Article

Applicability of Evapotranspiration Models and Water Consumption Characteristics Across Different Croplands

1
Hebei Fertilizer Technology Innovation Centre, Institute of Agricultural Resources and Environment, Hebei Academy of Agriculture and Forestry Sciences, Shijiazhuang 050051, China
2
Institute of Soil and Water Conservation, Northwest A&F University, Yangling 712100, China
3
State Key Laboratory of Soil Erosion and Dryland Farming on the Loess Plateau, Chinese Academy of Sciences and Ministry of Water Resources, Yangling 712100, China
4
Key Laboratory of Agricultural Water Resources, Hebei Laboratory of Water-Saving Agriculture, Center for Agricultural Resources Research, Institute of Genetic and Developmental Biology, The Chinese Academy of Sciences, Shijiazhuang 050021, China
*
Authors to whom correspondence should be addressed.
Agronomy 2025, 15(6), 1441; https://doi.org/10.3390/agronomy15061441
Submission received: 20 May 2025 / Revised: 9 June 2025 / Accepted: 10 June 2025 / Published: 13 June 2025
(This article belongs to the Section Water Use and Irrigation)

Abstract

:
Estimating the actual evapotranspiration (ETc act) of cropland in arid areas, exploring the time trend, and analyzing periodic variation are the key to long-term assessment of water resource availability and regional drought. The Penman formula has a strong ability to characterize reference crop evapotranspiration (ETo). However, the application of this formula may be limited in the absence of a complete set of climate data. While previous studies have investigated Kc act in China, few have employed localized Kc values to systematically analyze long-term periodic fluctuations in ETc act under climate variability conditions. Therefore, this study aimed to evaluate the applicability of nine ETo estimation models in the Loess Plateau of China, calculate actual crop coefficients (Kc act) for spring maize and winter wheat, and examine the temporal trend and periodicity of ETc act for long-term (1961–2018) continuous cropping of spring maize and winter wheat in the study area. The Mann–Kendall test and continuous wavelet transform (CWT) were used to obtain the temporal trend and periodicity of ETc act. The results were as follows: (1) Priestley–Taylor (Prs–Tylr), based on radiation, and the 1985 Hargreaves–Samani (Harg), based on temperature, can be used when meteorological data are limited. It should be noted that among the models evaluated in this study, except for FAO56-PM, only the Harg equation is compatible with Kc-ETo due to established conversion factors. (2) The Kc act of spring maize at the seeding–jointing stage and the earning–filling stage was 12% and 10% lower than the value recommended by FAO, respectively. For Kc act of winter wheat, it was 65% higher, 31% lower, and 85% higher than the FAO experience values in the rejuvenation–jointing stage, heading–grouting stage, and grouting–harvest stage. (3) Winter wheat, through its ETc act cycle synchronized with precipitation and excellent water balance, can effectively alleviate regional drought. It is recommended to be included in the promotion of drought resistance policies.

1. Introduction

Evapotranspiration (ET), the only connection linking water balance and land surface energy balance, is considered a significant indicator for climate change and the water cycle [1,2]. Variation of reference crop evapotranspiration (ETo) is driven by solar radiation, relative humidity, air temperature, and wind speed, which affect the process of ETo from the perspective of meteorology [3,4]. In addition, agriculture is one of the most sensitive sectors to climate change, which will have a significant impact on agricultural production and food security.
As an important factor affecting ETo, climate anomalies often occur periodically [5,6]. In recent years, the number of high-temperature days and the intensity of high temperatures have increased in China, and the impact on agricultural production is increasing [7,8]. It was found that the six extreme temperature events at 552 sites in China showed a 3–10-year periodicity during 1961–2000, and the results of future projections of extreme temperature events in different sub-regions of China showed a 2–4-year periodicity during 2001–2100 [9]. ETo is strongly affected by climate factors, so the periodic variation of ETo may also show periodicity. As there is a certain correlation between the actual evapotranspiration of cropland (ETc act) and reference crop evapotranspiration (ETo), ETc act will also show a certain periodic variation. Periodic fluctuation in ETc act has significant impacts on agricultural planning, specifically in the irrigation schedule, crop selection and management, water resource management, agricultural policy, farm management practices, climate change adaptation, and yield forecasting. During the water-stressed season in California, due to periodic increases in ETc act caused by higher temperatures, farmers implement more efficient irrigation schedules to conserve water [10]. In areas with periodic water stress, farmers have shifted to growing dry-season-resistant crops such as millet and sorghum [11]. In India, policies such as the Mahatma Gandhi National Rural Employment Guarantee Act (MGNREGA) have been implemented to respond to periodic ETc act fluctuations by creating water conservation structures [12]. In the Midwestern United States, no-till agricultural practices have become more common to maintain soil moisture during ETc act peaks [13]. In Brazil, ETo data is used to improve the accuracy of soybean yield forecasts, which is crucial for global commodity markets [14]. Therefore, clarifying the change characteristics and the periodicity of regional ETc act can provide a scientific basis for planting patterns and agricultural production planning under climate change.
To assess the change characteristics and periodicity of ETo, it is necessary to understand the algorithms suitable for ETo in the area [15]. The Changwu Tableland is one of the main dry farming areas in northwest China. The predominant grain crops in this region are winter wheat and spring maize. It has been found that the annual evapotranspiration accounts for about 90% of the annual precipitation in this area [16,17]. In this area, water resources are scarce, and the utilization rate is low. Precipitation is the main source of crop water, and soil water directly limits the growth of crops. In recent years, under the background of economic transformation in the Loess Plateau, a large area of wheat and corn fields has been transformed into apple orchards. However, as the ETc act of apple orchards is much larger than the precipitation, soil water resources exhibit a sustained decreasing trend, which seriously restricts the sustainable development of the economy and water in this area. Therefore, it is necessary to analyze the water consumption characteristics of cropland under long-term planting patterns to determine whether there is periodicity so as to further analyze whether planting major food crops can alleviate extreme dry seasons in apple orchards. This can provide a theoretical basis for the optimization of management measures and the sustainable use of soil water in the course of agricultural production in the Loess Plateau and lay a foundation for further understanding the effects of climate change on soil water status. However, few studies have investigated the periodicity of ETc act in this region. In particular, an intercomparison of the periodicity of ETc act for different croplands has rarely been reported.
Thus, in arid and semi-arid areas with limited water resources, developing accurate methods for estimating ETo is critical to ensure crop health and optimize water use efficiency [18]. The estimation methods of ETo mainly include models based on temperature, mass transport, radiation, and comprehensive complementary correlation, such as Penman [19,20], Penman–Monteith [21], Blaney–Criddle and other formulas [22], as well as the S-W two-source model (Shuttleworth–Wallace) [23], the Soil–Plant–Atmosphere Continuum (SPAC) model [24], Advection–Aridity (AA) [25], and Complementary Relationship Areal Evapotranspiration (CRAE) [26]. The Penman formula for calculating ETo was first proposed by Penman in 1948. It is based on the energy balance and mass transport theory and is calculated by meteorological factors such as radiation, temperature, wind speed, and relative humidity [27]. Since then, many scientists have made revisions on the basis of the Penman formula and obtained many revised Penman formulas. The Penman–Monteith formula is the most representative and was proposed by Monteith in 1965. This formula comprehensively considers the contribution of aerodynamics and physiological characteristics of plants to ETo. Many studies have shown that this formula is more complete than other formulas in ETc act studies in cropland; regardless of whether the study area is humid or arid, it is more representative and accurate. However, the Penman–Monteith formula also has some shortcomings; for example, the formula requires many parameters and is difficult to obtain. This formula can be standardized by referring to ETc act, which makes it easier to obtain ETc act. Numerous scholars have studied the accuracy of the Penman–Monteith formula, and the results indicate that using ETo is better than using precipitation for drought assessment in arid areas [28]. ETo models have been compared by many researchers. For example, Lu et al. used Thornthwaite, Hamon, Hargreaves–Samani, Turc, Makkin, and Priestley–Taylor formulas to compare and analyze the ETo results of 36 river basins in the eastern United States and showed that the correlation between the results of the calculation formulas used in this study was relatively high, but there were significant differences in ETo calculated by different algorithms [29]. Models such as Hargreaves, Blaney–Criddle, Markink, Priestley–Taylor, and Loval have also performed well in predicting ETo based on Penman–Monteith in Switzerland. These models can use the original constants involved in each model to make reasonable estimates [30]. Ten models based on temperature, radiation, extensive Penman–Monteith data, and the combination model were used to estimate the ETo of southeastern Australia, and the results showed that the combination methods performed the best [31]. These models can be roughly divided into four types based on the input requirements: temperature-based models, radiation-based models, mass transfer-based models, and combination models. The 1948 Penman (Pn), Standardized ASCE Penman-Monteith (ASCE-PM), FAO 24 Corrected Penman (FAO24-Pn), FAO Plant Protection Paper 17 Penman (FP17), 1982 Kimberly Penman (KPn), and FAO 56 Penman–Monteith (FAO56-PM) are some of the combination models, which require sufficient climate factors, including air temperature, solar radiation, relative humidity, and wind speed [32]. FAO 24 Radiation (FAO24-Rd), Makkink (Makk), and Priestley–Taylor (Prs–Tylr) are some of the radiation-based models, and they are related to solar radiation. They require fewer climate factors than the combination models. When there is a lack of climate factors, there are also some temperature-based models, such as the 1985 Hargreaves–Samani (Harg). The difference in formulas can be found in the Supplementary Materials of [33]. In addition, there are many comparative studies on a global scale. For example, 11 temperature-based models were compared for predicting ETo of several climatic conditions, and the results indicated that Hargreaves performed the best in different climate conditions [34].
In addition to referring to ETo, another important factor in clarifying the ETc act of different croplands is the crop coefficient (Kc act). The ETc act can be obtained by multiplying ETo and Kc act under water and environmental stress. ETo is closely related to climate conditions and is defined as the evapotranspiration of a hypothetical crop with vigorous growth, a height of 0.12 m, a canopy albedo of 0.23, a fixed canopy resistance of 70 s m−1, and with the wind speed and humidity measured at a height of 2 m [35]. Apart from meteorological factors, ETc act is also influenced by water availability in the soil, crop characteristics, environment, and management practices [36,37,38] (Figure 1).
In summary, the evapotranspiration rate, evapotranspiration in a certain growth period, and the characteristics of long-term evapotranspiration are of great significance to agricultural production. However, the calculation method of ETo and the periodicity of water consumption of long-term continuous cropping of spring maize and winter wheat in the Loess Tableland are still unclear. In addition, the uncertainty of field experiments is large, the reproducibility is poor, and it is difficult to obtain continuous evapotranspiration data. While previous studies have examined Kc for wheat and maize in China, our work systematically analyzes the periodic fluctuations of actual evapotranspiration (ETc act) under long-term climate variability in the Loess Plateau. This study explores the estimation method of ETo in the Loess Plateau so as to further analyze the periodicity of ETc act. The objectives of this study are (1) to evaluate the suitability of the nine models (Standardized ASCE Penman–Monteith, FAO 24 Corrected Penman, FAO 24 Radiation, FAO Plant Protection Paper 17 Penman, 1982 Kimberly Penman, 1948 Penman, Makkink, Priestley–Taylor, and 1985 Hargreaves–Samani) for calculating ETo across daily and seasonal scales based on the FAO 56 Penman–Monteith formula in the study area; (2) to clarify the characteristics of ETc act in each growth period (2012–2015) and define the crop coefficients of spring maize and winter wheat by ETc act (measured by the water balance method) and ETo (calculated by FAO 56 Penman–Monteith) in the study area; and (3) to explore the periodicity of ETc act for spring maize and winter wheat under the condition of climate fluctuation (1961–2018). This approach identifies cyclic drought patterns and quantifies crop-specific water demands under climate fluctuations, offering scalable strategies for arid agroecosystems.

2. Materials and Methods
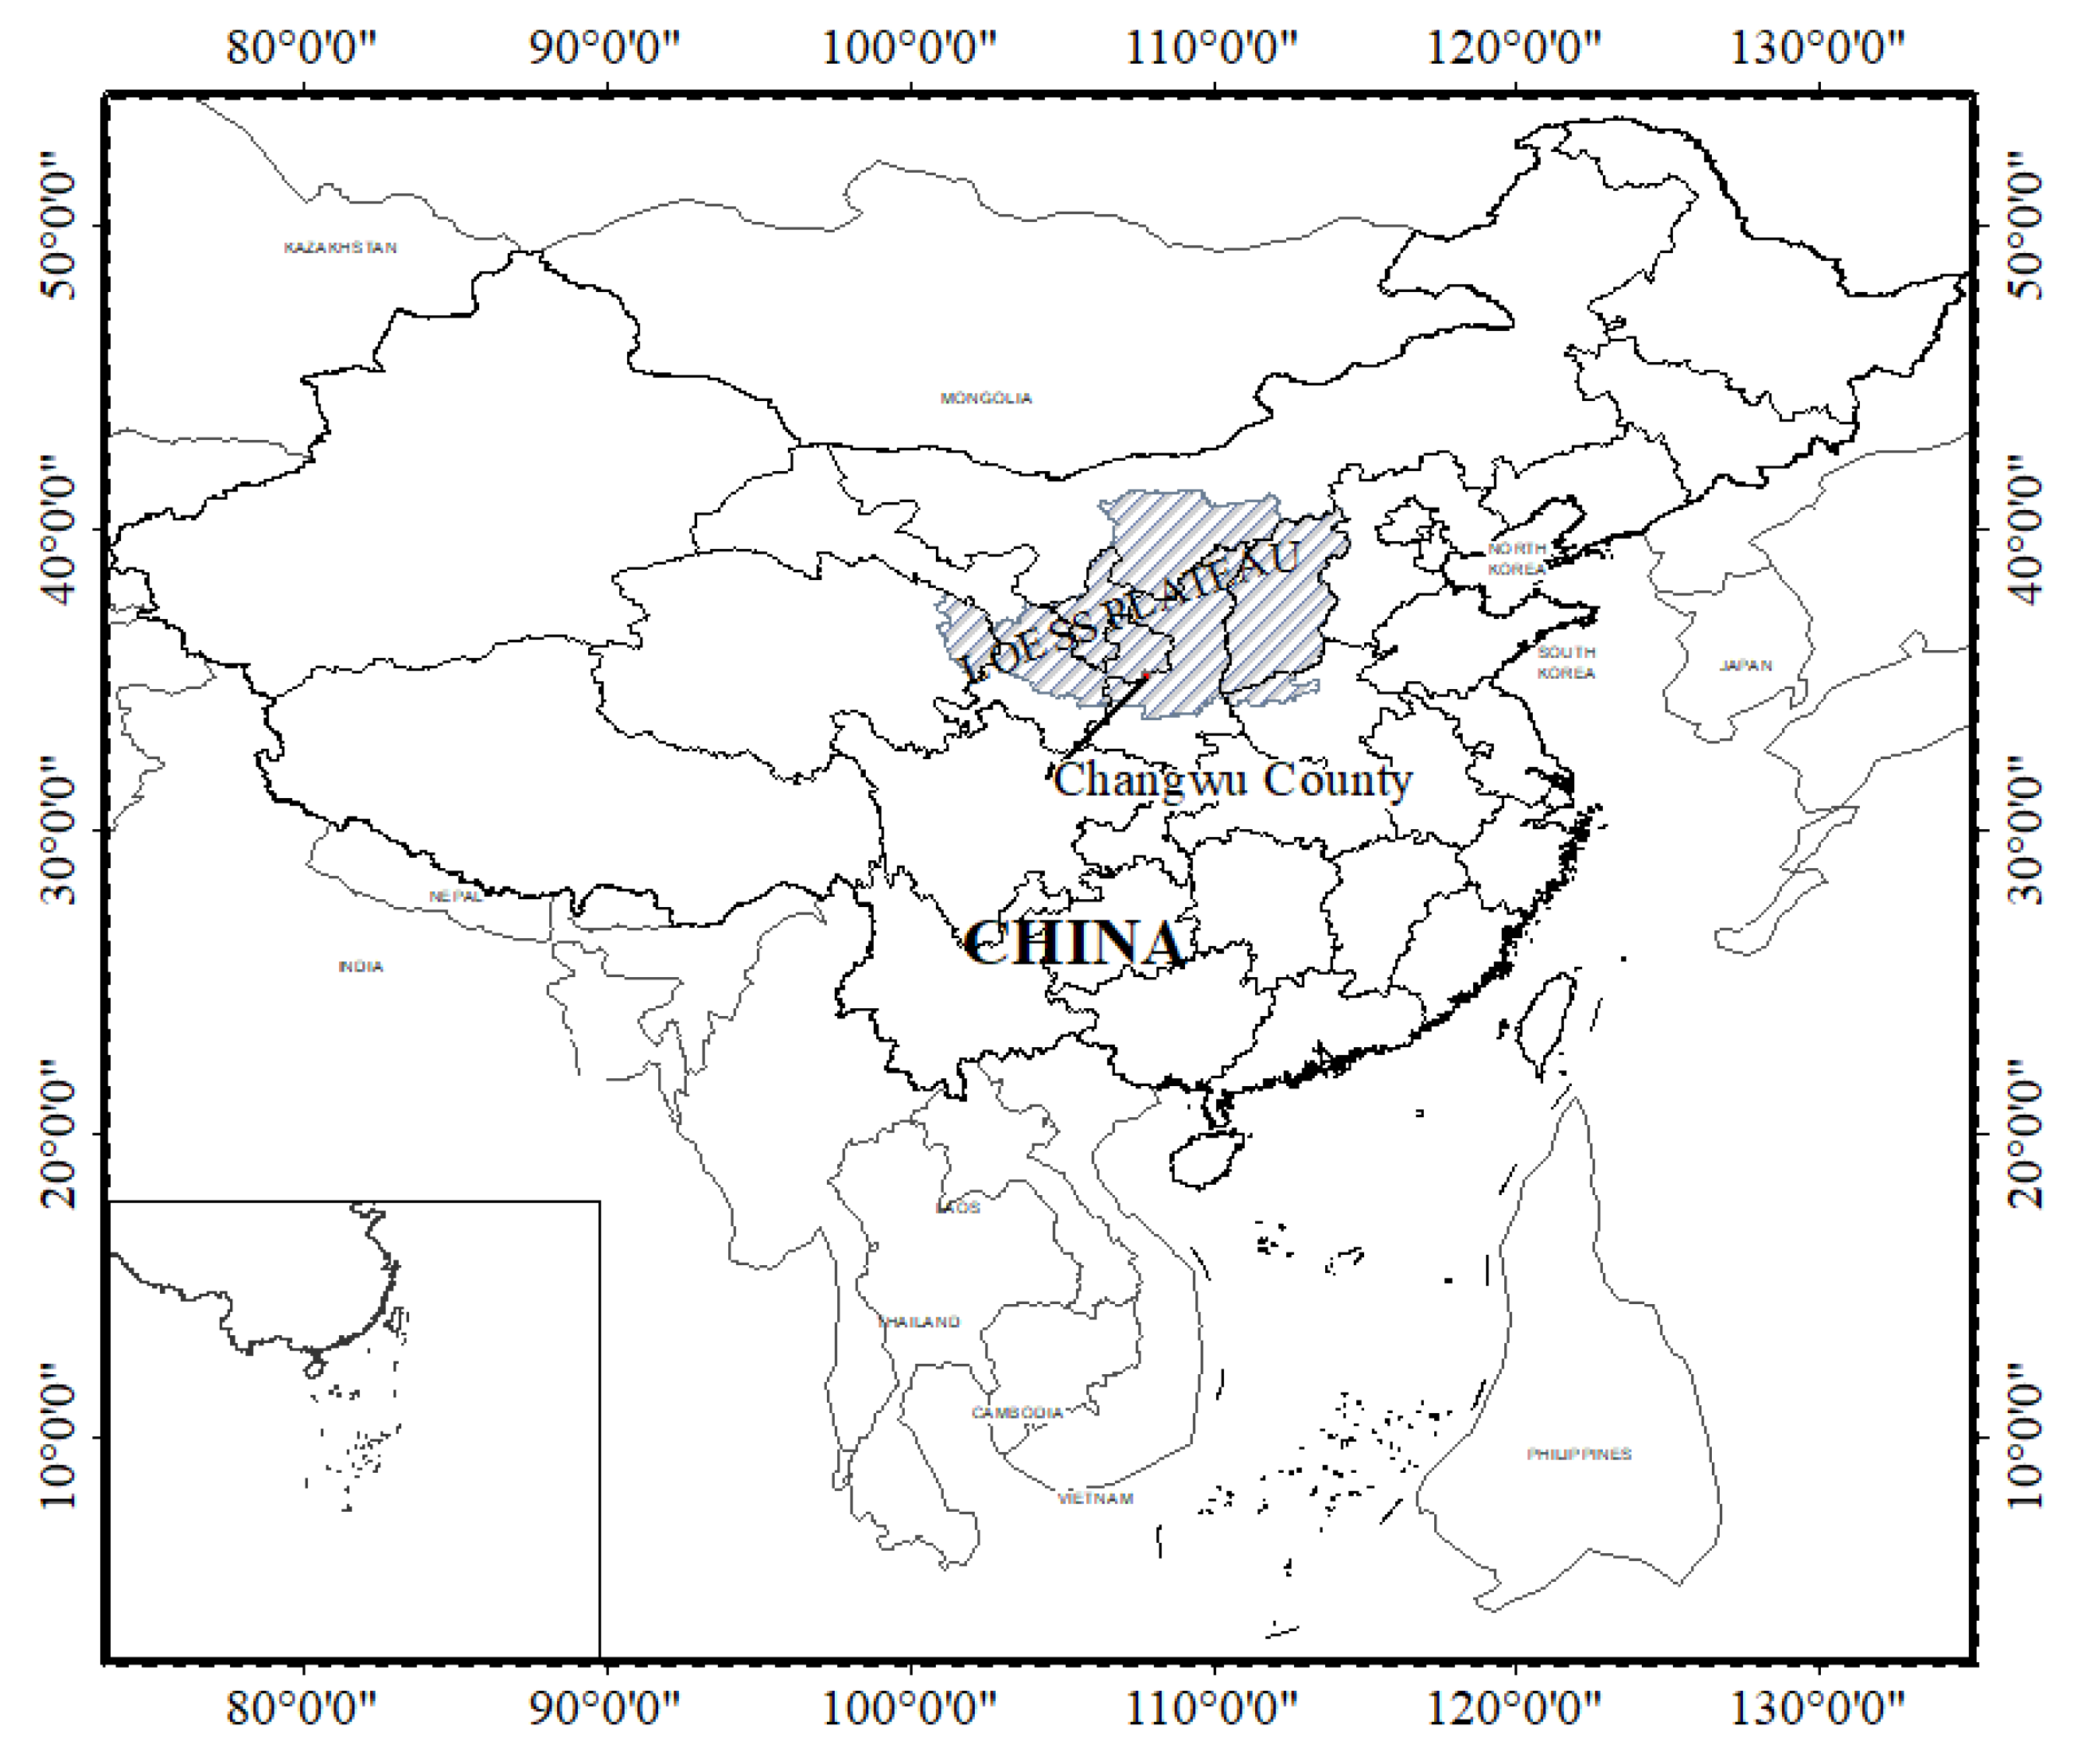
2.1. Study Site

The study area is located at the junction of Shaanxi and Gansu Province, Wangdonggou watershed (107°40′30″–107°42′30” E, 35°12′16″–35°16′00” N), which is 12 km away from Changwu County, Shaanxi Province (Figure 2), and the area is 8.3 km2. This area is a typical gully area of the Loess Plateau, and it belongs to the warm temperate semi-humid area with a continental monsoon climate. The plateau surface in the area is flat, and the altitude is 1215–1226 m. The main soil type in the area is dark loessial soils. The soil in the whole profile is uniform and loose, the stable water infiltration rate is 1.35 mm min−1, the field water capacity is 23%, and the wilting point is 10.6%. The soil bulk densities of 0–1 m, 1–2 m, 2–3 m, and 3–6 m are 1.34, 1.28, 1.31, and 1.30 g cm−3, respectively [39]; these data are from the same experimental field as this study. The experiments were performed under rainfed conditions, and there is a high probability that maize and maybe wheat suffered water stress conditions. This stress may affect the actual crop evapotranspiration (ETc act) and actual crop coefficient (Kc act) of crops, resulting in differences from FAO-recommended values. The precipitation in the area is mostly concentrated from July to September, and it accounts for 54.9% of the annual precipitation. The average annual potential evapotranspiration is about 1.7 times the average annual precipitation. The meteorological conditions in the study area are shown in Table 1.

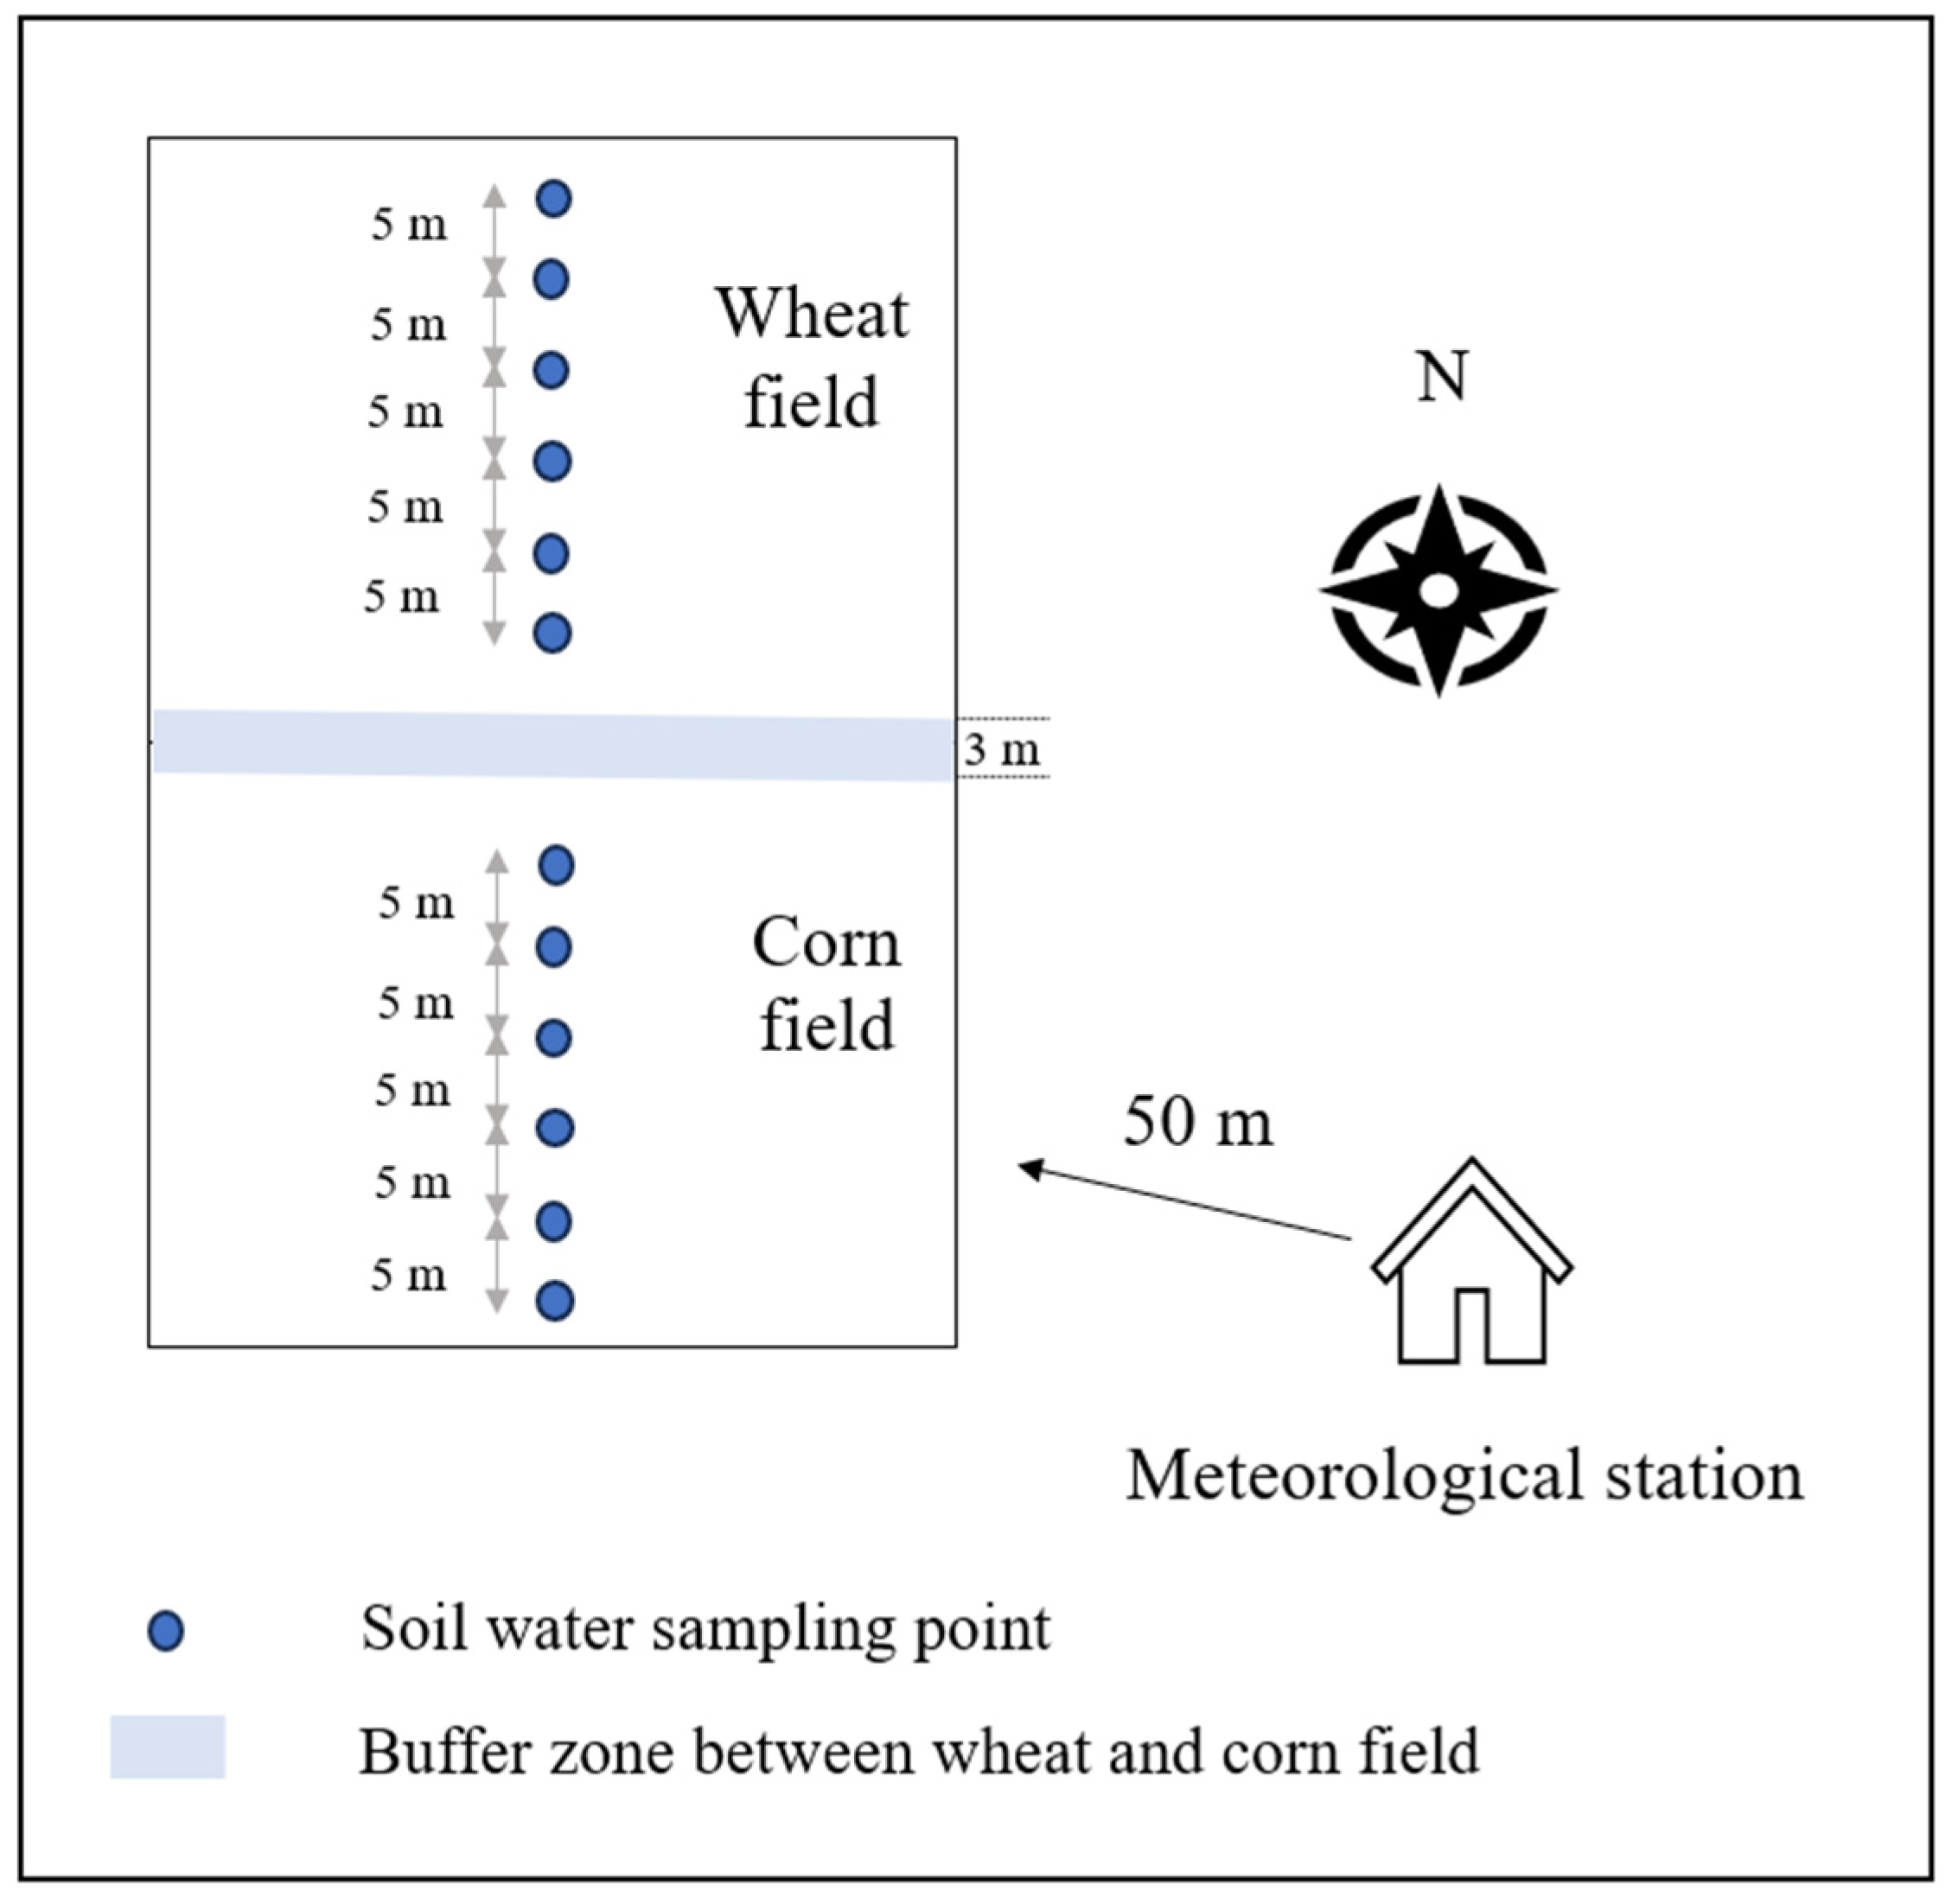
2.2. Field Experiment Design

Changwu Experimental Station is located in the central part of the Loess Plateau, and with its typical loess soil and semi-arid climate conditions, it serves as a representative site for research on soil and water conservation and ecological restoration in the region. For the field experiment, the adjacent long-term continuous cropping wheat field and corn field were selected as the research objects from 2012 to 2015 (Figure 3). The area of the wheat and corn fields was 667 m2. The varieties of wheat and corn were Changhan 58 and Xianyu 335, respectively. Their plant density was 3.3 × 10⁶ seeds hm−2 and 6.25 × 10⁴ seeds hm−2, respectively. The management measures of the selected experimental wheat field and corn field were the same as the local customs. The key indicators of soil, vegetation, and hydrology of the studied sites were representative for the Loess Plateau. This area is typically dry farmland, and there were no irrigation or covering measures in the study sites. The application amounts of N, P2O5, and K2O were 138 kg hm−2, 40 kg hm−2, and 80 kg hm−2 for wheat and corn during the growth period. Moreover, 40%, 30%, and 30% of N were applied to corn field at the stages of sowing, big bell mouth, and tasseling, respectively. P2O5 and K2O were applied to the soil as base fertilizer before sowing for corn. The fertilizer was applied once before sowing in the wheat field. Figure 4 shows the rainfall distribution pattern of Changwu station during 2012–2015.
The water balance method is a traditional and accurate method for estimating ETc act. The study area is rain-fed, without irrigation, and the groundwater depth is below 50 m. Therefore, there is no irrigation, and the groundwater rise can be ignored. Due to the loose soil, flat terrain, and strong infiltration capacity in the study area, runoff can be ignored. In addition, the infiltration depth of soil water in the study area is about 260 cm, while the depth of soil studied in this research is 600 cm, so deep percolation can be ignored. Thus, the water balance was determined by precipitation minus the change of soil water storage (SWS) to analyze the characteristics of ETc act so as to derive the crop coefficient at different growth stages. During the study period of 2012–2015, the soil water content (SWC) of the wheat field and corn field was regularly measured by a neutron probe (CNC503B (Beijing Chaoneng International Technology Co., Ltd., Beijing, China)) on the 15th and 30th of each month during the experiment period with six replicates, which were from north to south in the two fields, respectively (Figure 3). It was measured at the 10 cm interval at depths of 0–100 cm and at the 20 cm interval at depths of 100–600 cm for each sampling point. The SWCs for depths of 0–40 cm were confirmed using samples that were collected with a soil auger. During the experimental process, regular inspections were conducted on the meteorological station equipment, including the operational status of the sensors, the functionality of the data loggers, and the overall stability of the system. Additionally, the neutron probe was calibrated regularly to ensure measurement accuracy. Through these routine maintenance and calibration efforts, the reliability and validity of the ETc act data could be ensured. SWS (mm) is calculated as
SWS = θ v × h
where SWS is the soil water storage (mm), θ v is the SWC (%), and h is the soil depth (mm).
The environmental factors related to the ETo, SWC, and the growth of plants, including solar radiation (Rs, W·m−2), air temperature (Ta, °C), relative humidity (RH, %), wind speed (Ws, m·s−1), vapor pressure deficit (VPD, kPa), and ground heat (W·m−2) were continuously measured by the meteorological station in the test station. The meteorological data on daily net radiation (Ra, W·m−2), maximum air temperature (Tmax, °C), minimum air temperature (Tmin, °C), precipitation (P, mm), wind speed (Ws, m·s−1), and relative humidity (RH, %) in this study from 1961 to 2018 were derived from the China Meteorological Data Sharing Network (http://data.cma.cn/, accessed on 15 May 2021). To correct abnormal meteorological values, we used data from a nearby weather station (Figure 2) as a reference. The correction involved replacing outliers with concurrent data from the station, ensuring data consistency. This method was chosen for its reliability in reflecting local conditions and has been validated against other datasets for accuracy.
The precipitation year was distinguished by the drought index (DI), and the formula is as follows:
DI = P P ¯ / σ
where P is annual precipitation (mm), P ¯ is the average annual precipitation (mm), and σ is the standard deviation of multi-year precipitation. Based on the standardized precipitation index (DI) of each year, the precipitation year was spread to dry ( DI < 0 . 35 ), normal ( 0.35 < DI < 0.35 ), and wet ( DI > 0 . 35 ) years [40].
The annual precipitation of 2012–2015 was 482, 590, 601, and 547 mm, respectively. The precipitation years during the study period were dry, normal, wet, and wet years, respectively. Moreover, the precipitation from April to September accounted for 91%, 88%, 90%, and 79% of the annual precipitation, respectively, from 2012 to 2015.

2.3. Statistical Analysis

All the results of the ETo models used in this study were derived from the REF-ET software (Version 4.1).

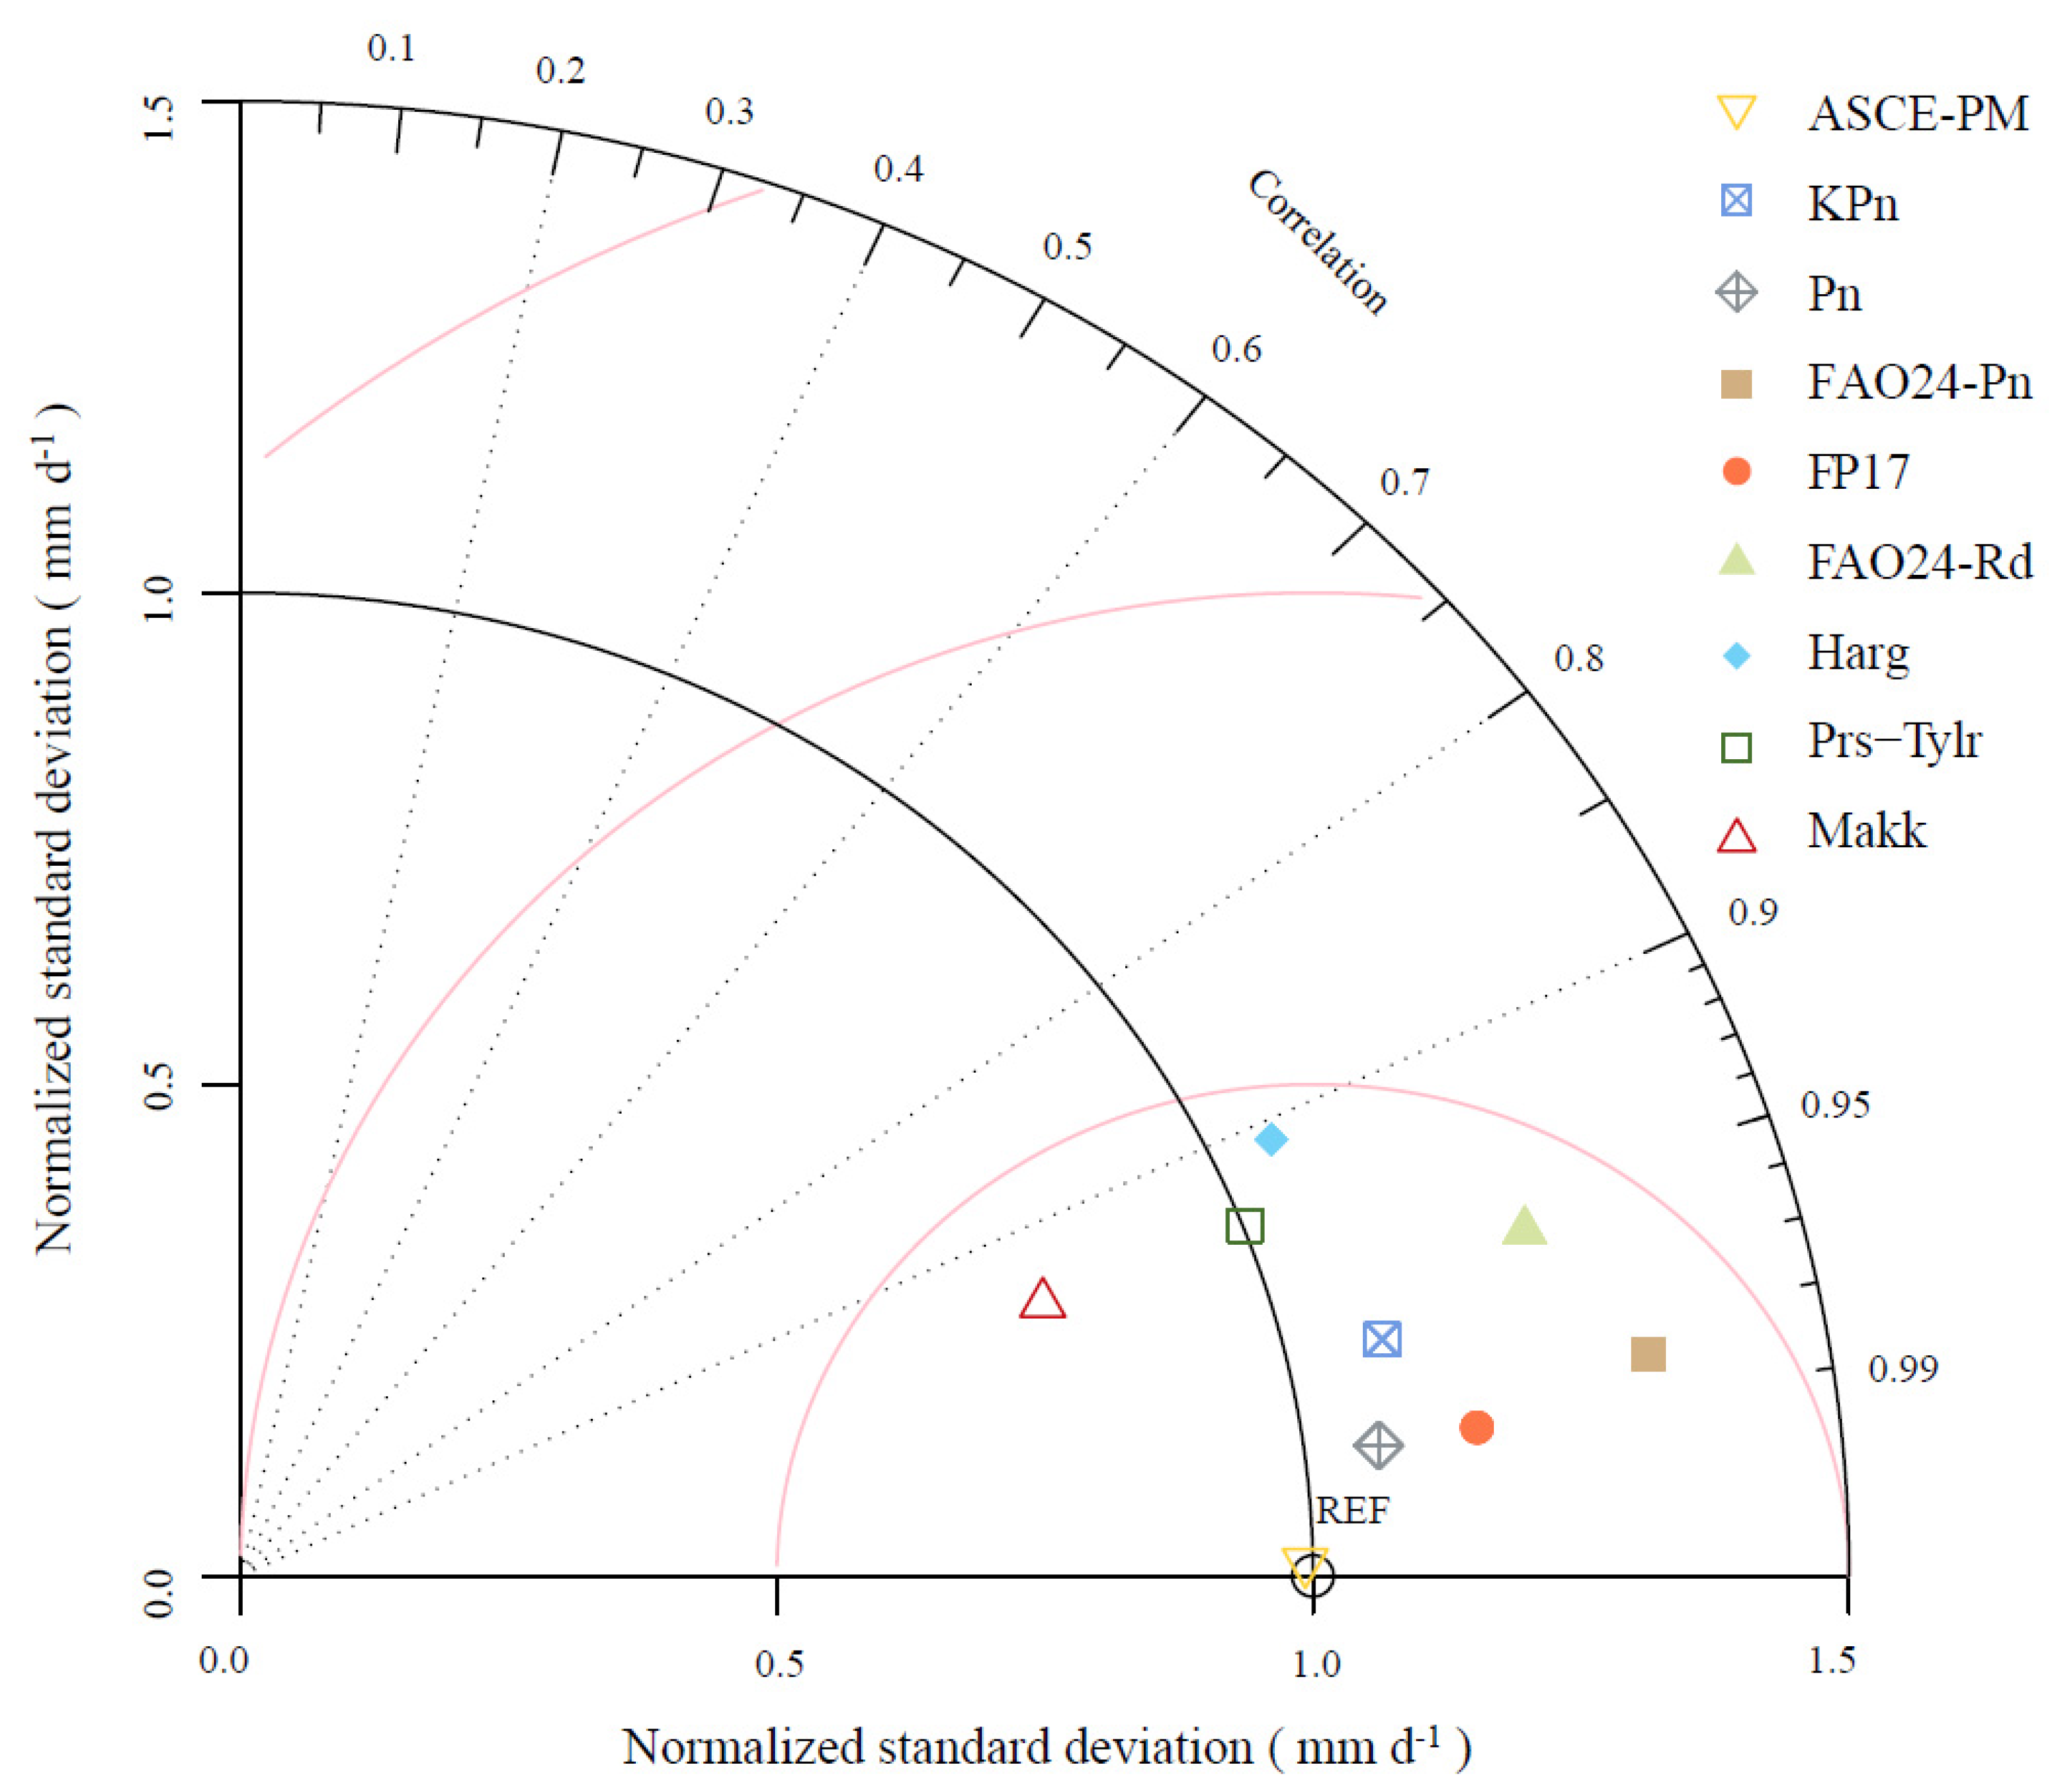
2.3.1. Taylor Analysis

The Taylor chart presents three-dimensional data in a two-dimensional plane, which can show the differences between various variables intuitively. Based on the standard of FAO56-PM, this study evaluated the applicability of the other nine algorithms for calculating ETo using the determination coefficient (R2), Taylor skill score (S), normalized root mean square error (nRMSE), and relative mean deviation error (rMBE). Specifically, S can evaluate the quality of the simulation effect comprehensively by quantifying the correlation coefficient and standard deviation between the simulated value and the observed value [41]. NRMSE indicates the relative difference between the simulated value and the observed value. It indicates excellent model performance when nRMSE < 10%, good model performance when 10% < nRMSE < 20%, general model performance when 20% < nRMSE < 30%, and poor model performance when nRMSE < 30%. RMBE was used to evaluate the model deviation and system error comprehensively. A positive or negative value can reflect the relative observation value of the model. The greater the S value or the closer nRMSE and rMBE are to 0%, the better the model has performed. The specific formulas are as follows:
R 2 = i = 1 N E T M , i E T M ¯ E T F A O 56 P M , i E T F A O 56 P M ¯ 2 i = 1 N E T M , i E T M ¯ 2 i = 1 N E T F A O 56 P M , i E T F A O 56 P M ¯ 2
S = 4 1 + R 2 σ E σ F A O 56 P M + σ F A O 56 P M σ E 2 1 + R 0 2
nRMSE = 100 E T F A O 56 P M ¯ 1 n i = 1 n E T M , i E T F A O 56 P M , i 2
rMBE = 100 E T F A O 56 P M ¯ 1 n i = 1 n E T M , i E T F A O 56 P M , i
where E T M , i and E T F A O 56 P M , i are the reference crop evapotranspiration calculated by each model and the FAO56-PM, E T M ¯ and E T F A O 56 P M ¯ are the average reference crop evapotranspiration calculated by each model and the FAO56-PM, and n is the number of daily estimated ETo.

2.3.2. Mann–Kendall (MK) Test

The Mann–Kendall test is strongly recommended by the World Meteorological Organization (WMO) to quantitatively analyze the trend and mutation of long-term series of hydrological elements, meteorological elements, and evapotranspiration [42]. The MK test was conducted to analyze the trend and mutation of long-term series (1961–2018) of actual crop evapotranspiration, precipitation, and air temperature during the growth period of spring maize and winter wheat in this study.
In the MK test, the standardized test statistic (Z) is used to indicate the trend of variables. When Z > 1.96, it indicates that the trend of the time series is significant at the 95% confidence level; when Z > 2.58, it indicates that the time series trend is significant at the 99% confidence level. A positive value of Z represents an increasing trend, while a negative value of Z represents a decreasing trend. The statistical values S and Z are calculated as follows [43]:
S v = k = 1 n 1 j = k + 1 n sgn x j x k
sgn x j x k = 1 0 1 , , , i f   x j x k > 0 i f   x j x k = 0 i f   x j x k < 0
Z = S v 1 σ 0 S v 1 σ , , , i f   S v > 0 i f   S v = 0 i f   S v < 0
σ 2 = n n 1 2 n + 5 j = 1 p t j t j 1 2 t j + 5 / 18
where xj and xk are consecutive values of the variable, n is the length of the data set, p is the value in the binding group, and tj is the value of the jth group.

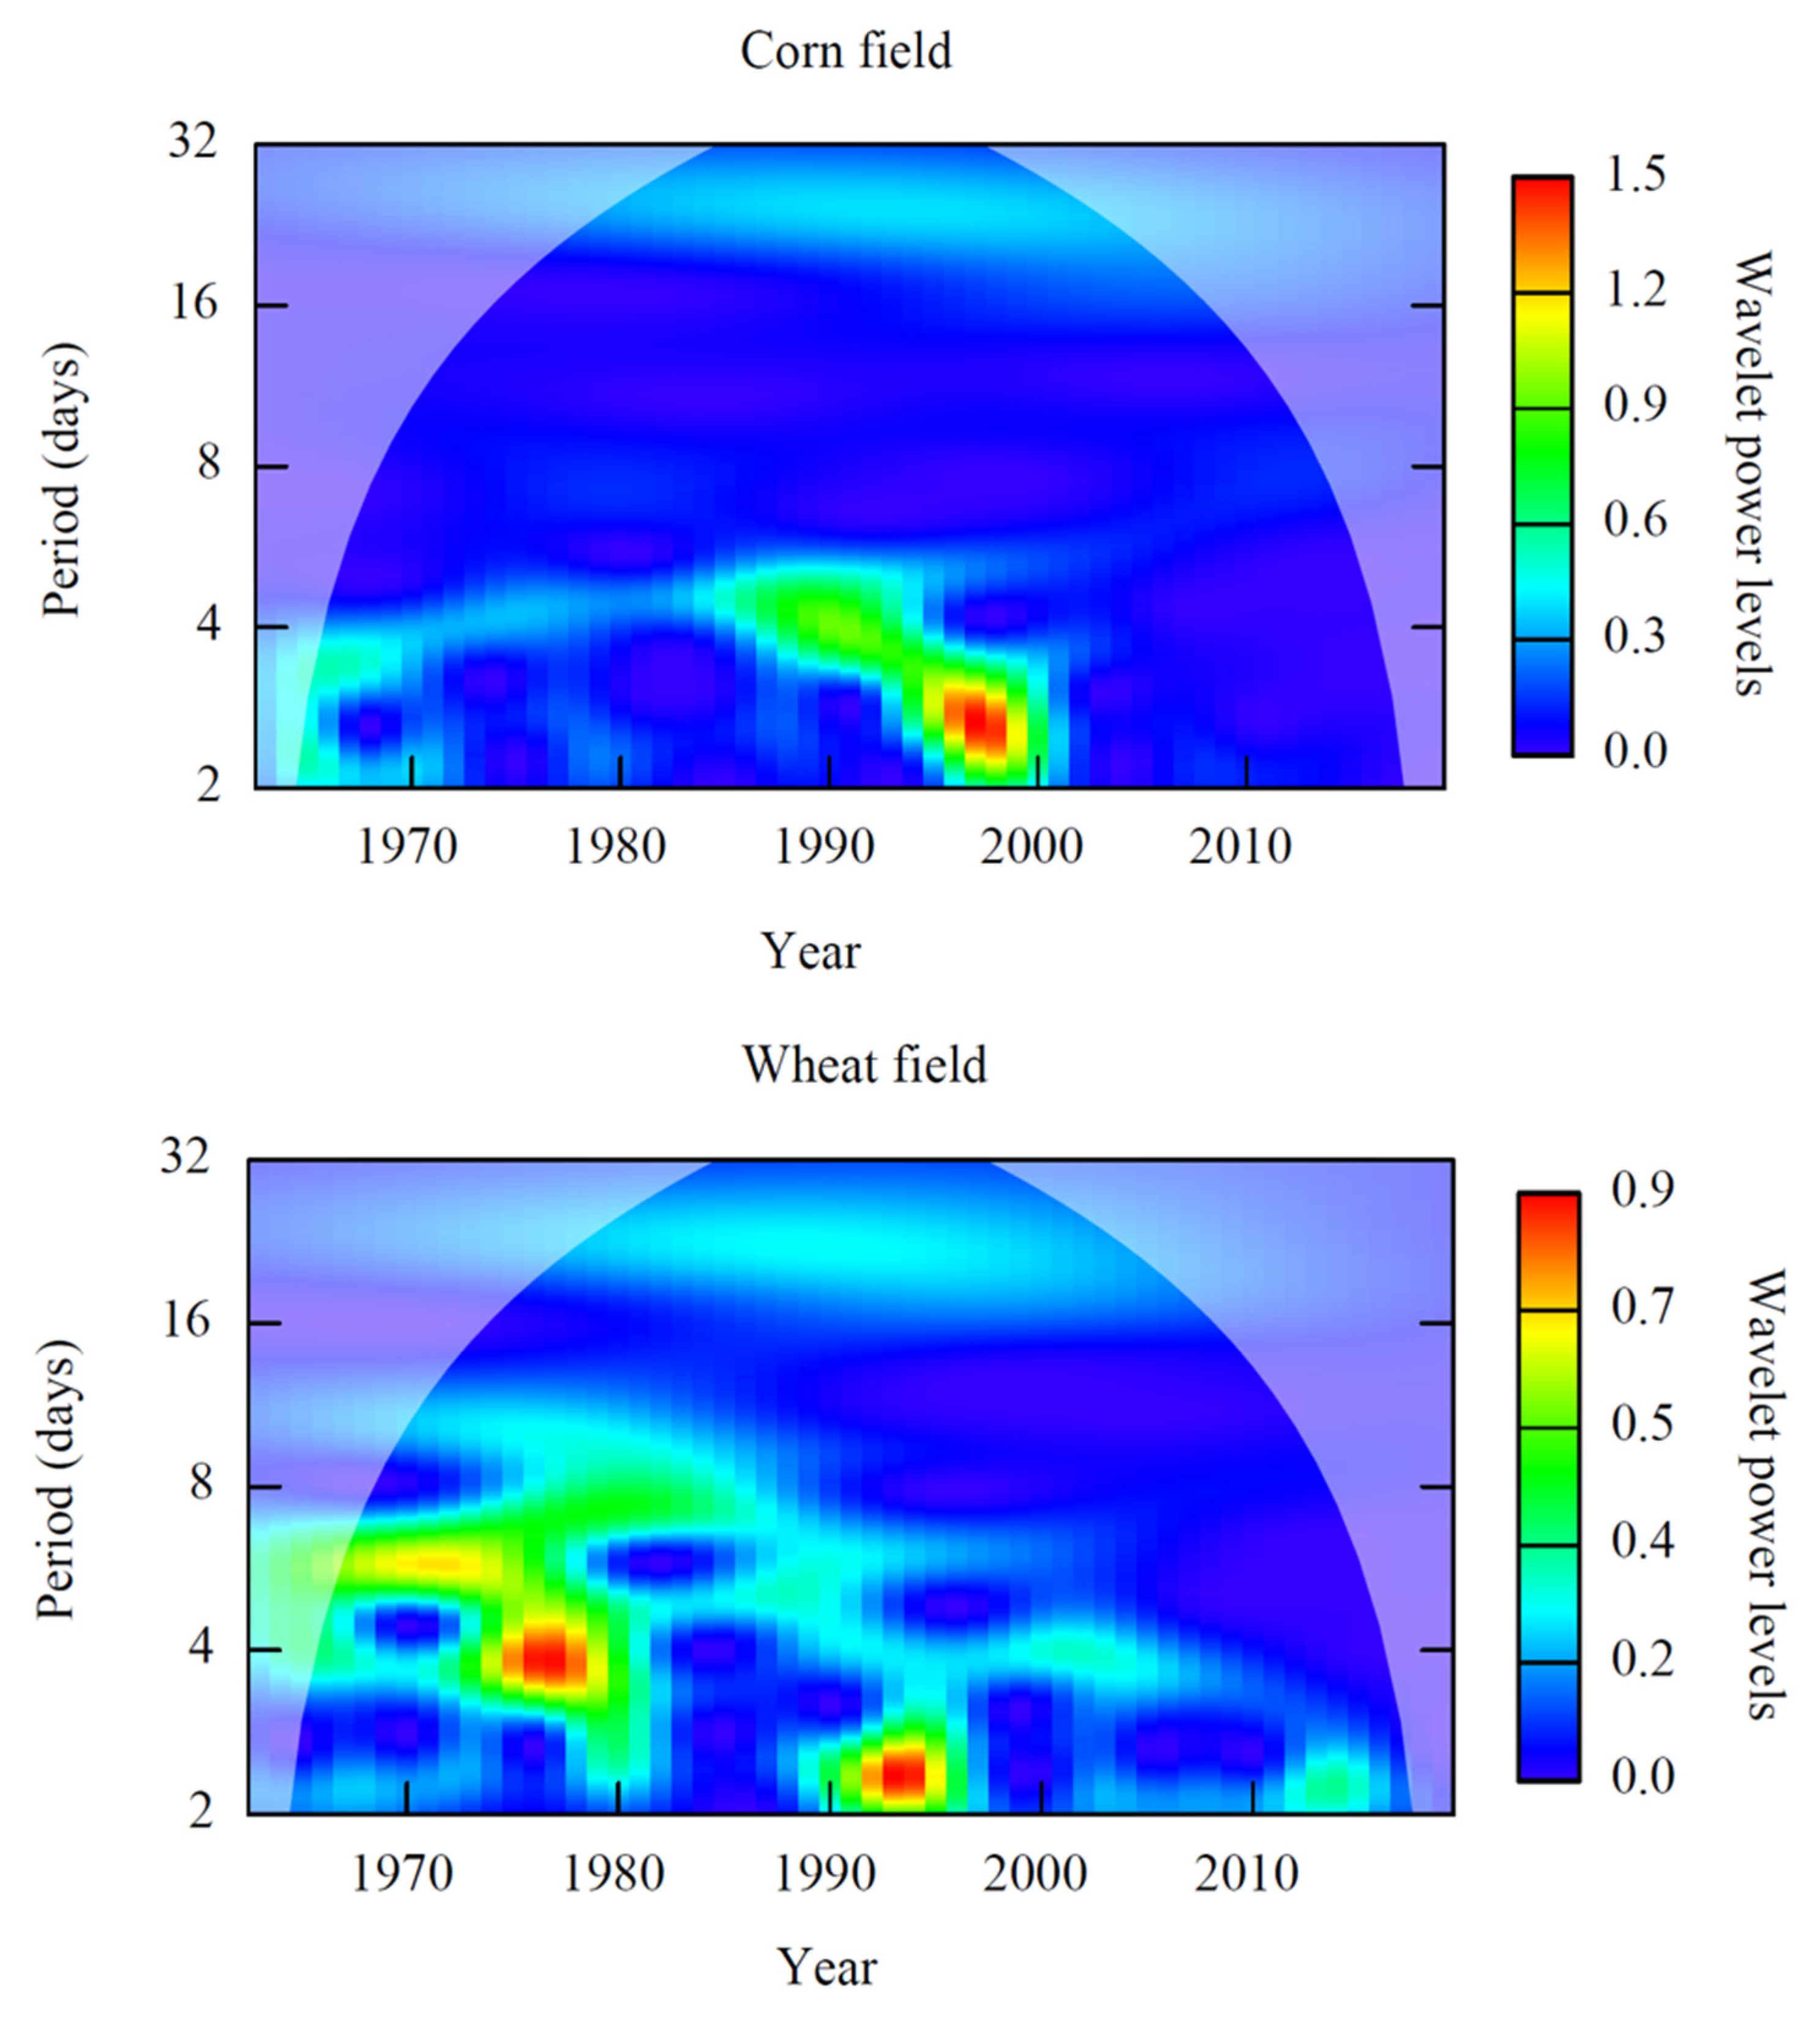
2.3.3. Morlet Wavelet Analysis

Wavelet analysis, which emerged in the 1980s, is an analysis method that can process time and frequency into a signal. This method is used to analyze the periodic characteristics of sequences. Morlet wavelet analysis shows obvious advantages in the study of the hydrological periodic characteristics of nonlinear changes. This method can obtain the periodic change characteristics of different time scales and predict future trends. It has been confirmed in many studies, and its definition is as follows:
W f a , b = 1 a Δ t k = 1 N f k Δ t φ ^ k Δ t b a
where a is the frequency domain parameter, b is the time domain parameter, and W f a , b is the wavelet coefficient reflecting a and b simultaneously. It is increasing when W f a , b > 0 and decreasing when W f a , b < 0. When W f a , b = 0, it means that the corresponding point is a sudden change point. The larger the W f a , b , the more significant the change of the corresponding time scale.

3. Results

3.1. The Applicability of the Method for Reference Crop Evapotranspiration

As the key factor to determine crop water demand, reference crop evapotranspiration can be calculated by many methods. The complexity of each calculation formula is also different, with each method requiring different basic meteorological data. Therefore, it is particularly important to select a suitable method considering the actual background of the study area. This section aims to explore the applicability of various methods in the Loess Plateau area by comparing the calculation results of the nine selected reference crop evapotranspiration calculation methods so as to provide a scientific reference for determining actual crop evapotranspiration.

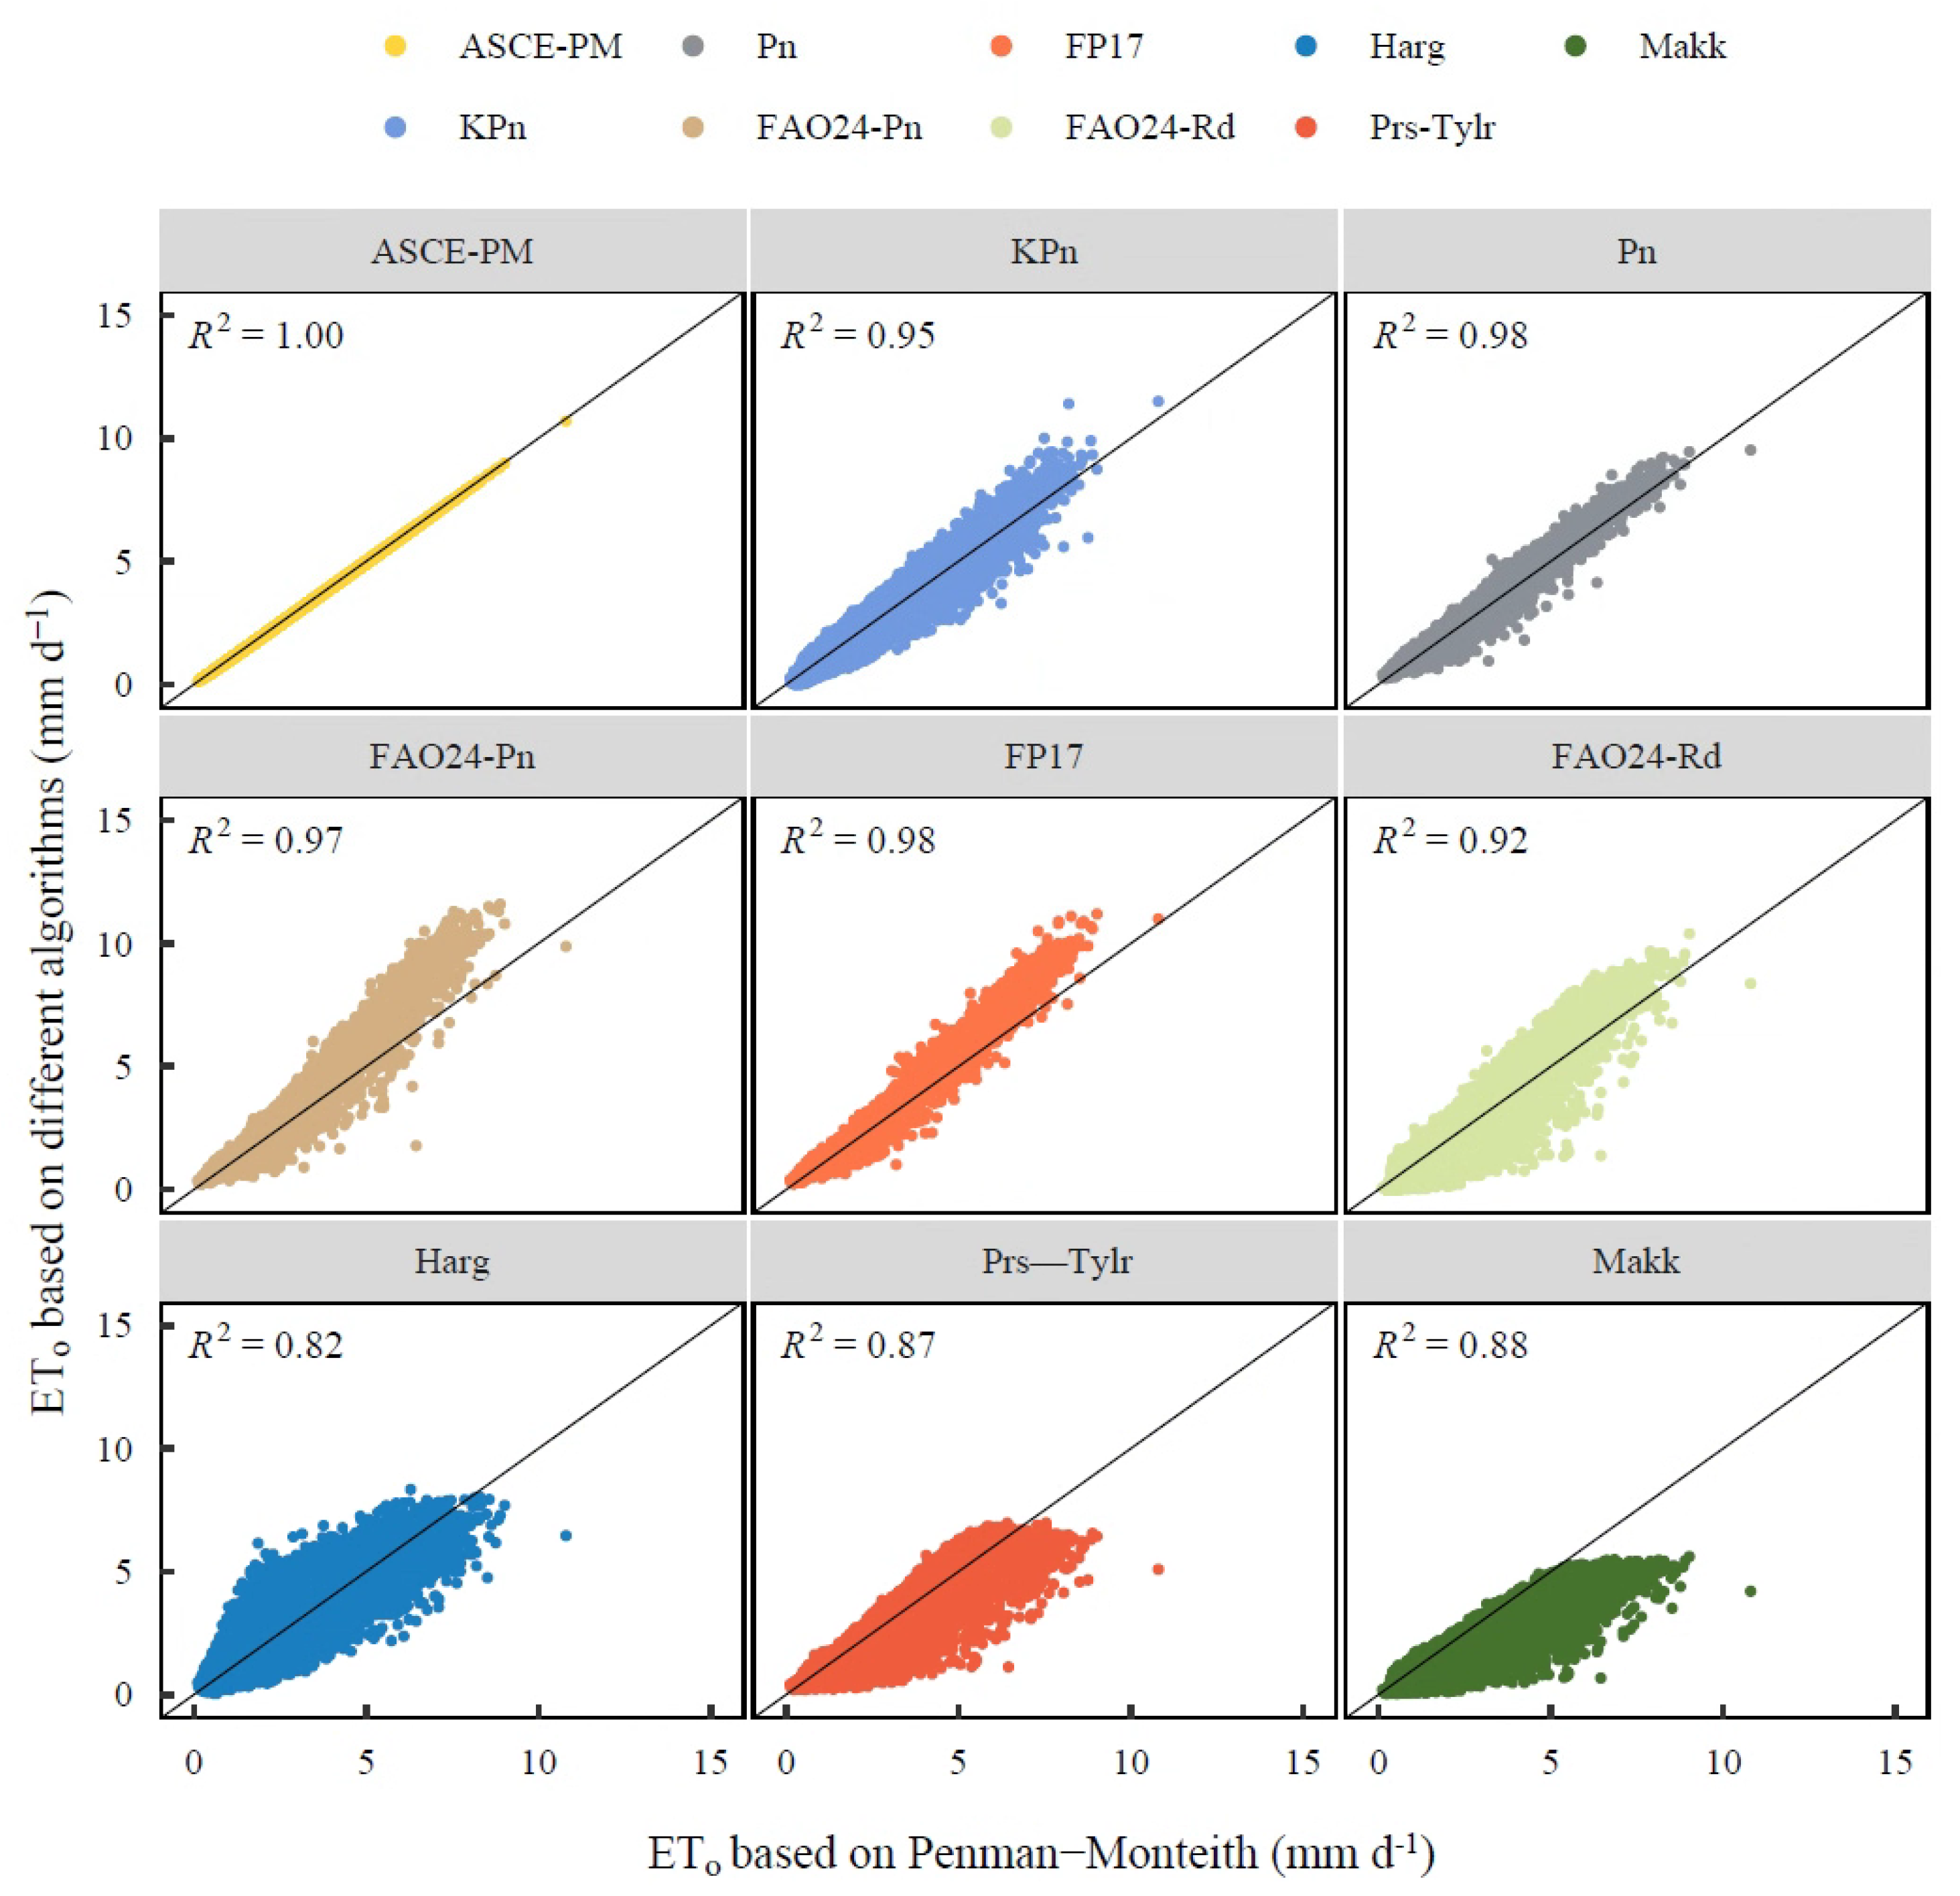
3.1.1. Applicability on a Daily Scale

In this study, 10 methods were used to calculate the reference crop evapotranspiration at a daily scale based on the meteorological data of the Changwu from 1961 to 2018, and the consistency of the other nine methods with the FAO56-PM was plotted based on the results of the FAO56-PM calculation (Figure 5). The results showed that all the algorithms selected in this study performed the same change trend with the calculation results of FAO56-PM. Among them, the most consistent change trend with the reference crop evapotranspiration calculated by FAO56-PM was the result calculated based on the Penman formula. The R2 of the fitting lines for the algorithms based on Penman, from high to low, were as follows: ASCE-PM (R2 = 1.00) > Pn (R2 = 0.98) = FP17 (R2 = 0.98) > FAO24-Pn (R2 = 0.97) > KPn (R2 = 0.95). The R2 of the fitting lines for the algorithms based on radiation was smaller than that based on Penman, and the consistency of its change was as follows: FAO24-Rd (R2 = 0.92) > Makk (R2 = 0.88) > Prs–Tylr (R2 = 0.87). The R2 of the fitting line for the algorithms based on air temperature (Harg) was the smallest, with a value of 0.82.
In order to more accurately analyze the applicability of these nine methods for calculating ETo in the Loess Plateau, Taylor analysis was used to evaluate the performance of each algorithm to provide scientific reference for determining a reasonable ETo in the region based on meteorological data. The results of the Taylor skill score performed slightly differently from those of R2; the specific performance was as follows: ASCE-PM (S = 1.00) > Pn (S = 0.99) > KPn (S = 0.97) = FP17 (S = 0.97) > Prs–Tylr (S = 0.93) > FAO24-Rd (S = 0.92) > FAO24-Pn (S = 0.91) = Harg (S = 0.91) > Makk (S = 0.90) (Figure 6). Figure 6 visually shows the difference in the prediction results of each model relative to the reference model FAO56-PM (REF). The radiation line between the center of the circle and the point represents the correlation coefficient, the horizontal and vertical axes represent the NSD, the pink curve represents the root mean square error, and the point REF represents FAO56-PM. It shows the same result as S.

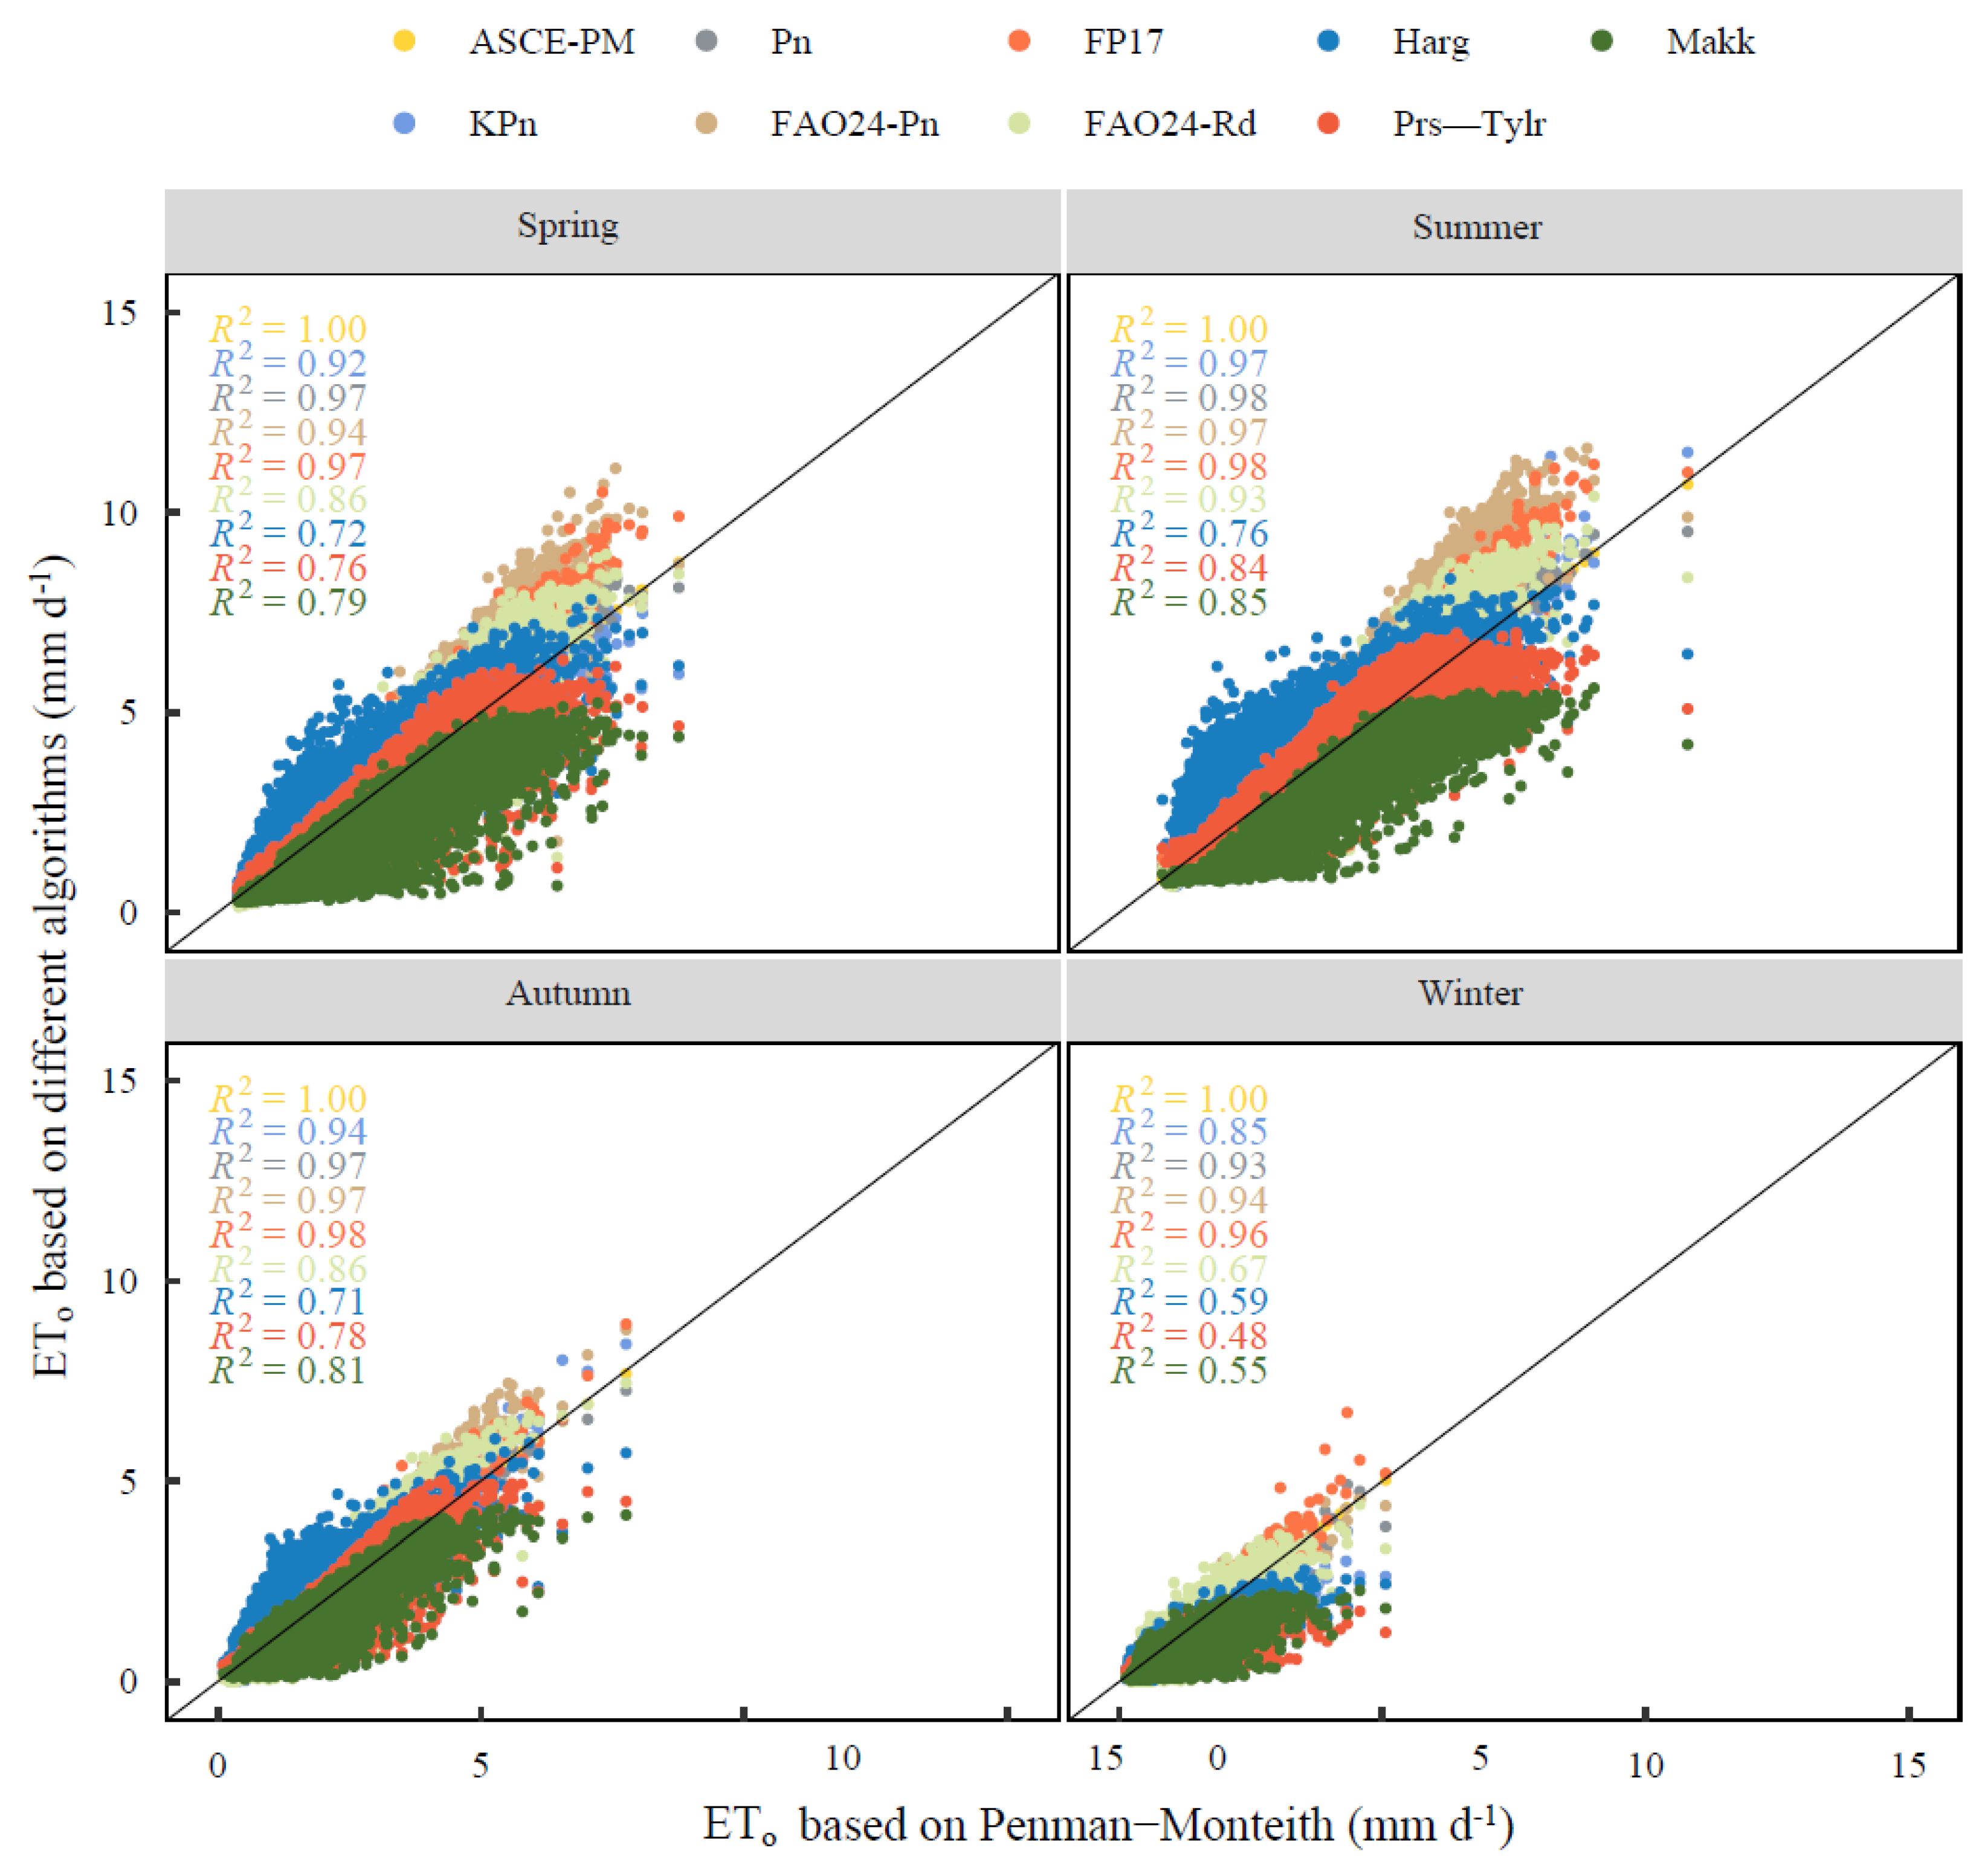
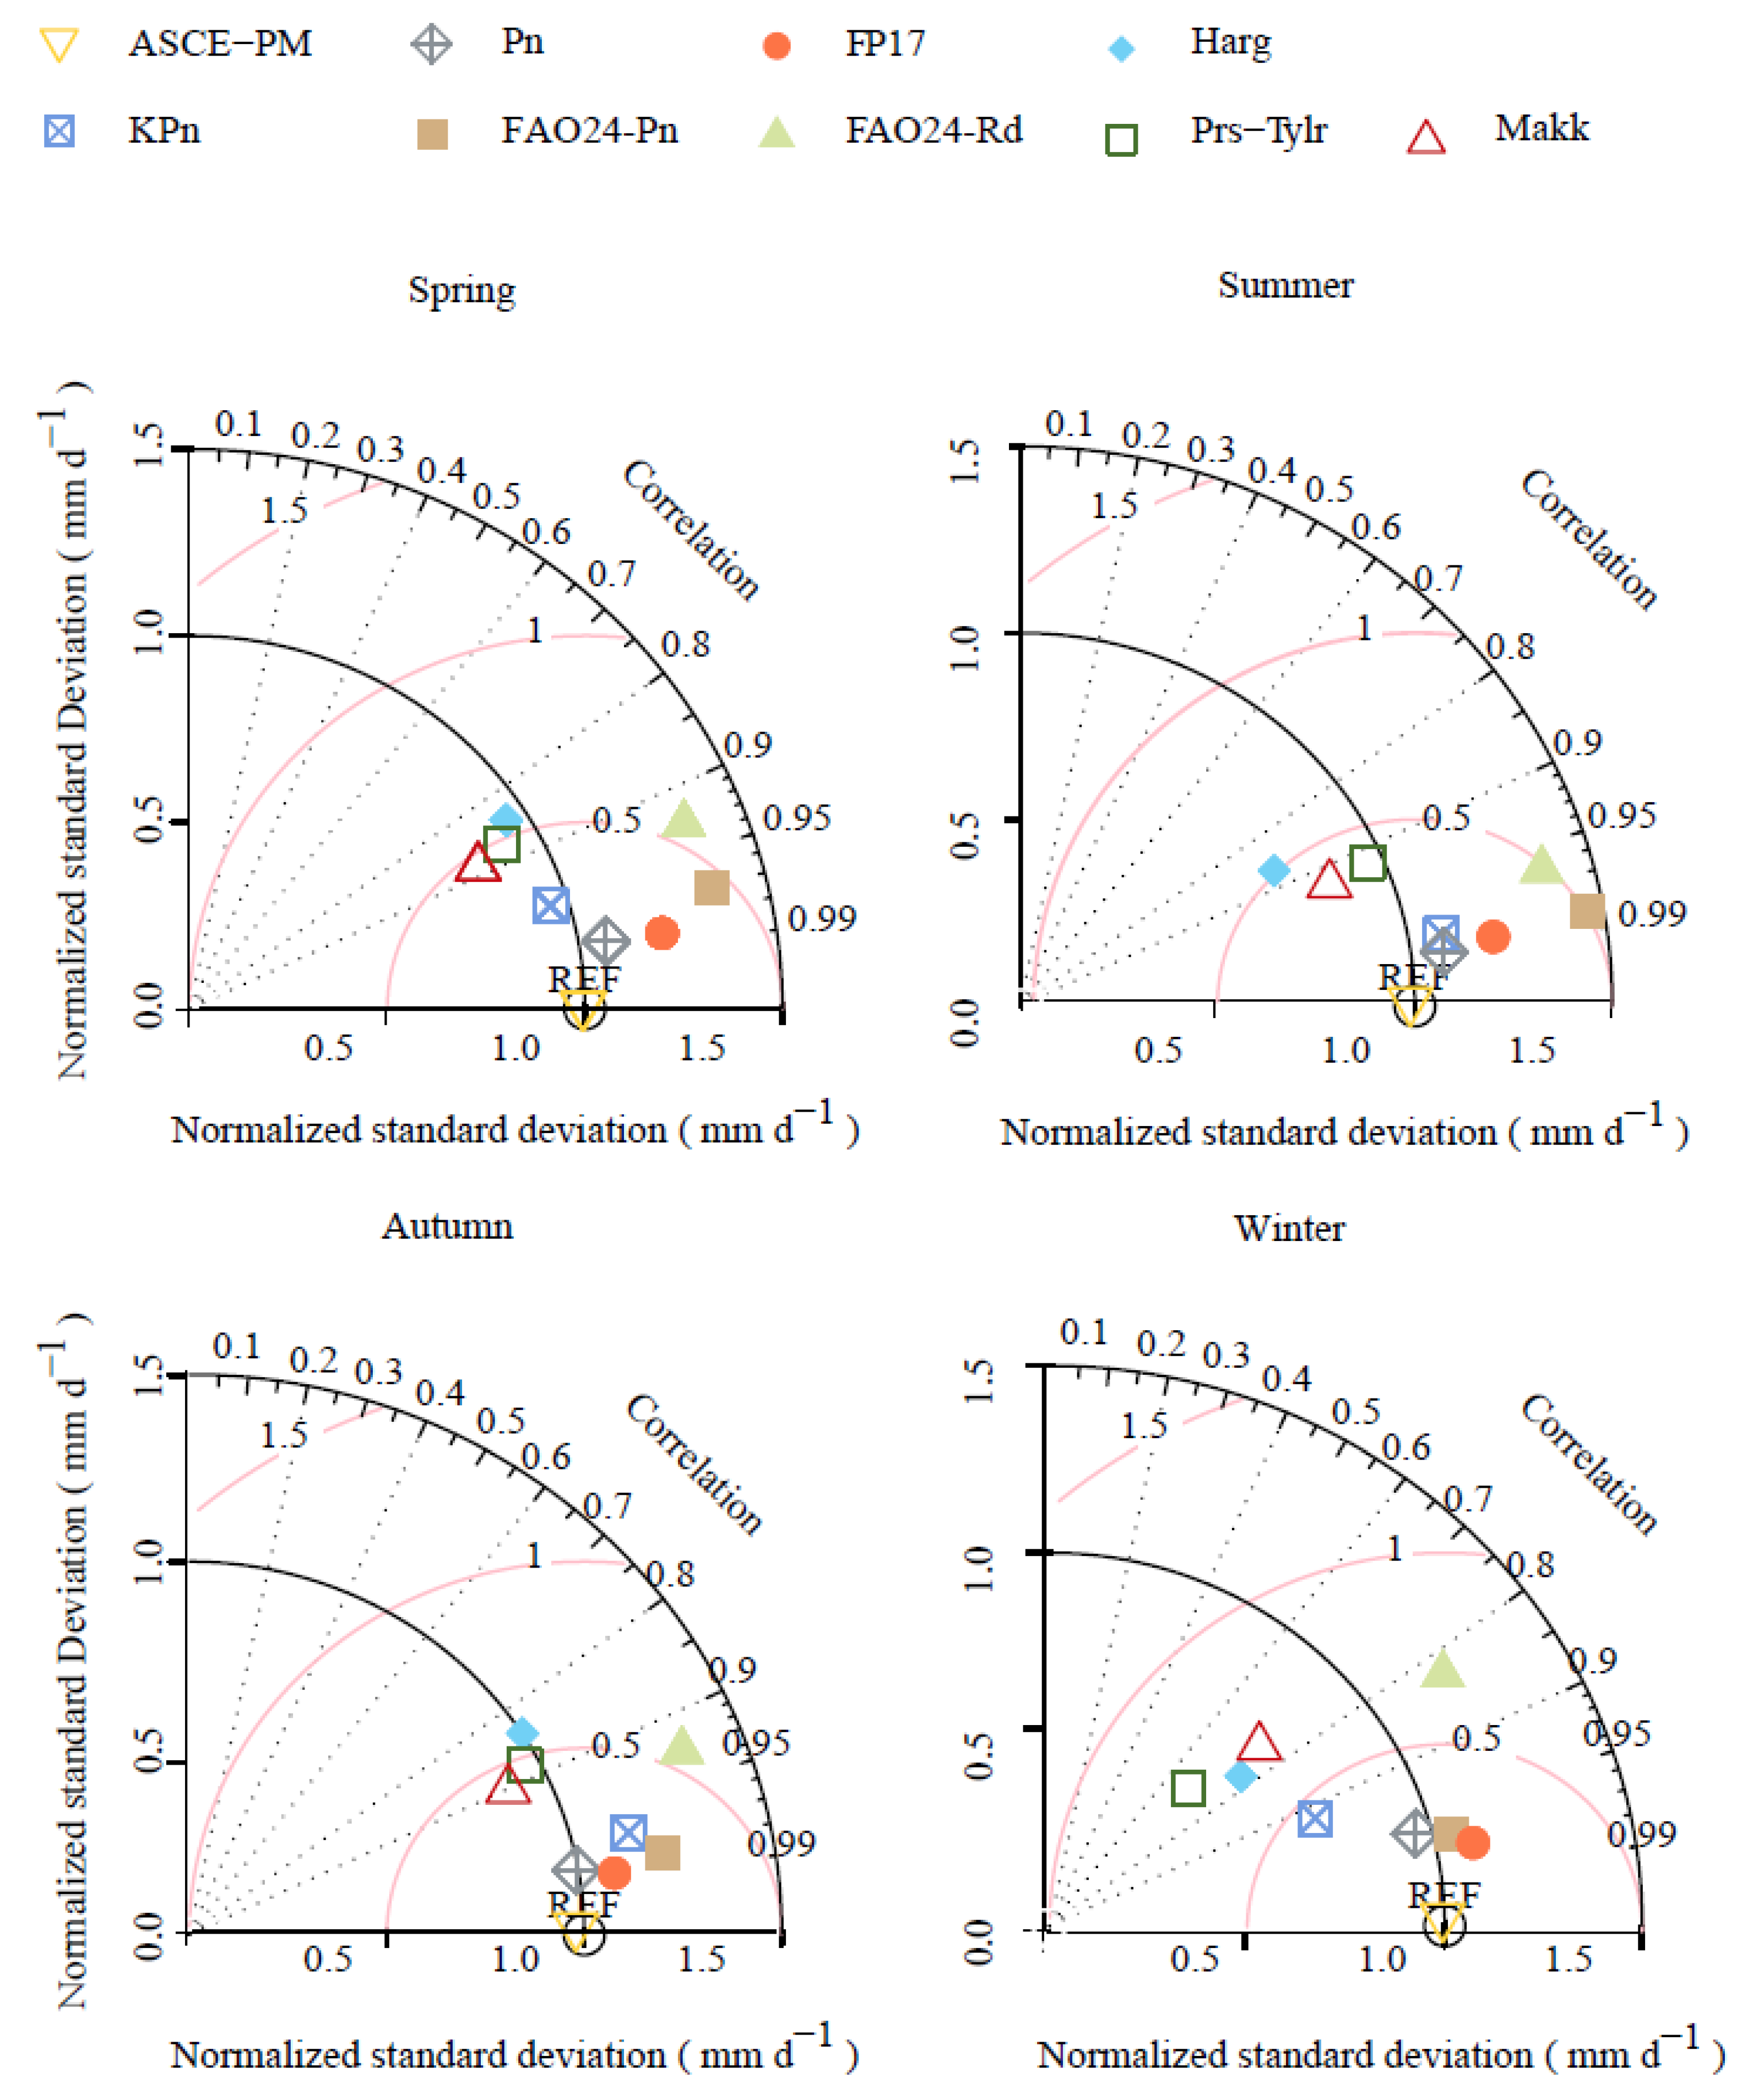
3.1.2. Applicability on Seasonal Scale

The relationship between different meteorological factors and evapotranspiration was slightly different in different seasons, corresponding to spring (December, January, and February), summer (March, April, and May), autumn (June, July, and August), and winter (September, October, and November) (Figure 7). The results showed that the algorithms based on Penman showed significant correlation in each season with the ETo calculated by FAO56-PM (p < 0.01). Similar to the results at the daily scale, the algorithms based on the Penman formula showed the most consistent trend with the results calculated by FAO56-PM. The accuracy in summer and autumn was higher than that in spring and winter for all algorithms. Specifically, the R2 based on the Penman formula was the highest, at greater than 0.9, followed by the R2 based on radiation algorithms; the R2 based on temperature was the lowest, with a value that was less than 0.8. The accuracy of all algorithms was the lowest in winter, with the R2 of the radiation-based algorithm being less than 0.7 (Figure 7).
The normalized root mean square error between different algorithms and FAO56-PM also varied in different seasons. The nRMSE of ASCE-PM, FP17, and Pn was less than 20% in all four seasons, indicating that these three algorithms performed well in all four seasons. The Makk performed poorly in all four seasons, with nRMSE greater than 30%. The nRMSE of FAO24-Rd, Harg, and Prs Tyr was less than 30% in spring and summer, and it was the opposite in autumn and winter, indicating that these three algorithms performed better in spring and summer than in autumn and winter.
The performance of FAO24-Pn was opposite to the results of these three algorithms. KPn performed well in all three seasons but showed poor performance in winter. The rMBE of ASCE-PM, FP17, FAO24-Rd, and Pn also indicated that these four algorithms performed well in different seasons, with ASCE-PM and FAO24-Rd underestimating ETo and FP17 and Pn overestimating ETo. The Makk algorithm performed poorly, with a relative average deviation of less than −20% in all four seasons. The rMBE of Harg, Prs–Tyler, and KPn in winter was less than −20%, but the absolute values of the other three seasons were all less than 20%.
Figure 8 shows the Taylor analysis results between FAO56-PM and other ETo algorithms in different seasons. The S values in the spring and autumn were all greater than 0.85. The S values of these algorithms based on the Penman formula were the highest, followed by the radiation algorithm, and the S values based on the temperature algorithm were the lowest. In summer, the S value of FAO24-Pn was smaller than that based on the radiation algorithm. In winter, the S values of each algorithm differed the most from those at a daily scale. Among them, the S values of Makk and Prs Tyr based on the radiation algorithm and Harg based on the temperature algorithm were both lower than 0.7. The S of Prs Tyr was the lowest, with a value of 0.47 (Table 2).

3.2. Evapotranspiration Characteristics of Crops at Different Growth Stages Based on Water Balance

Understanding the characteristics of crop evapotranspiration and water consumption is of great significance for studying crop growth and yield formation. The evapotranspiration of each growth period is closely related to growth period length and climate conditions. The water balance method is a traditional and accurate method for estimating cropland evapotranspiration, but it cannot obtain continuous values. The actual crop coefficient (Kc act) of the crops in the area can be obtained using the ratio of actual crop evapotranspiration (ETc act) to ETo (determined by FAO56-PM in this study) during each growth period of the cropland during the experimental period. It can accurately estimate the evapotranspiration water consumption of the cropland that has not been measured in the actual field to monitor drought and effectively manage water resources.
The evapotranspiration characteristics of winter wheat and spring maize at different growth stages in the Changwu are shown in Table 3. The ETo of winter wheat at each growth stage in the Loess Plateau region showed a single peak curve. This reflects the changes in evapotranspiration capacity determined by climate conditions in the study area. Correspondingly, the evapotranspiration of winter wheat at each growth stage also showed a trend of change with its growth and development. The growth rate of winter wheat gradually increased after the rejuvenation period. With the continuous growth of leaves and stems, as well as the occurrence of reproductive growth, the evapotranspiration during the booting stage also continuously increased. At the heading and grouting stages, the temperature rapidly increased and reached the stage of yield formation, with evapotranspiration reaching a peak of 50 mm. The variation pattern of water consumption modulus (M), water consumption intensity (Iwc), and evapotranspiration during each growth period of winter wheat was basically consistent. The minimum Iwc occurred at the rejuvenation period, with a value of 1.04 mm d−1. This was due to the lower temperature during the period and the weaker life activities of winter wheat.
The variation of evapotranspiration during the growth period of spring maize was closely related to meteorological factors and physiological characteristics, as shown in Table 3. The ETo of spring maize showed a single peak curve, reaching a maximum value of 182 mm during the filling period. The spring maize grew slowly from the sowing period to the five-leaf stage, and evapotranspiration during the five-leaf stage reached 49 mm. Evapotranspiration during the jointing stage was 67 mm as the temperature increased. Water consumption reached the maximum value of 152 mm during the filling stage. The ETc act of spring maize during the harvest period was the lowest. Correspondingly, the water consumption modulus and water consumption intensity showed a single peak curve during the growth period of spring maize and reached their peak at the filling stage (41% and 3.27 mm d−1, respectively).
The crop coefficient can be used as an indicator reflecting the water consumption characteristics of crops during their growth period to determine their water demand. The magnitude of its value is related to the crop type, water conditions, and nutrient management measures in the field. M and Iwc during the growing stage showed a similar trend as the crop coefficient. M was determined by the ratio of evapotranspiration water consumption at a certain stage of the growth period to the total water consumption throughout the growth period, while Iwc was determined by the ratio of evapotranspiration water consumption at a certain stage of the growth period to the number of days in that stage.

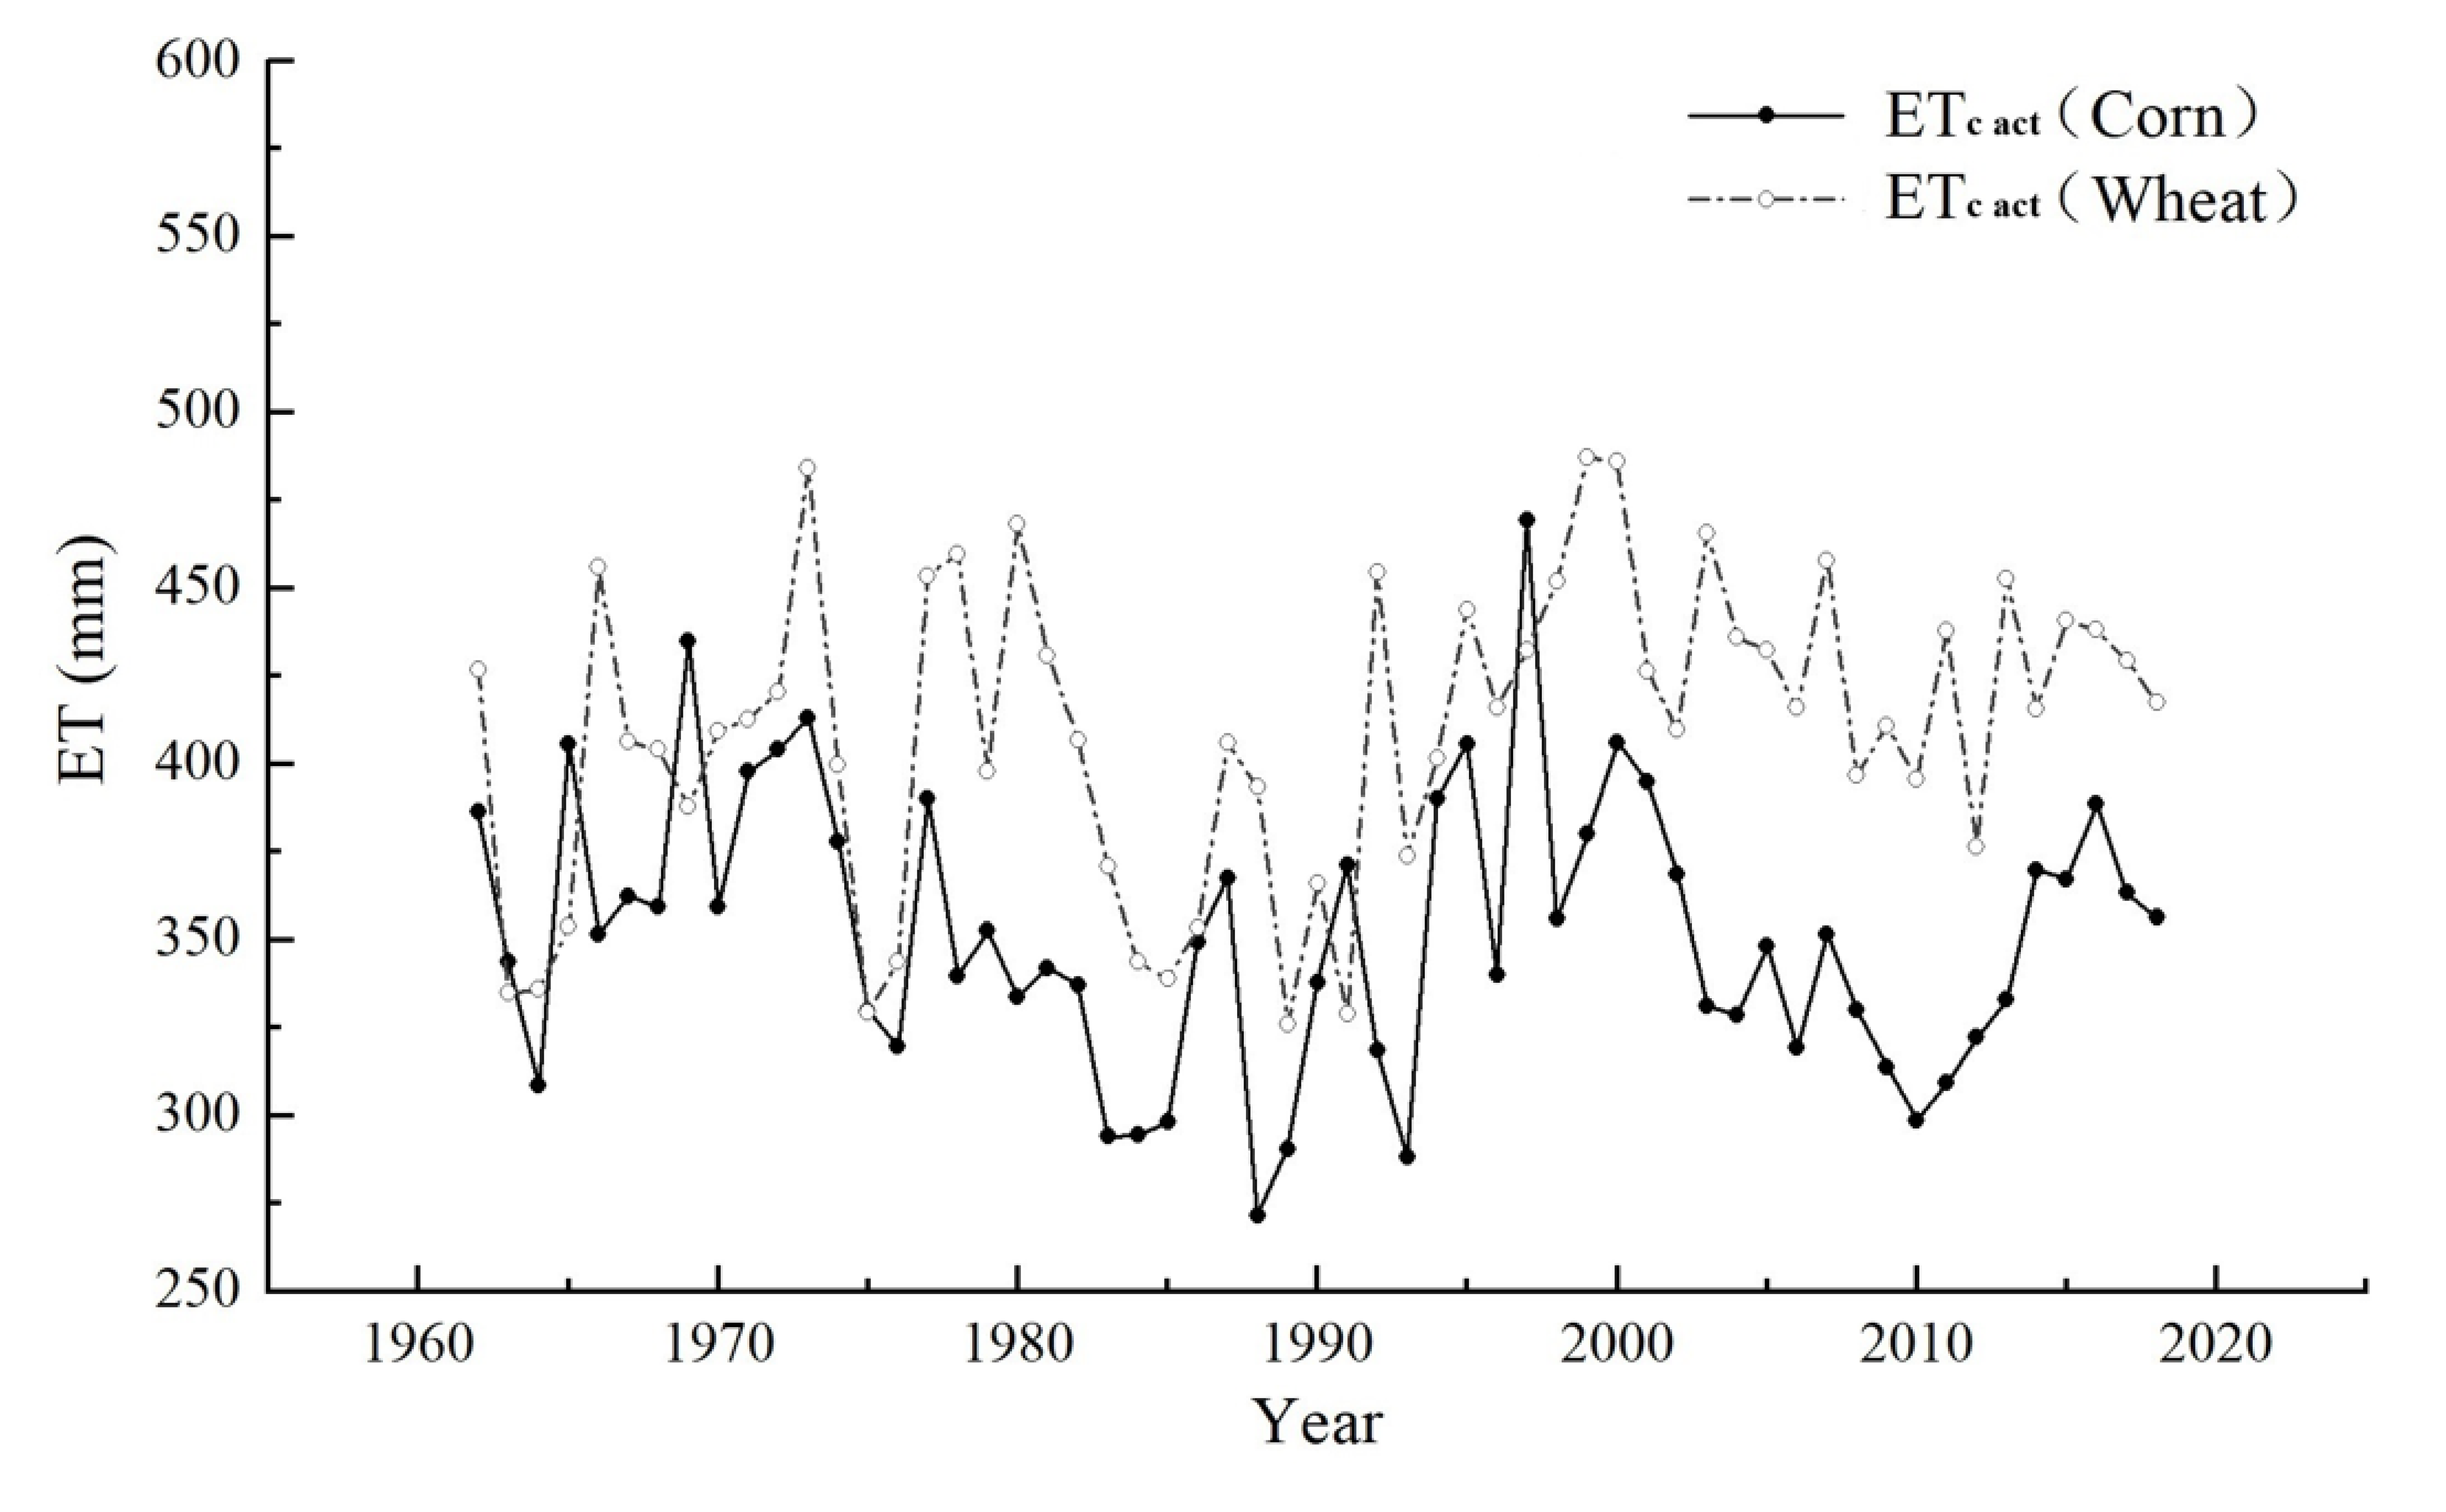
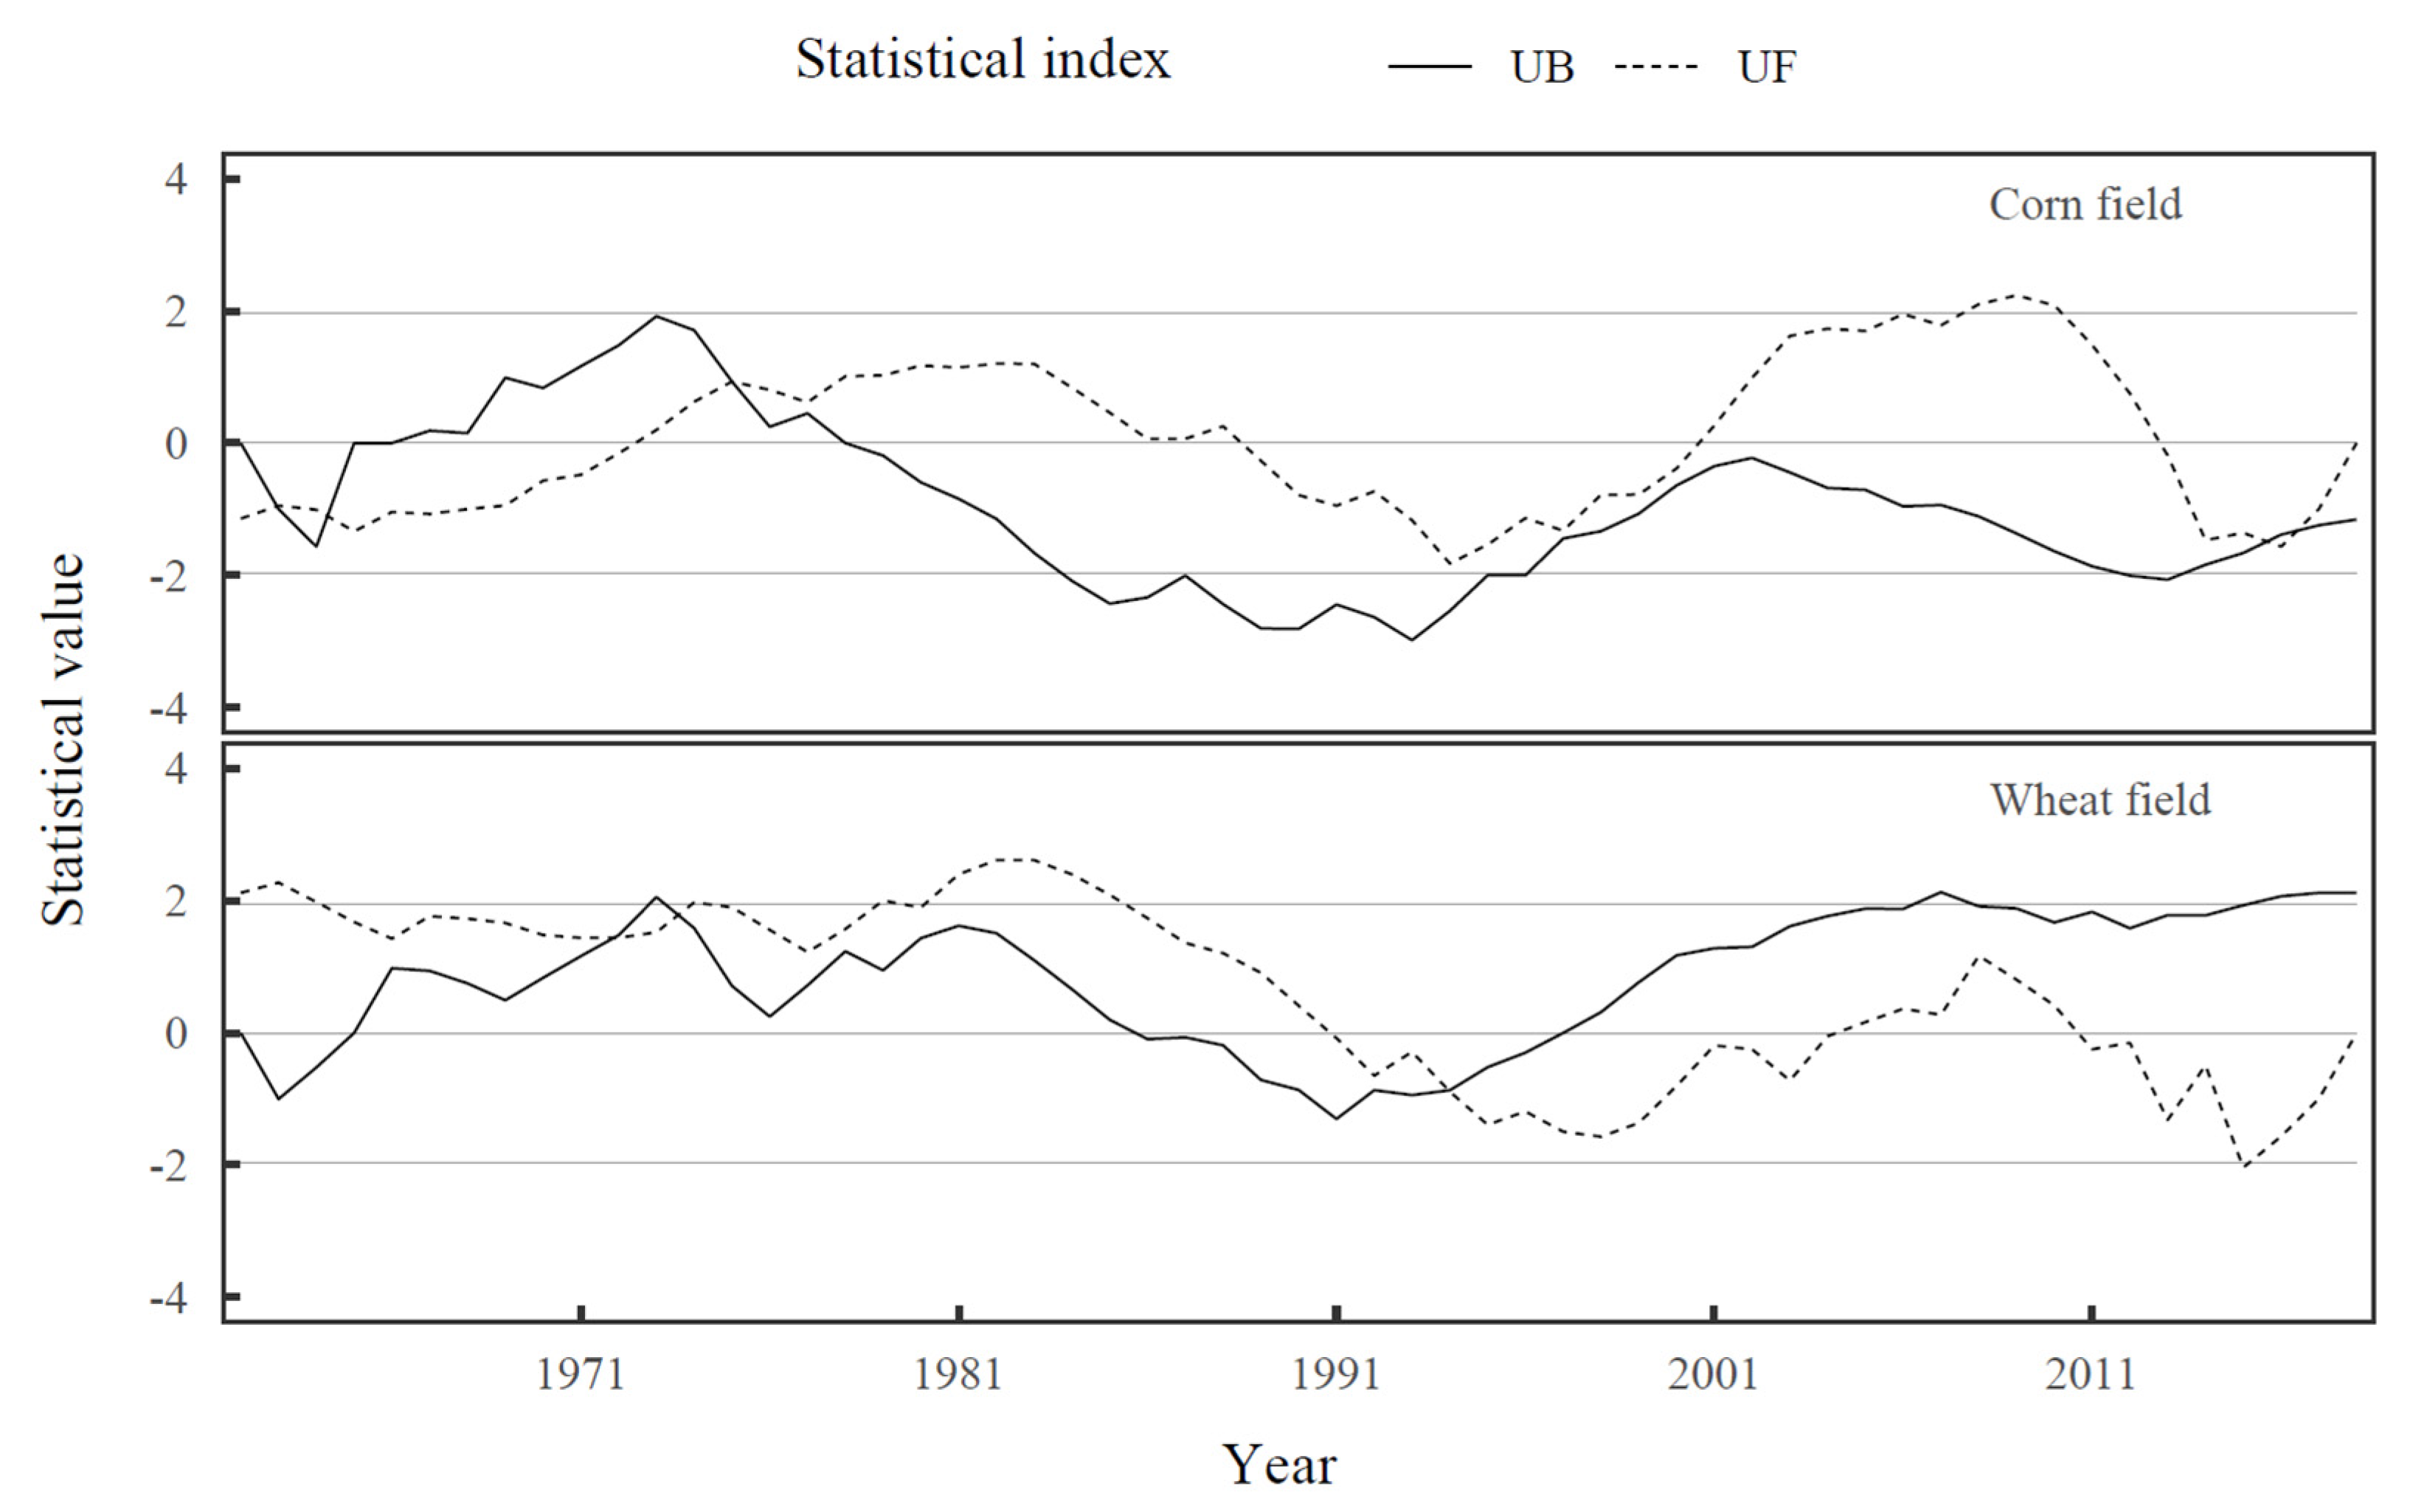
3.3. Interannual Variation Characteristics of Evapotranspiration in Cropland Under Climate Fluctuation

Changes in climate conditions, such as precipitation and temperature, cause changes in regional evapotranspiration, which affect agricultural water resources and agricultural production. The interannual variation of ETc act, which was determined by multiplying the ETo obtained from FAO56-PM with the Kc act obtained from the Section 3.2 experiment during the growth period of spring maize and winter wheat in Changwu from 1961 to 2018, is shown in Figure 9. The results showed that the average annual evapotranspiration of spring maize throughout its entire growth period was 352 mm, with a maximum value of 469 mm (1997) and a minimum value of 271 mm (1988).
In addition, the MK trend test was conducted on the evapotranspiration of spring maize during the growth period in Changwu. The MK test coefficient was −1.14, with a p-value of 0.25 (greater than 0.05), indicating that the change in maize evapotranspiration in the region was not significant. The average annual evapotranspiration of winter wheat throughout the entire growth period in the research area was 410 mm, with a maximum value of 487 mm (1999) and a minimum value of 326 mm (1989). The MK trend test results of evapotranspiration during the growth period of winter wheat in the region showed a significant increase in water consumption at the 0.05 level, with an MK test coefficient of 2.11 and a p-value of 0.03.
The MK mutation test results of evapotranspiration during the growing season of spring maize and winter wheat in Changwuyuan are shown in Figure 10. The evapotranspiration of spring maize in the study area during the growing season increased first, followed by a decrease. It showed a significant decreasing trend from 1984 to 1996 and 2012 to 2013 (p < 0.05). The UF and UB curves showed two intersections in 1974 and 2015, respectively, indicating that the evapotranspiration of spring maize in the study area experienced two mutations during the entire growth period from 1961 to 2018. The evapotranspiration of winter wheat in the study area showed a significant increasing trend from 2016 to 2018 (p < 0.05). The UF and UB curves showed two intersections in 1973 and 1994, respectively, indicating that the evapotranspiration of winter wheat in the study area experienced two mutations during the entire growth period from 1961 to 2018.
Continuous Morlet wavelet analysis was conducted on the evapotranspiration of spring maize and winter wheat during the growth period in the Changwu Plateau region, calculated based on the FAO56-PM formula. The fluctuation intensity of evapotranspiration changes during the growth period of the two crops under historical climate change conditions are plotted in Figure 11, which clearly displays the fluctuation patterns of evapotranspiration during the growth period of crops with time series at different time scales. Based on this, the variation cycle of evapotranspiration during the growth period of spring maize and winter wheat can be inferred.
The results showed that the evapotranspiration of the two crops in the study area had fluctuation periods in the 58-year time series from 1961 to 2018, and there were differences in the fluctuation periods of the two crops. As shown in Figure 11, the evapotranspiration of spring maize during its growth period had a fluctuation period of 2–3 years from 1994 to 2000 and a fluctuation period of 3–6 years from 1985 to 1994. In addition, long-term fluctuations of 24–28 years were also found in the periodic study from 1961 to 2018. The periodic fluctuation of evapotranspiration during the growth period of winter wheat in this research area was stronger than that of spring maize. There were 2–3 years of periodic changes between 1990 and 1996 and 2010 and 2015, 3–5 years of periodic changes between 1972 and 1981 and 1995 and 2005, and 6–7 years of periodic changes between 1964 and 1980. In addition, long-term changes of 20–28 years were also found in the periodic study from 1961 to 2018.

4. Discussion

4.1. Comparison of Calculation Methods for Reference Crop Evapotranspiration in the Loess Plateau

This study found a great correlation for the ETo results between the ETo calculation methods based on the Penman formula algorithm in the Loess Plateau area, and the consistency between the calculation results of ASCE-PM and FAO56-PM was the highest. Fan et al. also found a close correlation between the ETo calculation methods of Penman and believed that the Kimberly PM-72 method was the best, which may be related to the difference between the study area and the calculation method studied in this study [44]. Meanwhile, this study found that the Harg and Makk algorithms based on temperature and radiation had relatively low accuracy at the daily scale, and both Prs–Tyler and Makk underestimated the ETo due to inappropriate empirical coefficients used in the formulas. The Prs–Tyler formula was established on the basis of negligible advection effects on land and open water surfaces. The formula modifies the radiation term but ignores the aerodynamic term. In fact, wind speed also has a significant impact on evapotranspiration [45]. Moreover, temperature-based models often assume a constant relationship between temperature and evapotranspiration, which may not hold true when there are variable temperature conditions in a study area. This assumption can result in less accurate predictions compared to methods that directly account for radiation and other climatic factors. Therefore, it is necessary to adjust the parameters in the formula when calculating ETo with less meteorological data. This is consistent with the conclusions of many scholars [46,47,48]. In the study of the applicability of various algorithms for reference crop evapotranspiration in different seasons, this study found that the Taylor skill scores of each algorithm for ETo in spring and autumn were the highest with the Penman formula algorithm, followed by the radiation-based algorithm and the temperature-based algorithm, with small differences between different algorithms in these two seasons. The Taylor skill scores of each algorithm in winter were relatively small and had significant differences. Some scholars have found that there are significant differences between different algorithms for ETo in summer, while the differences in spring and autumn are relatively small [44], which also reflects the regional differences of each calculation method. Moreover, when applying the Kc-ETo approach, ETo must be calculated following the FAO56 guidelines. Among the models evaluated in this study, only the FAO56-PM and Harg equations are compatible with Kc-ETo due to established conversion factors. Other models cannot be used with Kc-ETo as their conversion relationships are undefined, which would introduce significant uncertainties.

4.2. Evapotranspiration Based on Field Measurements

Unlike modeling-focused studies, our field-measured Kc act values revealed divergence from FAO standards due to local soil–climate interactions. In this study, the crop coefficient of winter wheat in the Changwu Plateau showed a trend of first increasing and then decreasing from overwintering to harvest, but the value was different from the empirical value in arid areas recommended by FAO. FAO recommends crop coefficients for winter wheat of 0.40, 1.14, and 0.40 for the three stages of rejuvenation–jointing (crop development of FAO), heading–grouting (mid-season (Stage 3) of FAO), and grouting–harvest (late season of FAO). The average crop coefficients for the corresponding growth stages in this study were 0.66, 0.79, and 0.74, respectively, which were 65% higher, 31% lower, and 85% higher than the FAO experience values. Li et al. [49] found a similar result in their research on the crop coefficient of winter wheat in the Loess Plateau region and believed that the study area belongs to a semi-arid climate zone, resulting in a strong water consumption capacity of winter wheat. The crop coefficient of spring maize in the study area was consistent with the FAO-recommended values, which were 0.43, 0.43–1.16, 1.16, and 1.16–0.35 for the seeding–jointing stage, jointing–tasseling stage, tasseling–grouting stage, and grouting–harvest stage during the jointing–heading stage and the filling–maturity stage. It was lower than the FAO-recommended values by 12% and 10% during the seedling–jointing stage and the heading–filling stage, respectively, indicating that the study area does not lack water during these two growth stages of spring maize. The difference between the Kc act of the winter wheat and maize in the study area with the values recommended by FAO may be attributed to several factors. For instance, the unique environmental conditions in Changwu Plateau may be different from the conditions in which the FAO recommendations were developed. Higher average temperatures or different diurnal temperature ranges can lead to higher Kc act values during certain growth stages [38]. The Changwu Plateau may have different soil properties that affect the availability of water to the crops, thereby altering the Kc act values. Moreover, the crop varieties and management practices, such as planting dates, fertilization, and irrigation scheduling, can result in different water use efficiencies compared to those assumed in the FAO guidelines [50].

4.3. Changes in Field Evapotranspiration of Spring Maize and Winter Wheat with Climate Fluctuations

The field evapotranspiration during the growth period of spring maize and winter wheat showed different trends and cycles under climate fluctuations, which were caused by the different growth periods of crops, and the changes were synchronized with the changes in meteorological factors. Precipitation and temperature during the growing season of spring maize showed a trend of increase–decrease–increase, and the intensity of temperature fluctuations was greater than that of precipitation, with a significant decrease in temperature from 1984 to 1996 (p < 0.05). The precipitation during the growth period of winter wheat showed a decreasing trend, and the temperature showed a trend of increase–decrease–increase, which significantly increased after 2003 (p < 0.01) (Figure 12). The growth period of spring maize is from April to September each year, which means high precipitation and temperature. During the study period, the minimum precipitation was 220 mm (1995), and the maximum precipitation was 727 mm (2003), with an average of 441 mm. The minimum temperature was 17.1 °C (1983), the maximum temperature was 19.6 °C (1995), and the average was 18.7 °C. The growth season of winter wheat is from the end of September to June of the following year, during which there is less precipitation and lower temperatures. During the study period, the maximum, minimum, and average precipitation were 389 mm (1983), 123 mm (1977), and 200 mm, respectively. The maximum, minimum, and average temperatures were 6.8 °C (2017), 3.6 °C (1968), and 4.6 °C, respectively. The evapotranspiration of spring maize during the entire growth period was 352 mm, while the evapotranspiration of winter wheat was 410 mm. Obviously, the water consumption of winter wheat was greater than the precipitation during the growth period. In addition, due to the existence of a certain period of variation in precipitation and air temperature (Figure 12) and the fact that the water consumption during the growth period of spring maize and winter wheat can basically be replenished by precipitation, the evapotranspiration of the two also showed a corresponding period of variation with climate fluctuations. Therefore, according to our previous study on the characteristics of water supply and demand in apple orchards [51] and the results of the periodic evapotranspiration for winter wheat and spring maize in this study, it can be suggested that winter wheat be planted to alleviate extreme dryness in apple orchards.

4.4. Uncertainty Analysis of Research Methods

Although the method used in this study performed well in the study area, there are still some uncertainties. In terms of observation data, the accuracy of the neutron instrument in determining soil moisture content is ±5%, and the measurement depth interval (0–100 cm per 10 cm and 100–600 cm per 20 cm) may result in the loss of detailed information about vertical changes in soil moisture. Although the missing rate of meteorological data is small, linear interpolation processing may smooth out the characteristic values of extreme meteorological events, which may have an impact on the calculation accuracy of ETc act. In terms of modeling, the water balance method is based on the simplified assumption of “precipitation − soil water storage change = evapotranspiration”, ignoring runoff and deep seepage processes, which may introduce significant errors under extreme rainfall events or special terrain conditions. Secondly, there is uncertainty in the spatial extrapolation of localized Kc act values obtained through field trials from 2012 to 2015. When extending the results of a single experimental point to the entire Loess Plateau, it is necessary to consider the spatial heterogeneity of regional terrain, soil, and management. Although six repeated samples were used, the characterization of microterrain changes and water and heat redistribution processes in farmland may still be insufficient. Therefore, in future research, new-generation soil moisture monitoring technologies (such as distributed fiber optic sensing or electromagnetic induction technology) can be used, combined with unmanned aerial vehicle remote sensing, to achieve high-precision and high-resolution continuous monitoring of soil moisture. The evapotranspiration of cropland can be estimated using a water balance model that couples surface runoff and deep seepage processes, and its applicability can be validated under extreme rainfall conditions. By utilizing a multisite networked observation system in typical areas of the Loess Plateau and combining remote sensing data assimilation methods, the regional representativeness of the research results can be enhanced.

5. Conclusions

This study has made three key contributions. Firstly, the study established a comprehensive evaluation framework for ETo estimation models specific to Loess Tableland conditions, demonstrating that the Prs–Tylr formula based on radiation and the Harg formula based on temperature can be used when meteorological data are limited. ASCE-PM, FP17, and Pn are available to be used to calculate the daily ETo in the Loess Tableland when meteorological data are sufficient. Secondly, the crop coefficient of spring maize was consistent with the FAO-recommended values during the jointing–heading stage and the filling–maturity stage and was lower than the FAO-recommended values by 12% and 10% during the seedling–jointing stage and the heading–filling stage, respectively. For the Kc act of winter wheat, it was 65% higher, 31% lower, and 85% higher than the FAO experience values in the rejuvenation–jointing stage, heading–grouting stage, and grouting–harvest stage. Thirdly, during the growth period of continuous cropping of spring maize and winter wheat in a 58-year-long time series (1961–2018), the evapotranspiration of spring maize fluctuated between 2–3 years and 3–6 years, while the evapotranspiration of winter wheat underwent periodic changes of 2–3 years, 3–5 years, and 6–7 years. This result provides a new mechanistic understanding of crop–water–climate interactions that bridges the gap between short-term field studies and decadal climate projections. These advances can collectively enhance the precision of water management strategies for semi-arid tableland regions, particularly for the management of cropland ecosystems.

Author Contributions

Conceptualization, J.Z.; methodology, G.C.; software, G.C. and J.Z.; validation, L.W., L.J., and J.Z.; formal analysis, G.C.; investigation, L.W.; resources, J.Z.; data curation, J.Z. and G.C.; writing—original draft preparation, J.Z.; writing—review and editing, L.W. and L.J.; visualization, L.W.; supervision, L.W. and L.J.; project administration, L.W.; funding acquisition, L.W. and J.Z. All authors have read and agreed to the published version of the manuscript.

Funding

This research was funded by the National Natural Science Foundation of China (42377318 and 42171043), the Hebei Natural Science Foundation (C2024301124), and the Basic Research Funds of Hebei Academy of Agriculture and Forestry Sciences (2024130202). The APC was funded by the Basic Research Funds of Hebei Academy of Agriculture and Forestry Sciences (2024130202).

Data Availability Statement

The datasets analyzed in the present study are available from the corresponding authors on reasonable request.

Acknowledgments

We acknowledge all supporting staff and friends for their help during the experiments.

Conflicts of Interest

The authors declare no conflicts of interest.

References

  1. Chen, H.; Razaqpur, A.G.; Wei, Y.; Huang, J.J.; Li, H.; McBean, E. Estimation of global land surface evapotranspiration and its trend using a surface energy balance constrained deep learning model. J. Hydrol. 2023, 627, 130224. [Google Scholar] [CrossRef]
  2. Zhang, L.; Marshall, M.; Vrieling, A.; Nelson, A. The divergence of energy-and water-balance evapotranspiration estimates in humid regions. J. Hydrol. 2023, 624, 129971. [Google Scholar] [CrossRef]
  3. Amani, S.; Shafizadeh-Moghadam, H. A review of machine learning models and influential factors for estimating evapotranspiration using remote sensing and ground-based data. Agric. Water Manag. 2023, 284, 108324. [Google Scholar] [CrossRef]
  4. Liu, W.; Zhang, B.; Wei, Z.; Wang, Y.; Tong, L.; Guo, J.; Han, X.; Han, C. Heterogeneity analysis of main driving factors affecting potential evapotranspiration changes across different climate regions. Sci. Total Environ. 2024, 912, 168991. [Google Scholar] [CrossRef]
  5. Adeyeri, O.E.; Zhou, W.; Ndehedehe, C.E.; Wang, X. Global vegetation, moisture, thermal and climate interactions intensify compound extreme events. Sci. Total Environ. 2024, 912, 169261. [Google Scholar] [CrossRef]
  6. Pluntke, T.; Bernhofer, C.; Grünwald, T.; Renner, M.; Prasse, H. Long-term climatological and ecohydrological analysis of a paired catchment–flux tower observatory near Dresden (Germany). Is there evidence of climate change in local evapotranspiration? J. Hydrol. 2023, 617, 128873. [Google Scholar] [CrossRef]
  7. Liu, Z.; Cammarano, D.; Liu, X.; Tian, Y.; Zhu, Y.; Cao, W.; Cao, Q. Winter wheat yield responses to growing degree days: Long-term trends and adaptability in major producing areas of China. Ecol. Indic. 2025, 170, 113058. [Google Scholar] [CrossRef]
  8. Yu, Y.; You, Q.; Zuo, Z.; Zhang, Y.; Cai, Z.; Li, W.; Jiang, Z.; Ullah, S.; Tang, X.; Zhang, R.; et al. Compound climate extremes in China: Trends, causes, and projections. Atmos. Res. 2023, 286, 106675. [Google Scholar] [CrossRef]
  9. Li, L.; Yao, N.; Li, Y.; Li Liu, D.; Wang, B.; Ayantobo, O.O. Future projections of extreme temperature events in different sub-regions of China. Atmos. Res. 2019, 217, 150–164. [Google Scholar] [CrossRef]
  10. Howitt, R.E.; MacEwan, D.; Medellín-Azuara, J.; Lund, J.R. Economic Modeling of Agriculture and Water in California Using the Statewide Agricultural Production Model; University of California: Davis, CA, USA, 2010. [Google Scholar]
  11. Van Dijk, A.I.; Beck, H.E.; Crosbie, R.S.; De Jeu, R.A.; Liu, Y.Y.; Podger, G.M.; Timbal, B.; Viney, N.R. The Millennium Drought in southeast Australia (2001–2009): Natural and human causes and implications for water resources, ecosystems, economy, and society. Water Resour. Res. 2013, 49, 1040–1057. [Google Scholar] [CrossRef]
  12. Arts, B.; De Koning, J. Community forest management: An assessment and explanation of its performance through QCA. World Dev. 2017, 96, 315–325. [Google Scholar] [CrossRef]
  13. Islam, R.; Reeder, R. No-till and conservation agriculture in the United States: An example from the David Brandt farm, Carroll, Ohio. Int. Soil Water Conserv. Res. 2014, 2, 97–107. [Google Scholar] [CrossRef]
  14. Asseng, S.; Ewert, F.; Rosenzweig, C.; Jones, J.W.; Hatfield, J.L.; Ruane, A.C.; Boote, K.J.; Thorburn, P.J.; Rötter, R.P.; Cammarano, D.; et al. Uncertainty in simulating wheat yields under climate change. Nat. Clim. Change 2013, 3, 827–832. [Google Scholar] [CrossRef]
  15. Chang, Y.; Ding, Y.; Zhang, S.; Qin, J.; Zhao, Q. Variations and drivers of evapotranspiration in the Tibetan Plateau during 1982–2015. J. Hydrol. Reg. Stud. 2023, 47, 101366. [Google Scholar] [CrossRef]
  16. Mai, M.; Qiu, X.F.; Zeng, Y. Distribution characteristics of actual evapotranspiration on crop fields in Western China. Chin. J. Agrometeorol. 2004, 25, 28–32. [Google Scholar]
  17. Tysa, S.K.; Ren, G.; Zhang, P.; Zhang, S. Impact of urbanization on regional extreme precipitation trends observed at China national station network. Weather. Clim. Extrem. 2025, 48, 100760. [Google Scholar] [CrossRef]
  18. Liu, X.; Xu, Y.; Sun, S.; Wu, P.; Wang, Y. Water resource efficiency evaluation of crop production in arid and semi-arid regions based on water footprint and comparative advantage. Eur. J. Agron. 2024, 160, 127310. [Google Scholar] [CrossRef]
  19. Penman, H.L. Natural evaporation from open water, bare soil and grass. Proc. R. Soc. Lond. Ser. A Math. Phys. Sci. 1948, 193, 120–145. [Google Scholar]
  20. He, C.; Wang, Y.; Yan, F.; Lu, Q. Spatiotemporal characteristics and influencing factors of vegetation water use efficiency on the Tibetan Plateau in 2001–2020. J. Geogr. Sci. 2025, 35, 39–64. [Google Scholar] [CrossRef]
  21. Allen, R.G.; Pruitt, W.O.; Wright, J.L.; Howell, T.A.; Ventura, F.; Snyder, R.; Itenfisu, D.; Steduto, P.; Berengena, J.; Yrisarry, J.B.; et al. A recommendation on standardized surface resistance for hourly calculation of reference ETo by the FAO56 Penman-Monteith method. Agric. Water Manag. 2006, 81, 1–22. [Google Scholar] [CrossRef]
  22. Allen, R.G.; Wright, J.L. Variation Within Measured and Estimated Consumptive Use Requirements; American Society of Civil Engineers: New York, NY, USA, 1983. [Google Scholar]
  23. Qin, S.; Li, S.; Cheng, L.; Zhang, L.; Qiu, R.; Liu, P.; Xi, H. Partitioning evapotranspiration in partially mulched interplanted croplands by improving the Shuttleworth-Wallace model. Agric. Water Manag. 2023, 276, 108040. [Google Scholar] [CrossRef]
  24. Beegum, S.; Sun, W.; Timlin, D.; Wang, Z.; Fleisher, D.; Reddy, V.R.; Ray, C. Incorporation of carbon dioxide production and transport module into a Soil-Plant-Atmosphere continuum model. Geoderma 2023, 437, 116586. [Google Scholar] [CrossRef]
  25. Parlange, M.B.; Katul, G.G. An advection-aridity evaporation model. Water Resour. Res. 1992, 28, 127–132. [Google Scholar] [CrossRef]
  26. Hobbins, M.T.; Ramírez, J.A.; Brown, T.C.; Claessens, L.H. The complementary relationship in estimation of regional evapotranspiration: The complementary relationship areal evapotranspiration and advection-aridity models. Water Resour. Res. 2001, 37, 1367–1387. [Google Scholar] [CrossRef]
  27. Raza, A.; Al-Ansari, N.; Hu, Y.; Acharki, S.; Vishwakarma, D.K.; Aghelpour, P.; Zubair, M.; Wandolo, C.A.; Elbeltagi, A. Misconceptions of reference and potential evapotranspiration: A PRISMA-guided comprehensive review. Hydrology 2022, 9, 153. [Google Scholar] [CrossRef]
  28. Zhao, S.; Zhang, H.; Feng, S.; Fu, Q. Simulating direct effects of dust aerosol on arid and semi-arid regions using an aerosol–climate coupled system. Int. J. Climatol. 2015, 35, 1858–1866. [Google Scholar] [CrossRef]
  29. Lu, J.; Sun, G.; McNulty, S.G.; Amatya, D.M. A comparison of six potential evapotranspiration methods for regional use in the southeastern United States. J. Am. Water Resour. Assoc. 2005, 41, 621–633. [Google Scholar] [CrossRef]
  30. Xu, C.; Singh, V. Cross comparison of empirical equations for calculating potential evapotranspiration with data from Switzerland. Water Resour. Manag. 2002, 16, 197–219. [Google Scholar] [CrossRef]
  31. Azhar, A.H.; Perera, B. Evaluation of reference evapotranspiration estimation methods under southeast Australian conditions. J. Irrig. Drain. Eng. 2011, 137, 268–279. [Google Scholar] [CrossRef]
  32. Milly, P.C.; Dunne, K.A. Potential evapotranspiration and continental drying. Nat. Clim. Change 2016, 6, 946–949. [Google Scholar] [CrossRef]
  33. Zhang, J. The Water Consumption Characteristics and Model Simulation of Agroforestry Ecosystem in Loess Plateau; Northwest A&F University: Xianyang, China, 2022. [Google Scholar]
  34. Almorox, J.; Quej, V.H.; Martí, P. Global performance ranking of temperature-based approaches for evapotranspiration estimation considering Köppen climate classes. J. Hydrol. 2015, 528, 514–522. [Google Scholar] [CrossRef]
  35. Irmak, S.; Howell, T.; Allen, R.; Payero, J.; Martin, D. Standardized ASCE Penman-Monteith: Impact of sum-of-hourly vs. 24-hour timestep computations at reference weather station sites. Trans. ASAE 2005, 48, 1063–1077. [Google Scholar] [CrossRef]
  36. Afshar, M.H.; Bulut, B.; Duzenli, E.; Amjad, M.; Yilmaz, M. Global spatiotemporal consistency between meteorological and soil moisture drought indices. Agric. For. Meteorol. 2022, 316, 108848. [Google Scholar] [CrossRef]
  37. Tesfaye, S.; Taye, G.; Birhane, E.; van der Zee, S.E. Spatiotemporal variability of ecosystem water use efficiency in northern Ethiopia during 1982–2014. J. Hydrol. 2021, 603, 126863. [Google Scholar] [CrossRef]
  38. Allen, R.G.; Pereira, L.S.; Raes, D.; Smith, M. Crop Evapotranspiration-Guidelines for Computing Crop Water Requirements-FAO Irrigation and Drainage Paper 56; FAO: Rome, Italy, 1998; Volume 300, p. D05109. [Google Scholar]
  39. Wang, S.Y.; Wang, L.; Han, X.; Zhang, L.S. Evapotranspiration characteristics of apple orchard at peak period of fruiting in Loess Tableland. Sci. Silvae Sin. 2016, 52, 128–135. [Google Scholar]
  40. Guo, S.; Zhu, H.; Dang, T.; Wu, J.; Liu, W.; Hao, M.; Li, Y.; Syers, J.K. Winter wheat grain yield associated with precipitation distribution under long-term nitrogen fertilization in the semiarid Loess Plateau in China. Geoderma 2012, 189, 442–450. [Google Scholar] [CrossRef]
  41. Taylor, K.E. Summarizing multiple aspects of model performance in a single diagram. J. Geophys. Res. Atmos. 2001, 106, 7183–7192. [Google Scholar] [CrossRef]
  42. Lv, M.Q.; Chen, J.L.; Mirza, Z.A.; Chen, C.D.; Wen, Z.F.; Jiang, Y.; Ma, M.-H.; Wu, S.-J. Spatial distribution and temporal variation of reference evapotranspiration in the Three Gorges Reservoir area during 1960–2013. Int. J. Climatol. 2016, 36, 4497–4511. [Google Scholar] [CrossRef]
  43. Han, J.; Wang, J.; Zhao, Y.; Wang, Q.; Zhang, B.; Li, H.; Zhai, J. Spatio-temporal variation of potential evapotranspiration and climatic drivers in the Jing-Jin-Ji region, North China. Agric. For. Meteorol. 2018, 256, 75–83. [Google Scholar] [CrossRef]
  44. Fan, J.; Shao, M.; Wang, Q. Comparison of many equations for calculating reference evapotranspiration in the Loess Plateau of China. Trans. Chin. Soc. Agric. Eng. 2008, 24, 98–102. [Google Scholar]
  45. Priestley, C.H.B.; Taylor, R.J. On the assessment of surface heat flux and evaporation using large-scale parameters. Mon. Weather Rev. 1972, 100, 81–92. [Google Scholar] [CrossRef]
  46. Tongwane, M.I.; Savage, M.J.; Tsubo, M.; Moeletsi, M.E. Seasonal variation of reference evapotranspiration and Priestley-Taylor coefficient in the eastern Free State, South Africa. Agric. Water Manag. 2017, 187, 122–130. [Google Scholar] [CrossRef]
  47. Trajkovic, S.; Kolakovic, S. Evaluation of reference evapotranspiration equations under humid conditions. Water Resour. Manag. 2009, 23, 3057–3067. [Google Scholar] [CrossRef]
  48. Yonaba, R.; Tazen, F.; Cissé, M.; Mounirou, L.A.; Belemtougri, A.; Ouedraogo, V.A.; Koïta, M.; Niang, D.; Karambiri, H.; Yacouba, H. Trends, sensitivity and estimation of daily reference evapotranspiration ET0 using limited climate data: Regional focus on Burkina Faso in the West African Sahel. Theor. Appl. Climatol. 2023, 153, 947–974. [Google Scholar] [CrossRef]
  49. Li, S.; Kang, S.; Zhang, L.; Zhang, J.; Du, T.; Tong, L.; Ding, R. Evaluation of six potential evapotranspiration models for estimating crop potential and actual evapotranspiration in arid regions. J. Hydrol. 2016, 543, 450–461. [Google Scholar] [CrossRef]
  50. Ding, D.; Feng, H.; Zhao, Y.; Liu, W.; Chen, H.; He, J. Impact assessment of climate change and later-maturing cultivars on winter wheat growth and soil water deficit on the Loess Plateau of China. Clim. Change 2016, 138, 157–171. [Google Scholar] [CrossRef]
  51. Zhang, J.; Wang, L.; Cheng, G.; Jia, L. Characteristics of water supply and demand in an agroforestry ecosystem under long-term continuous cropping assessed using the RZWQM2 model. Agric. Water Manag. 2025, 307, 109245. [Google Scholar] [CrossRef]
Figure 1. Relationships for reference crop evapotranspiration (ETo), crop evapotranspiration under standard (ETc), and non-standard (ETc act) conditions [38].
Agronomy 15 01441 g001
Figure 2. Location of the study area.
Agronomy 15 01441 g002
Figure 3. Spatial distribution of soil water sampling points under wheat and maize fields.
Agronomy 15 01441 g003
Figure 4. The distribution of precipitation in Changwu station during the study period of 2012–2015.
Agronomy 15 01441 g004
Figure 5. Consistency between algorithms of ETo and FAO56-PM on a daily scale. Note: The black line in the figure is 1:1, and R2 is the determination coefficient of the fitting straight line.
Agronomy 15 01441 g005
Figure 6. The performance of calculation methods of ETo on a daily scale. Note: NSD is a statistical measure that indicates the degree of variability or dispersion of a dataset for each model in relation to the REF dataset. In this study, the standard deviation of the reference dataset (REF) is treated as 1.0, and in the Taylor plot, the standard deviation of all other models is expressed as a ratio relative to the reference dataset. The red lines represented the skill scores.
Agronomy 15 01441 g006
Figure 7. Comparison of consistency between algorithms of ETo and FAO56-PM in different seasons.
Agronomy 15 01441 g007
Figure 8. The performance of calculation methods on ETo in different seasons.
Agronomy 15 01441 g008
Figure 9. Interannual variation characteristics of ETc act in the growing season of maize and wheat in the Loess Plateau.
Agronomy 15 01441 g009
Figure 10. M-K statistic curve of ETc act for corn and wheat fields in Changwu Tableland.
Agronomy 15 01441 g010
Figure 11. Variation characteristics of ETc act for corn and wheat in Changwu Tableland based on wavelet analysis.
Agronomy 15 01441 g011
Figure 12. M-K statistic curve of precipitation and temperature for corn and wheat fields in Changwu Tableland.
Agronomy 15 01441 g012
Table 1. The meteorological conditions in the study area.
ItemsValueItemsValue
Mean precipitation584 mmAnnual accumulated temperature2994 °C
Maximum precipitation813 mmFrost-free period171 d
Minimum precipitation370 mmAnnual sunshine hours2230 h
Mean temperature9.1 °CSunshine rate51%
Maximum temperature36.9 °CAnnual radiation4837 kJ m−2
Minimum temperature−24.9 °CAnnual potential evapotranspiration1017 mm
Table 2. Taylor skill score (S) of each algorithm of ETo at each seasonal.
SeasonSringSummerAutumnWinter
S
Algorithms
ASCE-PM1.001.001.001.00
Pn0.980.990.990.97
KPn0.960.980.950.84
FP170.950.950.980.97
FAO24-Pn0.890.860.950.97
Prs–Tylr0.870.920.890.47
Makk0.860.900.890.68
FAO24-Rd0.850.880.860.81
Harg0.850.800.850.64
Table 3. Evapotranspiration characteristics of cropland (winter wheat and spring maize) in each phenology during the test period (2012–2015).
Crop SpeciesPhenologyETc act/mmIwc/mm d−1M/%ETo/mmKc act
Sowing–overwintering period189.87 ± 82.671.17 ± 0.3929.38 ± 18.07226.65 ± 20.820.84
Rejuvenation period15.69 ± 7.191.04 ± 0.744.00 ± 2.3341.39 ± 11.620.38
Rising period36.17 ± 15.781.74 ± 0.739.26 ± 5.4555.64 ± 13.920.65
WinterJointing stage47.51 ± 20.572.52 ± 0.8912.30 ± 7.7950.70 ± 17.170.94
wheatBooting stage42.53 ± 0.402.84 ± 0.0310.44 ± 1.9057.72 ± 2.480.74
Heading stage49.88 ± 16.473.61 ± 0.5012.71 ± 6.5659.41 ± 14.130.84
Grouting period46.87 ± 21.093.31 ± 1.0911.99 ± 7.0866.81 ± 14.130.7
Harvest period45.31 ± 61.102.24 ± 1.669.95 ± 13.3158.41 ± 61.940.78
Sowing10.2 ± 8.341.77 ± 1.292.89 ± 2.5822.65 ± 2.000.45
Seeding stage26.58 ± 4.131.06 ± 0.177.24 ± 1.9896.62 ± 10.390.28
Five leaf stage37.96 ± 12.651.43 ± 0.4410.45 ± 4.65115.25 ± 15.220.33
SpringJointing stage56.83 ± 32.422.30 ± 1.2614.81 ± 6.90107.85 ± 5.610.53
maizeTasseling stage19.73 ± 1.803.95 ± 0.365.35 ± 1.1323.90 ± 10.830.83
Silking152.01 ± 0.833.27 ± 0.0341.04 ± 5.18181.68 ± 23.810.84
Grouting period60.68 ± 45.782.67 ± 1.2815.63 ± 10.3848.76 ± 36.461.24
Harvest period9.31 ± 5.361.00 ± 0.642.60 ± 1.7515.09 ± 1.000.62
Disclaimer/Publisher’s Note: The statements, opinions and data contained in all publications are solely those of the individual author(s) and contributor(s) and not of MDPI and/or the editor(s). MDPI and/or the editor(s) disclaim responsibility for any injury to people or property resulting from any ideas, methods, instructions or products referred to in the content.

