1. Introduction
Soil media exhibit spatial variability and nonlinear characteristics, with their physical, chemical, and biological properties displaying significant stratification in the vertical direction [
1,
2,
3]. This layered structure not only influences plant root growth and nutrient absorption but also directly affects the performance of agricultural machinery [
4]. Traditional soil modeling approaches often treat soil as a homogeneous body, neglecting its stratified nature, which leads to significant discrepancies between simulation results and actual conditions. Therefore, developing precise modeling methods based on soil stratification characteristics is crucial for optimizing agricultural machinery design and improving soil management practices.
In recent years, the application of the Discrete Element Method (DEM) in soil dynamics, utilizing three-dimensional sphere adhesive particle models and wet particle models that consider soil moisture content, has advanced the microscopic mechanism analysis of soil dynamics. This approach has facilitated innovation in soil tillage component design, leading to widespread application of DEM simulations in soil mechanics research [
5,
6,
7]. Numerous scholars have employed the DEM to develop agricultural machinery for deep loosening and seeding, as well as to conduct soil mechanics studies. For instance, Zhao et al. optimized the design of a novel bionic shovel through DEM simulation of the deep loosening process [
8]. Zou et al. used the DEM to simulate the entire movement process of the Jiwei Mountain landslide–debris flow, investigating the dynamic characteristics of rock landslides and debris flows [
9]. Jia et al. used the DEM to explore the influences of shear direction and geogrid anisotropy on the shear strength behavior of geogrid–soil interfaces [
10]. However, the accuracy of DEM models largely depends on the precision of input parameters. Significant differences exist in the microscopic parameters of various soil forms, which substantially impact the prediction of agricultural machinery performance [
11,
12,
13]. Consequently, accurately calibrating discrete element parameters for soil at different layers has become a critical issue in improving the simulation accuracy of soil–machinery interactions.
The traditional Hertz–Mindlin contact model has limitations when simulating the behavior of cohesive soils. Soil particles are subject to complex interactions due to moisture and chemical substances, making it challenging for simple contact models to accurately simulate the mechanical properties of soils commonly encountered in agricultural production [
14,
15]. Relevant studies have shown that incorporating the Johnson–Kendall–Roberts (JKR) theory into the traditional Hertz–Mindlin model can better describe the adhesion forces between particles. In conducting angle of repose experiments, precise calibration of JKR model parameters is crucial for accurately simulating the accumulation behavior of soil particles [
16]. To more accurately simulate soil cohesion and shear strength, researchers typically employ the Hertz–Mindlin model with Bonding contact parameters [
17]. This model introduces bonding interactions between particles, enabling a better description of soil mechanical behavior under various conditions. However, due to the complexity of soil states, simulating soil behavior characteristics with a single model is relatively limited, providing insufficient support for subsequent numerical simulations of soil behavior under complex working conditions.
In summary, understanding the soil mechanical properties of different soil layers and improving the precision of soil–machine interaction simulations are crucial for the design innovation of soil tillage components and for sustainable agriculture. Existing research has predominantly focused on discrete element modeling of soil–implement interactions, but efficient parameter acquisition methods for soil stratification are lacking. Current methods for stratified calibration rely heavily on extensive physical and simulation experiments, which are both time-consuming and computationally expensive. Therefore, there is a pressing need for a universal model that can accurately and quickly acquire the physical characteristics of soils at different depths. This study assumes that within the working depth range of agricultural machinery, soil particle distribution is relatively uniform, but the physical properties of the soil vary. Based on this assumption, a new soil calibration model is proposed to rapidly obtain discrete element model parameters for soils at different depths. The repose angle test and direct shear test were used to calibrate the parameters for the Hertz–Mindlin model with JKR V2 and the Hertz–Mindlin model with Bonding V2, respectively. Based on this, a discrete element soil tank model was developed, and calibration experiments were conducted for different soil layers using soil particles that follow a normal distribution. By comparing the simulation results with the physical test results and discussing the differences between this study and traditional calibration models, the accuracy and applicability of the new model are evaluated. This study aims to establish a more universal soil calibration model to quickly acquire calibration parameters for soils at different depths, providing a reliable parametric foundation for numerical simulations of agricultural machinery–soil interactions.
2. Materials and Methods
2.1. Basic Parameter Testing
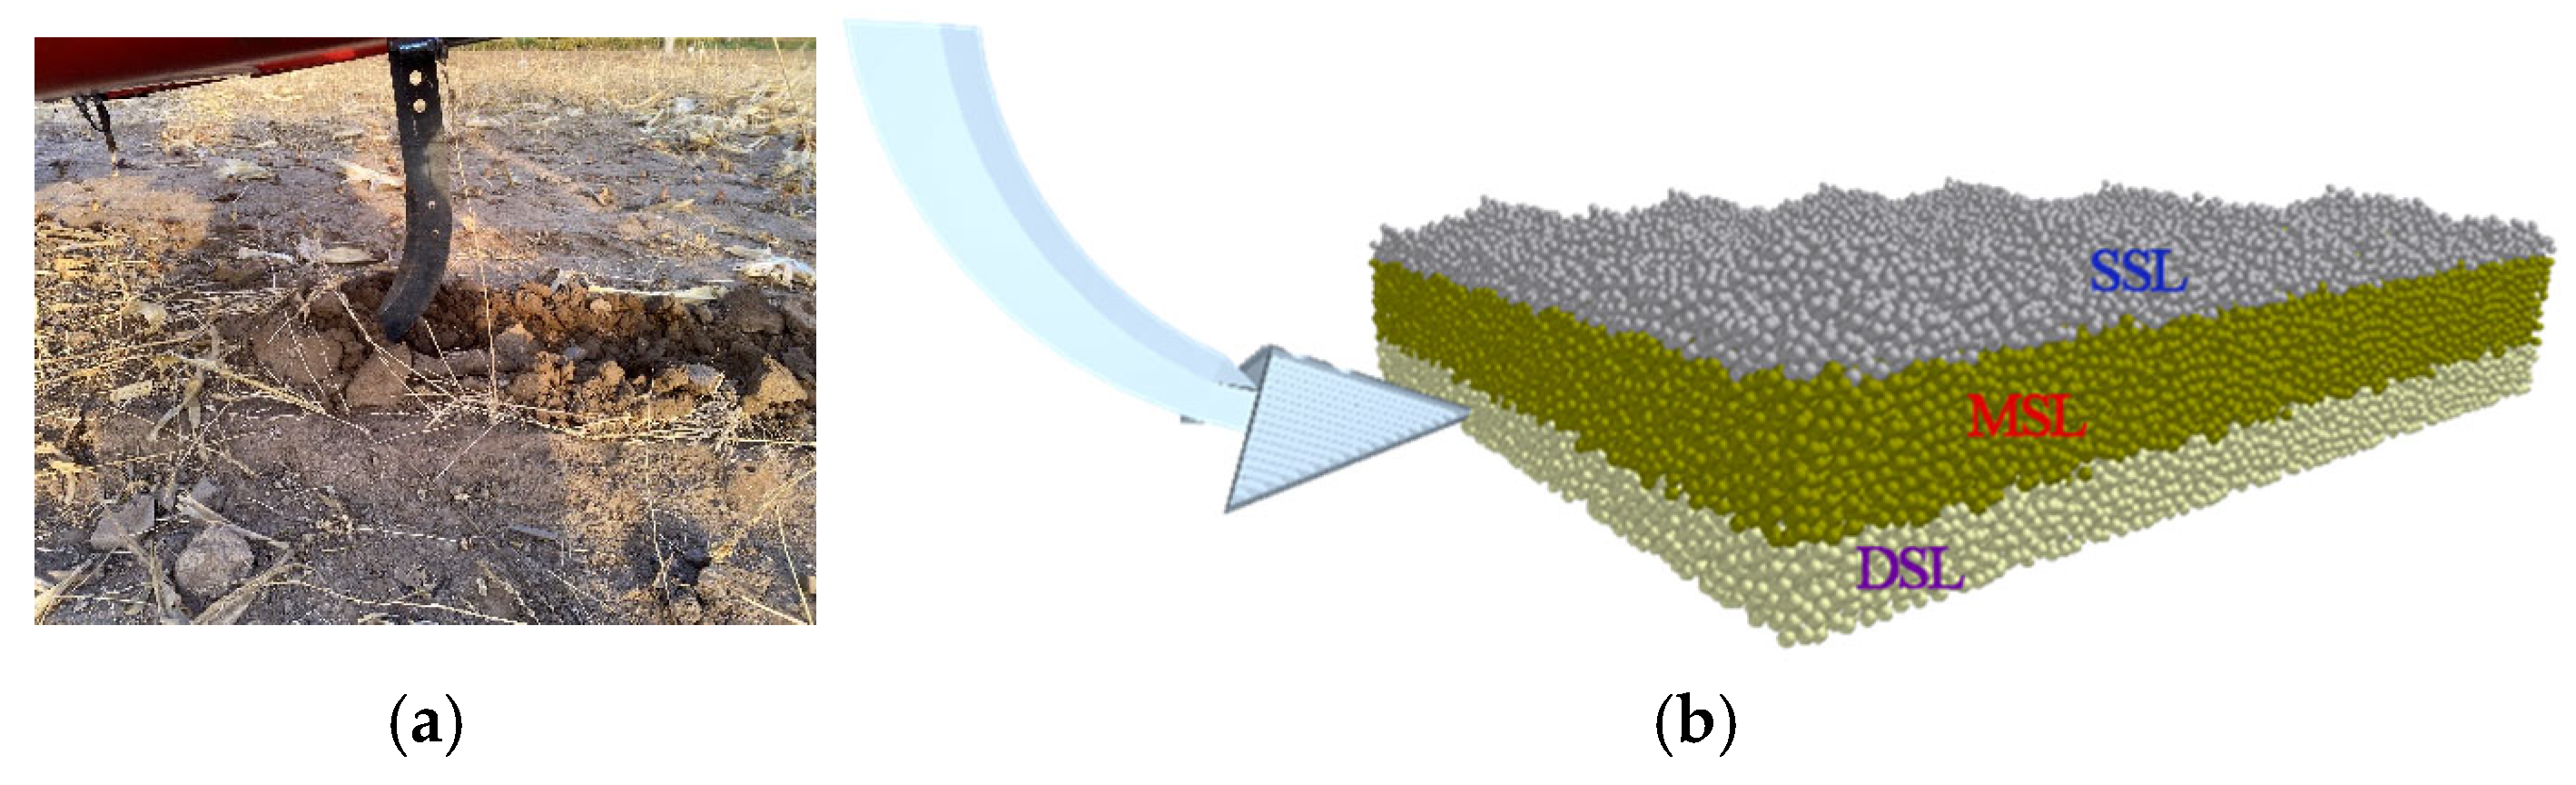
In numerical simulation studies of soil–agricultural machinery interactions, researchers often divide the soil profile into multiple layers to enhance simulation accuracy. This study’s sampling site is located in the experimental field of Inner Mongolia Agricultural University, Inner Mongolia Autonomous Region, as shown in
Figure 1. The geographical coordinates are 40°81′ N, 111°73′ E. The area has a temperate continental monsoon climate with an average annual temperature of 5–7 °C and annual precipitation of 300–400 mm, primarily concentrated between June and August. The region experiences significant inter-annual variation in precipitation and is characterized as a typical cold and arid zone. The soil texture in the experimental area is sandy loam, classified as chestnut soil. Based on the region’s soil characteristics, stratified soil sampling was conducted. The soil profile was divided into three layers: surface soil layer (SSL, 0–6 cm), middle soil layer (MSL, 6–15 cm), and deep soil layer (DSL, 15–21 cm).
Following the stratified sampling of these three soil layers, basic physical property tests were conducted as illustrated in
Figure 2. Soil moisture content was determined using the oven-drying method with a 101-type electric heating constant-temperature drying oven (Zhejiang Shangcheng Instrument Co., Ltd., Shaoxing, China); soil density was measured using a density meter (Daho Meter, Shenzhen, China); and particle size analysis was performed using a BT-2001 laser particle size analyzer (Bettersize Instruments Ltd., Dandong, China), equipped with a BT-901 dispersion system.
The soil moisture content and density for different soil layers are presented in
Figure 2d, while the particle size distribution is shown in
Figure 2e. The experimental results show that the average moisture content for the SSL, MSL, and DSL are 6.43%, 12.19%, and 11.28%, respectively, while the average density values are 1.83 g·cm
−3, 1.74 g·cm
−3, and 1.86 g·cm
−3, respectively. The soil density varied minimally across different soil depths. However, moisture content exhibited notable differences, with the SSL showing greater variability in moisture content data and significantly lower values compared to the MSL and DSL. The particle size distribution patterns for different soil layers at varying depths are similar, with the particle size distribution following a normal distribution. The peak is centered around 0.25 mm, indicating that the majority of particles are concentrated near this particle size. To improve numerical simulation efficiency, soil particles were generated in the simulation according to a normal distribution with a mean diameter of 2.5 mm [
18]; physical tests showed that the densities of the different soil layers are similar, and therefore, a uniform density of 1.81 g·cm⁻
3 was adopted. [
18].
2.2. Determination of Contact Models
Considering the soil cohesion characteristics and mechanical properties during the tillage process, the Hertz–Mindlin model with JKR V2 and the Hertz–Mindlin model with Bonding V2 were selected as the contact models for soil particles in the EDEM numerical simulation.
When soil particles are in motion, they come into contact with each other. During this contact process, the particle surfaces gradually deform, generating contact forces (
Figure 3). These contact forces can be accurately expressed using the Hertz–Mindlin model with JKR V2 [
19,
20]. To account for the presence of negative overlap in the study, the particle contact radius
R must satisfy Equation (1):
where
r is the physical particle radius, mm; α
f is the relative approach where the contact breaks, mm. In Equation (1), the pull-off force
fc and α
f are as follows:
where
R* is the equivalent radius of particles, mm;
E* is the equivalent elastic modulus, MPa;
γ is the surface energy of particles, J.
The Hertz–Mindlin model with Bonding V2 can accurately express the mechanical characteristics of soil [
21,
22]. After bonding, the forces (
Fn,t)/torques (
Tn,t) on the particles are set to zero and are adjusted incrementally every time step as follows:
where:
where
δFn,
δFt,
δMn, and
δMt are the increments in the normal force
Fn, tangential force
Ft, normal torque
Mn, and tangential torque
Mt of the bonds, respectively.
Rb is the radius of the bonds;
Sn and
St are the normal and shear stiffness, respectively;
δt is the time step, which is set to 15% of the characteristic time step in the simulation;
vn and
vt are the normal and tangential velocities of the particles;
ωn and
ωt are the normal and tangential angular velocities.
A is the contact area between the particles.
J denotes the polar area moment of inertia of the bonds.
Each bond is broken when the normal and tangential shear stresses exceed some predefined value:
where
σmax and
τmax are the normal and tangential shear stresses.
2.3. Calibration of Stratified Soil Parameters
2.3.1. Soil Angle of Repose Calibration Test
The angle of repose (θ) for different soil layers was determined using the bucket lifting method with a universal testing machine. To mitigate the impact of experimental errors, the test was repeated multiple times, and the results were photographed. The soil profiles were extracted and linearly fitted using MATLAB (2020) to calculate the angle of repose for different soil layers. The angles of repose for the upper, middle, and lower soil layers are 28.34°, 26.85°, and 24.56°, respectively.
The calibration process for the angle of repose test involved the following steps [
12,
23]: Using the Plackett–Burman experimental design to screen for parameters that significantly influence the angle of repose. Determining the optimal level values using the path of steepest ascent method. Developing a second-order regression model between significant parameters and the angle of repose using response surface methodology. Optimizing the experimental results [
23]. To enhance calibration efficiency for soil parameters at different depths, the angles of repose for the SSL, MSL, and DSL were input into the model to solve for discrete element parameters at different soil depths. The factor levels for the Plackett–Burman experiment for soil angle of repose were determined through a literature review, as shown in
Table 1.
X1 to
X7 are the parameters to be calibrated, while
X8 to
X11 are virtual items used for error analysis.
The analysis of the degree of influence of each parameter on the angle of repose shows that the parameters which have a significant effect on the angle of repose are X3, X5, and X7. The value ranges for these three significant parameters were determined using the path of steepest ascent method, and these ranges were used to conduct response surface experiments.
2.3.2. Soil Direct Shear Calibration Test
The Hertz–Mindlin model with Bonding V2 for soil was calibrated using direct shear tests.
Figure 4 illustrates the physical experiment and numerical simulation process of the soil direct shear test. The shear strength (
M) under a 100 kPa load for the SSL, MSL, and DSL was used as the response value, with the maximum shear stress during the shearing process considered the shear strength. In the physical experiments, the shear strengths (
M1,
M2,
M3) for the three soil layers were 63.33 kPa, 65.91 kPa, and 73.05 kPa, respectively. The experimental factors were normal stiffness per unit area, shear stiffness per unit area, normal strength, and shear strength. The factor levels for the response surface experiment of soil direct shear were determined through a literature review, as shown in
Table 2.
2.4. Soil Excavation Verification Experiment
To evaluate whether the obtained stratified soil simulation parameters accurately reflect the actual soil characteristics during operation, this study combines field experiments and DEM simulations to verify the accuracy of the calibrated parameters (
Figure 5). During the trenching process, the soil undergoes shearing and compression, accumulating into ridges on both sides of the trench. Different soil properties result in varying accumulation effects. Therefore, the trench width, ridge height, and the resistance encountered by the trencher during excavation were selected as evaluation criteria. The measured values were compared with the simulated results, and the accuracy of the calibrated discrete element parameters was assessed based on the error values between the two.
The primary equipment used in the field experiment included a Dongfanghong MK704 tractor, a trenching shovel, a field telemetry instrument, a ruler, a tape measure, and a stopwatch. The field experiment was conducted at the experimental field of Inner Mongolia Agricultural University, as shown in
Figure 1. The 50 m test area was divided into a 10 m acceleration zone, a 10 m deceleration zone, and a 30 m data collection zone, with an operational speed of 5 km/h in the data collection area. The width of the trenching tool is 245 mm, and the trenching depth is 180 mm. A load sensor in the telemetry instrument was used to measure the working resistance of the trenching device, and the real-time force data were transmitted to a computer for storage. The average force values within the data collection zone were taken as the final results. After trenching, five random measurement points were selected within the data collection zone to measure ridge height, and the average value was recorded as the final result.
EDEM (2022.3) software was used to simulate the trenching process, with soil simulation parameters set according to the calibration experiment results. A soil tank model was created using the Geometries module of EDEM. During the simulation, the dimensions of the trenching tool, trenching depth, operation speed, and other parameters should be identical to those used in the field experiment. The soil tank model was created using the Geometries module in EDEM, and the simulation model of the trenching device was identical to that used in the physical experiment. The simulation time step was set to 3 × 10⁻⁶ s, the Rayleigh time step was 15%, and the total simulation time was 10 s.
3. Results
3.1. Soil Angle of Repose Test Results
The results of the Plackett–Burman experiment for soil angle of repose are presented in
Table 3.
Figure 6 illustrates the degree of influence that each parameter has on the angle of repose based on these results. The parameters
X3,
X5, and
X7 were identified as having significant influence on the angle of repose.
Table 4 shows the results of the path of steepest ascent method, which determined the value ranges for the three significant parameters:
X3 (0.16–0.2),
X5 (0.32–0.4), and
X7 (6.8–10). The response surface experiment results using these three factors are presented in
Table 5.
Multiple regression fitting of the experimental results using Design-Expert yielded the following second-order regression equation for the simulated angle of repose (
θ):
The angles of repose θ1, θ2, and θ3 for the SSL, MSL, and DSL were, respectively, substituted into Equation (12) to solve for the discrete element parameter combinations at different soil depths. The results were as follows: coefficient of rolling friction (soil to soil): 0.2, 0.198, and 0.184; coefficient of static friction (soil to steel): 0.396, 0.385, and 0.366; surface energy coefficients: 9.981, 7.078, and 8.489 J·m−2. Validation experiments using these parameters show errors below 10% for the SSL, MSL, and DSL, indicating that the calibration test results are relatively accurate and suitable for subsequent numerical model experiments.
The research results show that the moisture content in the surface layer is significantly lower than in the middle and deep layers, with greater variability. The high variability in moisture content in the surface soil layer is due to its greater susceptibility to evaporation and climate changes, leading to larger fluctuations in moisture content. This characteristic results in differences in soil properties at different layers, which has implications for agricultural machinery design, suggesting the need to consider the vertical distribution of soil moisture content. In the angle of repose calibration test, three parameters were identified as having a significant influence on the soil angle of repose. Among these, the friction coefficient and surface energy coefficients showed a strong correlation with soil moisture content, which aligns with findings from previous studies [
24,
25].
3.2. Soil Direct Shear Test Results
The results of the soil direct shear tests are presented in
Table 6. Analysis of the experimental results reveals that
X12 and
X14 have extremely significant effects on shear strength;
X13 has a significant effect on shear strength, while
X15 does not significantly affect shear strength. The regression model fitted to the experimental results shows
p < 0.0001, with the lack of fit term
p > 0.05, indicating that the model fits well with no lack of fit occurring. The coefficient of determination for the regression equation is
R2 = 0.9041, which is very close to 1, suggesting that the regression model is highly significant and can reliably and accurately reflect the true situation. Therefore, it can be used for further predictive analysis of shear strength targets.
Multiple regression fitting of the experimental results using Design-Expert yielded the following second-order regression equation for the simulated shear strength (
M):
The shear strengths
M1,
M2, and
M3 for the SSL, MSL, and DSL were, respectively, substituted into Equation (13) to solve for the discrete element parameter combinations at different soil depths. The results were as follows: normal stiffness per unit area: 1.703 × 10
8, 5.76 × 10
8, and 7.731 × 10
8 N·m
−3; shear stiffness per unit area: 4.724 × 10
8, 5.223 × 10
8, and 2.403 × 10
8 N·m
−3; normal strength: 4.893 × 10
7, 4.373 × 10
7, and 1.468 × 10
7 Pa; shear strength: 1.484 × 10
7, 1.736 × 10
7, and 6.601 × 10
7 Pa. Validation experiments using these parameters showed errors of 1.38%, 2.53%, and 2.84% for the SSL, MSL, and DSL, respectively, indicating that the calibration test results were accurate and suitable for subsequent numerical model experiments. By integrating the results of the soil angle of repose test and direct shear test calibration, the specific parameters for the stratified soil discrete element model are obtained, as shown in
Table 7.
The direct shear test results indicate that normal stiffness per unit area, shear stiffness per unit area, and normal strength significantly influence shear strength, while shear strength does not significantly affect the test results. This partially aligns with the findings by Han et al., although they found that shear strength also had some influence [
26]. This discrepancy may be due to differences in soil types and experimental conditions. Through parameter calibration and validation tests, we successfully and rapidly obtained discrete element parameter combinations for the three soil layers, with validation errors all within 10%. Notably, the Hertz–Mindlin model with JKR V2 effectively simulated the partial flow behavior characteristics of soil, while the Hertz–Mindlin model with Bonding V2 simulated soil cohesion behavior characteristics. These findings echo previous research [
19,
27]. This study further confirms the applicability and superiority of these two models in agricultural soil simulation, with their combined use resulting in higher simulation accuracy. This improved model precision provides a more reliable foundation for numerical simulations of agricultural machinery–soil interactions.
3.3. Verification Experiment
Figure 7 presents a comparison of the field test and simulation results based on three key indicators: the resistance experienced by the trencher, the trench width, and the ridge height. The resistance recorded in the field test was 1526.94 N, while the simulated resistance was 1639.12 N, with a relative error of 6.84%. For the ridge height after trenching, the field measurement was 52.8 mm, with a relative error of 3.04% compared to the simulation results. The measured trench width in the field test was 249.6 mm, with a relative error of 2.76% compared to the simulated results. The verification results demonstrate strong consistency between the field test and numerical simulation, with relative errors for all three evaluation criteria remaining below 10%, and a particularly high correlation with trench width. The deviation in force measurements is slightly larger, which may be attributed to the complex interactions between soil and the trenching tool, as well as variations in field conditions that are difficult to fully capture in the simulation. However, these results confirm that the calibrated discrete element parameters effectively represent the mechanical behavior of stratified soil in agricultural operations.
The minimal errors in trench width and ridge height between the simulation and field test results indicate that the calibrated parameters accurately capture soil flow and accumulation behavior. The simulation results further demonstrate that the model effectively represents soil cohesion and internal friction characteristics. Compared to geometric parameters, the resistance error between the simulated and field tests is relatively large, reflecting the complex dynamic interactions between soil and machinery in real farmland environments. The strong agreement between the simulation and field test results validates the effectiveness of the parameter calibration method developed in this study.
4. Discussion
This study successfully provides a more precise parametric foundation for the numerical simulation of agricultural machinery–soil interactions using stratified soil sampling and accurate calibration of discrete element parameters. The key soil parameters were obtained through various tests on the SSL, MSL, and DSL. The results of the validation experiments show that the errors of all calibrated parameters are below 10%, verifying the high accuracy of the model.
Compared to previous studies, this study proposes a refined simulation method based on soil stratification characteristics. Zhao et al. pointed out that considering the impact of soil layer variations on agricultural machinery performance is key to improving simulation accuracy [
28,
29,
30]. However, many existing studies mainly focus on parameter calibration for a single soil layer. This study, for the first time, combines the Hertz–Mindlin model with JKR V2 and the Hertz–Mindlin model with Bonding V2, which can more accurately simulate the adhesion and interactions between soil particles in different soil layers. The Hertz–Mindlin model with JKR V2 demonstrates significant advantages in simulating soil adhesion and flow behavior. By introducing surface energy parameters, this model can more accurately describe the adhesion effects between soil particles. The experimental results show that the model exhibits noticeable differences when simulating behaviors at the SSL and DSL. Due to the significant differences in moisture content between the SSL and DSL, the adhesion between particles also varies, and the JKR model can address the issue of different soil moisture contents. The Hertz–Mindlin model with Bonding V2 excels in simulating the mechanical properties and shear behavior of soil. By introducing normal and tangential bonding strength parameters, this model better describes the structural connections between soil particles. This feature gives the model an advantage in simulating soil deformation behavior and strength characteristics, allowing it to capture the complex behavior of soil at different depths. Through the stratified calibration of soil parameters, this study achieved an excavation resistance error of only 6.84%, with errors of 2.76% and 3.04% in predicting trench width and ridge height, respectively. These results significantly outperform the findings of Zeng et al., who based their study on a single-layer soil–implement interaction model [
31].
Although this study has made significant progress in calibrating discrete element models, it still has some limitations. The research is only calibrated for a specific soil type from the Inner Mongolia region, and the applicability to other regions or soil types still needs further verification. Additionally, the model assumes that the physical properties of the soil layers remain relatively stable during the simulation process, but in practical operations, the soil’s physical properties may fluctuate due to mechanical intervention or climate change. Future research can expand the calibration scope of soil parameters, especially focusing on studies for the adaptability of different soil types. By collecting more soil data from various regions, the model’s general applicability can be validated, thereby improving its versatility and reliability. Through the integration of multi-scale numerical simulations and experimental data, future studies can explore the nonlinear interaction effects between soil and machinery, aiming for more precise predictions and optimizations.
5. Conclusions
This study proposes a rapid method for obtaining discrete element model parameters for soils at different depths, based on stratified soil sampling, to improve the accuracy of agricultural machinery–soil interaction simultions. Three soil samples of sandy loam from Inner Mongolia were collected from three layers, the surface soil layer (0–6 cm), middle soil layer (6–15 cm), and deep soil layer (15–21 cm), and their basic physical properties were tested. The physical properties such as soil moisture, density, and particle distribution demonstrated the coexistence of differences and commonalities across soil layers, with significant fluctuations in the moisture content of the surface soil layer. Through Plackett–Burman and response surface experiments, significant parameter combinations affecting the angle of repose for the surface, middle, and deep soil layers were determined as follows: coefficient of rolling friction (soil to soil) values of 0.2, 0.198, and 0.184; coefficient of static friction (soil to steel) values of 0.396, 0.385, and 0.366; surface energy coefficients of 9.981, 7.078, and 8.489 J·m−2. Key factors influencing the shear strength of different soil layers were identified through response surface experiments, and the normal stiffness per unit area, shear stiffness per unit area, normal strength, and shear strength for each soil layer were determined. The validation experiments using these calibrated parameters showed errors of 1.38%, 2.53%, and 2.84% for the surface, middle, and deep soil layers, respectively, all of which were below 10%, indicating that the calibration results are reliable. The results of this study show that the combination of the JKR and Bonding models can more accurately simulate the adhesive and shear behaviors between soil particles. The soil excavation verification experiments demonstrated that the model can accurately simulate changes in soil geometric parameters and soil–machine interaction capabilities. This study successfully validated the efficiency and accuracy of the proposed method for simulating agricultural machinery–soil interactions, providing a more precise parametric foundation for agricultural machinery design and soil management.
Author Contributions
B.H.: investigation, validation, writing—original draft preparation; X.M.: software, formal analysis, writing—review and editing; X.T.: methodology, funding acquisition; L.W.: supervision, funding acquisition. All authors have read and agreed to the published version of the manuscript.
Funding
This research was funded by the Natural Science Foundation of Inner Mongolia Autonomous Region (2025QN04003 and 2023LHMS04010), the National Natural Science Foundation of China (No. 42367046 and 32160279), the Science and Technology Major Project of Inner Mongolia (No. 2022YFHH0017), the Special Research Projects for First-Class Disciplines [YLXKZX-NND-034], the Scientific Research Projects of Higher Education Institutions in Inner Mongolia Autonomous Region [NJZZ23032], and the Ordos Science and Technology Plan (No. 2022EEDSKJZDZX010, 2022EEDSKJXM005).
Data Availability Statement
Data is contained within the article.
Conflicts of Interest
The authors declare no conflicts of interest.
References
- Ruma, F.Y.; Munnaf, M.A.; De Neve, S.; Mouazen, A.M. Visible-to-near-infrared spectroscopy for prediction of soil nitrogen mineralization after sample stratification by textural homogeneity criteria. Soil Tillage Res. 2024, 244, 106250. [Google Scholar] [CrossRef]
- Shin, Y.; Mohanty, B.P.; Ines, A.V.M. Development of non-parametric evolutionary algorithm for predicting soil moisture dynamics. J. Hydrol. 2018, 564, 208–221. [Google Scholar] [CrossRef]
- Li, C.; Yin, H.; Wu, C.; Zhang, Y.; Zhang, J.; Wu, Z.; Wang, W.; Jia, D.; Guan, S.; Ren, R. Calibration of the Discrete Element Method and Modeling of Shortening Experiments. Front. Earth Sci. 2021, 9, 636512. [Google Scholar] [CrossRef]
- Ng, C.W.W.; Wong, A.Y.Y.; Buenaventura, A.D.F.; Zhu, P.Y. Three-dimensional numerical analysis of twin tunnelling in two-layered soil strata. Tunn. Undergr. Space Technol. 2024, 153, 106028. [Google Scholar] [CrossRef]
- Listauskas, J.; Jankauskas, V.; Žunda, A.; Katinas, E.; Gargasas, J. Estimation and modelling the wear resistance of plough points and knife coulters by discrete element method. Wear 2024, 556–557, 205508. [Google Scholar] [CrossRef]
- Wang, T.; Tang, C.-S.; Liu, W.-J.; Cheng, Q.; Shen, Z.-T.; Pan, X.-H. Insight into the initiation and propagation mechanism of desiccation cracking in clayey soil from DEM simulations. Comput. Geotech. 2024, 175, 106694. [Google Scholar] [CrossRef]
- Zhang, S.; Yuan, H.; Cao, Q.; Zhang, Y.; Fu, J.; Wen, X. Numerical simulation of improving the dispersion and migration characteristics of tiger nut tuber-soil mixture with a novel variable-amplitude flexible screen. Comput. Electron. Agric. 2024, 225, 109291. [Google Scholar] [CrossRef]
- Zhao, J.; Lu, Y.; Wang, X.; Zhuang, J.; Han, Z. A bionic profiling-energy storage device based on MBD-DEM coupled simulation optimization reducing the energy consumption of deep loosening. Soil Tillage Res. 2023, 234, 105824. [Google Scholar] [CrossRef]
- Zou, Z.; Tang, H.; Xiong, C.; Su, A.; Criss, R.E. Kinetic characteristics of debris flows as exemplified by field investigations and discrete element simulation of the catastrophic Jiweishan rockslide, China. Geomorphology 2017, 295, 1–15. [Google Scholar] [CrossRef]
- Jia, Y.; Zhang, J.; Chen, X.; Miao, C.; Zheng, Y. DEM study on shear behavior of geogrid-soil interfaces subjected to shear in different directions. Comput. Geotech. 2023, 156, 105302. [Google Scholar] [CrossRef]
- Wu, P.; Chen, Y. Discrete element modelling of the effect of disc angle and tilt angle on residue incorporation resulting from a concave disc. Comput. Electron. Agric. 2024, 224, 109222. [Google Scholar] [CrossRef]
- Ma, X.; Guo, M.; Tong, X.; Hou, Z.; Liu, H.; Ren, H. Calibration of Small-Grain Seed Parameters Based on a BP Neural Network: A Case Study with Red Clover Seeds. Agronomy 2023, 13, 2670. [Google Scholar] [CrossRef]
- Yousefi, S. Input Parameters in Discrete Element Modeling. Ph.D. Thesis, the University of New Mexico, Albuquerque, NM, USA, 2016. [Google Scholar]
- Mudarisov, S.; Lobachevsky, Y.; Farkhutdinov, I.; Khasanov, E.; Rakhimov, I. Justification of the soil dem-model parameters for predicting the plow body resistance forces during plowing. J. Terramech. 2023, 109, 37–44. [Google Scholar] [CrossRef]
- Coetzee, C.J. Particle upscaling: Calibration and validation of the discrete element method. Powder Technol. 2019, 344, 487–503. [Google Scholar] [CrossRef]
- Ma, X.; Liu, M.; Hou, Z.; Gao, X.; Bai, Y.; Guo, M. Numerical simulation and experimental study of pelletized coating of small grain forage seeds. Trans. Chin. Soc. Agric. Eng. 2023, 39, 43–52. [Google Scholar]
- Ahmad, F.; Qiu, B.; Ding, Q.; Ding, W.; Khan, Z.M.; Shoaib, M.; Chandio, F.A.; Rehim, A.; Khaliq, A. Discrete element method simulation of disc type furrow openers in Paddy soil. Int. J. Agric. Biol. Eng. 2020, 13, 103–110. [Google Scholar] [CrossRef]
- Zeng, B.; Li, M.; Yao, L.; Zhao, S.; Chen, X.; Wang, Y.; Liu, F.; Xie, S. Simulation and Experiment on the Mechanical Properties of Coptis Chinensis Root-Soil Composites Based on Image Reconstruction. Trans. Chin. Soc. Agric. Eng. 2023, 39, 75–84. [Google Scholar]
- Yang, L.; Li, J.; Lai, Q.; Zhao, L.; Li, J.; Zeng, R.; Zhang, Z. Discrete element contact model and parameter calibration for clayey soil particles in the Southwest hill and mountain region. J. Terramech. 2024, 111, 73–87. [Google Scholar] [CrossRef]
- Ma, G.; Sun, Z.; Ma, H.Y.; Li, P. Calibration of Contact Parameters for Moist Bulk of Shotcrete Based on EDEM. Adv. Mater. Sci. Eng. 2022, 2022, 6072303. [Google Scholar] [CrossRef]
- Li, X.; Luo, Z.; Hao, Z.; Zheng, E.; Yao, H.; Zhu, Y.; Wang, X. Investigation on tillage resistance and soil disturbance in wet adhesive soil using discrete element method with three-layer soil-plough coupling model. Powder Technol. 2024, 436, 119463. [Google Scholar] [CrossRef]
- Zhang, L.; Zhai, Y.; Chen, J.; Zhang, Z.; Huang, S. Optimization design and performance study of a subsoiler underlying the tea garden subsoiling mechanism based on bionics and EDEM. Soil Tillage Res. 2022, 220, 105375. [Google Scholar] [CrossRef]
- Zhang, S.; Zhao, H.; Wang, X.; Dong, J.; Zhao, P.; Yang, F.; Chen, X.; Liu, F.; Huang, Y. Discrete element modeling and shear properties of the maize stubble-soil complex. Comput. Electron. Agric. 2023, 204, 107519. [Google Scholar] [CrossRef]
- Zhou, H.; Zhou, T.; Wang, X.; Hu, L.; Wang, S.; Luo, X.; Ji, J. Determination of Discrete Element Modelling Parameters of a Paddy Soil with a High Moisture Content (>40%). Agriculture 2022, 12, 2000. [Google Scholar] [CrossRef]
- Bai, J.; Xie, B.; Yan, J.; Zheng, Y.; Liu, N.; Zhang, Q. Moisture content characterization method of wet particles of brown rice based on discrete element simulation. Powder Technol. 2023, 428, 118775. [Google Scholar] [CrossRef]
- Han, D.; Zhou, Y.; Nie, J.; Li, Q.; Chen, L.; Chen, Q.; Zhang, L. DEM model acquisition of the corn ear with bonded particle model and its simulated parameters calibration. Granul. Matter. 2024, 26, 54. [Google Scholar] [CrossRef]
- Wu, T.; Huang, W.; Chen, X.; Ma, X.; Han, Z.; Pan, T. Calibration of discrete element model parameters for cohesive soil considering the cohesion between particles. J. South China Agric. Univ. 2017, 38, 93–98. [Google Scholar]
- Zhao, Y.; Teng, C. Classification of Soil Layers in Deep Cement Mixing Using Optimized Random Forest Integrated with AB-SMOTE for Imbalance Data. Comput. Geotech. 2025, 179, 106976. [Google Scholar] [CrossRef]
- Ma, X.; Yu, Z.; Liu, M.; Wang, J.; Su, Q.; Zhang, J.; Xie, J.; Wang, T. Mechanical Properties and Critical State Characteristics of Maize Root-Soil Composites at Different Soil Depths. Biosyst. Eng. 2025, 250, 163–173. [Google Scholar] [CrossRef]
- Zhao, Y.; Lu, Z.; Liu, J.; Tang, C.; Tabaroei, A.; Zhang, R.; Feng, Y.; Yao, H. A Novel Approach to Water-Salt Migration Preven-tion: Foamed Lightweight Soil Barrier Layer Technology. Cold Reg. Sci. Technol. 2025, 236, 104514. [Google Scholar] [CrossRef]
- Zeng, Z.; Chen, Y.; Zhang, X. Modelling the Interaction of a Deep Tillage Tool with Heterogeneous Soil. Comput. Electron. Agric. 2017, 143, 130–138. [Google Scholar] [CrossRef]
| Disclaimer/Publisher’s Note: The statements, opinions and data contained in all publications are solely those of the individual author(s) and contributor(s) and not of MDPI and/or the editor(s). MDPI and/or the editor(s) disclaim responsibility for any injury to people or property resulting from any ideas, methods, instructions or products referred to in the content. |
© 2025 by the authors. Licensee MDPI, Basel, Switzerland. This article is an open access article distributed under the terms and conditions of the Creative Commons Attribution (CC BY) license (https://creativecommons.org/licenses/by/4.0/).


