Article

Evaluation of Hybrid Sorghum Parents for Morphological, Physiological and Agronomic Traits Under Post-Flowering Drought

1
International Crops Research Institute for the Semi-Arid Tropics (ICRISAT), Bamako BP 320, Mali
2
Département de Biologie, Ecole Doctorale des Sciences et Technologies du Mali (EDSTM), Faculté des Sciences et Techniques (FST), Université des Sciences, des Techniques et des Technologies de Bamako (USTTB), Bamako BP E3206, Mali
3
International Maize and Wheat Improvement Center (CIMMYT), Thiès BP 3320, Senegal
4
International Crops Research Institute for the Semi-Arid Tropics (ICRISAT), Sahelian Center, Niamey BP 12404, Niger
5
Leibniz-Centre for Agricultural Landscape Research (ZALF) e.V., Eberswalder Str. 84, 15374 Müncheberg, Germany
6
Laboratoire Ecologie et Gestion de la Biodiversité Sahélo-Saharienne (EGB2S), Université André Salifou de Zinder, Zinder BP 656, Niger
7
Donald Danforth Plant Science Center, Saint Louis, MO 63132, USA
*
Authors to whom correspondence should be addressed.
Agronomy 2025, 15(6), 1399; https://doi.org/10.3390/agronomy15061399
Submission received: 25 March 2025 / Revised: 17 April 2025 / Accepted: 19 April 2025 / Published: 6 June 2025

Abstract

:
Sorghum (Sorghum bicolor, (L.) Moench.), is one of the most important cereals in semi-arid and subtropical regions of Africa. However, in these regions, sorghum cultivation is often faced with several constraints. In Mali, terminal or post-flowering drought, caused by the early cessation of rains towards the end of the rainy season, is one of the most common constraints. Sorghum is generally adapted to harsh conditions. However, drought combined to heat reduce its yield and production in tropical and subtropical regions. To identify parents of sorghum hybrids tolerant to post-flowering drought for commercial hybrids development and deployment, a total of 200 genotypes, including male and female parents of the hybrids, were evaluated in 2022 by lysimeters under two water regimes, well-irrigated and water-stressed, at ICRISAT in Niger. Agronomic traits such as phenological stages, physiological traits including transpiration efficiency, and morphological traits such as green leaf number were recorded. Genotype × environment (G × E) interaction was significant for harvest index (HI), green leaf number (GLN), and transpiration efficiency (TE), indicating different responses of genotypes under varying water conditions. Transpiration efficiency (TE) was significantly and positively correlated with total biomass (BT), harvest index (HI), and grain weight (GW) under both stress conditions. Genotypes ICSV216094, ICSB293, ICSV1049, ICSV1460016, and ICSV216074 performed better under optimal and stress conditions. The Principal Component Analysis (PCA) results led to the identification of three groups of genotypes. The Groups 1 and 3 are characterized by their yield stability and better performance under stress and optimal conditions. These two groups could be used by breeding programs to develop high yield and drought tolerant hybrids.

1. Introduction

(Sorghum bicolor, (L.) Moench), is one of the most important cereals in the semi-arid and subtropical regions of Africa, ranking second in production after maize. Sorghum is a drought-resilient crop and plays an essential role in food security in water-scarce regions [1].
Sorghum production is predominantly concentrated in semi-arid climates, where it is cultivated without supplemental irrigation [2]. It requires less water for cultivation compared to other staple cereals such as maize and wheat, reinforcing its status as one of the most drought-resilient crops. This character has positioned sorghum as an ideal model for studying plant physiological and molecular responses to water stress [3,4]. However, although well adapted to harsh conditions, sorghum’s yield potential in tropical and subtropical regions remains low largely due to recurrent drought and heat stress. In Mali, the cropping period is shortening, and sorghum frequently suffers from terminal drought due to rainfall ending well before the rainy season concludes [5]. This often results in post-flowering drought, characterized by leaf senescence, stem collapse, and lodging, and charcoal stem rot. At this late stage of growth, the plant’s water requirement is particularly high for grain filling, making sorghum susceptible to significant yield losses that can range from 35% to total crop failure [5,6,7,8,9,10].
Sorghum uses different morphological and physiological adaptation strategies to withstand intermittent or prolonged drought cycles. A key adaptation strategy involves reducing water loss through transpiration in response to increased atmospheric demand [11]. Total transpiration (T), transpiration efficiency (TE), and harvest index (HI) are critical factors that influence crop production under drought stress. Transpiration efficiency, defined as the amount of biomass produced per unit of water transpired, is essential for enhancing drought tolerance in sorghum [12,13]. Variation in TE has been extensively documented across various crops, including cowpea, peanut, rice, and pearl millet [14,15,16,17,18,19,20]. In sorghum, significant genetic variation in TE has been demonstrated through gas exchange measurements, traditional lysimetric studies, and field evaluations [21]. These findings highlighted the existence of considerable genetic variation in TE within sorghum germplasm and underscored the strong environmental influence on this trait. Vadez et al. [5], identified high TE and enhanced water extraction capacity in the Durra sorghum race as a valuable resource for improving drought resilience. In addition to this trait, many others are associated with post-flowering drought tolerance, including the stay-green trait [22,23]. The stay-green trait in sorghum is associated with increased root length, which enhances soil water exploration, and an early reduction in transpiration rate to conserve soil moisture. These mechanisms contribute to increased photosynthetic rates and grain yield under drought stress [24]. As highlighted by the aforementioned studies, both transpiration efficiency and stay-green traits can be effectively evaluated using a lysimetric system. Lysimeters provide a controlled environment in which scientists can precisely impose and study terminal water stress, allowing a detailed exploration of the physiological mechanisms that control drought tolerance in sorghum. Such tools are crucial for developing drought-tolerant hybrids in breeding programs.
Given the urgent need to enhance food security in West Africa, breeding high-yielding hybrid sorghum varieties that resist post-flowering drought presents a promising path to ensure agricultural sustainability. Despite sorghum’s significance in this region, research on post-flowering drought tolerance in sorghum breeding using a high through put phenotyping platform remains limited. To address this gap, the study objective was to evaluate the performance of 200 sorghum hybrid parents under post-flowering drought in a controlled lysimeter environment in Niger. Specifically, the aimed (i) to determine the effect of post-flowering drought on morphological, physiological, and agronomic traits; (ii) to study the relationship between morphological traits, grain weight, and TE; and (iii) to identify the best hybrid sorghum parents under drought stress condition.

2. Materials and Methods

2.1. Study Site

The trial was conducted in the lysimetric system at the International Crops Research Institute for the Semi-Arid Tropics (ICRISAT) research station in Sadoré, located at 45 km from Niamey in Niger (13°15′ N and 2°18′ E). The soil used to fill the lysimeter tubes was collected at the Sadoré station farm. The soil characteristics are as follows: high sand content (90%), pH-H2O (5.28), cation exchange capacity (1.91 cmol+ kg−1), organic matter (0.22%), total nitrogen (204.3 mg N kg−1), total phosphorus (26.25 mg P kg−1), and Bray1 phosphorus (1.83 mg P kg−1) [14]. The climate is of the semi-arid tropical type and is characterized by a rainy season that extends from July to September [25] and a long dry season lasting about eight months [26].

2.2. Plant Materials

Two hundred (200) lines were evaluated in this study, including male and female parents of hybrids from the Guinea, Caudatum, Durra and intermediate races. These lines were identified through breeding programs in Mali, Burkina Faso, Senegal, Nigeria, Kenya, Chad, Niger, Ghana, and Cameroon. They were selected based on grain color and size with a focus on white, cream, and yellow grains. The selected genotypes for controls were B35 (drought tolerant) and TX7000 (drought stress-sensitive genotype).

2.3. Experimental Set-Up

The seeds were sown in polyvinyl chloride (PVC) tubes, each measuring 130 cm in length and 25 cm in diameter. A two (2) mm thick iron plate was placed at the bottom of each tube, supported by four screws to retain the soil while allowing for water drainage. Each tube was equipped with metal collars and rings to facilitate lifting during transpiration measurements. To replicate field conditions, the tubes were filled with two types of soil. The first 100 cm from the base was filled with subsoil collected from depths of 20 to 100 cm, while the next 20 cm was filled with topsoil taken from a 0 to 20 cm depth. The top 10 cm of the tubes were left empty to allow for watering and the application of a layer of granules or polyethylene beads at the time of water stress application [14]. After filling, the tubes were watered to field capacity and the following day, after draining, the grains were sown on in three clusters per tube, with four grains per cluster at a 3 cm depth. Thinning to two plants per tube was done on the 14th day after sowing (DAS). The dose of 100 kg/ha di-ammonium phosphate (18-46-0) (i.e., 3 g per tube) was applied after sowing.

2.4. Experimental Design and Imposition of Post-Flowering Water Stress

The experimental design used was a completely randomized block design with four replications and one plant per tube. The factors involved were the water treatments as the main factor (well-watered, WW, and water-stressed, WS, conditions) and 200 lines as the secondary factor. Irrigation was withheld beginning on the 5th day after heading. Watering was then resumed only when the third leaf from the top exhibited clear wilting symptoms, and this cycle of stopping and restarting irrigation continued until maturity. Approximately 10 days were observed between the stress imposition and removal.

2.5. Data Collection

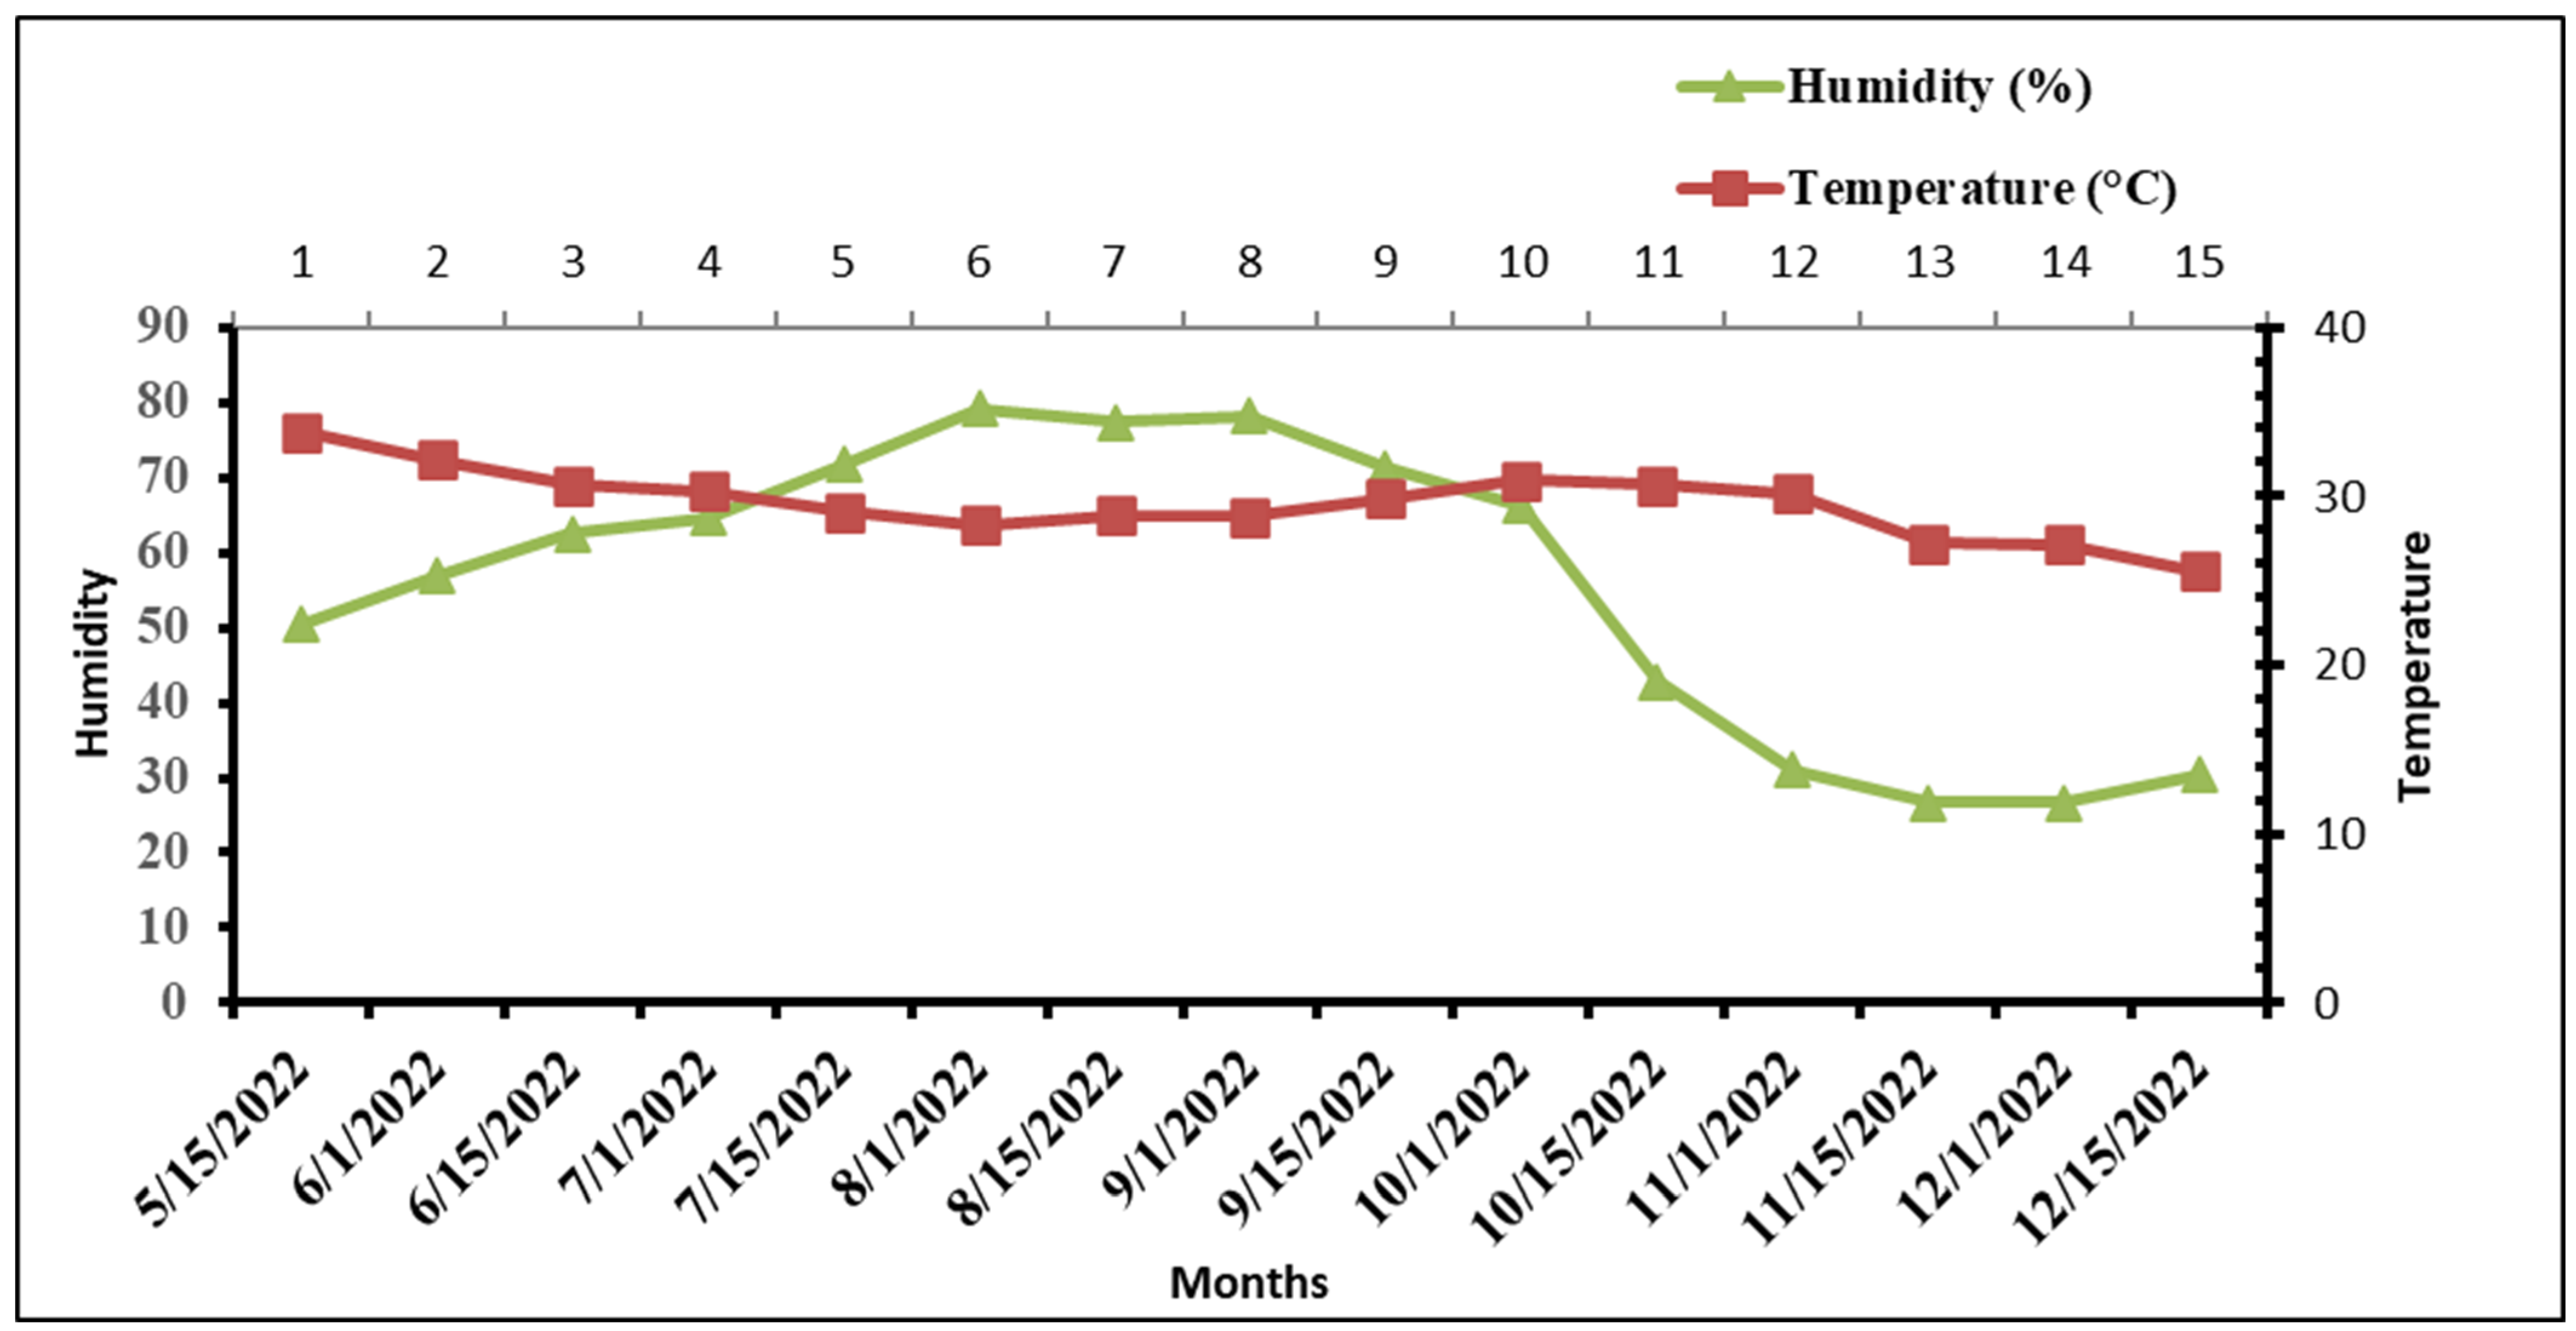
2.5.1. Climatic Data

Temperature and relative humidity data were collected hourly using a thermo-hygrometer (Tinytag Ultra 2 TGU-4500 Gemini Dataloggers Ltd., Chichester, UK) installed within the trial. To better visualize these data in the graph, we first calculated the daily averages and then computed the 15-day averages (Figure 1).

2.5.2. Phenological Traits

Emergence, leaf, and tiller emission were regularly monitored. Daily observations were also recorded to determine the dates of bolting, flag leaf formation, heading, flowering, and the beginning and end of grain maturity, as well as to establish the date of water stress imposition.

2.5.3. Morphological and Physiological Parameters

The total number of green leaves on each plant was counted.
The transpiration measurements started on the 35th day after sowing. At this stage, one of the two plants in each tube was delicately removed and dried to determine the initial dry biomass (IB). The following day, the surface of the tubes was covered with a disc-shaped bag on which was placed a 2 cm layer of polyethylene granules. The tubes were saturated with water, and after drainage, they were weighed to determine the initial weight of each tube. Transpiration was measured gravimetrically by regularly weighing the tubes. A total of 1200 tubes were used, with 4 replicates for each water treatment, for a total of 200 tubes per block. The tubes were weighed twice a week for each water treatment. The tubes were watered 1 to 2 times daily with a maximum of 1 L of water in total (if the daily water demand was more than 1 L). The stressed plants were treated similarly to the irrigated plants until water stress imposition. For the irrigated treatment (WW) all tubes were irrigated until maturity. And for the stressed treatment, irrigation was stopped at the flowering period. About 10 days were observed between stress imposition and removal. The water loss recorded in each tube after weighing corresponded to the transpiration value.
Transpiration efficiency (TE) was determined from the total above-ground biomass and the total amount of water transpired by each plant from the beginning of weighing to harvest [14] It was calculated using the following formula:
T E = B T I B W T
where BT is the total above-ground biomass at harvest; IB represents the initial biomass at the time of the imposition of the water deficit and WT is the total water transpired by each plant from the first weighing to harvest.

2.5.4. Yield Components, Harvest Index, and Stay-Green Trait

At full maturity (at harvest), the total number of green leaves on each plant, from the base of the stem to the panicle leaf, was counted. The plants were cut and dried. After drying, the total biomass (leaf, stem, and panicle biomass), panicle weight per plant and grain weight per plant were obtained after threshing. The number of grains per plant were determined. The harvest index (HI) was calculated as the ratio of grain weight per plant to total biomass per plant at harvest.

2.5.5. Drought Tolerance Index

Several drought stress indices or selection criteria, such as tress tolerance (TOL), mean productivity (MP), geometric mean productivity (GMP), stress susceptibility index (SSI), and stress tolerance index (STI), percentage reduction (Re %) have been proposed as ways to identify genotypes with good stress tolerance.
Among stress tolerance indicators, TOL and SSI can be used to identify drought-sensitive genotypes. Thus, the higher the TOL and SSI values, the greater the sensitivity to stress, and the lower the TOL and SSI values, the better [27]. The MP, STI and GMP indices can be used to identify genotypes that produce high yields under both stressed and unstressed conditions [28]. Different drought tolerance indices were calculated based on the grain yield of the genotypes under well-watered (Yp) and stressed (Ys) conditions.
  • Tolerance index: T O L = ( Y p Y s ) [29]
  • Mean productivity: M P = Y p + Y s 2 [30]
  • Reduction (%): R E D = Y p Y s Y p [31]
  • Stress susceptibility index: S S I = 1 Y S / Y P S I [32]
  • Stress tolerance index: S T I = Y P × Y S Y P 2 [33]
  • Geometric mean productivity: G M P = Y p × Y s [33]
  • Stress intensity: S I = 1 Y ¯ s Y ¯ p [32]

2.6. Statistical Analyses

All statistical analyses were performed using R software (version 3.1.0). The analyses included variance analysis, and were performed using the “agricolae” package. Residual normality and homogeneity were assessed using the Shapiro–Wilk normality and Bartlett homogeneity tests [34] while mean comparisons were conducted using the Tukey test at a 5% significance level [34]. Pearson correlation was performed on the adjusted averages of the parents using the “Hmisc” library. The broad-sense heritability was calculated according to the method proposed by [35], using the following formula:
H 2 = σ 2 G σ 2 P
where σ2 G is the total genotypic variance and is σ2 P the total phenotypic variance. Multivariate analyses including a principal component analysis (PCA) biplot were conducted using “Factoextra”.

3. Results

3.1. Analysis of Variance

The results of the analysis of variance showed highly significant variation among genotypes for all traits (Table 1) under both water treatment conditions. The interaction between genotype and environment (G*E) was highly significant for green leaf number GLN, harvest index HI, total biomass BT, and transpiration efficiency TE (Table 1). The broad-sense heritability H2 was estimated for each trait measured under both water conditions (Table 1). Under water-stress conditions, the heritability of traits ranged from 37% for total biomass BT to 98% for heading date HD. Under well-watered conditions, the heritability of traits ranged from 36% for transpiration efficiency TE to 97% for heading date HD.

3.2. Relationship Between Morphological, Physiological, and Agronomic Traits Under Water Stress (WS)

In the correlation matrix (Figure 2), the lower half shows the vicarate schematic model plots with the line of best fit, while the upper half represents the value of the correlation coefficient, indicated with significance levels as stars. In this study, grain weight per plant GW was significantly and positively correlated with green leaf number GLN, grain number GN, harvest index HI, transpiration efficiency TE, and total biomass BT. In contrast, heading date HD and stem length SL were negatively associated with GW. Harvest index HI also showed a significant positive correlation with grain number GN, grain weight per plant GW, green leaf number GLN, and TE, but a negative correlation with stem length SL and heading date HD. Total biomass BT was positively correlated with water transpired WT, transpiration efficiency TE, grain weight GW, and grain number GN. A positive correlation was detected between transpiration efficiency TE and harvest index HI, total biomass BT, grain number GN, grain weight GW, and green leaf number GLN, but TE was negatively correlated with water transpired WT and stem length SL. Water transpired WT also showed a significant positive correlation with total biomass BT, stem length SL, and heading date HD, and a negative correlation with transpiration efficiency TE and green leaf number GLN (Figure 2).

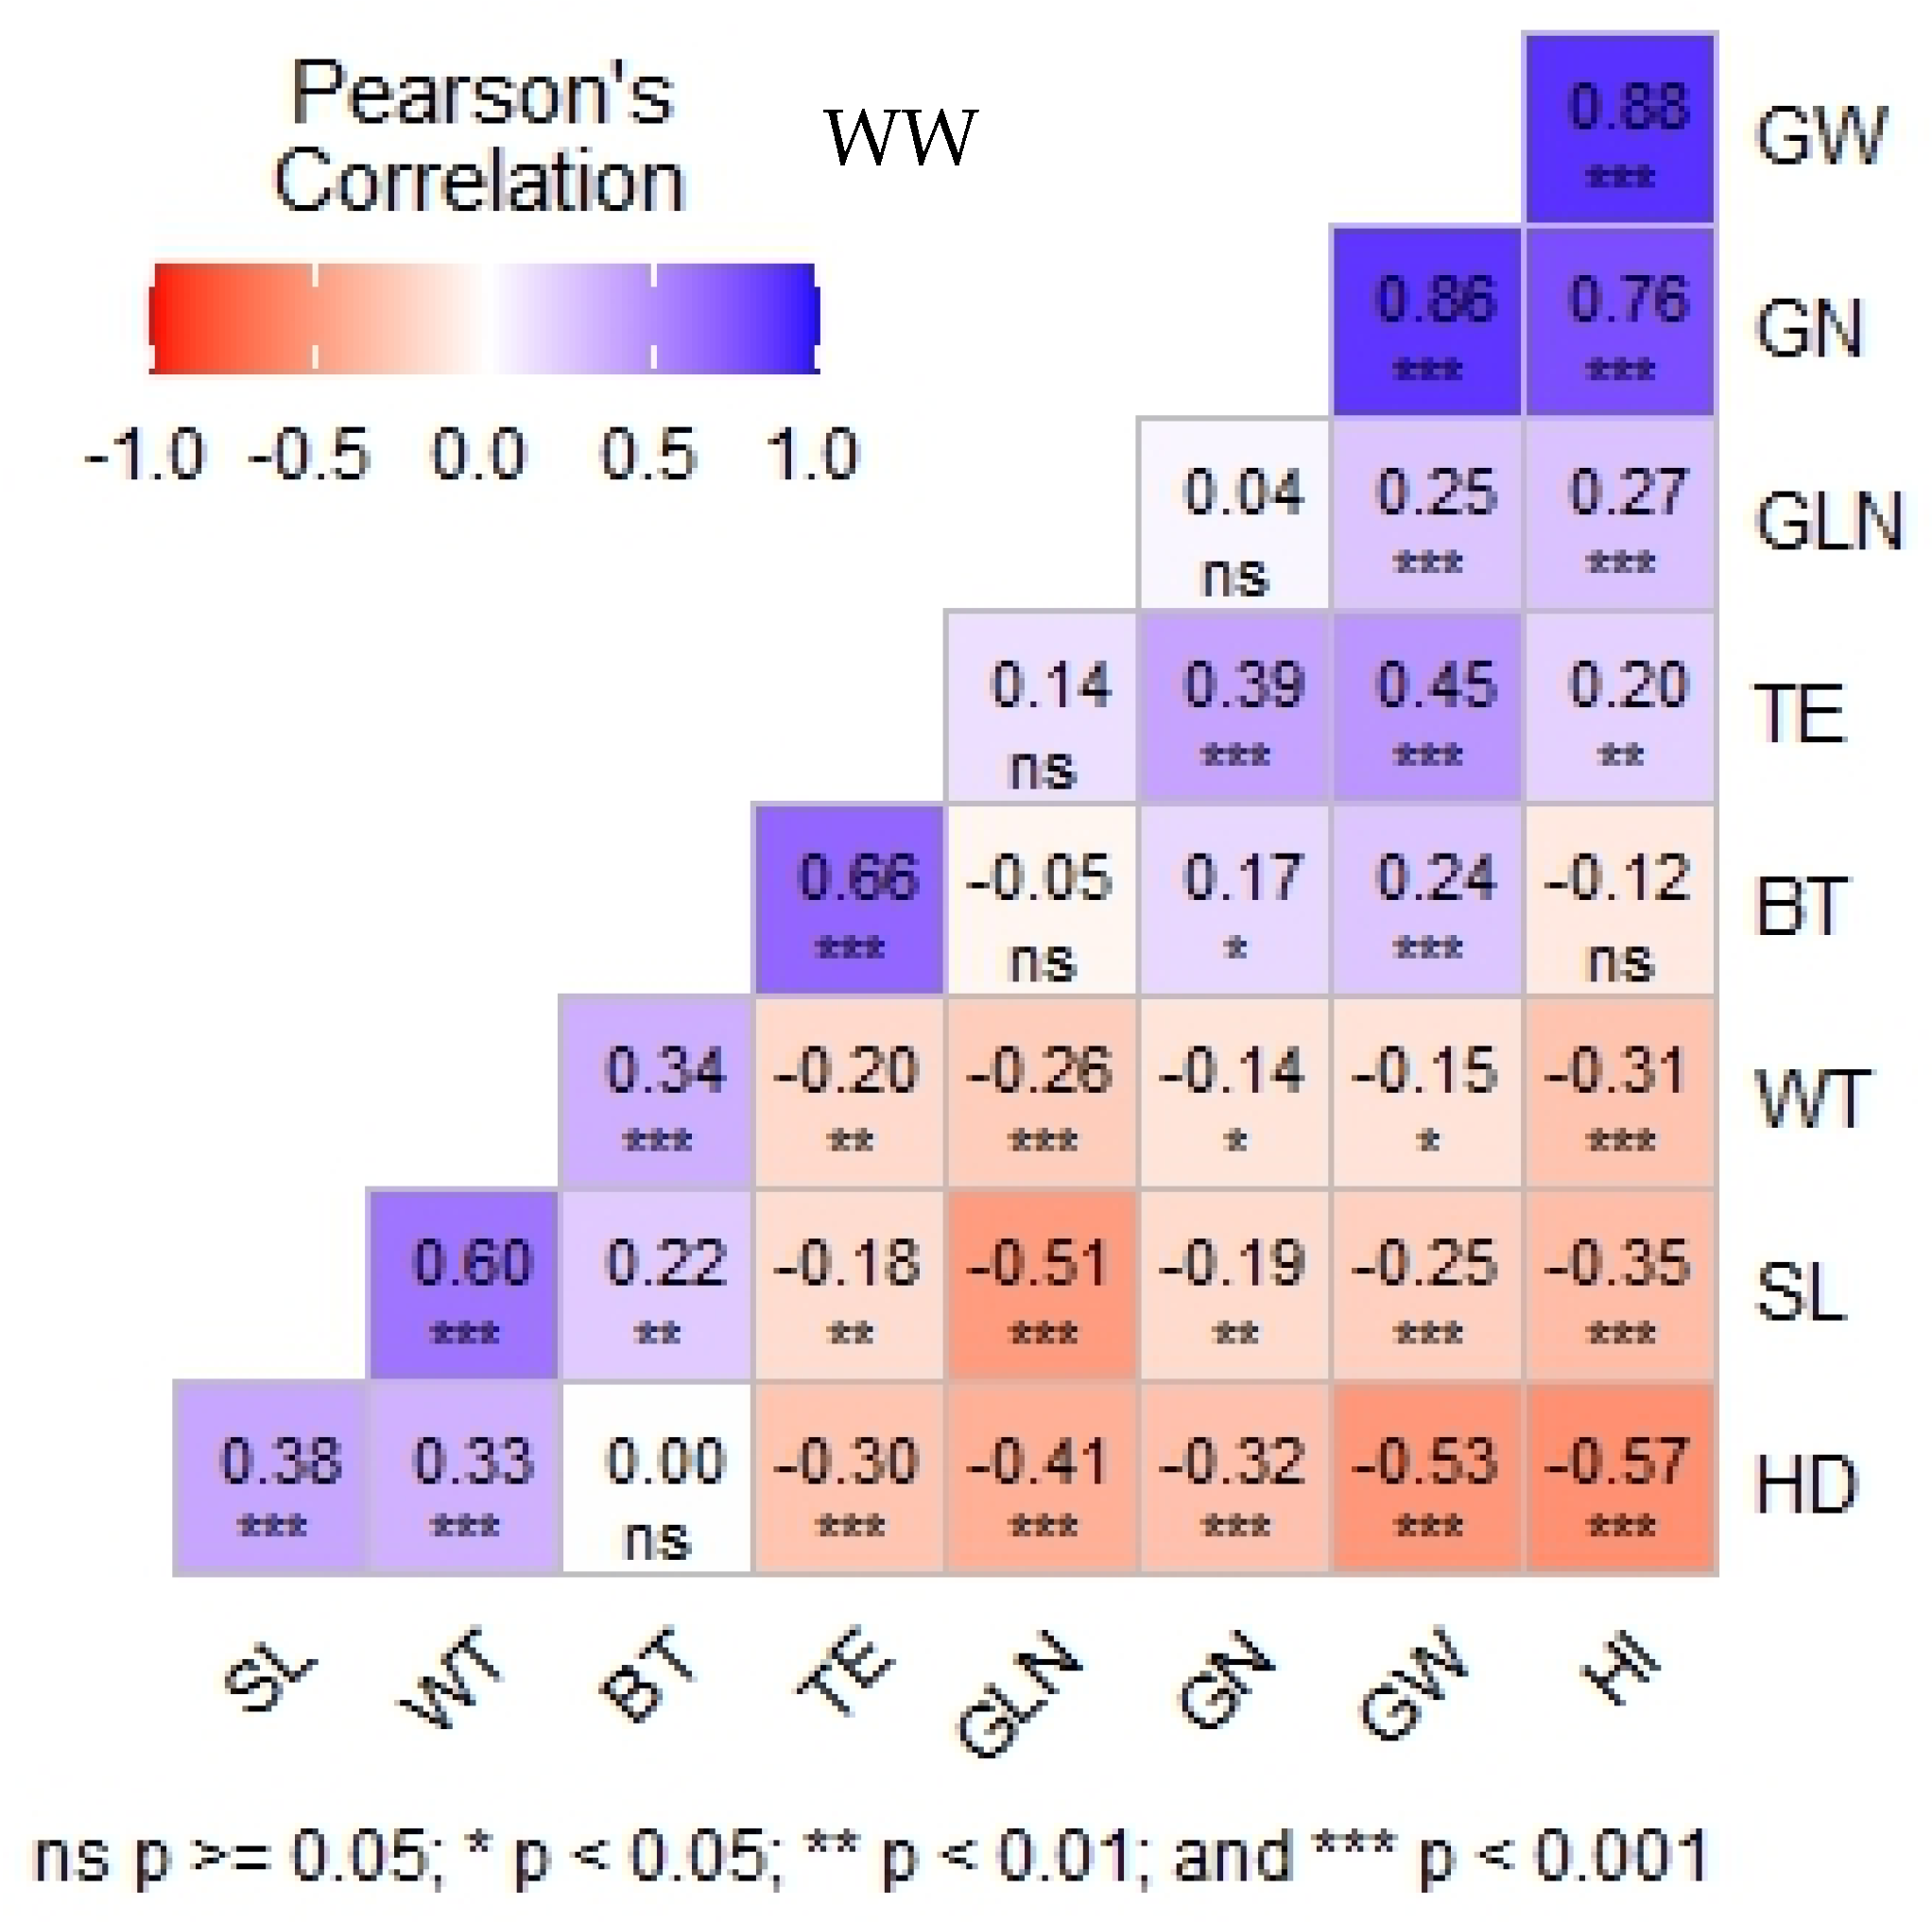
3.3. Relationship Between Morphological, Physiological, and Agronomic Traits Under Well-Watered Condition (WW)

Figure 3 shows the correlation between different sorghum traits under well-watered conditions. Grain weight per plant GW was positively correlated (p < 0.001) with green leaf number GLN, grain number GN, total biomass BT, and harvest index HI, while it was negatively correlated with stem length SL, heading date HD, and water transpired WT. Transpiration efficiency TE was positively correlated with grain weight GW, grain number GN, total biomass BT, and HI. TE also showed a negative correlation with heading date HD, stem length SL, and water transpired WT. No significant correlation was found between TE and green leaf number GLN. Harvest index HI was negatively associated with stem length SL, heading date HD, and water transpired WT, but positively correlated with grain number GN, grain weight GW, green leaf number GLN, and TE. Total biomass BT was positively correlated with grain weight GW, water transpired WT, TE, stem length SL, and grain number GN. Water transpired WT showed a positive correlation (p < 0.001) with total biomass BT, heading date HD, and stem length SL, but a negative correlation with HI, green leaf number GLN, TE, grain weight GW, and grain number GN.

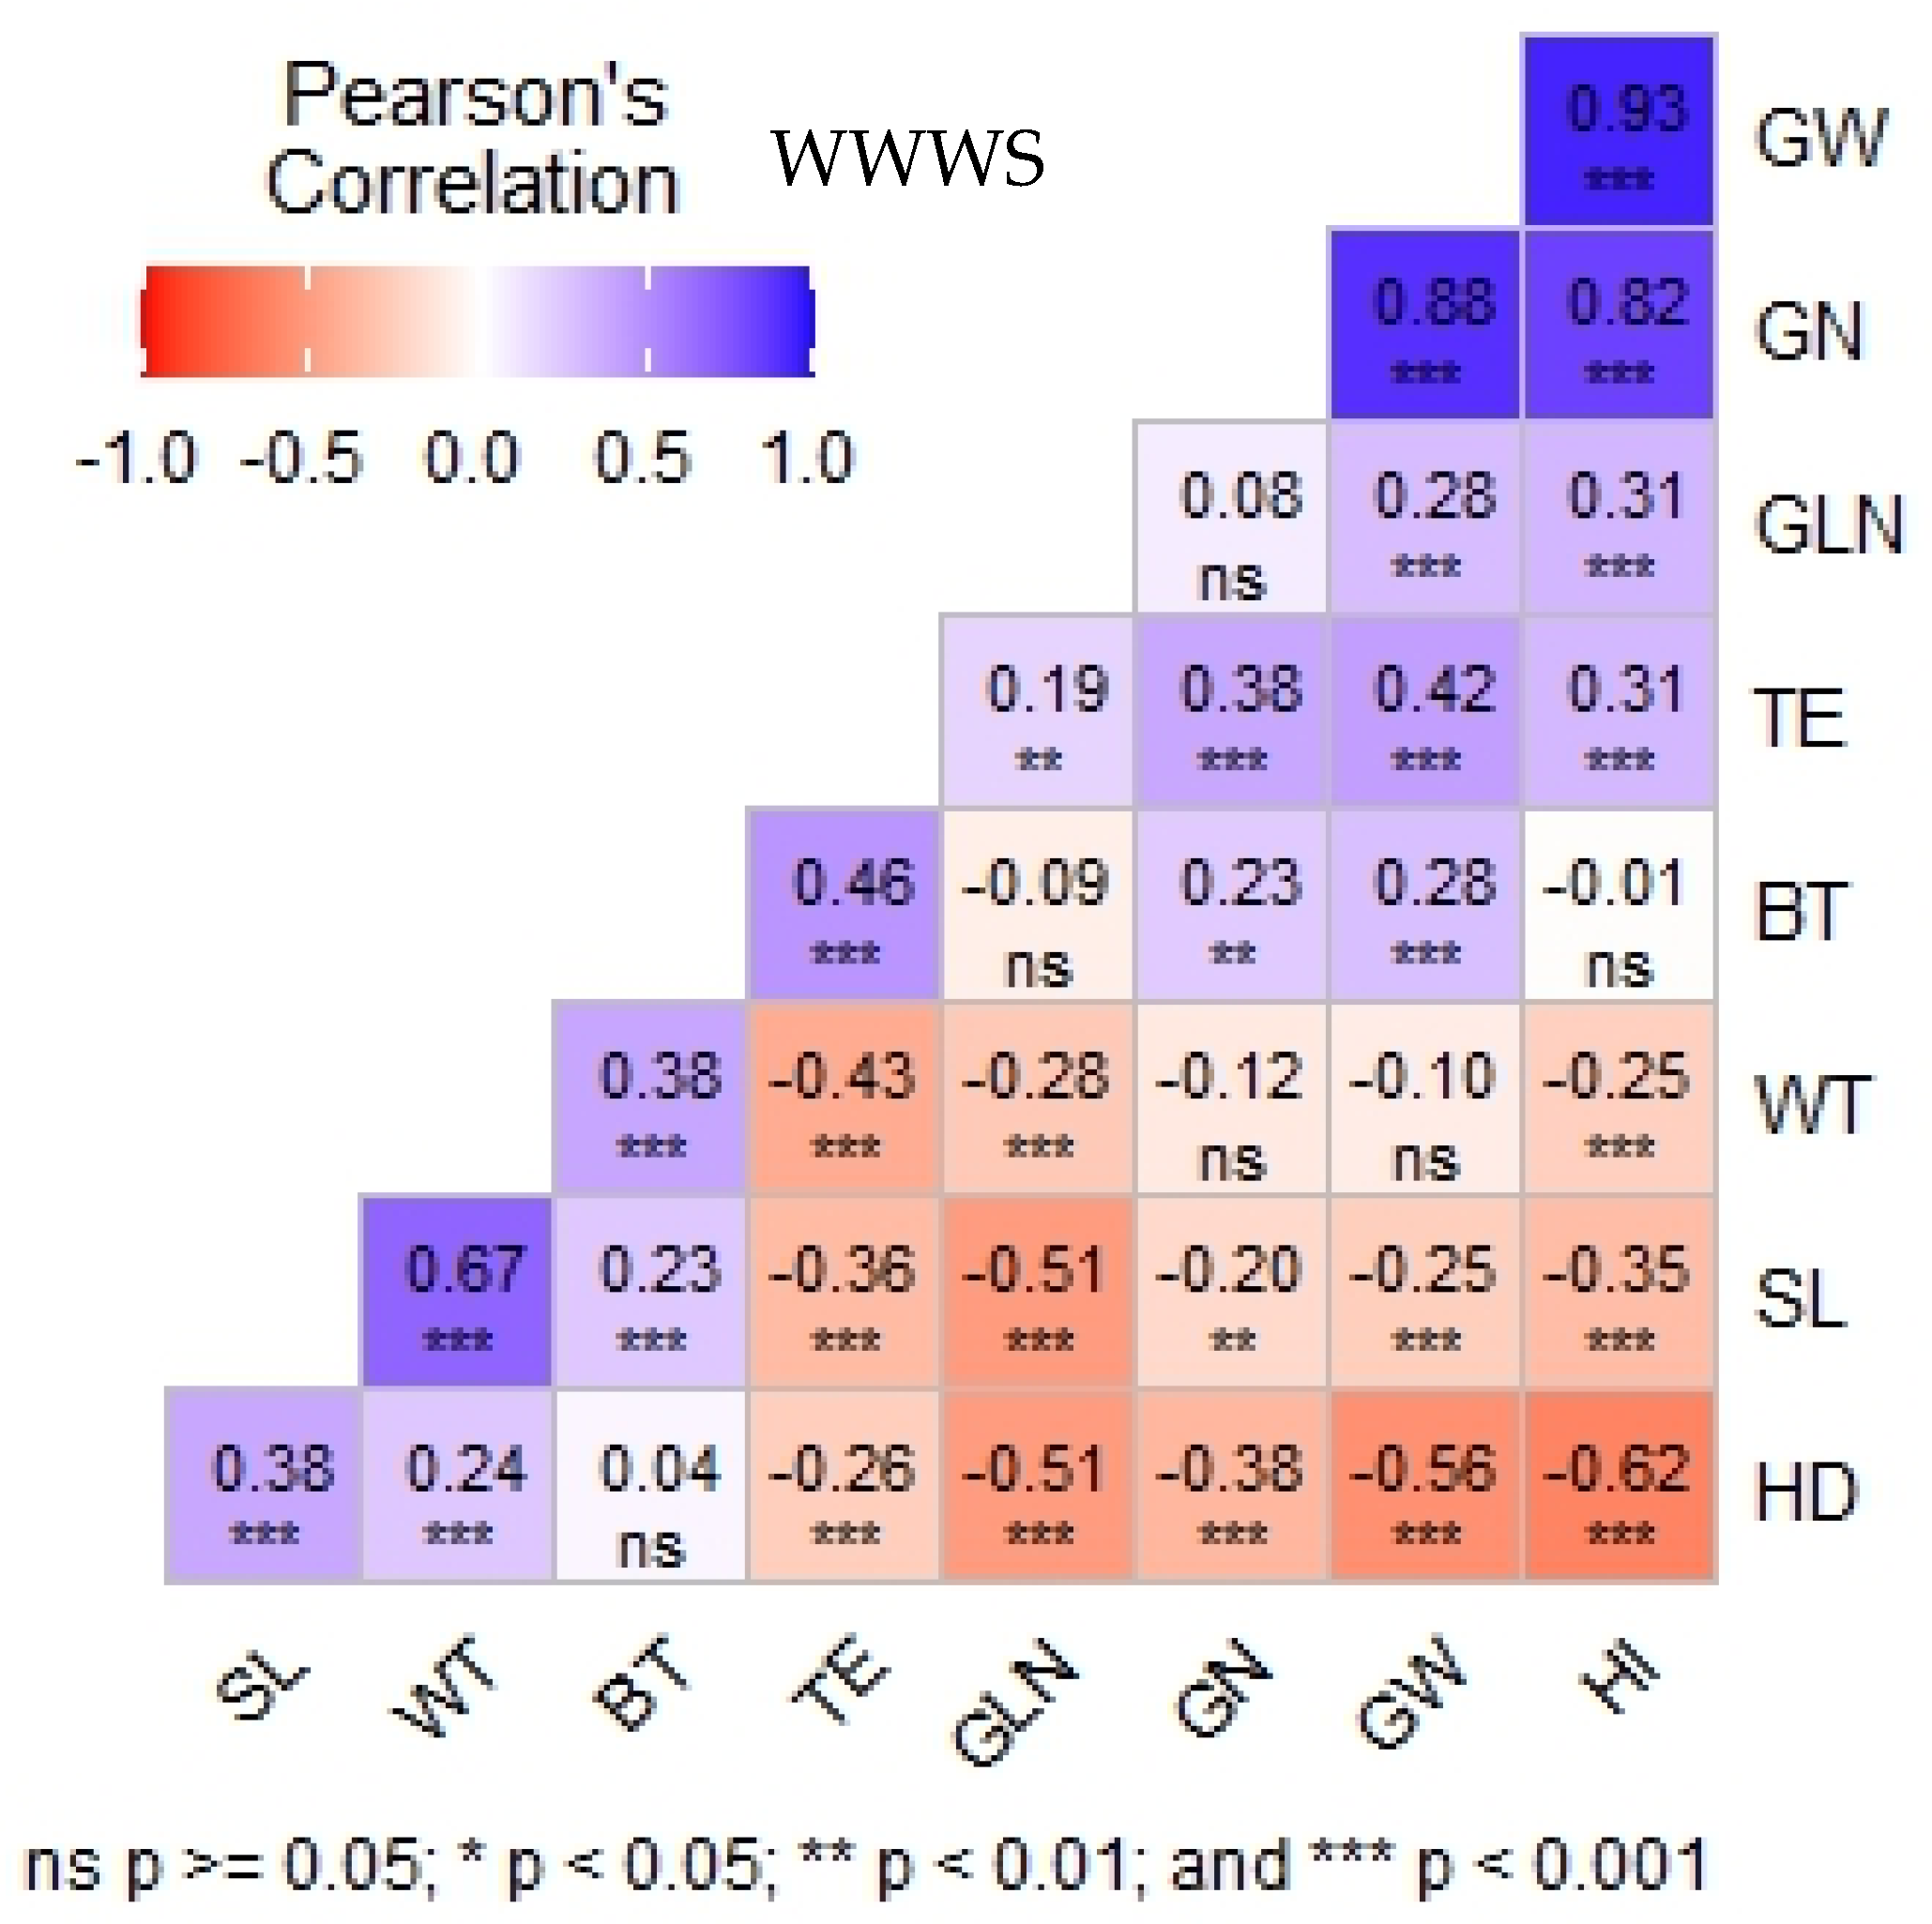
3.4. Relationship Between Traits Under Well-Watered and Water-Stressed Treatment

Figure 4 shows the relationship between different sorghum traits in both environments (well-watered and water-stressed treatments). Grain weight per plant GW was positively correlated (p < 0.001) with green leaf number GLN, grain number GN, total biomass BT, harvest index HI, and transpiration efficiency TE, while it was negatively correlated with stem length SL, heading date HD, and water transpired WT. Transpiration efficiency TE was positively correlated with grain weight GW, grain number GN, total biomass BT, green leaf number GLN, and HI. TE also showed a negative correlation with heading date HD, stem length SL, and transpired water WT. HI was positively correlated with grain weight per plant GW, grain number per plant GN, green leaf number GLN, and transpiration efficiency TE. In contrast, HI was strongly and negatively correlated with heading date HD, stem length SL, and transpired water WT. Total biomass BT was positively correlated with grain weight GW, transpired water WT, TE, stem length SL, and grain number GN. No significant relationships were found between BT and HI, GLN, and HD. Transpired water WT showed a positive correlation (p < 0.001) with total biomass BT, heading date HD, and stem length SL, but the relationship was negative with HI, green leaf number GLN, and TE; on the other hand, no significant relationship was observed between WT and grain weight GW and grain number GN.

3.5. Grain Yield and Drought Tolerance Indices in Sorghum Hybrid Parents

In Table 2, fifty (50) genotypes considered as drought tolerant were selected based on drought tolerance indices. Considering the STI, the genotypes Sariaso 16, Sariaso 14, CSV 1049, FAOUROU, 216-2P4-5B, Sureno, 06-SB-F4DT-15, ICSV111, Seguifa, ICSB 176001, SAMSORG 41, 015-SB-CS-F7-127, and ICSB 176003 were identified as the most tolerant genotypes with high yield under both conditions, having the highest STI values (1.10–3.38). In general, in drought tolerance studies, STI is considered the best index of drought tolerance [36]. The STI allows for the identification of high-yielding and drought-tolerant genotypes.
Stress tolerance (TOL) values ranged from 0.65 (ICSV 1360883) to 32.5 (Sepon 82). Lower or negative TOL indices indicated greater tolerance to water stress. Therefore, the genotypes PR3009B, 019-SB-CS-F5-71, ISS3187, ISS408, ICSB 176006, ICSB 176031, IRAT204, ICSB 176031, SAMSORG3, ICSV 206056, SAMSORG 40, 06-SB-F4DT-15, Niobougouma, Sariaso 16, ICSV 1049, ICSB 176003, FAOUROU, Sureno, Sariaso 14, ICSB 176001, 016-SB-CS-DU-17, 015-SB-CS-F7-127, Seguifa, and ICSV 206084, which had low TOL values (0.65 g to 15 g), were considered drought tolerant. Mean productivity (MP) values ranged from 36.51 (PAYENNE) to 0.84 (ICSV 1360883), with 56 genotypes recording MP values >19 and 116 genotypes recording values <15. For geometric mean productivity (GMP), Sariaso 16 recorded the highest value (35.92), while ICSV 1360883 had the lowest value (0.84) (Table 2). Regarding the SSI index, the lowest (0.19) and highest (2.08) values were recorded by 019-SB-CS-F5-71 and Kapelga, respectively. In this study, SSI results were most similar to the RED% index (Table 2).
In this study B35 tolerant controls recorded a low grain weight per plant and under optimal conditions (3.32g plant−1) and water stress (1.33g plant−1), compared to the sensitive control which recorded a higher grain weight per plant under optimal condition (6.34 g plant−1) and stress condition (4.12g plant−1). On the other hand, B35 recorded high values of efficiency of transpiration and number of green leaves at harvest.

3.6. Green Leaf Number (GLN) and Transpiration Efficiency in Sorghum Hybrid Parents

Green leaf number GLN ranged from zero to 11.50 under stress conditions, whereas under optimal conditions, GLN ranged from 3.50 to 15.50 (Table 2).
Transpiration efficiency TE values ranged from 1.62 to 5.63 g/kg under water stress and 1.56 to 5.06 g/kg under well-watered conditions. The genotypes ICSB293, ICSV206059, ICSV206032, ICSV186002, IRAT204, SAMSORG 41, Sariaso 16, ICSB 176031, FAOUROU, ICSV 1049, Sureno, and ICSV111 exhibited high TE values under water stress, meaning that these genotypes use efficiently water to produce biomass (Table 2).

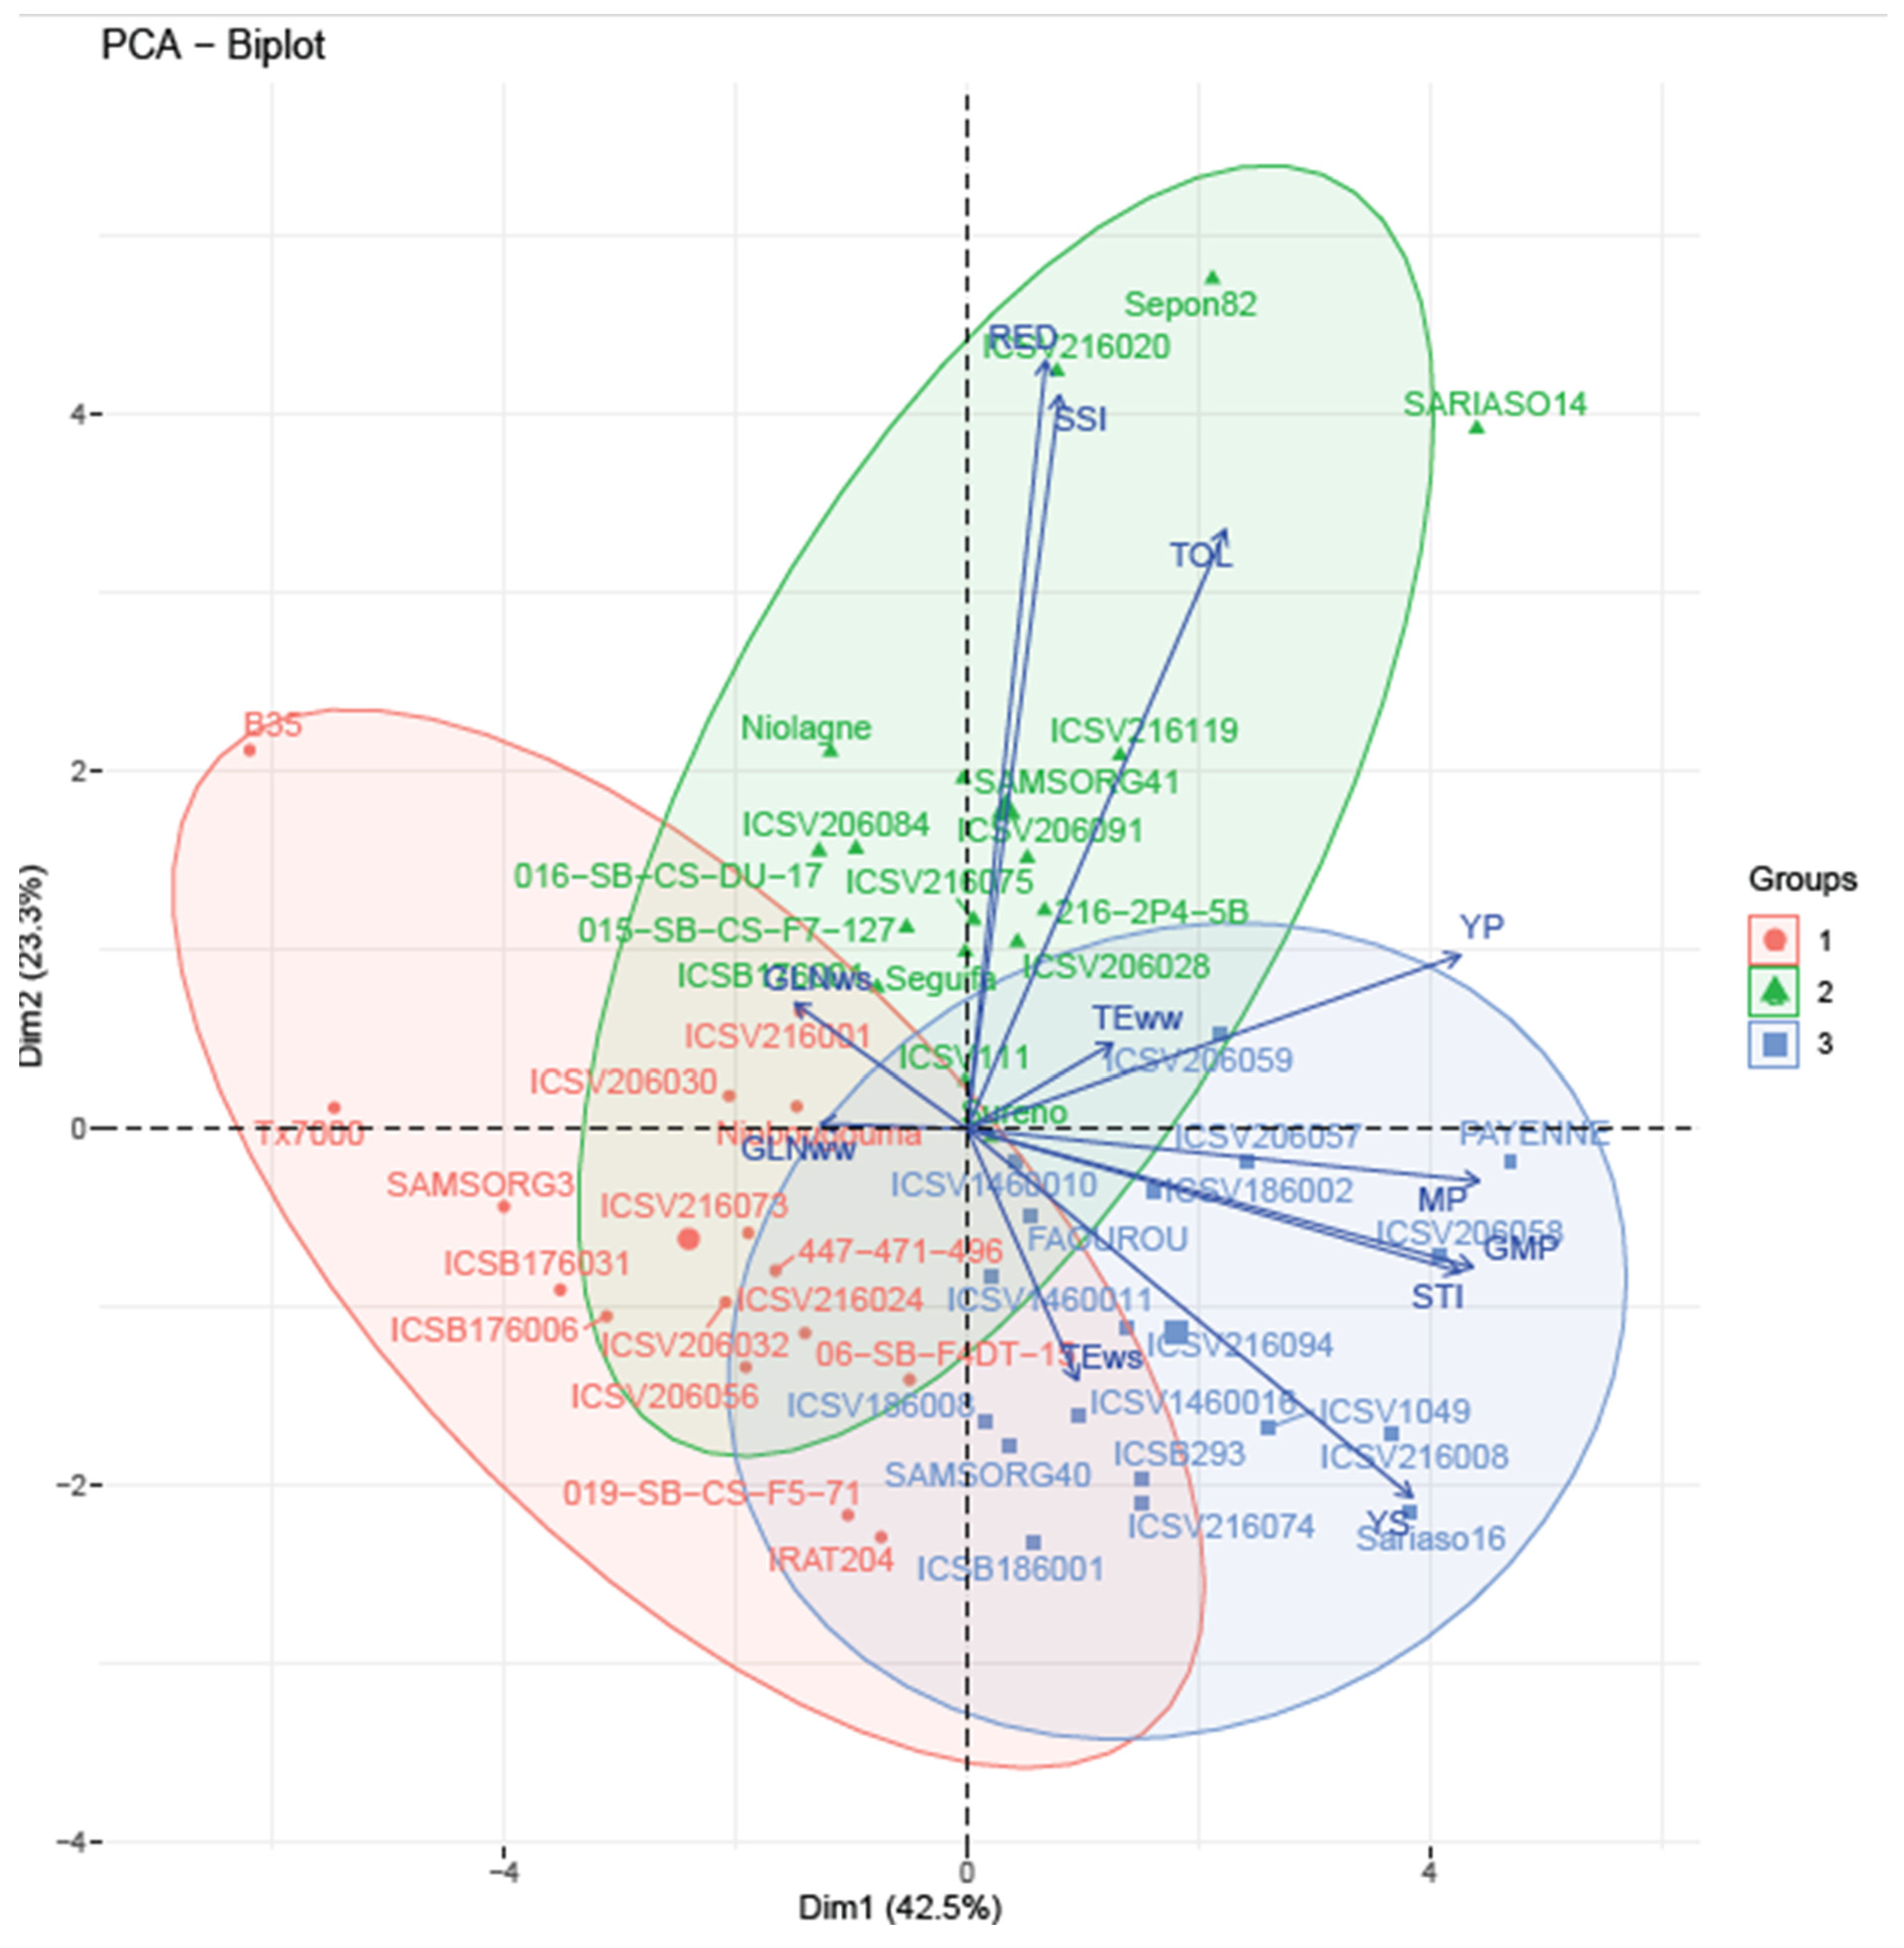
3.7. PCA-Based Clustering of Drought-Tolerant Sorghum Genotypes

A principal component analysis (PCA) biplot was conducted based on fifty sorghum genotypes selected using drought tolerance indices. The PCA biplot revealed three homogeneous groups (Figure 5). Dimensions 1 and 2 explained 23.3% and 42.5% of the total variation, respectively.
Group 1 includes the genotypes ICSV206032 (21.77 and 15.73 g), ICSV216024 (21.63 and 16.47 g), 447 (471) 496 (22.39 and 15.97 g), ICSV216073 (22.77 and 16.40 g), and ICSV206056 (19.70 and 15.90 g), which recorded low values for grain weight under optimal conditions (YP), yield reduction (RED%), tolerance index (TOL), and stress susceptibility index (SSI). This group also includes genotypes with high green leaf numbers under both water-stressed and well-watered conditions (GLNws and GLNww).
Group 2 consists of genotypes with high yield under optimal conditions (YP), high yield reduction (RED%), high tolerance index (TOL), and high stress susceptibility index (SSI). This group includes the genotypes ICSV206091, ICSV206028, ICSV216075, 216-2P4-5B, and Seguifa. This result suggests that this group is sensitive to drought. Group 3 is characterized by high values of YP, YS, STI, GMP, MP, TEws, and TEww. The genotypes in this group include ICSV216094, ICSB293, ICSV1049, ICSV1460016, and ICSV216074. This result means that genotypes in this group could be drought tolerant.

4. Discussion

Post-flowering drought is one of the most important abiotic constraint that can affect crop production, especially sorghum [6].
In this study, we investigated 200 sorghum hybrid parents for agronomic, physiological, and morphological traits under two water regimes using a lysimetric system. Agronomic traits such as phenological stages, physiological traits including transpiration efficiency, and morphological traits such as number of green leaves were recorded.
Our results revealed a significant genotypic effect for several traits: GLN (the number of green leaves), SL (stem length), HD (heading date), GW (grain weight per plant), GN (the number of grains per plant), HI (harvest index), BT (total biomass), WT (total water transpired), and TE (transpiration efficiency) under both well-watered and water-stressed conditions. This suggests high genetic variability among genotypes that could be exploited for new hybrids development. Similar genetic variability in sorghum has been reported by [21], in which significant variability was also observed in TE under both normal and stressed water regimes. The genotype × environment (G × E) interaction was significant for HI, GLN, and TE, indicating different genotype responses under varying water conditions. The higher environment effect between genotypes for TE suggests a differential expression of phenotypes in different water conditions for this trait [37,38]. Our findings align with those of [39,40], who reported significant G × E interactions for grain yield, SPAD chlorophyll content, and green leaf number under post-flowering drought stress.
Broad-sense heritability (H2) ranged from 37% to 98% under stress conditions and from 36% to 97% under optimal conditions. According to [41], H2 is classified as high if greater than 50%, medium between 20% and 50%, and low if less than 20%, but the interpretation depends on the trait. In this study, high H2 values were obtained for GLN, SL, HD, GW, GN, HI, and WT, indicating a low environmental influence on these traits and also the confidence on the results. On the other hand, TE had moderate heritability (50% under stress and 36% under optimal conditions), suggesting that TE variation among genotypes is moderately determined by genetic factors. This finding is consistent with [20], who reported H2 values between 29% and 36% for TE in pearl millet under both conditions.

4.1. Correlation Analysis

TE was significantly and positively correlated with BT, HI, and GW under both stressed and optimal conditions. This suggests that improving TE could contribute to increased grain weight, a result consistent with those of [5,12,14]. Under water stress, TE and WT showed a strong negative correlation (r = −0.50), while under well-watered conditions, the relationship was weaker (r = −0.20). This indicates that a reduction in WT leads to an increase in TE, likely due to stomatal closure minimizing water loss through transpiration. Similar results were reported by [15].

4.2. Selection of Drought-Tolerant Genotypes

A total of 50 genotypes (including both male and female hybrid parents) were selected based on their high drought tolerance index (STI) values. A principal component analysis (PCA biplot) was performed on these genotypes, revealing three homogeneous clusters (Figure 3). Cluster 1 includes ICSV206032, ICSV216024, 447 (471) 496, ICSV216073, and ICSV206056. These genotypes are characterized by low yield (YP and YS) under both optimal and stressed conditions, low yield reduction (RED%), low tolerance index (TOL), and low stress susceptibility index (SSI). They could be stable across all conditions but with low yield potential. Cluster 2 contains genotypes with high grain yield under optimal conditions but low yield under stress. These genotypes had high RED%, TOL, and SSI, indicating greater sensitivity to drought.
Cluster 3 comprises genotypes with high grain yield under both stressed and unstressed conditions. These genotypes exhibited high STI, GMP, and MP values, indicators of superior performance in both environments. The results align with [39,42,43,44], who also found high YP, YS, STI, GMP, and MP under different water conditions. Additionally, genotypes in Cluster 3 had high TE under water stress, further supporting their drought tolerance potential. According to [5], higher TE values are often linked to improved grain yield, reinforcing the importance of TE as a selection criterion for drought tolerance in sorghum breeding.

5. Conclusions

The results of our study revealed variability among genotypes for morphological traits, grain yield, and TE under well-watered and stressed regimes. The heritability of the traits was high under stressed and normal conditions. The positive and significant correlations were between the grain weight trait and the transpiration efficiency, and the green leaf number under normal and stressed water regimes. Genotypes ICSV216094, ICSB293, ICSV1049, ICSV1460016, and ICSV216074 performed better under stressed and normal conditions. Clusters 1 and 3 were characterized by their yield stability and high performance under stressed and normal conditions. Breeding programs can use these clusters as parents of hybrids in developing drought-resistant varieties.

Author Contributions

Conceptualization and methodology, B.N., M.B.J., H.F., K.T. and S.S.; data collection, H.F., K.T. and H.A.; formal analysis, K.T., J.S.B.D., M.D. and B.N.; validation M.B.J., B.N., M.D., J.S.B.D., B.G., S.S., H.F., H.A. and B.S.; writing—original draft; K.T. and M.B.J.; writing—review and editing; K.T., M.B.J., S.S., M.D., B.N., J.S.B.D., B.G. and B.S.; and supervision; M.B.J., S.S. and B.S. All authors have read and agreed to the published version of the manuscript.

Funding

This study was funded by the European Union as part of the project “Improving Crop Productivity and Climate Resilience for Food and Nutrition Security in Mali” (EU-APSAN Mali).

Data Availability Statement

The data presented in this study are available on request from the corresponding author.

Acknowledgments

We thank all of the staff at the Plant Physiology Laboratory at ICRISAT Niger who assisted us with data collection.

Conflicts of Interest

The authors have no competing interests or other interests that might be perceived to influence the results and/or discussion reported in this paper.

References

  1. Sissoko, S.; Diallo, A.G.; Coulibaly, M.M.; Teme, N.; Vernon, G.; Danquah, E. Genetic Analysis of VariousTraits of Hybrids Sorghum (Sorghum bicolor (L) Moench), Correlated with Drought Tolerance. J. Plant Biol. Soil Health 2017, 4, 9. [Google Scholar] [CrossRef]
  2. Rosenow, D.T. Breeding for pre- and post-flowering drought stress resistance in sorghum. In Proceedings of the International Conference on Genetic Improvement of Sorghum and Pearl Millet, Lubbock, TX, USA, 22–27 September 1996; pp. 400–424. [Google Scholar]
  3. Hammer, G.L.; Kropff, M.J.; Sinclair, T.R.; Porter, J.R. Future contributions of crop modelling—From heuristics and supporting decision making to understanding genetic regulation and aiding crop improvement. Eur. J. Agron. 2002, 18, 15–31. [Google Scholar] [CrossRef]
  4. Krupa, K.N.; Dalawai, N.; Shashidhar, H.E.; Harinikumar, K.M.; Manojkumar, H.B.; Bharani, S.; Turaidar, V. Mechanisms of Drought Tolerance in Sorghum: A Review. Int. J. Pure Appl. Biosci. 2017, 5, 221–237. [Google Scholar] [CrossRef]
  5. Vadez, V.; Krishnamurthy, L.; Hash, C.T.; Upadhyaya, H.D.; Borrell, A.K. Yield, transpiration efficiency, and water-use variations and their interrelationships in the sorghum reference collection. Crop Pasture Sci. 2011, 62, 645–655. [Google Scholar] [CrossRef]
  6. Assefa, Y.; Staggenborg, S.A.; Prasad, V.P. Grain Sorghum Water Requirement and Responses to Drought Stress: A Review. Crop Manag. 2010, 9, 1–11. [Google Scholar] [CrossRef]
  7. Das, I.K.; Rakshit, S. Millets, Their Importance, and Production Constraints; Elsevier Inc.: Amsterdam, The Netherlands, 2016. [Google Scholar] [CrossRef]
  8. Upadhyaya, H.D.; Dwivedi, S.L.; Vetriventhan, M.; Krishnamurthy, L.; Singh, S.K. Post-flowering drought tolerance using managed stress trials, adjustment to flowering, and mini core collection in sorghum. Crop Sci. 2017, 57, 310–321. [Google Scholar] [CrossRef]
  9. de Souza, A.A.; de Carvalho, A.J.; Bastos, E.A.; Portugal, A.F.; Torres, L.G.; Batista, P.S.C.; Julio, M.P.M.; Julio, B.H.M.; de Menezes, C.B. Grain Sorghum Grown Under Drought Stress at Pre- and Post-flowering in Semiarid Environment. J. Agric. Sci. 2020, 12, 97. [Google Scholar] [CrossRef]
  10. Mwamahonje, A.; Eleblu, J.S.Y.; Ofori, K.; Feyissa, T.; Deshpande, S.; Tongoona, P. Evaluation of traits performance contributing to drought tolerance in sorghum. Agronomy 2021, 11, 1698. [Google Scholar] [CrossRef]
  11. Kholová, J.; Murugesan, T.; Kaliamoorthy, S.; Malayee, S.; Baddam, R.; Hammer, G.L.; McLean, G.; Deshpande, S.; Hash, C.T.; Craufurd, P.Q.; et al. Modelling the effect of plant water use traits on yield and stay-green expression in sorghum. Funct. Plant Biol. 2014, 41, 1019–1034. [Google Scholar] [CrossRef]
  12. Xin, Z.; Aiken, R.; Burke, J. Genetic diversity of transpiration efficiency in sorghum. Field Crops Res. 2009, 111, 74–80. [Google Scholar] [CrossRef]
  13. Vadez, V.; Kholova, J.; Yadav, R.S.; Hash, C.T. Small temporal differences in water uptake among varieties of pearl millet (Pennisetum glaucum (L.) R. Br.) are critical for grain yield under terminal drought. Plant Soil 2013, 371, 447–462. [Google Scholar] [CrossRef]
  14. Abdou, H.; Falalou, H.; Oumarou, H.; Achirou, B.F.; Yacoubou, B. Lysimetre Et Performance Agronomique Au Champ Physiological response of cowpea [Vigna unguiculata (L.) Walp.] genotypes to water deficit under lysimeter conditions and agronomical performance in field conditions. IOSR J. Agric. Vet. Sci. 2019, 12, 22–33. [Google Scholar]
  15. Falalou, H.; Sani, M.A.; Hassane, Y.B.; Falke, B.A.; Upadhyaya, D.H. Abiotic Stresses Tolerance and Nutrients Contents in Groundnut, Pearl Millet and Sorghum Mini Core Germplasm for Food and Nutrition Security. Indian J. Plant Genet. Resour. 2017, 30, 201. [Google Scholar] [CrossRef]
  16. Vadez, V.; Ratnakumar, P. High transpiration efficiency increases pod yield under intermittent drought in dry and hot atmospheric conditions but less so under wetter and cooler conditions in groundnut (Arachis hypogaea (L.)). Field Crops Res. 2016, 193, 16–23. [Google Scholar] [CrossRef]
  17. Ratnakumar, P.; Vadez, V.; Nigam, S.N.; Krishnamurthy, L. Assessment of transpiration efficiency in peanut (Arachis hypogaea L.) under drought using a lysimetric system. Plant Biol. 2009, 11 (Suppl. S1), 124–130. [Google Scholar] [CrossRef]
  18. Affortit, P.; Effa-Effa, B.; Ndoye, M.S.; Moukouanga, D.; Luchaire, N.; Cabrera-Bosquet, L.; Perálvarez, M.; Pilloni, R.; Welcker, C.; Champion, A.; et al. Physiological and genetic control of transpiration efficiency in African rice, Oryza glaberrima Steud. J. Exp. Bot. 2022, 73, 5279–5293. [Google Scholar] [CrossRef]
  19. Belko, N.; Zaman-Allah, M.; Cisse, N.; Diop, N.N.; Zombre, G.; Ehlers, J.D.; Vadez, V. Lower soil moisture threshold for transpiration decline under water deficit correlates with lower canopy conductance and higher transpiration efficiency in drought-tolerant cowpea. Funct. Plant Biol. 2012, 39, 306–322. [Google Scholar] [CrossRef]
  20. Grégoire, L.; Kholova, J.; Srivastava, R.; Hash, C.T.; Vigouroux, Y.; Vadez, V. Transpiration efficiency variations in the pearl millet reference collection PMiGAP. PLoS ONE 2024, 19, e0299686. [Google Scholar] [CrossRef]
  21. Xin, Z.; Franks, C.; Payton, P.; Burke, J.J. A simple method to determine transpiration efficiency in sorghum. Field Crops Res. 2008, 107, 180–183. [Google Scholar] [CrossRef]
  22. Rajcan, I.; Tollenaar, M. Source: Sink ratio and leaf senescence in maize: I. Dry matter accumulation and partitioning during grain filling. Field Crops Res. 1999, 60, 245–253. [Google Scholar] [CrossRef]
  23. Borrell, A.K.; Tao, Y.; Mcintyre, C.L. Physiological Basis, QTL, and MAS of the Stay-Green Drought Resistance Trait in Grain sorghum; CIMMYT: El Batan, Mexico, 1999; Volume 240, pp. 142–146. [Google Scholar]
  24. Maduraimuthu, D.; Alagarswamy, S.; Prabhakaran, J.; Karuppasami, K.M.; Venugopal, P.B.; Koothan, V.; Natarajan, S.; Dhashnamurthi, V.; Veerasamy, R.; Rathinavelu, S.; et al. Drought Tolerance of Mungbean Is Improved by Foliar Spray of Nanoceria. Agronomy 2023, 13, 201. [Google Scholar] [CrossRef]
  25. Renard, C.; Boudouresque, E.; Bationd, G.S.A. Dans Une Zone Protegée Du Sahel (Sadoré, Niger). 1989. Available online: https://www.researchgate.net/publication/32975711 (accessed on 17 April 2025).
  26. Saidouet, A.K.; Ichaou, A. Gestion durable des sols au Niger: Contraintes, défis, opportunités et priorités. Nat. Faune 2016, 30, 31–34. [Google Scholar]
  27. Golabadi, M.; Arzani, A.; Maibody, S.A.M.M. Assessment of drought tolerance in segregating populations in durum wheat. Afr. J. Agric. Res. 2006, 1, 162–171. [Google Scholar]
  28. Subhani, G.M.; Ahmad, J.; Anwar, J.; Hussain, M.; Mahmood, A. Identification of drought tolerant genotypes of barley (Hordeum vulgare L.) through stress tolerance indices. J. Anim. Plant Sci. 2015, 25, 686–692. [Google Scholar]
  29. Hossain, A.B.; Sears, A.G.; Cox, T.S.; Paulsen, G. Desiccation tolerance and its relationship to assimilate partitioning in winter wheat. Crop Sci. 1990, 30, 622–627. [Google Scholar] [CrossRef]
  30. Rosielle, A.A.; Hamblin, J. Theoretical aspects of selection for yield in stress and non-stress environment. Crop Sci. 1981, 26, 943–946. [Google Scholar] [CrossRef]
  31. Choukan, R.; Taherkhani, T.; Ghanadha, M.R.; Khodarahmi, M. Evaluation of drought tolerance in grain maize inbred lines using drought tolerance indices. Iran. J. Agric. Sci 2006, 8, 79–89. [Google Scholar]
  32. Fischer, R.A.; Maurer, R. Drought resistance in spring wheat cultivars. I. Grain yield responses. Aust. J. Agric. Res. 1978, 29, 897–912. [Google Scholar] [CrossRef]
  33. Fernandez, G.C. Effective selection criteria for assessing stress tolerance. In Proceedings of the International Symposium on Adaptation of Vegetables and Other Food Crops in Temperature and Water Stress Tolerance, Asian Vegetable Research and Development Centre, Shanhua, Taiwan, 13–18 August 1992; pp. 257–270. [Google Scholar]
  34. Dembele, J.S.B.; Gano, B.; Vaksmann, M.; Kouressy, M.; Dembele, L.L.; Doumbia, M.; Teme, N.; Diouf, D.; Audebert, A. Response of eight sorghum varieties to plant density and nitrogen fertilization in the Sudano-Sahelian zone in Mali. Afr. J. Agric. Res. 2020, 16, 1401–1410. [Google Scholar] [CrossRef]
  35. Sarkar, B.; Varalaxmi, Y.; Vanaja, M.; RaviKumar, N.; Prabhakar, M.; Yadav, S.K.; Maheswari, M.; Singh, V.K. Mapping of QTLs for morphophysiological and yield traits under water-deficit stress and well-watered conditions in maize. Front. Plant Sci. 2023, 14, 1124619. [Google Scholar] [CrossRef]
  36. Chiulele, R.M.; Mwangi, G.; Tongoona, P.; Ehlers, J.D.; Ndeve, A.D. Assessment of cowpea genotypes for variability to drought tolerance. In Proceedings of the 10th African Crop Science Conference Proceedings, Maputo, Mozambique, 10–13 October 2011; pp. 531–537. [Google Scholar]
  37. Amelework, B.A.; Shimelis, H.A.; Tongoona, P.; Mengistu, F.; Laing, M.D.; Ayele, D.G. Sorghum production systems and constraints, and coping strategies under drought-prone agro-ecologies of Ethiopia. S. Afr. J. Plant Soil 2016, 33, 207–217. [Google Scholar] [CrossRef]
  38. Mofokeng, A.M.; Shimelis, H.A.; Laing, M.D. Agromorphological diversity of South African sorghum genotypes assessed through quantitative and qualitative phenotypic traits. S. Afr. J. Plant Soil 2017, 34, 361–370. [Google Scholar] [CrossRef]
  39. Sissoko, S. Marker Assisted Selection for Post-Flowering Drought Tolerance in Sorghum bicolor [L.] Moench. Ph.D. Thesis, University of Ghana, Legon, Accra, Ghana, 2015. [Google Scholar]
  40. Enyew, M.; Carlsson, A.S.; Geleta, M.; Tesfaye, K.; Hammenhag, C.; Seyoum, A.; Feyissa, T. Novel sources of drought tolerance in sorghum landraces revealed via the analyses of genotype-by-environment interactions. Front. Plant Sci. 2022, 13, 1062984. [Google Scholar] [CrossRef] [PubMed]
  41. Stanfield, W.D. Genetics; Mc Graw-Hill Inc.: New York, NY, USA, 1975; p. 281. [Google Scholar]
  42. Menezes, C.B.D.; Ticona-Benavente, C.A.; Tardin, F.D.; Cardoso, M.J.; Bastos, E.A.; Nogueira, D.W.; Portugal, A.F.; Santos, C.V.; Schaffert, R.E. Selection indices to identify drought-tolerant grain sorghum cultivars. Genet. Mol. Res. 2014, 13, 9817–9827. [Google Scholar] [CrossRef]
  43. Ladoui, K.K.; Mefti, M.; Benkherbache, N. Sélection de génotypes d’orge (Hordeum vulgare L.) tolérants au stress hydrique par les indices de tolérance à la sécherèsse. Agrobiologia 2020, 10, 1805–1812. [Google Scholar]
  44. Teklay, A.; Gurja, B.; Taye, T.; Gemechu, K. Selection efficiency of yield based drought tolerance indices to identify superior sorghum [Sorghum bicolor (L.) Moench] near isogenic lines (NILs) under two-contrasting environments. Afr. J. Agric. Res. 2020, 15, 379–392. [Google Scholar] [CrossRef]
Figure 1. Average daily temperature and relative humidity recorded during the lysimeter trial, with values further aggregated into 15-day averages.
Agronomy 15 01399 g001
Figure 2. Coefficients of correlation between the traits evaluated under water stress (WS). GLN = green leaf number, SL = stem length, HD = heading date, GW = grain weight per plant, GN = grain number per plant, BT = total biomass, HI = harvest index, WT = water transpired, and TE = transpiration efficiency. * = significant at the 0.05 probability level, ** = significant at the 0.01 probability level, and *** = significant at the 0.001 probability level.
Agronomy 15 01399 g002
Figure 3. Coefficients of correlation between the traits evaluated under the well-watered (WW) condition. GLN = green leaf number, SL = stem length, HD = heading date, GW = grain weight per plant, GN = grain number per plant, BT = total biomass, HI = harvest index, WT = water transpired, and TE = transpiration efficiency. * = significant at the 0.05 probability level, ** = significant at the 0.01 probability level, and *** = significant at the 0.001 probability level.
Agronomy 15 01399 g003
Figure 4. Coefficients of correlation between the traits evaluated under well-watered (WW) and water-stressed treatment. GLN = green leaf number, SL = stem length, HD = heading date, GW = grain weight per plant, GN = grain number per plant, BT = total biomass, HI = harvest index, WT = water transpired, and TE = transpiration efficiency. * = significant at the 0.05 probability level, ** = significant at the 0.01 probability level, *** = significant at the 0.001 probability level, and ns = no significant.
Agronomy 15 01399 g004
Figure 5. Principal component analysis (PCA biplot) with a combination of drought tolerance index and sorghum varieties under different water conditions (well-watered and water-stressed conditions). YS = grain yields under stress condition, YP = grain yields under well-watered condition, STI = stress tolerance index, TOL = tolerance index, MP = mean productivity, GMP = geometric mean productivity, RED = percentage reduction, SSI = stress susceptibility, Tews = transpiration efficiency under water stress, TEww = transpiration efficiency under well-watered condition, GLNws = green leaf number under water stress, and GLNww = green leaf number under well-watered condition.
Agronomy 15 01399 g005
Table 1. ANOVA of mean squares from across well-watered and stressed conditions for various traits of sorghum genotypes.
TraitWSWWG*E
MeanGENH2CV (%)MeanGENH2CV (%)
GLN3.0326.479 ***0.8858.606.7926.44 ***0,7934.697.1 ***
SL192.2611,899 ***0.917.90197.4112,861 ***0.9415.711101 ns
HD143.404461 ***0.986.25143.574807 ***0.978.04131.4 ns
GW10.49171.49 ***0.8350.8819.53370 ***0.8538.7354.9 ns
GN498.5331,525 ***0.7851.74863.16562839 ***0.7741.86119,644 ns
HI0.081275010.010210 ***0.7759.700.13054230.01727 ***0.7747.900.00425 **
BT136.663861 **0.3735.84157.835099 ***0.3935.193320 *
TE2.812.07 ***0.536.402.351.045 ***0.3634.711.135 *
WT44.95220 ***0.6818.6356.74111.9 ***0.6411.2348.6 ns
WS = water-stressed condition, WW = well-watered condition, GEN = genotypes, H2 = heritability, CV (%) = coefficient of variation, G*E = interaction between genotype and environment, GLN = green leaf number, SL = stem length, HD = heading date, GW = grain weight per plant, GN = grain number per plant, HI = harvest index, BT = total biomass, WT = total water transpired, and TE = transpiration efficiency. * = significant at the 0.05 probability level, ** = significant at the 0.01 probability level, *** = significant at the 0.001 probability level, and ns = nonsignificant.
Table 2. Effect of drought stress on the morphological, physiological, and agronomic traits, and drought tolerant indices of 50 sorghum varieties.
GENYSYPSTITOLMPGMPREDSSIGLNwsGLNwwTEwsTEww
Sepon8214.2547.051.7632.8030.6525.902.301.527.0010.332.053.09
PAYENNE27.7745.263.3017.4836.5235.450.630.843.257.003.565.06
ICSV 20605828.0743.483.2015.4135.7834.940.550.771.336.003.193.05
ICSV 21600830.5841.813.3511.2336.2035.760.370.583.009.003.311.97
SARIASO1428.4940.893.0512.4034.6934.130.440.663.508.002.633.32
Sariaso 1631.7040.693.388.9936.2035.920.280.484.6710.004.203.21
ICSV 21602012.3140.111.2927.7926.2122.222.261.516.2510.252.822.62
ICSV 20605919.5639.012.0019.4529.2927.620.991.080.006.335.072.23
ICSV 20605724.1338.432.4314.3131.2830.450.590.811.007.672.092.95
ICSV 104927.8637.562.749.7032.7132.350.350.564.509.003.942.52
ICSV 21611916.1637.471.5921.3126.8124.611.321.242.755.672.843.02
ICSV 18600221.6735.272.0013.6028.4727.650.630.846.009.004.783.42
216-2P4-5B16.8334.871.5418.0425.8524.231.071.122.756.753.081.76
ICSV 21609424.1334.052.159.9229.0928.660.410.632.335.752.561.56
SAMSORG 4114.0833.251.2319.1623.6721.641.361.258.5011.254.532.89
ICSV 20609115.7332.991.3617.2624.3622.781.101.140.004.251.982.51
ICSV 20602815.9132.771.3716.8624.3422.831.061.120.755.253.461.85
ICSB 29324.4232.262.077.8428.3428.070.320.534.507.255.632.78
ICSV 21607516.2732.111.3715.8324.1922.860.971.076.338.672.972.69
ICSV 21607426.1532.042.205.8929.1028.950.230.400.008.333.052.54
FAOUROU20.7932.041.7511.2526.4125.810.540.768.009.333.992.64
ICSV 146001624.8631.602.066.7428.2328.030.270.466.008.502.952.57
ICSV11117.8431.061.4513.2224.4523.540.740.927.0010.003.742.42
Seguifa16.2030.791.3114.5923.5022.330.901.035.339.503.043.38
Sureno18.9530.781.5311.8324.8724.150.620.847.0011.003.763.29
ICSV 146001121.0229.921.658.9025.4725.080.420.655.006.002.591.88
ICSV 146001019.0729.871.4910.8024.4723.870.570.793.759.003.294.00
ICSB 17600116.2529.331.2513.0822.7921.840.800.979.5011.002.722.41
015-SB-CS-F7-12714.6328.971.1114.3421.8020.590.981.080.008.002.092.20
ICSB 18600125.7228.891.953.1727.3027.260.120.244.677.752.502.39
SAMSORG 4023.6828.781.795.1026.2326.110.220.395.338.752.892.79
ICSV 18600821.7228.231.616.5224.9824.760.300.504.678.504.232.48
Niolagne12.6828.020.9315.3420.3518.851.211.197.338.251.622.81
016-SB-CS-DU-1713.1027.230.9414.1320.1718.891.081.135.338.752.062.20
ICSV 20608412.3526.970.8714.6119.6618.251.181.184.506.253.402.82
06-SB-F4DT-1520.9026.571.465.6723.7323.560.270.465.008.252.582.10
ICSB 17600316.0825.981.109.8921.0320.440.620.83- -3.313.63
ICSV 21600113.9425.430.9311.4919.6918.830.820.981.0015.252.642.67
ICSV 20603014.8924.180.949.2819.5418.980.620.8311.2515.503.292.44
IRAT20420.0623.161.223.1021.6121.560.150.294.506.254.712.68
ICSV 21607316.4022.770.986.3719.5919.320.390.619.5011.002.702.55
Niobougouma13.5222.420.798.9117.9717.410.660.862.753.503.022.67
447(471)49615.9722.390.946.4319.1818.910.400.626.339.503.592.65
019-SB-CS-F5-7119.9621.881.151.9220.9220.900.100.190.504.752.212.53
ICSV 20603215.7321.770.906.0318.7518.510.380.6011.5012.504.832.52
ICSV 21602416.4721.630.935.1519.0518.870.310.520.755.002.632.47
ICSV 20605615.9019.700.823.8017.8017.700.240.421.257.752.522.78
ICSB 17600612.0315.200.483.1613.6213.520.260.453.0010.753.013.38
SAMSORG 310.0613.790.363.7311.9311.780.370.598.008.002.232.01
ICSB 1760319.6313.170.333.5411.4011.260.370.581.2510.334.003.06
Tx70004.126.340.072.225.235.110.540.765.007.332.252.19
B 351.333.320.012.002.332.101.511.3110.5010.002.742.66
Overall Mean9.95200.6810.0614.9713.811.741.164.598.473.172.70
YS = grain yields under stress condition, YP = grain yields under well-watered condition, STI = stress tolerance index, TOL = tolerance index, MP = mean productivity, GMP = geometric mean productivity, RED = percentage reduction, SSI = stress susceptibility, GLNws = green leaf number under water stress, GLNww = green leaf number under well-watered condition, Tews = transpiration efficiency under water stress, and TEww = transpiration efficiency under well-watered condition.
Disclaimer/Publisher’s Note: The statements, opinions and data contained in all publications are solely those of the individual author(s) and contributor(s) and not of MDPI and/or the editor(s). MDPI and/or the editor(s) disclaim responsibility for any injury to people or property resulting from any ideas, methods, instructions or products referred to in the content.

