Article

Relationships Between Oat Phenotypes and UAV Multispectral Imagery Under Different Water Deficit Conditions by Structural Equation Modelling

1
Yinshanbeilu Grassland Eco-Hydrology National Observation and Research Station, China Institute of Water Resources and Hydropower Research, Beijing 100038, China
2
Farmland Irrigation Research Institute, Chinese Academy of Agricultural Sciences (CAAS), Xinxiang 453002, China
3
Institute of Water Resources for Pastoral Area Ministry of Water Resources, Hohhot 010020, China
4
Dancheng County Agricultural and Rural Bureau, Zhoukou 477150, China
5
Shandong Facility Horticulture Bioengineering Research Center, Weifang University of Science and Technology, Weifang 262700, China
*
Authors to whom correspondence should be addressed.
Agronomy 2025, 15(6), 1389; https://doi.org/10.3390/agronomy15061389
Submission received: 12 May 2025 / Revised: 29 May 2025 / Accepted: 4 June 2025 / Published: 5 June 2025
(This article belongs to the Special Issue Water and Fertilizer Regulation Theory and Technology in Crops)

Abstract

The prediction of soil moisture conditions using multispectral data from unmanned aerial vehicles (UAVs) has advantages over ground measurements in terms of costs and monitoring range. However, the prediction accuracy for moisture conditions using spectral data alone is low. In this study, relationships between water deficits and phenotypic characteristics in oats were evaluated and used to develop a UAV multispectral-based water prediction model. The vegetation indices NDRE (Normalized Difference Red Edge), CIG (Chlorophyll Index), and MCARI (Modified Chlorophyll Absorption in Reflectance Index) were highly correlated with oat yield. Based on a multipath analysis in the structural equation modeling framework, irrigation (p < 0.01), leaf area index (LAI) (p < 0.001), and SPAD (p < 0.001) had direct positive effects on NDRE. Three distinct machine learning approaches—linear regression (LR), random forest (RF), and artificial neural network (ANN) were employed to establish predictive models between the Normalized Difference Red Edge Index (NDRE) and soil water content (SWC). The linear regression model showed moderate correlation (R2 = 0.533). Machine learning approaches demonstrated markedly superior performance (RF: R2 = 0.828; ANN: R2 = 0.810). Nonlinear machine learning algorithms (RF and ANN) significantly outperform conventional linear regression in estimating SWC from spectral vegetation indices.

1. Introduction

As a drought-tolerant food and forage crop, oats are a typical crop in the agro-pastoral ecotone of northern China [1]. Water resources are scarce in this region, and soil water deficits affect crop growth and development and directly impact crop yield and quality [2]. Therefore, precise agricultural management through modern technological means is particularly important for monitoring crop growth [3,4,5] and optimizing water resource use [6,7].
Water deficiency affects crop growth rates and phenotypic traits by altering leaf morphology, photosynthetic efficiency, and physiological metabolism [8]. Under mild water stress, crops can maintain their growth by adjusting stomatal conductance and root distribution, whereas under severe stress, they exhibit responses such as reduced plant height (PH), leaf curling, and decreased biomass [9]. Yang et al. [10] found that under water deficit conditions, the leaf area index (LAI) and photosynthetic efficiency of wheat and maize decrease substantially; furthermore, the inhibitory effect of water stress on wheat is significantly higher than that on maize. Similar studies of rice [11], cotton [12], and peanuts [13] have shown that water deficiency leads to leaf wilting, which affects the LAI and vegetation indices.
Recently, remote sensing technology and unmanned aerial vehicle (UAV) multispectral imagery have provided new perspectives for water management and crop growth monitoring. In particular, UAV remote sensing technology has been widely used for crop growth monitoring and soil moisture prediction owing to its low cost, high efficiency, and high spatial resolution. UAV multispectral imagery captures spectral reflectance in the visible, near-infrared, and Red Edge bands. Key vegetation indices including the Normalized Difference Vegetation Index (NDVI), Normalized Difference Red Edge Index (NDRE), and Optimized Soil-Adjusted Vegetation Index (OSAVI), along with thermal infrared-derived Normalized Relative Canopy Temperature (NRCT), enable rapid and accurate assessment of crop phenotypic parameters such as plant height, leaf area index, and chlorophyll content [14,15,16,17,18]. Marques et al. [19] demonstrated that the Crop Water Stress Index (CWSI) exhibits strong predictive capability for key plant water status indicators, including relative water content, midday leaf water potential, and stomatal conductance. Their work further identified the Modified Chlorophyll Absorption Reflectance Index (MCARI) as the most robust indicator for chlorophyll b quantification. Silva et al. [20] employed vegetation indices to characterize coffee tree phenotypes under varying irrigation regimes; their analysis revealed significant positive correlations (p < 0.01) between photosynthetic/transpiration rates and multiple indices (NDVI, OSAVI, MCARI, NDRE, and Green Difference Vegetation Index (GDVI)), highlighting the utility of spectral vegetation indices for water management optimization in perennial crops.
The research on oats using remote sensing technology mainly focuses on the estimation of indicators such as phenological period, surface biomass, chlorophyll content, and yield. Romero et al. [21] used vegetation indices to predict oat heading and harvest dates, Zhang et al. [17] estimated oat aboveground biomass in different planting systems using UAV vegetation indices, and Bytyqi et al. [22] studied the differences in LAI, SPAD, and Normalized Difference Vegetation Index (NDVI) among different oat varieties. Significant correlations have been found between remote sensing data and oat biomass, LAI, and chlorophyll contents [23]. The quantitative relationships between oat phenotypic characteristics and UAV imagery data under different water deficit levels remain unclear. Traditional statistical methods can reveal certain correlations; however, their analytical capabilities are often limited by the complexity and multidimensionality of the data. Structural equation modeling (SEM), a statistical method that combines factor analysis and path analysis, can effectively handle complex relationships among multiple variables, providing a scientific analytical framework for studying the impact of water deficit on crop phenotypes and multispectral imagery characteristics [24]. Recently, SEM has been applied in agriculture to study interactions within the soil–crop–climate system. For example, Zeng et al. [25] used SEM to analyze the effects of different nitrogen management practices on maize photosynthetic products and yield. Tian et al. [26] used SEM to analyze the relationship between pumpkin leaf growth, photosynthesis, yield, and water–fertilizer coupling.
Therefore, this study intends to adopt the SEM path analysis to screen out the vegetation index that has a direct effect on both the phenotype of oats and soil moisture, and reveal the quantitative relationship between the vegetation index and soil moisture content. The linear regression (LM) algorithm is most commonly used for quantitatively estimating crop yields and soil water content [18]. However, it usually has limitations in dealing with nonlinear relationships between response variables and predictor variables. There are machine learning algorithms such as random forests (RFs) and artificial neural network (ANN) regression models that can overcome this limitation and provide better predictions for soil moisture content and crop yields [7,17]. In this study, using oats as a research subject, different water deficit gradients combined with UAV multispectral imagery monitoring technology were applied to (1) explore changes in PH, LAI, SPAD, and oat yield under different water deficit conditions; (2) identify key spectral indices and phenotypic parameters sensitive to water stress using correlation analyses and SEM; (3) construct a UAV multispectral-based water prediction model based on the path analysis results. The high-precision predictive model can guide field irrigation and provide a theoretical basis for water monitoring and management in agro-pastoral ecotones.

2. Materials and Methods

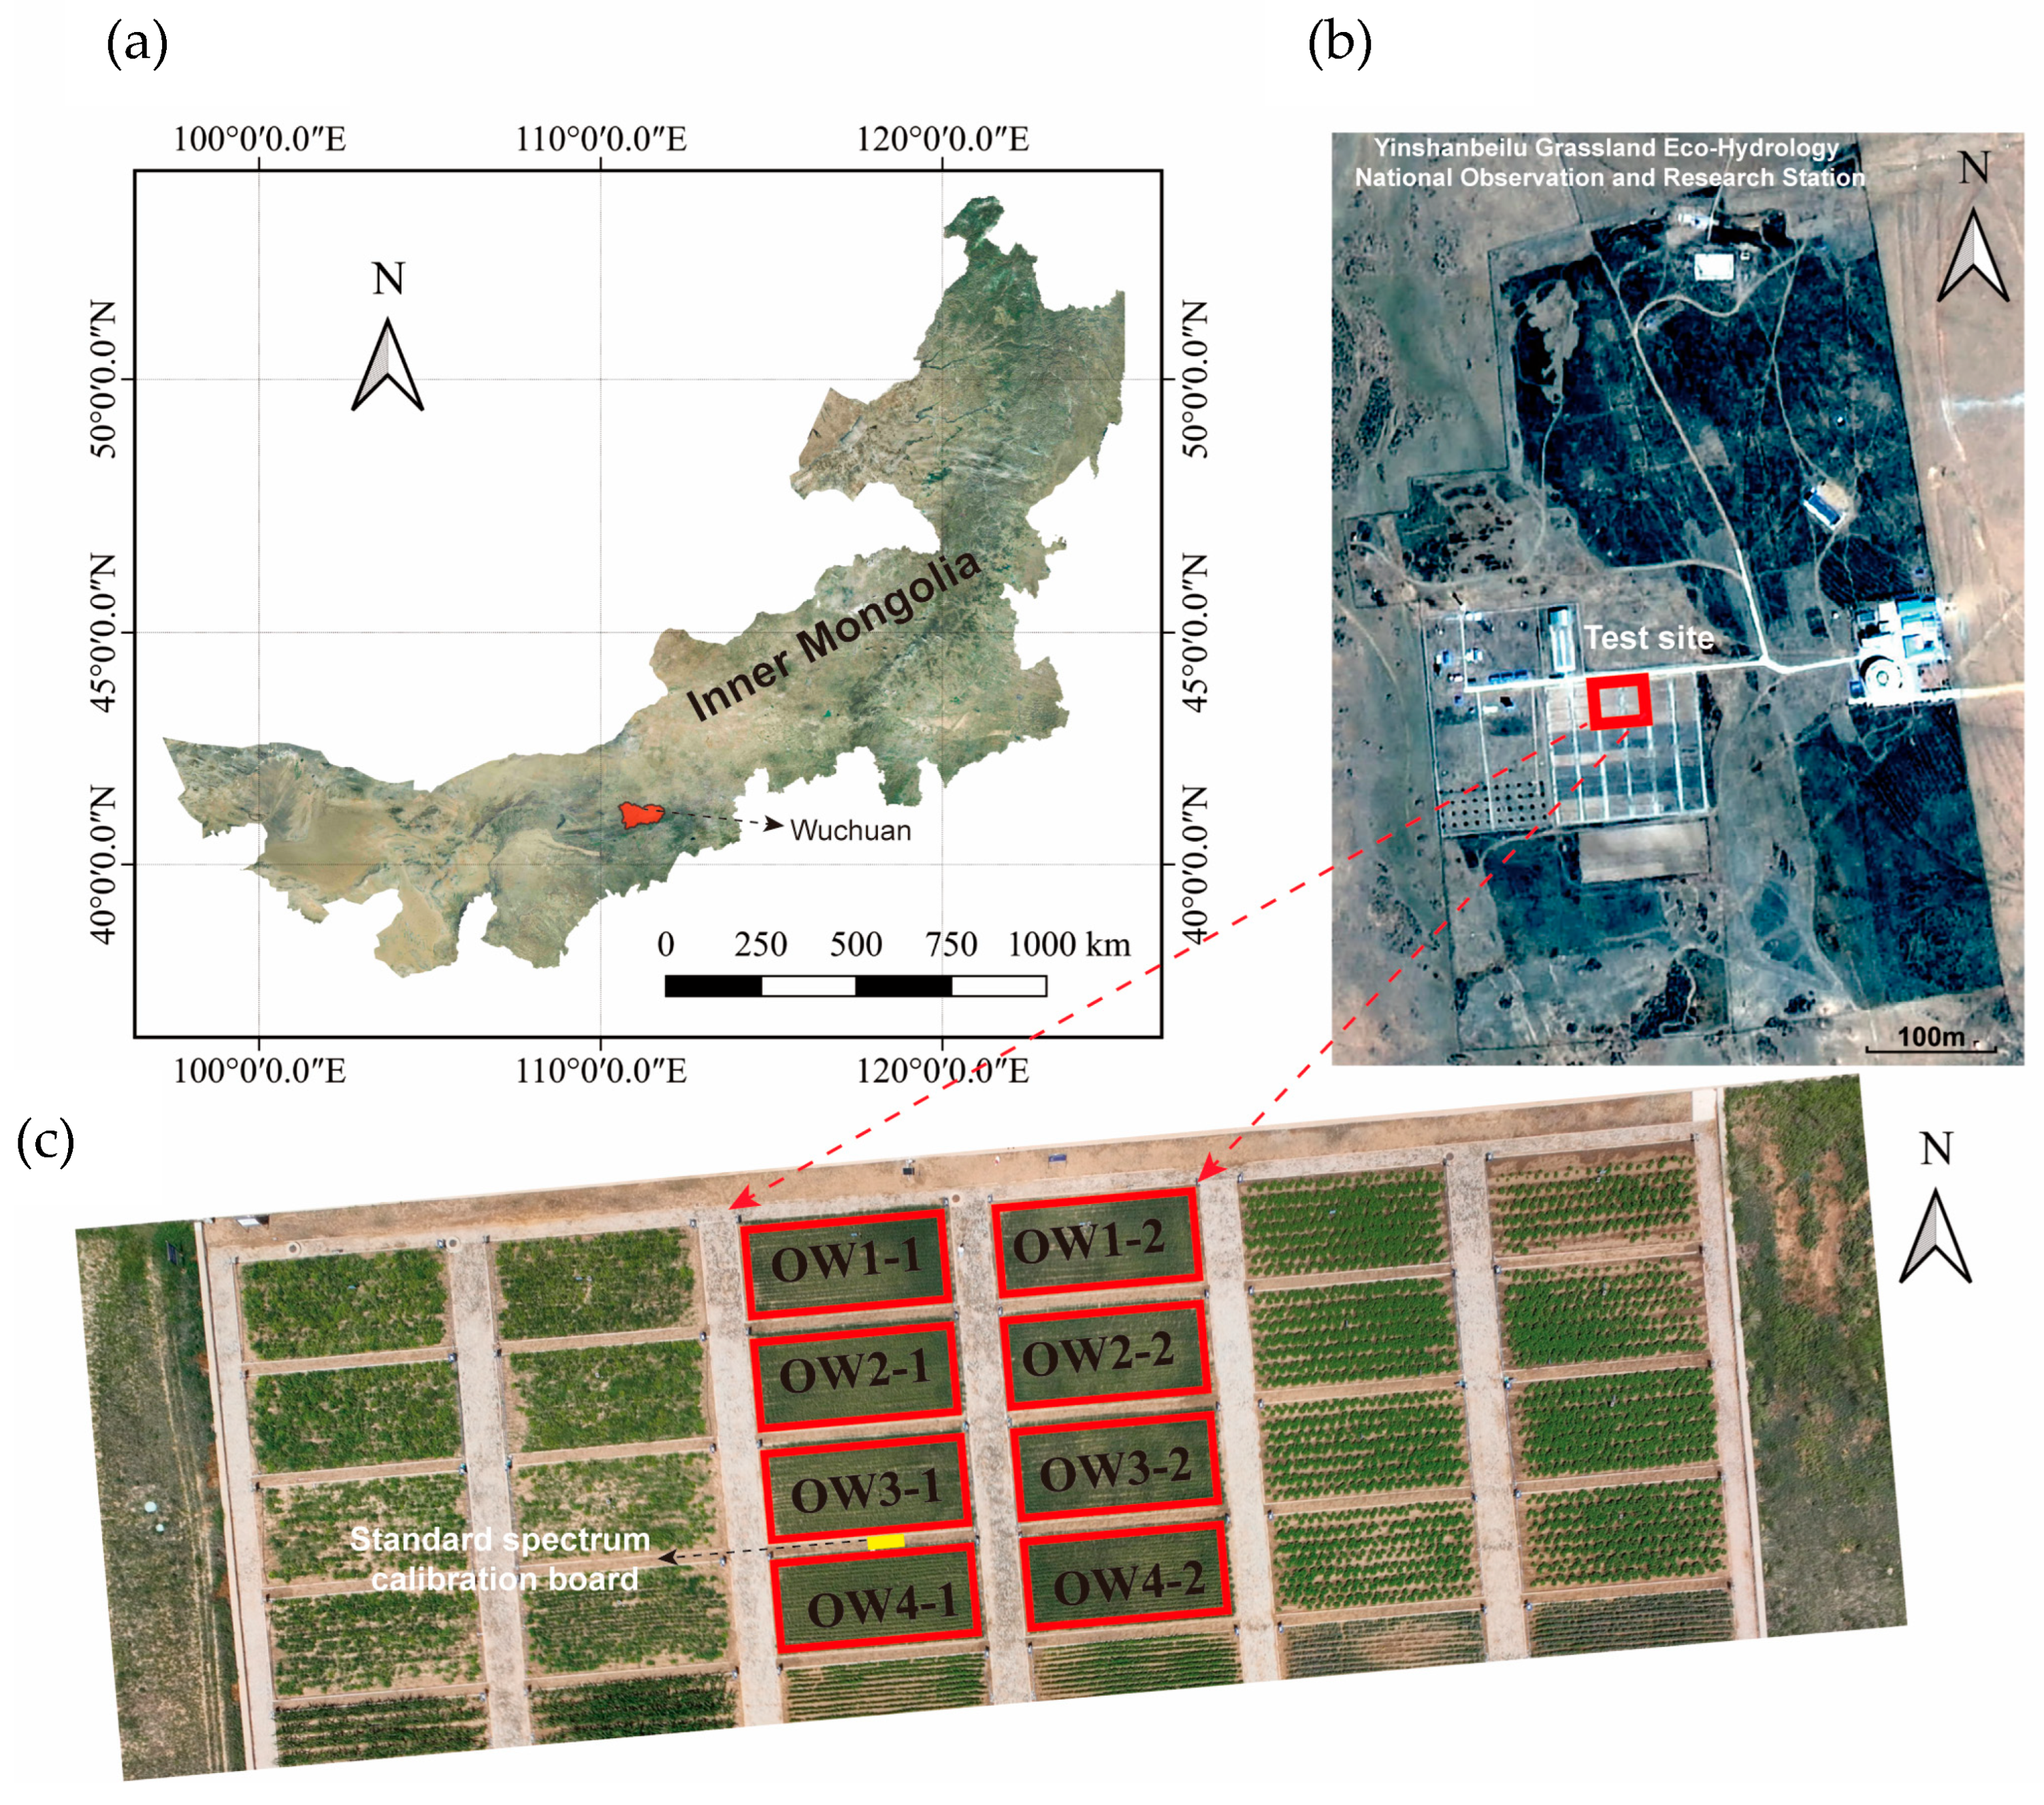
2.1. Overview of the Study Area

The research area was located at the Yinshanbeilu Grassland Eco-Hydrology National Observation and Research Station in Xilamuren Town, Damaoqi, Baotou, Inner Mongolia (41°21′10″ N, 111°12′58″ E). This area is in the transitional zone from the Yinshan Mountains to the Mongolian Plateau and serves as a climatic transition from a semi-arid to arid region (Figure 1). The climate in the research area is classified as a temperate continental monsoon climate, with an average annual rainfall of 306 mm, average annual temperature of 3.8 °C, average annual sunshine duration of 3200 h, and average annual wind speed of 4.5 m/s. The frost-free period lasts for approximately 90 d. The predominant soil type in the research area is chestnut soil, with a bulk density ranging from 1.5 to 1.7 g/cm3. The main crops grown in the area include oats, potatoes, and sunflowers. Agricultural irrigation relies on groundwater.

2.2. Experimental Design

The oat variety used in this study was Mengyan No. 1. The following four treatments were established: OW1 (full irrigation, with soil moisture maintained between 70% and 90% of the field capacity), OW2 (light deficit irrigation, with soil moisture maintained between 65% and 85% of the field capacity), OW3 (moderate deficit irrigation, with soil moisture maintained between 60% and 80% of the field capacity), and OW4 (severe deficit irrigation, with soil moisture maintained between 55% and 75% of the field capacity). Each treatment had one replicate, resulting in eight experimental plots. Each plot measured 8 m by 17 m. The oats were sown at a depth of 3 cm, with a row spacing of 30 cm between adjacent rows and a planting density of 3,001,500 plants per hectare. Irrigation was conducted using a surface drip irrigation system with one drip tape that controlled the two rows of oats. The spacing between adjacent drip tapes was 60 cm. The actual amount of irrigation for each treatment is listed in Table 1. Fertilization was performed by broadcasting. A base fertilizer of 525 kg/ha was applied and top-dressing was applied twice, with 150 kg/ha applied after rainfall in early July (jointing stage) and early August (grain-filling stage). The sowing dates were 1 June 2023 and 28 May 2024, with harvest dates of 20 September 2023 and 23 September 2024.

2.3. Observation Indicators and Methods

2.3.1. Physical Properties of Soil

Before sowing, soil samples were collected and brought back to the laboratory to analyze the soil nutrient content and basic physical parameters of various soil layers. The soil type of the experimental field was determined to be sandy loam using a laser particle size analyzer (BT-9300H; Dandong Baxter Instrument Co., Ltd., Dandong, China). Soil bulk density was measured using the ring knife method, and soil field capacity was determined using a pressure membrane apparatus (1600F1; Europe and America Geodetic Instrument Equipment China Co., Ltd., Hong Kong, China). The specific physical and chemical properties of the soil are listed in Table 2.

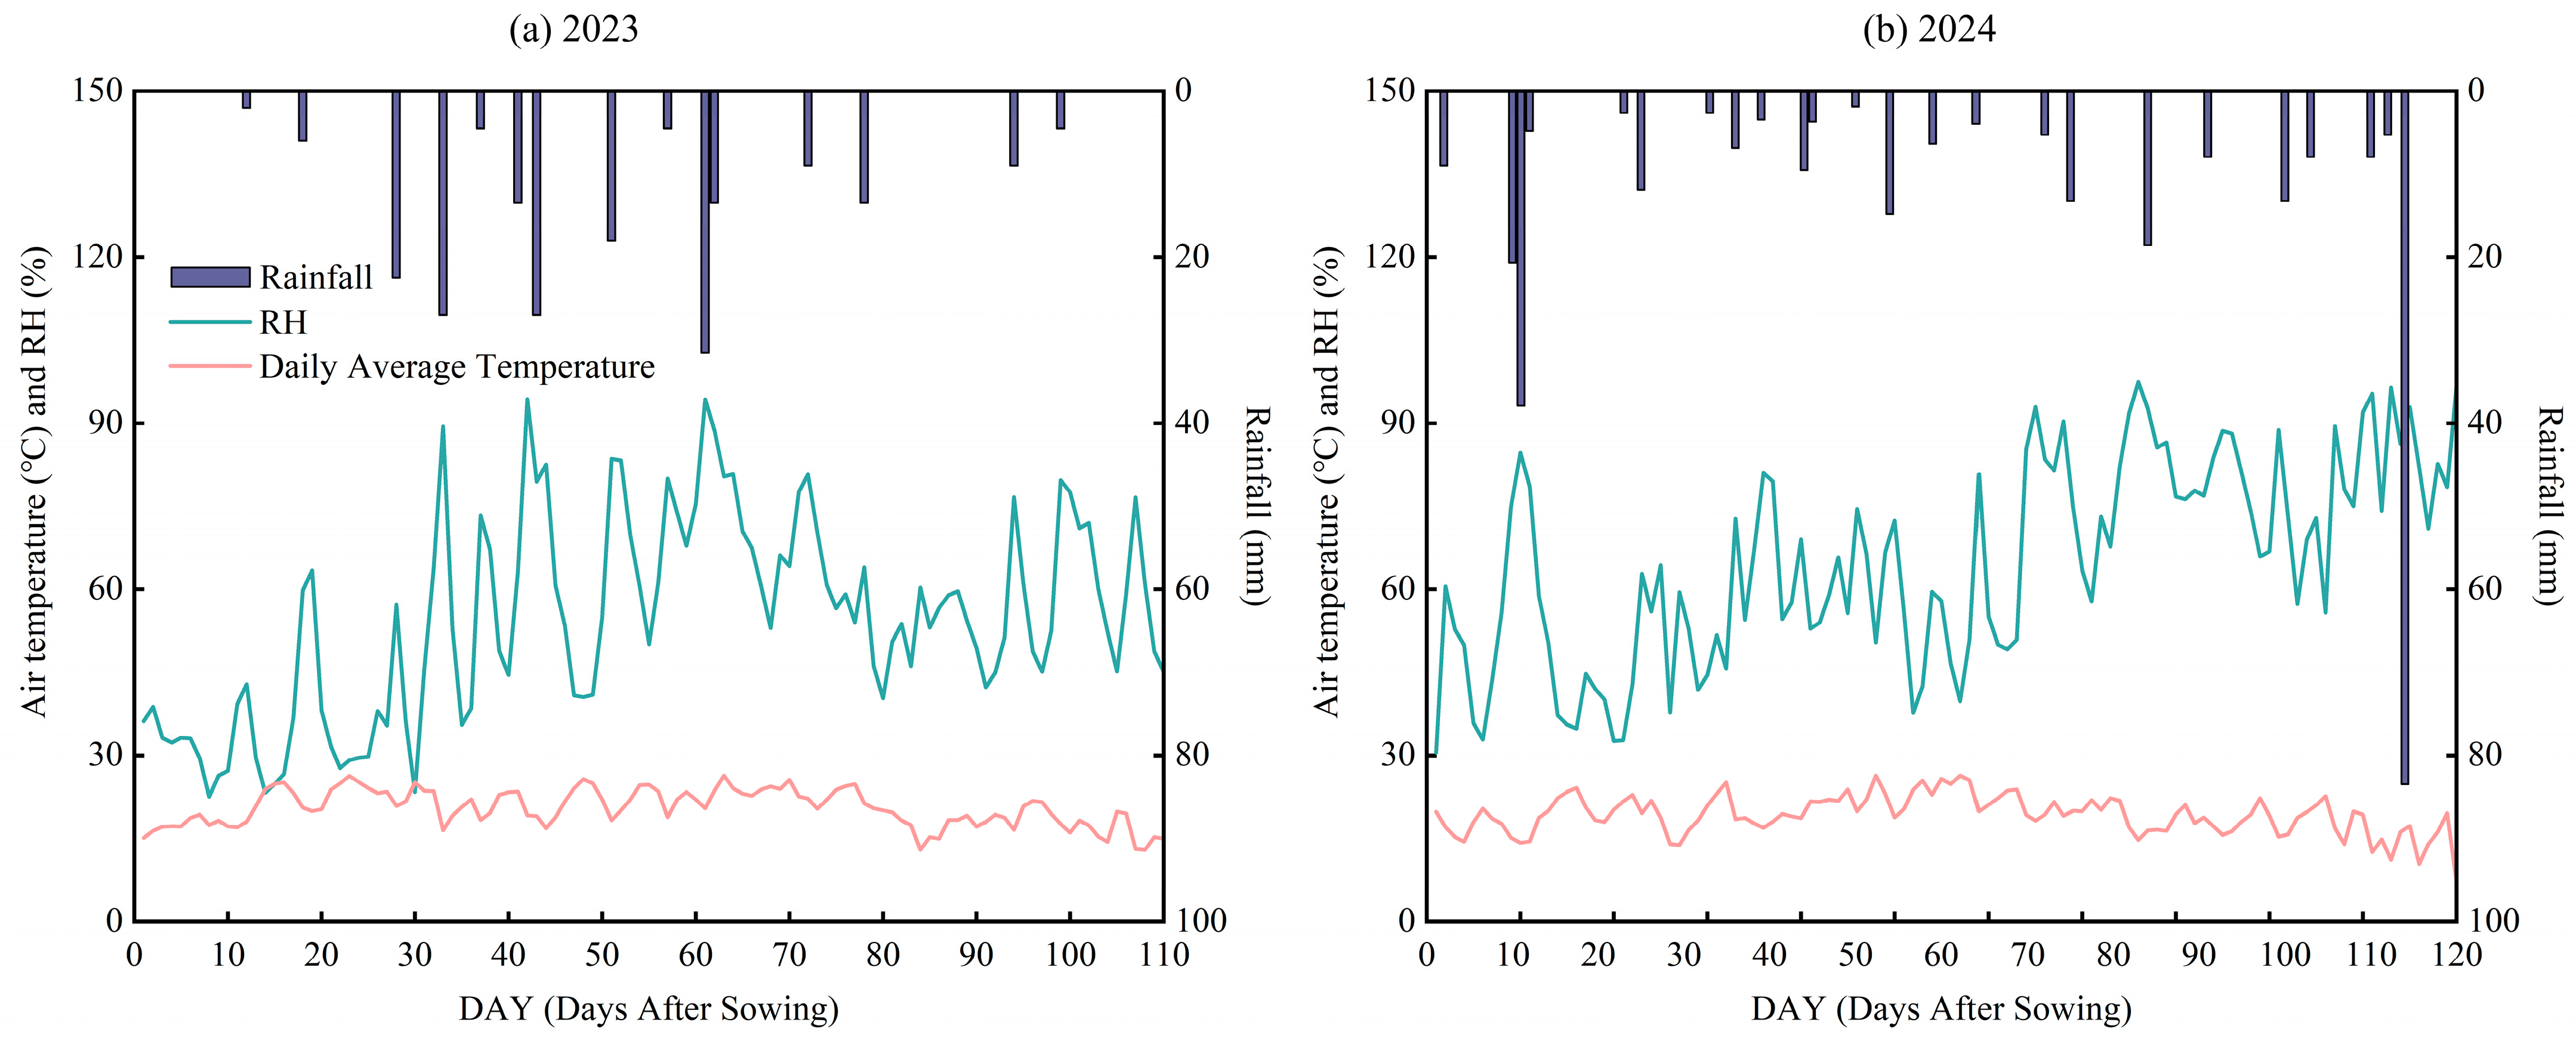
2.3.2. Meteorological Data

Meteorological data were automatically collected at the experimental station using a weather station (HOBO-U30, Onset Computer Corporation, Bourne, MA, USA). The daily average temperature, relative humidity, and rainfall during the crop growth period are shown in Figure 2. During the 2023 and 2024 growing seasons, the total rainfall values were 210.4 mm and 303.1 mm, respectively.

2.3.3. Soil Water Content

After sowing, automatic soil moisture collectors (NG-ZC-05; Farmland Irrigation Research Institute, Chinese Academy of Agricultural Sciences, Xinxiang, China) were installed between the oat rows in the middle of each plot to measure the soil moisture content (volumetric water content, %). Moisture sensors were installed at depths of 10, 30, and 50 cm below the surface, with data collection intervals of 2 h. The collectors were calibrated and validated using the oven-drying method during the critical growth stages after installation.

2.3.4. Multispectral Data Collection and Processing

Multispectral measurements were conducted using a DJI Mavic 3M drone (Shenzhen DJI Innovations Co., Ltd., Shenzhen, China), equipped with four 2.8-inch CMOS image sensors for the following bands: green (G) at 560 ± 16 nm, red (R) at 650 ± 16 nm, Red Edge (RE) at 730 ± 16 nm, and near-infrared (NIR) at 860 ± 26 nm. Spectral measurements were taken during the booting and grain-filling stages, selecting calm and sunny midday periods (11:00–14:00) for data collection. During the measurements, 100%, 75%, and 50% standard spectral calibration panels were placed at the center of the experimental plots. The drones were flown at a fixed altitude of 50 m.
The original images of each band taken by DJI Mavic 3M need to undergo image registration and spectral correction before the spectral index can be accurately calculated. We used AutoCAD 2021 to insert registration control points for each band image, and used Matlab 2023b software to extract the initial reflectance of the test area and calculate each spectral index. Multispectral images include bands such as green (G), red (R), Red Edge (RE), and near-infrared (NIR). Firstly, NIR is selected as the reference image. Fifty corresponding control points are, respectively, selected on the images to be registered R, RE, and G. The geometric deformation of the images is corrected through the Affine transformation model to align the multispectral images spatially. The registered images are saved for subsequent analysis and processing. Then, the spectral parameters are corrected through three standard spectral calibration plates captured by unmanned aerial vehicles. Then, based on the threshold difference in the reflection spectra between the soil and the vegetation, 20 sampling areas (20 × 20 pixels) were randomly selected for each treatment. The influence of the soil background on the spectral information was removed through the Normalized Difference Vegetation Index (NDVI). The mean value is calculated after eliminating the non-crop pixels in each sampling area. Finally, the vegetation index can be calculated based on these initial reflectance values.

2.3.5. Vegetation Index Calculation

The Normalized Difference Vegetation Index (NDVI), developed by Rouse et al. [27], remains one of the most widely used spectral indices for vegetation monitoring.
NDVI = ((NIR − R)/(NIR + R))
Recognizing that wavelengths within the Red Edge spectral region (between the red and near-infrared bands) exhibit strong sensitivity to vegetation health, researchers later proposed the Normalized Difference Red Edge Index (NDRE) [28].
NDRE = (NIR − RE)/(NIR + RE)
For enhanced detection of dense vegetation, Gitelson et al. [29] introduced the Chlorophyll Index Green (CIG) based on green-band reflectance, followed by the Green Normalized Difference Vegetation Index (GNDVI) developed by Gitelson and Merzlyak [30] in 1997.
CIG = (NIR/G) − 1
GNDVI = (NIR − G)/(NIR + G)
Further advancements in chlorophyll-sensitive indices led to the development of the Modified Chlorophyll Absorption in Reflectance Index (MCARI) by Daughtry et al. [31] and the Transformed Chlorophyll Absorption in Reflectance Index (TCARI) by Haboudane et al. [32].
MCARI = [(RE − R) − 0.2(RE − G)] (RE/R)
TCARI = 3[(RE − R) − 0.2(RE − G) (RE/R)]
To mitigate soil background interference, Huete (1988) [33] pioneered the Soil-Adjusted Vegetation Index (SAVI), which was later optimized through various modifications, culminating in the Modified Soil-Adjusted Vegetation Index (MSAVI) [34].
SAVI = (NIR − R)/(NIR + R + 0.5) × (1 + 0.5)
MSAVI = 1/2 × {2NIR + 1 − sqrt[(2NIR + 1)2 − 8 (NIR − R)]}

2.3.6. Oat Growth Index

Sowing date, emergence time, key growth stage, and harvest time were recorded. Every 10 days after sowing, 20 oat plants were randomly selected from each plot to measure the PH and LAI [35].
To measure SPAD, the SPAD-502 Plus (Konica Minolta, Tokyo, Japan) was used for rapid, nondestructive measurement of the relative chlorophyll content of each leaf. Twenty intact oat leaves were selected from each experimental plot on the same days as multispectral data collection. The upper, middle, and lower parts of each leaf were measured, and the average value was used as the SPAD value for that leaf.
For yield measurement, after oats matured, five 1 m2 quadrats were randomly selected from each plot. The oats were hand-harvested, threshed, bagged, and labeled. The samples were brought back to the laboratory and air-dried, and the seed weight was determined to calculate the oat yield.

2.4. Model Construction and Data Analysis

2.4.1. Structural Equation Model (SEM)

A path analysis model was constructed based on a SEM to examine the relationships between oat phenotypes and vegetation indices under different water deficit conditions. The accuracy of the SEM was evaluated using three indicators: chi-square to degrees of freedom ratio (CMIN/df, with values less than 3 being acceptable), Goodness-of-Fit Index (GFI, with an ideal value greater than 0.90 and values closer to 1 being better), and Root Mean Square Error of Approximation (RMSEA, with values close to 0 indicating a good fit).

2.4.2. Machine Learning Models

Three widely used machine learning methods were adopted. Linear regression (LM) is often used in predictive analysis. It predicts the outcomes of various types of variables by showing the linear relationship between one or more independent variables and the dependent variable. Random forest (RF) is a supervised learning algorithm that can be used for regression and classification problems [36]. Artificial neural network (ANN) is a digital model of the human brain, and computer programs have been designed to simulate the way the human brain processes information [37]. In this study, the above three methods were adopted to process the multispectral vegetation index (VI) and soil moisture data of unmanned aerial vehicles. The dataset is divided into a training set and a validation set. Among them, the experimental data from 2023 is used for the training process, and the experimental data from 2024 is used for model validation. The determination coefficient (R2) and root mean square error (RMSE) were calculated to evaluate the model.

2.4.3. Data Statistical Analysis

Statistical analyses were performed using Excel 2016 and SPSS statistical software (version 20.0; IBM, Armonk, NY, USA). The structural equation model was analyzed using Amos 28.0 software (Amos Development Corporation, Chicago, IL, USA). Graphs were generated using Origin 2024 (OriginLab, Northampton, MA, USA) and Adobe Illustrator 2020 (Adobe Inc., San Jose, CA, USA).

2.5. UAV Data Workflows for SWC: From Image Acquisition to Model Evaluation

The methodology implemented in this study is structured into three phases, as illustrated in Figure 3:
(1)
Quantify the physiological and agronomic responses of oat crops to water deficit conditions by systematically monitoring temporal variations in plant height (PH), leaf area index (LAI), soil–plant analysis development (SPAD) values, and ultimate grain yield across differential irrigation regimes.
(2)
Through the comprehensive correlation analysis of vegetation index and physiological parameters and the structural equation model (SEM), clarify the causal relationship and the relative contribution of key variables.
(3)
Develop and validate a UAV-based multispectral water stress prediction model by establishing robust transfer functions between remote sensing data and field-measured water status indicators.

3. Results

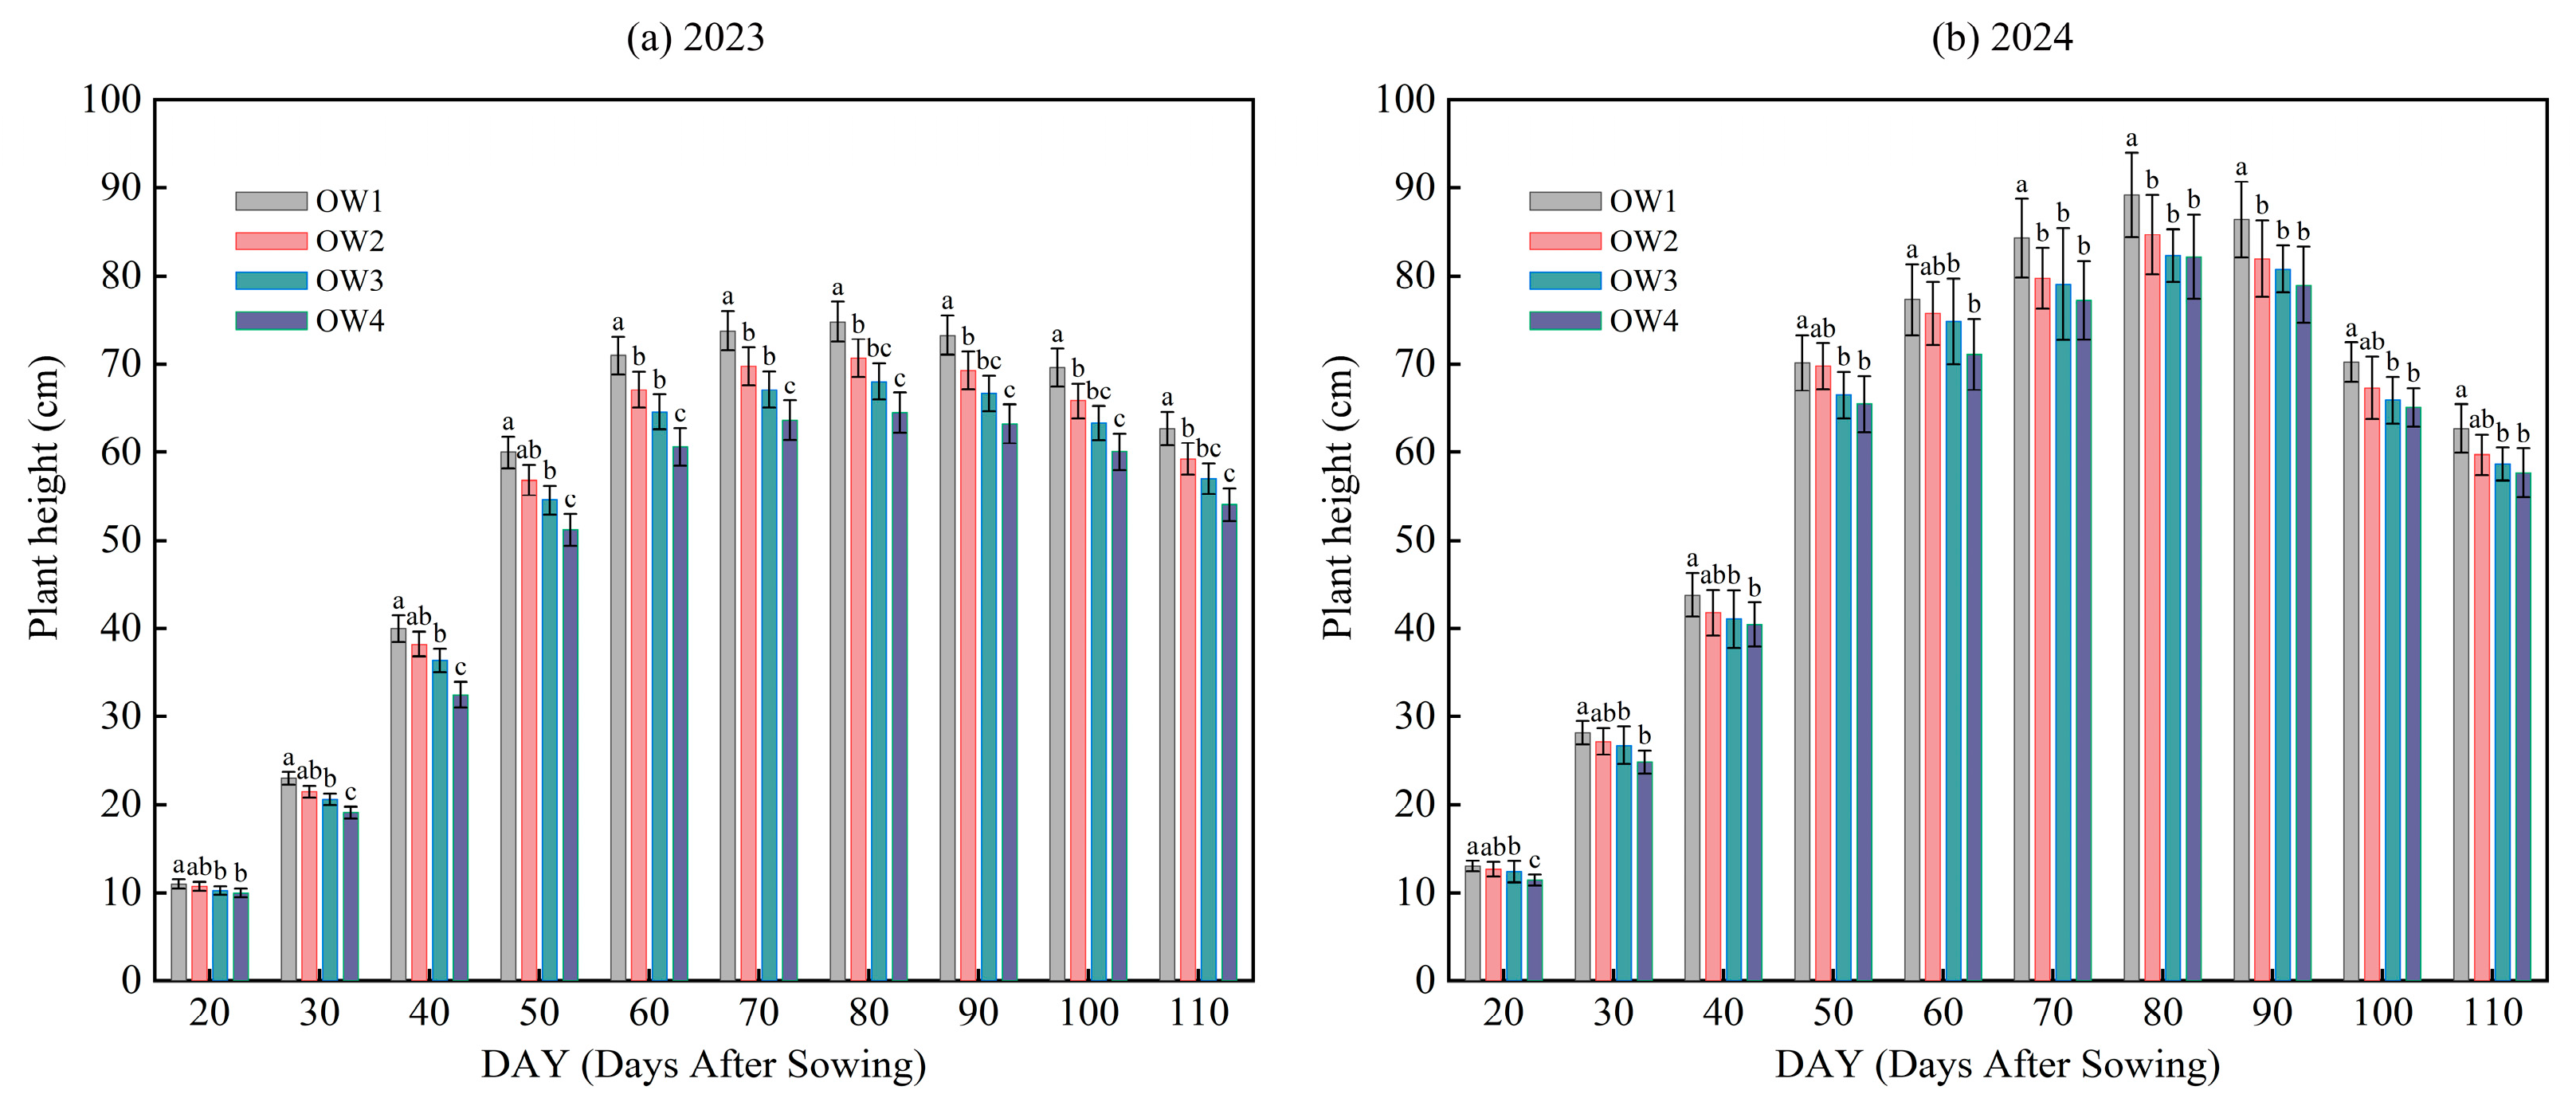
3.1. Effects of Different Water Deficit Conditions on Plant Height

As shown in Figure 4, PH increased initially and then decreased with oat growth. After the jointing stage, oats began to grow rapidly, reaching their maximum height during the grain-filling stage, after which PH decreased gradually. Overall, PH under the different water deficit treatments in 2023 and 2024 decreased in the order of OW1 > OW2 > OW3 > OW4. However, in 2024, PH in the middle and late growth stages were significantly higher than those in 2023 (p < 0.05), with OW1, OW2, OW3, and OW4 PH increasing by 10.58%, 11.89%, 13.52%, and 15.16%, respectively. As the degree of water deficit increased, PH increased. The rainfall and soil moisture content increased after mid-July 2024, with no additional irrigation in the later stages, resulting in negligible differences in the soil moisture content among treatments. Although the PH of OW1, which received sufficient irrigation early, remained significantly higher than those for the water deficit treatments, the differences in PH between OW2, OW3, and OW4 diminished over time and were not significant (p > 0.05). There were significant differences in PH under varying degrees of water deficit (p < 0.05). Sufficient water in later growth stages can reduce these differences; however, an early water deficit still has an impact on oat PH.

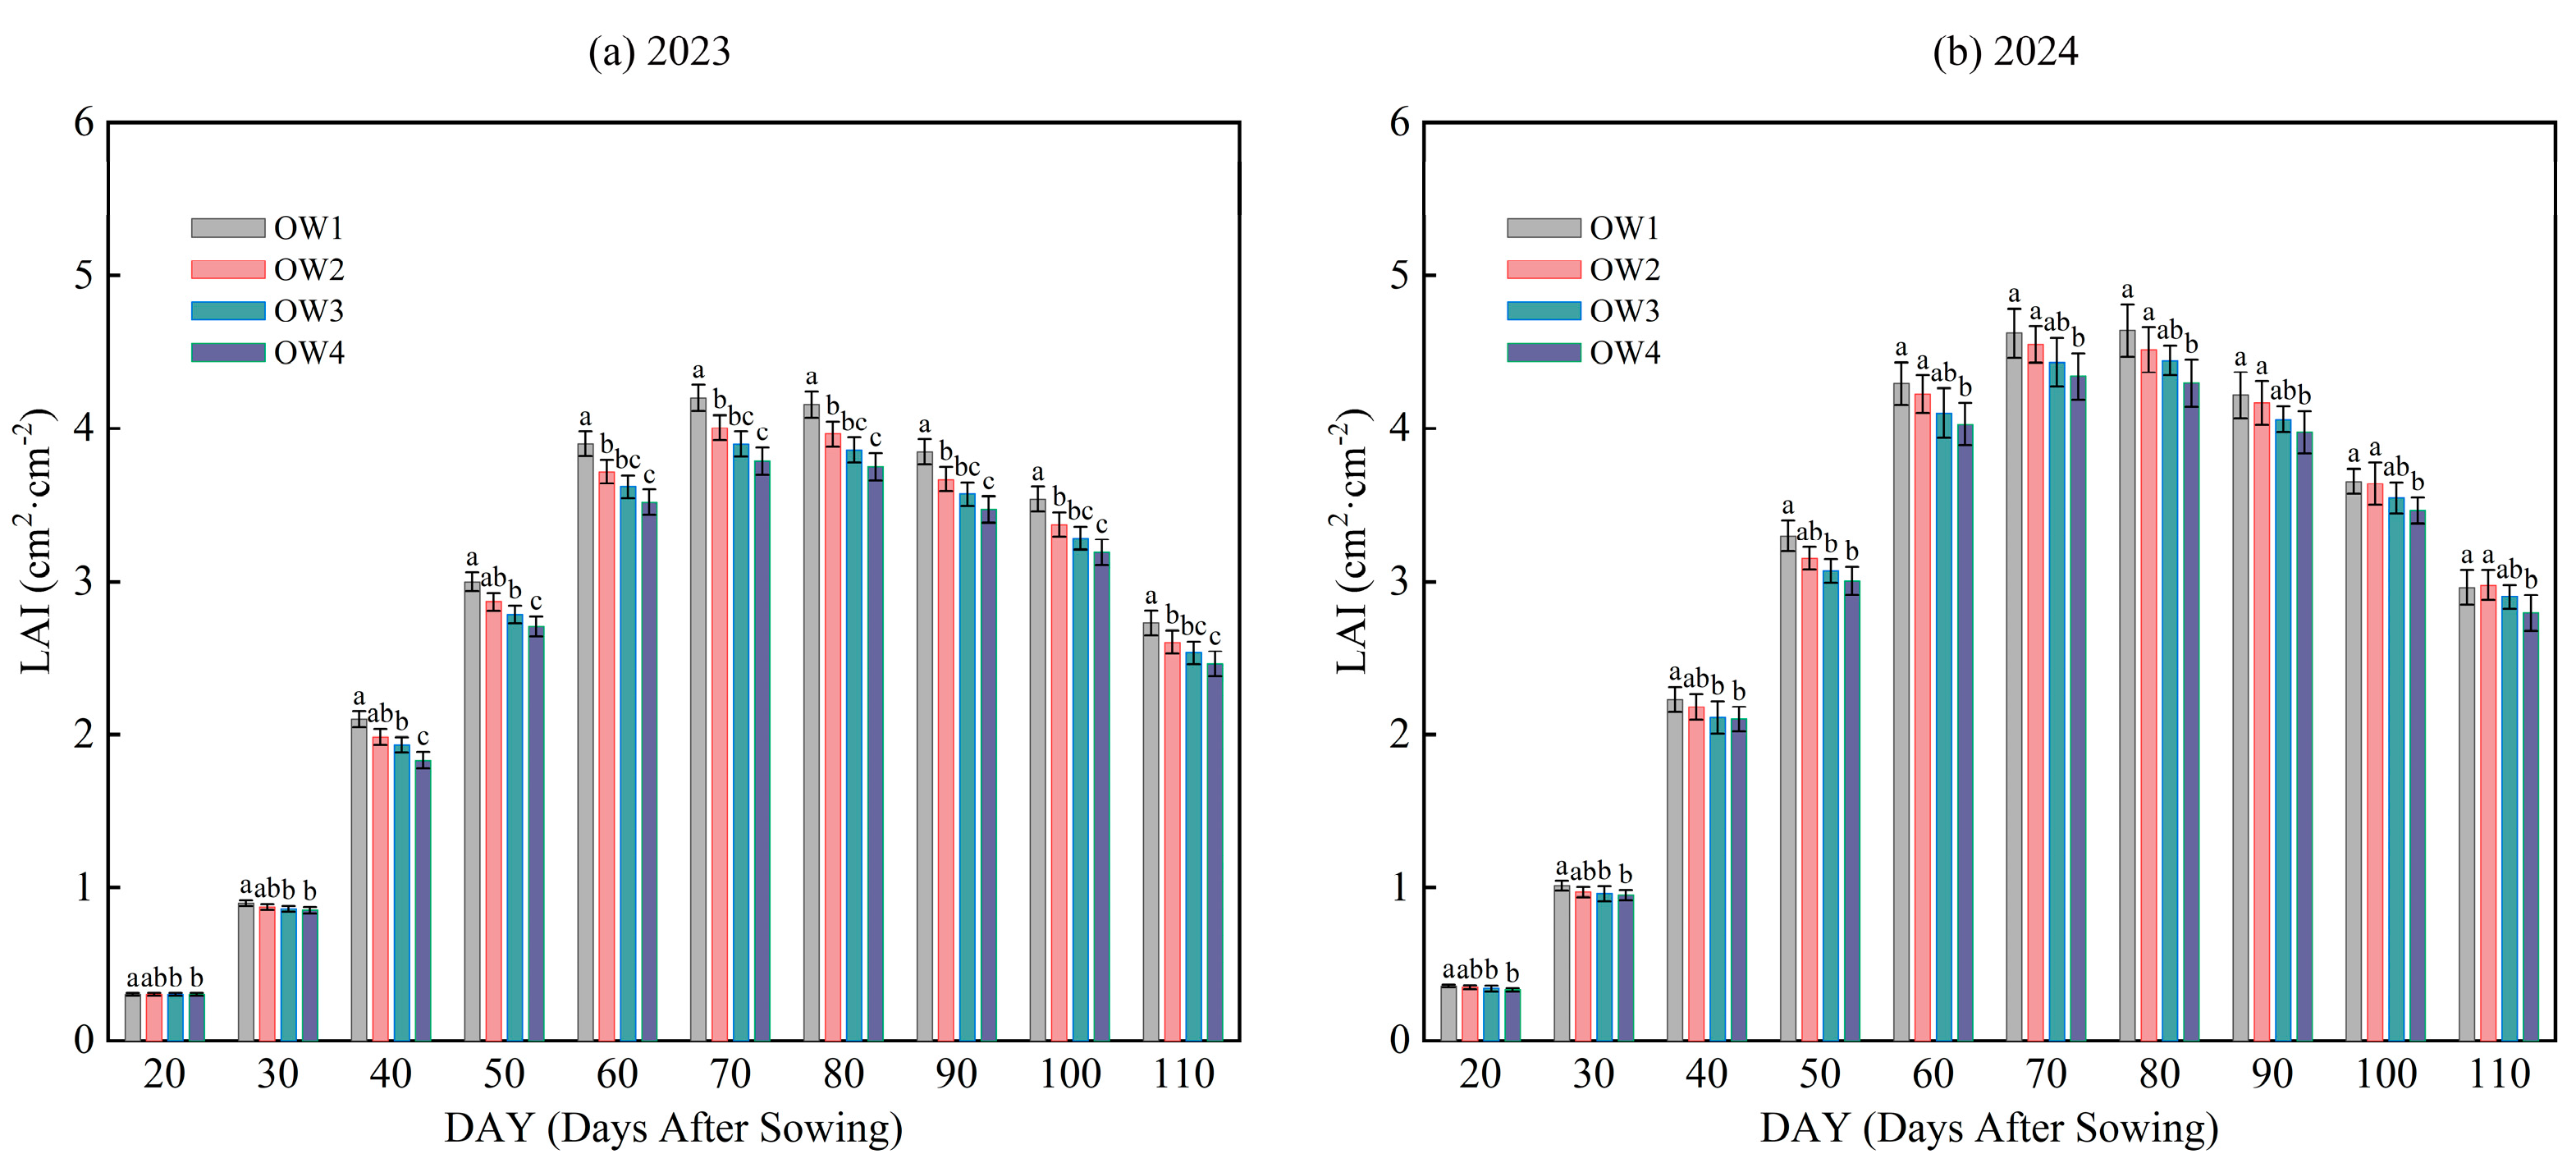
3.2. Effects of Different Water Deficit Conditions on Leaf Area Index

During oat growth, the LAI increased initially and then decreased, reaching its peak during the heading stage (Figure 5). Oat growth is fastest from the jointing to the heading stage, with increases in both the number and size of leaves. The LAI continued to increase until it stabilized at its peak during the heading stage. After entering the grain-filling stage, the leaves begin to wither from the bottom as they transport organic matter to the grains, resulting in a gradual decrease in the LAI. Overall, the leaf area index under different water deficit treatments in 2023 and 2024 followed the order OW1 > OW2 > OW3 > OW4. During the seedling and jointing stages, the fully irrigated OW1 treatment had a significantly higher LAI than those in the other water-deficit treatments, whereas the differences among OW2, OW3, and OW4 were not significant. During the heading and grain-filling stages, the differences among treatments increased gradually in 2023. However, in 2024, the differences among OW1, OW2, and OW3 were not significant, with slightly higher LAI values for OW3 than for OW4 (p > 0.05). It is evident that the water deficit had a relatively small impact on the LAI during the seedling and jointing stages. In the middle and late growth stages, different levels of water deficit led to significant differences in LAI, whereas sufficient water reduced these differences significantly.

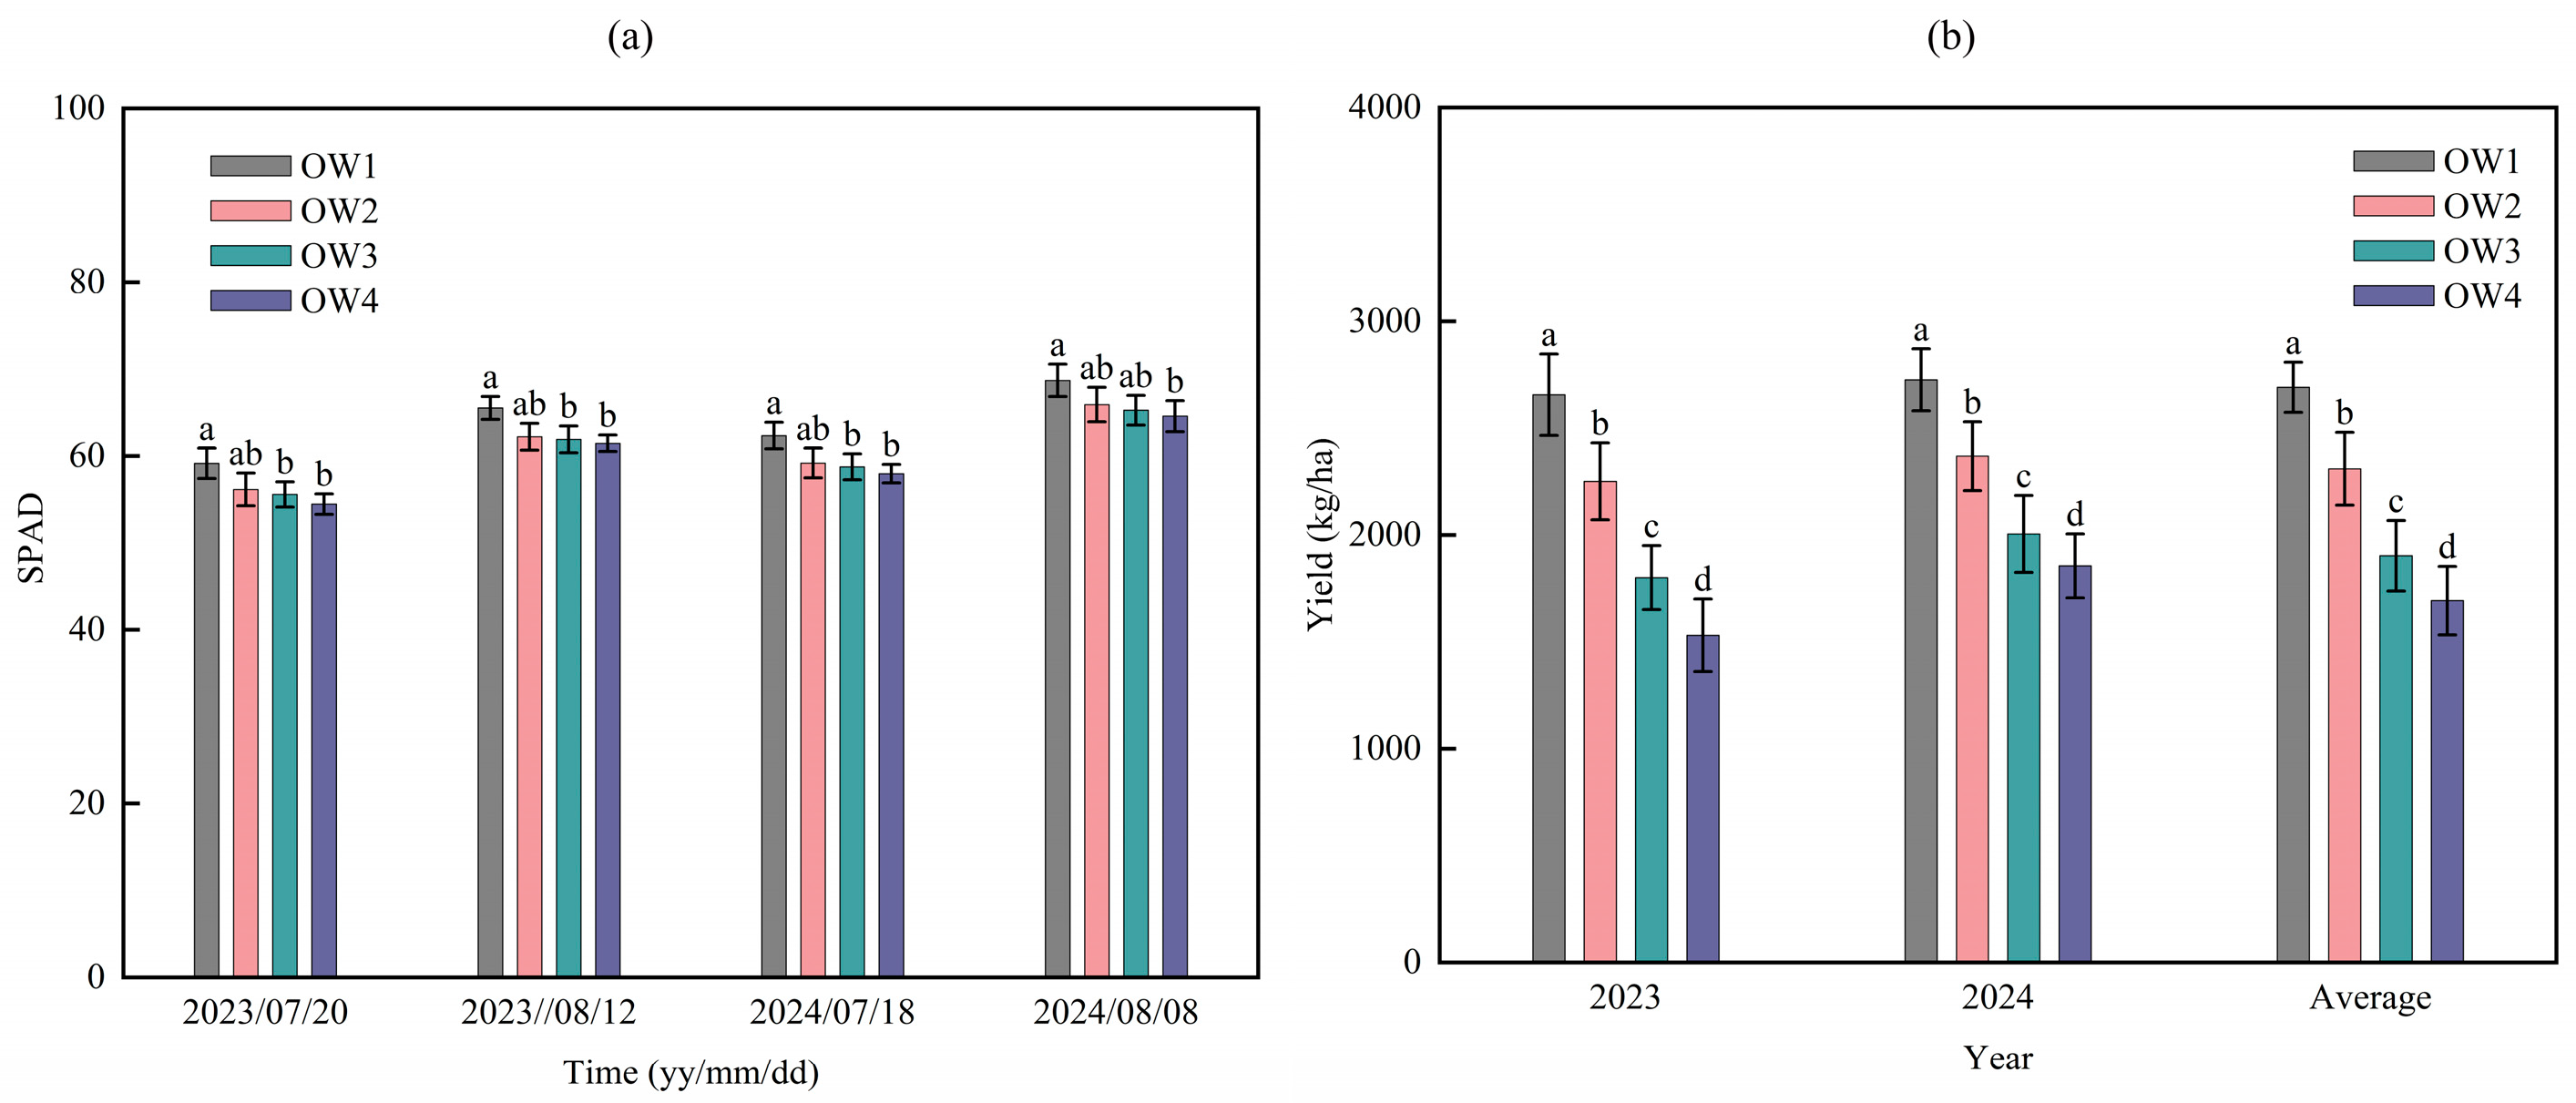
3.3. Effects of Different Water Deficit Conditions on SPAD Value and Yield

The SPAD value is a numerical indicator that can be quickly and nondestructively obtained to estimate the chlorophyll content in plant leaves, making it suitable for real-time monitoring. A higher SPAD value indicates a higher chlorophyll concentration in the leaves and better plant health. The fully irrigated OW1 treatment had the highest SPAD values during the tasseling stage (20 July 2023 and 18 July 2024) and grain-filling stage (12 August 2023 and 8 August 2024); SPAD in OW1 did not differ significantly from that OW2 (p < 0.05) but was significantly higher than those of OW3 and OW4. The differences among OW2, OW3, and OW4 were not significant.
The yield in 2024 was slightly higher than that in 2023, and the yield trends in both years were essentially identical (Figure 6). Taking the average yield over 2 years as an example, the fully irrigated OW1 treatment had the highest yield of 2691.51 kg/ha, which was significantly different from those of the other treatments (p > 0.05). The yields of OW2, OW3, and OW4 were 14.17%, 29.30%, and 37.09% lower than that of OW1, respectively. It is evident that a water deficit has a highly significant impact on yield, with the yield increasing as the irrigation water quota increases. The yield differences among the water-deficit treatments were significantly greater than those of oat PH, LAI, and SPAD.

3.4. Effects of Different Water Deficit Conditions on Vegetation Index

Vegetation indices are commonly used to evaluate crop growth conditions. We selected eight vegetation indices, NDVI (Figure 7a), NDRE (Figure 7b), GNDVI (Figure 7c), MCARI (Figure 7d), TCARI (Figure 7e), CIG (Figure 7f), SAVI (Figure 7g), and MSAVI (Figure 7h). The vegetation indices for different water deficit treatments during the tasseling stage (20 July 2023 and 18 July 2024) and grain-filling stage (12 August 2023 and 8 August 2024) are shown in Figure 6. The NDRE and MCARI showed better performance than those of other indices, showing significant differences among the different water deficit treatments (p > 0.05). However, MCARI displayed a negative correlation with NDRE. CIG showed significant differences among OW1, OW2, and OW3; however, there was no significant difference between OW3 and OW4. NDVI and TCARI showed no significant differences among OW1, OW2, and OW3 (p ≤ 0.05). GNDVI showed no significant differences among OW2, OW3, and OW4. SAVI and MSAVI values were highest in OW2 and did not differ significantly between OW1 and OW4. NDRE aligned well with the phenotypic changes in oats under different water deficit treatments. CIG aligned well with the yield changes in oats under different water deficit treatments. MCARI showed a negative correlation with yield changes in oats under different water deficit treatments.

3.5. The Relationship Between Phenotype–Spectrum–Yield of Oat Under Different Water Deficits

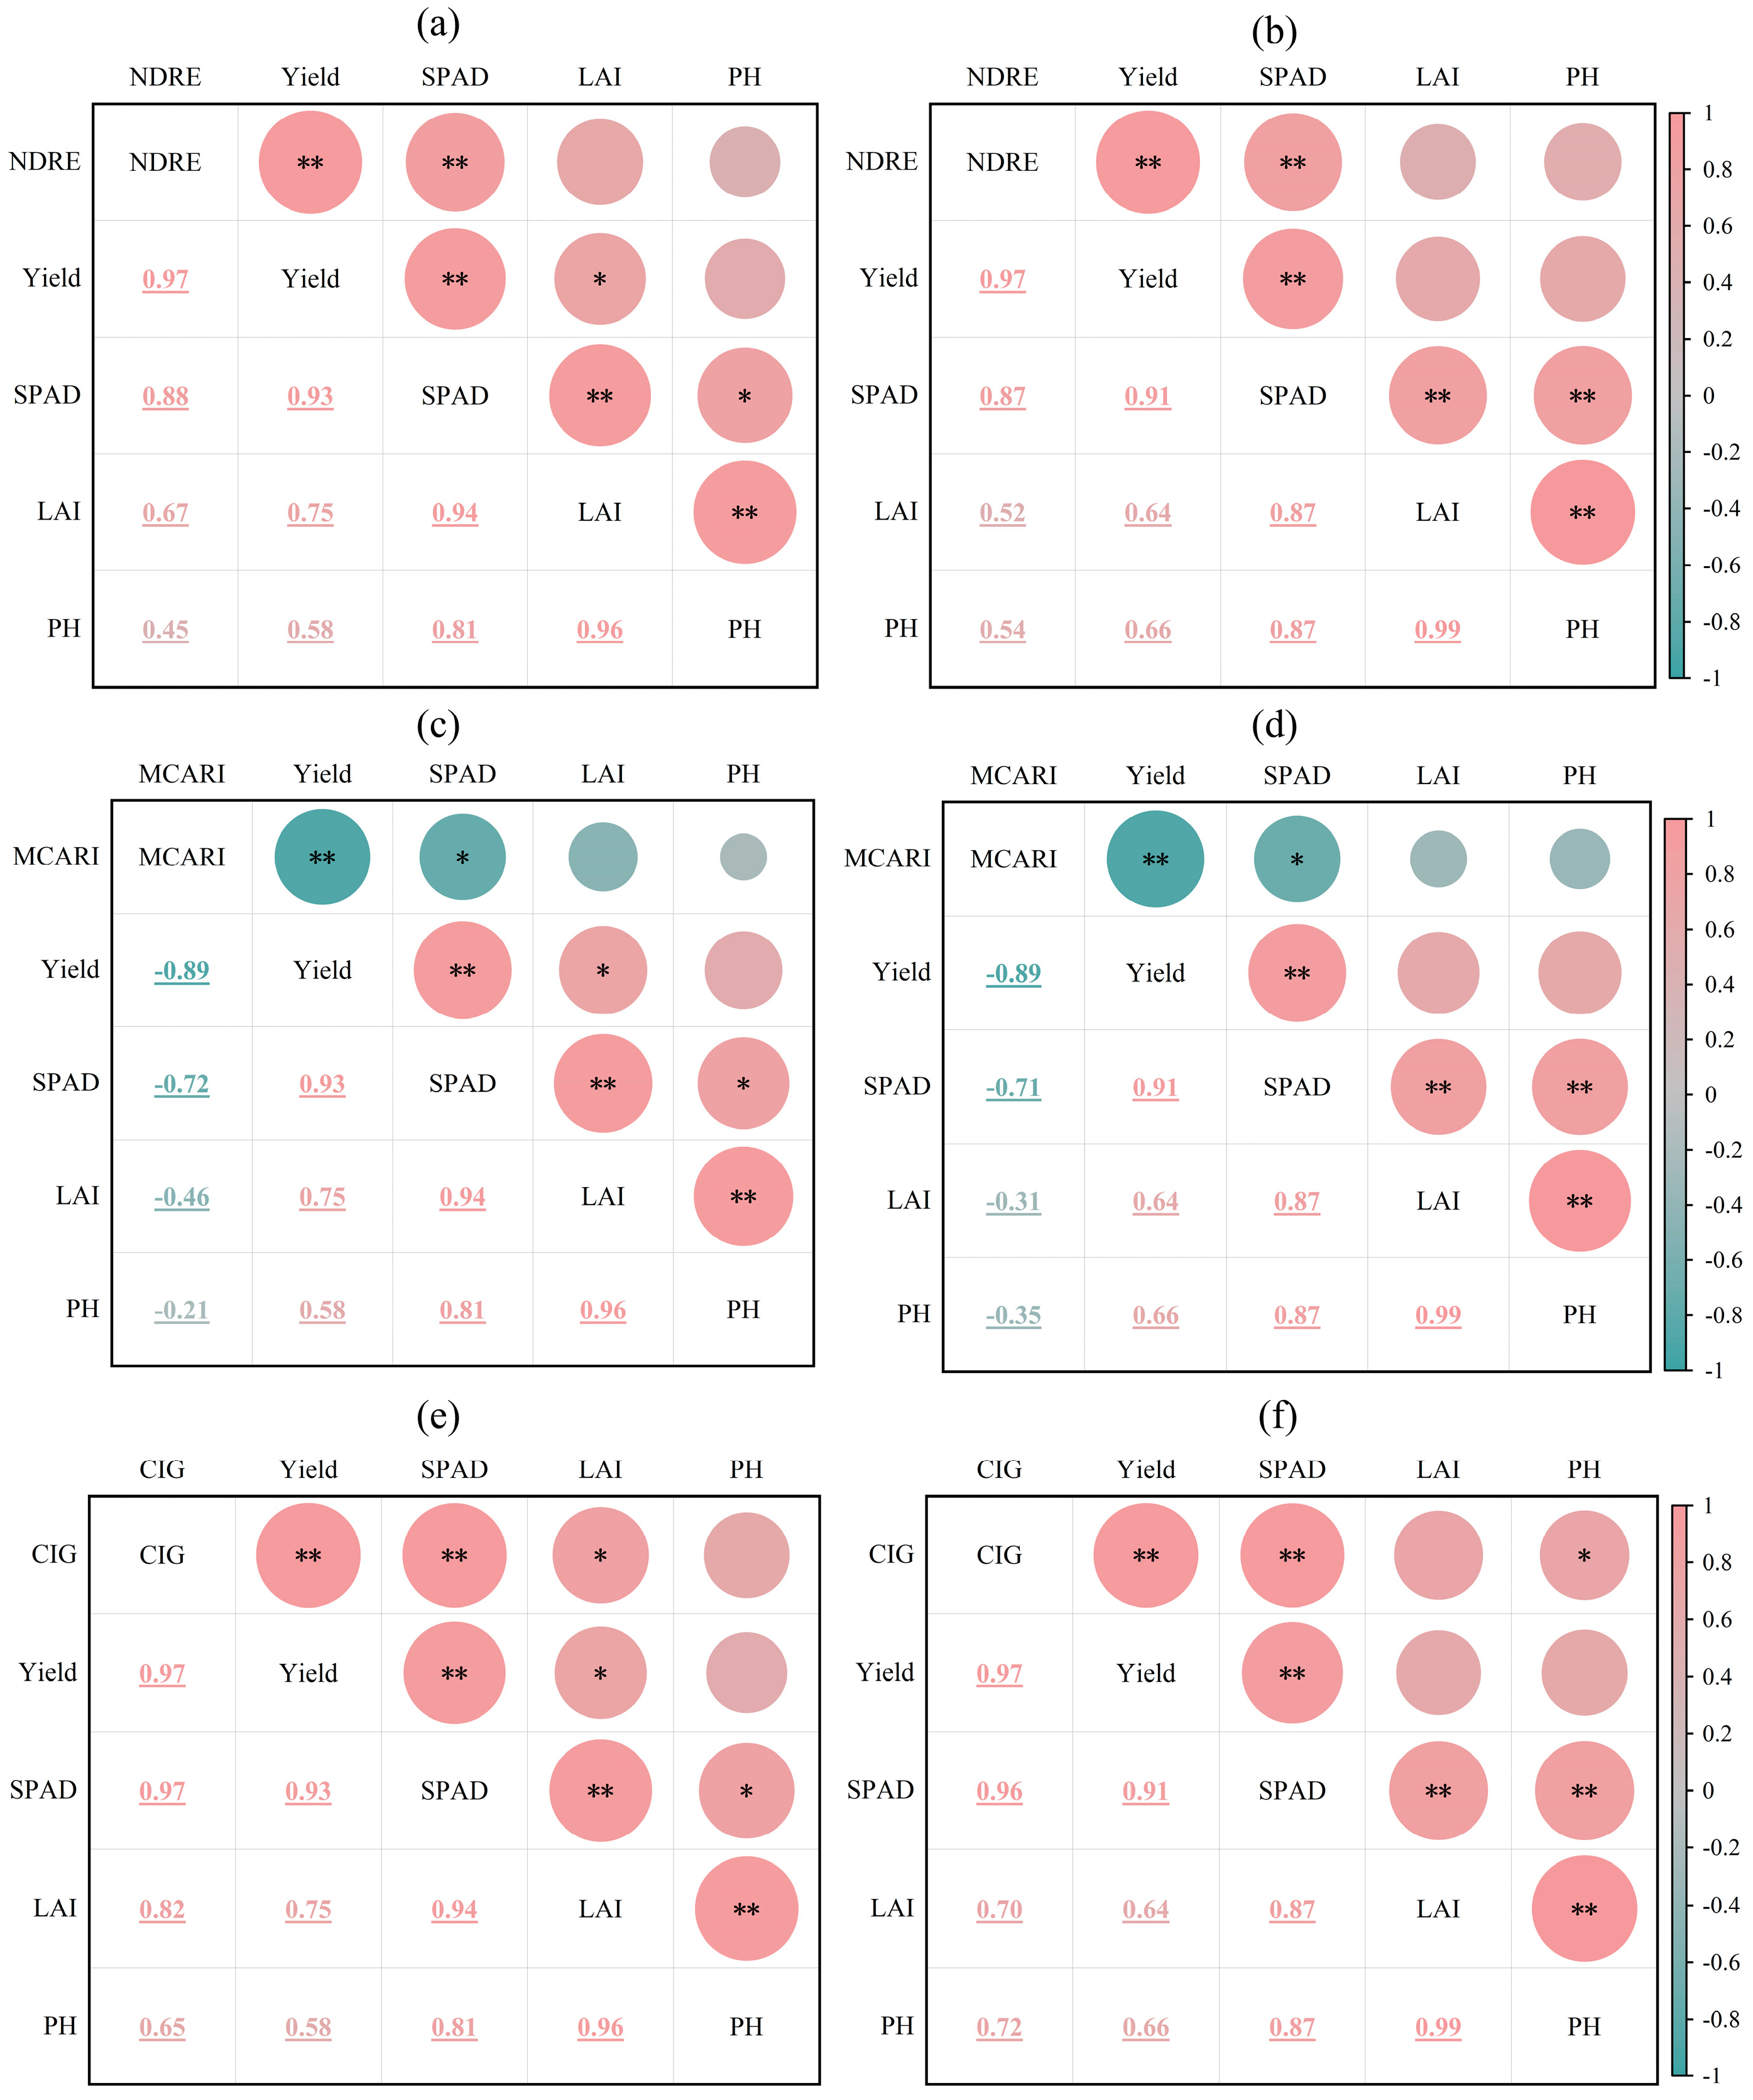
3.5.1. Correlation Analysis

Correlation analyses were conducted on yield, SPAD, LAI, PH, and vegetation indices (NDRE, MCARI, and CIG) for oats during the tasseling stage (20 July 2023 and 18 July 2024) and grain-filling stage (12 August 2023 and 8 August 2024). As shown in Figure 8, the results indicated that NDRE and CIG had highly significant positive correlations with the yield and SPAD (p < 0.01). MCARI showed a highly significant positive correlation with yield (p < 0.01) and a significant positive correlation with SPAD (p < 0.05). The CIG had a significant positive correlation with the LAI (p < 0.05). The correlations between the PH and vegetation indices were not significant. There was a highly significant positive correlation between yield and SPAD (p < 0.01) and a significant positive correlation between yield and LAI (p < 0.05).

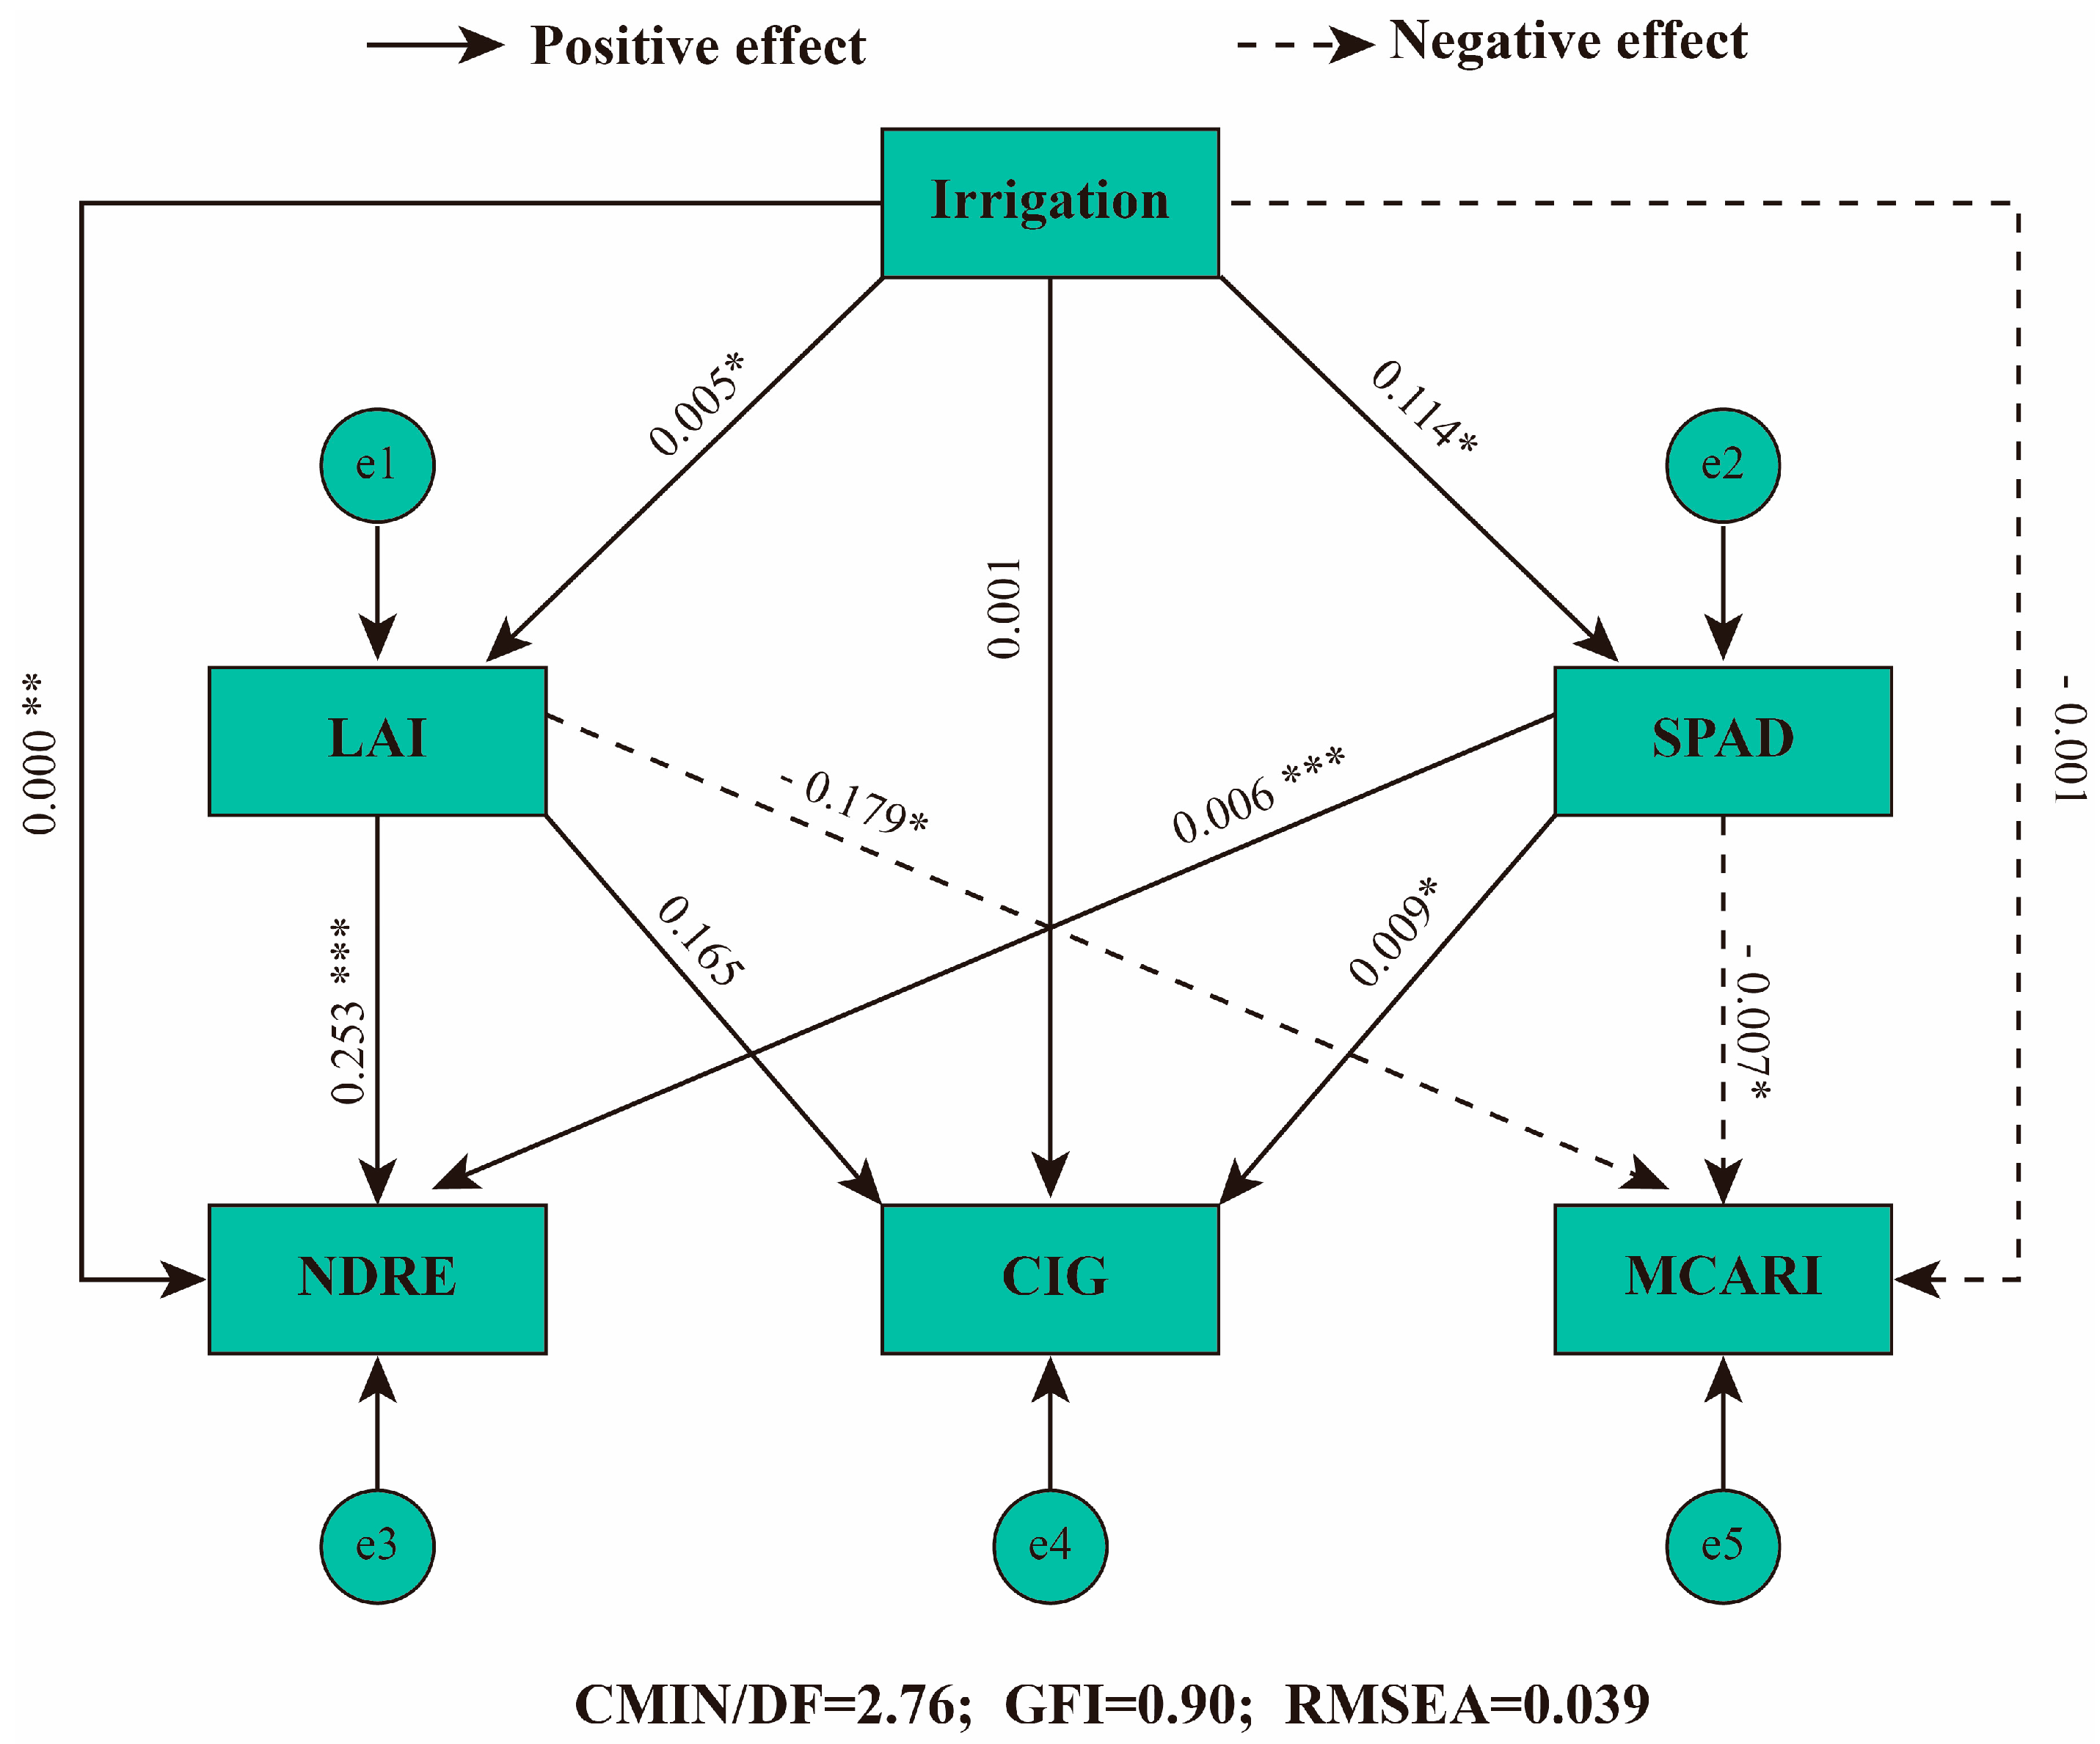
3.5.2. Structural Equation Model Analysis

A path analysis diagram of the SEM for oat phenotypes and vegetation indices under different water deficit conditions was constructed (Figure 9). The SEM had a minimum discrepancy ratio (CMIN/DF) of 2.76, Goodness-of-Fit Index (GFI) of 0.833, and RMSEA of 0.039, indicating a high degree of fit between the model and hypothetical results.
Irrigation had a direct positive effect on the NDRE value (p < 0.01) and on the LAI and SPAD values (p < 0.1). Irrigation had an indirect positive effect on CIG values and an indirect negative effect on MCARI values. The LAI and SPAD had a direct positive effect on NDRE (p < 0.001) and a direct negative effect on MCARI (p < 0.05). SPAD had a direct positive effect on CIG (p < 0.05). Therefore, in this study, the LAI and SPAD as well as the canopy spectral index NDRE were selected as important parameters for the multispectral inversion of water deficit.

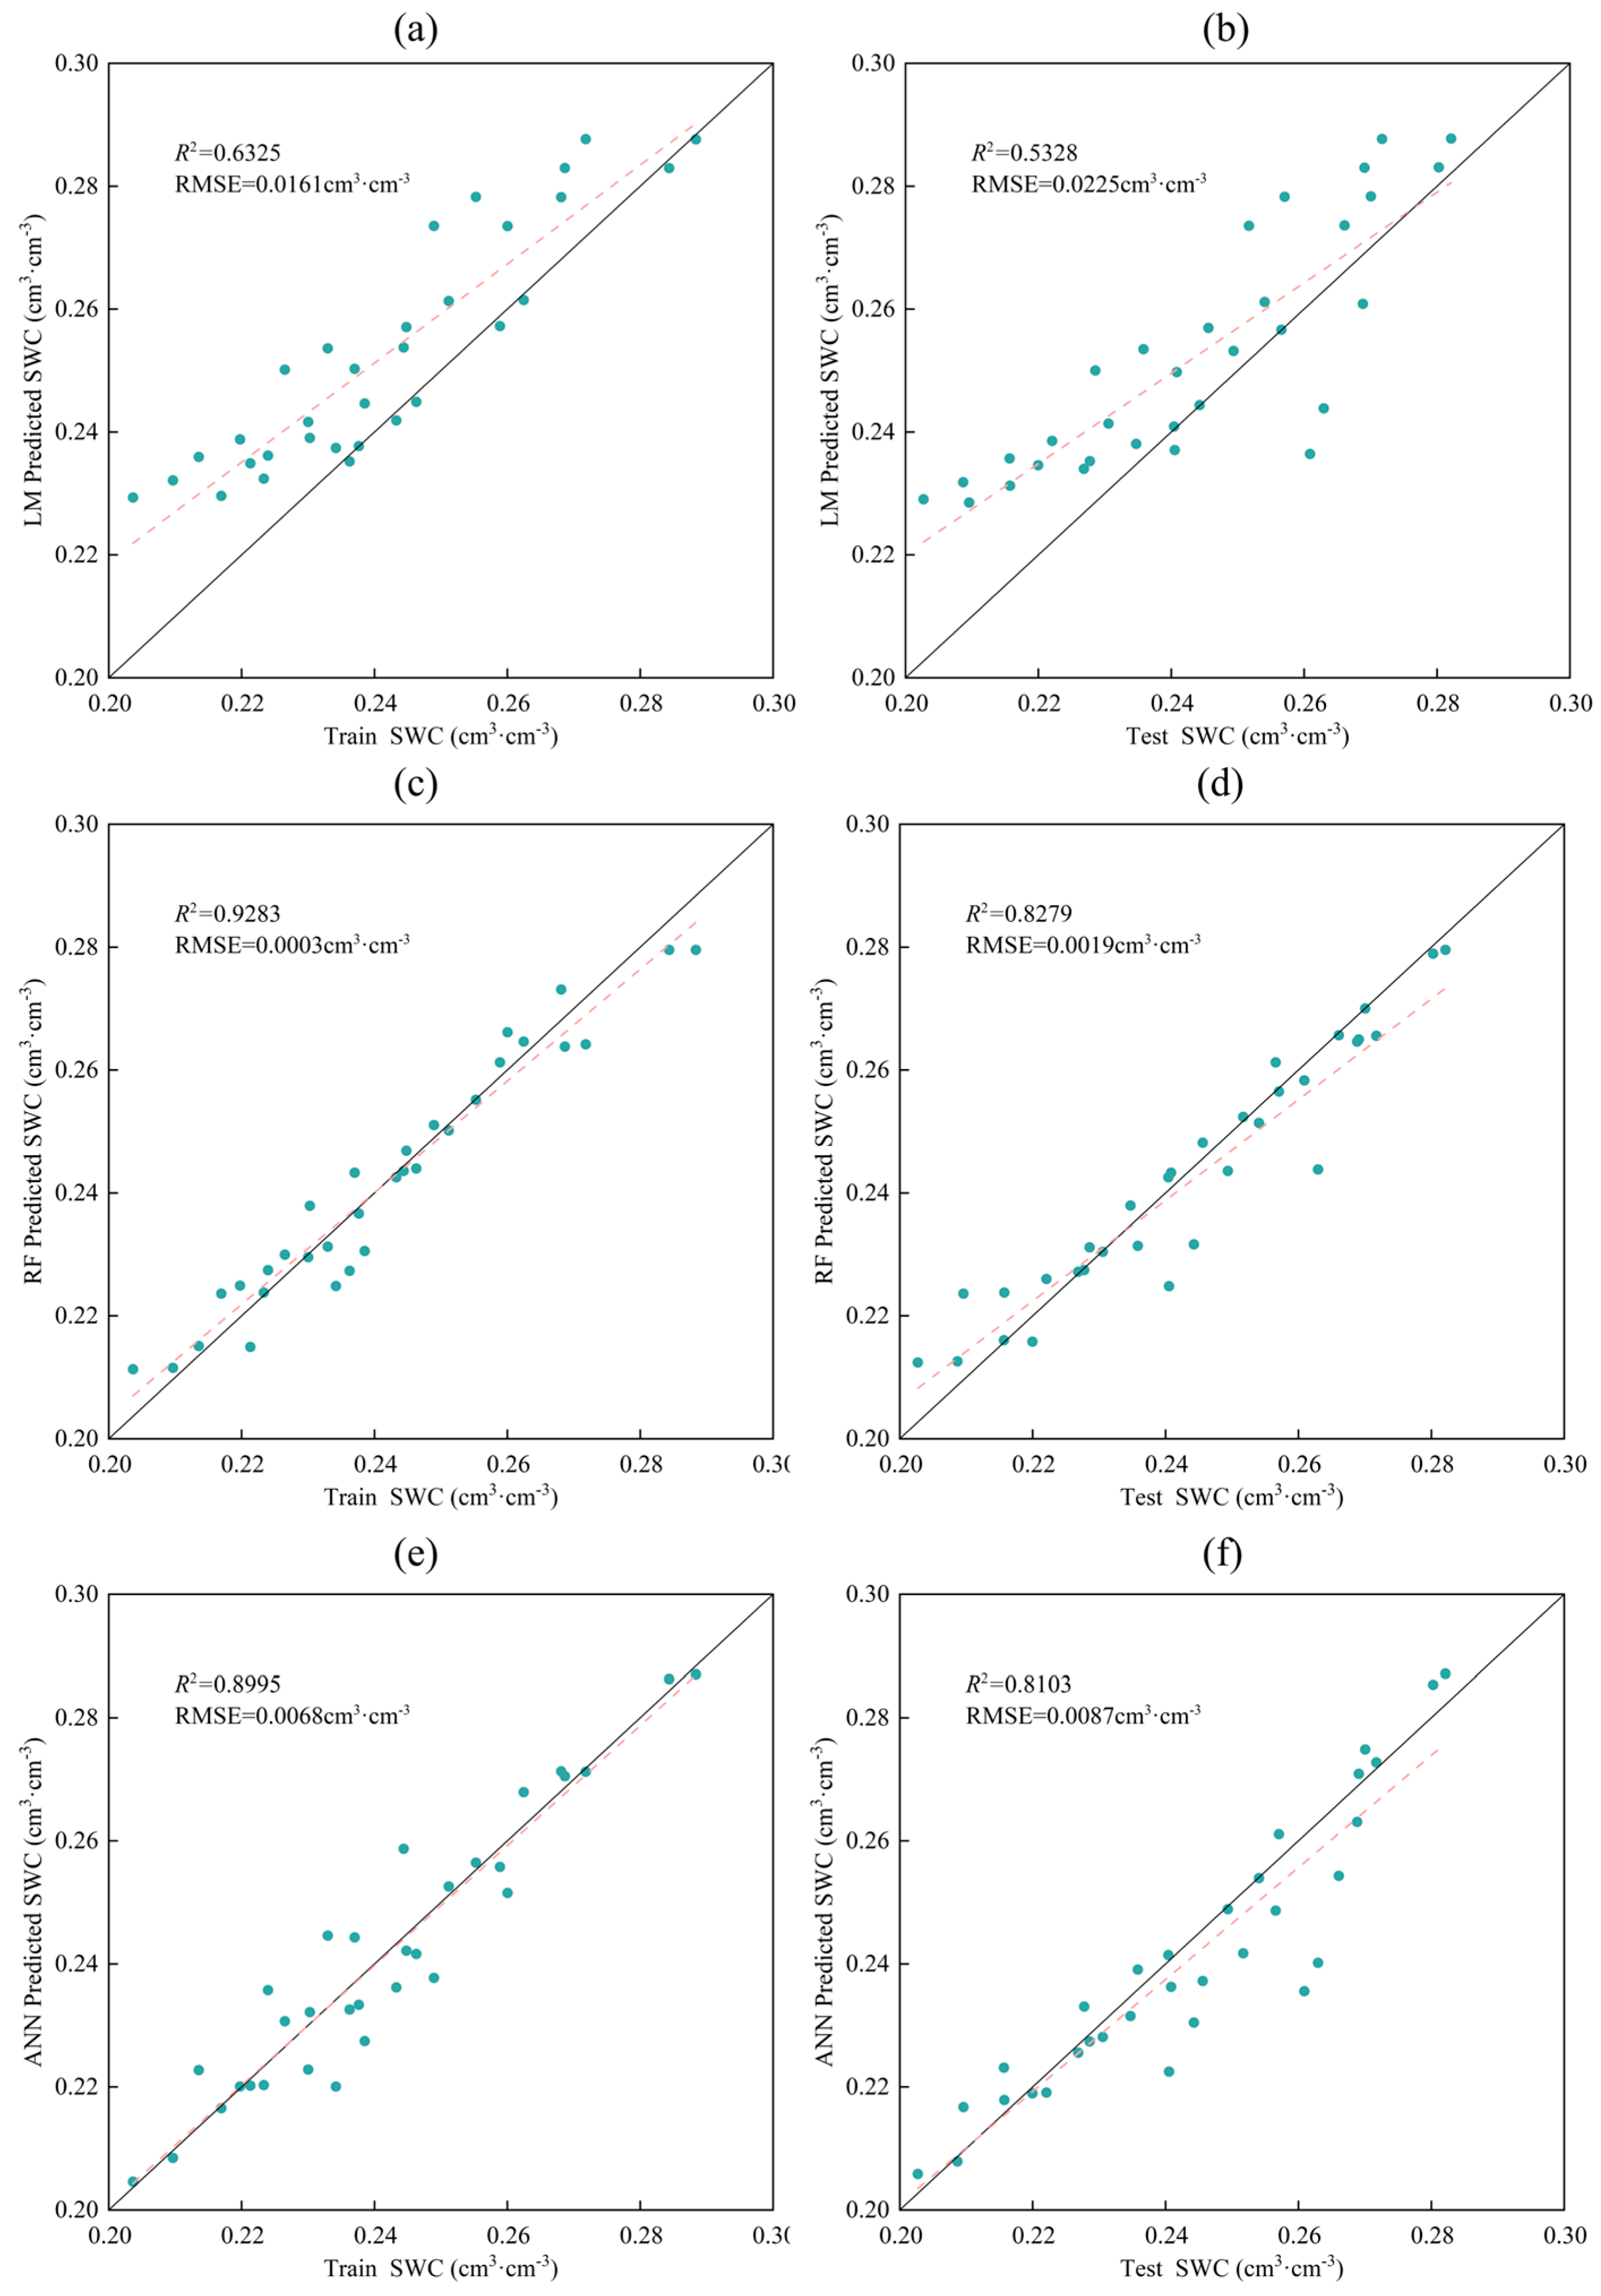
3.6. Soil Water Content Diagnosis Model

Three regression models were used to estimate soil water content and compare it with the measured soil water content. Using soil moisture values from 2023 and the vegetation index NDRE, a univariate linear model was constructed with a model-fitting accuracy of R2 = 0.632. Using 2024 data as test data for model verification, with the coefficient of determination (R2) and RMSE employed as evaluation metrics for the predictive performance. The discrepancies between the measured data and predicted values are illustrated in Figure 10. The model had an R2 of 0.5328 and RMSE of 0.0225 cm3/cm3. The experimental data were trained and tested using the random forest (RF) and artificial neural network (ANN) methods. The correlations of the training results of RF and ANN were 0.9283 and 0.8995, respectively, and the RMSE were 0.0003 and 0.0068, respectively. The result correlations of the test set were 0.8279 and 0.8103, respectively, and the RMSE were 0.0019 cm3/cm3 and 0.0087 cm3/cm3, respectively. Machine learning models are significantly superior to linear models in SWC prediction. The RF model is slightly superior to the ANN model.

4. Discussion

Soil moisture deficit leads to reduced leaf area, PH, and chlorophyll content, thereby affecting crop growth and yield [38,39]. In field studies of oats, we found that a water deficit caused a reduction in PH, with significant differences depending on the extent of the water deficit (p < 0.05). An adequate water supply in the late growth stages reduced these differences; however, the effects of early-stage water deficits were not completely attenuated. The effect of water deficit on the LAI during the seedling and jointing stages was minimal; however, significant differences in the LAI were observed in the mid-to-late growth stages under different water deficit levels. Yield increased significantly as irrigation quotas increased. The differences in yield among treatments were significantly greater than the differences in PH, LAI, and SPAD.
Analyses of phenotypic changes during key growth stages revealed that under mild water deficit conditions, oats exhibit minimal growth changes, whereas severe water deficit conditions reduce the chlorophyll content significantly and result in marked differences in phenotypic characteristics.
To cope with water stress, crops often exhibit adaptive mechanisms at the leaf level, such as reducing light absorption and dissipating excess absorbed energy by lowering the chlorophyll concentration and reducing photosynthesis [8,40,41]. These biological and physiological changes induced by water stress provide the functional basis for monitoring the crop water status using vegetation indices derived from UAV-based multispectral imagery [39,42]. Water deficits not only affect crop biomass significantly but also alter the spectral characteristics of vegetation [43]. There were significant correlations between the vegetation indices (e.g., NDVI and NDRE) in the remote sensing data, crop growth status, and phenotypic characteristics [14,44]. In this study, analyses of multispectral image data obtained from UAVs revealed good correlations between the vegetation indices MCARI, CIG, and NDRE, and phenotypic indices, such as LAI and SPAD, under different water deficit conditions.
By combining SEM with a path analysis, this study explored the relationships between oat phenotypes and UAV multispectral remote sensing data under water deficit conditions, distinguished direct and indirect effects of water deficit on phenotypic and spectral characteristics, and systematically analyzed the complex interactions among variables. The SEM constructed in this study effectively quantified the direct and indirect effects of water deficiency on oat phenotypes and spectral characteristics. The results indicated a high degree of fit between the path analysis model and the hypothesized model, with water deficit having direct positive effects on NDRE, LAI, and SPAD values and indirect effects on CIG and MCARI values. The model quantified the path coefficients of various indicators, providing additional theoretical support for exploring the mechanisms by which water deficits affect phenotypic indicators. The LAI and SPAD as well as the canopy spectral index NDRE were selected as parameters for the multispectral inversion model of water deficit.
Spectral indices have recently been used with various regression algorithms (multiple linear regression, random forest, partial least squares regression, and artificial neural network regression) to estimate crop and soil water statuses [39,45]. The use of LAI to optimize the prediction model accuracy was also validated [46]. Zhang et al. [39] evaluated the maize water status using six spectral indices and three regression algorithms (multiple linear regression, random forest, and artificial neural network regression) and found that nonlinear machine learning regression algorithms do not significantly improve accuracy compared with that for multiple linear regression, indicating that the multiple linear regression method performed well and was very robust in estimating maize water status. This study systematically evaluated different modeling approaches for soil water content estimation using NDRE vegetation index data. Initial analysis employed a simple linear regression model calibrated with 2023 dataset, yielding a moderate determination coefficient (R2 = 0.6325). However, when validated with independent 2024 data, the linear model exhibited reduced performance (R2 = 0.5328, RMSE = 0.0225 cm3/cm3). To enhance prediction accuracy, we implemented two advanced machine learning algorithms: random forest (RF) and artificial neural network (ANN) regression. These nonlinear approaches demonstrated superior performance, achieving R2 values of 0.8103–0.8279 during validation. The 21–23% reduction in RMSE achieved by machine learning models has important practical implications for precision irrigation management.
This investigation employed an innovative integration of structural equation modeling (SEM) and UAV-acquired multispectral imagery to elucidate the complex relationships between oat phenotypic traits and spectral characteristics under water-limited conditions. The study was conducted in the ecologically vulnerable agro-pastoral transition zone of northern China, a critical region characterized by a steep climatic gradient from semi-arid to arid conditions. Compared with traditional single-variable analyses, this method demonstrates greater comprehensiveness and accuracy. With the continuous advancement of agricultural science and technology, the application of unmanned aerial vehicle (UAV) monitoring technology in the agricultural field will become increasingly widespread. For instance, in areas such as oat growth monitoring, precise fertilization and irrigation, pest and disease monitoring and management, and harvest prediction, it can significantly enhance the efficiency and accuracy of agricultural management. With the continuous development and popularization of technology, drones will play a greater role in agriculture in the future, helping farmers achieve efficient and sustainable production methods. Although this study provides valuable insights, its findings are based on a two-year field experiment conducted in a single geographic region using a specific oat cultivar. Consequently, the model’s performance may be constrained by varietal differences and site-specific climatic and soil conditions, necessitating further validation to assess its broader applicability. Future research should expand the evaluation to multiple oat varieties across diverse agroecological zones to improve the model’s generalizability and robustness under varying environmental conditions.

5. Conclusions

This study demonstrated that a water deficit led to reduced PH, with significant differences among various levels of water deficit (p < 0.05). The effects of water deficit on the LAI during the seedling and jointing stages were minimal; however, significant differences in the LAI were observed in the mid-to-late growth stages as the water deficit levels increased. Under mild water deficit conditions, phenotypic changes in oats were relatively small, whereas severe water deficit reduced the PH, LAI, and chlorophyll content significantly. The effect of water deficit on yield was extremely significant, with the yield increasing as irrigation quotas increased.
Detailed analyses indicated that NDRE, CIG, and MCARI showed good correlations. According to a path analysis of the SEM, a water deficit reduced the LAI and SPAD, thereby indirectly affecting spectral indices.
Finally, three regression models were constructed using the Most Relevant Vegetation Index (NDRE). The correlations of the test sets of the linear regression, random forest (RF), and artificial neural network (ANN) regression models were 0.5328, 0.8279, and 0.8103, respectively. Machine learning models are significantly superior to linear models in SWC prediction. Overall, our results demonstrate the potential of using vegetation indices obtained from UAV multispectral imagery and machine learning methods to estimate the soil moisture conditions in northern oat farmlands.

Author Contributions

Conceptualization, Y.J.; methodology, Y.F. and Y.J.; validation, X.S.; formal analysis, X.S. and Y.J.; investigation, Y.F., G.W., J.W. and X.M.; resources, H.Z. and Y.J.; data curation, Y.F., G.W. and X.M.; writing—original draft preparation, Y.F. and G.W.; writing—review and editing, Y.F., J.W., H.Z., P.L., Y.L. and Y.J.; visualization, Y.F. and P.L.; supervision, H.Z. and Y.L.; project administration, J.W.; funding acquisition, H.Z. All authors have read and agreed to the published version of the manuscript.

Funding

This study was supported by Yinshanbeilu Grassland Eco-hydrology National Observation and Research Station, China Institute of Water Resources and Hydro-power Research, Grant No. YSS202314. Central Public-Interest Scientific Institution Basal Research Fund, No. IFI2023-08, Natural Science Foundation Project of Henan Province: No.252300420511.

Data Availability Statement

The original contributions presented in this study are included in the article. Further inquiries can be directed to the corresponding authors.

Conflicts of Interest

The authors declare no conflicts of interest.

Abbreviations

The following abbreviations are used in this manuscript:
CIGChlorophyll Index
GFIGoodness-of-Fit Index
LAILeaf area index
GNDVIGreen Normalized Difference Vegetation Index
MCARIModified Chlorophyll Absorption in Reflectance Index
MSAVIModified Soil-Adjusted Vegetation Index
NDRENormalized Difference Red Edge
PHPlant height
RMSERoot mean square error
RMSEARoot Mean Square Error of Approximation
SAVISoil-Adjusted Vegetation Index
SEMStructural equation modeling
TCARITransformed Chlorophyll Absorption in Reflectance Index
UAVUnmanned aerial vehicle
SWCSoil water content
ANNArtificial neural network
RFRandom forest

References

  1. Zhai, X.; Li, S.; Huang, D.; Tang, S.; Wang, K. The effect of different ecosystems on groundwater consumption in an agro-pastoral ecotone of northern China from an innovative perspective. Sustain. Water Resour. Manag. 2018, 4, 667–672. [Google Scholar] [CrossRef]
  2. Wagg, C.; Hann, S.; Kupriyanovich, Y.; Li, S. Timing of short period water stress determines potato plant growth, yield and tuber quality. Agric. Water Manag. 2021, 247, 106731. [Google Scholar] [CrossRef]
  3. Cheng, M.; Jiao, X.; Liu, Y.; Shao, M.; Yu, X.; Bai, Y.; Wang, Z.; Wang, S.; Tuohuti, N.; Liu, S. Estimation of soil moisture content under high maize canopy coverage from UAV multimodal data and machine learning. Agric. Water Manag. 2022, 264, 107530. [Google Scholar] [CrossRef]
  4. Ge, X.; Wang, J.; Ding, J.; Cao, X.; Zhang, Z.; Liu, J.; Li, X. Combining UAV-based hyperspectral imagery and machine learning algorithms for soil moisture content monitoring. PeerJ 2019, 7, e6926. [Google Scholar] [CrossRef] [PubMed]
  5. Tanabe, R.; Matsui, T.; Tanaka, T.S. Winter wheat yield prediction using convolutional neural networks and UAV-based multispectral imagery. Field Crops Res. 2023, 291, 108786. [Google Scholar] [CrossRef]
  6. Yue, J.; Yang, H.; Yang, G.; Fu, Y.; Wang, H.; Zhou, C. Estimating vertically growing crop above-ground biomass based on UAV remote sensing. Comput. Electron. Agric. 2023, 205, 107627. [Google Scholar] [CrossRef]
  7. Kim, D.-W.; Jeong, S.J.; Lee, W.S.; Yun, H.; Chung, Y.S.; Kwon, Y.-S.; Kim, H.-J. Growth monitoring of field-grown onion and garlic by CIE L* a* b* color space and region-based crop segmentation of UAV RGB images. Precis. Agric. 2023, 24, 1982–2001. [Google Scholar] [CrossRef]
  8. Kang, J.; Hao, X.; Zhou, H.; Ding, R. An integrated strategy for improving water use efficiency by understanding physiological mechanisms of crops responding to water deficit: Present and prospect. Agric. Water Manag. 2021, 255, 107008. [Google Scholar] [CrossRef]
  9. Ghadirnezhad Shiade, S.R.; Fathi, A.; Ghasemkheili, F.T.; Amiri, E.; Pessarakli, M. Plants’ responses under drought stress conditions: Effects of strategic management approaches—A review. J. Plant Nutr. 2023, 46, 2198–2230. [Google Scholar] [CrossRef]
  10. Yang, Z.; Tian, J.; Wang, Z.; Feng, K.; Ouyang, Z.; Zhang, L.; Yan, X. Coupled soil water stress and environmental effects on changing photosynthetic traits in wheat and maize. Agric. Water Manag. 2023, 282, 108246. [Google Scholar] [CrossRef]
  11. Zhou, C.; Gong, Y.; Fang, S.; Yang, K.; Peng, Y.; Wu, X.; Zhu, R. Combining spectral and wavelet texture features for unmanned aerial vehicles remote estimation of rice leaf area index. Front. Plant Sci. 2022, 13, 957870. [Google Scholar] [CrossRef] [PubMed]
  12. Ma, Y.; Zhang, Q.; Yi, X.; Ma, L.; Zhang, L.; Huang, C.; Zhang, Z.; Lv, X. Estimation of cotton leaf area index (LAI) based on spectral transformation and vegetation index. Remote Sens. 2021, 14, 136. [Google Scholar] [CrossRef]
  13. Sarkar, S.; Cazenave, A.-B.; Oakes, J.; McCall, D.; Thomason, W.; Abbott, L.; Balota, M. Aerial high-throughput phenotyping of peanut leaf area index and lateral growth. Sci. Rep. 2021, 11, 21661. [Google Scholar] [CrossRef] [PubMed]
  14. Xingjiao, Y.; Kai, F.; Xuefei, H.; Qi, Y.; Long, Q.; Zhengguang, L.; Chaoyue, Z.; Li, L.; Wen’e, W.; Xiaotao, H. Dynamic estimation of summer maize LAI based on multi-feature fusion of UAV imagery. Trans. Chin. Soc. Agric. Eng. 2025, 41, 124–134. [Google Scholar]
  15. Dong, H.; Dong, J.; Sun, S.; Bai, T.; Zhao, D.; Yin, Y.; Shen, X.; Wang, Y.; Zhang, Z.; Wang, Y. Crop water stress detection based on UAV remote sensing systems. Agric. Water Manag. 2024, 303, 109059. [Google Scholar] [CrossRef]
  16. Zhou, Z.; Majeed, Y.; Naranjo, G.D.; Gambacorta, E.M. Assessment for crop water stress with infrared thermal imagery in precision agriculture: A review and future prospects for deep learning applications. Comput. Electron. Agric. 2021, 182, 106019. [Google Scholar] [CrossRef]
  17. Feng, L.; Chen, S.; Zhang, C.; Zhang, Y.; He, Y. A comprehensive review on recent applications of unmanned aerial vehicle remote sensing with various sensors for high-throughput plant phenotyping. Comput. Electron. Agric. 2021, 182, 106033. [Google Scholar] [CrossRef]
  18. Sun, X.; Zhang, B.; Dai, M.; Jing, C.; Ma, K.; Tang, B.; Li, K.; Dang, H.; Gu, L.; Zhen, W. Accurate irrigation decision-making of winter wheat at the filling stage based on UAV hyperspectral inversion of leaf water content. Agric. Water Manag. 2024, 306, 109171. [Google Scholar] [CrossRef]
  19. Marques, P.; Pádua, L.; Sousa, J.J.; Fernandes-Silva, A. Assessing the water status and leaf pigment content of olive trees: Evaluating the potential and feasibility of unmanned aerial vehicle multispectral and thermal data for estimation purposes. Remote Sens. 2023, 15, 4777. [Google Scholar] [CrossRef]
  20. da Silva, P.C.; Junior, W.Q.R.; Ramos, M.L.G.; Lopes, M.F.; Santana, C.C.; Casari, R.A.d.C.N.; Brasileiro, L.d.O.; Veiga, A.D.; Rocha, O.C.; Malaquias, J.V. Multispectral Images for Drought Stress Evaluation of Arabica Coffee Genotypes Under Different Irrigation Regimes. Sensors 2024, 24, 7271. [Google Scholar] [CrossRef]
  21. Romero, A.G.; Lopes, M.S. Heading and maturity date prediction using vegetation indices: A case study using bread wheat, barley and oat crops. Eur. J. Agron. 2024, 160, 127330. [Google Scholar] [CrossRef]
  22. Bytyqi, B.; Kutasy, E. Leaf reflectance characteristics and yield of spring oat varieties as influenced by varietal divergences and nutritional supply. Acta Agrar. Debreceniensis 2023, 2023, 29–34. [Google Scholar] [CrossRef] [PubMed]
  23. Ma, B.-L.; De Haan, B.; Zheng, Z.; Xue, A.G.; Chen, Y.; de Silva, N.D.G.; Byker, H.; Mountain, N.; Yan, W. Exploring the relationships between biomass production, nutrient acquisition, and phenotypic traits: Testing oat genotypes as a cover crop. J. Plant Nutr. 2022, 45, 2931–2944. [Google Scholar] [CrossRef]
  24. Westland, J.C. Structural equation models. Stud. Syst. Decis. Control 2015, 22, 152. [Google Scholar]
  25. Zeng, X.; Peng, Z.; Peng, Y. Structural equation model analyzing relationship among N application-carbonhydrate product-grain yield of maize. Trans. Chin. Soc. Agric. Eng. 2016, 32, 98–104. [Google Scholar]
  26. Tian, P.; Zhang, J.; Ding, L.; Zhong, T.; Yin, M.; Yang, R.; Du, L.; Xie, Y. Simulation and analysis of pumpkin leaf growth-photosynthesis-yield relationship under water-fertilizer coupling by SEM. Sci. Hortic. 2025, 340, 113923. [Google Scholar] [CrossRef]
  27. Rouse, J.W.; Haas, R.H.; Schell, J.A.; Deering, D.W. Monitoring vegetation systems in the Great Plains with ERTS. NASA Spec. Publ. 1974, 351, 309. [Google Scholar]
  28. Gitelson, A.A.; Gritz, Y.; Merzlyak, M.N. Relationships between leaf chlorophyll content and spectral reflectance and algorithms for non-destructive chlorophyll assessment in higher plant leaves. J. Plant Physiol. 2003, 160, 271–282. [Google Scholar] [CrossRef]
  29. Gitelson, A.A.; Kaufman, Y.J.; Merzlyak, M.N. Use of a green channel in remote sensing of global vegetation from EOS-MODIS. Remote Sens. Environ. 1996, 58, 289–298. [Google Scholar] [CrossRef]
  30. Gitelson, A.A.; Merzlyak, M.N. Remote estimation of chlorophyll content in higher plant leaves. Int. J. Remote Sens. 1997, 18, 2691–2697. [Google Scholar] [CrossRef]
  31. Daughtry, C.S.; Walthall, C.; Kim, M.; De Colstoun, E.B.; McMurtrey Iii, J.E. Estimating corn leaf chlorophyll concentration from leaf and canopy reflectance. Remote Sens. Environ. 2000, 74, 229–239. [Google Scholar] [CrossRef]
  32. Haboudane, D.; Miller, J.R.; Tremblay, N.; Zarco-Tejada, P.J.; Dextraze, L. Integrated narrow-band vegetation indices for prediction of crop chlorophyll content for application to precision agriculture. Remote Sens. Environ. 2002, 81, 416–426. [Google Scholar] [CrossRef]
  33. Huete, A.R. A soil-adjusted vegetation index (SAVI). Remote Sens. Environ. 1988, 25, 295–309. [Google Scholar] [CrossRef]
  34. Qi, J.; Chehbouni, A.; Huete, A.R.; Kerr, Y.H.; Sorooshian, S. A modified soil adjusted vegetation index. Remote Sens. Environ. 1994, 48, 119–126. [Google Scholar] [CrossRef]
  35. Liu, Z. Study on the correction coefcient and leaf area index of winter wheat spring leaf area. J. Triticeae Crops 1997, 1, 42–44. (In Chinese) [Google Scholar]
  36. Boulesteix, A.; Janitza, S.; Kruppa, J.; König, I.R. Overview of random forest methodology and practical guidance with emphasis on computational biology and bioinformatics. Wiley Interdiscip. Rev. Data Min. Knowl. Discov. 2012, 2, 493–507. [Google Scholar] [CrossRef]
  37. Agatonovic-Kustrin, S.; Beresford, R. Basic concepts of artificial neural network (ANN) modeling and its application in pharmaceutical research. J. Pharm. Biomed. Anal. 2000, 22, 717–727. [Google Scholar] [CrossRef] [PubMed]
  38. Bhattacharya, A.; Bhattacharya, A. Effect of soil water deficit on growth and development of plants: A review. In Soil Water Deficit and Physiological Issues in Plants; Springer: Singapore, 2021; pp. 393–488. [Google Scholar]
  39. Zhang, L.; Han, W.; Niu, Y.; Chávez, J.L.; Shao, G.; Zhang, H. Evaluating the sensitivity of water stressed maize chlorophyll and structure based on UAV derived vegetation indices. Comput. Electron. Agric. 2021, 185, 106174. [Google Scholar] [CrossRef]
  40. Xie, P.; Zhang, Z.; Ba, Y.; Dong, N.; Zuo, X.; Yang, N.; Chen, J.; Cheng, Z.; Zhang, B.; Yang, X. Diagnosis of summer maize water stress based on UAV image texture and phenotypic parameters. Trans. Chin. Soc. Agric. Eng. 2024, 40, 136–146. [Google Scholar]
  41. Farooq, M.; Hussain, M.; Ul-Allah, S.; Siddique, K.H. Physiological and agronomic approaches for improving water-use efficiency in crop plants. Agric. Water Manag. 2019, 219, 95–108. [Google Scholar] [CrossRef]
  42. Han, X.; Wei, Z.; Chen, H.; Zhang, B.; Li, Y.; Du, T. Inversion of winter wheat growth parameters and yield under different water treatments based on UAV multispectral remote sensing. Front. Plant Sci. 2021, 12, 609876. [Google Scholar] [CrossRef] [PubMed]
  43. Zhou, Y.; Lao, C.; Yang, Y.; Zhang, Z.; Chen, H.; Chen, Y.; Chen, J.; Ning, J.; Yang, N. Diagnosis of winter-wheat water stress based on UAV-borne multispectral image texture and vegetation indices. Agric. Water Manag. 2021, 256, 107076. [Google Scholar] [CrossRef]
  44. Bonfil, D.J. Wheat phenomics in the field by RapidScan: NDVI vs. NDRE. Isr. J. Plant Sci. 2017, 64, 41–54. [Google Scholar] [CrossRef]
  45. Ren, S.; Guo, B.; Wang, Z.; Wang, J.; Fang, Q.; Wang, J. Optimized spectral index models for accurately retrieving soil moisture (SM) of winter wheat under water stress. Agric. Water Manag. 2022, 261, 107333. [Google Scholar] [CrossRef]
  46. An, M.; Xing, W.; Han, Y.; Bai, Q.; Peng, Z.; Zhang, B.; Wei, Z.; Wu, W. The optimal soil water content models based on crop-LAI and hyperspectral data of winter wheat. Irrig. Sci. 2021, 39, 687–701. [Google Scholar] [CrossRef]
Figure 1. An overview of the study area. (a) shows the location of the study area. (b) Yinshanbeilu Grassland Eco-Hydrology National Observation and Research Station. (c) shows the field experiment area.
Agronomy 15 01389 g001
Figure 2. Temperature, relative humidity (RH), and rainfall during the growth period of 2023 (a) and 2024 (b).
Agronomy 15 01389 g002
Figure 3. Diagram of work’s global methodology.
Agronomy 15 01389 g003
Figure 4. The effects of water deficit on plant height (PH) at different growth stages of oats in 2023 (a) and 2024 (b). Statistical comparisons were made by one-way ANOVA. Different lowercase letters mean significant differences found at p < 0.05, same as below.
Agronomy 15 01389 g004
Figure 5. The effects of water deficit on leaf area index (LAI) at different growth stages of oats in 2023 (a) and 2024 (b). Different lowercase letters mean significant differences found at p < 0.05.
Agronomy 15 01389 g005
Figure 6. The effects of water deficit on soil and plant analyzer development (SPAD) value and yield. (a) SPAD. (b) Yield. Different lowercase letters mean significant differences found at p < 0.05.
Agronomy 15 01389 g006
Figure 7. The effects of different water deficit conditions on vegetation index. (a) NDRE. (b) NDVI. (c) GNDVI. (d) MCARI. (e) TCARI. (f) CIG. (g) SAVI. (h) MSAVI. Different lowercase letters mean significant differences found at p < 0.05.
Agronomy 15 01389 g007
Figure 8. The correlation between phenotype–spectrum–yield of oat under different water deficits. (a) Correlation analysis of NDRE during the tasseling stage, (b) Correlation analysis of NDRE during the grain-filling stage, (c) Correlation analysis of MCARI during the tasseling stage, (d) Correlation analysis of MCARI during the grain-filling stage, (e) Correlation analysis of CIG during the tasseling stage, (f) Correlation analysis of CIG during the grain-filling stage. *, ** denote significant differences at the p of 0.05 and 0.01 levels.
Agronomy 15 01389 g008
Figure 9. Path diagram of structural equation model. *, **, and *** indicate significant differences at p levels of 0.05, 0.01, and 0.001.
Agronomy 15 01389 g009
Figure 10. The predicted soil moisture content was compared with the measured soil moisture content using linear regression (LW) models (a,b), RF models (c,d), and ANN models (e,f). The black solid line is a 1:1 line. The dotted line is the fitting line.
Agronomy 15 01389 g010
Table 1. Irrigation amount during oat growth period (mm).
Irrigation Date20232024
5 June15 June25 June7 August20 August3 September3 June18 June27 June7 July14 July
OW113.536.036.036.036.036.018.036.036.036.036.0
OW213.533.033.033.033.033.016.533.033.033.033.0
OW313.530.030.030.030.030.015.030.030.030.030.0
OW413.527.027.027.027.027.013.527.027.027.027.0
Table 2. Basic physical and chemical parameters.
Soil
Layer
Depth
Particle Distribution (mm)Field CapacityBulk
Density
Soil Organic
Matter
PH
(cm)ClaySiltSand(cm3/cm3)(g/cm3)(g/kg)
0–204.1842.0153.810.281.422.347.01
20–404.242.5353.270.351.544.516.81
40–603.9338.5957.480.351.552.856.79
Disclaimer/Publisher’s Note: The statements, opinions and data contained in all publications are solely those of the individual author(s) and contributor(s) and not of MDPI and/or the editor(s). MDPI and/or the editor(s) disclaim responsibility for any injury to people or property resulting from any ideas, methods, instructions or products referred to in the content.

