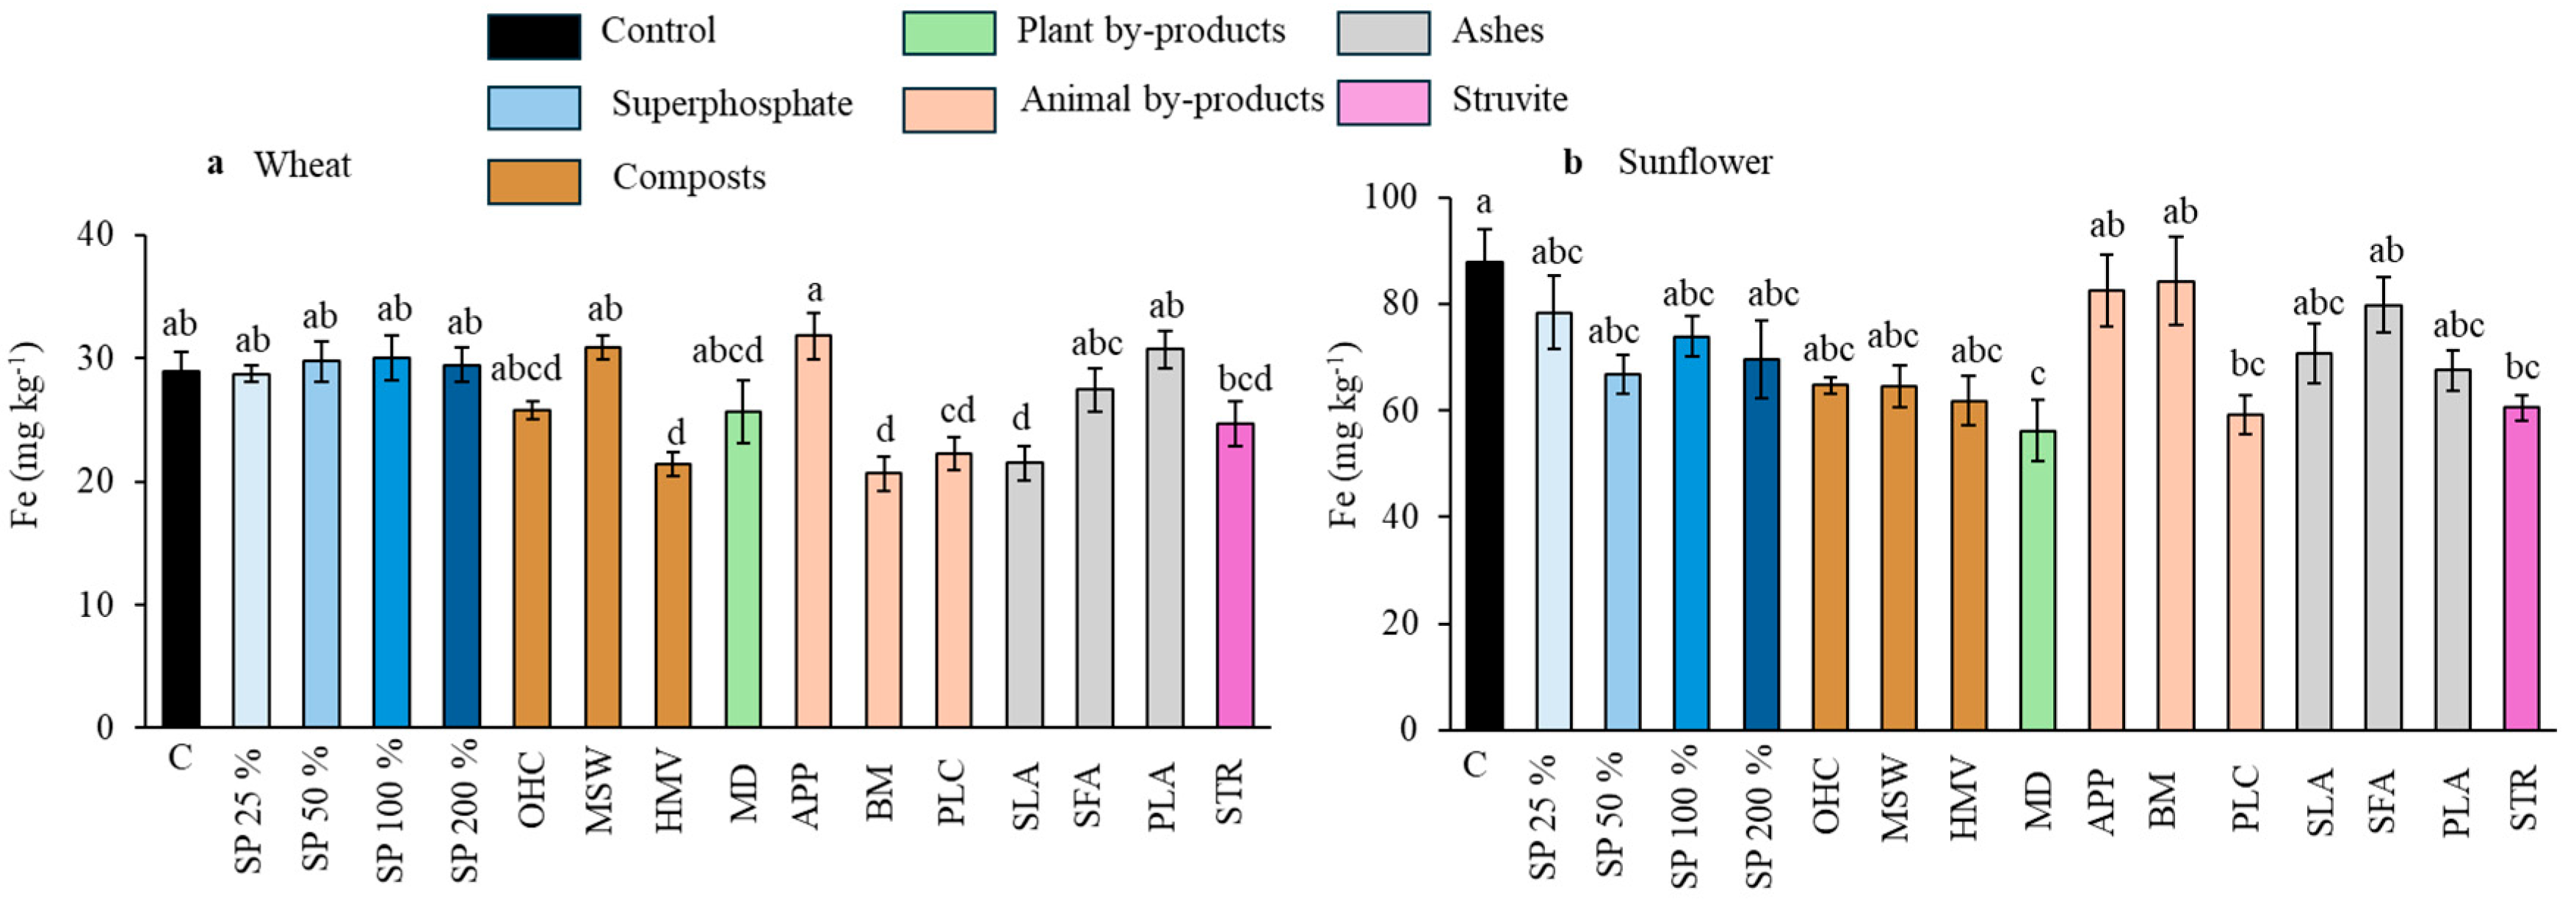
Figure 1.
Effect of the different fertilizer treatments on Fe concentration in wheat grains (a) and sunflower seeds (b). Means are averaged across both soils since the interaction between fertilizer treatment and soil was not significant. SP, superphosphate (the percentage indicates the rate relative to 50 mg kg−1, which is considered 100%); OHC, olive husk compost; MSW, municipal solid waste compost; HMV, horse manure compost; MD, maize digestates; APP, animal and plants mixed pellets; BM, bone meal; PLC, poultry litter compost; SLA, sewage sludge ashes; SFA, sunflower by-products ashes; PLA, poultry litter ashes; STR, struvite. Treatments in blue represent the superphosphate treatments, where the intensity of the color increases with increasing doses of P. Different letters indicate significant differences according to the Tukey test (p-value < 0.05 for both wheat and sunflower crops).
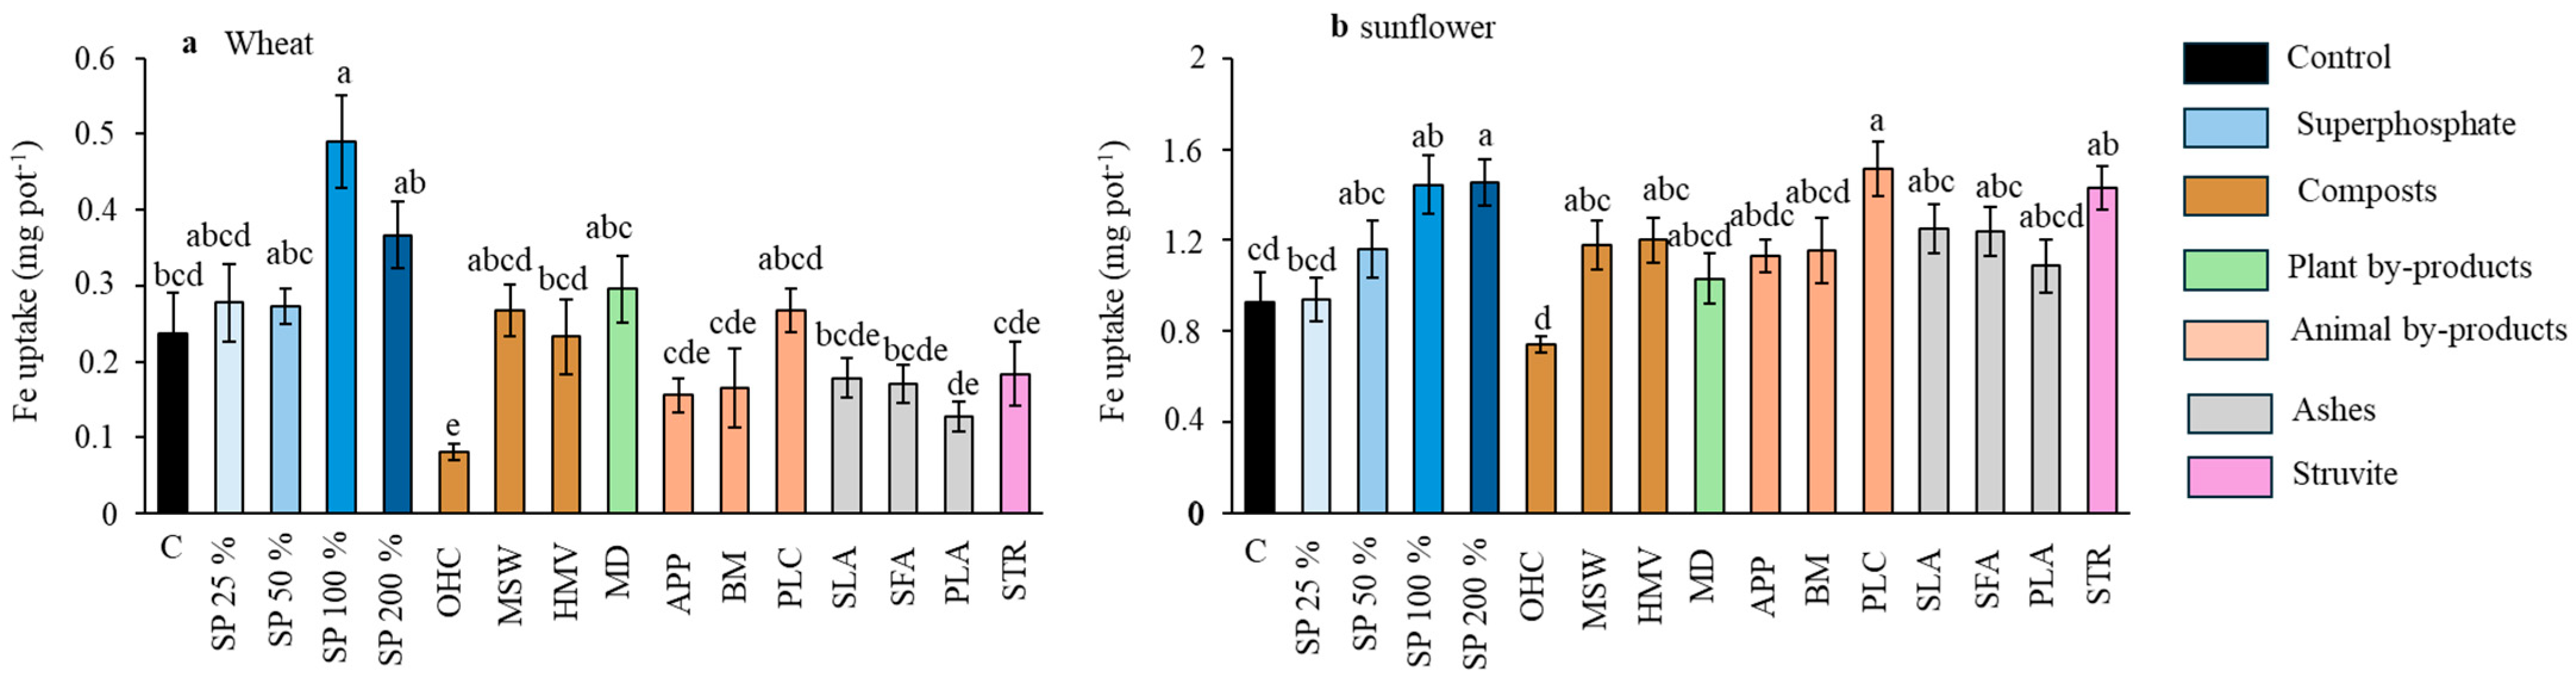
Figure 2.
Effect of the different fertilizer treatments on Fe uptake by wheat (a) and sunflower (b). Means are averaged across both soils. SP, superphosphate (the percentage indicates the rate relative to 50 mg kg−1, which is considered 100%); OHC, olive husk compost; MSW, municipal solid waste compost; HMV, horse manure vermicompost; MD, maize digestates; APP, animal and plants mixed pellets; BM, bone meal; PLC, poultry litter compost; SLA, sewage sludge ashes; SFA, sunflower by-products ashes; PLA, poultry litter ashes; STR, struvite. Treatments in blue represent the superphosphate treatments, where the intensity of the color increases with increasing doses of P. Different letters indicate significant differences according to the Tukey test (p-value < 0.05).
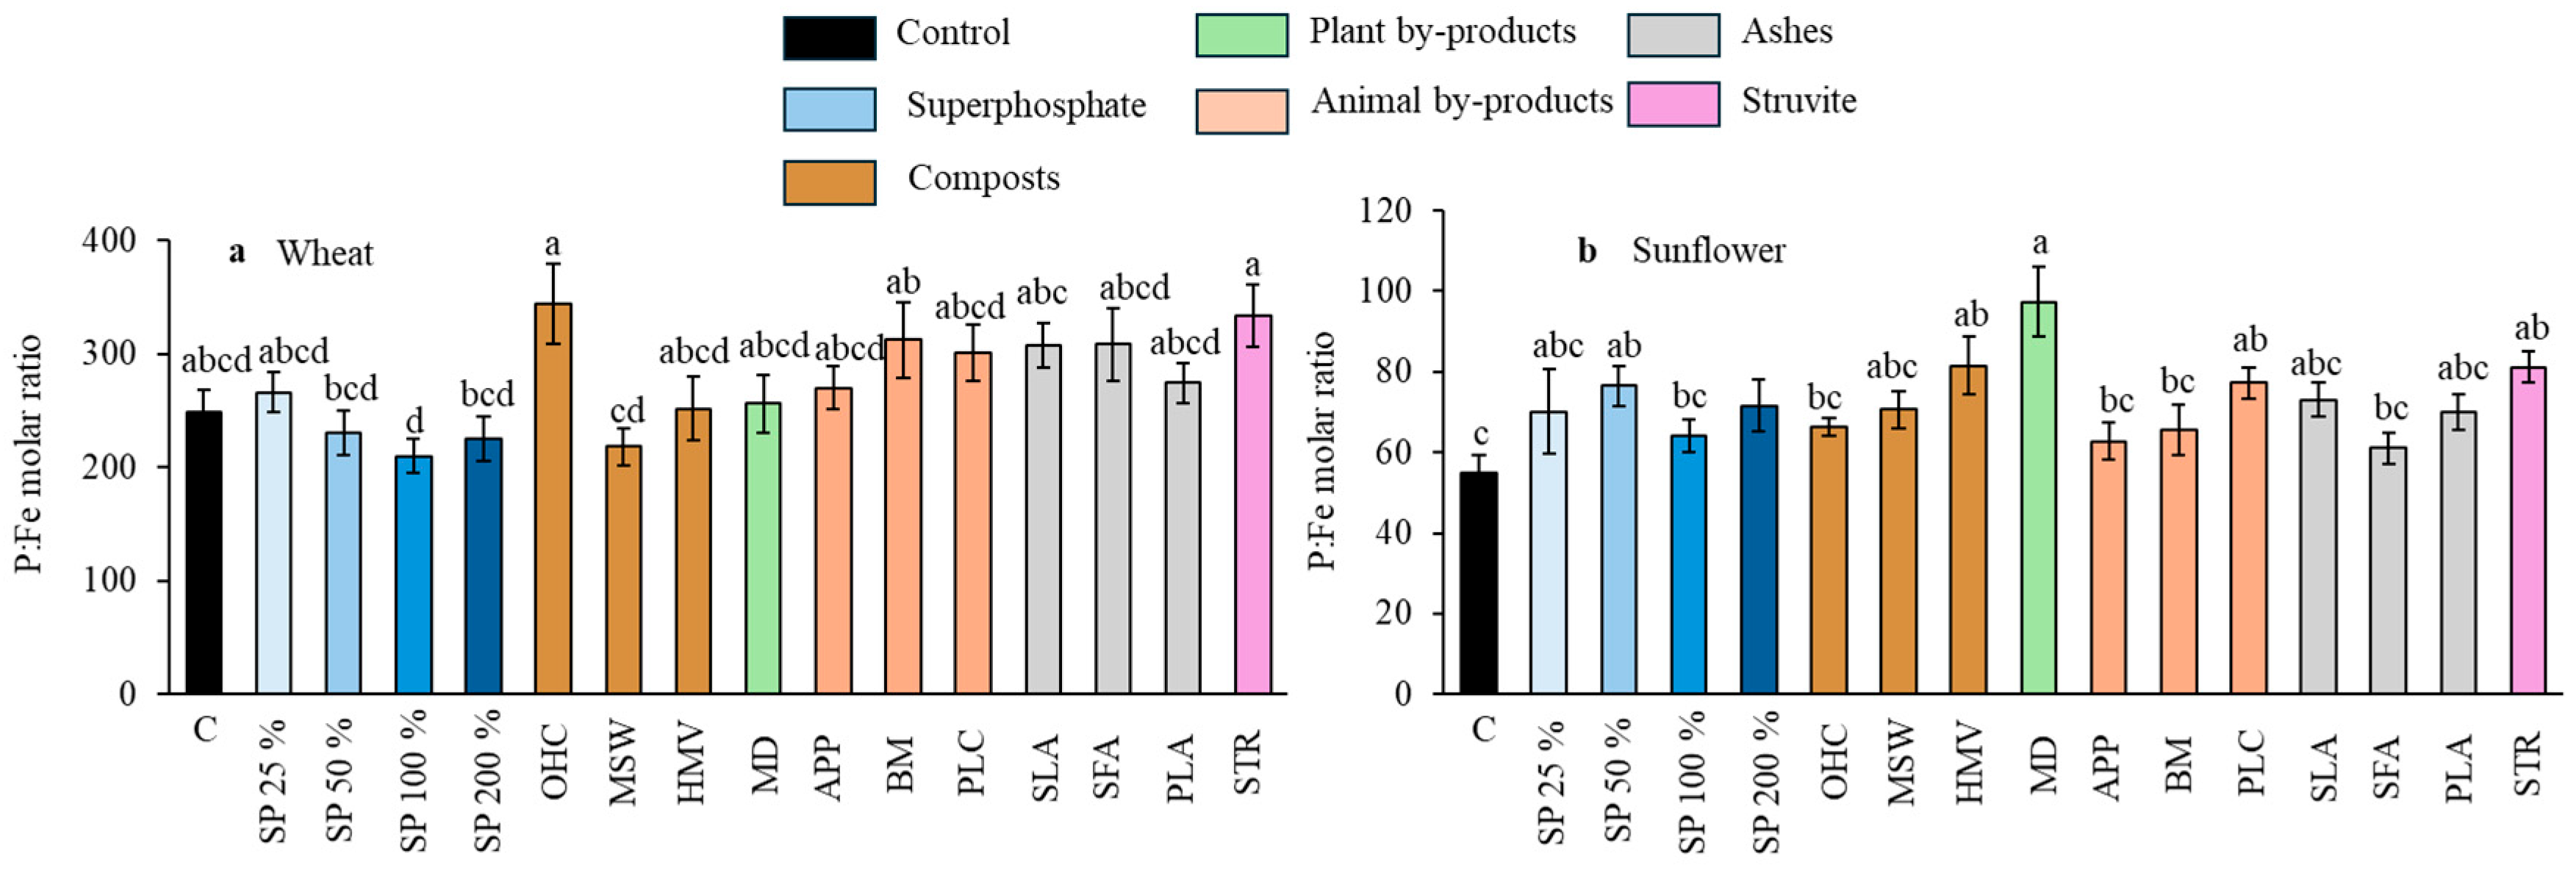
Figure 3.
Effect of the different fertilizer treatments on the P:Fe molar ratio in wheat grains (a) and in sunflower seeds (b). Means are averaged across both soils since the interaction between fertilizer treatments and soil was not significant; SP, superphosphate (the percentage indicates the rate relative to 50 mg kg−1, which is considered 100%); OHC, olive husk compost; MSW, municipal solid waste compost; HMV, horse manure vermicompost; MD, maize digestates; APP, animal and plants mixed pellets; BM, bone meal; PLC, poultry litter compost; SLA, sewage sludge ashes; SFA, sunflower by-products ashes; PLA, poultry litter ashes; STR, struvite. Treatments in blue represent the superphosphate treatments, where the intensity of the color increases with increasing doses of P. Different letters indicate significant differences according to the Tukey test (p-value < 0.05 for both wheat and sunflower crops).
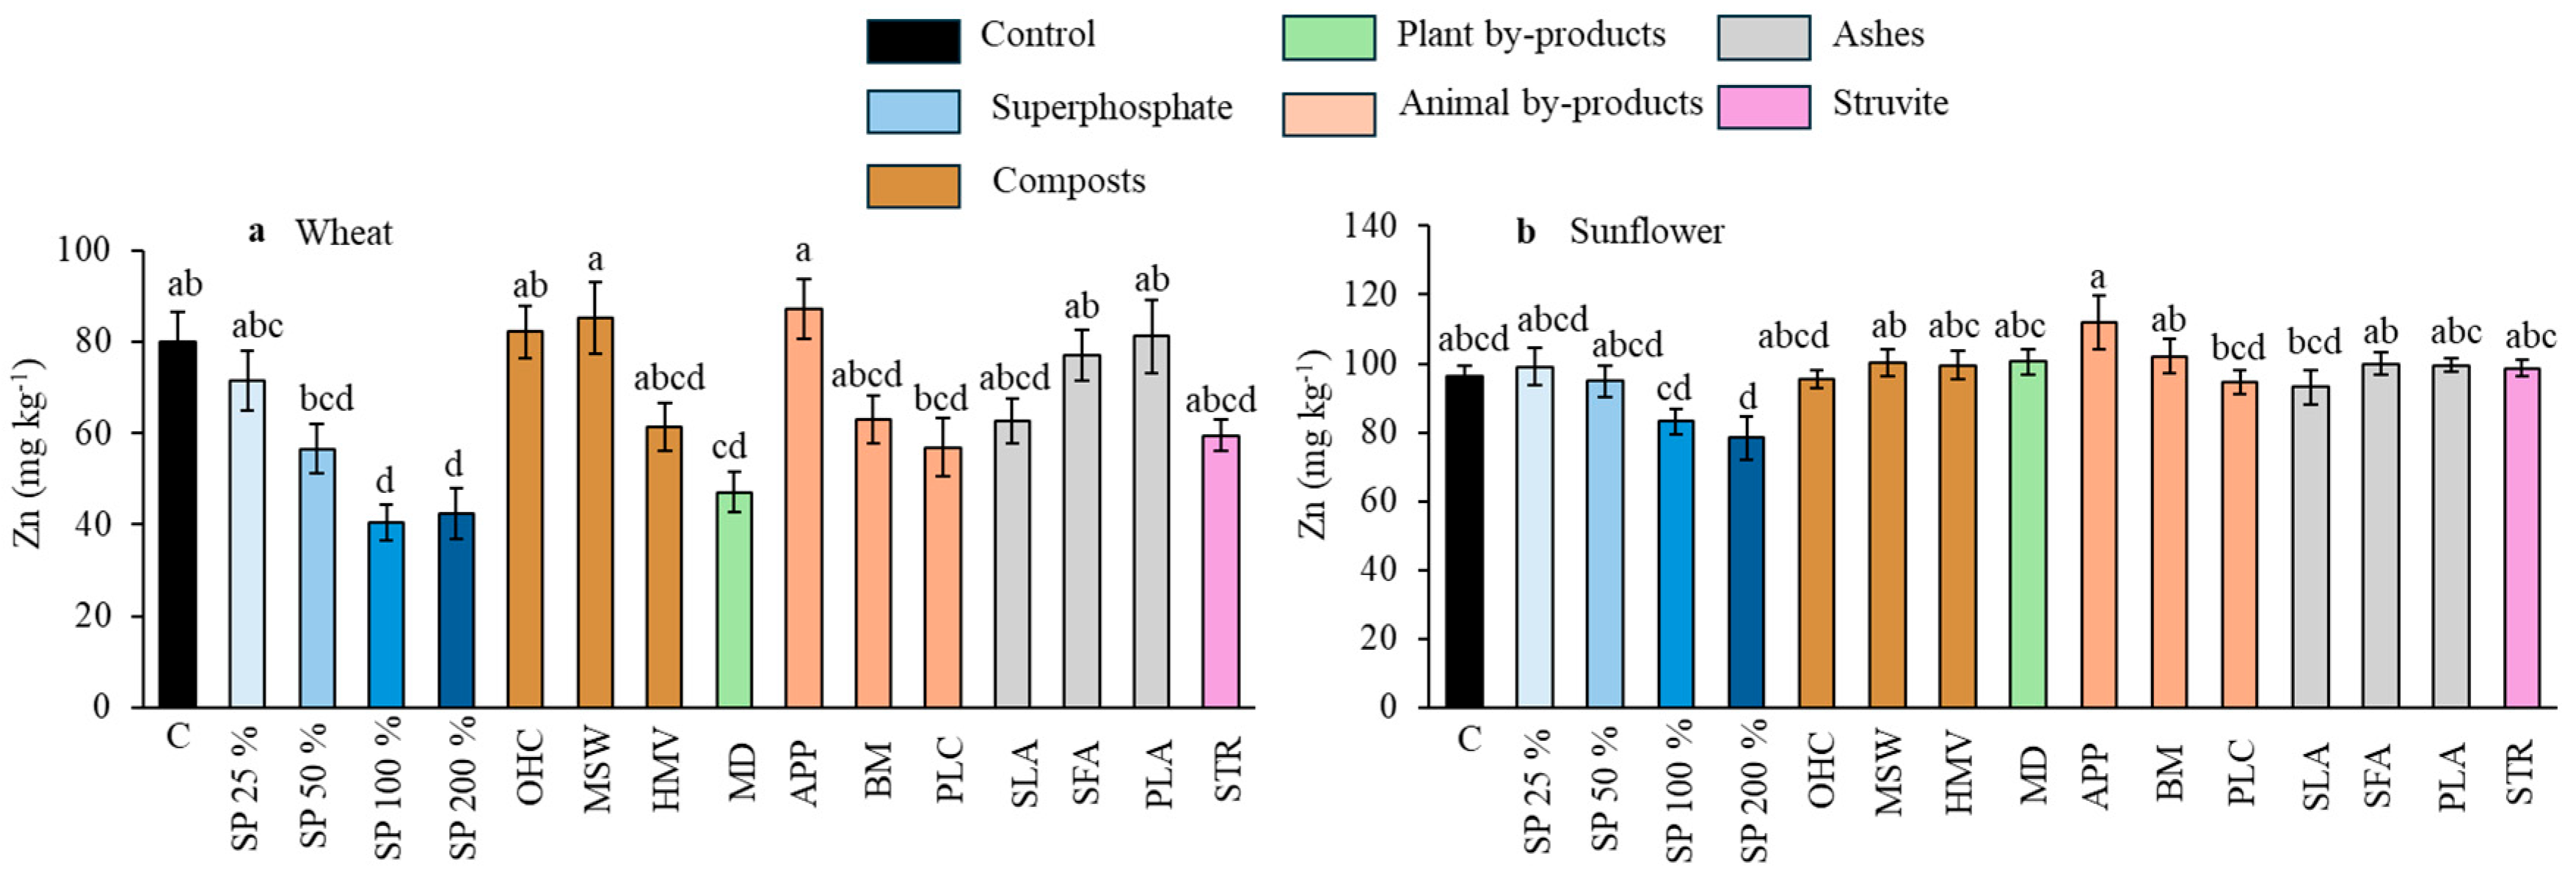
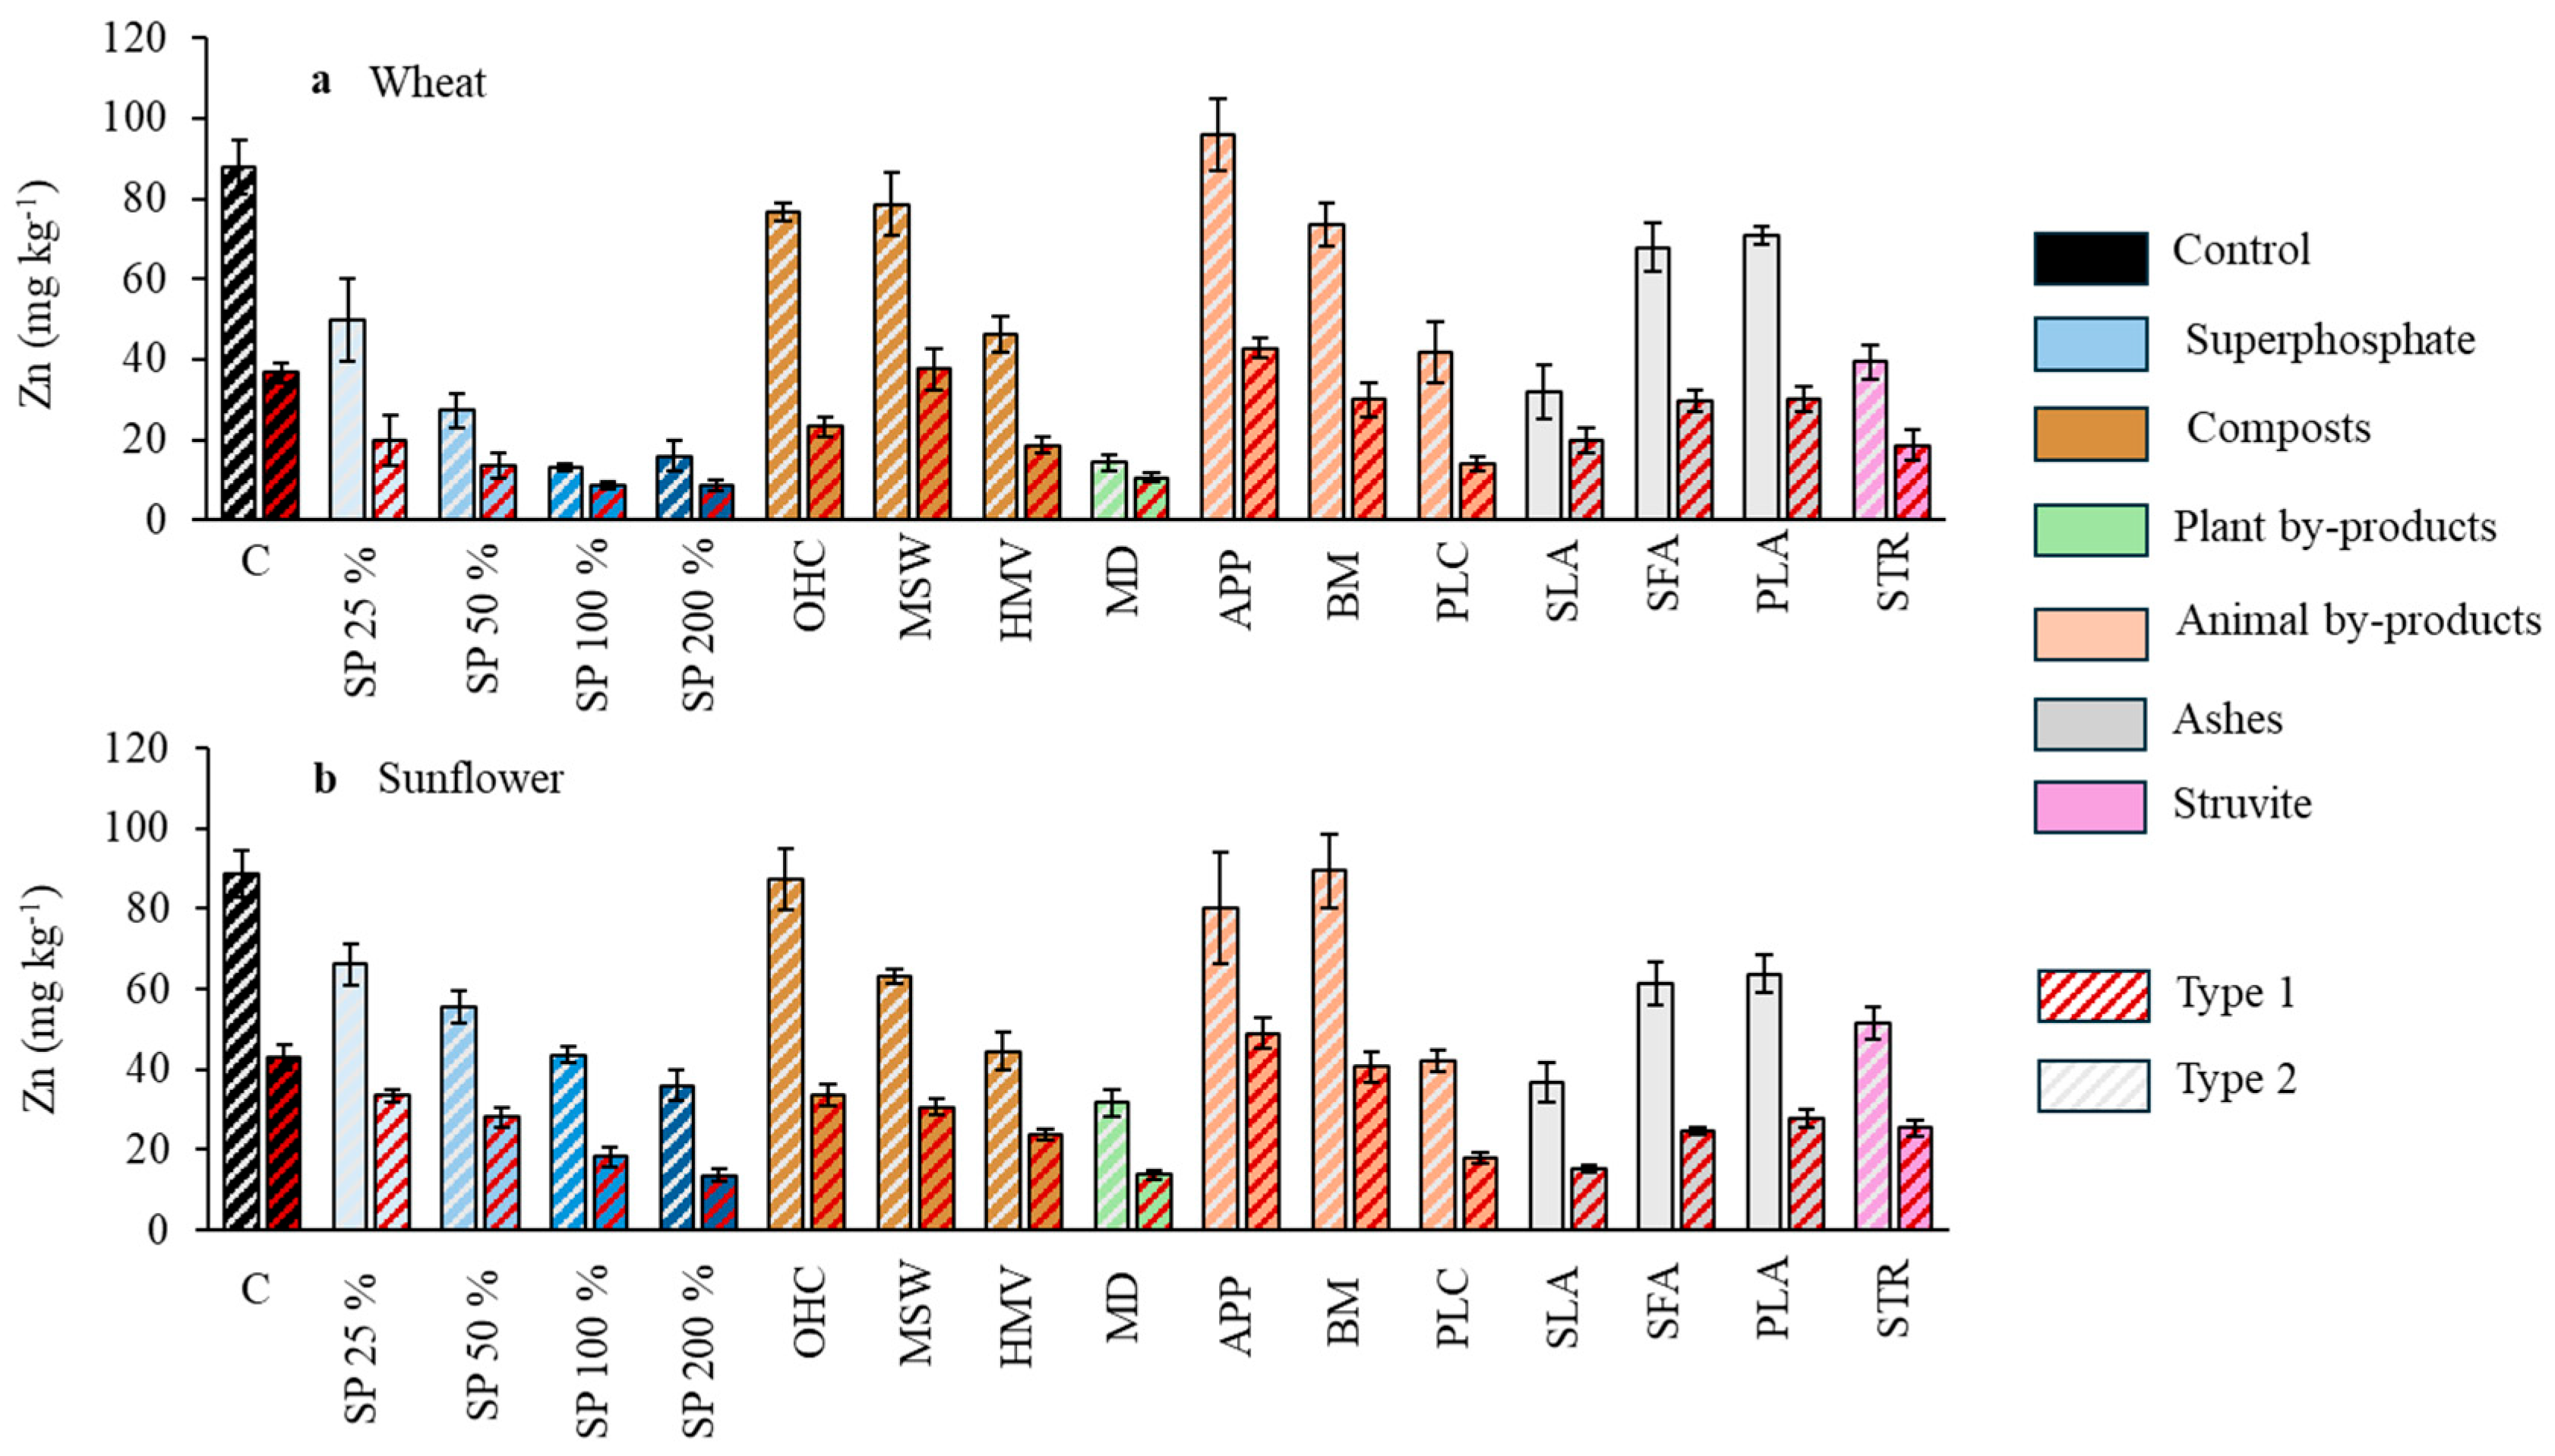
Figure 4.
Effect of the different fertilizer treatments on Zn concentration in wheat grains (a) and sunflower seeds (b). Means are averaged across both soils since the interaction between fertilizer treatments and soil was not significant; SP, superphosphate (the percentage indicates the rate relative to 50 mg kg−1, which is considered 100%); OHC, olive husk compost; MSW, municipal solid waste compost; HMV, horse manure vermicompost; MD, maize digestates; APP, animal and plants mixed pellets; BM, bone meal; PLC, poultry litter compost; SLA, sewage sludge ashes; SFA, sunflower by-products ashes; PLA, poultry litter ashes; STR, struvite. Treatments in blue represent the superphosphate treatments, where the intensity of the color increases with increasing doses of P. Different letters indicate significant differences according to the Tukey test (p-value < 0.05 for both wheat and sunflower crops).
Figure 5.
Effect of the different fertilizer treatments in each soil on the Zn concentration in wheat straw (
a) and sunflower straw (
b) fertilized with the different products evaluated. SP, superphosphate (the percentage indicates the rate relative to 50 mg kg
−1, which is considered 100%); OHC, olive husk compost; MSW, municipal solid waste compost; HMV, horse manure vermicompost; MD, maize digestates; AP3P, animal and plants mixed pellets; BM, bone meal; PLC, poultry litter compost; SLA, sewage sludge ashes; SFA, sunflower by-products ashes; PLA, poultry litter ashes; STR, struvite. Treatments in blue represent the superphosphate treatments, where the intensity of the color increases with growing doses of P. Mean comparison according to the joint analysis of both factors is shown in
Table A1.
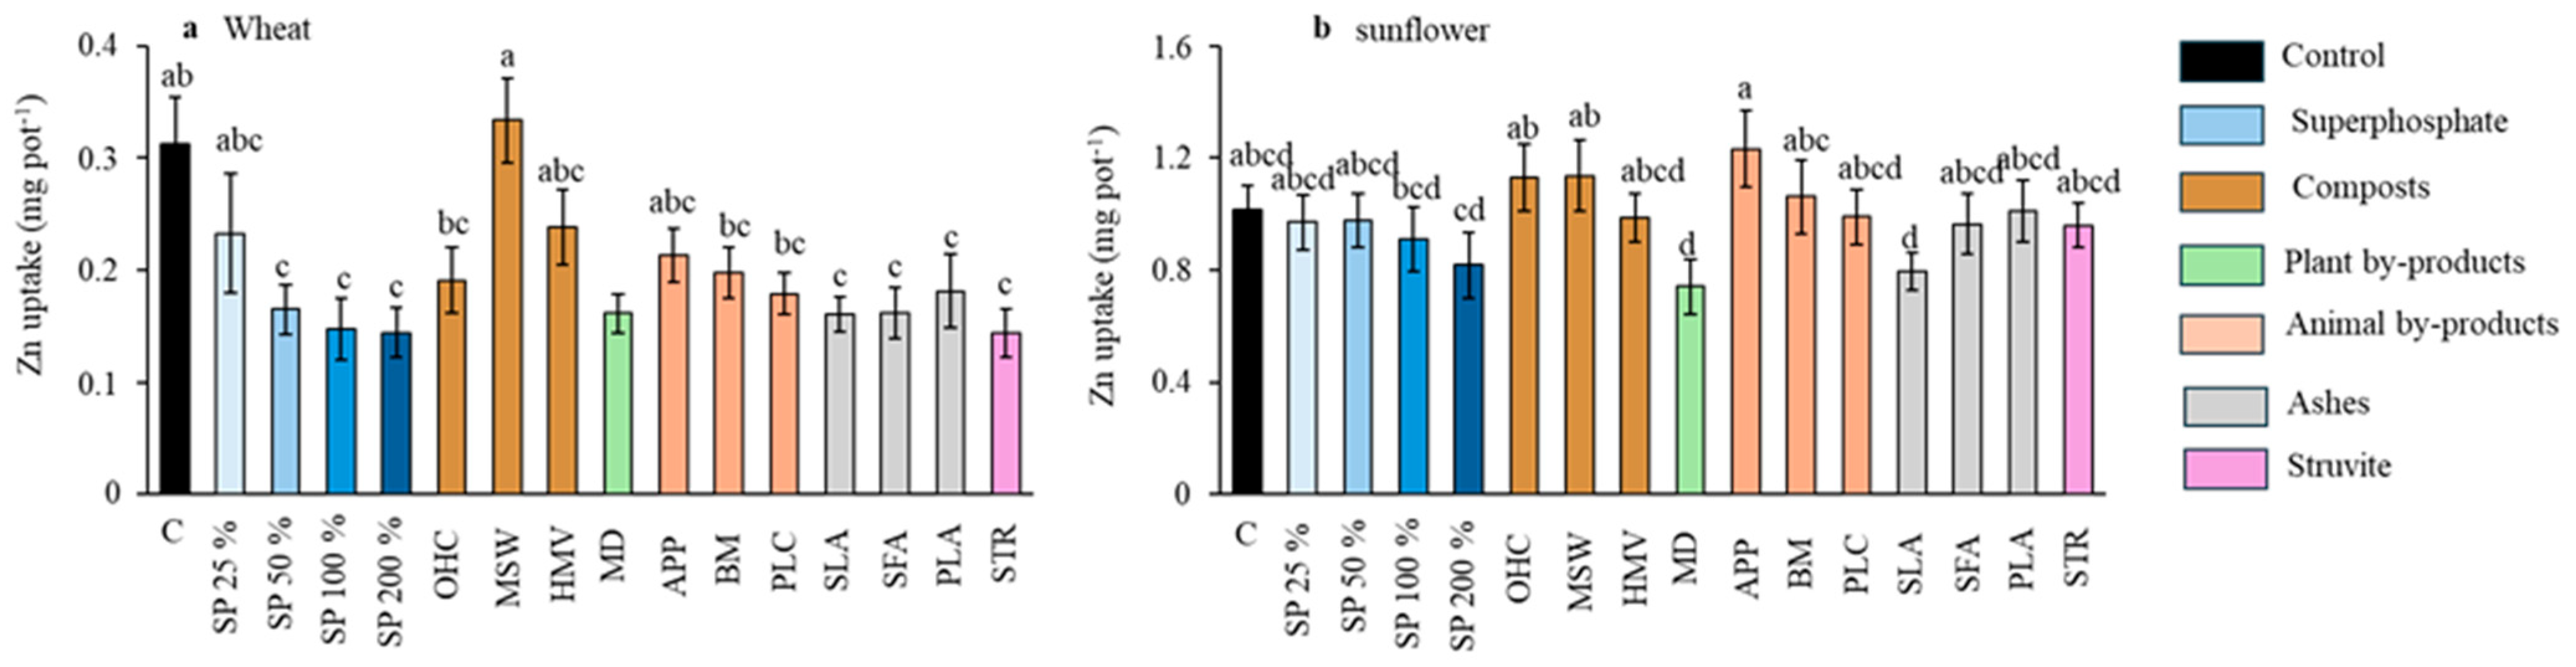
Figure 6.
Effect of the different fertilizer treatments on the Zn uptake by wheat (a) and sunflower (b). Means are averaged across both soils since the interaction between fertilizer treatments and soil was not significant; SP, superphosphate (the percentage indicates the rate relative to 50 mg kg−1, which is considered 100%); OHC, olive husk compost; MSW, municipal solid waste compost; HMV, horse manure vermicompost; MD, maize digestates; APP, animal and plants mixed pellets; BM, bone meal; PLC, poultry litter compost; SLA, sewage sludge ashes; SFA, sunflower by-products ashes; PLA, poultry litter ashes; STR, struvite. Treatments in blue represent the superphosphate treatments, where the intensity of the color increases with increasing doses of P. Different letters indicate significant differences according to the Tukey test (p-value < 0.05).
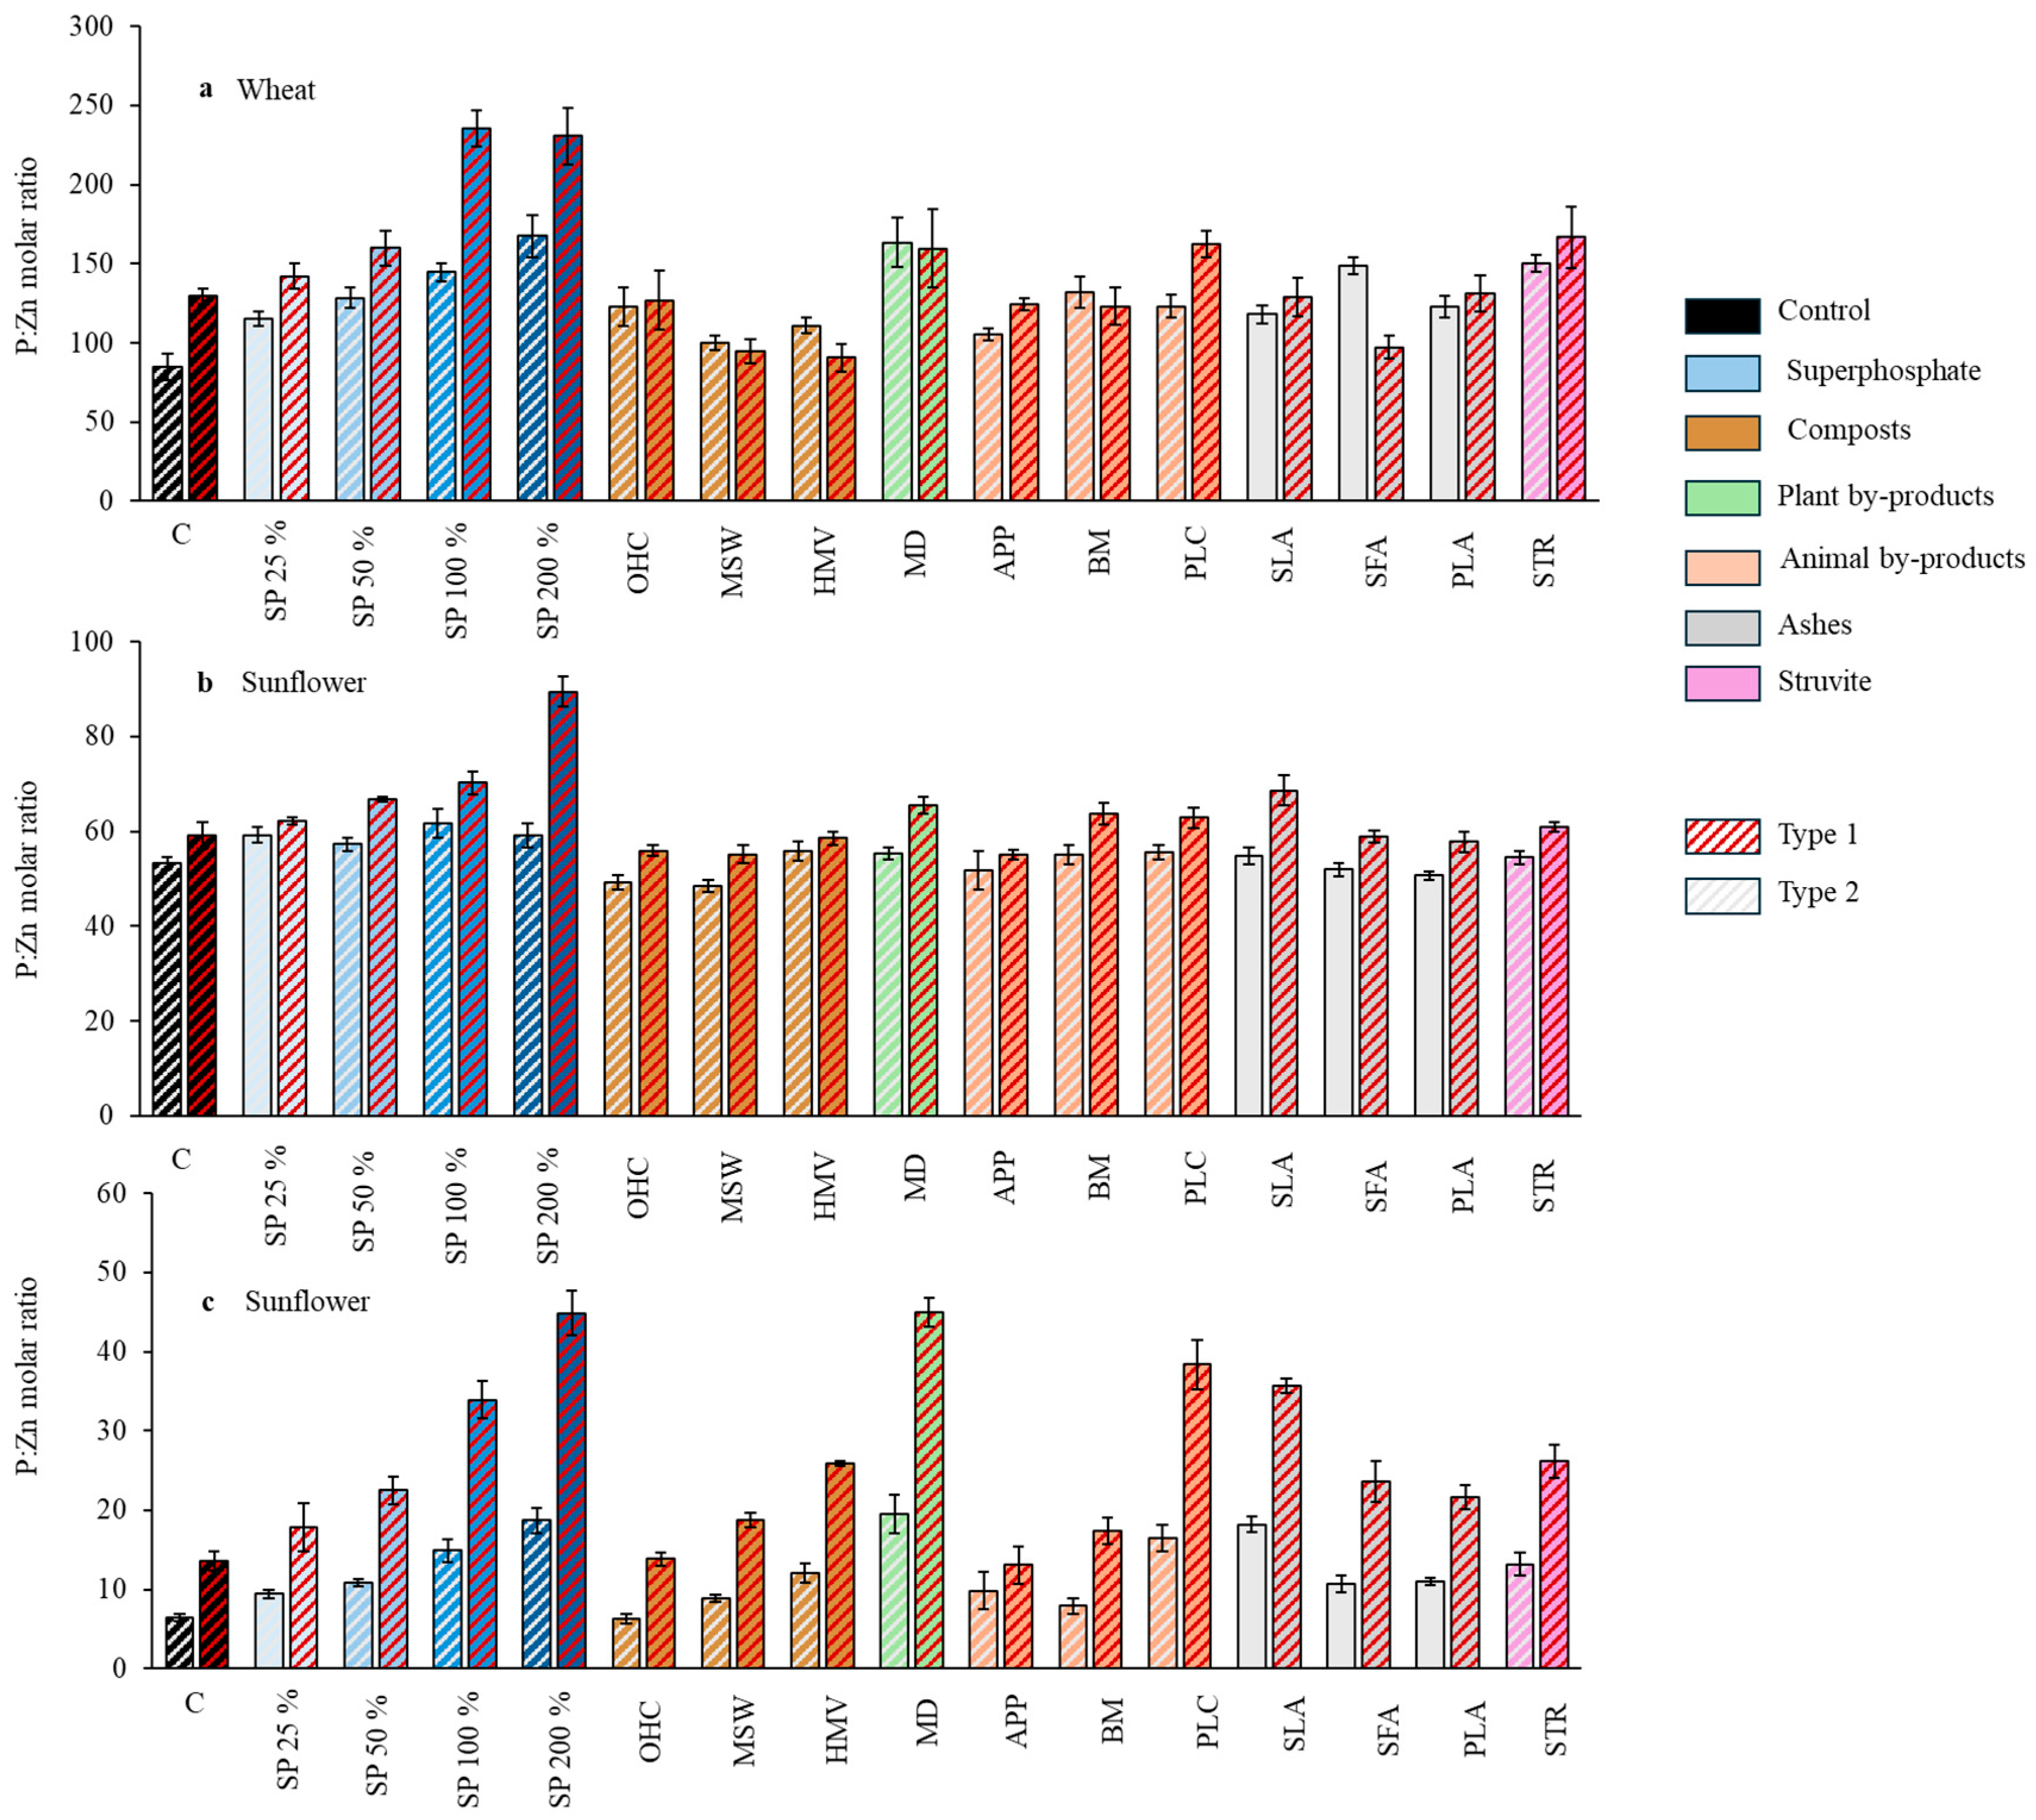
Figure 7.
Effect of the different fertilizer treatments in each soil on the P:Zn molar ratio in wheat grains (
a), sunflower seeds (
b), and sunflower straw (
c). SP, superphosphate (the percentage indicates the rate relative to 50 mg kg
−1, which is considered 100%); OHC, olive husk compost; MSW, municipal solid waste compost; HMV, horse manure vermicompost; MD, maize digestates; APP, animal and plants mixed pellets; BM, bone meal; PLC, poultry litter compost; SLA, sewage sludge ashes; SFA, sunflower by-products ashes; PLA, poultry litter ashes; STR, struvite. Interaction in both crops was significant (
p-value < 0.05). Treatments in blue represent the superphosphate treatments, where the intensity of the color increases with increasing doses of P. Mean comparison according to the joint analysis of both factors are shown in
Table A1.
Table 1.
Properties of the soils used in the study.
Table 1.
Properties of the soils used in the study.
| Soil | Sand | Loam | Clay | SOC | CCE | pH | CEC | Olsen P | Fe | Zn | Feox |
|---|
| | % | | cmolc kg−1 | mg kg−1 | g kg−1 |
|---|
| Type 1 | 60 | 17 | 23 | 0.51 | 6.8 | 8.37 | 10.3 | 8.5 | 8.4 | 2.2 | 7.6 |
| Type 2 | 29 | 47 | 24 | 0.68 | 57.2 | 8.29 | 9.6 | 6.4 | 9 | 3.3 | 3.2 |
Table 2.
Composition of BBFs evaluated in the experiment: dry mass and total content of nutrients.
Table 2.
Composition of BBFs evaluated in the experiment: dry mass and total content of nutrients.
| BBFs | Dry Mass | C | N | P | Fe | Zn |
|---|
| | % | g kg−1 | mg kg−1 |
|---|
| OHC | 90.2 | 413 | 18.62 | 1.8 | 3.8 | 31.2 |
| MSW | 81.5 | 347 | 16.73 | 3.4 | 4.5 | 264.9 |
| HMV | 76.3 | 261 | 21.97 | 6.9 | 6.2 | 146.7 |
| MD | 90.4 | 478 | 55.0 | 13.6 | 0.2 | 119.5 |
| APP | 91.71 | 237 | 24.9 | 67.4 | 1.96 | 130 |
| BM | 97.6 | 374 | 81.25 | 63.4 | 0.2 | 89.7 |
| PLC | 84.9 | 372 | 31.5 | 19.6 | 1.4 | 375 |
| SLA | 100 | 1.0 | 0.5 | 80.5 | 91.9 | 1635 |
| SFA | 97.1 | 5.7 | 1.3 | 19.5 | 1.8 | 299.5 |
| PLA | 92.1 | 6.1 | 0.1 | 52.3 | 4.9 | 1946.5 |
| STR | 54.8 | 4.0 | 101 | 227.5 | 5.6 | 4.2 |
Table 3.
Effect of the different fertilizer treatments averaged across both soils (the interaction was not significant) on the concentration of Fe and on the P:Fe ratio of wheat and sunflower straw.
Table 3.
Effect of the different fertilizer treatments averaged across both soils (the interaction was not significant) on the concentration of Fe and on the P:Fe ratio of wheat and sunflower straw.
| | Fe Concentration | P:Fe |
|---|
| | mg kg−1 | Molar Ratio |
|---|
| BBFs | Wheat | Sunflower | Wheat | Sunflower |
|---|
| C | 64.7 ab | 49.4 bc | 7.9 bc | 11.2 ab |
| SP 25% | 102.2 ab | 46.7 bc | 10.9 bc | 11.5 ab |
| SP 50% | 66.9 ab | 58.1 ab | 9.9 bc | 10.4 abc |
| SP 100% | 109.2 a | 71.8 ab | 5.8 c | 7.8 bc |
| SP 200% | 63.1 abc | 67.3 ab | 12.4 bc | 8.8 bc |
| OHC | 29.9 c | 33.4 c | 38.0 a | 13.0 a |
| MSW | 75.1 ab | 60.6 ab | 13.7 abc | 9.5 abc |
| HMV | 60.9 abc | 57.3 abc | 15.3 abc | 9.3 abc |
| MD | 58.9 abc | 57.3 ab | 15.5 abc | 9.5 abc |
| APP | 74.7 ab | 70.7 ab | 14.9 abc | 9.2 abc |
| BM | 51.3 abc | 57.0 ab | 20.6 ab | 10.1 abc |
| PLC | 76.8 ab | 65.7 ab | 12.1 bc | 9.3 abc |
| SLA | 42.7 bc | 56.7 ab | 24.8 ab | 8.4 bc |
| SFA | 92.9 ab | 64.8 ab | 19.2 abc | 8.6 bc |
| PLA | 51.2 abc | 59.0 ab | 19.7 abc | 9.7 abc |
| STR | 75.3 abc | 81.3 a | 27.8 ab | 7.3 c |
Table 4.
Effect of the different fertilizer treatments averaged across both soils (the interaction was not significant) on the P:Zn ratios in wheat straw.
Table 4.
Effect of the different fertilizer treatments averaged across both soils (the interaction was not significant) on the P:Zn ratios in wheat straw.
| BBFs | P:Zn |
|---|
| | Molar Ratio |
|---|
| C | 11.9 h |
| SP 25% | 34.1 cdefg |
| SP 50% | 34.3 abcdef |
| SP 100% | 57.4 abc |
| SP 200% | 69.0 a |
| OHC | 47.9 abcdef |
| MSW | 21.0 fgh |
| HMV | 26.8 defg |
| MD | 65.6 a |
| APP | 17.0 gh |
| BM | 23.0 defgh |
| PLC | 41.1 abcde |
| SLA | 44.0 abcd |
| SFA | 35.9 bcdefg |
| PLA | 21.1 efgh |
| STR | 64.0 ab |
Table 5.
Pearson’s correlation coefficients between nutritional variables studied (P, Fe, and Zn concentration in grains and straws, as well as uptake by plants) for wheat and sunflower in both studied soils.
Table 5.
Pearson’s correlation coefficients between nutritional variables studied (P, Fe, and Zn concentration in grains and straws, as well as uptake by plants) for wheat and sunflower in both studied soils.
| Wheat |
| Soil Type 1 |
| | P_G | Fe_G | Zn_G | P_S | Fe_S | Zn_S | P upt | Fe upt | Zn upt |
| P_G | | −0.18 | 0.76 | −0.06 | −0.27 | 0.90 * | −0.35 | −0.59 | 0.87 |
| Fe_G | 0.60 | | −0.50 | −0.16 | −0.55 | −0.36 | 0.89 * | −0.13 | −0.12 |
| Zn_G | 0.46 | 0.79 ** | | 0.02 | −0.34 | 0.97 ** | −0.74 | −0.58 | 0.91 * |
| P_S | 0.44 | 0.64 * | 0.73 * | | 0.45 | −0.05 | 0.13 | 0.72 | −0.01 |
| Fe_S | 0.21 | 0.28 | 0.58 | 0.24 | | −0.39 | −0.12 | 0.79 | −0.57 |
| Zn_S | −0.16 | 0.11 | 0.34 | 0.13 | 0.23 | | −0.61 | −0.66 | 0.96 ** |
| P upt | −0.12 | −0.03 | −0.41 | −0.44 | −0.25 | 0.12 | | 0.30 | −0.41 |
| Fe upt | −0.69 * | −0.28 | −0.48 | −0.40 | −0.29 | 0.02 | 0.52 | | −0.69 |
| Zn upt | −0.21 | 0.16 | 0.22 | 0.35 | −0.04 | 0.45 | 0.35 | 0.46 | |
| Soil Type 2 |
| | P_G | Fe_G | Zn_G | P_S | Fe_S | Zn_S | P upt | Fe upt | Zn upt |
| P_G | | 0.48 | 0.52 | 0.99 ** | −0.01 | 0.15 | −0.43 | −0.76 | 0.14 |
| Fe_G | 0.53 | | −0.38 | 0.60 | 0.54 | −0.68 | 0.47 | 0.12 | −0.62 |
| Zn_G | 0.66 * | 0.72 * | | 0.42 | −0.10 | 0.91 * | −0.99 *** | −0.63 | 0.91 * |
| P_S | 0.52 | 0.23 | 0.35 | | 0.07 | 0.05 | −0.31 | −0.67 | 0.05 |
| Fe_S | −0.09 | 0.15 | 0.04 | −0.26 | | −0.23 | 0.12 | 0.63 | −0.08 |
| Zn_S | 0.10 | −0.01 | 0.11 | 0.19 | 0.04 | | −0.93 * | −0.45 | 0.99 |
| P upt | −0.48 | −0.22 | −0.71 * | −0.43 | 0.11 | 0.03 | | 0.58 | −0.93 * |
| Fe upt | −0.55 | 0.19 | −0.25 | −0.35 | 0.29 | 0.22 | 0.60 * | | −0.35 |
| Zn upt | 0.13 | 0.63 * | 0.57 | 0.08 | 0.05 | 0.37 | −0.03 | 0.55 | |
| Sunflower |
| Soil Type 1 |
| | P_G | Fe_G | Zn_G | P_S | Fe_S | Zn_S | P upt | Fe upt | Zn upt |
| P_G | | −0.50 | 0.62 | 0.05 | −0.15 | 0.53 | −0.83 | −0.38 | 0.62 |
| Fe_G | 0.24 | | −0.49 | 0.20 | −0.10 | −0.22 | 0.44 | 0.23 | −0.42 |
| Zn_G | 0.06 | 0.34 | | −0.75 | −0.22 | 0.96 * | −0.99 ** | −0.57 | 0.98 ** |
| P_S | 0.00 | −0.31 | 0.00 | | 0.19 | −0.77 | 0.89 | 0.44 | −0.72 |
| Fe_S | −0.28 | −0.01 | 0.25 | 0.73 * | | −0.20 | 0.41 | 0.91 * | −0.08 |
| Zn_S | −0.11 | −0.10 | 0.16 | 0.46 | 0.09 | | −0.97 * | −0.50 | 0.97 ** |
| P upt | −0.11 | −0.56 | −0.63 * | 0.18 | 0.23 | −0.51 | | 0.69 | −0.97 * |
| Fe upt | 0.60 | −0.19 | −0.21 | −0.22 | −0.29 | −0.55 | 0.52 | | −0.43 |
| Zn upt | −0.31 | 0.37 | 0.67 * | −0.09 | 0.47 | −0.03 | −0.36 | −0.34 | |
| Soil Type 2 |
| | P_G | Fe_G | Zn_G | P_S | Fe_S | Zn_S | P upt | Fe upt | Zn upt |
| P_G | | −0.31 | 0.35 | 0.10 | −0.11 | 0.02 | −0.28 | −0.18 | −0.18 |
| Fe_G | 0.34 | | 0.62 | −0.75 | −0.73 | 0.90 * | −0.79 | −0.78 | 0.22 |
| Zn_G | 0.65 * | 0.56 | | −0.83 | −0.95 * | 0.87 | −0.92 * | −0.96 ** | 0.18 |
| P_S | 0.03 | −0.22 | −0.10 | | 0.96 * | −0.92 * | 0.85 | 0.92 | −0.61 |
| Fe_S | −0.15 | −0.05 | −0.03 | 0.71 * | | −0.94 * | 0.93 * | 0.99 ** | −0.42 |
| Zn_S | −0.09 | 0.03 | 0.13 | 0.27 | −0.20 | | −0.97 ** | −0.97 ** | 0.41 |
| P upt | 0.13 | −0.66 * | −0.48 | −0.15 | −0.28 | −0.31 | | 0.98 ** | −0.33 |
| Fe upt | 0.10 | −0.18 | −0.13 | −0.55 | −0.15 | −0.71 * | 0.63 * | | −0.36 |
| Zn upt | −0.51 | 0.42 | 0.10 | −0.30 | −0.03 | 0.21 | −0.66 * | −0.36 | |


 ,
, 