1. Introduction
Water scarcity is a serious global issue affecting millions of people and ecosystems around the world, especially in drylands [
1]. According to the United Nations (
www.unwater.org, accessed on 12 February 2025), approximately 40% of the world’s population may face the risk of serious water scarcity by 2040. Existing assessments of future water scarcity suggest that increased global water demands related to population growth and economic development, combined with variations in water availability owing to altered hydrometeorological regimes, are exacerbating water scarcity issues globally [
2,
3]. Among many interventions to provide water supply security, inter-basin water transfer is a commonly used engineering approach to reduce the water deficit in water-stressed areas by directly transferring excess water from one water-surplus basin to another water-scarce basin [
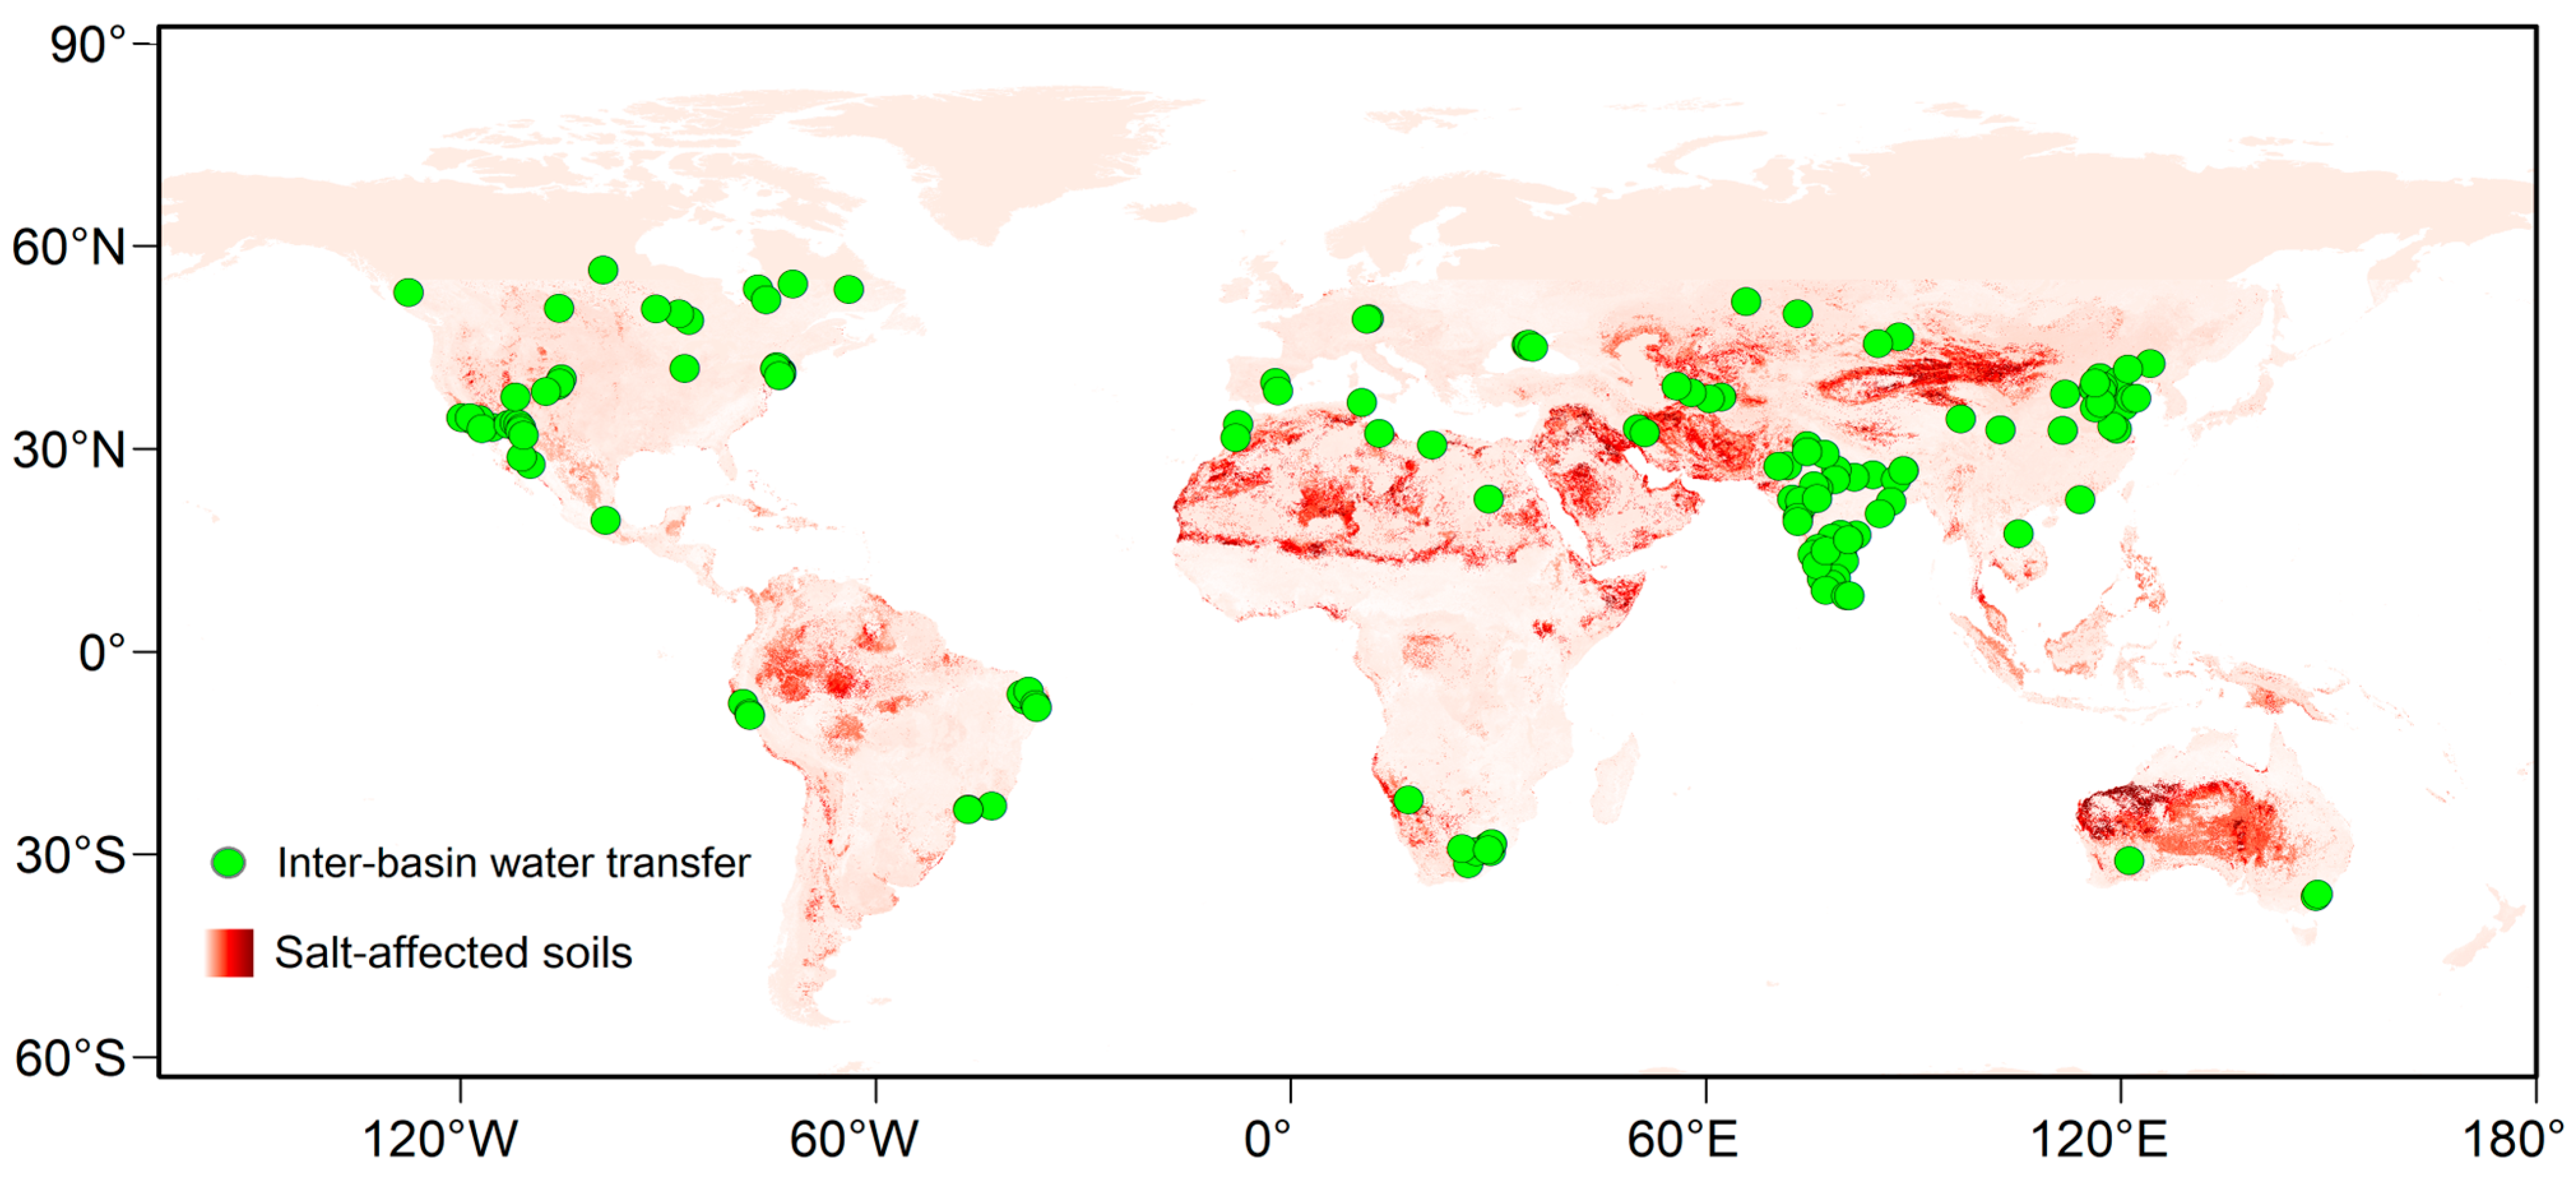
4]. The inter-basin water transfer has a long history worldwide, with the majority of schemes implemented in the early 1900s rising to a peak in the 1970s and 1980s and the average water transfer capacity per project increasing from 3.56 km
3 per year up to 1980 to a projected 12.7 km
3 per year in 2050, especially in arid and semi-arid areas (
Figure 1) [
5]. Nevertheless, inter-basin water transfers inevitably involve the redistribution of water resources in the relevant basins and may cause regional eco-environmental changes. Such changes involve both positive impacts, such as the promotion of the water cycle, the alleviation of ecological water scarcity, and the restoration of damaged ecosystems, and negative impacts, such as exacerbating regional soil salinization, deteriorating groundwater quality, and reductions in land productivity [
6,
7]. Therefore, it is crucial to reveal the long-term impacts of inter-basin water transfers on the regional soil and water environments.
Soil salinization is one of the major land degradation threats affecting soil stability, fertility, and biodiversity [
8]. Worldwide, about 37% of arable land is categorized as sodic and 23% as saline, and nearly 50% of irrigated lands globally are considered to be significantly affected by soil salinization (
Figure 1) [
9]. Soil salinity refers to high concentrations of salt in the soil, while soil sodicity indicates a situation where sodium makes up a large portion of the total cations and is not necessarily accompanied by high salinity [
10]. Both soil salinity and soil sodicity levels are spatially, vertically, and temporally dynamic, especially in arid environments, and are substantially influenced by governing climatic conditions and anthropogenic activities [
8,
11]. Generally, water is the primary driver of the salt transport through the soil, and seasonal changes in soil salinity and sodicity in the root zone occur as water enters and leaves the system. Also, precipitation regimes, irrigation management, and water quality can significantly affect root zone salinity and sodicity dynamics by controlling leaching and transpiration processes. Moreover, capillary upflow plays a dominant role in the dynamics of soil water and salts, which is strongly influenced by the shallow groundwater table and salinity. Furthermore, the plant salt tolerance and soil properties are important aspects of long-term root zone salt buildup, thereby controlling land productivity [
12,
13,
14,
15]. Nevertheless, the effect of inter-basin water transfer on the long-term dynamics of soil salinity and sodicity is poorly understood, especially under varying irrigation practices.
Figure 1.
Global inter-basin water transfer systems [
16] and a global distribution map of salt-affected soils in 2018 (excluding the frigid zones) [
9].
Figure 1.
Global inter-basin water transfer systems [
16] and a global distribution map of salt-affected soils in 2018 (excluding the frigid zones) [
9].
The influence of salinization on crop production and concerns regarding its management have been the focus of agronomic research [
10]. Salinization can reduce yields of many crops by 10~25%, and in severe cases, it can make crops completely uncultivable and lead to land desertification. Typically, soil salinity and sodicity directly affect healthy plant growth by affecting the plant water uptake, plant nutrient effectiveness, and imposing plant toxicity, as well as indirectly by the degradation of soil physical conditions [
17]. For instance, the elevated osmotic pressure of the soil moisture can impede the water uptake by the roots, and nutrient imbalances, which conversely can result in toxicities and deficiencies, are the main reasons for the unfavorable effects of soil salinity and sodicity on plant growth [
18]. Other unfavorable factors include poor soil physical regimes, such as a low permeability to water, which is induced by the clay swelling and dispersion related to complex interactions between sodicity and electrolyte concentrations [
19]. Furthermore, soil salinity and sodicity can impose stress on agricultural crops, and when critical threshold ranges are exceeded, yields decrease [
20]. In recent decades, plant response functions to various growth and environmental factors have been proposed and applied, with considerable attention concentrated on water and salinity [
21]. At the same time, the response of crop yield reductions to soil salinity is often modeled using a threshold-type function [
22] or a sigmoid (S-shaped) function [
23]. Also, for most crops with different salt tolerances, this response function follows a sigmoidal relationship [
24]. Hence, the plant response function to salinity is an effective tool to study the effect of salinity on crop yields in the inter-basin water transfer area.
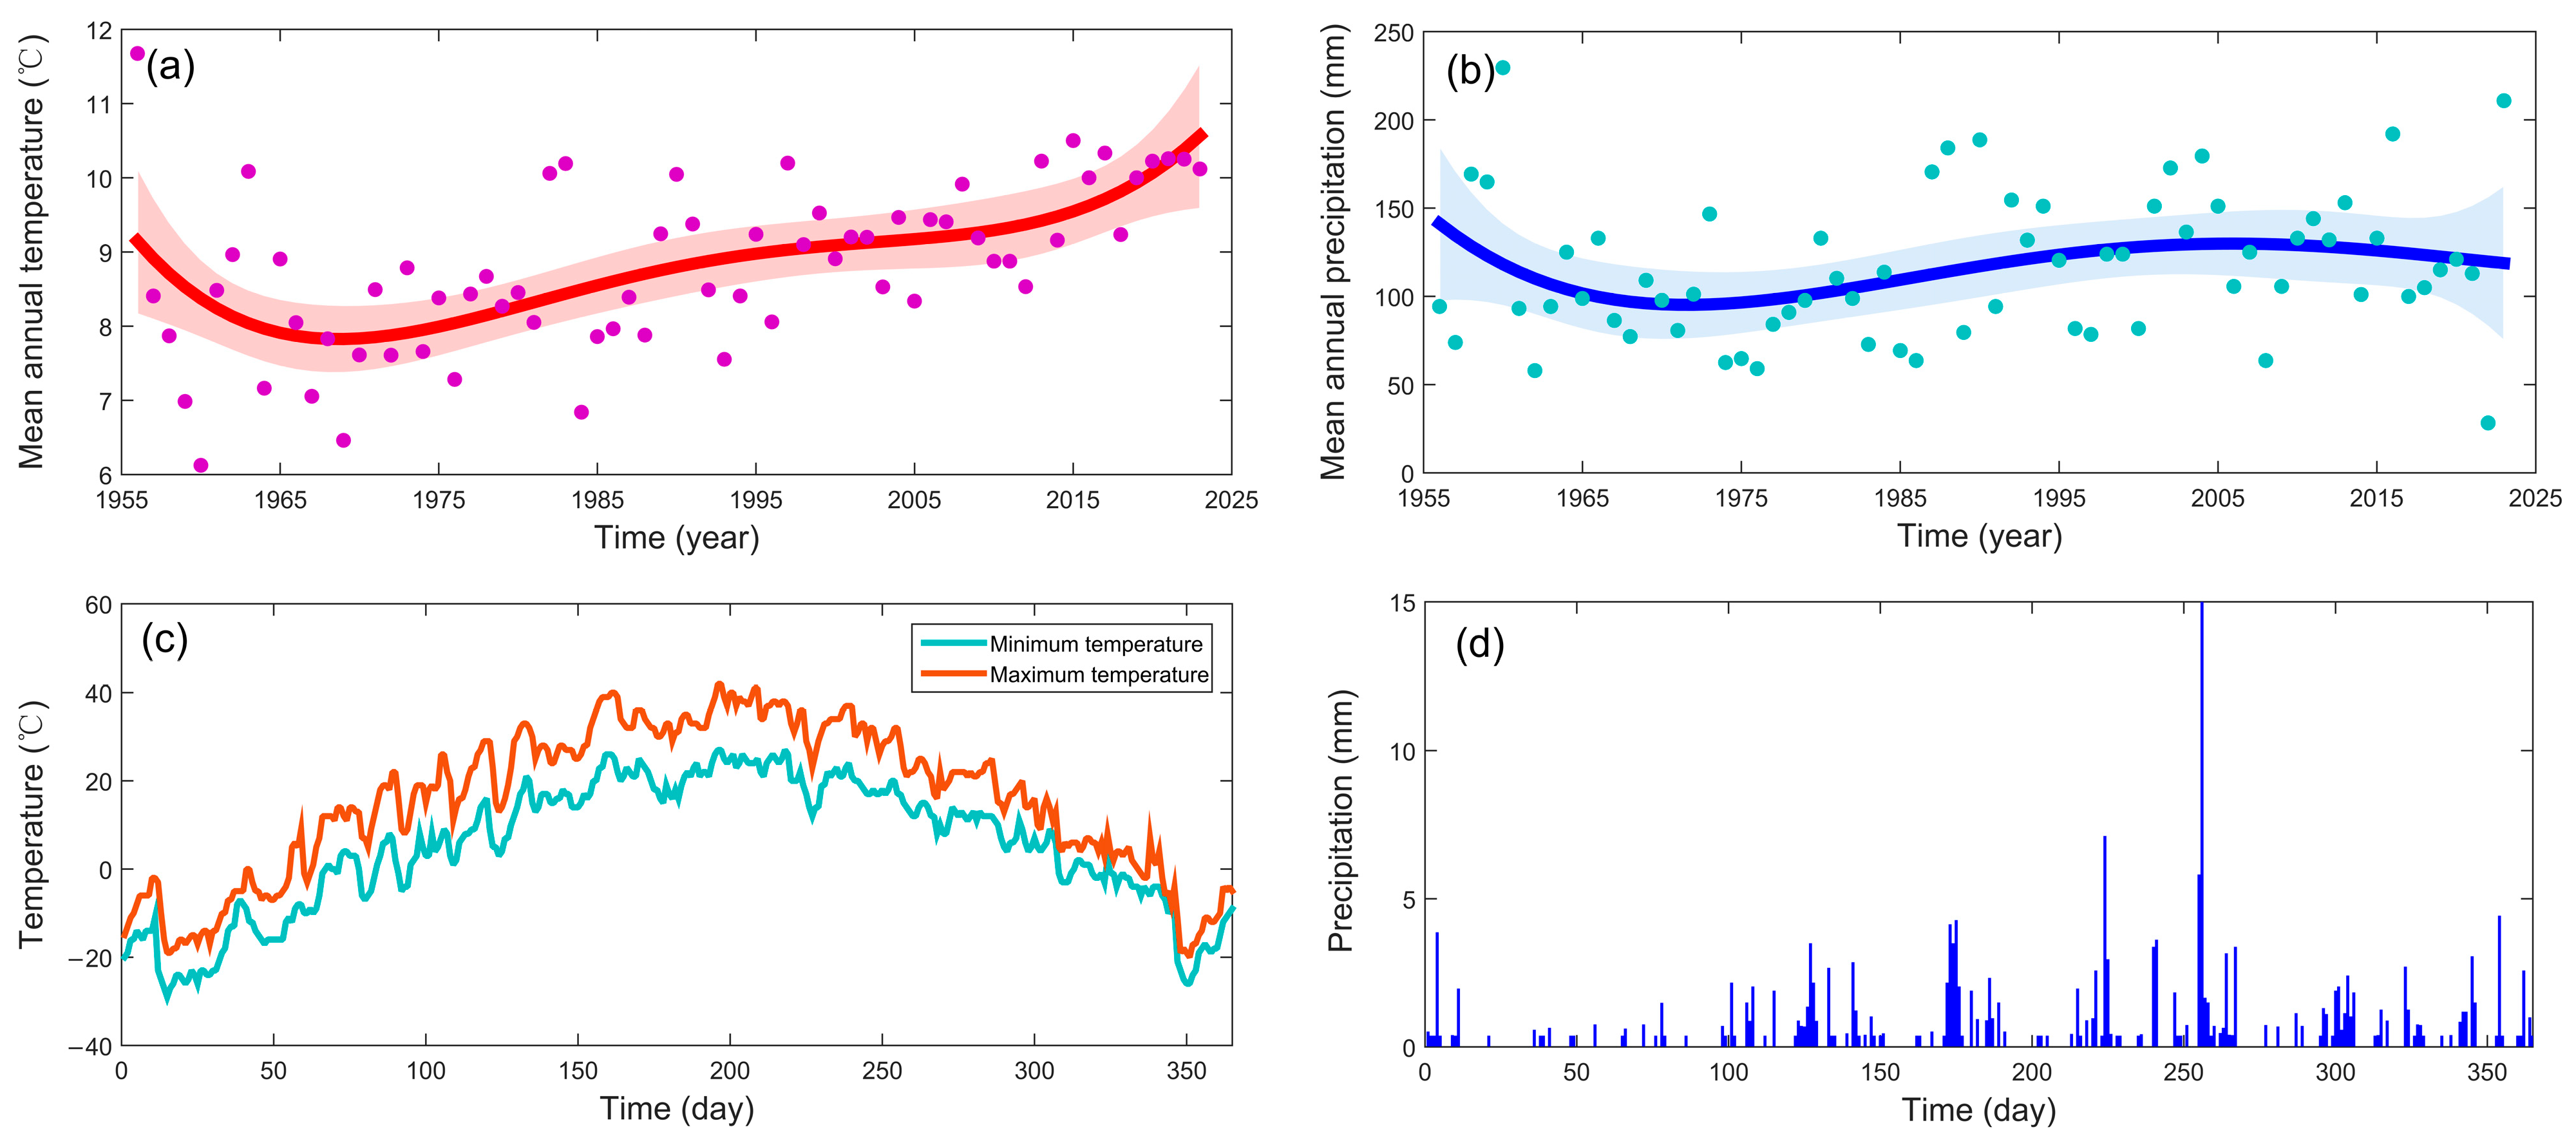
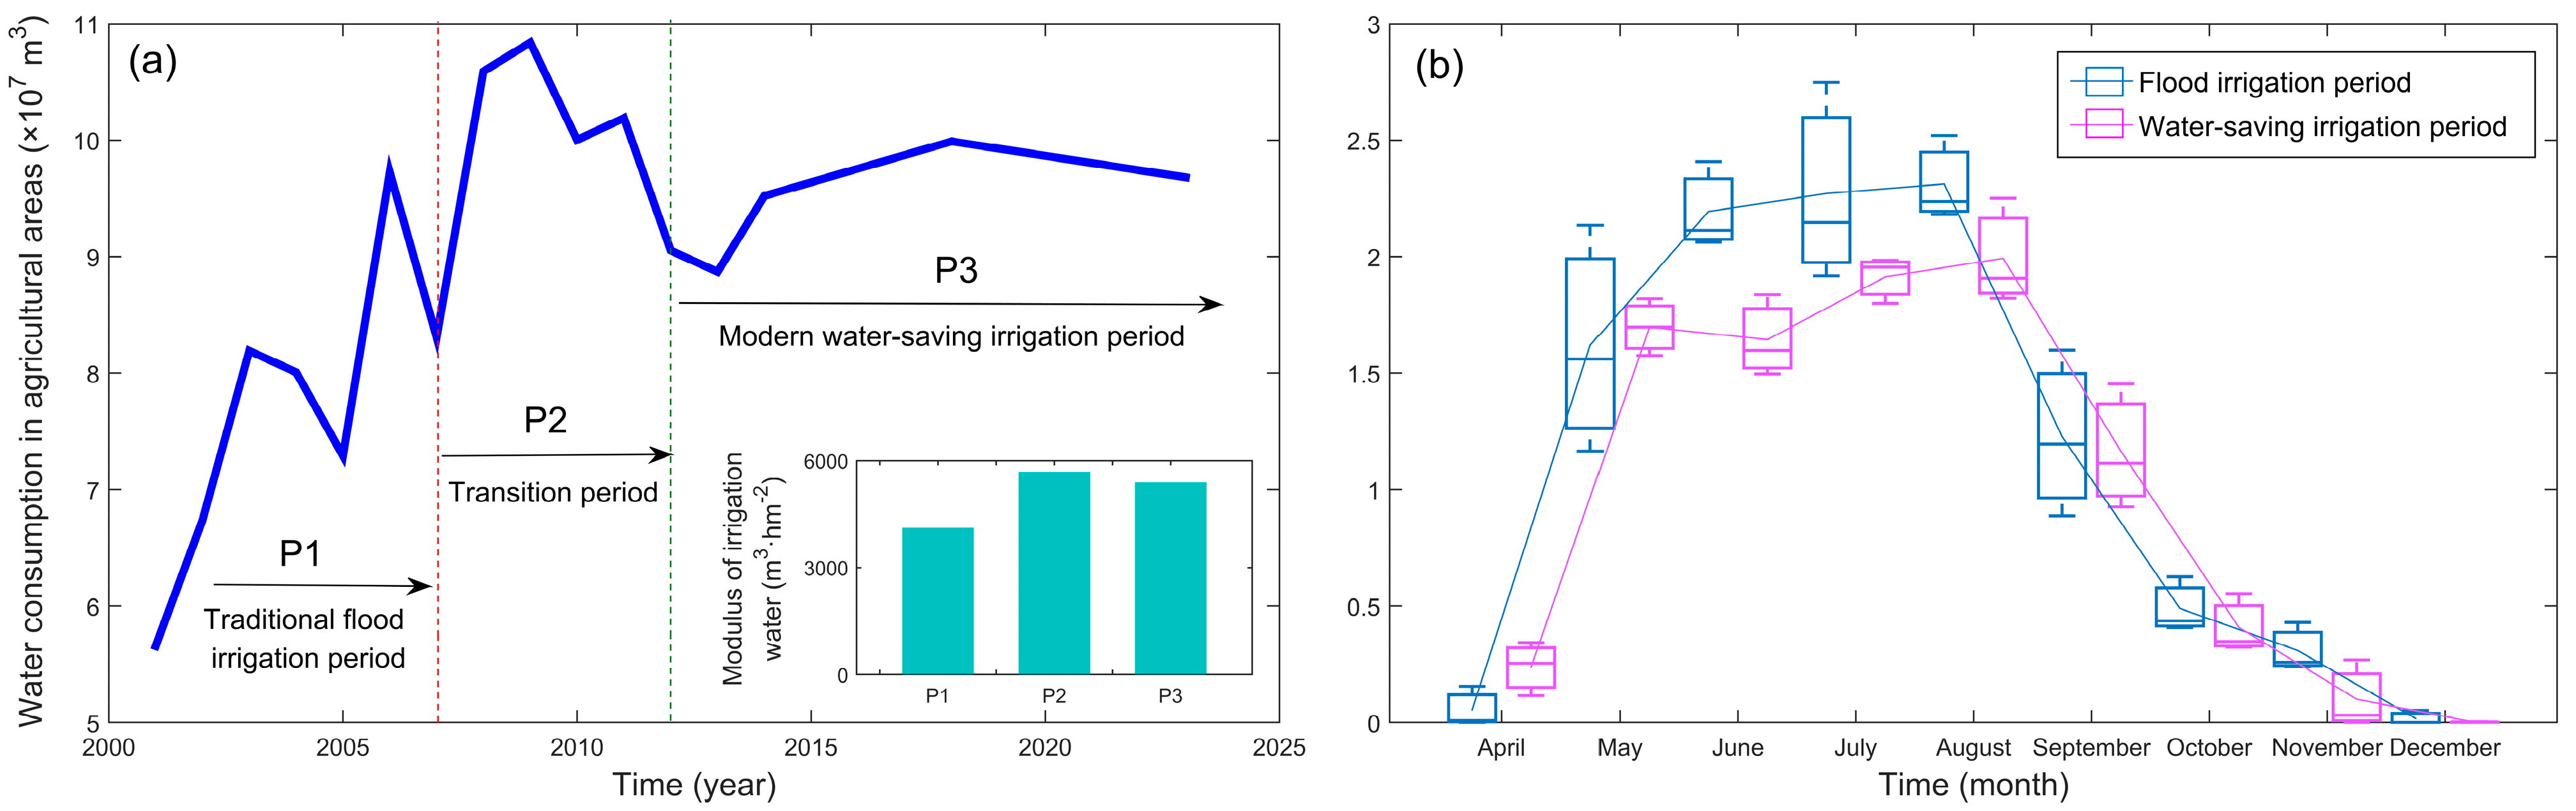
The Karamay irrigation district is located in the northwestern edge of the Junggar Basin in Xinjiang, on the alluvial plains of the ancient Manas Lake, which is one of the most arid regions in the northwest of China with low precipitation, high evapotranspiration, and no surface runoff [
25]. Since 2000, with the development of land for agricultural exploitation, there has been projected to be 260 million m
3·a
−1 of water transferred to the Karamay irrigation district, with 140 million m
3·a
−1 earmarked for agricultural use [
6]. Initially, regional irrigation was dominated by flood irrigation. Since 2006, water-saving irrigation has been widely used on a large scale. By 2011, all irrigation districts had adopted water-saving irrigation [
25]. Currently, extensive irrigation without adequate drainage has caused rising groundwater levels and upset the original water–salt balance in the root zone and shallow aquifer in the Karamay irrigation district.
Here, to reveal the effect of inter-basin water transfer on soil salinity and sodicity and the associated vegetation dynamics under varying irrigation practices, the Karamay irrigation district of China was selected. Using field comprehensive measurements and meaningful modeling approaches, this study aims to achieve the following objectives: (1) investigating the effect of inter-basin water transfer on the spatio-temporal variations in soil salinity and sodicity dynamics, (2) revealing the soil salinity and sodicity exchange fluxes and their controlling factors in different soil layers, and (3) evaluating the long-term implications of soil salinity on yields for different salt-tolerant crops. Capitalizing on these research objectives, we would provide effective directives for maintaining the sustainability of soil and water environments in the inter-basin water transfer area in the face of ongoing and future global changes.
3. Results
3.1. Spatio-Temporal Dynamics of Soil Salinity and Sodicity
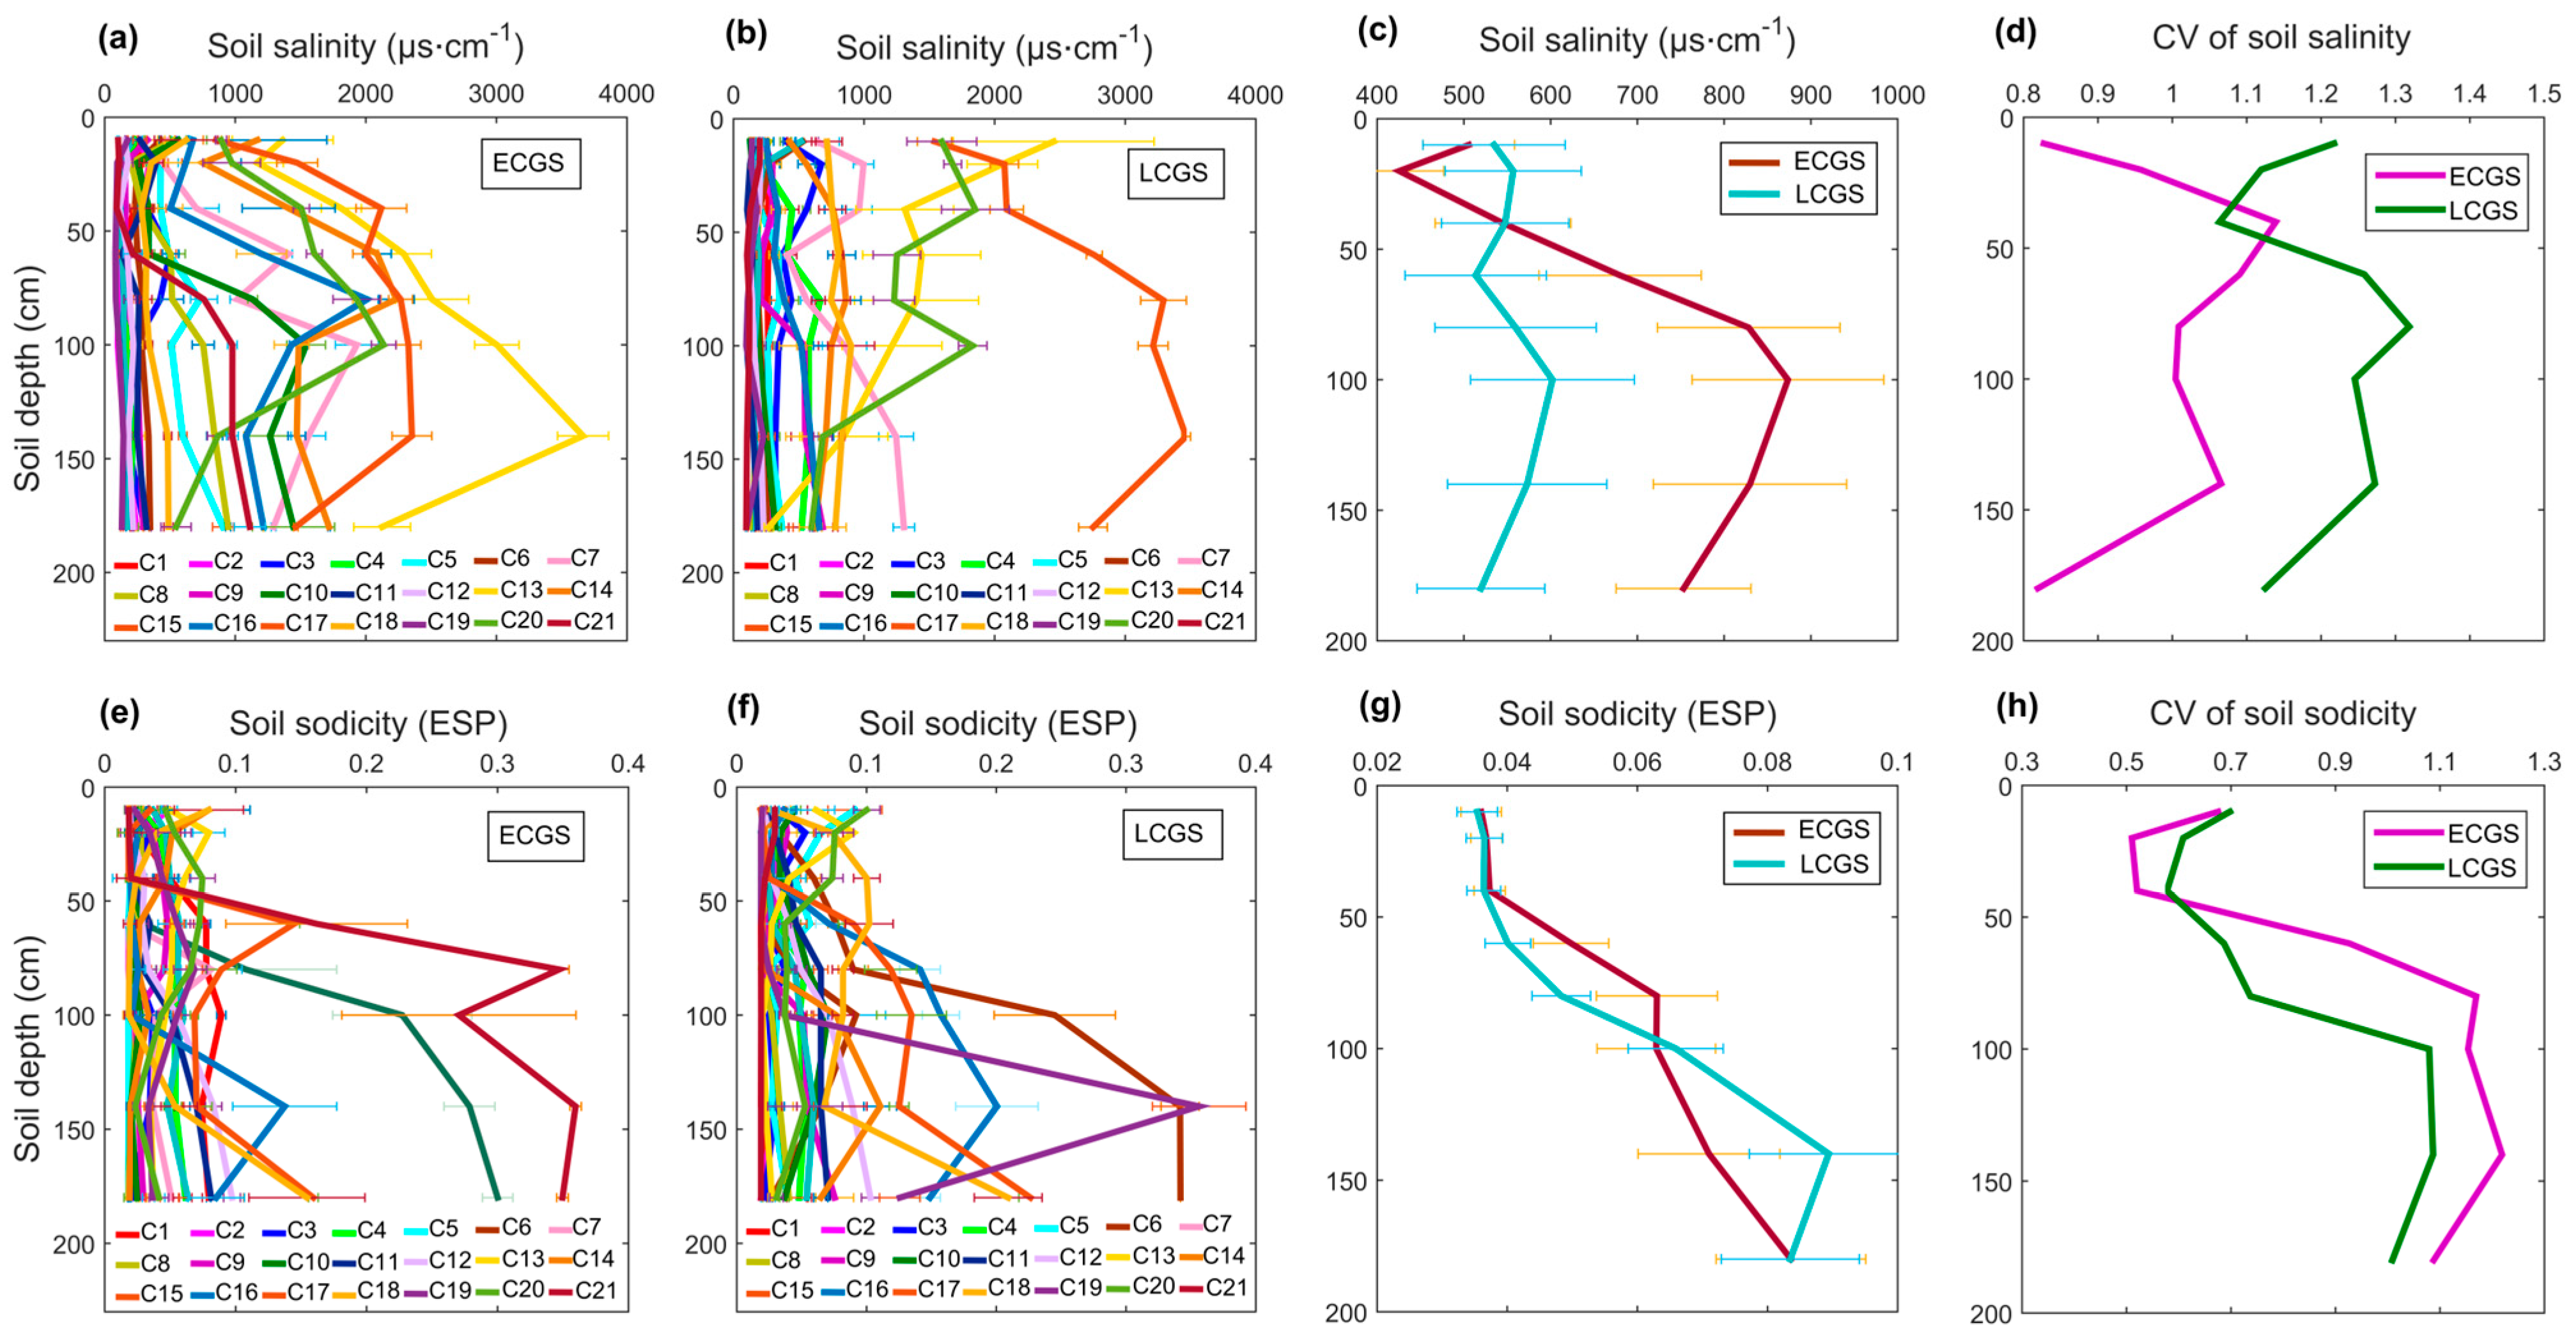
As presented in
Figure 6, soil salinity and sodicity profiles at the 21 soil sampling sites exhibited a clear vertical stratification under both the early crop growing stage (ECGS) and late crop growing stage (LCGS) in the KID. The mean soil salinity profile under the ECGS was evidently greater than that under the LCGS among the 40~180 cm soil layer, and the higher soil salinity was mainly distributed in the deeper layer under the ECGS. The mean soil salinity increased from 465.63 µs·cm
−1 in the 0~20 cm layer to 731.75 µs·cm
−1 in the >20~100 cm layer and then decreased gradually to 791.49 µs·cm
−1 in the >100~140 cm layer under the ECGS. Yet, the soil salinity remained relatively stable (mean value of 550.92 µs·cm
−1), and two small salt deposits appeared at 20 cm and 100 cm under the LCGS. Moreover, the coefficient of variation (CV) of the soil salinity varied from 0.82 to 1.14 under the ECGS and from 1.06 to 1.32 under the LCGS among the layers (
Figure 6a–d). At the same time, the mean soil sodicity displayed an increasing trend with the depth under both the ECGS and LCGS, and the mean soil sodicity profile under the ECGS (0.053) was evidently greater than that under the LCGS (0.048) among the >40~100 cm layer, whereas it was clearly greater under the LCGS (0.086) than under the ECGS (0.077) in the >100~180 cm layer. Furthermore, the CV of the soil sodicity increased from 0.5~0.7 for the 0~40 cm layer to 0.9~1.1 for the 100~180 cm layer under both stages (
Figure 6e–h).
According to the profile distributions of the mean soil salinity, mean soil sodicity, and their coefficient of variation (CV) under both the ECGS and LCGS, the soil profile for both soil salinity and soil sodicity could be divided into three typical layers, i.e., 0~40, >40~100, and >100~180 cm. Except for the soil salinity of the LCGS, there were clear differences in both the soil salinity and soil sodicity for each typical soil layer in the Karamay irrigation district (
Table 2).
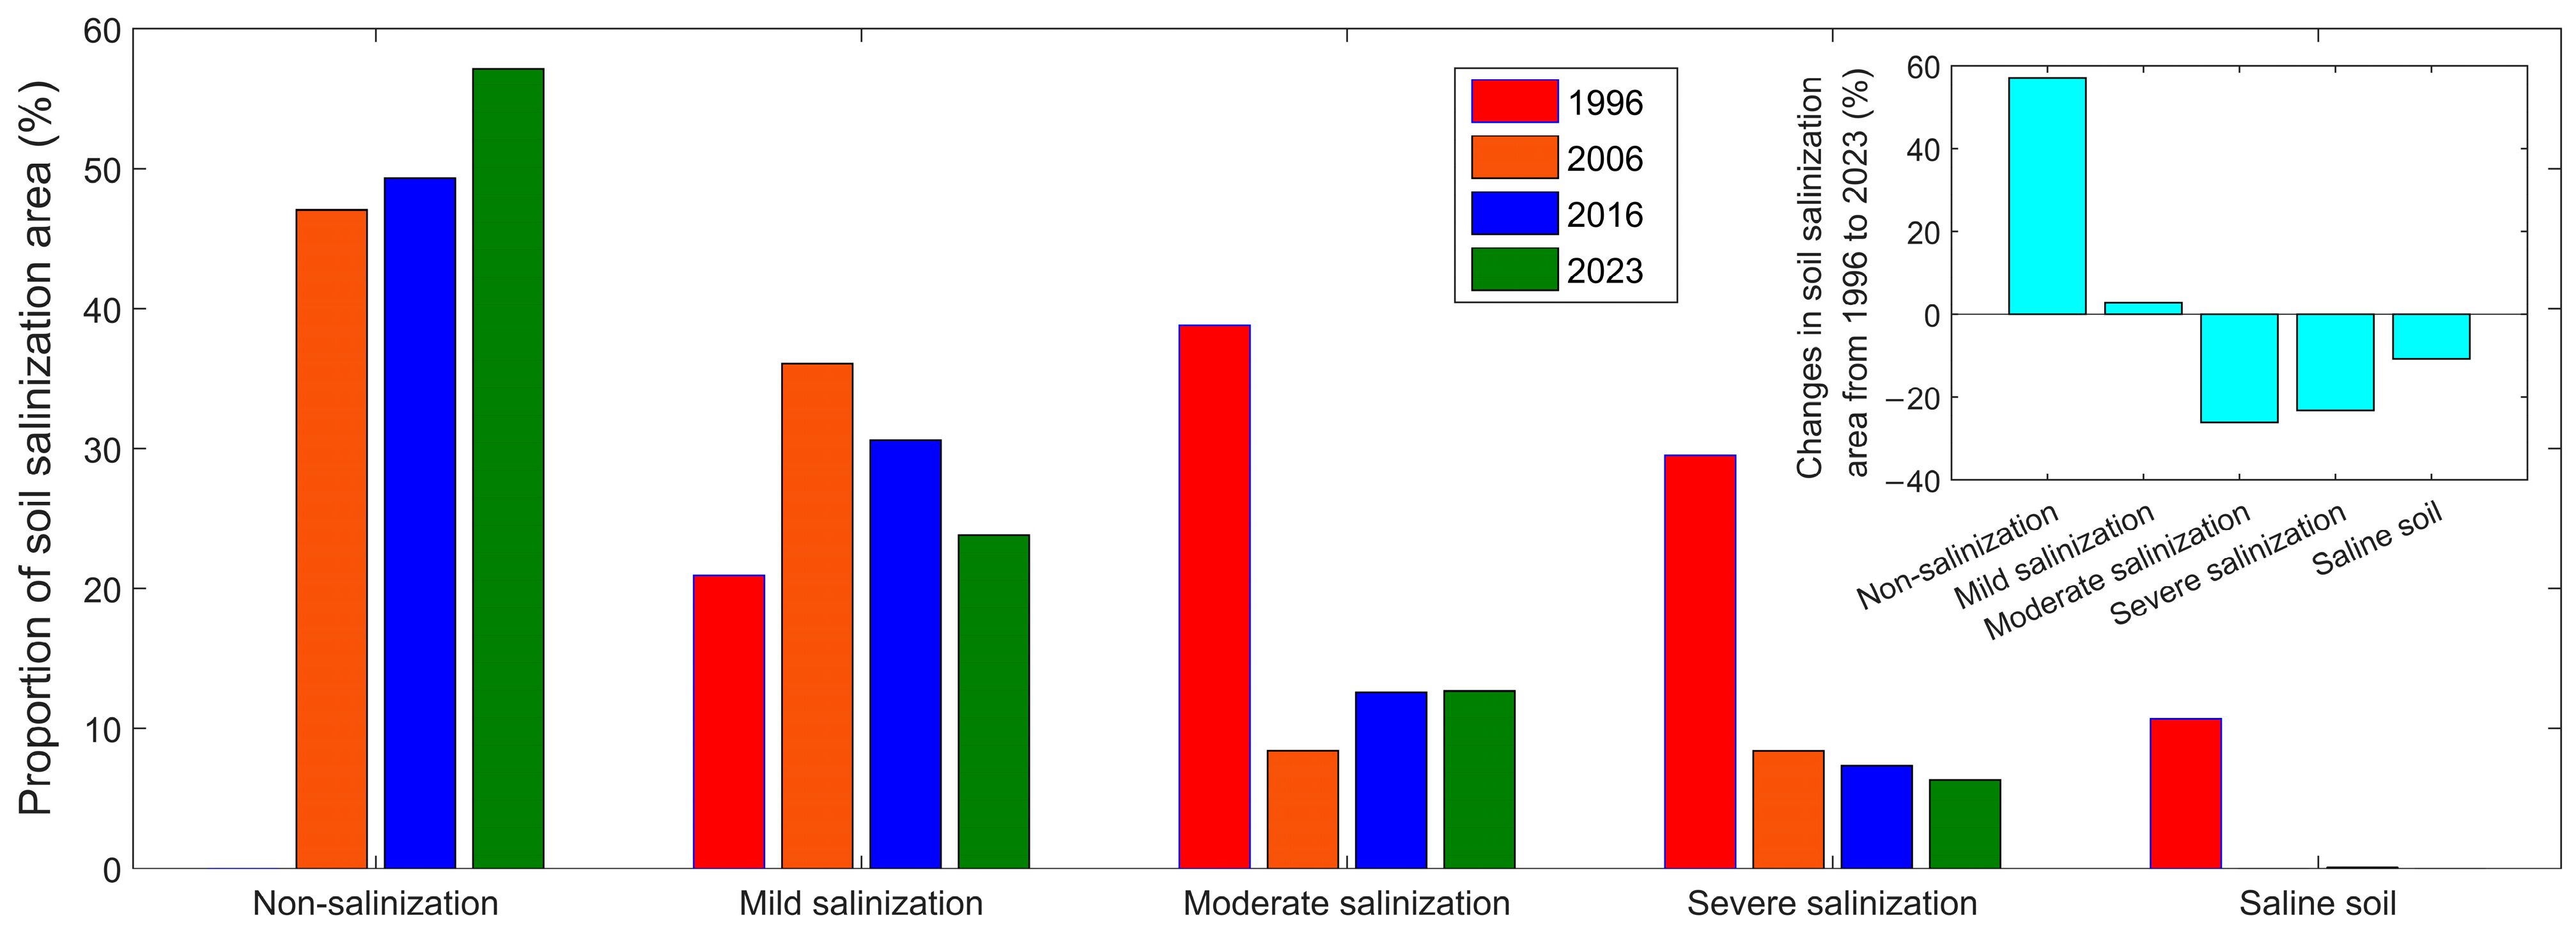
As illustrated in
Figure 7, the degree of soil salinization is decreasing, and the area of non-saline land is increasing significantly from 1996 to 2023 in the Karamay irrigation district. Specifically, in 1996, there was no non-salinization land distribution in the study area, and the area of moderate and above salinization land accounted for 79% of the irrigation area. However, after 10 years of traditional flood irrigation and extensive field cultivation, the area of non-salinization land reached 47.07% in 2006, the area of moderate and severe salinization land decreased by 20.73%, and the area of saline land almost disappeared, but the area of mild salinization land increased by 15.12%. With the large-scale promotion of water-saving irrigation technology, the area of both moderate and non-salinization land showed an increasing trend in 2023, in which the non-salinization land area increased to 57.14%, whereas the area of both mild and severe salinization land exhibited a decreasing trend in this study area. Overall, soil salinization showed a pattern of first decreasing and then maintaining a relatively stable state from the traditional flood irrigation period (i.e., 1996–2006) to the modern water-saving irrigation period (i.e., 2011–present) in the study area.
3.2. Variations in Soil Salinity and Sodicity Exchange Fluxes
As illustrated in
Figure 8, the average exchange flux of the soil salinity in the 0~40 cm, >40~100 cm, and >100~180 cm layers was 0.3376, −1.4634, and −1.5234 g·kg
−1, respectively, and the corresponding mean exchange flux of soil sodicity was −0.0006, −0.0072, and −0.0259 ESP, respectively, from the ECGS to the LCGS during 2023 in the Karamay irrigation district. For the soil salinity exchange flux (
Figure 8(a1–a3)), at the 21 sampling sites, 42.86%, 66.67%, and 71.43% of the soil salinity exchange fluxes were negative (i.e., salt expelled from the soil layer) in the soil layers of 0~40 cm, 40~100 cm, and 100~180 cm, respectively. Furthermore, there was a significant positive correlation between the soil salinity exchange flux in the 40~100 cm and 100~180 cm soil layers (
r = 0.6929,
p < 0.01) in this study area.
For the soil sodicity exchange flux (
Figure 8(b1–b3)), at the 21 sampling sites, 42.85%, 52.38%, and 52.38% of the soil sodicity exchange fluxes were negative (i.e., alkali discharged from the soil layer) in the soil layers of 0~40 cm, 40~100 cm, and 100~180 cm, respectively. The results showed that the water-saving irrigated farmland in the KID was in a state of alkali aggregation in the 0~40 cm soil layer, while both the 40~100 cm and 100~180 cm soil layers were in a state of alkali equilibrium in the whole growing season. Meanwhile, the soil sodicity fluxes in the 40~100 cm and 100~180 cm soil layers showed a significant positive correlation (
r = 0.5061,
p < 0.05). By comparison, there is a certain synchronization between the soil salinity flux and the soil sodicity flux in each soil layer, but there may also be a certain lag in the study area. Altogether, the water-saving irrigated farmland was in the slight salt-aggregating state in the topsoil layer, while the other soil layers were in the salt-expelling or salt-equilibrating state in the study area.
3.3. Controlling Factors for Changes in Soil Salinity and Sodicity
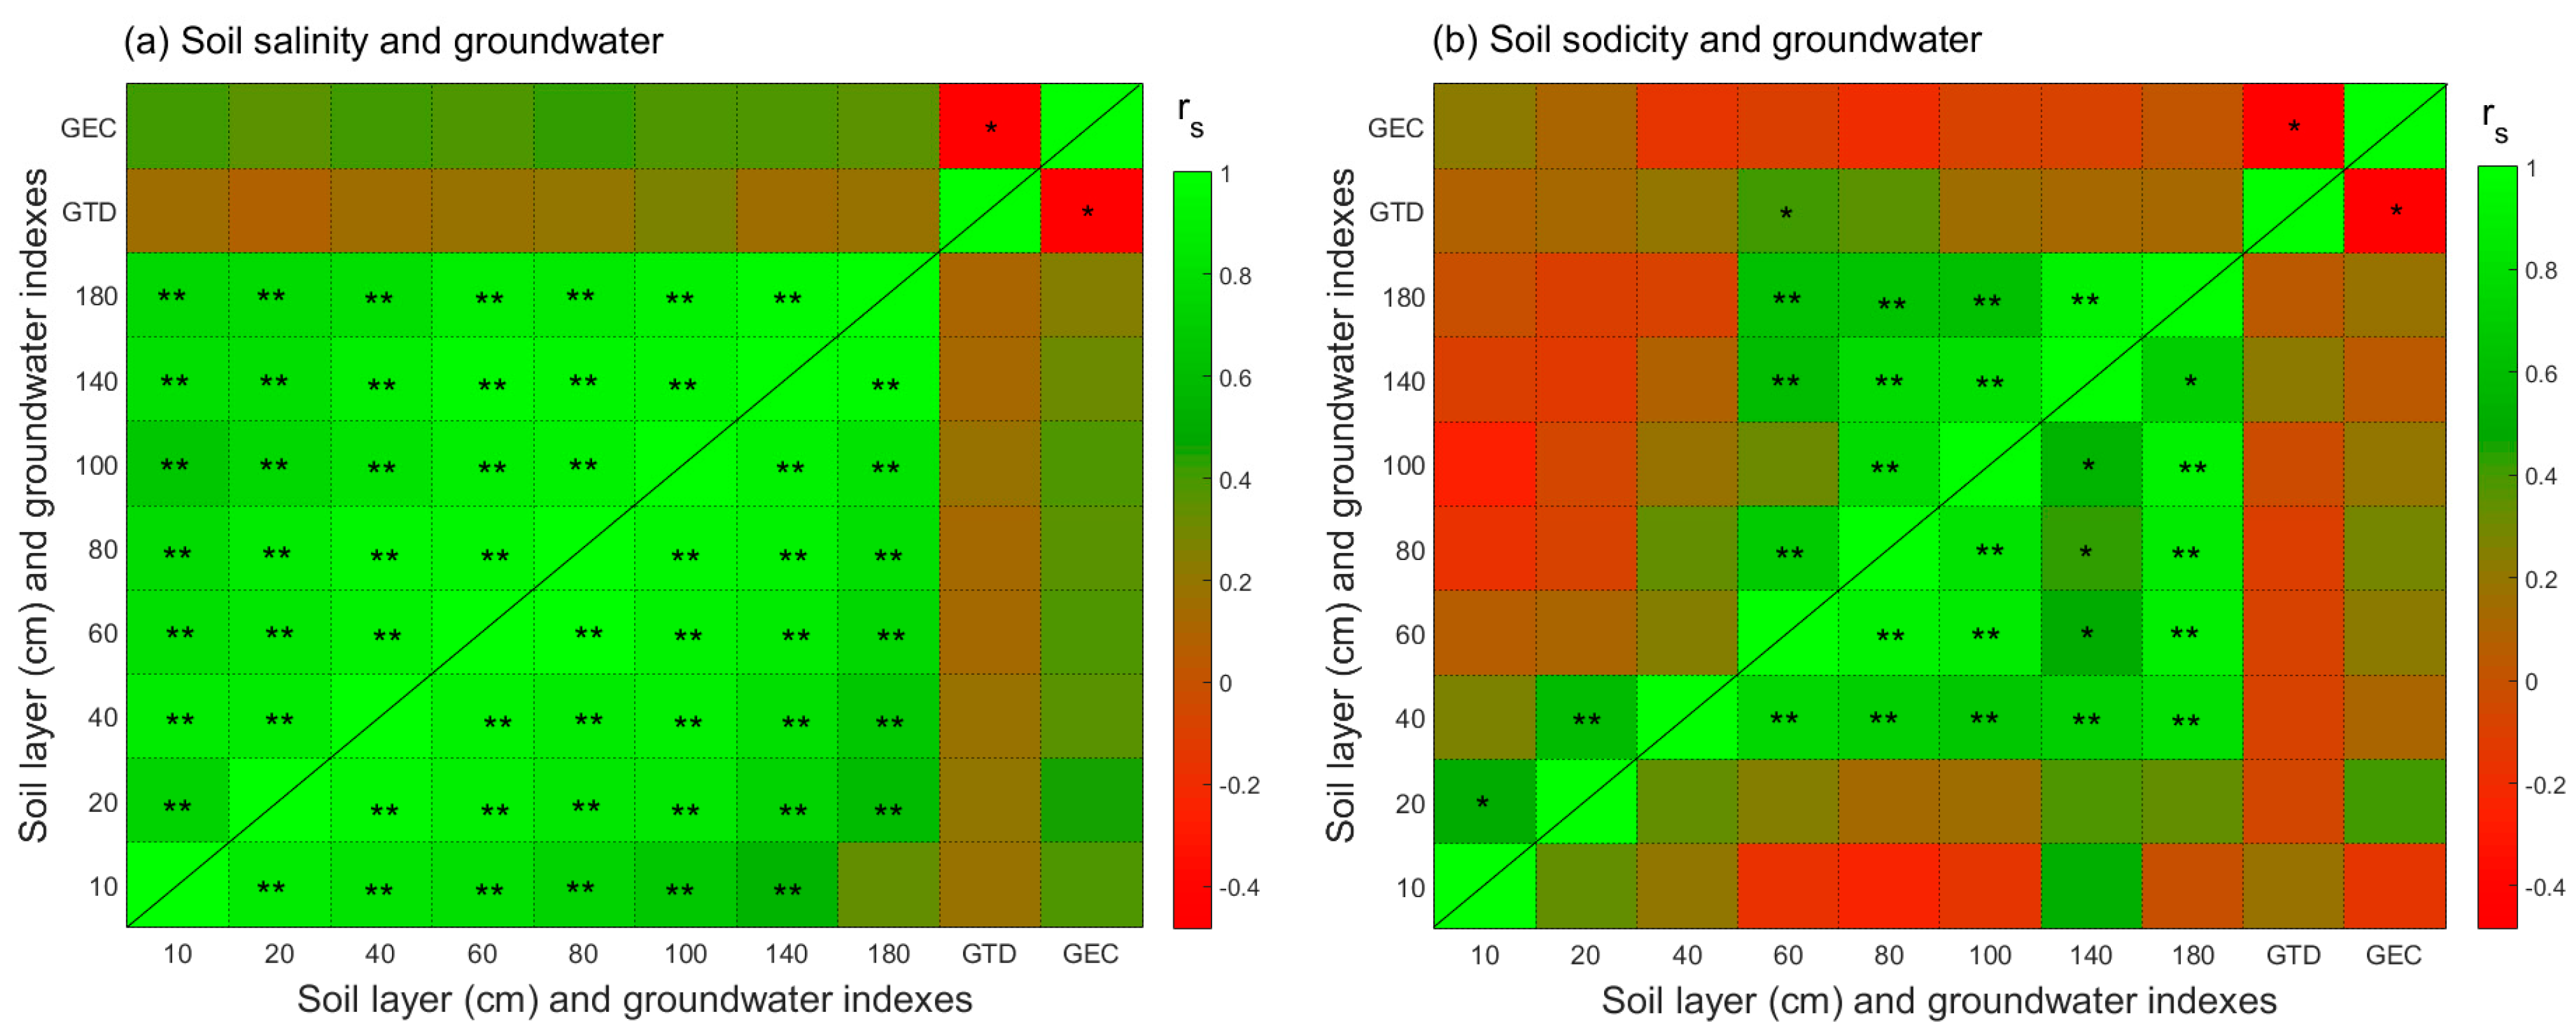
In accordance with
Figure 9, Spearman’s rank correlation coefficients (
rs) identified an overall similarity in spatial patterns of both soil salinity and soil sodicity among the defined soil layers, especially between two adjacent layers, under both the ECGS and LCGS in the Karamay irrigation district. For soil salinity (
Figure 9a), the overall similarity was higher under the ECGS, with the
rs ranging from 0.66 to 0.96 (mean
rs: 0.86), than under the ECGS, with the
rs ranging from 0.35 to 0.98 (mean
rs: 0.86). For soil sodicity (
Figure 9b), the overall similarity was higher under the ECGS, with the
rs (absolute value) ranging from 0.01 to 0.91 (mean
rs: 0.51), than under the ECGS, with the
rs (absolute value) ranging from 0.66 to 0.96 (mean
rs: 0.36). The
rs between two adjacent layers for both soil salinity and soil sodicity under each stage were almost statistically significant (
p < 0.05), suggesting that the spatial patterns of both soil salinity and soil sodicity between adjacent soil layers have a strong dependence. Furthermore, the
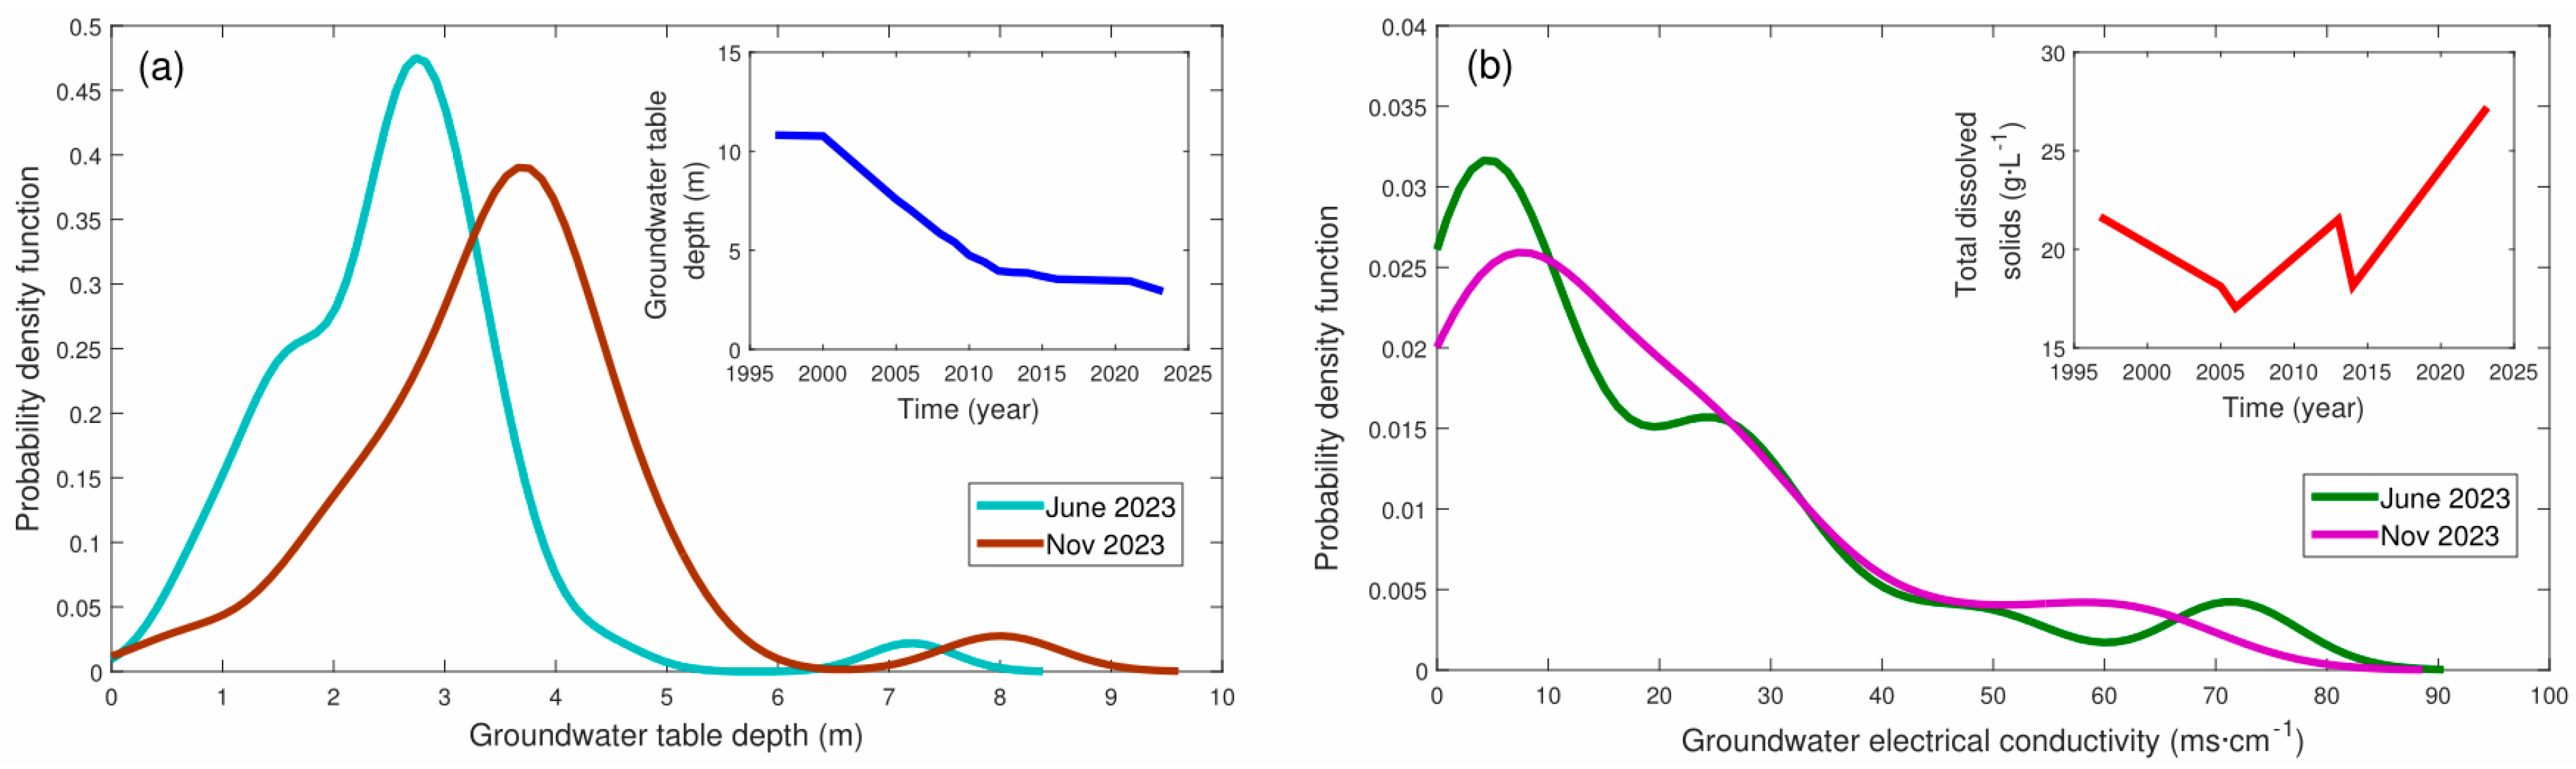
rs of both soil salinity and sodicity to the groundwater table depth (GTD) and groundwater electrical conductivity (GEC) were relatively low in all soil layers under both stages. Nevertheless, there was a significant correlation between the GTD and GEC in the study area.
The pre-existing soil moisture controls water fluxes in different soil layers under the interaction of precipitation and irrigation water as well as groundwater. As shown in
Figure 10, there was a negative correlation between the soil water content and soil salinity, while there was a positive correlation with soil sodicity during both the ECGS and LCGS in the Karamay irrigation district. In other words, as the soil water content increases, the soil salinity content gradually decreases; that is, “salt comes with water, and salt goes with water”. However, with the increase in the soil water content, the soil sodicity content of the soil gradually increases; that is, “alkali comes with water, and alkali stays with water loss”. The results showed that soil moisture dynamics are an important factor in regulating soil salinity and soil sodicity dynamics in water-saving irrigation farmland in the study area.
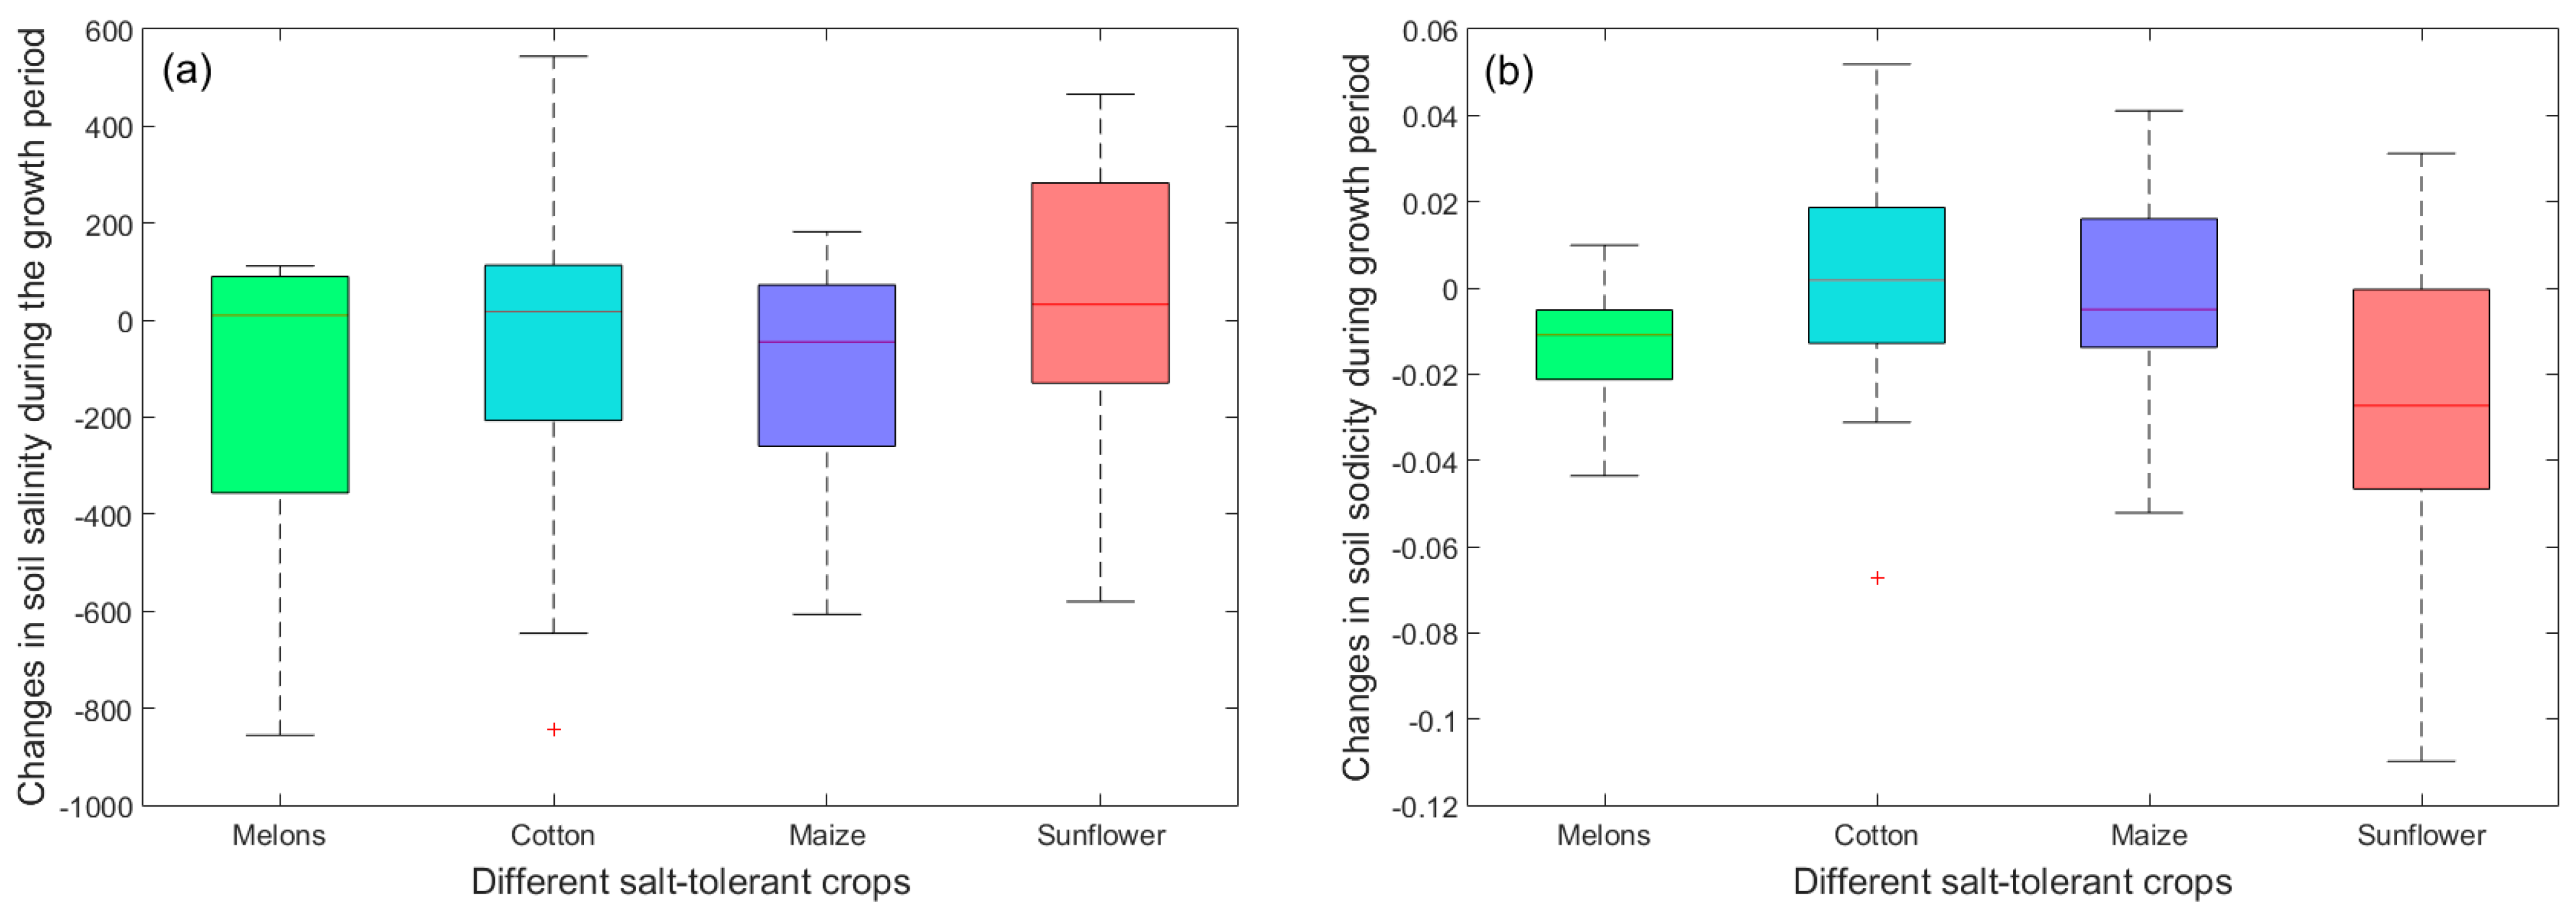
Increased plant salt tolerance corresponds to a higher water use efficiency, lower values of the effective soil wilting point, and a greater potential to hinder leaching events and enhance soil salt accumulation [
14]. As illustrated in
Figure 11, changes in soil salinity during the growth period were −196.06 ± 149.27 us·cm
−1, −25.14 ± 72.97 us·cm
−1, −69.72 ± 70.21 us·cm
−1, and 269 ± 106.15 us·cm
−1 for melons, cotton, maize, and sunflower, respectively, and the corresponding changes in soil sodicity during the growth period were −0.014 ± 0.005, 0.003 ± 0.005, −0.001 ± 0.006, and −0.273 ± 0.016, respectively. There were clear differences in soil salinity and soil alkalinity in the root zone of different salt-tolerant crops in the Karamay irrigation district. This suggests that crop salt tolerance is a crucial factor in controlling and limiting soil salinization and alkalization in water-saving irrigation farmland in the study area.
In addition, topography and geomorphology, which typically regulate the distribution of salts in soils by controlling the movement of the surface/subsurface runoff and the depth of the groundwater table, are two of the major factors affecting soil salt accumulation in this study area. Also, the soil texture in the study area (mainly silt, accounting for about three fifths of the particle composition, while the content of sand and clay accounted for about 20%, respectively) had a clear effect on the distribution of soil salinity and sodicity. In general, with the increase in the soil clay and silt content, the soil salt content increases, and with the increase in the sand content, the soil salt content decreases, because the surface area of clay and silt particles in the soil is larger, which is the active component of the soil, and the sand particles are relatively inactive. Moreover, the water from the Xijiao Reservoir (45°34′22″ N, 84°51′25″ E) was used for irrigation in the study area, and the mineralization was 1160 µs·cm−1, although its value was small, but a large amount of salt was also carried into the study area and accumulated in the soil for many years of agricultural irrigation.
Furthermore, the annual evaporation in the study area is 16.6 times of the annual rainfall, and under this arid climate, the leaching effect of the soil is weak, and the salts in the shallow groundwater and soil water are constantly transported to the surface under the strong evaporation and concentration effect, so that the both salinity and sodicity of the topsoil increased. Particularly, with the large-scale popularization and application of modern water-saving irrigation technology in this study area, the “bottom-up” soil salinization is reduced, but due to the small quota of single water-saving irrigation, the salt accumulated on the surface of the soil cannot be leached into the deep layer in time, and the new risk of “top-down” soil salinization appears, and the problem is more prominent when using brackish water for irrigation. In addition, the overapplication of nitrogen-containing fertilizers, especially urea, was also a major reason for the increase in soil salinity and sodicity in the implementation of the integrated irrigation of water and fertilizers in the study area.
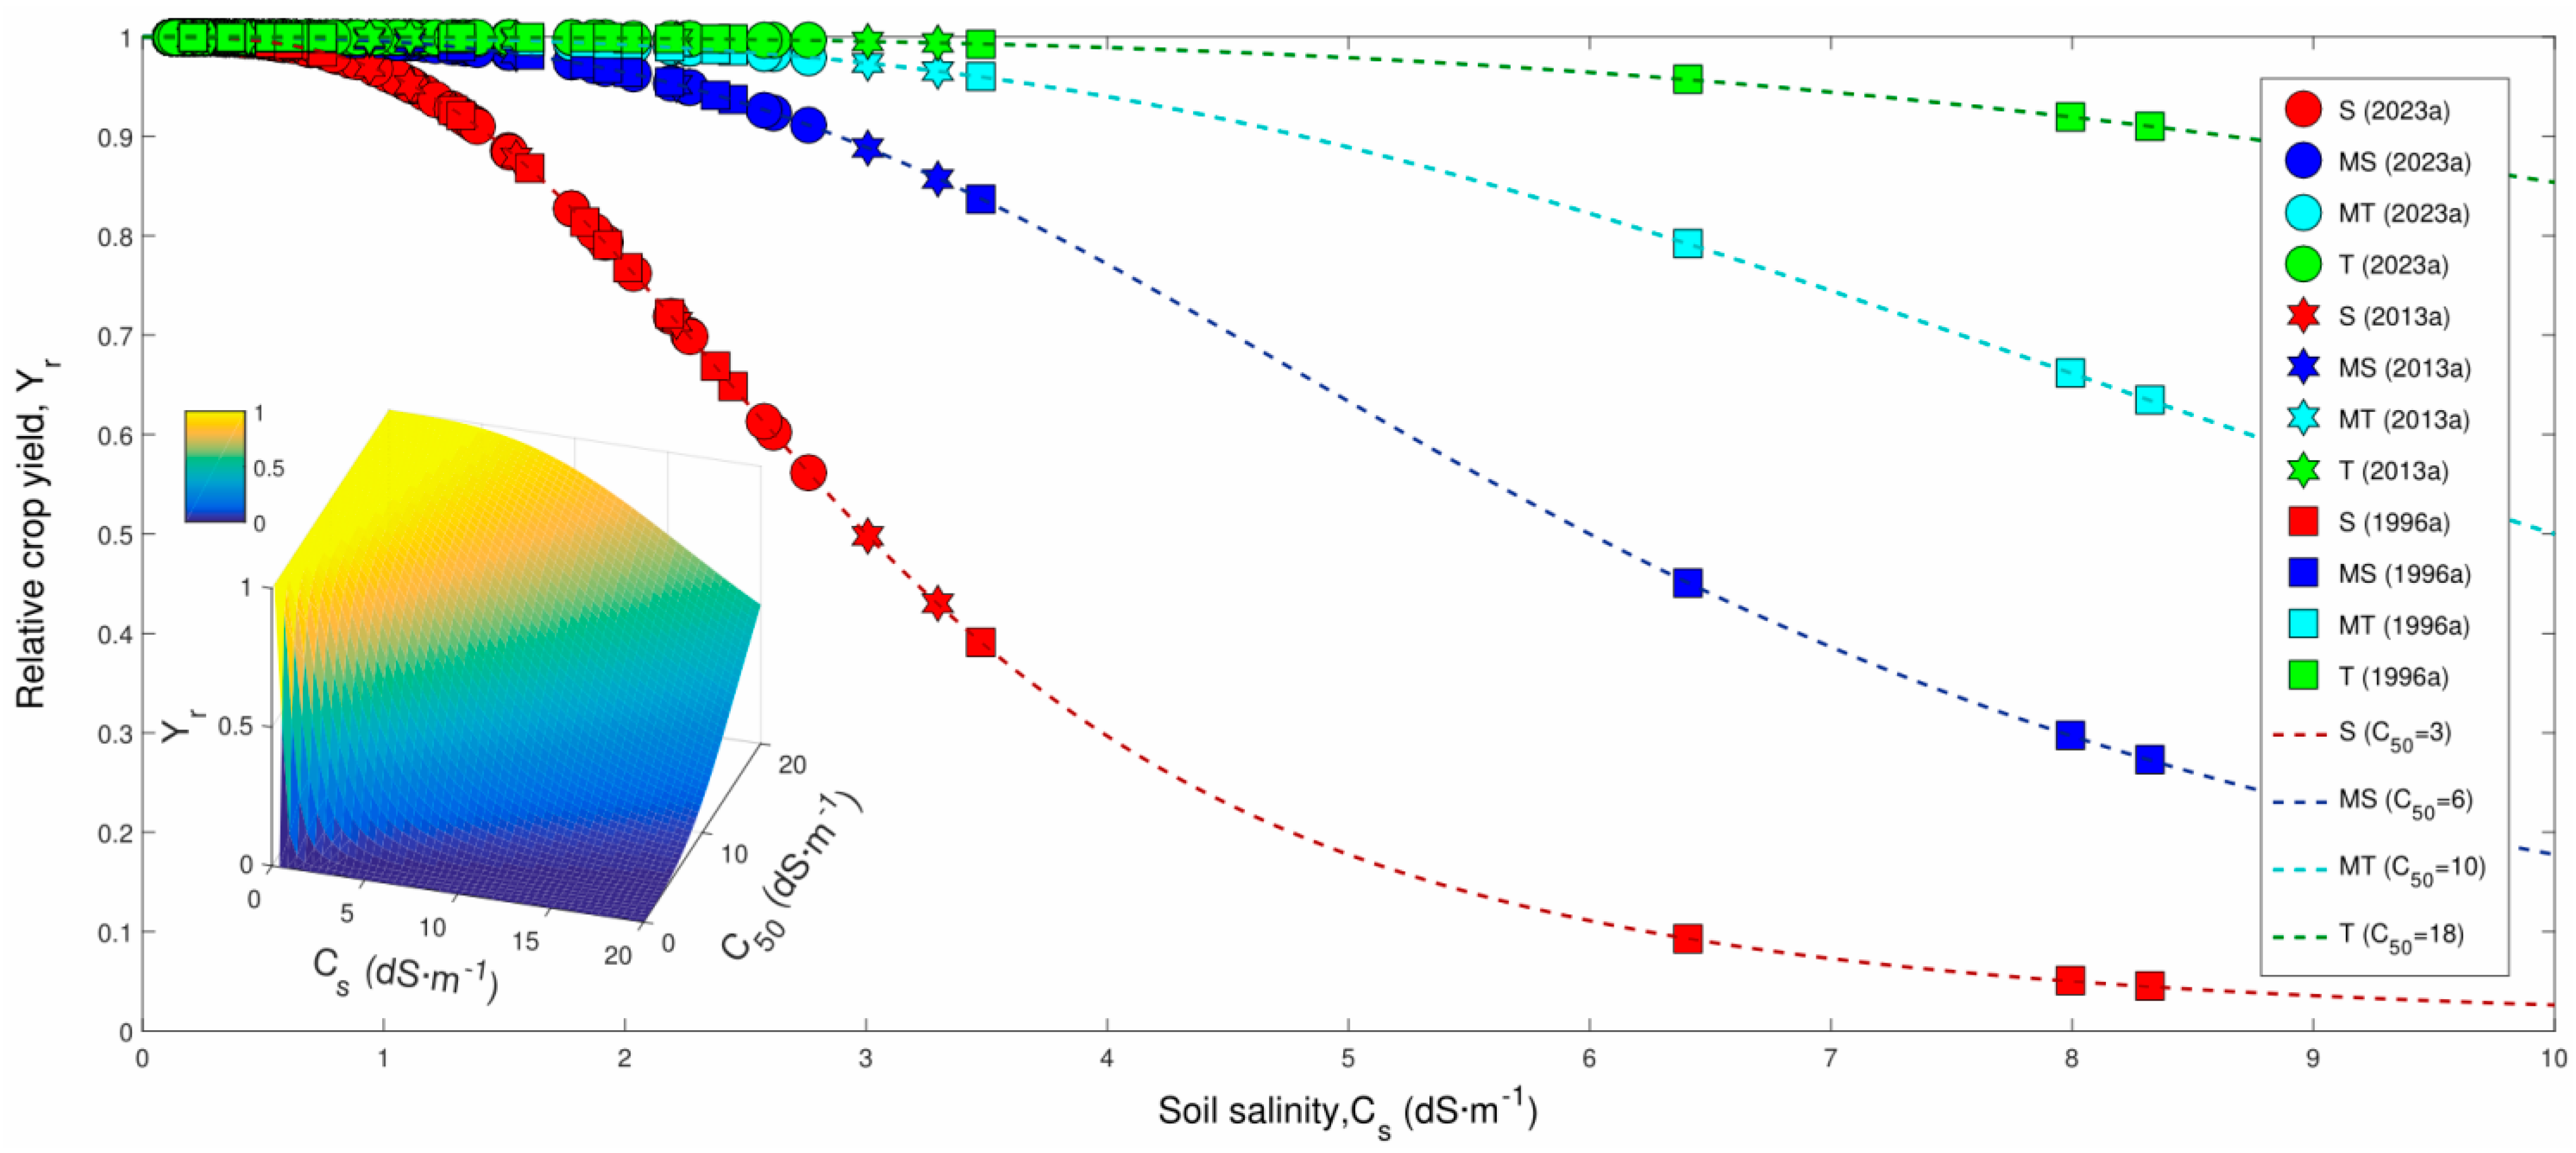
3.4. Crop Yield Response for Given Soil Salinity and Salt Tolerance
As illustrated in
Figure 12 and
Table 3, the relative crop yield
Yr decreased significantly with the increasing root zone salinity
Cs and the decreasing crop salt tolerance
C50 in the Karamay irrigation district. In contrast, for salt-sensitive, moderately-salt-sensitive, moderately-salt-tolerant, and salt-tolerant crops, the average
Yr in 2013 was significantly higher than in 1996, while there was no significant difference between the average
Yr in 2023 and 2013. This indicates that the soil salinity in the study area is currently maintained within the lower limit of the threshold affecting the crop yield. In general, the effects of salt stress on different salt-tolerant crops are different, and excessive stress can reduce the yield of crops, and no more than a certain threshold can improve the quality of some crops. In reality, the crop response to soil salinity is affected by a number of factors besides root zone solute concentrations, such as climate, irrigation practices, soil fertility, and soil hydraulic conductivity. In the case of maize, for example, an irrigation water salt concentration of 3 g/L is the upper limit of the salt tolerance of maize seedlings, and when the irrigation water salt concentration is lower than this value, the seedling growth is normal, and when it is higher than this value, the seedling growth is significantly inhibited. Therefore, the interaction effect of multiple factors should be considered in studying the response of the crop yield to soil salinity in future research practices.
4. Discussion
Owing to limited precipitation but high potential evaporation and the absence of surface runoff in the KID, the inter-basin water transfer has substantially ensured the security of the regional water supply for irrigation, industrial, and domestic uses [
6]. Nevertheless, when the region lacks a supporting drainage system or the drainage system is not properly designed, the inter-basin water transfer can lead to the accumulation and redistribution of salts in the soil once the groundwater level is higher than the critical depth of the groundwater. As a result, the soil structure is destroyed, nutrients are lost, and the water and salt balance is broken, which ultimately has a negative impact on the ecological environment and leads to a decrease in the crop yield in irrigated areas [
7,
32].
Since the large-scale agricultural development of the KID in 1997, the traditional flood irrigation method has been mostly used in the study area, and there is no drainage system, and the groundwater level has been rising year by year. By 2009, about two-thirds of the groundwater were buried to a depth of less than 4 m [
6], and most areas of the KID were threatened by secondary soil salinization. The rising poor-quality groundwater and the soil salinization caused by it pose a serious challenge to the development of soil and water resources in the study area. By 2010, 86.96% of the farmland in the study area was salinized to different degrees, and the soil salinity and sodicity of the cultivated layer and subsoil showed a negative correlation with the depth of the groundwater table. In order to inhibit the rise in the groundwater level and prevent secondary soil salinization, the farmland in the study area was switched from flood irrigation to drip irrigation in 2006. From 2011 to 2023, the change range of the groundwater depth in the study area tended to be flat, and the soil salinization showed a decreasing trend in the KID [
25]. In general, under the background of inter-basin water transfer, from traditional flood irrigation to modern water-saving irrigation, soil salinization shows a decreasing trend due to declines in the shallow groundwater table.
Soil salinity and soil sodicity are dynamic in spatial, vertical, and temporal dimensions, and are substantially influenced by governing climatic conditions and anthropogenic activities, especially in arid environments [
8]. The inter-basin water transfers have significant impacts on the hydrological regimes in the drylands [
7]; thus, the hydrological regime change is an important factor affecting the spatial changes in soil salinity and sodicity. This may be attributed to the fact that the salts are transported and redistributed with the precipitation, soil water, irrigation water, and groundwater in the study area [
33]. The distribution of salinity and sodicity in soil profiles of farmland are mainly characterized by climate, irrigation, crop, and groundwater dynamics. Similarly to Vico and Porporato [
34], our results showed that irrigation schemes (i.e., traditional flood irrigation and water-saving irrigation) result in different soil salinity and sodicity profiles in the KID. In particular, the popularization and application of drip irrigation technology has improved the efficiency of water and fertilizer utilization and changed the mode of water and salt transport in farmland. On the one hand, the decline in the water table and the weakening of the connection between the soil water and groundwater have reduced the salts from shallow groundwater evaporation, reducing soil salinization; on the other hand, due to the lack of saline washing, the salt accumulated on the surface of the soil cannot be leached into the deep layer in time, and the salinization of the topsoil is aggravated, and the problem is more prominent when brackish water is used for irrigation [
11,
35].
Figure 8 indicates that throughout the growing season, the water-saving irrigated farmland in the study area was in the salt accumulation state in the 0~40 cm soil layer, while both the 40~100 cm and 100~180 cm soil layers were in the salt drainage state. Generally, the soil salinization under water-saving irrigation with marginal water is mainly caused by insufficient water leaching, so it may be necessary to irrigate with adequate low-salt water, at least once at the beginning of growing season, to facilitate salt leaching from the soil profile [
13]. In addition, the plant salt tolerance, soil properties, and agronomic management also influences the salt accumulation in the soil profile in the KID. Perri [
14] highlighted that the plant salt tolerance is a key factor in limiting the long-term soil salinization levels in salt-affected soils. Furthermore, sodicity negatively impacts the soil physical properties, reducing soil saturated hydraulic conductivity and indirectly affecting soil salt accumulation [
9,
19]. Thus, an integrated consideration of the interactive effects of multiple factors on soil salinity and sodicity is vital for controlling soil salinization and improving land productivity in the KID.
Dryland agricultural regions face significant challenges due to groundwater, soil, and irrigation water salinity, so gaining a comprehensive understanding of how groundwater, soil, and irrigation water salinity affect crop performance is crucial for implementing sustainable practices in dryland agriculture [
36]. Often, soil salinity hinders crop growth, especially for salt-sensitive crops, by impeding water uptake, causing osmotic stress, and altering the nutrient availability. Similarly, the increased salinity in irrigation water and from the shallow groundwater capillary rise can directly affect the soil salt content. This can lead to reduced crop yields, slower plant growth, reduced nutrient uptake, and greater susceptibility to pests and diseases, especially in arid and semi-arid saline soils [
10]. Cumulatively, these factors may contribute to reduced agricultural yields and crop quality and ultimately jeopardize regional food security. In addition, salinity-induced soil degradation can lead to long-term environmental impacts, such as reduced soil fertility, increased soil erosion, and reduced biodiversity [
36].
In our study area, under the background of inter-basin water transfer, with the transformation of irrigation methods from traditional flood irrigation to modern water-saving irrigation during 1996–2023, soil salinity has been effectively controlled, and the impact of soil salinity on crop yields has been greatly reduced. Hu [
37] found that the total number of cotton roots under drip irrigation was 1.6 times that under flood irrigation, and the yield could be higher under drip irrigation with appropriate irrigation methods. Water-saving irrigation technology tremendously improves crop water productivity and crop yields; however, when brackish water is used for irrigation, soil salt accumulation is aggravated, which is prone to salt stress on crops [
35]. In order to address the problems posed by the salinization of groundwater, soil, and irrigation water, the use of appropriate irrigation methods, such as precision irrigation, efficient water management techniques, and the use of high-quality irrigation water sources, is essential in the KID. In conclusion, further revealing the characteristics of soil water and salt transport and accumulation under drip irrigation conditions, formulating water and salt regulation programs for farmland, revealing the kinetic mechanism of coupled crop water and salt responses, determining the critical control threshold, constructing farmland drainage and regional salt disposal models, and optimizing salt-tolerant crop varieties are the keys to realizing the high-quality development of agro-ecosystems.
5. Conclusions and Implications
In this study, we presented an investigation of the spatio-temporal variability of soil salinity and sodicity dynamics and controlling factors and an evaluation of the effects of soil salinization on the yield of crops with diverse salt tolerances in an inter-basin water transfer area of northwestern China. The results revealed that soil salinity and sodicity profiles exhibited a clear vertical stratification under both the ECGS and LCGS in the KID. The degree of soil salinization has been decreasing and the area of non-saline land has been increasing significantly from 1996 to 2023 in the KID. Owing to the lack of salt-washing water and poor irrigation water quality, the water-saving irrigated farmland was in the slight salt-aggregating state in the topsoil layer, while the other soil layers were in the salt-expelling or salt-equilibrating state in the KID. The salinity and sodicity distribution are mainly characterized by climate, irrigation, and groundwater dynamics, and the plant salt tolerance, soil properties, and agronomic management also influence the soil salt accumulation. With the transformation of irrigation methods from traditional flood irrigation to modern water-saving irrigation during 1996–2023, the impact of soil salinity on the crop yield has been greatly reduced in the KID. Capitalizing on these research findings, we would provide effective directives for maintaining the sustainability of agricultural development in other similar inter-basin water transfer zones.
We conclude that inter-basin water transfer plays a key role in the high-quality development of agriculture in arid environments, yet irrational irrigation and drainage management may affect all aspects of local ecosystems. Future studies should optimize the drainage facilities according to the actual situation in the irrigation area to ensure that the groundwater level is within the ecological threshold in the irrigation area. At the same time, precise irrigation and fertilization measures should be fully implemented to prevent soil salinization caused by inadequate leaching and excessive fertilization. In addition, crop selection and agronomic practices have a key role in minimizing the effect of soil salinity and sodicity, and farmers should plant salt-tolerant and low-water-consuming crops as well as use crop rotations to interrupt the salt cycle and improve soil fertility.


