Article

Effects of Low Green Light Combined with Different Red and Far-Red Light Ratios on the Growth and Secondary Metabolites of Cilantro (Coriandrum sativum L.)

by
Manuel Mayam Miranda Sotelo
1,†,
Yuan-Kai Tu
2,†,
Pearl Pei-Chun Chang
1,
Wei Fang
3 and
Hsing-Ying Chung
4,*
1
Department of Tropical Agriculture and International Cooperation, National Pingtung University of Science and Technology, Pingtung 912, Taiwan
2
Crop Genetic Resources and Biotechnology Division, Taiwan Agricultural Institute, Taichung 413, Taiwan
3
Department of Biomechatronics Engineering, National Taiwan University, Taipei 106, Taiwan
4
Department of Plant Industry, National Pingtung University of Science and Technology, Pingtung 912, Taiwan
*
Author to whom correspondence should be addressed.
These authors contributed equally to this work.
Agronomy 2025, 15(6), 1363; https://doi.org/10.3390/agronomy15061363
Submission received: 20 April 2025 / Revised: 27 May 2025 / Accepted: 28 May 2025 / Published: 31 May 2025

Abstract

Plant factories offer a promising opportunity for fresh food production due to their minimal land requirements. Among the adjustable factors in the production system of plant factories, light serves as a critical element, significantly influencing both crop yield and quality. Cilantro, a prevalent culinary herb and a traditional flavoring agent, plays a crucial role in Taiwanese gastronomy. This research investigated cilantro plants grown under nine different light treatments with varying red to far-red ratios and green light percentages over a 49-day period. Results demonstrate that maximum fresh and dry biomass accumulation in both shoot and root tissues occurred under treatments with red to far-red ratios of approximately of 1.8 combined with medium green light intensity. Conversely, medium far-red ratios negatively affected lutein and carotenoid concentrations in foliar tissues. Carotenoid biosynthesis exhibited an inverse relationship with green light intensity, with lower green light percentages corresponding to significantly higher carotenoid concentrations. In terms of energy efficiency, a red to far-red ratio of approximately 1.8 yielded the highest energy yield (g kWh−1) and photon yield (g mol−1), indicating optimal energy conversion efficiency under this spectral composition. In conclusion, this study demonstrates that cilantro cultivation under R53G05B13FR29 spectral composition (53% red, 5% green, 13% blue, 29% far-red) with a 49-day production cycle maximizes biomass while optimizing energy utilization efficiency.

1. Introduction

The domestication and cultivation of cilantro (Coriandrum sativum L.) have spread from its place of origin in the Mediterranean region to the rest of the world giving fresh and smelly flavor to Indian, Mexican, Thailand, Chinese, Vietnamese, and Middle East cuisine. However, in recent years the production of this crop has faced challenges with global warming and elevated temperatures. In Taiwan, multiple factors have contributed to significant fluctuations in cilantro market prices. These factors include the destructive impact of typhoons, summer field floodings, and the excessive application of agrochemicals throughout the remainder of the growing season, all of which adversely affect cilantro production efficiency and yield stability.
Beyond conventional open-field cultivation, cilantro production in plant factories has emerged as a viable alternative [1]. These fully enclosed facilities isolate crops from external variables, enabling precise regulation of growth conditions [2]. Through meticulous control of temperature, humidity, nutrients, light, and—in advanced systems—atmospheric composition [3], plant factories facilitate year-round production without pesticide applications, enhancing both reliability and food safety.
Plant factories with artificial lighting (PFAL) enable precise adjustment of multiple lighting parameters, including spectral quality, photosynthetic photon flux density, photoperiod, and incident angle [4], which are critical factors directly influencing both plant growth and secondary metabolite biosynthesis [3]. Light-emitting diode (LED) technology development has dramatically enhanced illumination control precision and energy efficiency, facilitating the application of narrow-bandwidth spectral treatments with minimal radiant heat emission [5]. This technological advancement has expanded research capabilities, allowing plant scientists to conduct more sophisticated investigations into photoreceptor mechanisms, wavelength-specific plant responses, and potential synergistic interactions among different spectral regions [6].
Within the common electromagnetic spectrum range (300–800 nm) utilized in PFAL lighting studies, wavelengths are typically categorized as red (600–700 nm), blue (400–500 nm), green (500–600 nm), and non-visible regions including far-red (700–800 nm), UV-A (315–400 nm), and UV-B (280–315 nm). Red and blue wavebands primarily drive photosynthetic processes, while green light contributes less to photosynthetic activity [7]. These visible wavelengths constitute the photosynthetically active radiation (PAR) region spanning 400–700 nm [8]. In contrast, far-red and ultraviolet radiation do not directly participate in photosynthesis but influence plant developmental processes, secondary metabolite accumulation, and morphological responses [9].
Despite its lower absorption by chlorophyll pigments, green light demonstrates superior canopy penetration capacity, enabling photosynthetic activity in lower-positioned leaves that would otherwise receive insufficient irradiance [7]. The characteristic leaf arrangement in cilantro suggests that illumination of green wavelengths represents a potential cultivation strategy for developing higher-density cilantro crops with enhanced biomass accumulation. Regarding far-red radiation, plants possess sophisticated detection mechanisms that trigger numerous physiological responses, including photoperiodic regulation, morphological adaptations, and synergistic interactions with other spectral regions [9]. In cilantro production systems, far-red supplementation can optimize radiation distribution throughout the canopy by inducing shade avoidance responses, thereby improving overall light interception efficiency [10].
Plant factories with artificial lighting (PFAL) represents a promising solution for providing spatially efficient, pesticide-free cultivation while enabling precise environmental control. The present study quantified the effects of spectral composition on both growth parameters and secondary metabolite accumulation in cilantro. Through systematic cultivation of cilantro under nine distinct spectral combinations with varying proportions of red, green, blue, and far-red wavebands, this study aims to identify optimal lighting parameters that could enhance both biomass productivity and phytochemical content, thereby advancing sustainable production strategies for this high-value culinary herb.

2. Materials and Methods

2.1. Germination and Plant Seedlings

Cilantro (Coriandrum sativum L.) seed variety ‘Yuan Shiang’, Fong Tien Seed Company, Taiwan, Kaohsiung, were cracked and disinfected with a 3% H2O2 solution. The seeds were put in petri dishes with 10 mL of a 0.005% HClO solution to enhance the seed germination and put in darkness for 5 nights at 24 °C. Three growing cycles were performed in 2024: the middle R:Fr cycle from 1 August to 19 September, the low R:Fr cycle from 23 September to 11 November, and the high R:Fr cycle from 7 November to 26 December.

2.2. Growth Conditions and Seedling

Five days after sowing (DAS) in darkness, plantlets were taken and trans-planted into a plant factory prototype with artificial lighting with a smart controlling environmental system, in the National Pingtung University of Science and Technology, Research Farm for Sustainable Agriculture, Green Energy Greenhouse. The plants were grown in an enclosed deep water hydroponic system in sponge cubes 4 × 4 × 4, in trays of 100 cm length × 60 cm width, with a plant density of 15.84 plants m−2. Plants were immediately exposed to the lighting treatments. All treatments had a mean biological photon flux density (BPFD) (380 nm–800 nm) of 200 µmol m−2 s−1 in a photoperiod of 16 h light 8 h darkness. The environmental conditions of the growing chamber included a constant temperature of 24/22 °C day and night a relative humidity of 75% from 5–28 DAS and a relative humidity of 60% from 29 to 49 days after sowing; this change in parameters was to avoid the common plant disorder of tip-burn. The CO2 concentration was set at a constant value of 600 µmol mol−1.

2.3. Nutrient Solution

Cilantro plants were subjected to two different nutrient solutions according to the growing stage. For 5–21 DAS, a solution containing 2.87 me/L Ca(NO3)2, 2 me/L KNO3, 1 me/L (NH4)2SO4, 0.48 me/L NH4PO4H2, 0.66 me/L KH2PO4, 2.05 me/L MgSO4, 0.05 me/L EDTA-Fe, 0.16 me/L H3BO3, and 15 g/1000 L of micronutrients with an EC of 0.90 mS/cm and a pH in the range of 5.5–6.0 was used and for 22–49 DAS, a solution containing 4.31 me/L Ca(NO3)2, 4.0 me/L KNO3, 1 me/L (NH4)2SO4, 0.64 me/L NH4PO4H2, 1.32 me/L KH2PO4, 4.11 me/L MgSO4, 0.06 me/L EDTA-Fe, 0.24 me/L H3BO3, and 20 g/1000 L of Micronutrients with a EC of 1.60 mS/cm and a pH in the range of 6.0–6.5 was used.

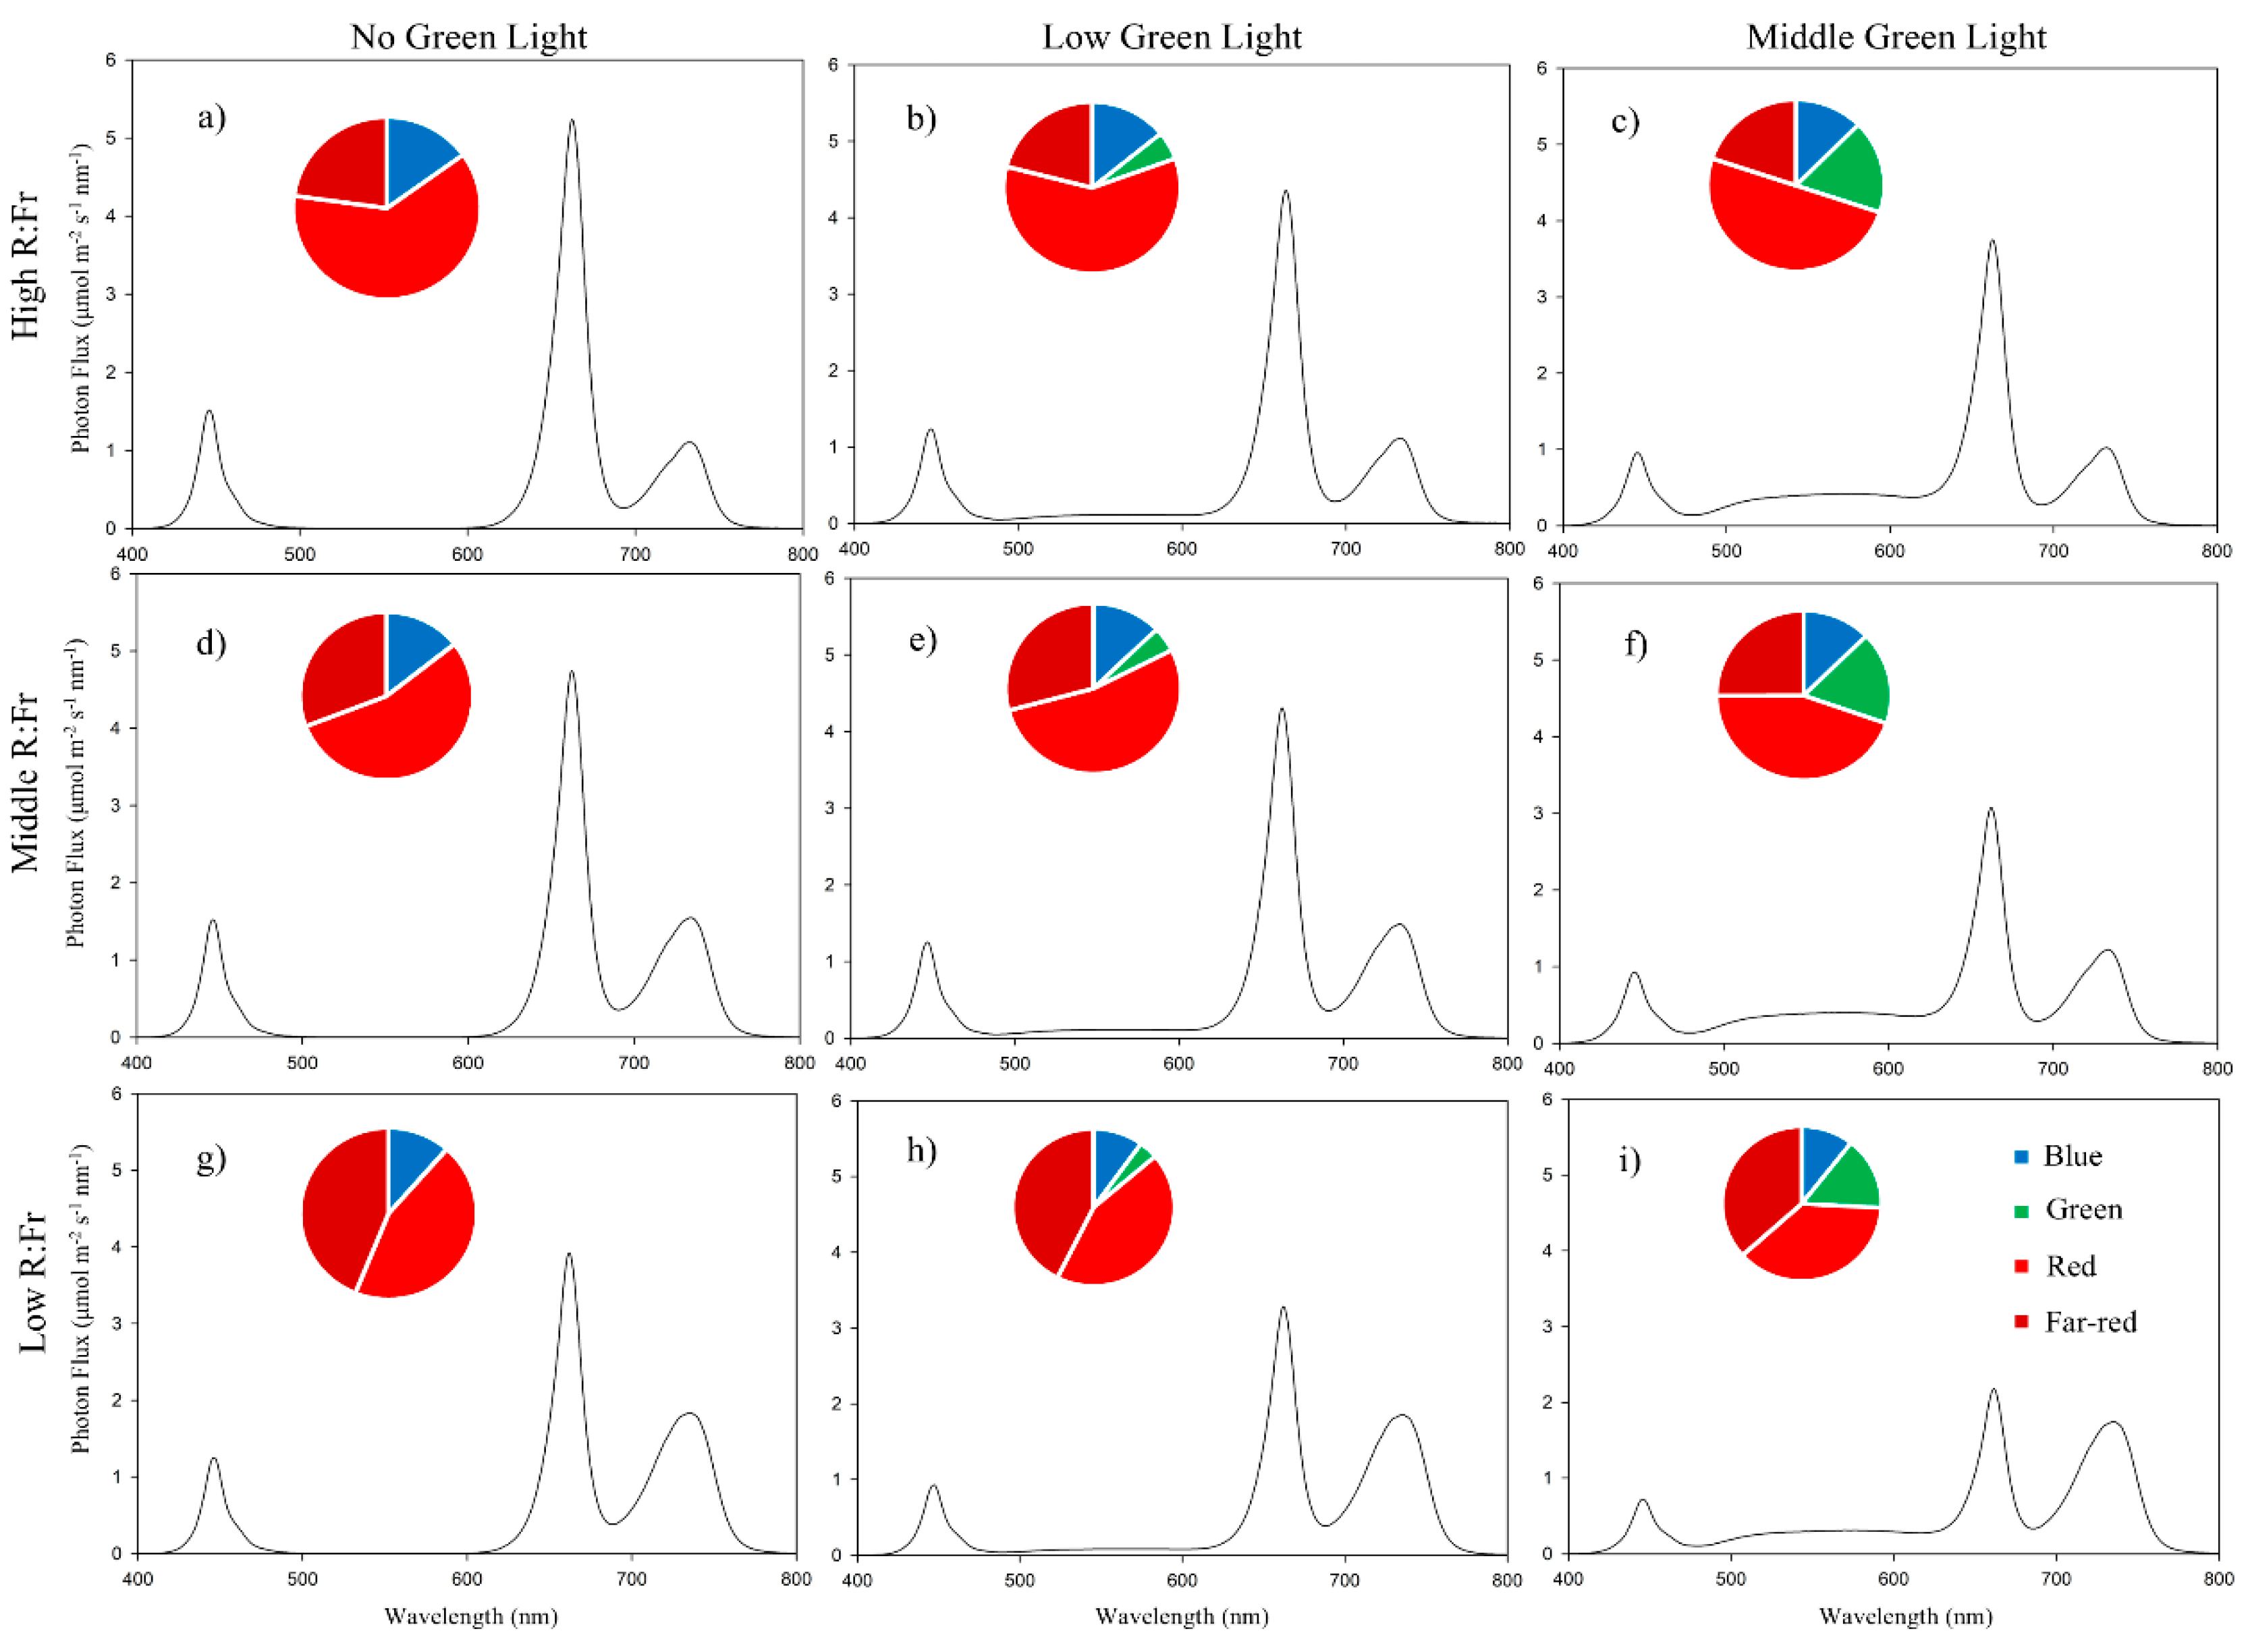
2.4. Light Treatments

From 5 to 49 DAS, the light treatments were designed to be maintained with a red to blue proportion from 3 to 4 while varying the red to far-red (R:Fr) proportion and green light percentage was as follows; high R:Fr group R:Fr2.7_0G (R62G0B15Fr23), R:Fr2.8_lowG (R60G5B14Fr21), and R:Fr2.5_midG (R50G18B12Fr20); middle R:Fr group: R:Fr1.7_0G (R55G0B14Fr31), R:Fr1.8_lowG (R53G5B13Fr29), and R:Fr1.7_midG (R44G18B13Fr25); low R:Fr group: R:Fr1_0G (R45G0B11Fr44), R:Fr1_lowG (R44G4B10Fr42), and R:Fr1_midG (R37G15B11Fr37). On 49 DAS, the plants were harvested (Table 1).
The LED lamps used to provide red and blue light were model RB01a 48V DC manufactured by Just Power Integrated Technology Inc. in Taiwan, Hsinchu County; the red and far-red lamps were model RFR 48V DC, manufactured by Just Power Integrated Technology Inc. in Taiwan; and the red, white, and blue lamp used in the low and middle green light were RW-01 model 48V DC, manufactured by Just Power Integrated Technology Inc. in Taiwan.
The light quality in each treatment is displayed in Figure 1. To maintain uniformity in the irradiated area, 22 measurements were made along the surface with a spectrometer model SE2030-025-VNIR14 manufactured by ISUZU Optics, Taiwan, Hsinchu County. All spectral measurements were evenly conducted 22 times across the entire plant growing area.

2.5. Measurements of Physical Characteristics

The measurements were made in a constant 24 °C room, plant height was determined by measuring the distance between the bases of the plant to the largest leave, the same as in the roots, from the start of the root to the end-tip. Shoots and roots fresh weight were determined by using an electronic scale (EL3002, METTLER TOLEDO, Switzerland, Zurich). For dry weight, dry material was obtained from drying the shoots and roots at 70 °C for 5 days.

2.6. Measurements of Pigments

Pigment content was determined following the method from Wei et al. (2010) [11], with minor modifications. Fresh leaf samples were extracted using 1:1 ethanol and acetone and absorbance were measured at different wavelengths, 470, 474, 485, 649, and 665 nm, in a spectrophotometer. Results were expressed in mg g−1 FW.
Total chlorophyll (mg/g) = (6.1 × A_665 + 20.04 × A_649) × 0.03/0.5
Chlorophyll a (mg/g) = (9.78 × A_665 − 0.99 × A_649) × 0.03/0.5
Chlorophyll b (mg/g) = (12.6 × A_649 − 4.65 × A_665) × 0.03/0.5
Lutein (mg/g) = (10.2 × A_470 − 0.0255 × A_485 − 0.0036 × Chl a − 0.652 × Chl b) × 0.03/0.5
Carotenoids (mg/g) = (4.92 × A_474 − 0.0255 × Chl a + 0.336 × Chl b) × 0.03/0.5

2.7. Measurement of Total Phenolics Content

To measure the phenolics content in leaves, stem, and roots, samples of 1 g were obtained and ground with liquid nitrogen in a ceramic mortar and homogenized with 10 mL of methanol [12], poured into an Eppendorf tube, and rested overnight. The next day, 0.25 mL of the extract was mixed with 0.25 mL of Folin–Ciocalteu’s reagent 50%, after 3 min 0.5 mL of Na2CO3 solution was added to maintain the pH of the reaction, followed by 4 mL of distilled water. To allow the reaction to complete, 20 min were necessary. After the 20 min, the samples were measured in a spectrophotometer at 735 nm. The values obtained were replaced in a standard curve made previously with different concentration solutions of gallic acid equivalent (GAE) of 10 ppm, 30 ppm, 50 ppm, 100 ppm, 150 ppm, and 200 ppm. The total phenolics yield per area was calculated by multiplying the plants’ fresh weight by the mean phenolics concentration in each treatment and the plant density.

2.8. Nitrates and Vitamin C

To measure nitrates and vitamin C, a colorimetric method was used with the RQFlex® reflectometer (RQflex 20, Merck KGaA, Germany, Darmstadt) by mixing 5 g of the plant tissue with 100 mL of water and tested with a reactive strip; the obtained result in vitamin c should be multiplied by 0.02 to obtain the units in mg g−1 and for the nitrates multiplied by 20 to obtain the results in mg kg−1. The total nitrates yield per area was calculated by multiplying the plants’ fresh weight by the mean nitrates concentration in each treatment and the plant density.

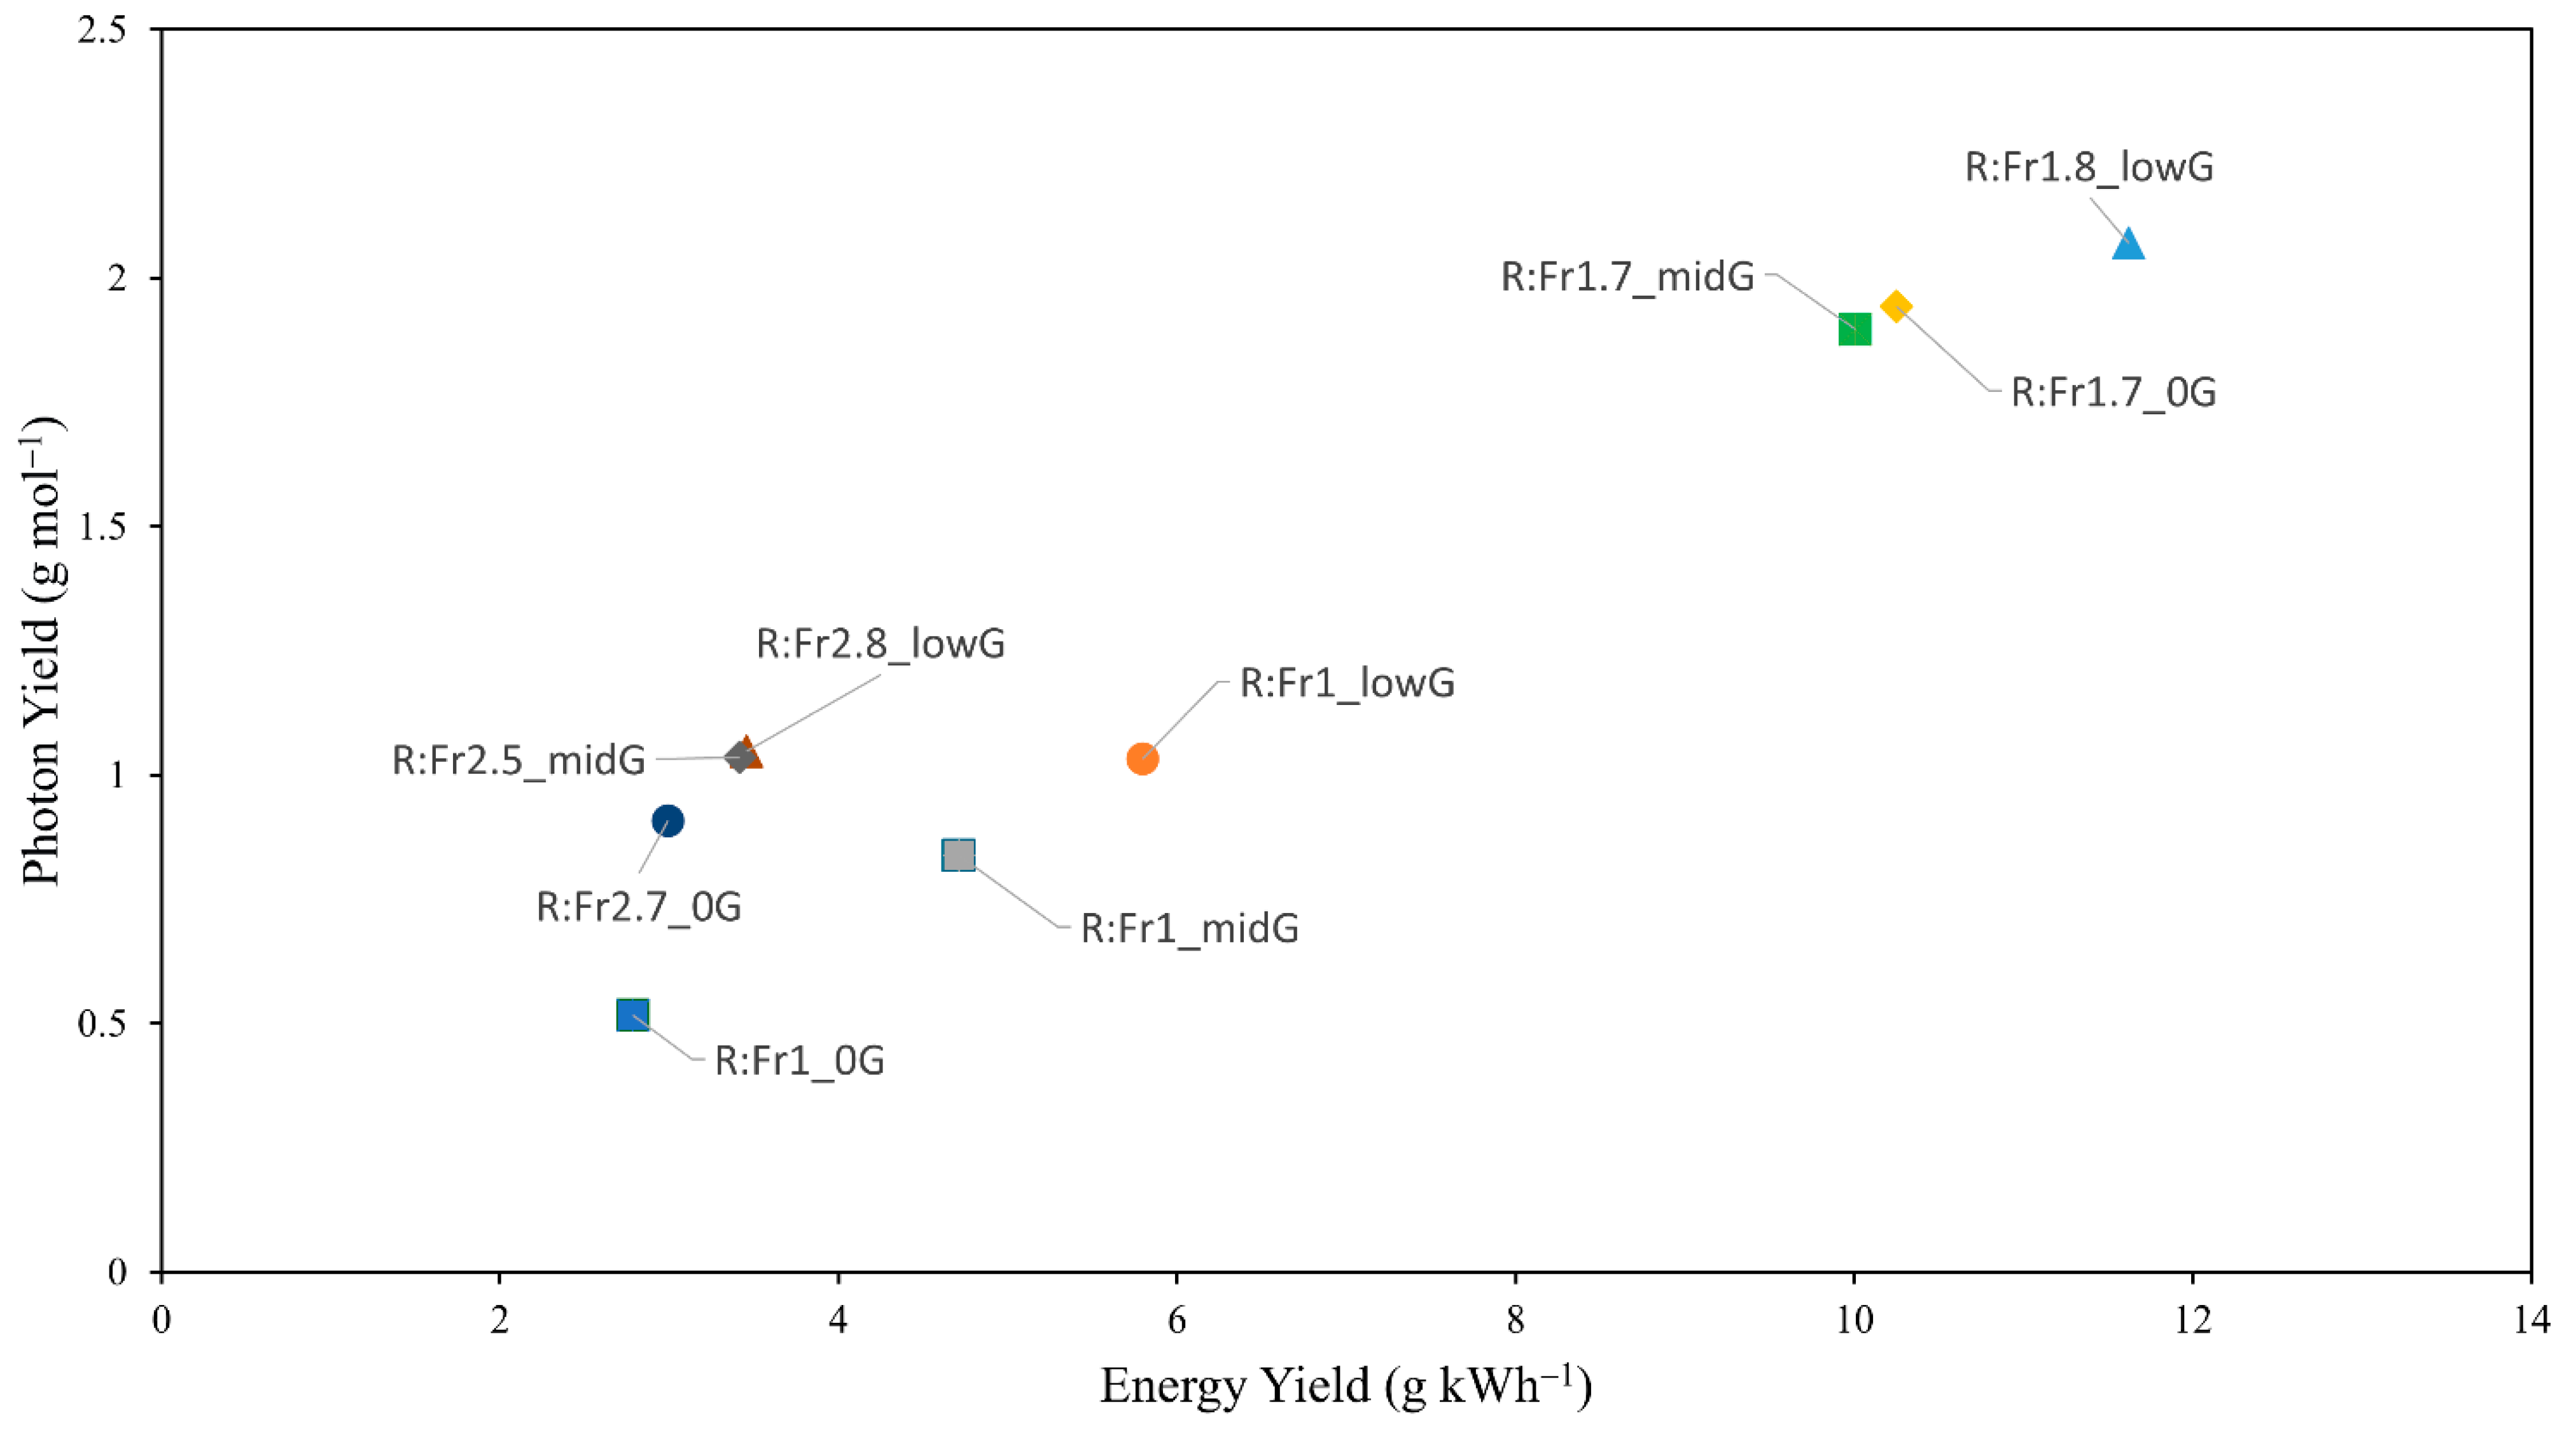
2.9. Energy Yield and Photon Yield

Two parameters, energy yield (EY) and photon yield (PY), indicating biomass produced per unit of energy provided, were used in this study. The EY is the amount of biomass, in grams of fresh weight, produced per kilowatt of electric energy per unit of time (g kWh−1). The PY refers to the biomass in grams of fresh weight produced by a mole of photons (g mol−1) [13].

2.10. Statistical Analysis

Statistical analysis was performed using IBM SPSS Statistics V.24 software. A one-way analysis of variance (ANOVA) was used to compare treatments, while a two-way ANOVA was applied for experimental group treatments, followed by a Tukey’s post hoc test with a significance level of p < 0.05. Data are presented as mean ± standard deviation, and the number of samples for each analysis is specified in the corresponding tables.

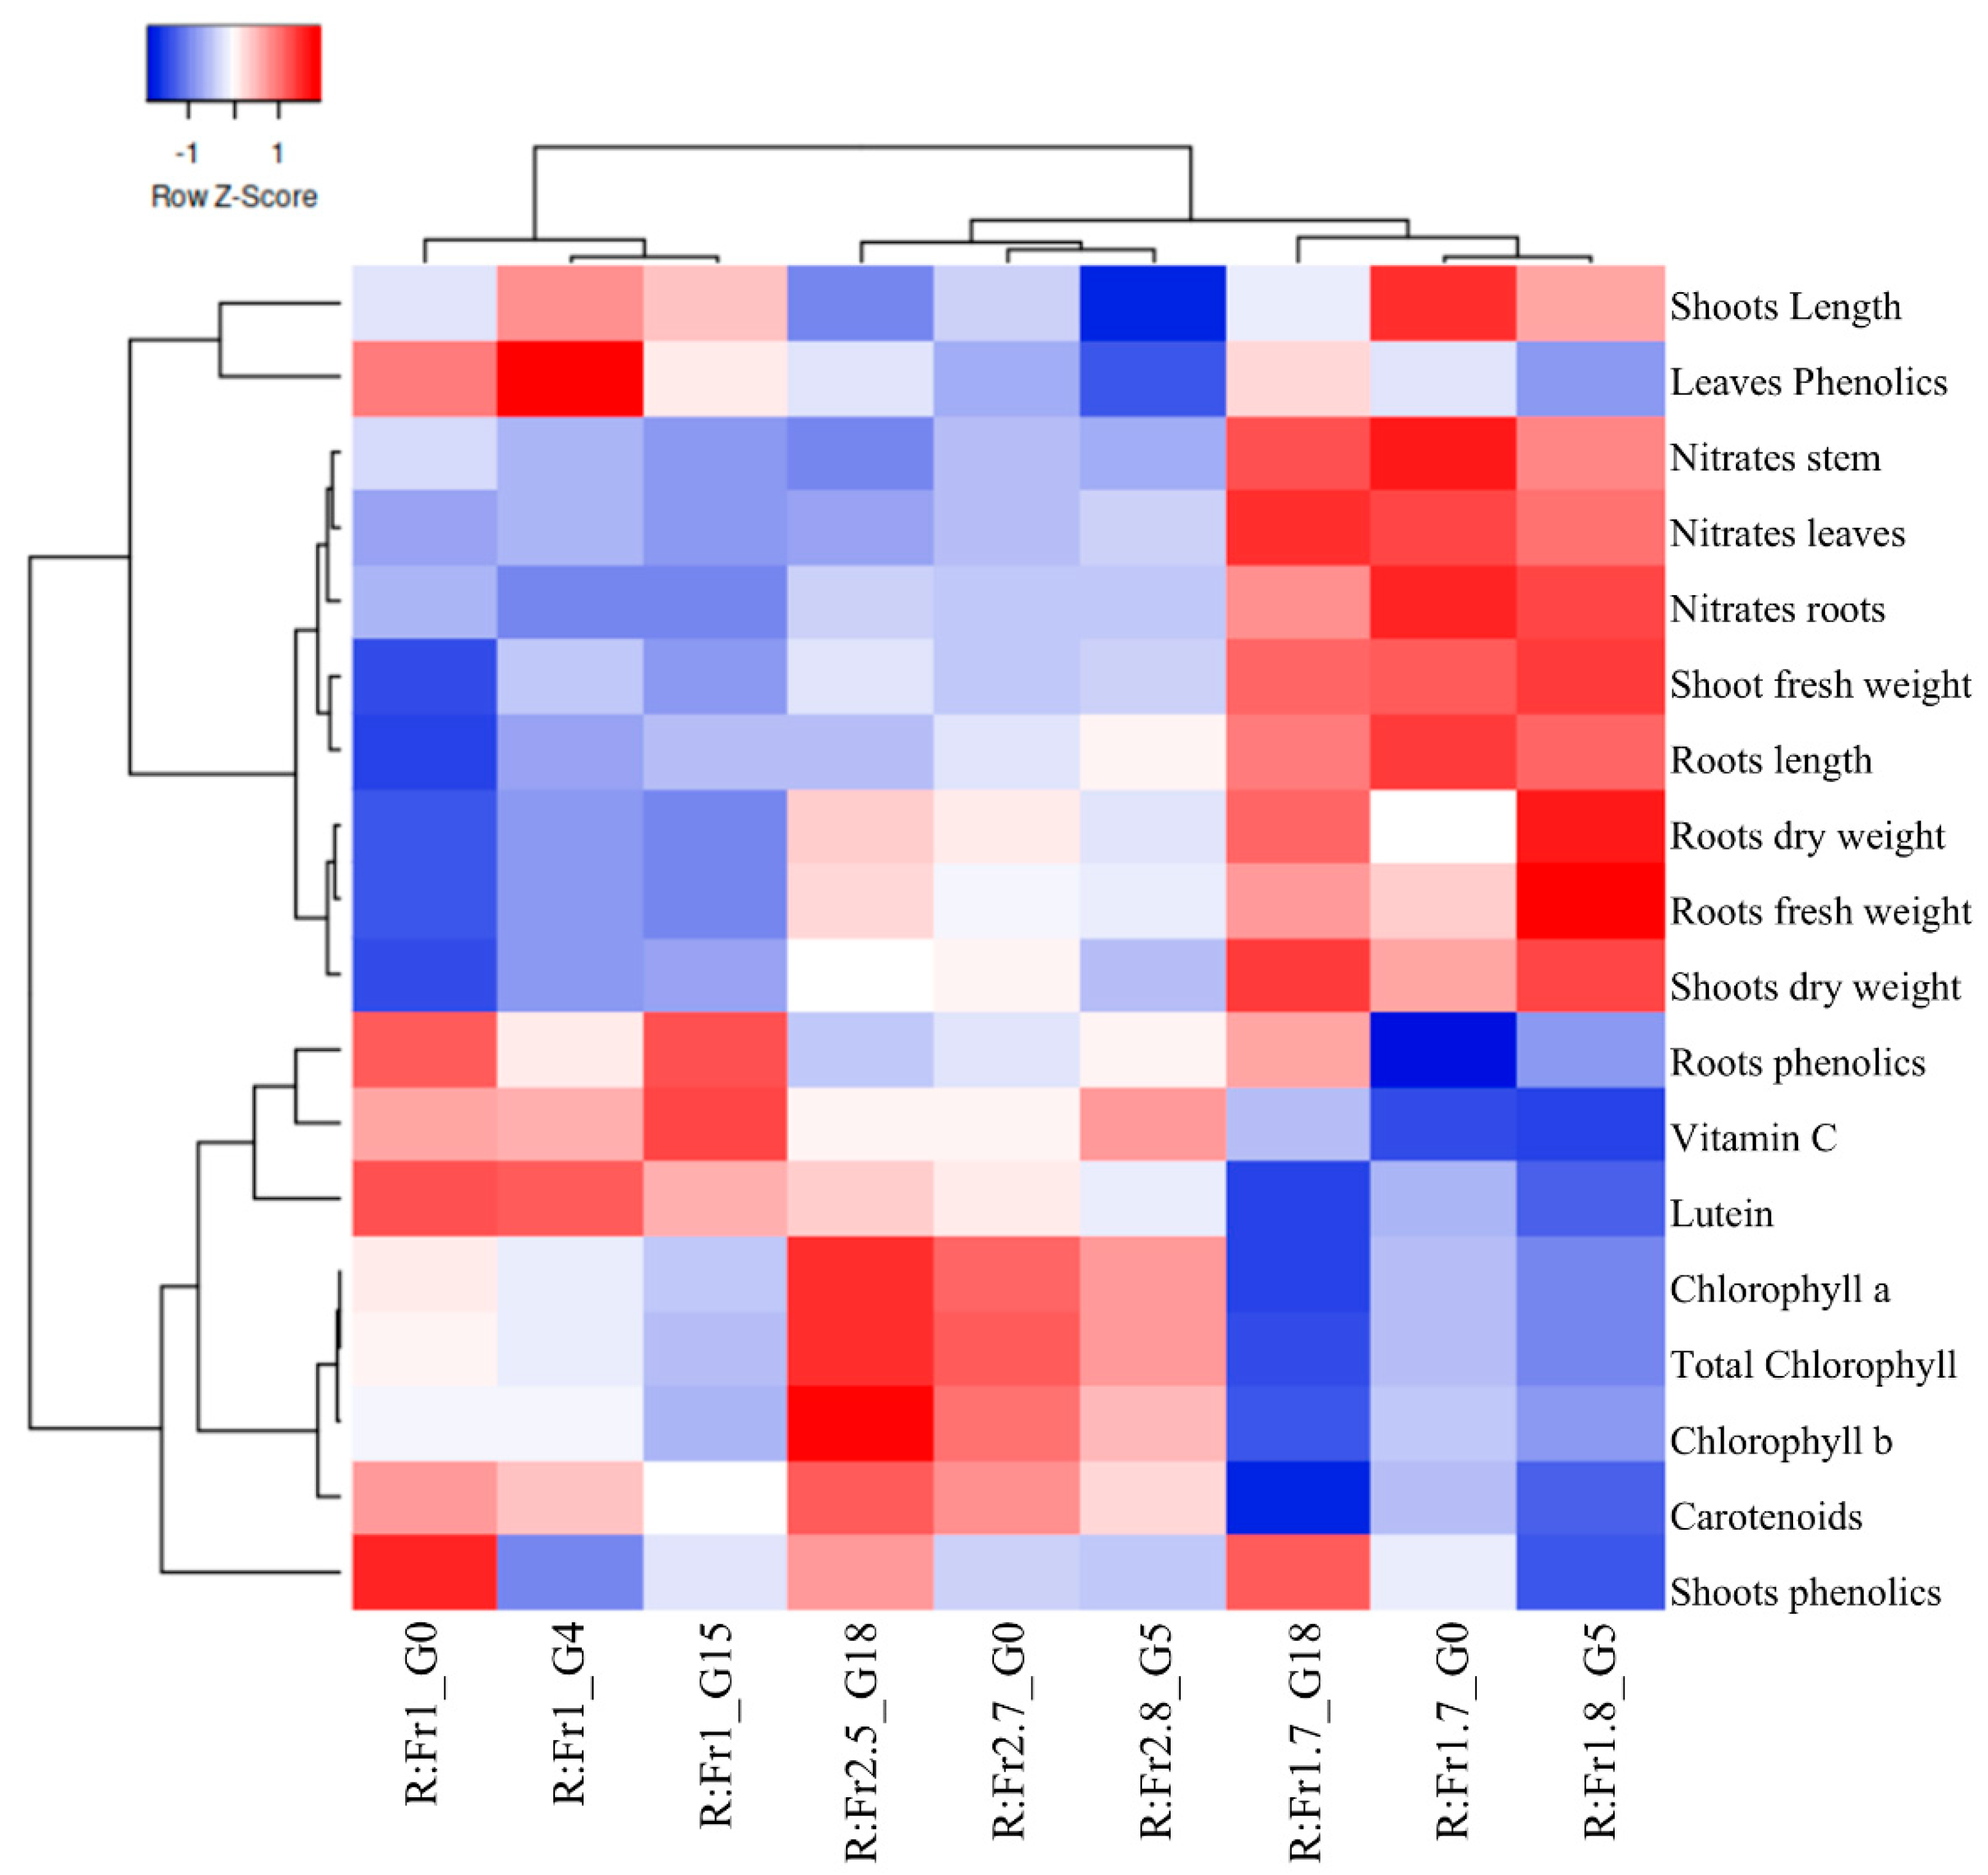
2.11. Clustering and Graphical Representation

A cluster heatmap was generated to visually represent the data normalized by their z-score. This analysis was conducted using the online tool “Heatmapper: web-enabled heat mapping for all” [14]. In the expression section, the scale type was set to “row”, the clustering method to “average linkage”, and the distance measurement method to “Pearson”. Clustering and dendrograms were applied to both rows and columns.

2.12. Surface Response Curve

To evaluate and visualize the response of light treatments to the fresh weight, dry weight, and metabolites, R:Fr proportion and green light percentage were input as independent variables, while mean measurements of fresh weight, dry weight, and metabolites were input as dependent variables by using Sigmaplot 10.0 software to generate the surface response meshes by interpolation, no specific equation or model.

3. Results

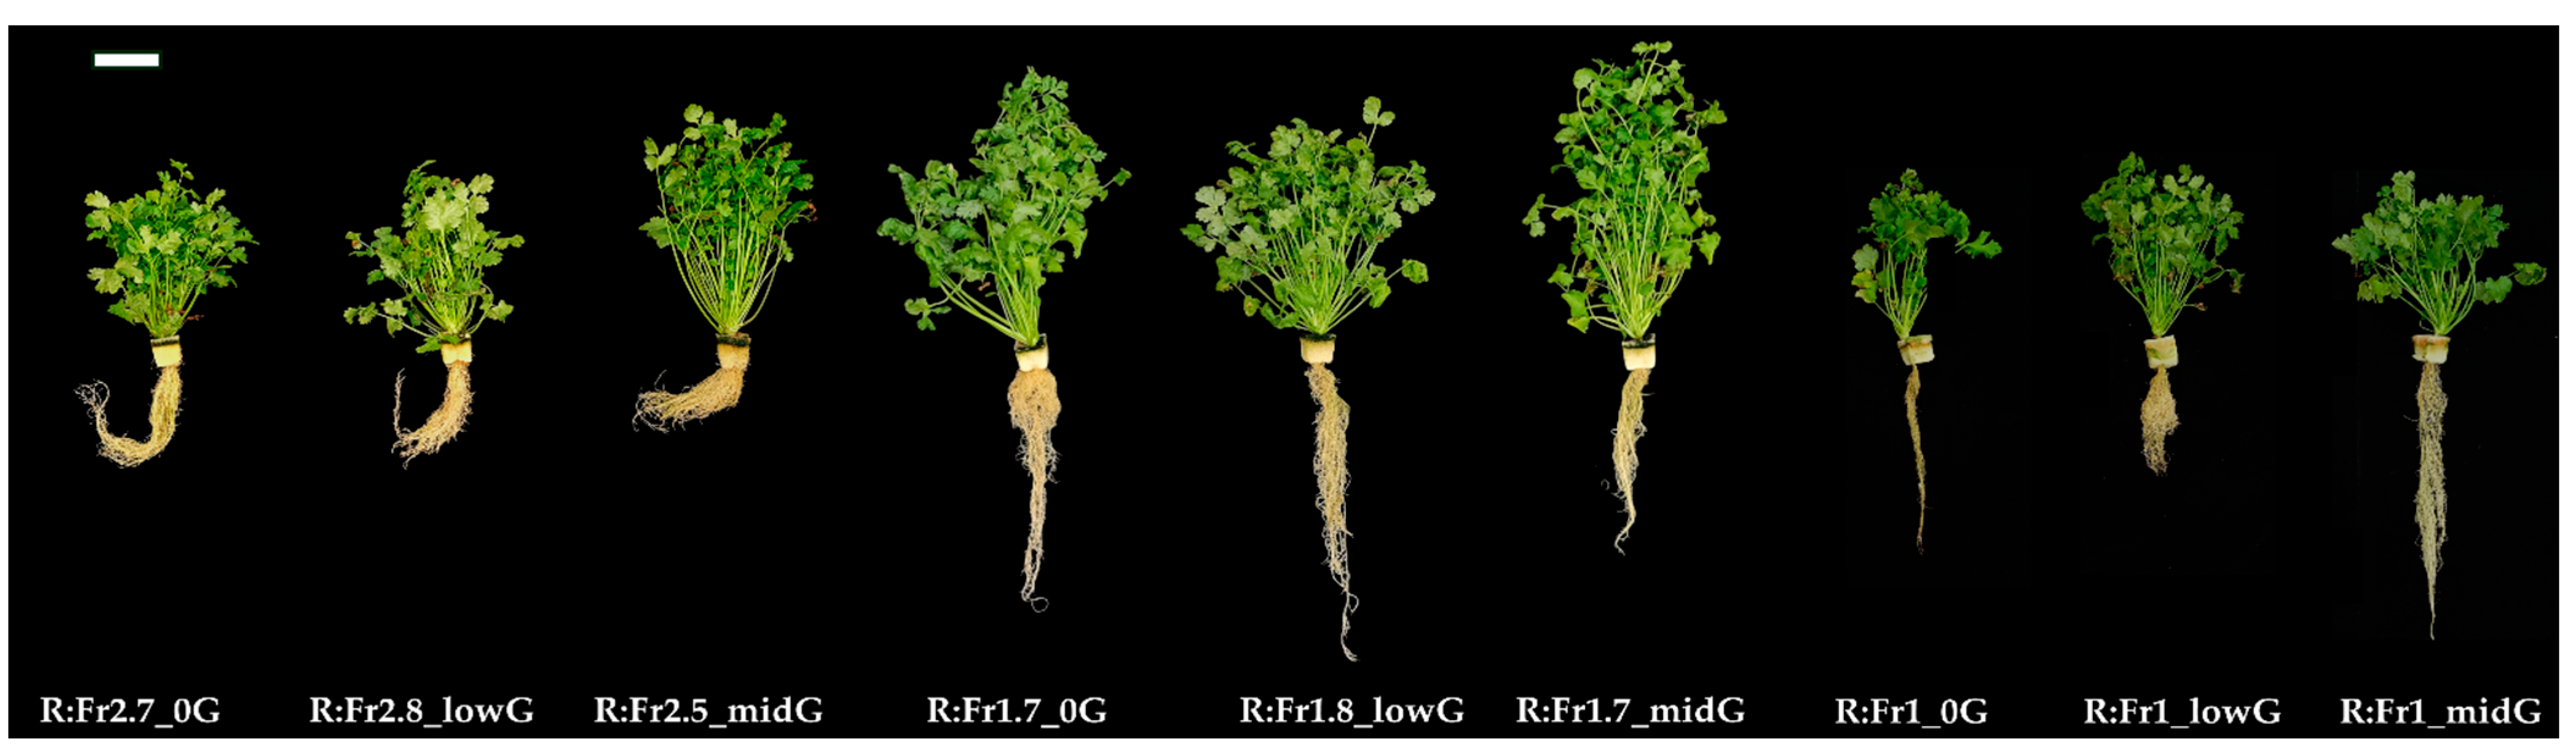
3.1. Cilantro Growth Under R:Fr + G

At 49 DAS, the plant morphology shown in Figure 2 and the corresponding growth data demonstrate that treatments with a medium red to R:Fr light ratio resulted in the greatest shoot biomass accumulation, as presented in Table 2. Among the tested R:Fr ratios of 1.0, 1.8, and 2.5, both shoot fresh and dry weights followed a unimodal distribution, with the intermediate ratio of 1.8 yielding the highest biomass, while the lowest values were consistently recorded under the R:Fr = 1.0 treatment. The shoot fresh weight reached a maximum of 66.4 g in the R:Fr1.8_lowG treatment, whereas the lowest value, 16.5 g, was observed under the R:Fr1_0G treatment. Shoot dry weight exhibited a similar pattern, with the highest value of 7.02 g recorded in the R:Fr1.7_midG treatment and the lowest, at 1.36 g, again found in the R:Fr1_0G group. In contrast, the proportion of green light did not show any effect on either shoot fresh or dry weight. In terms of root biomass, an R:Fr = 1.0 shows reduced root fresh and dry weights, whereas an R:Fr = 1.8 significantly increased both parameters (Table 2).

3.2. Pigment Content Under R:Fr + G

Lutein and carotenoid contents exhibited similar trends. A low R:Fr = 1.8 reduced both lutein and carotenoid concentrations. For example, the R:Fr1_0G treatment resulted in the highest lutein concentration at 0.44 mg g−1, while the R:Fr1.7_midG treatment showed the lowest concentration at 0.20 mg g−1. In the case of carotenoids, the highest concentration was observed in the R:Fr2.5_midG treatment, reaching 0.57 mg g−1, whereas the lowest concentration, 0.28 mg g−1, was again found in the R:Fr1.7_midG group. Total chlorophyll concentration was highest under the R:Fr = 2.7, with the R:Fr2.5_midG treatment reaching 1.7 mg g−1. In contrast, the R:Fr1.7_midG treatment exhibited the lowest chlorophyll concentration at 0.75 mg g−1. Two-way ANOVA reveals that the R:Fr ratio had a strong effect on total chlorophyll concentration, whereas the effect of green light proportion was not detected. Nevertheless, a considerable interaction between the two factors was observed, suggesting a potential synergistic effect between the R:Fr ratio and green light levels.
For vitamin C, the highest concentration was observed in treatments with both low and high R:Fr ratios combined with a higher green light proportion (Table 3). A two-way ANOVA indicates that both the R:Fr ratio and green light proportion had a strong effect on vitamin C concentration, and the interaction between these two factors demonstrated a synergistic effect (Figure 3f). The highest concentration, 2.06 mg g−1, was found in the R:Fr1_midG treatment, while the lowest concentration, 0.83 mg g−1, was observed in the R:Fr1.8_lowG treatment. This suggests that, in most cases, increasing the green light proportion to 18% enhances ascorbic acid content compared to 0% green light.

3.3. Nitrates and Phenolics Content Under R:Fr + G

In cilantro plants, nitrates content was distributed among tissues as follows: stem > leaves ≈ roots (Figure 3c). In terms of the R:Fr ratio, the highest nitrates concentration was observed under the R:Fr = 1.7 treatment (Table 4), while treatments with R:Fr = 2.7 and R:Fr = 1.0 reduced nitrates levels considerably. A similar trend was observed in both leaves and roots. According to the two-way ANOVA (Table 4), the R:Fr ratio has a strong statistical effect on nitrates concentration.
As shown in Table 4, total phenolics content was distributed as leaves > stem > roots. A R:Fr = 1 showed an increased phenolics content, whereas the other two R:Fr group ratios showed no statistical differences. The highest concentration in leaves was recorded under the R:Fr1_lowG treatment, reaching 99 mg GAE g−1. Two-way ANOVA results indicate that in leaves, total phenolic content was significantly affected by the R:Fr ratio, and an considerable interaction occurred between the R:Fr ratio and green light percentage. In stems, the R:Fr ratio had no effect on phenolic concentration, but the green light proportion and its interaction with the R:Fr ratio were both significant. Talking about the roots, both the R:Fr ratio and the green light proportion statistically affected total phenolic content, as well as both lights interaction.
In case of nitrates content per tissue, in cilantro plants this was as follows: stem > leaves ≈ roots (Figure 3c). In terms of the R:Fr, the highest concentrations treatments were middle R:Fr (Table 4), while the lowest concentrations were found at the lowest and highest red to far-red proportions, showing the existence of a peak in the middle R:Fr of the low and high R:Fr; the same pattern was followed by leaves and roots.
Thanks to two-way ANOVA (Table 4), it can be corroborated that the nitrates concentration was strongly affected by the R:Fr. Additionally, in the stem and roots, there is also evidence of the influence from the green light percentage in nitrates concentration. Among the variables, it is shown that in both leaves and roots, an interaction effect exists; in leaves, green light does not seem to have effect, but when is combined with the R:Fr, it can act synergistically. Something similar happens in roots nitrates concentration, but in this case, there is a remarkably effect when both independent variables are applied individually as well as in the interaction between them.
In the case of total phenolics content, the concentration per tissue in cilantro plant was leaves > stem > roots (Table 4), with the highest concentration in R:Fr1_lowG with 99 mg GAE g−1 in leaves and the lowest in R:Fr1.7_0G with 0.16 mg GAE g−1 in roots. After comparing with a two-way ANOVA, the results show that the total phenolics content in leaves is only affected by the R:Fr and there is a significant effect in the interaction between the red to far-red proportion and the green light percentage. For the stems, this is different because, in this case, the red to far-red proportion does not show a meaningful difference in the total phenolics concentration but the green light percentage does, as well as the interaction effect between both variables. In the case of the roots, the R:Fr seems to have more affect than the green light percentage in the phenolics concentration, and when the light effects are combined, it shows a notable interaction.
Table 5 shows the total phenolic yield per unit of area. It was found that the combination of R:Fr = 1.7 with 15% green light increased the shoot phenolic yield by approximately 69% compared to R:Fr = 1 with no green light. Additionally, it was observed that increasing the proportion of green light greatly enhanced the total phenolic yield per unit area in roots at middle R:Fr proportions.
After calculating the energy yield and photon yield for each treatment, the results were graphically represented (Figure 4). The x-axis represents energy use, expressed in grams of fresh weight per kilowatt (g FW kW h−1), while the y-axis represents photon yield use, expressed in grams per mol of photons (g FW mol−1). Among the treatments, R:Fr1.8_lowG demonstrates the highest energy yield and photon yield, indicating superior efficiency. In contrast, R:Fr1_0G shows the lowest energy use and photon efficiency, representing the least effective treatment.
A clustered normalized heatmap analysis was performed to differentiate and compare the cilantro parameters with the light treatments and to observe the relationship among them (Figure 5). In the clustering per light treatments, the three main groups are ordered by R:Fr, evidencing it as the variable with more impact compared to the green light percentage. However, it is also important in some cases to recall the participation of the green light as in the vitamin C (Table 3) concentration or the phenolics concentration in leaves (Table 4), which may not impact directly but have an interactive effect on its concentration.
Four main groups can be easily observed (Figure 5); the biggest one at the top left located in the low and high R:Fr proportions have the lowest values mostly for the physical properties including shoots and roots fresh and dry weight, shoots length, and phenolics in leaves and nitrates. This is followed by the second group at the bottom left, with most of the highest concentration in biochemical properties being present, including roots phenolics, vitamin C, and pigments with the highest values in the same R:Fr. The third group located in the top right of the heatmap, which encloses the middle R:Fr, has the highest values in the physical properties including shoots and roots fresh and dry weight, shoots length, phenolics in leaves, and nitrates concentrations, and the last one, the fourth group in the bottom right part of the heatmap, has the lowest concentrations of phenolics in roots, shoots, vitamin C, and pigments.
Therefore, Figure 5 indicates that R:Fr ratios around 1.7 to 1.8 are associated with optimal growth indicators. A R:Fr ratio of 2.7 notably stimulates pigment accumulation, particularly chlorophyll, while an R:Fr ratio of 1 enhances the accumulation of total phenolics and ascorbic acid.

4. Discussion

4.1. Light Quality for Cilantro Growth—Exploring R:Fr Ratios Under High Red Light

Studies on the impact of light quality on cilantro yield have been conducted for many years. Among these, red and blue light are widely recognized for their significant influence on photosynthesis. The optimal red-to-blue ratio (R:B) for maximizing cilantro yield has been identified as R:B = 4:1 [15]. However, most research has overlooked the roles of green light and far-red light in plant growth, resulting in incomplete light spectral combinations or light formulations. Phytochromes are the principal photoreceptors for red and far-red light perception and signaling in plants confirmed by Takano et al. [16], making it essential to consider these wavelengths when evaluating spectral effects. Therefore, the present study maintains an R:B ratio of 4 as a baseline for investigating the role of far-red light.
In previous studies on cilantro, Nguyen et al. [17] applied various light treatments and found that shoot fresh weight and plant height under R:B and R:B:FR treatments were significantly higher than those under treatments with only blue, green, or red–blue light. Although the effect of Fr was not statistically significant at a red to far-red ratio of 13.8, the yield was still slightly higher compared to treatments without FR. Further reduction in the R:Fr ratio was shown to increase yield in cilantro.
In the study by Akter and Cammarisano [18], cilantro plants were cultivated under different R:Fr ratios, and the addition of Fr significantly enhanced plant yield. Among the tested R:Fr ratios, a 3:1 ratio resulted in a higher yield than 8:1, suggesting that cilantro prefers a lower red to far-red ratio.
Similarly, Bae and colleagues [19] investigated four R:Fr ratios (0.7, 1.2, 4.1, and 8.6) in Crepidiastrum denticulatum and found that R:FR = 1.2 produced the highest shoot fresh weight of 32 g, almost three times that of the 8.6 ratio and the Fr-free control group, both around 13 g. These results further support that lower R:Fr ratios significantly enhance plant productivity, particularly in terms of shoot fresh weight.
In our current study, we further tested two low R:Fr treatments below 3—specifically 1.7 and 1. Among them, R:Fr = 1.7 yielded the highest shoot fresh weight, indicating it is the most favorable treatment for enhancing cilantro growth. The addition of far-red light effectively induces a shade-avoidance response, improving light interception efficiency. Our results also show that appropriate Fr supplementation promoted petiole elongation (Figure 2), which likely contributed to enhanced photosynthetic efficiency by improving light exposure to leaves through a different canopy architecture, leading indirectly to an increased biomass generation (Table 2).
Additionally, green light penetration may enhance light availability for lower canopy leaves. In our study, supplementing 18% green light under R:Fr = 1.7 increased shoot dry weight by 25% compared to 0% green light. This suggests that the far-red-induced morphological changes in cilantro improve light interception, while higher green light penetration enhances light distribution, together contributing to improved photosynthetic productivity and overall growth.
In the study by Akter and Cammarisano [18], two R:Fr ratios, 8:1 and 3:1, were used to measure the nitrogen content in the whole plant, and the results show no significant difference between the two treatments. On the other hand, in the study by Nguyen et al. [17], under light treatments with red–blue (R:B) ratio of 87:13 and red–blue–far-red (R:B:Fr) ratio of 163:25:12, the nitrogen content was 58 mg g−1 DW and 58.1 mg g−1 DW, respectively, indicating that high R:Fr ratios have little effect on nitrate concentration. A high R:Fr ratio of 13.5 showed no significant effect on yield. Nitrate is an essential nutrient absorbed by plants, and in this study, when the red to far-red ratio was approximately 2.69, the nitrate concentration (converted to dry weight) was 95.4 mg g−1 DW, which is 1.64 times higher than in the aforementioned studies. Moreover, under a red to far-red ratio of 1.7 combined with green light (R:Fr1.7_xG), the nitrate concentration reached 279 mg g−1 DW, nearly five times higher. Therefore, this study suggests that an appropriate far-red light ratio can increase fresh weight, and in consequence of the rapid biomass accumulation, the nitrate content within the plant may be stored temporally instead of converted immediately into chlorophyll.

4.2. Light Quality for Cilantro Secondary Metabolite—Exploring R:Fr Ratios Under High Red Light

In this study, the trend observed in Figure 3 shows a positive correlation between vitamin C concentration and the addition of green light (ranging from 0% to 18%). Regarding the R:Fr light ratio, a clear effect in vitamin C concentration is observed when the ratio is above 2.7 or below 1.0. Supplementing far-red light under an appropriate red to blue light ratio can effectively enhance photosynthetic efficiency, and when combined with green light—which penetrates to the lower canopy layers—it can further improve overall photosynthetic capacity. This enhancement leads to an increased carbon flux, which, in turn, promotes the synthesis of secondary metabolites such as ascorbic acid [20]. According to the study by Nguyen et al. [17], vitamin C concentrations under light treatments of R:B 87:13 and R:B:Fr 163:25:12 were 1.19 mg g−1 and 1.25 mg g−1, respectively, suggesting that a lower R:Fr ratio can increase vitamin C concentration in plants. These findings are consistent with the results of the present study.
Phenolic compounds in coriander are major antioxidant constituents that effectively scavenge free radicals and inhibit lipid peroxidation, thereby contributing to the prevention of chronic diseases such as cardiovascular disease and cancer [21]. In the study by Nguyen et al. [17], light treatments with R:B:Fr at 163:25:12 and R:B at 87:13 showed trends similar to those in this study, where the addition of far-red light resulted in increased total phenolic content. This suggests that lower red to R:Fr light ratios promote the accumulation of such metabolites. As the proportion of far-red light increases (i.e., as the R:Fr ratio decreases), plants perceive competitive stress (simulating a shaded environment), activating the phytochrome-regulated signaling pathway that reduces Pfr levels, thereby stimulating defensive metabolism and enhancing the synthesis of secondary metabolites such as phenolics. This finding is consistent with results observed in this study (Table 4). However, based on ANOVA analysis in the present research, this effect is significant only in leaves and roots, and does not significantly affect phenolic content in stems. Although green light alone considerably impacts phenolic concentrations in stems and roots, a synergistic effect between green light and red to far-red ratios on total phenolic content was observed. Moreover, the influence of green light on nitrate and phenolic compound concentrations in stems and roots was more pronounced compared to that in leaves. This supports the theory proposed by Vogelman and Han [22], which suggests that green light can penetrate deeper into the canopy and exert effects on inner tissue layers.

4.3. Spectral Quantification Indices

Finally, when producing fresh vegetables, it is also important to consider production costs. In indoor cultivation systems, lighting is one of the highest expenses, accounting for a significant portion of total energy consumption. Through the “energy yield” and “photon yield” indices proposed by Chung et al. [13], we can compare the efficiency of various light treatments based on plant production per unit of energy consumed. In this study, the treatment group with a medium red to far-red ratio achieved the highest values for both EY and PY, being twice as high as the other two ratio groups. This suggests that a red to far-red ratio of approximately 1.8 might be the most suitable choice for indoor cilantro cultivation. Phenolic compounds are important secondary metabolites in cilantro. In this study, R:Fr = 1.8 substantially reduced the total phenolic content, but when calculated in terms of phenolic compound harvest per unit area in a plant factory, R:Fr = 1.8 resulted in about 144% more than R:Fr = 1.0 (midG) for the same energy consumption. Considering both yield and secondary metabolites, this study recommends the R:Fr1.7_midG treatment group (R44G18B13FR25) as the optimal light recipe, as it considerably increases fresh weight, total phenolic content per unit area, PY, and EY.

5. Conclusions

In this study, hydroponic cilantro free of pesticides and agrochemicals was grown in a plant factory prototype, and the effects of combining red and far-red light with varying proportions of green light in a plant factory were investigated. Under day/night temperatures of 24/22 °C, a CO2 concentration of 600 µmol mol−1, and a BPFD of 200 µmol m−2 s−1, using the R:Fr1.7_midG light recipe (R53G05B13FR29) with a 16 h photoperiod over a 49-day cultivation period, cilantro achieved a shoot fresh weight of 60.8 g, vitamin C content of 1.27 mg g−1, and leaf total phenolic content of 72.13 mg GAE g−1 FW, along with improved EY and PY. This light recipe is, therefore, recommended as the optimal spectral treatment for hydroponic cilantro.

Author Contributions

Conceptualization, M.M.M.S., W.F., and H.-Y.C.; methodology, M.M.M.S.; software, M.M.M.S.; validation, Y.-K.T. and P.P.-C.C.; formal analysis, M.M.M.S.; investigation, M.M.M.S. resources, H.-Y.C.; data curation, Y.-K.T. and P.P.-C.C.; writing—original draft preparation, M.M.M.S. and Y.-K.T.; writing—review and editing, P.P.-C.C., W.F., and H.-Y.C.; visualization, M.M.M.S. and Y.-K.T.; supervision, H.-Y.C.; project administration, H.-Y.C.; funding acquisition, H.-Y.C. All authors have read and agreed to the published version of the manuscript.

Funding

This research received no external funding.

Data Availability Statement

The data supporting the findings of this study are available from the corresponding author upon reasonable request.

Conflicts of Interest

The authors declare that they have no competing interests.

Abbreviations

The following abbreviations are used in this manuscript:
DASDays after sowing
BPFDBiological photon flux density
LEDLight-emitting diode
GAEGallic acid equivalents
RGBFRRed, green, blue, and far-red
PFALPlant factory with artificial lighting
EYEnergy yield
PYPhoton yield

References

  1. Stutte, G.W. Controlled environment production of medicinal and aromatic plants. In Medicinal and Aromatic Crops: Production, Phytochemistry, and Utilization, 1st ed.; American Chemical Society: Richland, MS, USA, 2016; Volume 1218, pp. 49–63. [Google Scholar] [CrossRef]
  2. Anpo, M.; Fukuda, H.; Wada, T. Introduction: Artificial light-type plant factories—Outline and a vision for the future. In Plant Factory Using Artificial Light, 1st ed.; Anpo, M., Fukuda, H., Wada, T., Eds.; Elsevier: Amsterdam, The Netherlands, 2019; pp. xxiii–xxviii. [Google Scholar] [CrossRef]
  3. Anpo, M.; Fukuda, H.; Wada, T. Chapter 3.1 Optimization of growth environment and development of technology to control the concentration of functional components. In Plant Factory Using Artificial Light, 1st ed.; Anpo, M., Fukuda, H., Wada, T., Eds.; Elsevier: Amsterdam, The Netherlands, 2019; pp. 121–130. [Google Scholar] [CrossRef]
  4. Fukuda, N. Chapter 2.2—Plant growth and physiological responses to light conditions. In Plant Factory Using Artificial Light, 1st ed.; Anpo, M., Fukuda, H., Wada, T., Eds.; Elsevier: Amsterdam, The Netherlands, 2019; pp. 71–77. [Google Scholar] [CrossRef]
  5. Sena, S.; Kumari, S.; Kumar, V.; Husen, A. Light emitting diode (led) lights for the improvement of plant performance and production: A comprehensive review. Curr. Res. Biotechnol. 2024, 7, 100184. [Google Scholar] [CrossRef]
  6. Zhen, S.; van Iersel, M.W. Far-red light is needed for efficient photochemistry and photosynthesis. J. Plant Physiol. 2017, 209, 115–122. [Google Scholar] [CrossRef] [PubMed]
  7. Liu, J.; van Iersel, M.W. Photosynthetic physiology of blue, green, and red light: Light intensity effects and underlying mechanisms. Front. Plant Sci. 2021, 12, 619987. [Google Scholar] [CrossRef] [PubMed]
  8. Mottus, M.; Sulev, M.; Baret, F.; Lopez-Lozano, R.; Reinart, A. Photosynthetically active radiation: Measurement and modelling. In Encyclopedia of Sustainability Science and Technology, 1st ed.; Meyers, R.A., Ed.; Springer: New York, NY, USA, 2012; pp. 7902–7932. [Google Scholar] [CrossRef]
  9. Yu, L.; Bu, L.; Li, D.; Zhu, K.; Zhang, Y.; Wu, S.; Chang, L.; Ding, X.; Jiang, Y. Effects of far-red light and ultraviolet light-a on growth, photosynthesis, transcriptome, and metabolome of mint (Mentha haplocalyx briq.). Plants 2024, 13, 3495. [Google Scholar] [CrossRef] [PubMed]
  10. Franklin, K.A. Shade avoidance. New Phytol. 2008, 179, 930–944. [Google Scholar] [CrossRef] [PubMed]
  11. Wei, Y.H.; Huang, Q.C.; Wang, H.J.; Pan, H. Comparative analysis on pigment content of sun plants and shade plants. Hubei Agric. Sci. 2010, 49, 1126–1129. [Google Scholar]
  12. Kelly, N.; Runkle, E.S. End-of-production ultraviolet a and blue light similarly increase lettuce coloration and phytochemical concentrations. Hort. Sci. 2023, 58, 525–531. [Google Scholar] [CrossRef]
  13. Chung, H.Y.; Chang, M.Y.; Wu, C.C.; Fang, W. Quantitative evaluation of electric light recipes for red leaf lettuce cultivation in plant factories. Horttechnology 2018, 28, 755–763. [Google Scholar] [CrossRef]
  14. Babicki, S.; Arndt, D.; Marcu, A.; Liang, Y.; Grant, J.R.; Maciejewski, A.; Wishart, D.S. Heatmapper: Web-enabled heat mapping for all. Nucleic Acids Res. 2016, 44, W147–W153. [Google Scholar] [CrossRef] [PubMed]
  15. Wang, F.; Gao, Q.; Ji, G.; Wang, J.; Ding, Y.; Wang, S. Effects of light intensity and photoperiod on morphological development and photosynthetic characteristics of coriander. Horticulturae 2024, 10, 215. [Google Scholar] [CrossRef]
  16. Takano, M.; Inagaki, N.; Xie, X.; Kiyota, S.; Baba-Kasai, A.; Tanabata, T.; Shinomura, T. Phytochromes are the sole photoreceptors for perceiving red/far-red light in rice. Proc. Natl. Acad. Sci. USA 2009, 106, 14705–14710. [Google Scholar] [CrossRef] [PubMed]
  17. Nguyen, D.T.P.; Kitayama, M.; Lu, N.; Takagaki, M. Improving secondary metabolite accumulation, mineral content, and growth of coriander (Coriandrum sativum L.) by regulating light quality in a plant factory. J. Hortic. Sci. Biotechnol. 2019, 95, 356–363. [Google Scholar] [CrossRef]
  18. Akter, N.; Cammarisano, L.; Taylor, G.; Naznin, M.; Verdonk, J.; Ahamed, S. Impact of light spectral combinations on morphology, yield, and quality of indoor-grown cilantro. Front. Sustain. Food Syst. 2024, 8, 1499954. [Google Scholar] [CrossRef]
  19. Bae, J.; Park, S.; Oh, M. Supplemental irradiation with far-red light-emitting diodes improves growth and phenolic contents in Crepidiastrum denticulatum in a plant factory with artificial lighting. Hortic. Environ. Biotechnol. 2017, 58, 357–366. [Google Scholar] [CrossRef]
  20. Smith, H.L.; McAusland, L.; Murchie, E.H. Don’t ignore the green light: Exploring diverse roles in plant processes. J. Exp. Bot. 2017, 68, 2099–2110. [Google Scholar] [CrossRef] [PubMed]
  21. Somsong, P.; Weeplian, T.; Kiravittaya, S.; Tayjasanant, T. Effects of far-red and UV-A lighting on phytochemicals and antioxidant activity in late growth stage of coriander (Coriandrum sativum L.). Acta Hortic. 2025, 1423, 235–242. [Google Scholar] [CrossRef]
  22. Vogelmann, T.C.; Han, T. Measurement of gradients of absorbed light in spinach leaves from chlorophyll fluorescence profiles. Plant Cell Environ. 2000, 23, 1303–1311. [Google Scholar] [CrossRef]
Figure 1. Relative photon distribution in each light treatment: (a) R:Fr2.7_0G, (b) R:Fr2.8_lowG, (c) R:Fr2.5_midG, (d) R:Fr1.7_0G, (e) R:Fr1.8_lowG, (f) R:Fr1.7_midG, (g) R:Fr1_0G, (h) R:Fr1_lowG, and (i) R:Fr1_midG, where each letter denotes a specific wavelength range: R (red, 600–700 nm), G (green, 500–600 nm), B (blue, 400–500 nm), and Fr (far-red, 700–800 nm). Pie-charts were built with the average contribution of each wavelength range to the total light quality.
Agronomy 15 01363 g001
Figure 2. Morphology comparison of cilantro plants at 49 DAS under 9 different light treatments. White bar represents 10 cm width.
Agronomy 15 01363 g002
Figure 3. The surface response curves of the light treatments for the different cilantro growth characteristics and metabolites. (a) Effect of light quality on shoots dry weight. (b) Effect of light quality on roots dry weight. (c) Effect of light quality on nitrates concentration in stems, leaves, and roots (from top to bottom layers). (d) Effects of light quality on carotenoids concentration in shoots. (e) Effect of light quality on lutein concentration in shoots. (f) Effect of light quality on shoots vitamin C concentration. The x axis: the R:Fr proportion; the y axis: mean measurements of fresh weight, dry weight and metabolites; and the z axis: green light percentage.
Agronomy 15 01363 g003
Figure 4. Representation of the energy yield (EY) and photon yield (PY) of cilantro plant production under different light treatments.
Agronomy 15 01363 g004
Figure 5. Clustering heatmap with all the parameters measured in cilantro plants at 49 DAS under different light treatments.
Agronomy 15 01363 g005
Table 1. Light treatments for cilantro plants from 6 to 49 DAF.
TreatmentPercentage Contribution of Each Spectral to the Biological Photon Flux Density (BPFD = 200 µmol m−2 s−1)R:Fr y
Red
600–700 nm (%)
Green
500–600 nm (%)
Blue
400–500 nm (%)
Far-Red
700–800 nm (%)
R:Fr2.7_0G62 z015232.7
R:Fr2.8_lowG60514212.8
R:Fr2.5_midG501812202.5
R:Fr1.7_0G55014311.7
R:Fr1.8_lowG53513291.8
R:Fr1.7_midG441813251.7
R:Fr1_0G45011441
R:Fr1_lowG44410421
R:Fr1_midG371511371
z Values indicate the mean percentage of the light treatment in each treatment except for R:Fr, which is the ratio of red light percentage with the far-red light percentage. y Red to far-red proportion.
Table 2. Effects of different light treatment on fresh weight (FW) and dry weight (DW) of shoots and roots for cilantro 49 DAS.
TreatmentShoot FW (g)Shoot DW (g)Root FW (g)Root DW (g)
R:Fr2.7_0G33.2 ± 18.0 bc4.2 ± 1.8 abc12.9 ± 4.5 a1.6 ± 0.2 abcd
R:Fr2.8_lowG35.1 ± 17.4 b3.1 ± 1.7 bc12.8 ± 1.9 a1.5 ± 0.1 bcd
R:Fr2.5_midG37.6 ± 19.2 b4.2 ± 2.8 abc15.4 ± 4.5 a1.7 ± 0.3 abc
R:Fr1.7_0G62.3 ± 11.5 a5.5 ± 0.3 ab15.9 ± 3.2 b1.6 ± 0.1 abcd
R:Fr1.8_lowG66.4 ± 7.4 a6.9 ± 0.5 a24.4 ± 6.9 a2.1 ± 0.3 a
R:Fr1.7_midG60.8 ± 7.5 a7.0 ± 0.3 a18.1 ± 4.3 b1.9 ± 0.1 ab
R:Fr1_0G16.5 ± 5.0 c1.3 ± 0.0 c5.8 ± 1.1 e1.2 ± 0.0 d
R:Fr1_lowG33.1 ± 15.7 bc2.5 ± 0.2 cb8.8 ± 3.0 de1.3 ± 0.0 cd
R:Fr1_midG26.9 ± 10.1 bc2.6 ± 0.2 cb7.9 ± 1.4 e1.3 ± 0.0 cd
R:Fr************
Green light %NSNSNSNS
R:Fr × Green light %NSNSNSNS
Values are expressed as means ± standard deviation (n = 7 for shoots and roots fresh weight; n = 3 for shoots and roots dry weight; n = 4 for total chlorophyll). Different letters indicate significant differences among treatments (one-way ANOVA with Tukey’s post hoc test, p ≤ 0.05). For two-way ANOVA, NS denotes no significant difference, while *** represent significant differences at p ≤ 0.001.
Table 3. Effects of different light treatments on cilantro plants biochemical properties concentration including lutein, carotenoids, vitamin C, and total chlorophyll concentrations 49 DAS.
TreatmentLutein (mg/g)Carotenoids (mg/g)Vitamin C (mg/g)Total Chlorophyll (mg/g)
R:Fr2.7_0G0.34 ± 0.02 abc0.52 ± 0.04 ab1.50 ± 0.08 bc1.59 ± 0.10 a
R:Fr2.8_lowG0.32 ± 0.01 bcd0.47 ± 0.02 ab1.79 ± 0.06 ab1.45 ± 0.06 ab
R:Fr2.5_midG0.36 ± 0.02 abc0.55 ± 0.05 a1.51 ± 0.25 bc1.7 ± 0.17 a
R:Fr1.7_0G0.28 ± 0.07 cde0.39 ± 0.09 bcd0.86 ± 0.02 d1.04 ± 0.26 cd
R:Fr1.8_lowG0.22 ± 0.03 de0.32 ± 0.04 cd0.83 ± 0.047 d0.90 ± 0.13 cd
R:Fr1.7_midG0.20 ± 0.03 e0.28 ± 0.05 d1.27 ± 0.07 c0.75 ± 0.16 d
R:Fr1_0G0.44 ± 0.03 a0.51 ± 0.04 ab1.78 ± 0.08 ab1.24 ± 0.10 bc
R:Fr1_lowG0.43 ± 0.10 ab0.48 ± 0.09 ab1.74 ± 0.19 b1.17 ± 0.20 bc
R:Fr1_midG0.38 ± 0.05 abc0.44 ± 0.06 abc2.06 ± 0.18 a1.05 ± 0.18 cd
R:Fr************
Green light %NS****NS
R:Fr × Green light %NSNS****
Values are expressed as means ± standard deviation (n = 5 for carotenoids and lutein; n = 3 for vitamin C and phenolic compounds in leaves, roots, and stems). Different letters indicate significant differences among treatments (one-way ANOVA with Tukey’s post hoc test, p ≤ 0.05). For two-way ANOVA, NS denotes no significant difference, while *, and *** represent significant differences at p ≤ 0.05, and p ≤ 0.001, respectively.
Table 4. Effect of different light treatment on nitrates concentration and total phenolics concentration in leaves, stem, and roots of cilantro at 49 DAS.
TreatmentNitrates Concentration (mg/kg)Phenolics Concentration (mg GAE z/g FW)
LeavesStemRootsLeavesStemRoots
R:Fr2.7_0G3840 ± 403 b8040 ± 610 b4280 ± 216 c60.38 ± 9.73 bc13.50 ± 2.56 abc6.94 ± 1.85 abc
R:Fr2.8_lowG4700 ± 0 b7600 ± 391 b4280 ± 383 c52.48 ± 9.89 c13.32 ± 0.99 abc8.07 ± 1.67 ab
R:Fr2.5_midG3025 ± 95 b6366 ± 57 b4360 ± 194 c66.56 ± 15.89 bc17.50 ± 3.63 abc6.10 ± 1.01 abc
R:Fr1.7_0G11600 ± 1019 a16300 ± 503 a12880 ± 1584 a66.55 ± 4.52 bc14.35 ± 5.19 abc0.16 ± 0.05 c
R:Fr1.8_lowG10200 ± 516 a13500 ± 382 a11920 ± 1035 a59.24 ± 7.64 bc10.24 ± 1.59 bc4.56 ± 1.53 bc
R:Fr1.7_midG12000 ± 1939 a14880 ± 521 a9520 ± 715 b72.13 ± 14.40 bc19.14 ± 7.14 ab10.76 ± 2.45 ab
R:Fr1_0G3028 ± 961 b9040 ± 723 b3616 ± 1037 cd80.08 ± 8.78 ab20.36 ± 1.91 a12.68 ± 6.39 a
R:Fr1_lowG3520 ± 851 b7900 ± 1205 b2090 ± 377 d99.07 ± 22.67 a11.4 ± 2.76 bc8.37 ± 2.02 ab
R:Fr1_midG2708 ± 1526 b6900 ± 3940 b2008 ± 857 d70.20 ± 5.78 bc14.05 ± 5.42 abc12.93 ± 0.70 a
R:Fr************NS***
Green light %NS****NS***
R:Fr × Green light %*NS********
Values are expressed as means ± standard deviation (n = 3 for nitrates in leaves, roots, and stems). Different letters indicate significant differences among treatments (one-way ANOVA with Tukey’s post hoc test, p ≤ 0.05). For two way ANOVA, NS denotes no significant difference, while *, **, and *** represent significant differences at p ≤ 0.05, p ≤ 0.01, and p ≤ 0.001, respectively. z Gallic acid equivalents.
Table 5. Effect of different light treatment on total nitrates (g) and phenolics content (g GAE) per unit of area (square meter m2).
TreatmentTotal Nitrates Yield (g/m2)Total Phenolics Yield (g GAE z/m2)
ShootsRootsShootsRoots
R:Fr2.7_0G3.18 ± 1.72 b0.74 ± 0.26 c19.48 ± 10.55 cde1.42 ± 0.50 bcd
R:Fr2.8_lowG3.03 ± 1.67 bc0.73 ± 0.11 cd18.3 ± 9.08 de1.64 ± 0.25 b
R:Fr2.5_midG3.60 ± 1.84 b0.89 ± 0.26 bc25.05 ± 12.80 cd1.49± 0.44 bcd
R:Fr1.7_0G5.96 ± 1.11 a0.91 ± 0.18 bc39.93 ± 7.42 ab0.04 ± 0.01 e
R:Fr1.8_lowG6.35 ± 0.71 a1.40 ± 0.40 a36.55 ± 4.08 ab1.76 ± 0.50 b
R:Fr1.7_midG5.82 ± 0.72 a1.04 ± 0.25 b43.99 ± 5.45 a3.00 ± 0.74 a
R:Fr1_0G1.59 ± 0.48 c0.34 ± 0.06 e13.20 ± 3.99 e1.17 ± 0.23 cd
R:Fr1_lowG3.17 ± 1.50 b0.51 ± 0.18 de28.99 ± 13.74 bc1.17 ± 0.41 cd
R:Fr1_midG2.43 ± 0.97 bc0.46 ± 0.09 e17.96 ± 6.74 de1.63 ± 0.31 bc
Nitrate content and total phenolics per square meter was estimated by multiplying the average nitrate concentration (mg/kg fresh weight) and average total phenolics concentration (mg GAE/g of fresh weight) of combined leaf and stem tissues by the average plant fresh weight (g), the planting density (15.84 plants/m²), and dividing by 1000 to express the result in g/m². Values are expressed as means ± standard deviation (n = 7). Different letters indicate significant differences among treatments (one-way ANOVA with Tukey’s post hoc test, p ≤ 0.05). z Gallic acid equivalents.
Disclaimer/Publisher’s Note: The statements, opinions and data contained in all publications are solely those of the individual author(s) and contributor(s) and not of MDPI and/or the editor(s). MDPI and/or the editor(s) disclaim responsibility for any injury to people or property resulting from any ideas, methods, instructions or products referred to in the content.

