1. Introduction
Leaves are crucial organs for plant photosynthesis (Schneider et al., 2024) [
1]. Mutations affecting leaf colour can significantly impact photosynthetic efficiency, directly influencing crop growth and development and ultimately leading to reduced yields (van Rooijen et al., 2017) [
2]. Chlorophyll deficiency is a primary factor contributing to leaf colour variation and can result in light green, albino, zebra-striped, spotted, or yellow-green leaves (Gao et al., 2016) [
3]. Leaf colour variation has been widely observed in crops. Plants with different leaf colours serve as valuable tools for studying the molecular mechanisms underlying leaf colour variation, as different pigment types and concentrations produce distinct leaf colours.
Leaf colour mutations can occur naturally or be induced artificially and are highly recognisable, making them useful as markers to assess the purity of hybrid seeds (van Rooijen et al., 2017) [
2]. The discovery and functional characterisation of these mutations are essential for understanding chlorophyll synthesis and degradation, chloroplast structure and function, the genetic regulation of chloroplast development, and the mechanisms of photosynthesis. To date, significant progress has been made in elucidating the molecular mechanisms of leaf colour variation, including the identification and functional analysis of genes involved in chloroplast development, carotenoid metabolism, and haem biosynthesis pathways (Zuo et al., 2019) [
4]. In higher plants, more than 700 genes are involved in leaf colour formation and metabolic processes. The ultrastructure of mature chloroplasts is highly complex, featuring a double-membrane envelope and an internal matrix with thylakoids. Mutations in chloroplast-related genes can disrupt chloroplast development, leading to leaf colour variations. For example, mutations in genes encoding pentatricopeptide repeat (PPR) proteins, such as WSL5, ASL3,
OsPPR4, and OsPPR6, result in leaf bleaching and lethality (Lan et al., 2023; Lin et al., 2015; Tang et al., 2017) [
5,
6,
7]. Similarly, mutations in the
ZN gene, which encodes a thylakoid-binding protein, produce a zebra-striped leaf phenotype (Li et al., 2010) [
8], whereas mutations in genes encoding the chloroplast proteins SRP43 and SRP54 lead to a light green leaf phenotype (Lv et al., 2015) [
9]. In this study, we identified a maize mutant,
zmpgl, that presented a light green leaf phenotype at the seedling stage. We characterised its agronomic traits, leaf ultrastructure, photosynthetic properties, and pigment content, providing a valuable resource for further research into the mechanisms of leaf colour variation in maize.
Chlorophyll biosynthesis in photosynthetic organisms occurs via the tetrapyrrole pathway. Within chloroplasts, the precursor 5-aminolevulinic acid (ALA) branches into protoporphyrin IX (PPIX), which serves as a precursor for both chlorophyll and haem. Bilin pigments, such as biliverdin (BV) and phycocyanobilin (PCB), are haem derivatives that function in light perception and capture as photoreceptor chromophores (Zhang et al., 2021) [
10]. Photosynthesis and respiration provide the carbon skeletons and energy required for amino acid synthesis. Research has demonstrated that nitrogen (N) is transported in plants primarily in the form of amino acids and that disruption of amino acid transport from source leaves to seeds impairs nitrogen and carbon (C) assimilation, as well as seed development. For example, in
Arabidopsis thaliana, knockout of amino acid permease 2 (AAP2) reduces nitrogen allocation to seeds, decreasing seed protein content while increasing amino acid accumulation in leaves, thereby increasing photosynthetic activity and sucrose translocation (Perchlik and Tegeder, 2018) [
11]. Photorespiration, a process concomitant with photosynthesis, refers to the light-dependent consumption of oxygen and organic substrates and simultaneous CO
2 release by oxygenic phototrophs. Both CO
2 and NH₃ released during photorespiration can be reassimilated and recycled by plants (Zhang et al., 2016) [
10]. Fixed carbon in plants is utilised by chloroplasts for fatty acid (FA) biosynthesis to produce membrane lipids or is stored as triacylglycerol (TAG). The chloroplast-associated protein degradation (CHLORAD) system regulates chloroplast protein import via the ubiquitin-proteasome pathway, influencing chloroplast proteostasis and mediating plant development and stress responses. The CHLORAD system coordinates chloroplast and cytosolic ubiquitin-proteasome activities to optimise photosystem efficiency and other critical chloroplast functions, including lipid metabolism (Yu et al., 2018) [
12]. Furthermore, leaf colouration is closely associated with phytohormone levels. Mutations affecting the biosynthesis of hormones, particularly abscisic acid (ABA), can alter leaf pigmentation and impair growth and development in mutants (Agrawal et al., 2001) [
13]. Abnormal chloroplast development can also impair the activity of key enzymes in the ABA biosynthesis pathway, reducing ABA levels in leaf colour mutants Fambrini et al., 2004) [
14].
Maize (Zea mays L.) is one of the most important cereal crops worldwide, extensively cultivated for its high yield potential, and serves as a vital source of industrial raw materials and animal feed. Photosynthesis constitutes the physiological foundation for crop yield formation. Elucidating the molecular mechanisms regulating photosynthesis in maize is crucial for optimising photosynthetic efficiency and enhancing yield. Although numerous leaf colour mutants have been identified in maize, the genetic determinants underlying most of these phenotypic traits remain undiscovered. The mechanistic pathways governing leaf colour development in mutant materials have not yet been comprehensively characterised or thoroughly investigated. In this study, we employed a maize pale-green leaf mutant as experimental material. Through integrated transcriptomic and metabolomic analyses, we systematically identified differentially expressed genes and differentially accumulated metabolites that are critical for essential physiological processes, including tetrapyrrole synthesis, lipid metabolism (associated with leaf photosynthesis), amino acid metabolism (related to chlorophyll biosynthesis and light response), and abscisic acid (ABA) biosynthesis, all of which play pivotal roles in plant photosynthesis, respiration, and catalytic functions. The enrichment analysis of these differentially expressed genes provides a fundamental framework for the comprehensive functional characterisation of the zmpgl mutant gene. Investigations into key genes and metabolites involved in photosynthetic pathways contribute to a deeper understanding of the molecular basis underlying leaf colour variation in maize and its impact on photosynthetic performance. This research holds significant implications for improving maize photosynthetic productivity, facilitating genetic improvement, and exploring the mechanistic and regulatory networks governing photosynthesis in maize.
2. Materials and Methods
Plant material: Initially, researchers in our laboratory constructed a maize B73 inbred line mutant library by using the EMS mutagenesis method (M.G. Neuffer et al., 1978) [
15]. We conducted relevant research on a light green leaf mutant. The experiment was carried out in the experimental field of the Liaoning Academy of Agricultural Sciences, Shenyang (41.8° N, 123.4° E), China.
Phenotypic assay of seedlings: Uniform and plump maize seeds were placed in Petri dishes lined with filter paper and germinated at approximately 30 °C (in darkness) for 12–24 h. Phenotypes were photographed and recorded after 4 weeks of cultivation in pots. Ten plants each of B73 and zmpgl were randomly selected, and the shoot lengths of the plants were measured.
Methods for determining chlorophyll and carotenoid contents: The chlorophyll and carotenoid contents were determined by ethanol extraction. Approximately 0.1 g of leaves was removed and weighed into 2 mL centrifuge tubes, and 2 mL of anhydrous ethanol was added to each tube and extracted for 12 h under dark conditions at 4 °C. The light absorption values of the chlorophyll extracts at 645 nm, 663 nm, and 470 nm were determined using an ultraviolet spectrophotometer. Chlorophyll content: Chlorophyll a = (12.72A663 − 2.59A645) × v/w × 1000 Chlorophyll b = (22.88A645 − 4.67A663) × v/w × 1000 Total chlorophyll content = (20.29A645 + 8.05A663) × v/w × 1000. Carotenoid = (1000A470 − 2.05 chlorophyll A − 114.8 chlorophyll B)/245; as a repetition, the measurement was repeated three times.
Measurement of photosynthetic parameters and light energy utilisation: The photosynthetic rate and transpiration rate were measured with an LI-6400 portable photosynthetic apparatus from 9:00 to 11:00 in clear and wind-free weather, and the opposite photosynthetic rate of two leaves at the seedling stage was determined. Three plants were used for each treatment. A custom 6400–07 transparent leaf chamber (with a thickness of 1 cm and a specially designed groove strip) was used, and both ends of the plant were pressed into the groove strip during measurement. The light intensity was 1000 μmol·m−2·s−1, the temperature was 30 °C, the relative humidity was 39%, the concentration of CO2 was 390 mg·L−1, and the air flow rate was 300 mol·s−1. All photosynthetic parameters, including the net photosynthetic rate (Pn), transpiration rate (Tr), stomatal conductance (Gs), and intercellular CO2 concentration (Ci), were determined automatically by the instrument. The water use efficiency (WUE) during photosynthesis was calculated as Pn/Tr.
Transmission electron microscopy: The leaves of wild-type B73 and the zmpgl mutant were sampled and stored in an electron microscope fixation solution. After vacuuming, an HT7800 (Hitachi TEM system, Hitachi, Tokyo, Japan) was used for transmission electron microscope observation. The parameters were set to 15,000 times, the high contrast mode, and the accelerated voltage was 80 kV. First, fresh tissue parts were collected, and sampling was completed within 1–3 min; the sample size was 1 mm. The cut small tissue blocks were placed into an EP tube with an electron microscope fixative and placed at room temperature for 2 h. The samples were rinsed with 0.1 M phosphate-buffered saline (PB) (pH 7.4) for 15 min each. The mixture was fixed with 1% osmic acid at room temperature for 7 h in the dark. The samples were rinsed with 0.1 M phosphate-buffered saline (PB) (pH 7.4) for 15 min each. A graded series of alcohol solutions was used to dehydrate the tissue dehydration, and the samples were immersed in each solution for 1 h. Permeabilisation with acetone and 812 embedding agent at a ratio of 3:1 was carried out for 2–4 h at 37 °C. Afterwards, the pure 812 embedding agent and the sample was put into the embedding plate and were incubated at 37 °C overnight. The embedding plate was placed in an oven at 60 °C for 48 h. The resin block was cut with an ultrathin microtome, and ultrathin sections of 60–80 nm thickness were obtained. The copper mesh was stained with 2% uranium acetate saturated alcohol solution and shielded from light for 8 min. The samples were washed 3 times with 70% alcohol and then washed 3 times with ultrapure water. Carbon dioxide-resistant staining was performed for 8 min with 2.6% lead citrate solution. The samples were rinsed 3 times with ultrapure water and blotted with filter paper. The copper mesh slices were stored in a copper mesh box and dried overnight at room temperature. A transmission electron microscope was used to observe and collect images for analysis.
RNA extraction and transcriptome sequencing: This study utilised wild-type B73 c(W-1, W-2, W-3) and the maize pale-green leaf mutant
zmpgl (Q-1, Q-2, Q-3) as samples, with three biological replicates per group. Total RNA was extracted from seedling-stage leaves using TRIzol Reagent (Life Technologies, Carlsbad, CA, USA). RNA degradation and contamination were assessed on 1% agarose gels, and RNA quality was verified using a Nanodrop 1000 spectrophotometer (Nanodrop, Wilmington, DE, USA). The RNA integrity number (RIN) and concentration were measured using an Agilent 2100 Bioanalyzer (Agilent Technologies, Inc., Santa Clara, CA, USA). After library quality control, different libraries were pooled according to the target data volume and sequenced on the Illumina platform. Raw sequencing data were processed using fastp V0.23.4 software to obtain high-quality Clean Reads (Chen et al., 2018) [
16]. Fastp is an ultra-fast all-in-one FASTQ preprocessor. The Clean Reads were aligned to the maize reference genome (
https://download.maizegdb.org/, accessed on 27 April 2025) using HISAT2 2.2.1 software to acquire mapping information on the reference genome. Differential expression analysis between sample groups was performed using DESeq2, which yielded a set of differentially expressed genes (DEGs) under two biological conditions. After the differential gene analysis, the Benjamini-Hochberg method was applied to adjust the
p values via multiple hypothesis testing correction, generating the false discovery rate (FDR). DEGs were screened with the thresholds |log2Fold Change| ≥ 1 and FDR < 0.05. Gene Ontology (GO) enrichment analysis was conducted using TopGO, Fisher’s exact test was performed, and the negative log10-transformed
p values were visualised via a pheatmap. Kyoto Encyclopedia of Genes and Genomes (KEGG,
https://www.genome.jp/kegg, accessed on 27 April 2025) pathway enrichment analysis was performed on the DEGs to further elucidate gene functions. KEGG integrates genomic information with higher-order functional data, providing a systematic approach for analysing large-scale datasets generated by high-throughput technologies such as genome sequencing.
Metabolomics of the wild-type and mutant strains: To investigate the physiological status and alterations in organisms, we analysed metabolic changes in the mutants. Four-week-old B73 and
zmpgl plants were selected for the experiments, with three biological replicates performed. Each sample (1.5 mL) was freeze-dried six times, and 50 mg of the lyophilised powder was dissolved in 1.2 mL of 70% methanol, followed by vortexing for 30 s every 30 min. In this study, multivariate statistical analysis, variable importance in projection (VIP), and fold change (FC) analysis were conducted for differentially abundant metabolite assessment. Differentially abundant metabolites were identified using the following criteria: VIP ≥ 1 and |Log2FC| ≥ 1. The metabolites were analysed using the KEGG database (
http://www.kegg.jp/kegg/compound/, accessed on 27 April 2025). Enrichment analysis was performed on the significantly enriched metabolic pathways, and their significance was determined by hypergeometric testing (
p ≤ 0.05).
Data processing and analysis of experimental: Experimental data processing and analysis were performed via Excel 2021 and GraphPad Prism 5.0.
3. Results
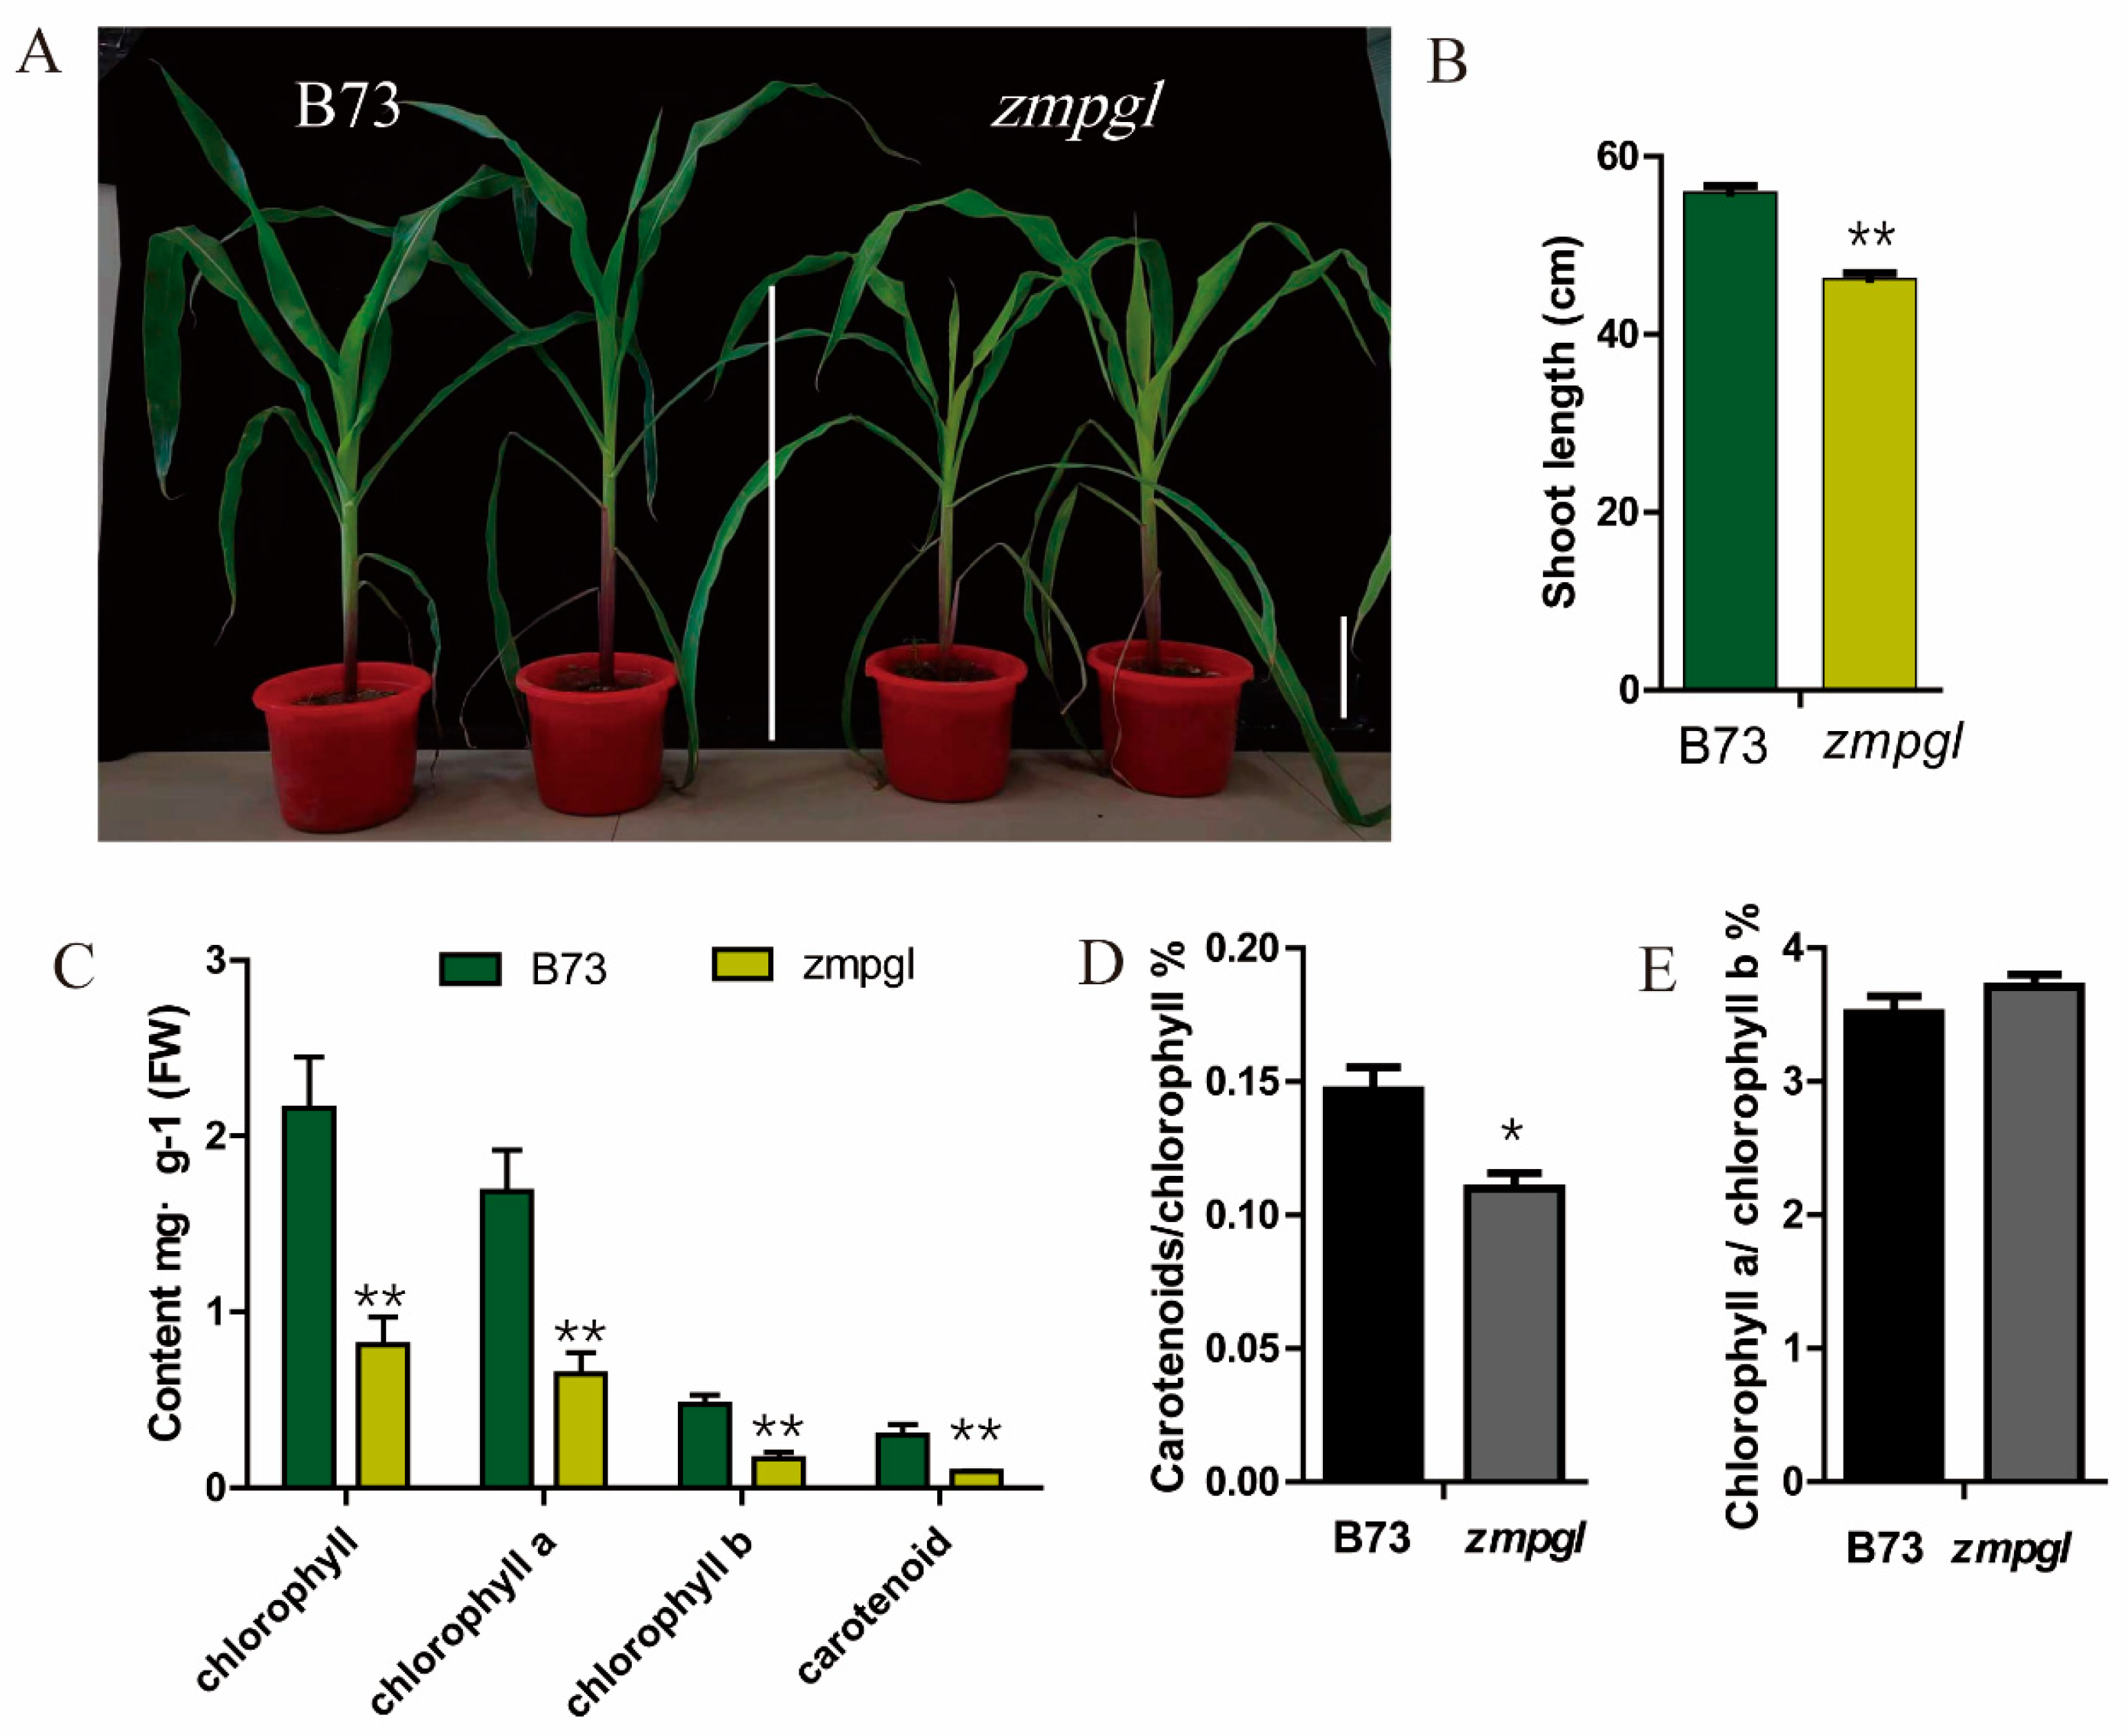
Phenotype and physiological parameters of the maize mutant: A maize mutant with light green leaves at the seedling stage was screened in the laboratory through EMS mutagenesis (
Figure 1A). After several generations of breeding, the mutant traits remained consistent. Statistical analysis of plant height at the seedling stage revealed that the height of the
zmpgl mutant was significantly lower than that of B73 (
Figure 1B). The main pigment contents of the leaves at the seedling stage were measured. Compared with those of the wild type, the total chlorophyll content, chlorophyll a content, chlorophyll b content, and carotenoid content of the
zmpgl mutant decreased significantly (
p < 0.01) (
Figure 1C). Compared with those of the wild type, the content of chlorophyll a decreased by 61.53%, the content of chlorophyll b decreased by 63.83%, and the content of carotenoids decreased by 70%. The chlorophyll a/chlorophyll b ratio was greater than that of the wild type, and the carotenoid/chlorophyll ratio was lower than that of the wild type (
Figure 1D). Compared with those of the wild type, the net photosynthetic rate (net photosynthetic rate, Pn) of the
zmpgl mutant decreased by 33.79%, the intercellular CO
2 concentration (intercellular CO
2 concentration, Ci) decreased by 27.51%, the stomatal conductance (Gs) decreased by 21.05%, and the transpiration rate (Tr) decreased by 28.54%, all of which were significantly lower than those of the wild type (
p < 0.01) (
Table 1). The decrease in the net photosynthetic rate indicated that the photosynthetic capacity was decreased and that the accumulation of photosynthetic products was reduced. A decrease in stomatal conductance is unfavourable for gas exchange and suppresses photosynthesis. A lower transpiration rate affects water vapour exchange. The decrease in the intercellular CO
2 concentration indicates a decrease in CO
2 utilisation efficiency and the inhibition of photosynthesis in this mutant.
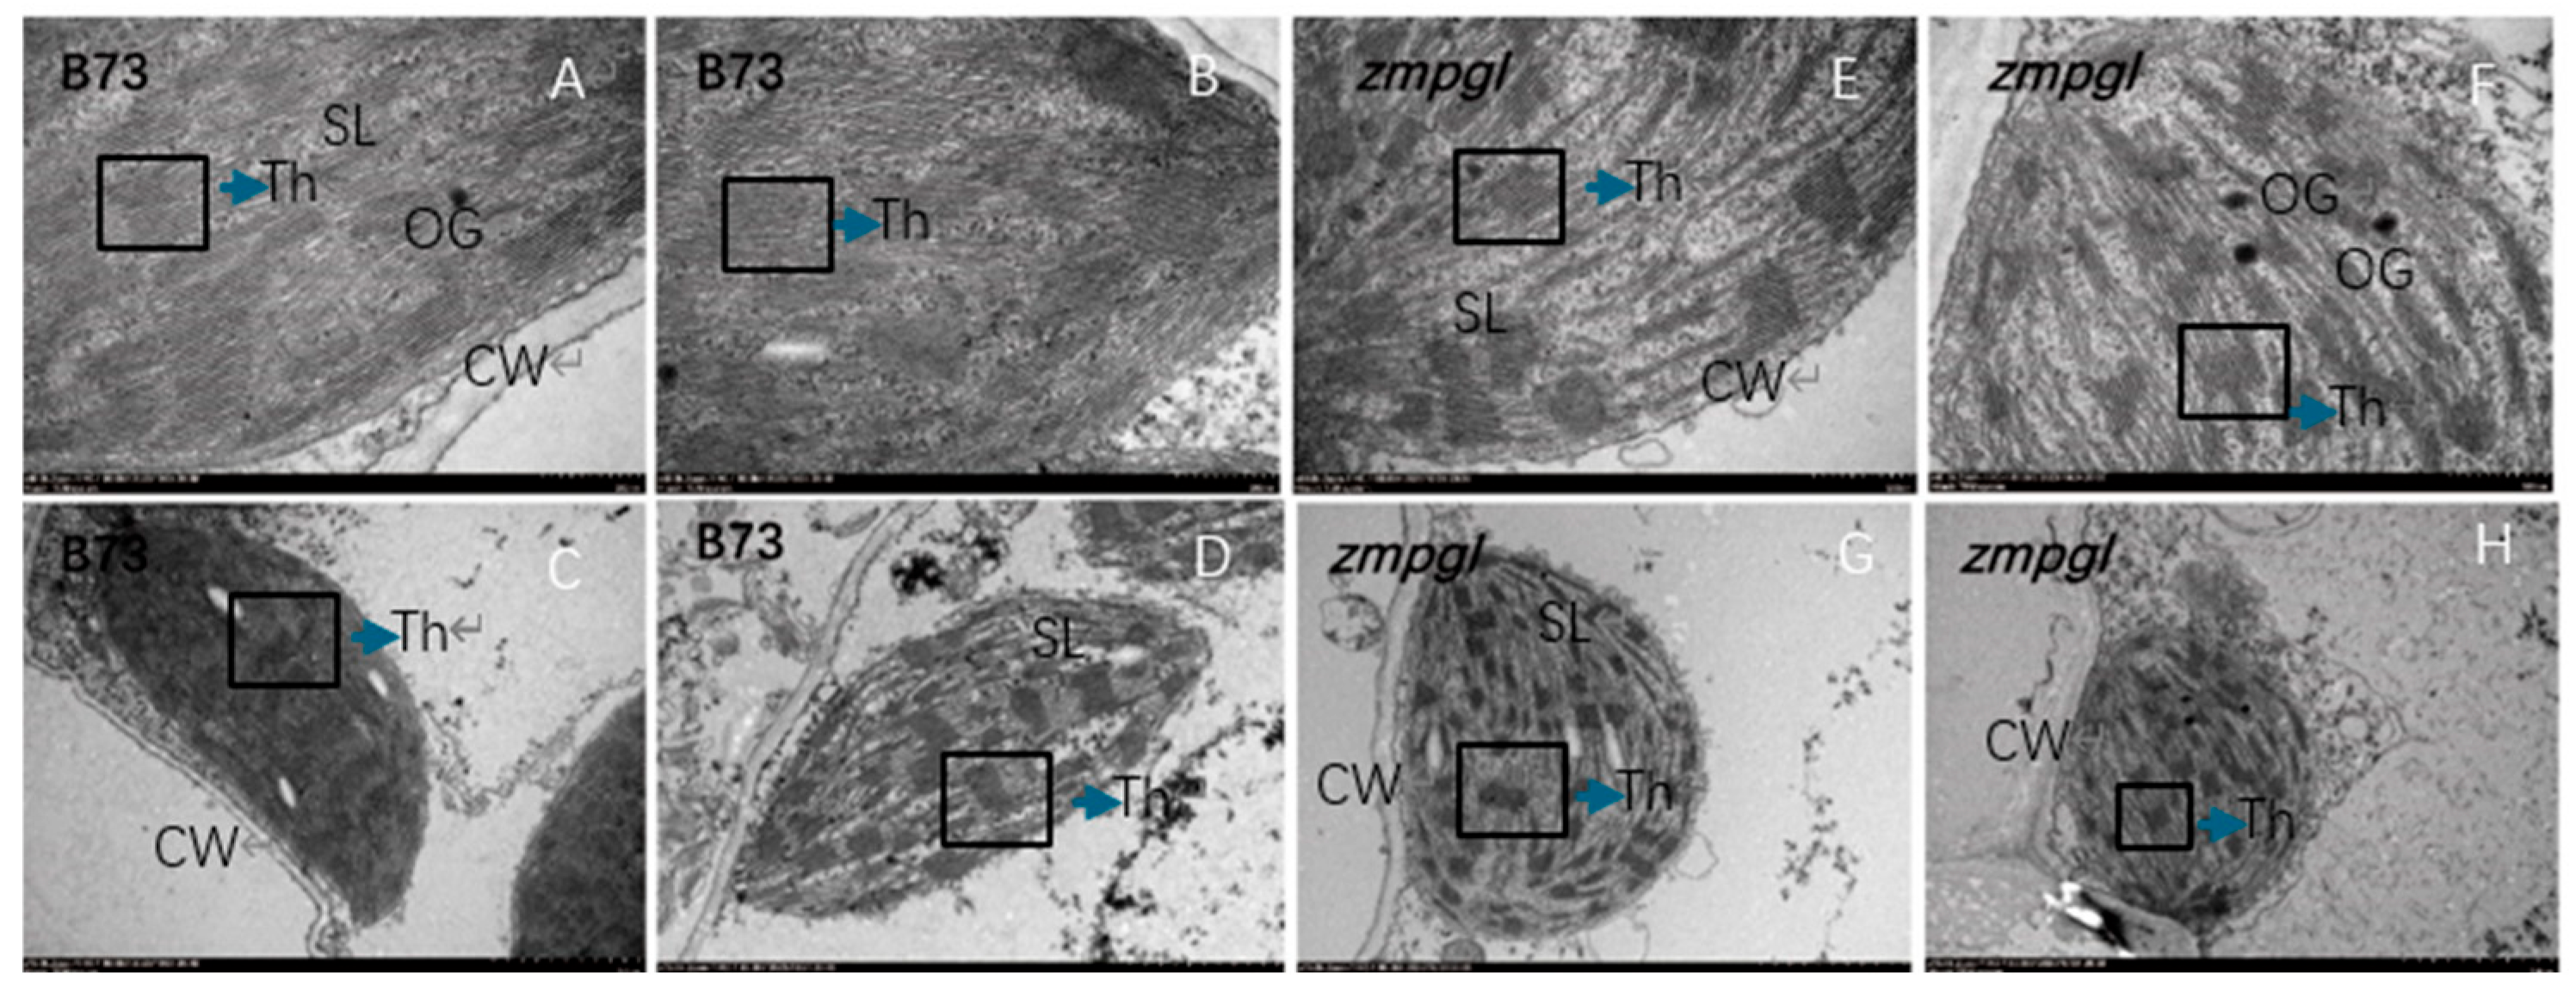
Ultrastructural analysis of zmpgl: Transmission electron microscopy was used to examine the morphological changes in chloroplasts between the leaves of the mutant
zmpgl and the wild-type B73. In wild-type B73 mesophyll cells, chloroplasts exhibited normal development, displayed an elongated spindle shape, and were positioned adjacent to the cell wall. In contrast, the
zmpgl mutant presented a reduced ratio of long-axis to short-axis length, altered chloroplast morphology, and swollen chloroplasts with a more spherical appearance. Compared with the wild type, the
zmpgl mutant presented an increased number of osmiophilic plastoglobuli in chloroplasts. Transmission electron microscopy revealed that the thylakoid membrane system in
zmpgl chloroplasts displayed a high degree of differentiation and a well-ordered arrangement but presented significantly fewer stacked granum lamellae than in the wild-type plant (
Figure 2). These results suggest that the abnormal chloroplast morphology in the mutant is associated with altered grain arrangement. Collectively, these findings demonstrate that this mutation affects chloroplast development.
Transcriptome quality control analysis: This study utilised wild-type B73 (W-1, W-2, W-3) and the maize pale-green leaf mutant
zmpgl (Q-1, Q-2, Q-3) as samples, with three biological replicates per group, to construct cDNA libraries. The data of RNA integrity number (RIN) and concentration were determined (
Table 2). After quality control of the raw sequencing data, a total of 69.15 Gb of clean data were obtained, with each sample yielding at least 7 Gb of clean data and Q30 base percentages all exceeding 93%. The clean reads from each sample were aligned to the maize reference genome, with a mapping efficiency ranging from 95.91 to 96.20%. Over 86.75% of the reads uniquely matched the reference genome, while the proportion of multimapped reads was less than 9.42%, indicating significantly greater specificity of uniquely mapped reads than multimapped reads. The Pearson correlation coefficient (r) was used to evaluate the reproducibility among biological replicates. A value of |r| closer to 1 indicates a stronger correlation between two replicate samples. In this study, the r
2 values between any two samples were greater than 0.97 (
Figure 3A). These results demonstrate that the transcriptome sequencing data in this study exhibit high quality and excellent sample reproducibility (
Figure 3B).
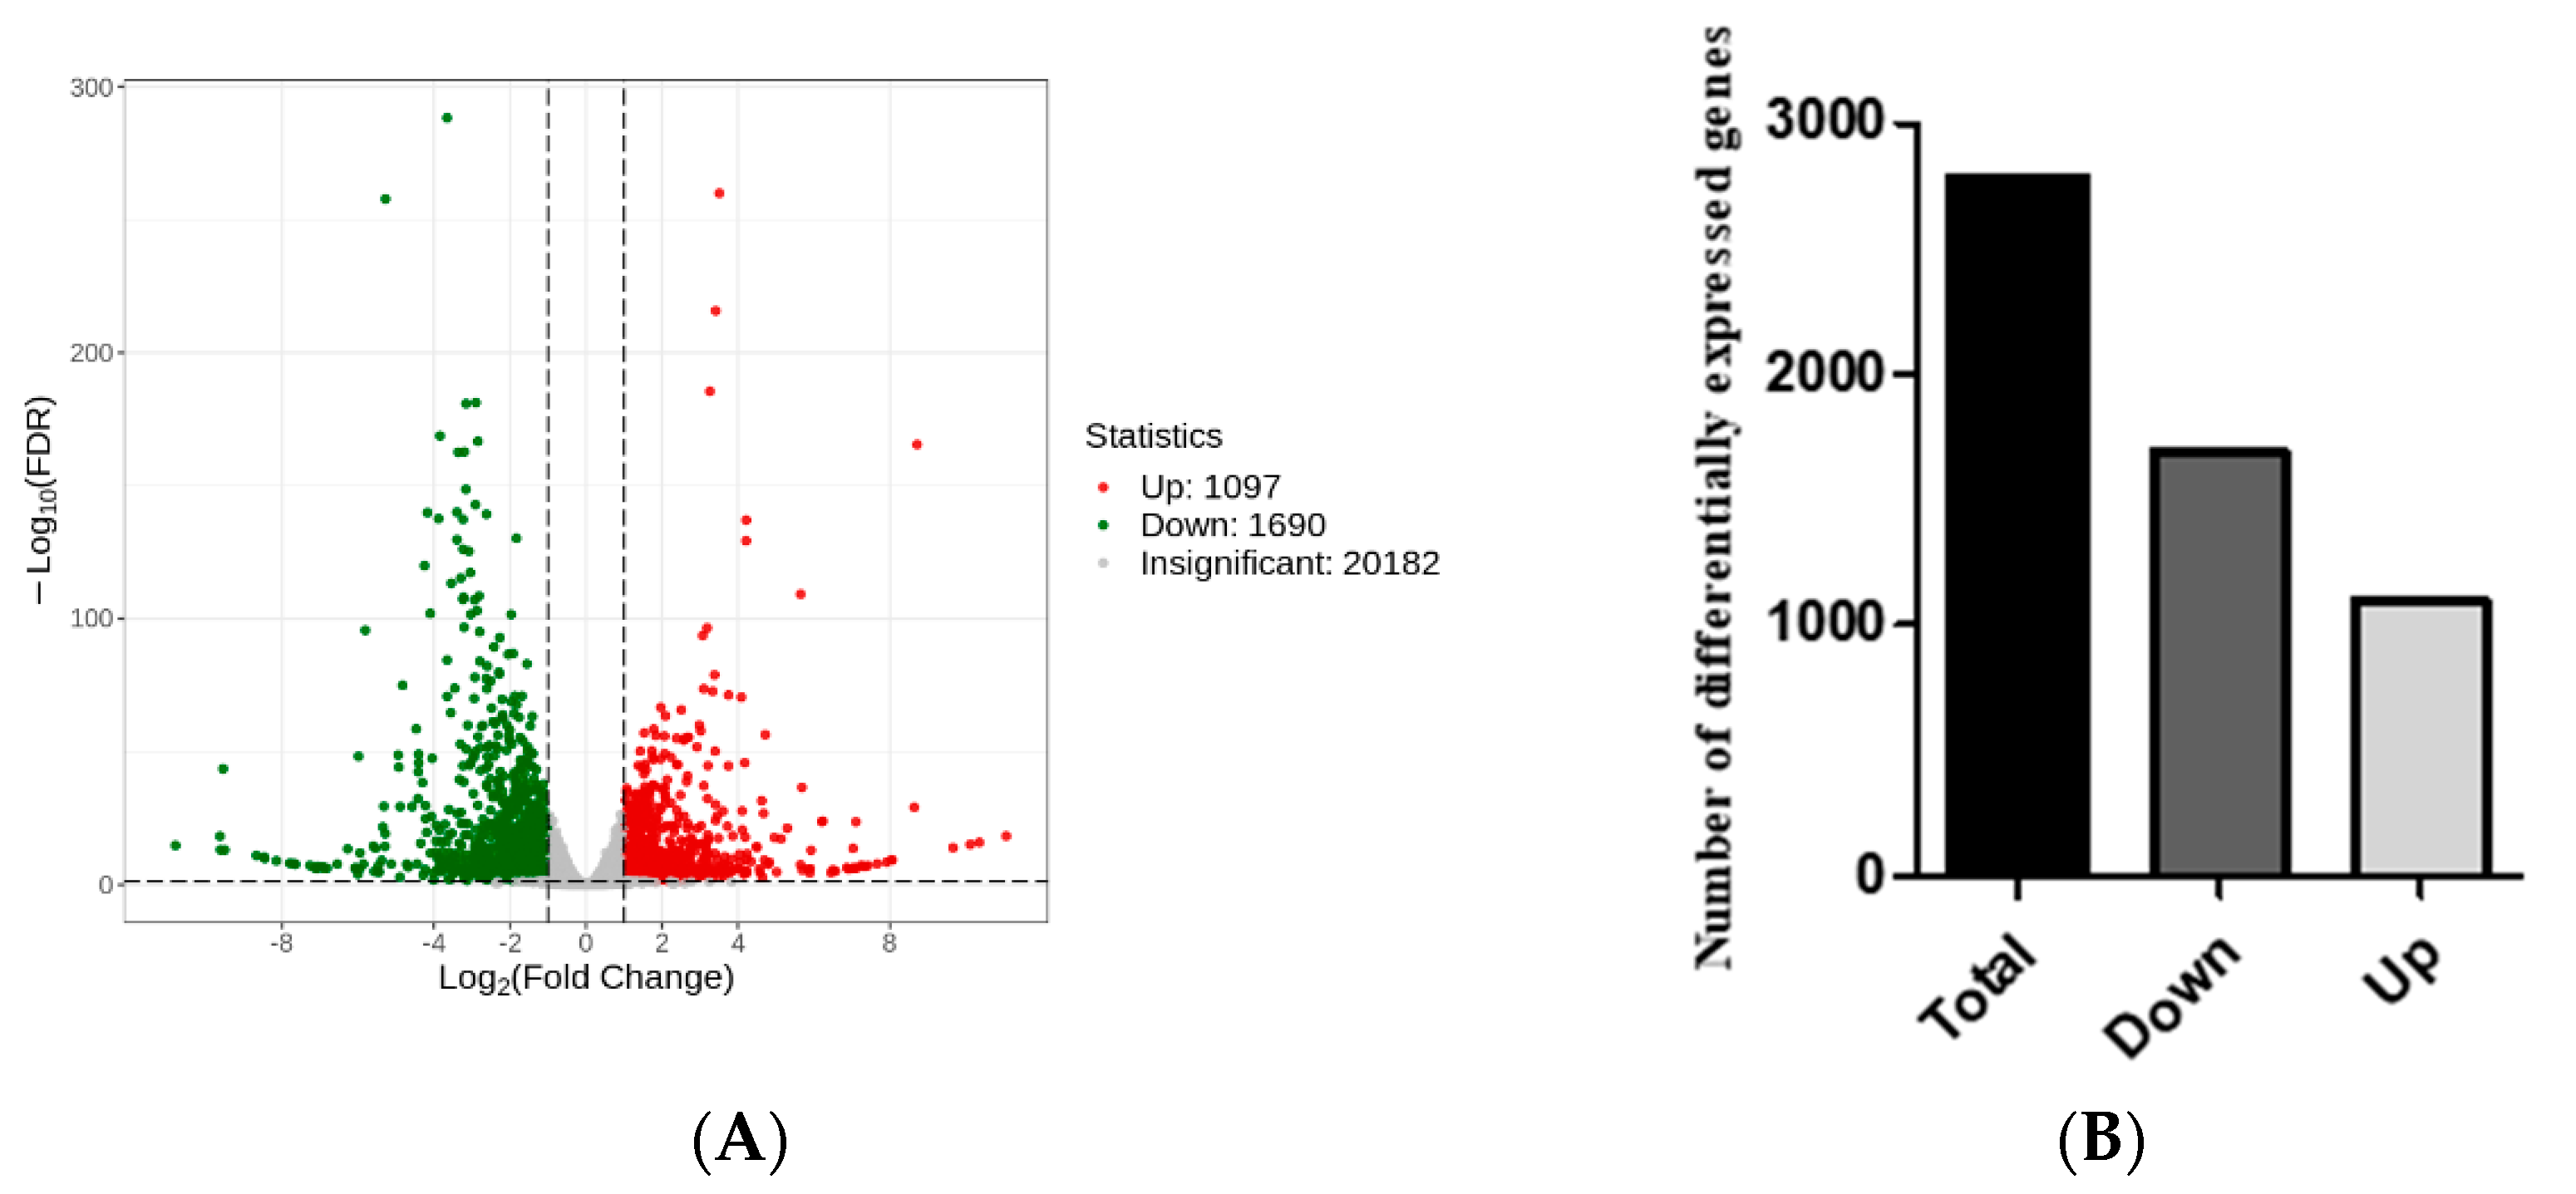
Statistical analysis of the DEGs: DEGs were screened between mutant
zmpgl leaves and wild-type B73 leaves (Qian vs. WT) (
Figure 4A). A total of 2787 DEGs were identified, of which 1097 genes were upregulated and 1690 genes were downregulated, indicating that the DEGs were mainly downregulated (
Figure 4B).
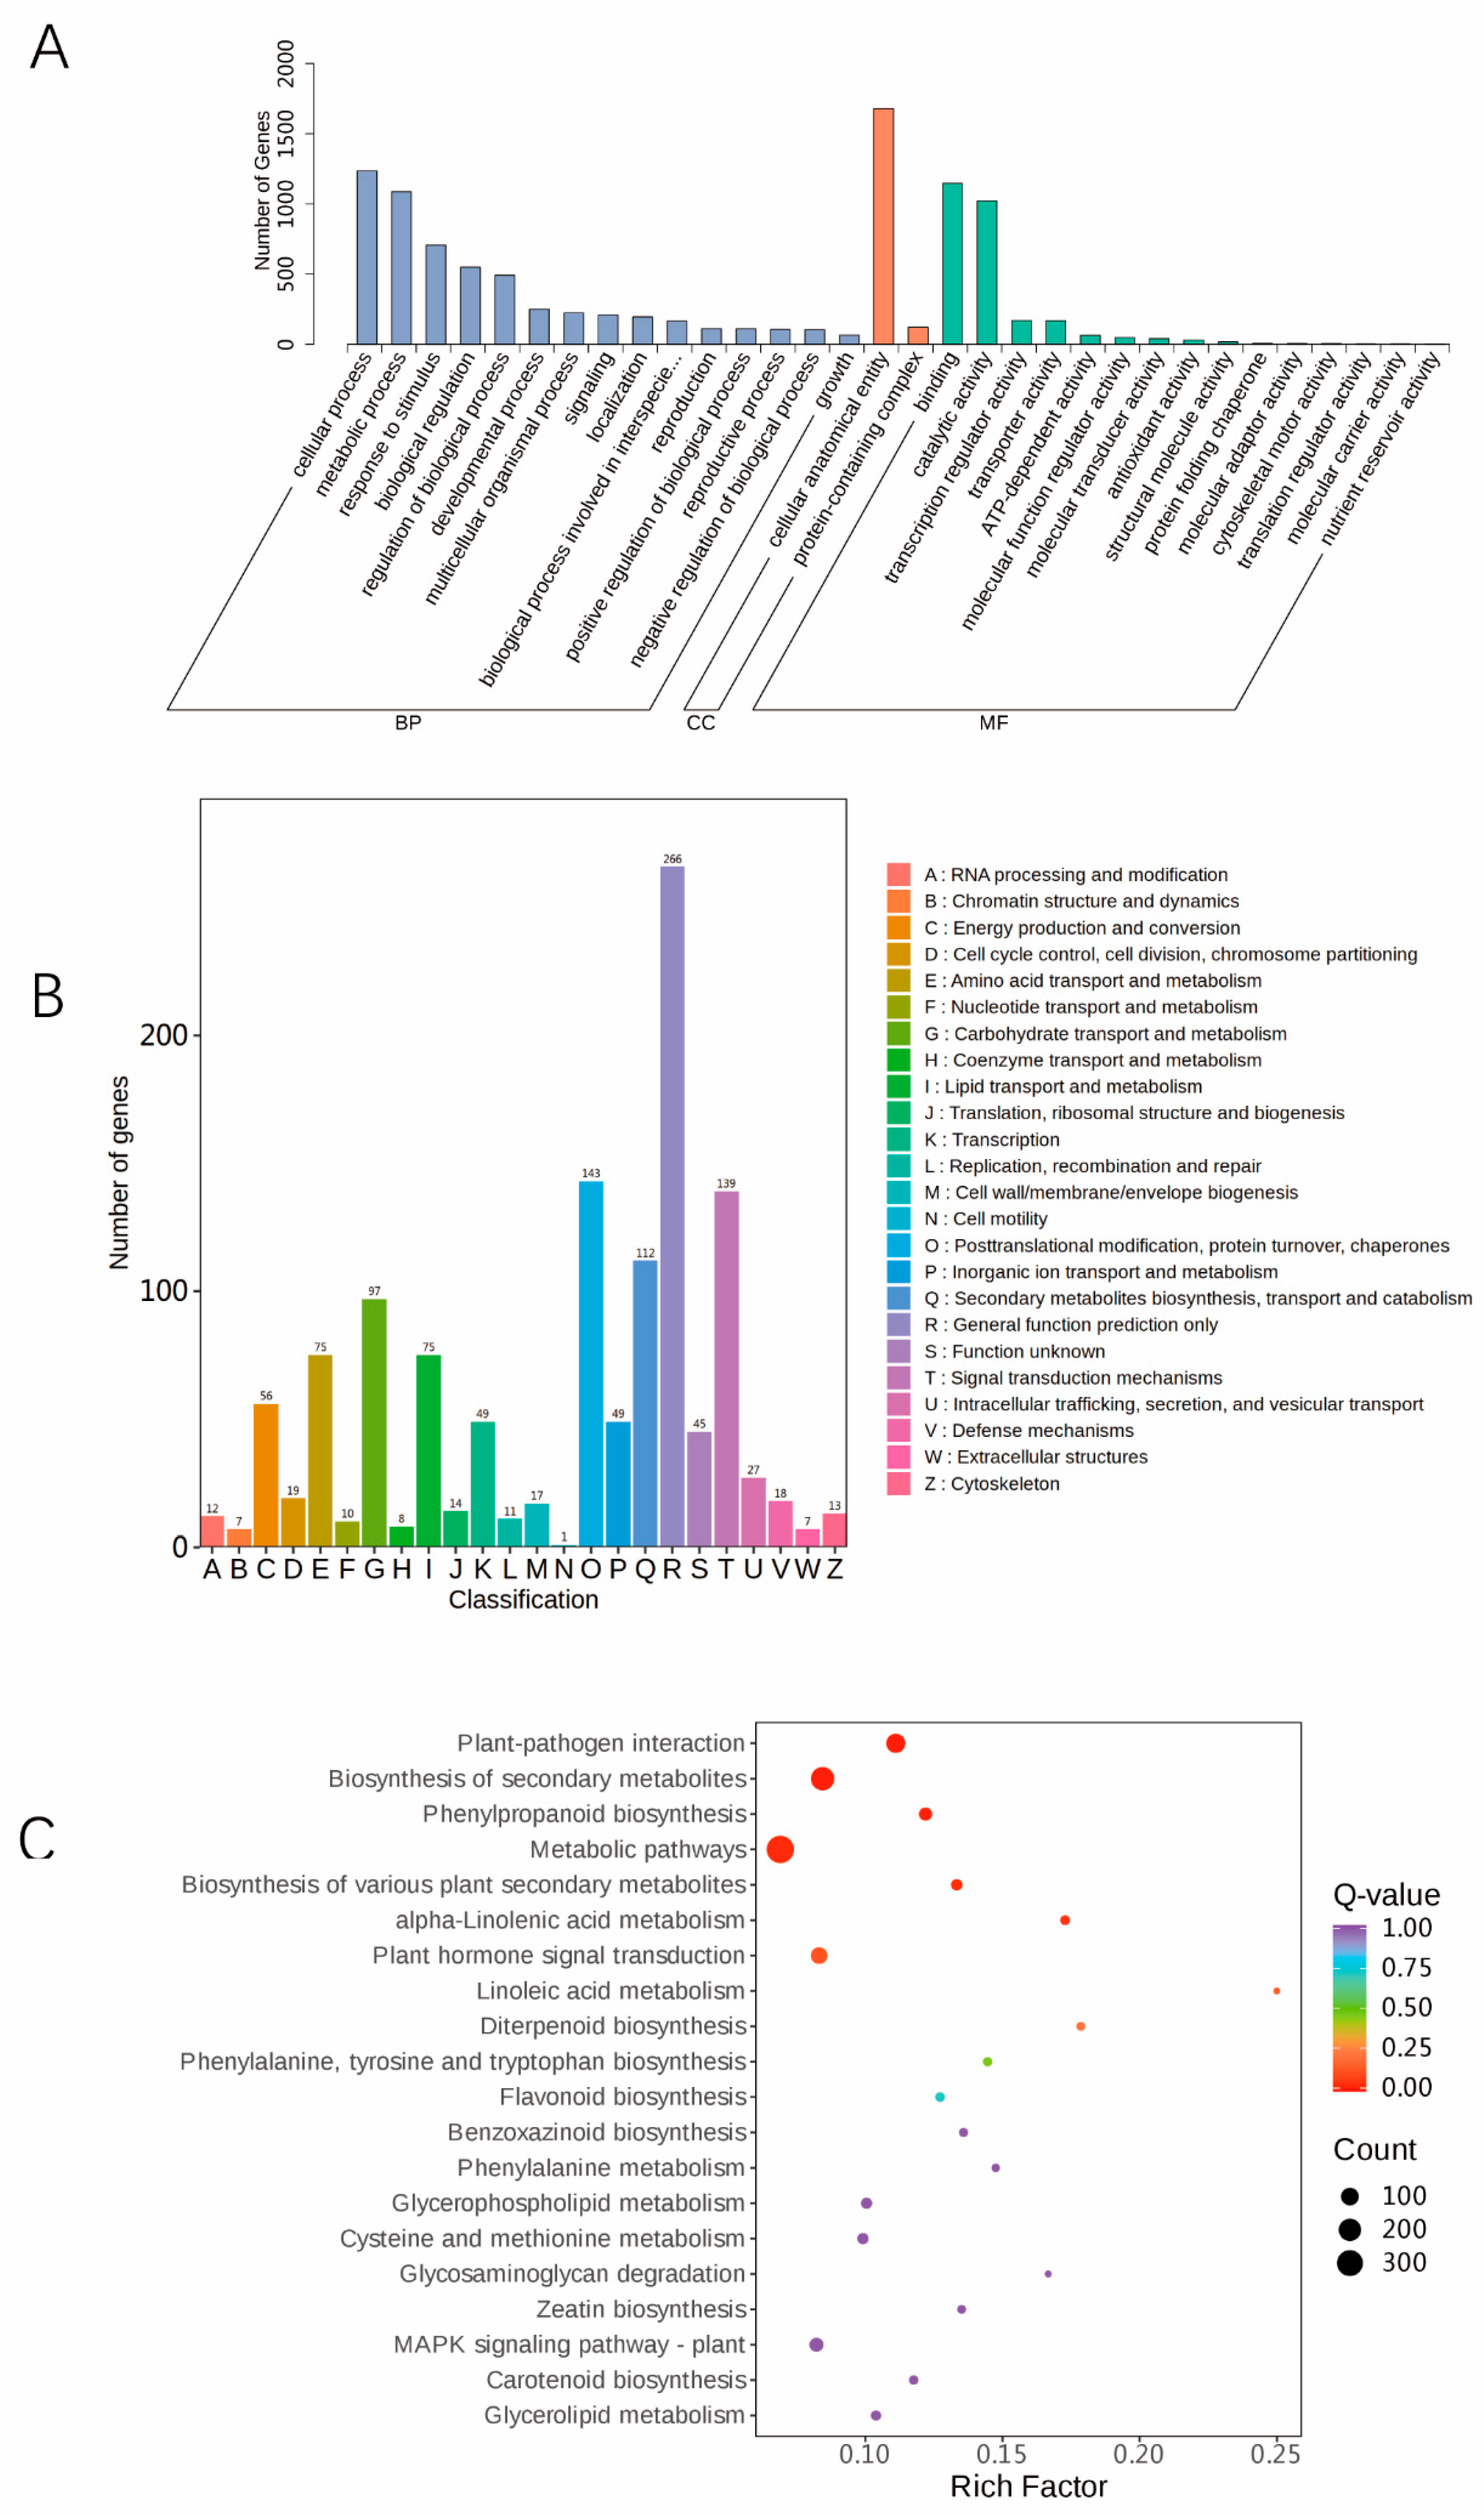
Identification and functional enrichment analysis of DEGs: In total, 2787 DEGs in the “Qian VS WT” comparison group were functionally annotated. GO analysis has three categories: molecular function (MF), biological process (BP), and cellular component (CC). The three GO BP terms that were enriched in the DEGs were cellular process, metabolic process, and response stimulus. The enriched GO CC items were cellular anatomical entity and protein-containing. The enriched GO MF terms were binding and catalytic activity (
Figure 5A). According to the KOG enrichment analysis, amino acid transport and metabolism (E, Amino acid transport and metabolism), lipid transport and metabolism (I, Lipid transport and metabolism), carbohydrate transport and metabolism (G, Carbohydrate transport metabolism), posttranslational modification, digested cation, protein turnover (O, posttranslational modifications, digested cation, protein turnover, chaperones), secondary metabolites biosynthesis, transport and catabolism (Q, secondary metabolites biosynthesis, transport and catabolism), general function prediction (R, general function prediction only), and other functions were enriched in the DEGs (
Figure 5B). Moreover, KEGG enrichment analysis of the DEGs was performed, and the results showed that metabolic pathways, biosynthesis of secondary metabolites, plant-pathogen interactions, and plant hormone signal transduction pathways were significant enriched (
Figure 5C). The next step was to further explore the genes involved in these pathways, so as to find the key functional genes regulating maize leaf colour.
Analysis of key functional genes: MapMAN 3.6.0RC1 was used to analyze the differentially expressed genes in the transcriptome data of wild-type B73 and mutant
zmpgl (
Figure 6). The biosynthesis of amino acids involves 22 differentially expressed genes, with 10 genes being downregulated. Among these,
zm00001d034460 exhibited the most significant expression difference between the Qian and WT control groups. There were 4 differently expressed genes related to glutamate biosynthesis (
zm00001d017790, zm00001d024950,
zm00001d032430, and zm00001d008310). Aspartic acid biosynthesis related to 6 (
zm00001d028750,
zm00001d028810,
zm00001d033030,
zm00001d033480, zm00001d017430, and zm00001d043780), Pyruvate amino acid biosynthesis was associated with 2 (
zm00001d004960 and zm00001d053960). The biosynthesis of shikimic amino acids was related to 6 (
zm00001d041700,
zm00001d045450,
zm00001d010190,
zm00001d003830,
zm00001d034460, and
zm00001d049610). There were 4 associated with protein and amino acid degradation. There were 75 differentially related genes involved in the maintenance of cell stable state, among which 26 were related to E3 ubiquitin ligase and 4 were related to E2 ligase. The expression of
zm00001d028020 encoding E3 ubiquitin ligase was most upregulated in the Qian VS WT comparison group. There are 15 differential genes related to photosynthesis, of which 10 genes are upregulated and 5 genes are downregulated. The differentially expressed genes are involved in photophosphorylation, with
zm00001d039040,
zm00001d06540,
zm00001d049650,
zm00001d034540,
zm00001d002240,
zm00001d029200, and
zm00001d032380 participating in the activity of photosystem II.
zm00001d018030, zm00001d028670, and
zm00001d043380 participate in chloroplast respiration. The gene
zm00001d039040, which encodes the components LHCb1/2/3 of the LHC-II complex, exhibited the most significant upregulation in the Qian group compared to the WT control group. There were 35 differentially expressed genes related to fatty acid metabolism, of which 13 genes were downregulated and 23 genes were upregulated. This study identified 14 genes involved in fatty acid metabolism, 12 genes participating in triglyceride metabolism, and 6 genes associated with sphingolipid metabolism. The mitochondrial pyruvate carrier 1 (MPC1) gene
zm00001d034520, which encodes a fatty acid metabolism-related mitochondrial pyruvate transporter, was upregulated by 4.677-fold. Among the 35 differentially expressed genes involved in ABA metabolism, the GTPase
zm00001d0333130 encoding the LSU process showed the most significant upregulation (3.219-fold increase) in the Qian VS WT control group, whereas the eL32 component
zm00001d031560 of the LSU proteome exhibited the most pronounced downregulation (3.111-fold decrease). There were 25 differential genes related to cell wall, 8 differential genes were upregulated and 17 differential genes were downregulated. The 1,4-glucan synthase gene
zm00001d020560 involved in hemicellulose and xyloglucan biosynthesis, and the galactosyltransferase gene
zm00001d046690 participating in pectin and rhamnogalacturonan-I biosynthesis were downregulated by 2-to 3-fold. A total of 5 differentially expressed genes (
zm00001d006040,
zm00001d008370,
zm00001d024210,
zm00001d032230,
and zm00001d008530) were identified to be involved in the biosynthesis of tetrahydrofuran, among which two were downregulated and three were up- regulated.
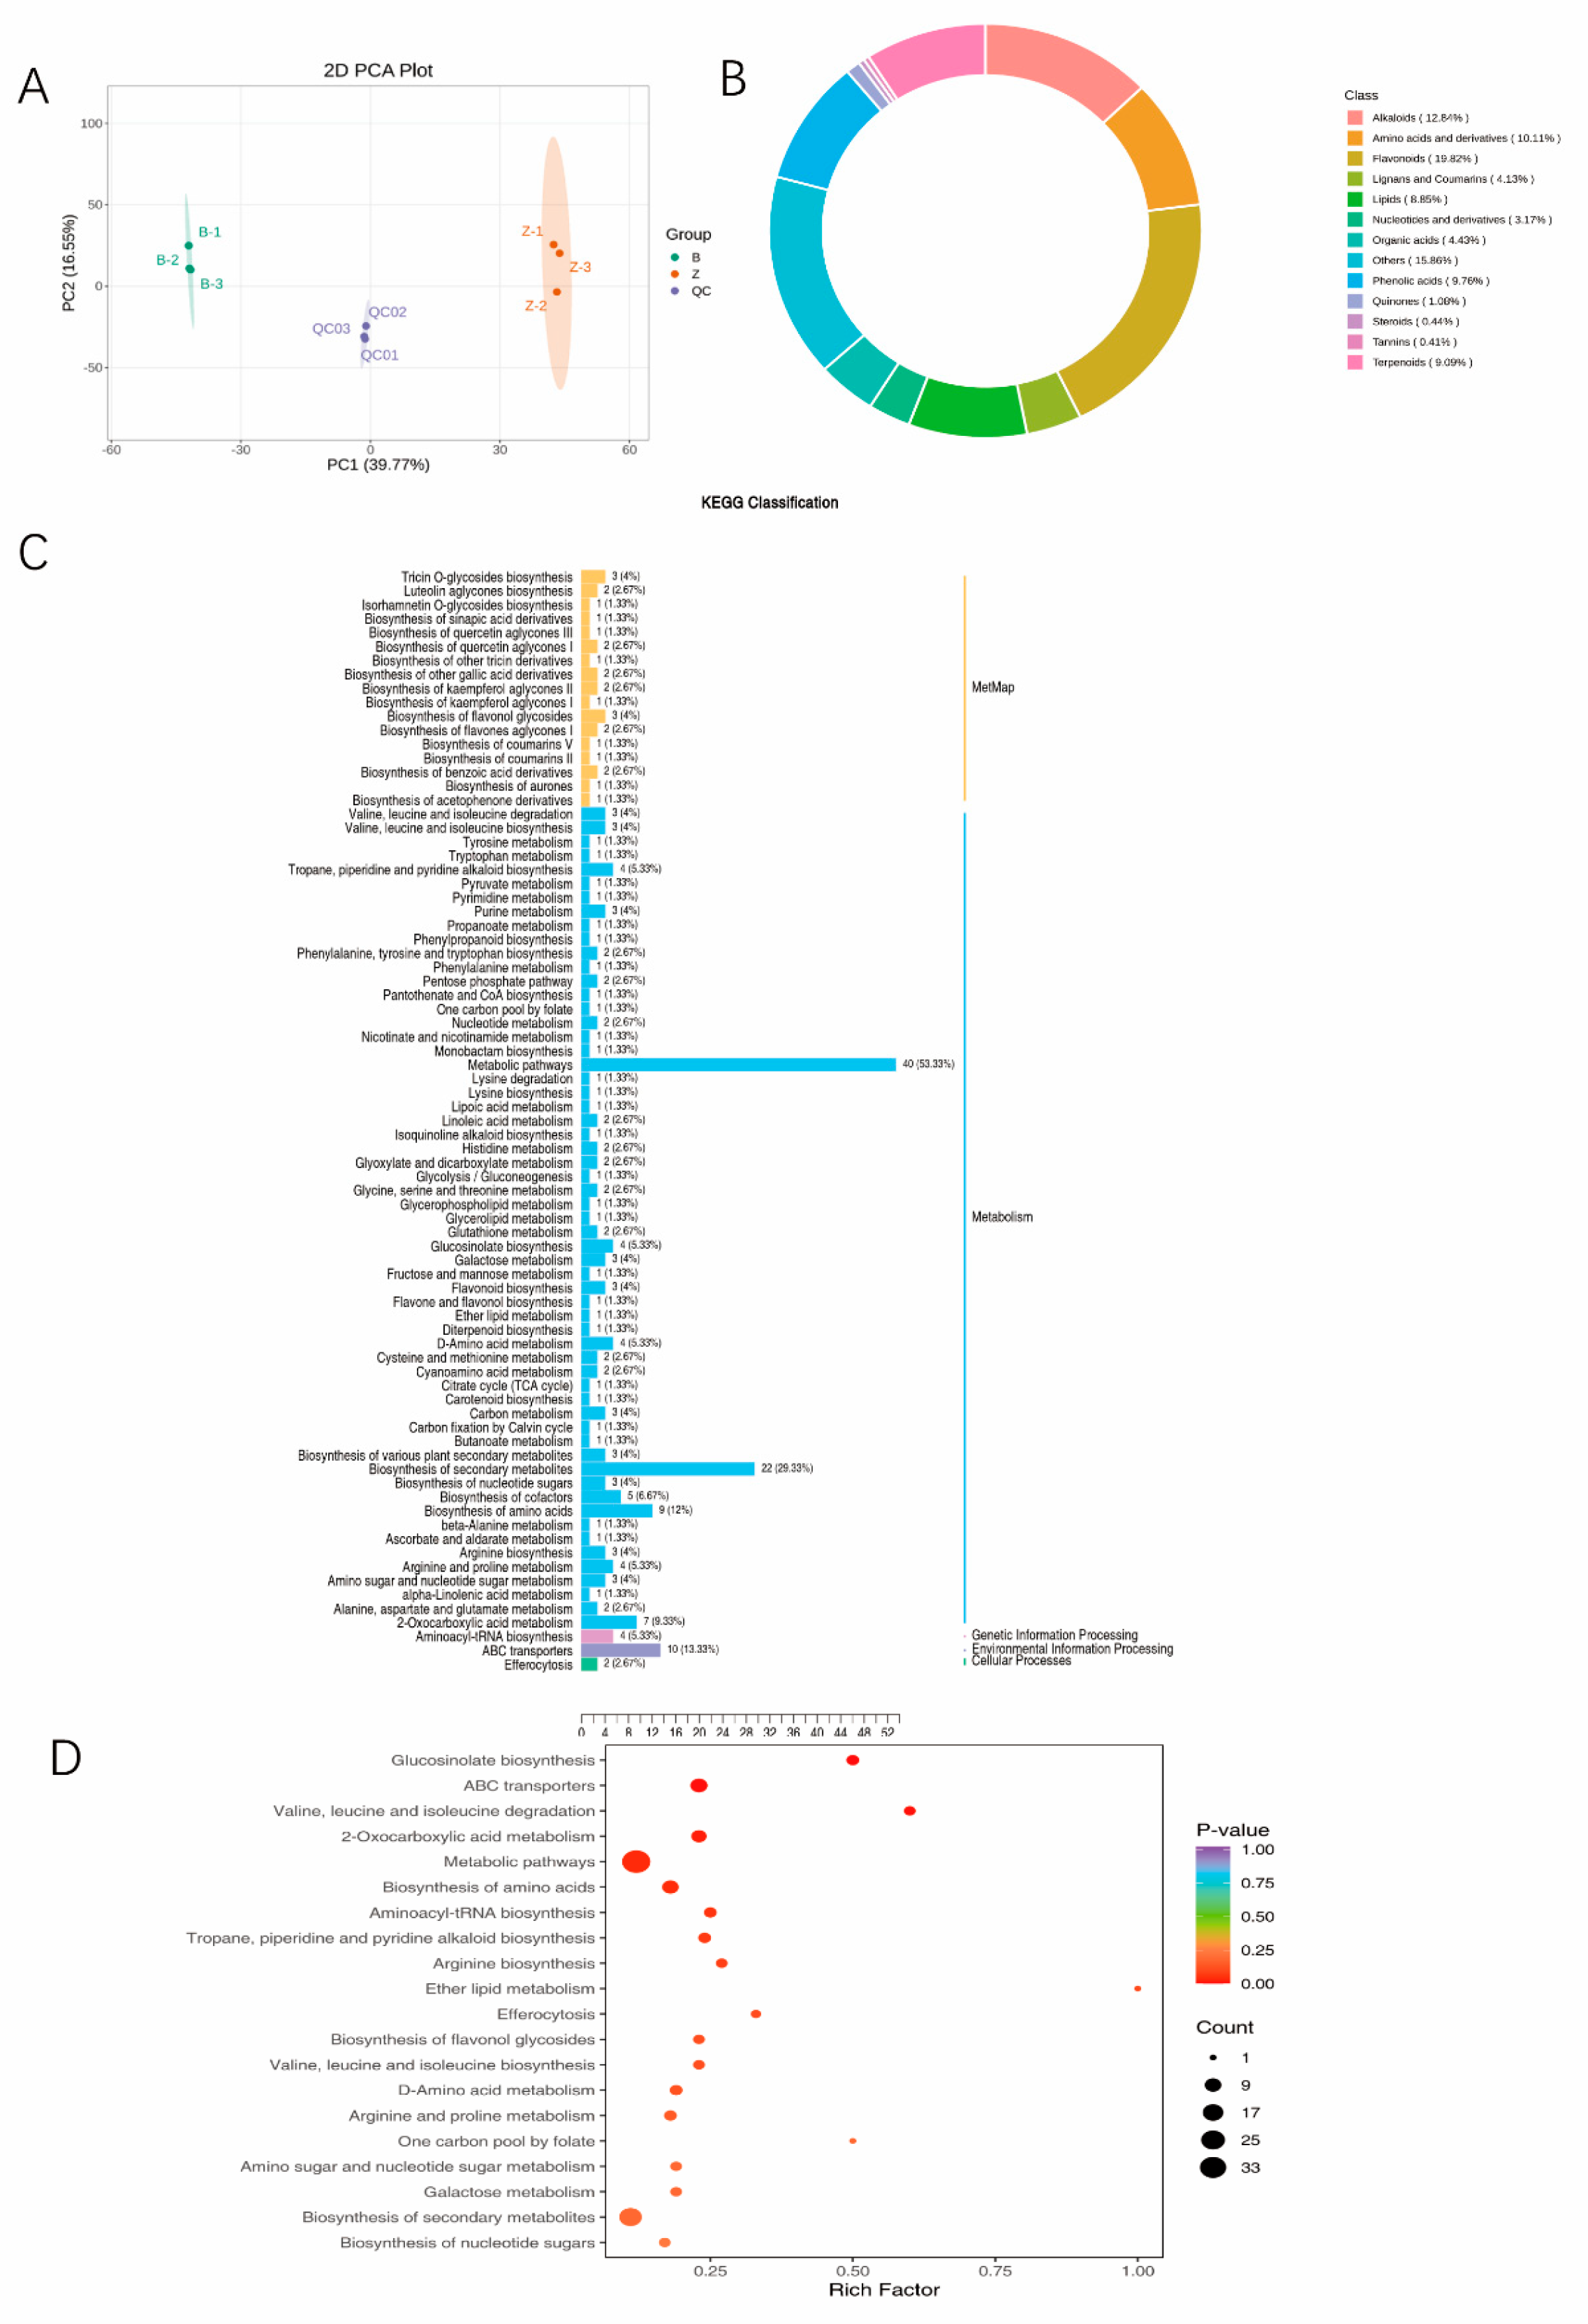
Principal component analysis (PCA) of metabolite samples: To investigate the differences and variability in total metabolites both between and within sample groups, a PCA was performed on the samples. The PCA results revealed different metabolite profiles among the different sample groups, indicating potential differences in the metabolome between the sample groups. QC represents quality control samples, and the three replicate QC samples were clustered closely together, demonstrating the high quality of the test data. The PCA results revealed a good correlation among the intragroup replicates (
Figure 7A).
Analysis of differentially abundant metabolites: A total of 329 differentially abundant metabolites were detected in this study, of which 160 metabolites increased and 169 metabolites decreased (
Table 3). Flavonoids accounted for 19.82%, alkaloids accounted for 12.84%, amino acids and derivatives accounted for 10.11%, lignans and coumarins accounted for 18.8%, and lipids accounted for 8.85%. The phenolic acid content was 9.76% and the terpenoid content was 9.09% (
Figure 7B). A total of 329 differentially abundant metabolites of Qian vs. WT were associated with 59 KEGG pathways (
Figure 7C), among which both metabolite pathways and amino acid biosynthesis pathways were among the top 20 enriched pathways (
Figure 7D).
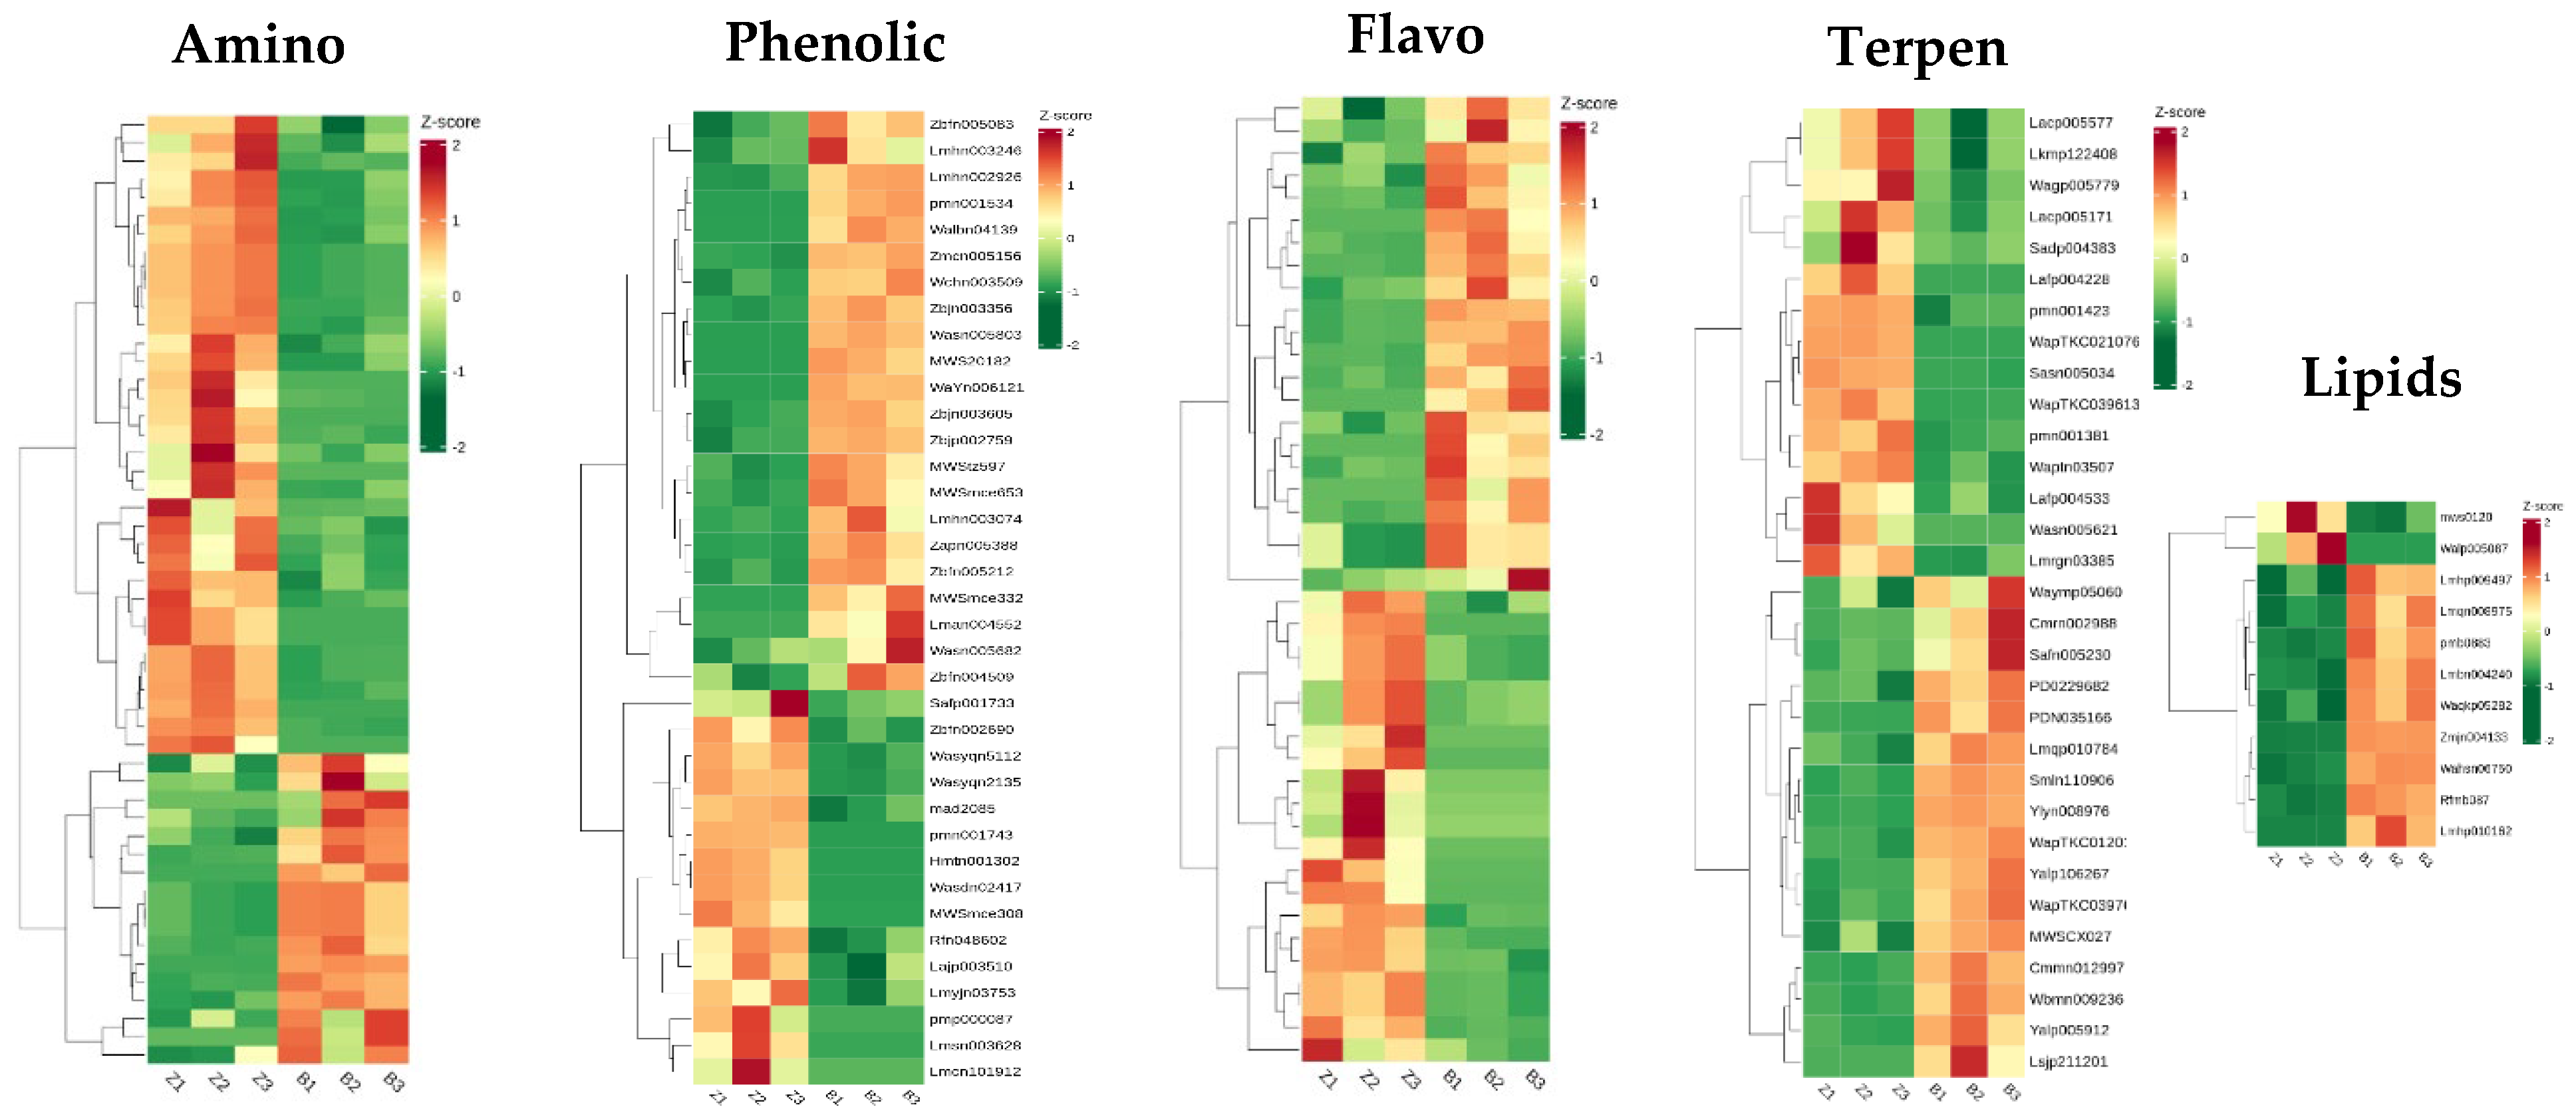
KEGG pathway enrichment analysis of differentially abundant metabolites: The differentially abundant metabolites were analysed, and 52 different amino acid metabolites were found. Compared with those in the wild type, the contents of 35 amino acids in the
zmpgl mutant were increased. The contents of Thr-Glu-Ile, Ile-Glu-Val, His-Ile-Gly*, 3-(Pyrazol-1-yl)-L-alanine, Pro-Ile-Asp*, Pro-Leu-Asp*, and Cyclo(D-Val-L-Pro) were significantly increased. The contents of Gly-Asp-Val, N5-ethyl-L-glutamine, S-allyl-L-cysteine, N-acetyl-tryptophan, and Gly-Val-Phe were significantly decreased. There were 37 distinct phenol acid metabolites, among which the contents of gallic acid ethyl ester, 6′-O-sinapoylsucrose, helicoside, pecnuezhenide, and 2-feruloyll-SN-glycerol were significantly increased. The contents of 1,2,3,6-Tetrakis-o-galloyl-beta-d-glucose, 3,4-dimethoxycinnamic acid, and protocatechuic acid 4-O-(6 “-o-feruloyl)glucoside were significantly reduced. There were 43 differential flavonoid metabolites, among which the contents of 5,7,8,3′,4′-pentamethoxyflavanone, hesperetin 7-O-glucoside, 2-(3,4-dihydroxyphenyl)-4 h-Chromene-3,5,7-triol-glucoside, quercetin-3-O-α-rhamnosyl (1→2)-[α-rhamnosyl (1→6)]-β-glucoside*, and 7,8,4′-trihydroxyflavanone were significantly increased. There were 53 different alkaloid metabolites, and the contents of Indican, 2-amino-2-(1-methyl-1H-pyrazol-4-yl)acetic acid, Retronecine, and Dhurrin 6′-Glucoside were significantly increased (
Figure 8).
4. Discussion
Leaf colour mutants present changes in chlorophyll content and chloroplast structure, which directly affect leaf colour. In addition, changes in chloroplast structure can affect the composition and levels of photosynthetic pigments, further altering leaf colour. In this study, the total chlorophyll content, chlorophyll a content, chlorophyll b content, and carotenoid content of the zmpgl mutant were significantly lower than those of the wild type. Considering that the contents of chlorophyll a, chlorophyll b, and carotenoids in the zmpgl mutant were significantly reduced, the mutant was initially considered to be a total chlorophyll-deficient leaf colour mutant, and the change in leaf colour was caused by a decrease in the photosynthetic pigment content.
In higher plants, chlorophyll biosynthesis is catalysed by a series of enzymes. Genes within the HEMA gene family that regulate chlorophyll and haem synthesis have been identified (McCormac et al., 2001; Schmied et al., 2011; Zhu et al., 2016) [
1,
17,
18]. Magnesium chelatase, a key enzyme in chlorophyll a synthesis, requires three subunits (I, H, D), and mutations or deletions in the genes encoding these subunits disrupt chlorophyll biosynthesis, leading to altered leaf colour. For example, the rice mutant
ygl98, which has yellow-green leaves as a result of a mutation in the OsChlD gene, exhibits irregular chloroplast morphology with vesicular structures and reduced thylakoid stacking (Sun et al., 2011) [
13]. Similarly, the chlorophyll-deficient cucumber mutant C528 displays leaf colour variation due to a mutation in the CHLI subunit of magnesium chelatase. Additionally, a single-base insertion in the POR gene, encoding a protochlorophyllide oxidoreductase, results in a pale-green leaf phenotype in the rice mutant
pgl10 Furthermore, the rice yellow-green leaf mutants
ygl4 and
ygl11 are caused by mutations in chlorophyll a oxidase (OsCAO1) [
19]. These findings underscore the critical role of chlorophyll biosynthesis and chloroplast structure in determining leaf colouration and provide insights into the genetic basis of leaf colour mutations in plants.
Abnormal chlorophyll anabolism and chloroplast structure affect the chlorophyll content and the efficiency of photosynthetic energy conversion and transfer; thus, the photosynthetic physiological characteristics of plant leaf colour mutants are often aberrant. The net photosynthetic rate, stomatal conductance, intercellular CO2 concentration, and transpiration rate of the yellow–green maize mutant were significantly lower than those of the wild-type plants, and the photosynthetic capacity and photosynthetic efficiency were also significantly lower. Photosynthesis is required for the production of organic matter in plants. Crop yield is closely related to photosynthesis, and 95% of the crop yield is attributed to plant biomass grown via carbon dioxide fixation during photosynthesis. Leaf colour mutations directly or indirectly affect the synthesis and degradation of chlorophyll. Therefore, leaf colour mutants must be studied to clarify the regulatory mechanism of photosynthesis, improve the photosynthetic efficiency of crops, and increase crop yield.
Changes in chloroplast structure strongly influence photosynthesis. Most of the thylakoids in chloroplasts are stacked to form granulosa, and the thylakoid structure of the chloroplasts in leaf colour mutants varies. A previous study revealed that the chloroplast shape of the yellow–green leaf rice mutant ygl98 was irregular, the number of granulothylakoid stacks decreased, and empty vesicular structures appeared in the green leaves. The chloroplast shape of the maize mutant zmpgl was modified, and the thylakoid lamellar structure was highly differentiated and ordered, but the stack number was significantly reduced, suggesting that the phenotype may also be caused by the inhibition of chloroplast development.
Galactoids are composed of 80% thylakoid lipids, and their biosynthesis is the basis of chloroplast development. Membrane lipids and photosynthetic protein complexes form chloroplast thylakoid membranes; therefore, lipid biosynthesis and photosynthesis-associated protein accumulation are important for thylakoid development. Studies have shown that the inhibition of galactoselin synthesis can reduce the expression of PhANGs and PhAPGs, which are related to photosynthesis. Galactoselin increases the transcript levels of PhANG and PhAPG and is essential for the accumulation of chloroplast-encoded photosynthesis-related proteins. GENOMES UNCOUPLED1 (GUN1) is involved in the PhANG regulatory response to galactoselide. Previous studies have shown that GUN1 accumulation reflects protein homeostasis in plastids and alters the level of PhANG expression. These results indicate that both genes jointly regulate chloroplast development. In the light green leaf maize mutant
zmpgl, the expression of the galactosyltransferase gene
zm00001d046690, which is involved in galactose synthesis, was significantly downregulated compared with that in the wild-type plant, indicating that changes in the expression of genes involved in galactose synthesis affect the development of chloroplasts and lead to changes in leaf colour. Protein is the basic structure of chloroplasts, and changes in amino acid content also strongly influence leaf colour. Studies have shown that glutamic acid (Glu) and aspartic acid (Asp) are upstream of the amino acid metabolic pathway and that their conversion is inhibited, which affects the contents of various amino acids downstream [
20].
In this study, the expression of genes related to the synthesis of Glu and Asp decreased most significantly. It was concluded that Glu and Asp were upstream of the entire amino acid metabolic pathway and that their conversion was blocked in the mutant leaves, resulting in a decrease in amino acid content during downstream metabolism.
LHC superfamily proteins play crucial roles in photosynthesis. Most studies of LHC plants have focused on the LHC subfamilies LHCa and LHCb, which play important roles in PSI (Photosystem I) and PSII (Photosystem II), respectively [
21]. The binding of LHC proteins to antenna pigments, chlorophyll, and carotenoids increases the light-trapping capacity of plants. In Arabidopsis, the roles of several LHC members in solar energy capture, seed germination, growth, and plant adaptation to environmental changes have been studied. The overexpression of the CsLHC gene in LHCb mutants of
Arabidopsis thaliana promotes chlorophyll accumulation and leaf greening by increasing the expression level of genes related to chlorophyll biosynthesis [
22]. In
Arabidopsis thaliana, the chlorophyll contents of athcb6, athcb5, and athcb4 knockout mutants are significantly reduced. The gene
zm00001d039040, encoding the LHC-II complex component LHCb1/2/3, was downregulated in the light green leaf maize mutant
zmpgl, which was inferred to affect leaf chlorophyll synthesis and lead to a lighter leaf colour.
Stomata are important channels for water and air exchange in plants, and their size affects plant transpiration and photosynthesis Stomata are tiny pores surrounded by pairs of guard cells whose openings are well controlled to balance water vapour loss via transpiration and CO
2 absorption via photosynthesis. The signal network regulating stomatal movement is complex. Studies have shown that NRGA1, a member of the putative mitochondrial pyruvate carrier (MPC) family in plants, is a negative regulator of abacic acid (ABA) signalling in guard cells. Compared with wild-type plants, loss-of-function MPC1 (MPC1) mutants are more sensitive to ABA-induced stomatal closure and their ABA-activated guard cells have a slow anion current, and the water loss rate is reduced under drought conditions. In contrast, plants that overexpress MPC1 are insensitive to ABA and have increased sensitivity to drought stress. In addition,
mpc1 mutants accumulate more pyruvate under drought conditions or after ABA treatment. Increased pyruvate content also induces stomatal closure and activates slow anion channels in guard cells, a process that depends on the function of the NADPH oxidase RbohD/F and the concentration of reactive oxygen species in guard cells [
23].
5. Conclusions
In this study, the expression of the mitochondrial pyruvate transporter component MPC1
zm00001d034520 was upregulated by 4–5 times in the maize mutant
zmpgl compared with the wild-type maize plant, indicating that the mutation affected stomatal opening and closing and thus, affected photosynthesis. In addition, LSU proteins involved in protein synthesis interact with members of the brassinolide signalling pathway (Niemiro et al., 2020) [
24], jasmonic acid signalling pathway, and ethylene biosynthesis pathway (Moniuszko et al., 2013) [
25]. Analysis of the Arabidopsis LSU gene promoter region suggested that these genes have cis-regulatory elements that may be potentially responsive to plant hormones such as ABA.
zm00001d033130, a regulatory GTPase (NUG1/NSN1) of the LSU proteome, was upregulated 3–4-fold in the maize mutant compared with the wild-type maize plant, which is presumed to affect ABA biosynthesis and thus, further affects photosynthesis. Moreover, tetrapyrrole plays a vital role in various biological processes, including photosynthesis and respiration. The tetrapyrrole biosynthesis pathway can be divided into two branches: one for chlorophyll synthesis and the other for haem and photoproduct biosynthesis, and the key intermediate substance in both of these branches is protoporphyrin Ⅸ. The magnesium porphyrin transmethylase activity in the barley white leaf process is lost, which leads to the metabolism of tetrapyrrole to be biased towards the synthesis of haem and results in photosynthesis inhibition [
26].
The chloroplast is a unique organelle of plants that is the site of photosynthesis and the synthesis of various metabolites necessary for life activities. The biosynthesis of chlorophyll and haem via the tetrapyrrole pathway takes place in chloroplasts. On the one hand, chlorophyll and haem are essential metabolic substances for plant photosynthesis and growth and development. On the other hand, if tetrapyrrole intermediates accumulate excessively, reactive oxygen species are easily generated after light exposure, often causing oxidative damage to plants. zm00001d024210, zm00001d032230, and zm00001d008530, which are involved in the biosynthetic pathway of tetrapyrrole, are upregulated 1–2-fold in the maize mutant compared with the wild-type maize plant, which is expected to lead to an increased content of tetrapyrrole intermediates and damage to plants.
Leaf colour variation is common in maize crops, and different leaf colours are inherited via the transmission of nuclear gene and chloroplast gene mutations [
27]. Leaf colour mutants are ideal materials for studying chloroplast development, pigment metabolism, photosynthesis and related pathways and are highly important for breeding plants with high photosynthetic efficiency. Studies have shown that leaf colour variation is regulated by photosystem protein-encoding genes, protein transport genes, chloroplast genes and other related genes (Xu Peizhou et al., 2006) [
28], making the study of leaf colour genetics more complicated. Through the comprehensive analysis of transcriptomics and metabolomics, we found that mutations have altered the differentially expressed genes and differentially accumulated metabolites that are crucial for important physiological processes such as tetrapyridine synthesis, lipid metabolism (related to leaf photosynthesis), amino acid metabolism (related to chlorophyll biosynthesis and light response), and abscisic acid (ABA) biosynthesis. The research on the key genes and metabolites involved in the photosynthetic pathway has increased the understanding of the molecular basis of colour variation in corn leaves and its impact on photosynthetic performance, providing information for improving the photosynthetic efficiency of corn leaves and artificial breeding.


