Article

Long-Term Irrigation Deficits Impair Microbial Diversity and Soil Quality in Arid Maize Fields

1
College of Life Sciences, Shihezi University, Shihezi 832003, China
2
Xinjiang Production and Construction Corps Key Laboratory of Oasis Town and Mountain, Basin System Ecology, Shihezi University, Shihezi 832003, China
3
Agricultural Ecology and Resource Protection Station of the Ministry of Agriculture and Rural Affairs, Beijing 100125, China
*
Authors to whom correspondence should be addressed.
These authors contributed equally to this work.
Agronomy 2025, 15(6), 1355; https://doi.org/10.3390/agronomy15061355
Submission received: 24 April 2025 / Revised: 26 May 2025 / Accepted: 29 May 2025 / Published: 31 May 2025
(This article belongs to the Section Water Use and Irrigation)

Abstract

:
Water scarcity in arid regions poses a severe threat to agricultural sustainability, necessitating optimized irrigation strategies. This study investigates the cumulative impacts of long-term irrigation deficits on soil quality, microbial diversity, and maize yield in the arid maize fields of Xinjiang, China, where consistent irrigation patterns have been maintained over multiple years. Seven sites were monitored from April 2023 to March 2024, with a single end-of-cycle sampling in March 2024. Using the Irrigation Water Deficit Index (IWDI), the sites were classified into low (LD, 16.37–22.30%), moderate (MD, 30.54–38.10%), and high drought (HD, 47.49–50.00%) categories. The findings reveal that long-term consistent irrigation deficits exacerbate soil salinization, compaction, and nutrient loss, with organic matter declining significantly under HD conditions. Bacterial richness increased by ~6% under HD, driven by stress-tolerant taxa, while fungal diversity decreased by 14–50%, impairing nutrient cycling functions critical for soil health. The Soil Quality Index (SQI) and maize yield declined with drought severity (LD > MD by 26.18% and 21.05%; LD > HD by 45.02% and 13.13%), highlighting the pivotal role of sustained irrigation patterns in maintaining productivity. These results underscore the need for tailored irrigation management in arid regions, such as precision drip irrigation, to mitigate soil degradation and sustain maize yields, providing a scientific foundation for optimizing water use efficiency in water-scarce agroecosystems under long-term irrigation regimes.

1. Introduction

Drought ranks among the most formidable environmental stressors impacting global agricultural production [1,2]. In arid and semi-arid regions, where water scarcity severely jeopardizes soil ecosystem functions and sustainable crop yields, irrigation emerges as a critical strategy to mitigate these challenges [3,4]. Covering approximately 41% of the Earth’s land surface and sustaining over 38% of its population, arid regions are vital to terrestrial ecosystems and significantly influence agriculture and national economies [5,6]. Climate change, through erratic precipitation and intensifying drought events, amplifies pressure on water resources, making effective irrigation management increasingly essential [4,7]. Over time, sustained irrigation practices shape soil physicochemical properties—such as organic matter content and nutrient availability—along with microbial community diversity and functionality, driving long-term shifts that affect soil nutrient cycling, plant stress resilience, and agricultural ecosystem stability [8,9,10]. Consequently, a systematic investigation of drought’s multifaceted impacts under varying irrigation regimes not only clarifies ecological response mechanisms but also underpins strategies for safeguarding food security [11,12]. Unlike previous studies that often focus on short-term water restrictions or isolated drought events [13], this study uniquely examines the long-term cumulative effects of sustained irrigation patterns on soil quality, microbial diversity, and maize yield in arid regions. By integrating the Irrigation Water Deficit Index (IWDI), Soil Quality Index (SQI), and microbial indicators, our research offers a comprehensive framework to understand and manage irrigation impacts in water-scarce agroecosystems.
In arid agricultural ecosystems, where high evapotranspiration demands prevail, maize—a water-sensitive crop—relies heavily on long-term irrigation management to sustain growth and yield [14,15]. Prior research shows that drought diminishes soil fertility by promoting salinization, nutrient depletion, and slowing organic matter decomposition [16,17,18]. Soil microbial communities, critical drivers of ecological functions [19,20,21], exhibit complex adaptations under drought, with bacterial communities often enriching drought-tolerant taxa [22] and fungal diversity declining due to water dependency [23]. Specifically, bacterial communities may bolster stress resilience by favoring drought-tolerant groups, whereas fungal communities—reliant on water for mycelial development—often show reduced diversity and impaired functionality [23,24]. These microbial shifts, influenced by water availability, further affect soil nutrient availability and plant productivity [25,26], yet their quantitative links to long-term irrigation patterns remain underexplored. Current studies often focus on isolated drought events or short-term water restrictions, such as those conducted by [13,27], which provide valuable insights into immediate responses but overlook the cumulative effects of sustained irrigation regimes on soil quality index (SQI) and microbial dynamics. These short-term studies cannot fully capture the long-term shifts in soil properties and microbial communities that result from consistent irrigation practices over multiple years. This study addresses this gap by examining the long-term cumulative effects of sustained irrigation patterns on soil quality, microbial diversity, and maize yield in arid regions. To address this, we monitored maize fields over one year (April 2023 to March 2024), leveraging the legacy of prolonged irrigation to elucidate the differential responses of bacterial and fungal communities, their interactions with soil quality, and their implications for crop yield in arid settings.
This study examines maize fields in Xinjiang, China, where long-term irrigation regimes have shaped soil responses to drought, using one-year monitoring data (April 2023–March 2024) and a single end-of-cycle sampling in March 2024 to assess impacts across drought gradients via the Irrigation Water Deficit Index (IWDI) [28]. As a critical arid region for maize production facing significant water resource constraints, Xinjiang provides an ideal context for investigating the effects of irrigation management [4]. The specific challenges in this region, including severe water scarcity, high evaporation rates, and the need to maintain agricultural productivity while conserving limited water resources, underscore the necessity for a deeper understanding of the long-term impacts of irrigation practices. While prior studies often use multiple sampling times to capture seasonal microbial dynamics (e.g., (Muhammad et al., 2024 [17]), this study focuses on the cumulative effects of sustained irrigation practices, aiming to (1) evaluate how IWDI influences soil salinity, structure, and nutrients; (2) analyze bacterial and fungal community responses to irrigation-driven water gradients, emphasizing functional shifts; and (3) explore SQI–yield relationships under these conditions. These insights will inform sustainable irrigation strategies to mitigate soil degradation and sustain maize productivity in arid environments.

2. Materials and Methods

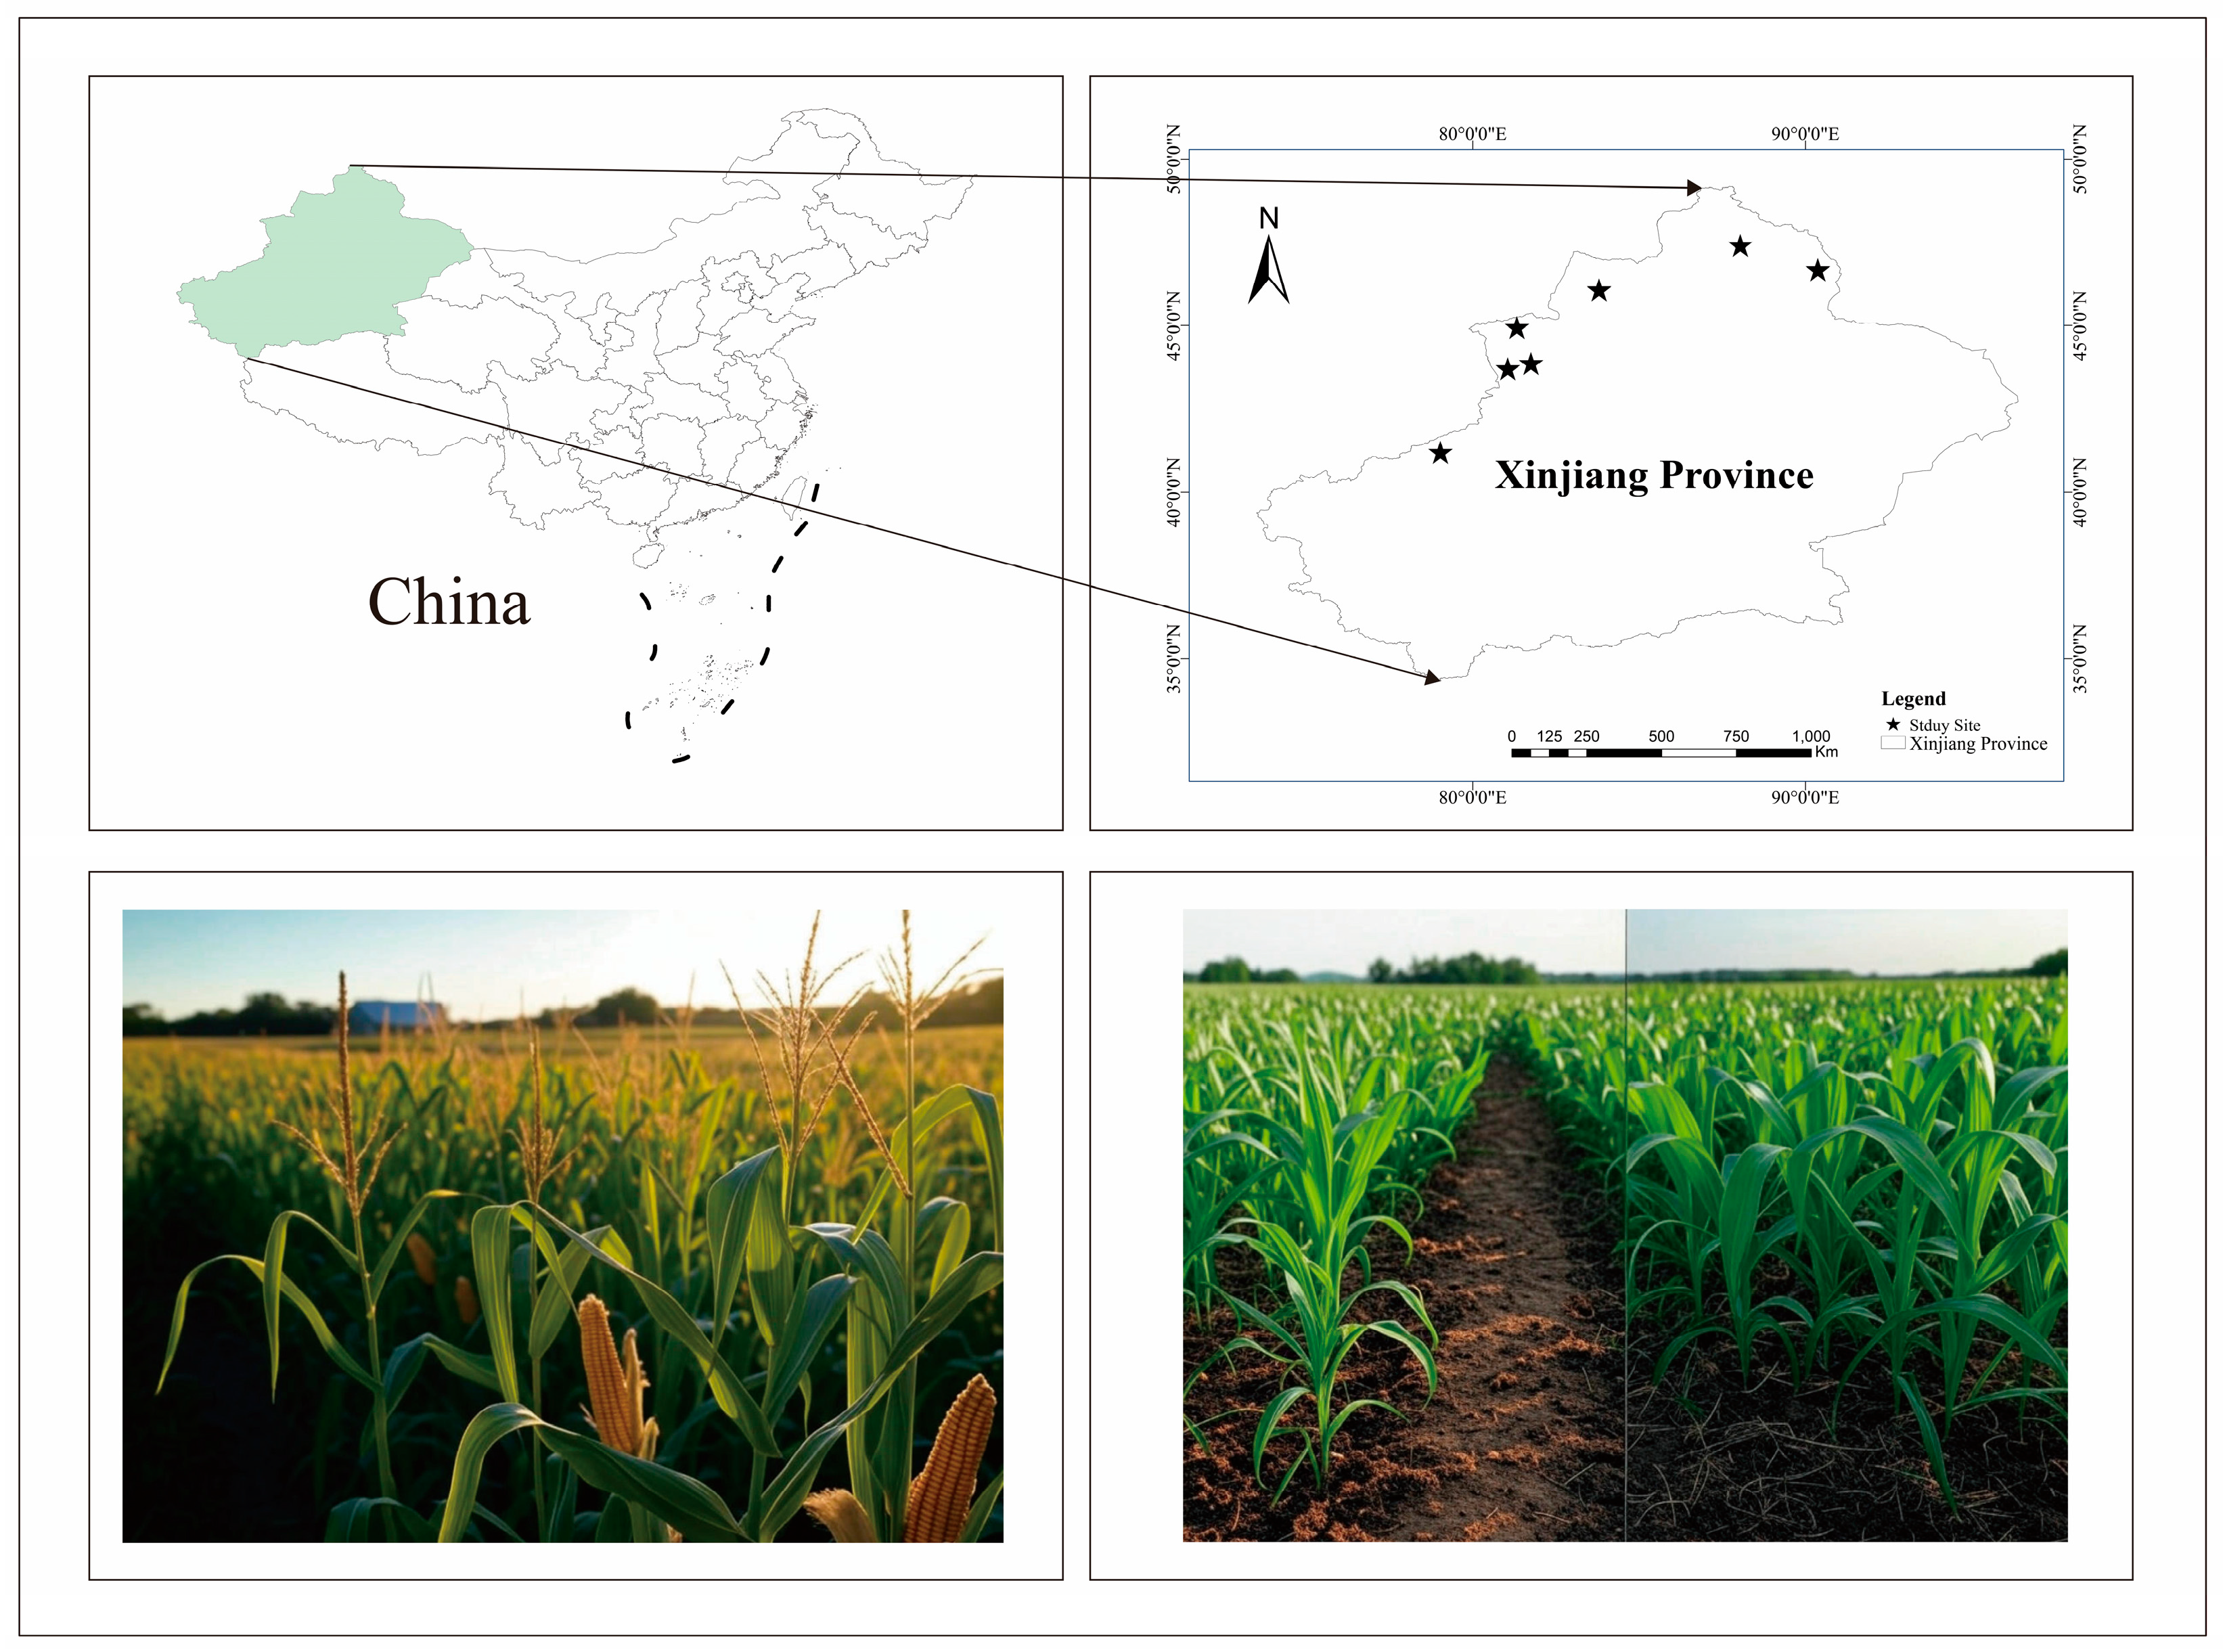
2.1. Experimental Site

This study was conducted in Xinjiang’s principal maize-growing areas within its arid region, where fields have been managed under long-term, site-specific irrigation regimes for multiple years. The experimental sites have a history of maize cultivation, with previous crop types including corn, wheat, and cotton. The fields have been under consistent irrigation and fertilization practices for over 20 years, with typical fertilizer applications including nitrogen, phosphorus, and potassium. These historical management practices have significantly shaped the current soil and microbial characteristics. Monitoring occurred over one year, from April 2023 to March 2024, across seven sites spanning geographic coordinates 41.196° N to 46.071° N and 79.034° E to 90.022° E, with elevations ranging from approximately 550 to 1500 m, encompassing Ili Kazakh Autonomous Prefecture, Tacheng Prefecture, Altay Prefecture, and Aksu Prefecture. This study area covers Xinjiang’s primary maize-producing regions in the arid zone, where crops are grown using conventional agricultural practices (Figure 1).

2.2. Experimental Design and Management

2.2.1. Experimental Design

The study monitored maize fields from April to October 2023, with maize sown in spring and harvested in autumn, reflecting conditions shaped by long-term irrigation practices consistently applied over many years. Based on the Irrigation Water Deficit Index (IWDI), defined as the ratio of maize water demand to water supply, seven plots were categorized into low drought (LD, 16.37–22.30%), moderate drought (MD, 30.54–38.10%), and high drought (HD, 47.49–50.00%), representing the cumulative effects of these irrigation regimes [28].

2.2.2. Field Management

Maize fields, managed under long-standing irrigation regimes, maintained a seeding rate of 45 kg·hm−2, with a row spacing of 30 cm and a plant spacing of 27 cm. Tillage involved 30 cm rotary cultivation, followed by uniform plastic mulch coverage. The plastic mulch was black, with a thickness of 0.01 mm, and covered the entire soil surface to a width of 70 cm. The primary functions of the plastic mulch included moisture retention, temperature regulation, and weed suppression. Drip irrigation, consistently applied for years, was used for both irrigation and fertilization, reinforcing its central role in shaping soil and crop outcomes. This drip irrigation system, widely adopted in Xinjiang’s arid agriculture, enhances water use efficiency and provides a practical framework for managing water deficits in water-scarce regions. All plots received identical fertilizer applications, comprising nitrogen from urea (46% N) (Shenyang Beinong Biotechnology Co., Ltd, Liaoning, China), phosphorus from diammonium phosphate ((NH4)2HPO4), (Dewoduo Fertilizer, Hebei, China), and a compound fertilizer (N-P-K = 15:15:15) (Shenyang Beinong Biotechnology Co., Ltd, Liaoning, China). Total urea application was 1120 kg·hm−2, distributed as follows: 15% as base fertilizer prior to mulching, 50% at the jointing stage, and 35% during the grain-filling stage. The base fertilizer consisted of 800 kg·hm−2 of diammonium phosphate and 240 kg·hm−2 of compound fertilizer.

2.2.3. Calculation of Irrigation Water Deficit Index

Precipitation (P) and potential evapotranspiration (ET0) data were obtained from the National Tibetan Plateau Data Center (https://data.tpdc.ac.cn/ (accessed on 20 October 2024)) [29,30,31,32], provided as monthly datasets. ET0 was calculated using the Hargreaves equation, which is widely accepted for its accuracy in estimating potential evapotranspiration based on meteorological data [32]. Raster data for the experimental sites were extracted using ArcMap (version 10.8.2) software. Irrigation volume was determined based on total irrigation amounts and plot area, encompassing the entire maize growing season. The total irrigation volume was measured using water meters installed at each plot, and the data were verified by comparing them with the irrigation records provided by the local farmers. This approach ensured the accuracy of the irrigation volume data used in the study. Crop coefficients (Kc) were adopted from the FAO-56 guidelines [33], specified by growth stage—initial (0.3), development (0.725), mid-season (1.15), and late (0.5). The growth period extended from April 15 to September 30 (approximately 140 days), with October limited to the final 8 days of the late stage.

2.2.4. Calculation of Crop Evapotranspiration

The IWDI was calculated using a series of equations to quantify water deficit relative to crop demand, as follows:
(1)
Crop evapotranspiration (ETcrop)
E T c r o p = × K c · E T 0
Here, ETcrop represents crop evapotranspiration, ET0 represents potential evapotranspiration (unit: mm), and Kc is the crop coefficient.
ET0 was allocated across the maize growth cycle (15 April to 30 September) into stages (initial stage: 30 days, development stage: 30 days, mid-stage: 61 days, late stage: 48 days), with October involving only the final phase of the late stage (8 days), and the monthly ETcrop for each plot was calculated and summed accordingly.
(2)
Effective precipitation (Peff)
Effective precipitation (Peff) was assumed to equal precipitation (P), considering that Xinjiang experiences very few extreme rainfall events. Additionally, the local soil characteristics, which include high permeability and low water retention capacity, support this assumption.
P e f f = P
(3)
Irrigation volume (Wgross)
Wgross is allocated according to water demand proportions [34] (April 0.4%, May 9%, June 25.8%, July 34.6%, August 18.6%, September 6.4%, October 0%).
W g r o s s = W / S c r o p
Here, Wgross is the total irrigation volume (unit: mm), W is the total irrigation volume (unit: m3), and Scrop is the plot area (unit: m2).
W i r r i = W g r a s s · E a
Here, Wirri is the effective irrigation volume (unit: mm) and Ea is the irrigation efficiency (95%), which is a reference value from the literature [35].
(4)
Irrigation Water Deficit Index (IWDI)
IWDI is based on the cumulative irrigation water deficit (CIWD) and maximum cumulative demand (MXIR).
I W D I = C I W D / M C I R × 100 %
(5)
Cumulative Irrigation Water Deficit (CIWD).
C I W D = ( max E T c r o p P + W i r r i , 0 )
(6)
Maximum Cumulative Irrigation Requirement (MCIR) is the theoretical maximum water deficit for each plot.
M C I R = max E T c r o p P
IWDI under irrigation scenarios was calculated for each plot to analyze spatial heterogeneity and differences in drought severity.

2.3. Sample Collection and Measurement

2.3.1. Collection and Analysis of Soil Samples

Soil samples were collected in March 2024 using a 3.5 cm diameter sampler, targeting the 0–20 cm depth along an ‘S’-shaped path at five random points per plot, then combined into subsamples for microbial and physicochemical analyses [36]. This sampling time was chosen to capture the cumulative effects of long-term irrigation regimes at the end of the monitoring period (April 2023–March 2024), providing a comprehensive snapshot of soil health before the next planting season. While this approach limits insights into seasonal dynamics, it aligns with our objective to assess the enduring impacts of irrigation deficits on soil quality and microbial diversity.
Soil pH and electrical conductivity (EC) were measured using the potentiometric method. Specifically, 10 g and 4 g of air-dried soil were mixed with 25 mL and 20 mL of deionized water (water-to-soil ratios of 2.5:1 and 5:1, respectively), shaken for 30 min, and then sequentially analyzed with a pH meter (PHS-3C, Shanghai Leici, Shanghai, China) and a conductivity meter (DDS-307, Shanghai Leici). Total soil nitrogen (TN) was quantified using the Kjeldahl method. Total soil phosphorus (TP) was determined through alkaline dissolution and dual-acid extraction, followed by the molybdenum antimony colorimetric method. Total soil potassium (TK) was assessed via alkaline dissolution and ammonium acetate extraction, followed by flame photometry. Alkali-hydrolyzable nitrogen (AKN) was measured using the alkali diffusion method. Available potassium (AK) was extracted with an ammonium acetate solution and quantified using a UV-6300 (PC) ultraviolet spectrophotometer. Available phosphorus (AP) was determined by sodium bicarbonate extraction, followed by the molybdenum antimony colorimetric method. Additionally, at each sampling point, soil profiles (0–20 cm) were excavated at three representative locations, and soil bulk density was measured using the core method (core dimensions: 70 mm × 52 mm).

2.3.2. Soil Quality Assessment

Fourteen variables, representing soil physical, chemical, and biological properties, were selected, exhibiting significant variation across different green manure management strategies. The Total Data Set (TDS) approach was applied to evaluate the Soil Quality Index (SQI) [37]. Principal component analysis (PCA) was utilized to assess the proportion of variance explained by each factor within the common factor framework. These proportions were subsequently used as weights for individual indicators [38]. Soil property indicators were standardized and scored using a nonlinear scoring function, as outlined below:
F N L i = 1 1 + x / x i m
Here, x represents the observed value of the indicator at each sampling point, xi denotes the mean value of the indicator across all sampling points, and m is the direction parameter distinguishing the desirability of the indicator. Specifically, m = −2.5 signifies a “more is better” scenario (where higher indicator values enhance soil quality), whereas m = 2.5 indicates a “less is better” scenario (where lower indicator values improve soil quality). The mean xi is derived from the indicator values of 21 samples, ensuring that the standardization reflects the actual data distribution within the study area.
S Q I = i = 1 n W i × F N L i
Here, n = 14 (representing the 14 selected indicators), Wi denotes the weight derived from the principal component analysis (PCA), and Fnl represents the nonlinear score of the i-th indicator. The Soil Quality Index (SQI) ranges from 0 to 1, with higher values indicating superior soil quality.

2.3.3. Maize Yield

Maize was harvested from each plot at maturity, then dried, threshed, and weighed.

2.3.4. Bioinformatics

Total community genomic DNA was extracted using the E.Z.N.A™ Mag-Bind Soil DNA Kit (Omega, M5635-02, Norwalk, CT, USA) according to the manufacturer’s protocol. DNA concentration was quantified with a Qubit 4.0 fluorometer (Thermo, Waltham, MA, USA) to confirm the extraction of sufficient high-quality genomic DNA. The V3–V4 region of the bacterial 16S rDNA gene was amplified using the Illumina NovaSeq platform with primers 341F/805R (5′-CCTACGGGNGGCWGCAG-3′/5′-GACTACHVGGGTATCTAATCC-3′). Similarly, the fungal ITS3/ITS4 region was sequenced with primers ITS3/ITS4 (5′-GCATCGATGAAGAACGCAGC-3′/5′-TCCTCCGCTTATTGATATGC-3′). Raw sequence data underwent quality filtering and merging using Fastp (v0.20.0) and FLASH (v1.2.11), respectively. Sequences were clustered at a 97% similarity threshold using UPARSE (v11.0). Taxonomic assignments for bacterial and fungal species were performed against the SILVA_v138 and UNITE_v8.0 databases, respectively, using the RDP Classifier (v2.13) with a 70% alignment threshold. Sequence analysis was conducted using QIIME2 and the ggplot2 (v3.5.0) package in R (v4.4.1). Raw microbial data have been deposited in the NCBI SRA under accession numbers PRJNA1242996 and PRJNA1243014.

2.4. Data Statistical Analysis and Visualization

All statistical analyses in this study were conducted using SPSS 27.0 (IBM, New York, NY, USA) with one-way analysis of variance (ANOVA) at a significance level of p < 0.05. Data represent mean values of soil layers from maize fields across three drought levels—low drought (LD, 16.37–22.30%), moderate drought (MD, 30.54–38.10%), and high drought (HD, 47.49–50.00%)—as defined by the Irrigation Water Deficit Index (IWDI). Normality and homogeneity of variance were assessed for all data. One-way ANOVA (p < 0.05) was employed to evaluate variations in soil properties, the Soil Quality Index (SQI), and maize yield, while random forest analysis was used to examine the influence of 14 soil factors on the SQI. Microbial community α-diversity was quantified using the Chao [39], Shannon [40], Simpson [41], and Ace indices [42], calculated at the OTU level with MOTHUR v1.30. The β-diversity of the microbial communities was analyzed using the vegan package in R v4.4.1, with principal coordinate analysis (PCoA) performed based on Bray–Curtis dissimilarity. Graphs and charts were generated using Origin 2022 and R 4.4.3.
To explore the relationships between microbial communities and environmental factors (e.g., pH, soil organic matter (SOM), available potassium (AK)), redundancy analysis (RDA) was conducted using the vegan and ggplot2 packages in R v4.4.1 to assess the associations between environmental variables and taxonomic composition at the genus level [43]. FAPROTAX [44] was utilized to predict the functional profiles of soil bacterial and fungal communities. The Mantel test was applied to examine the correlations between soil bacterial and fungal communities and soil properties.

3. Results

3.1. Irrigation Water Deficit Index (IWDI)

Table 1 displays the Irrigation Water Deficit Index (IWDI) for each plot during the maize growing season (April to October 2023), reflecting the long-term influence of site-specific irrigation practices maintained over multiple years. Based on the IWDI, Wenquan and Yining were categorized as low drought (LD), Tuoli and Chaxian as moderate drought (MD), and Qinghe, Wushi, and Altai as high drought (HD). Subsequent analyses were performed according to these drought classifications (Table 1).
The rationality of grouping based on these criteria can be corroborated by the correlation analysis between the physicochemical properties of the soil in each plot and the soil microbial diversity indices (Figure A2).

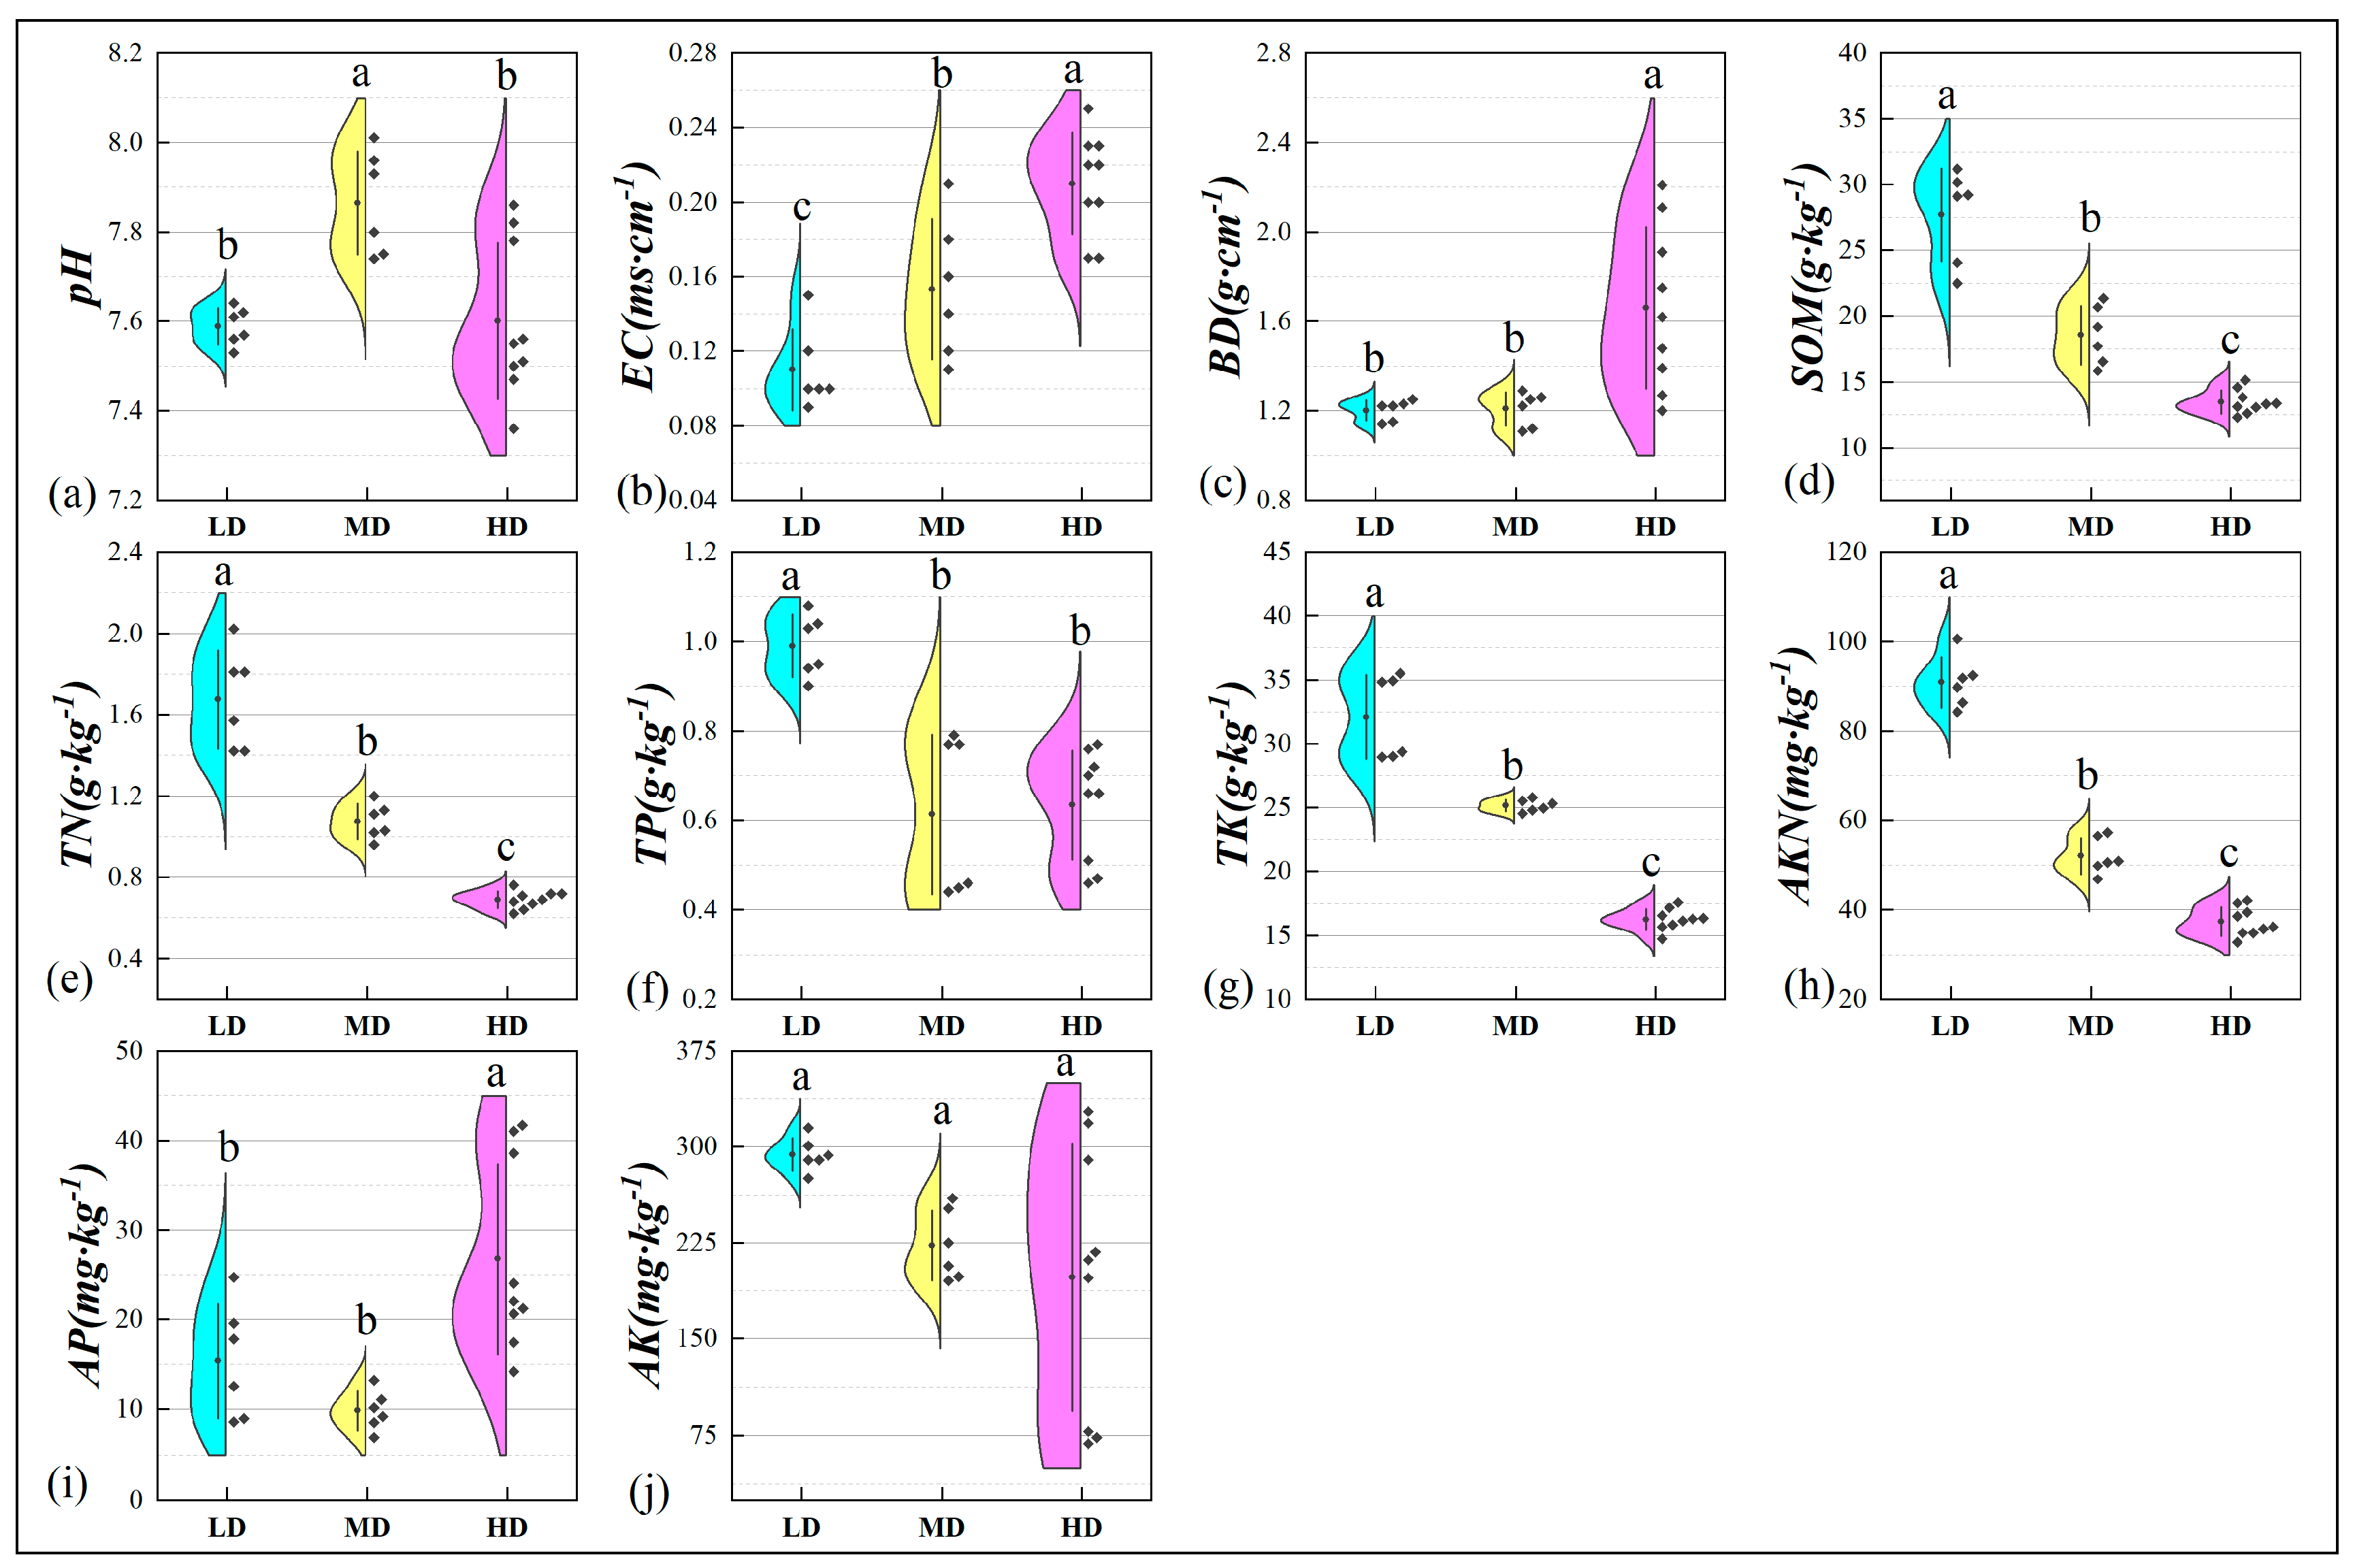
3.2. Basic Soil Properties

3.2.1. Physical Parameters

Compared to low drought (LD) and moderate drought (MD), high drought (HD) showed significantly elevated soil electrical conductivity (EC) and bulk density (BD) (Figure 2b,c), suggesting that increasing drought severity, as measured by the Irrigation Water Deficit Index (IWDI), markedly enhances soil salinity and compaction. With rising IWDI values, soil EC increased from 0.09 mS·cm−1 under LD to 0.25 mS·cm−1 under HD, while soil BD rose from 1.11 g·cm−3 under LD to 2.21 g·cm−3 under HD. Gray areas and black diamond markers indicate the data distribution range and degree of variation, respectively.

3.2.2. Chemical Parameters

Soil pH rose from 7.36 under LD to 8.01 under HD, whereas soil organic matter (SOM) declined from 31.15 g·kg−1 to 12.30 g·kg−1, and major nutrients (TN, TP, TK, AKN, AP, AK) exhibited significant reductions (Figure 2d–j). Overall, increasing Irrigation Water Deficit Index (IWDI) values correlated with reduced soil nutrient availability and organic matter content, with effects most pronounced under HD conditions.

3.3. Characteristics of Soil Microbial Communities

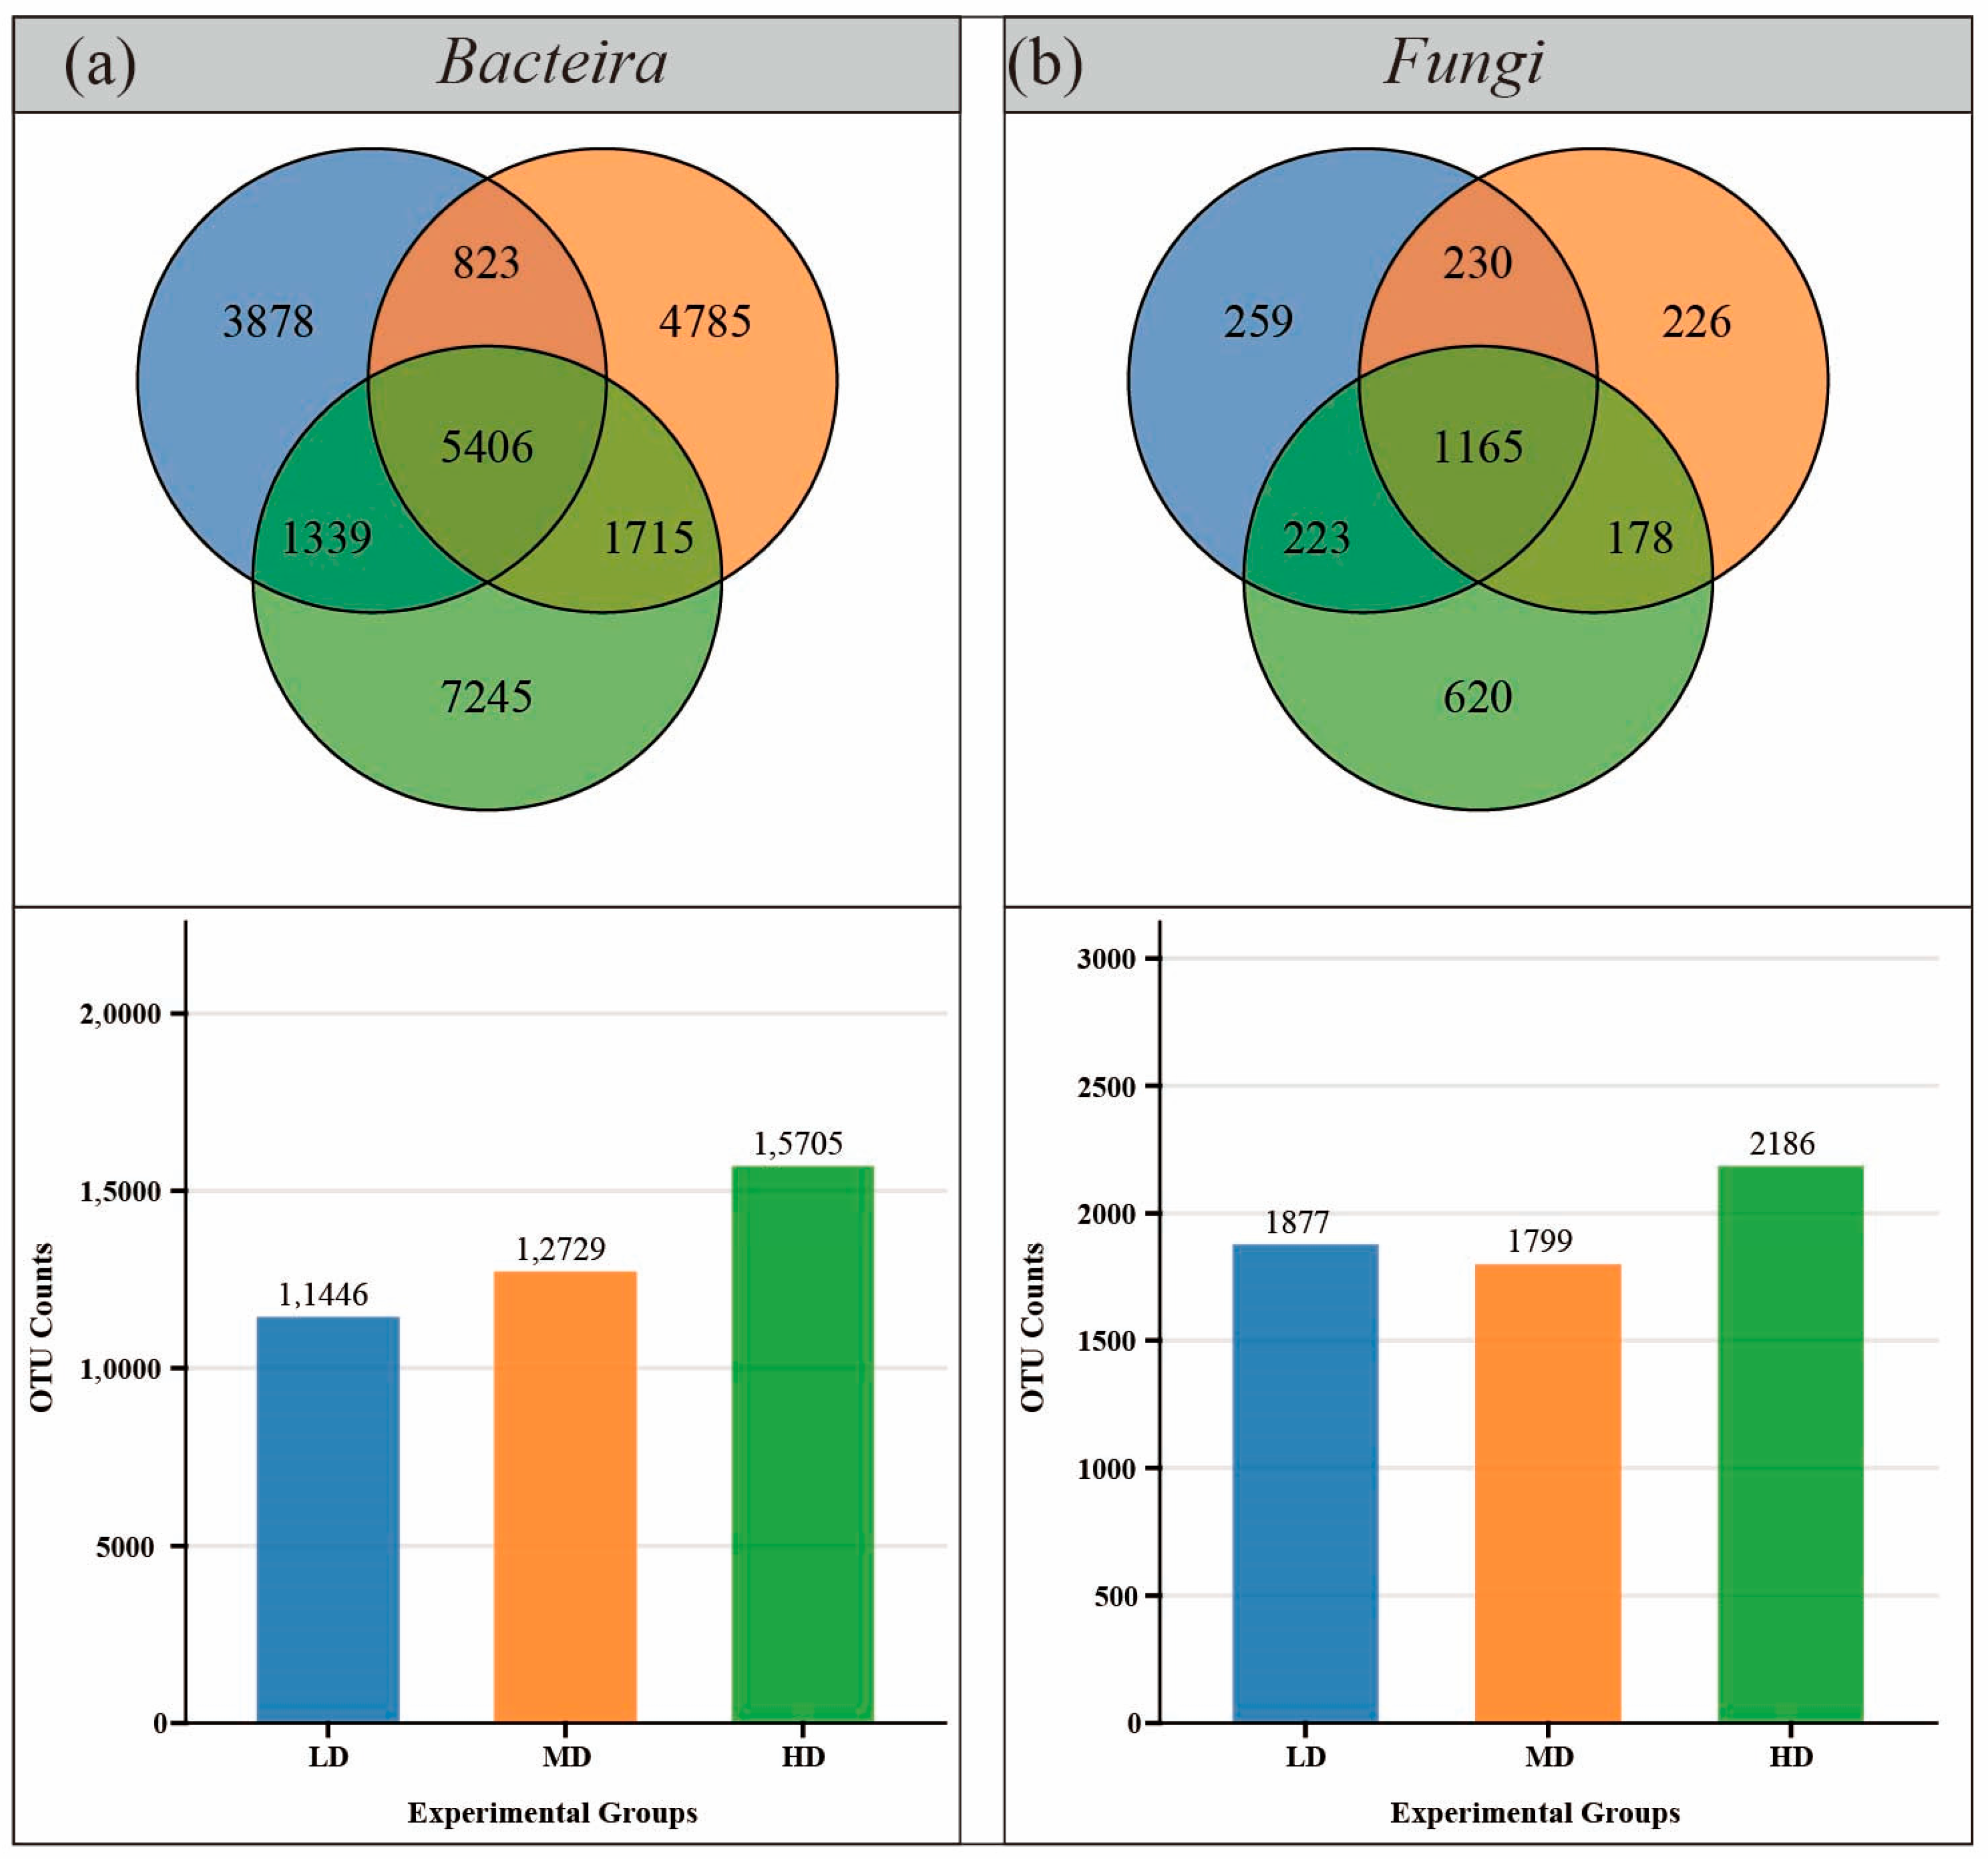
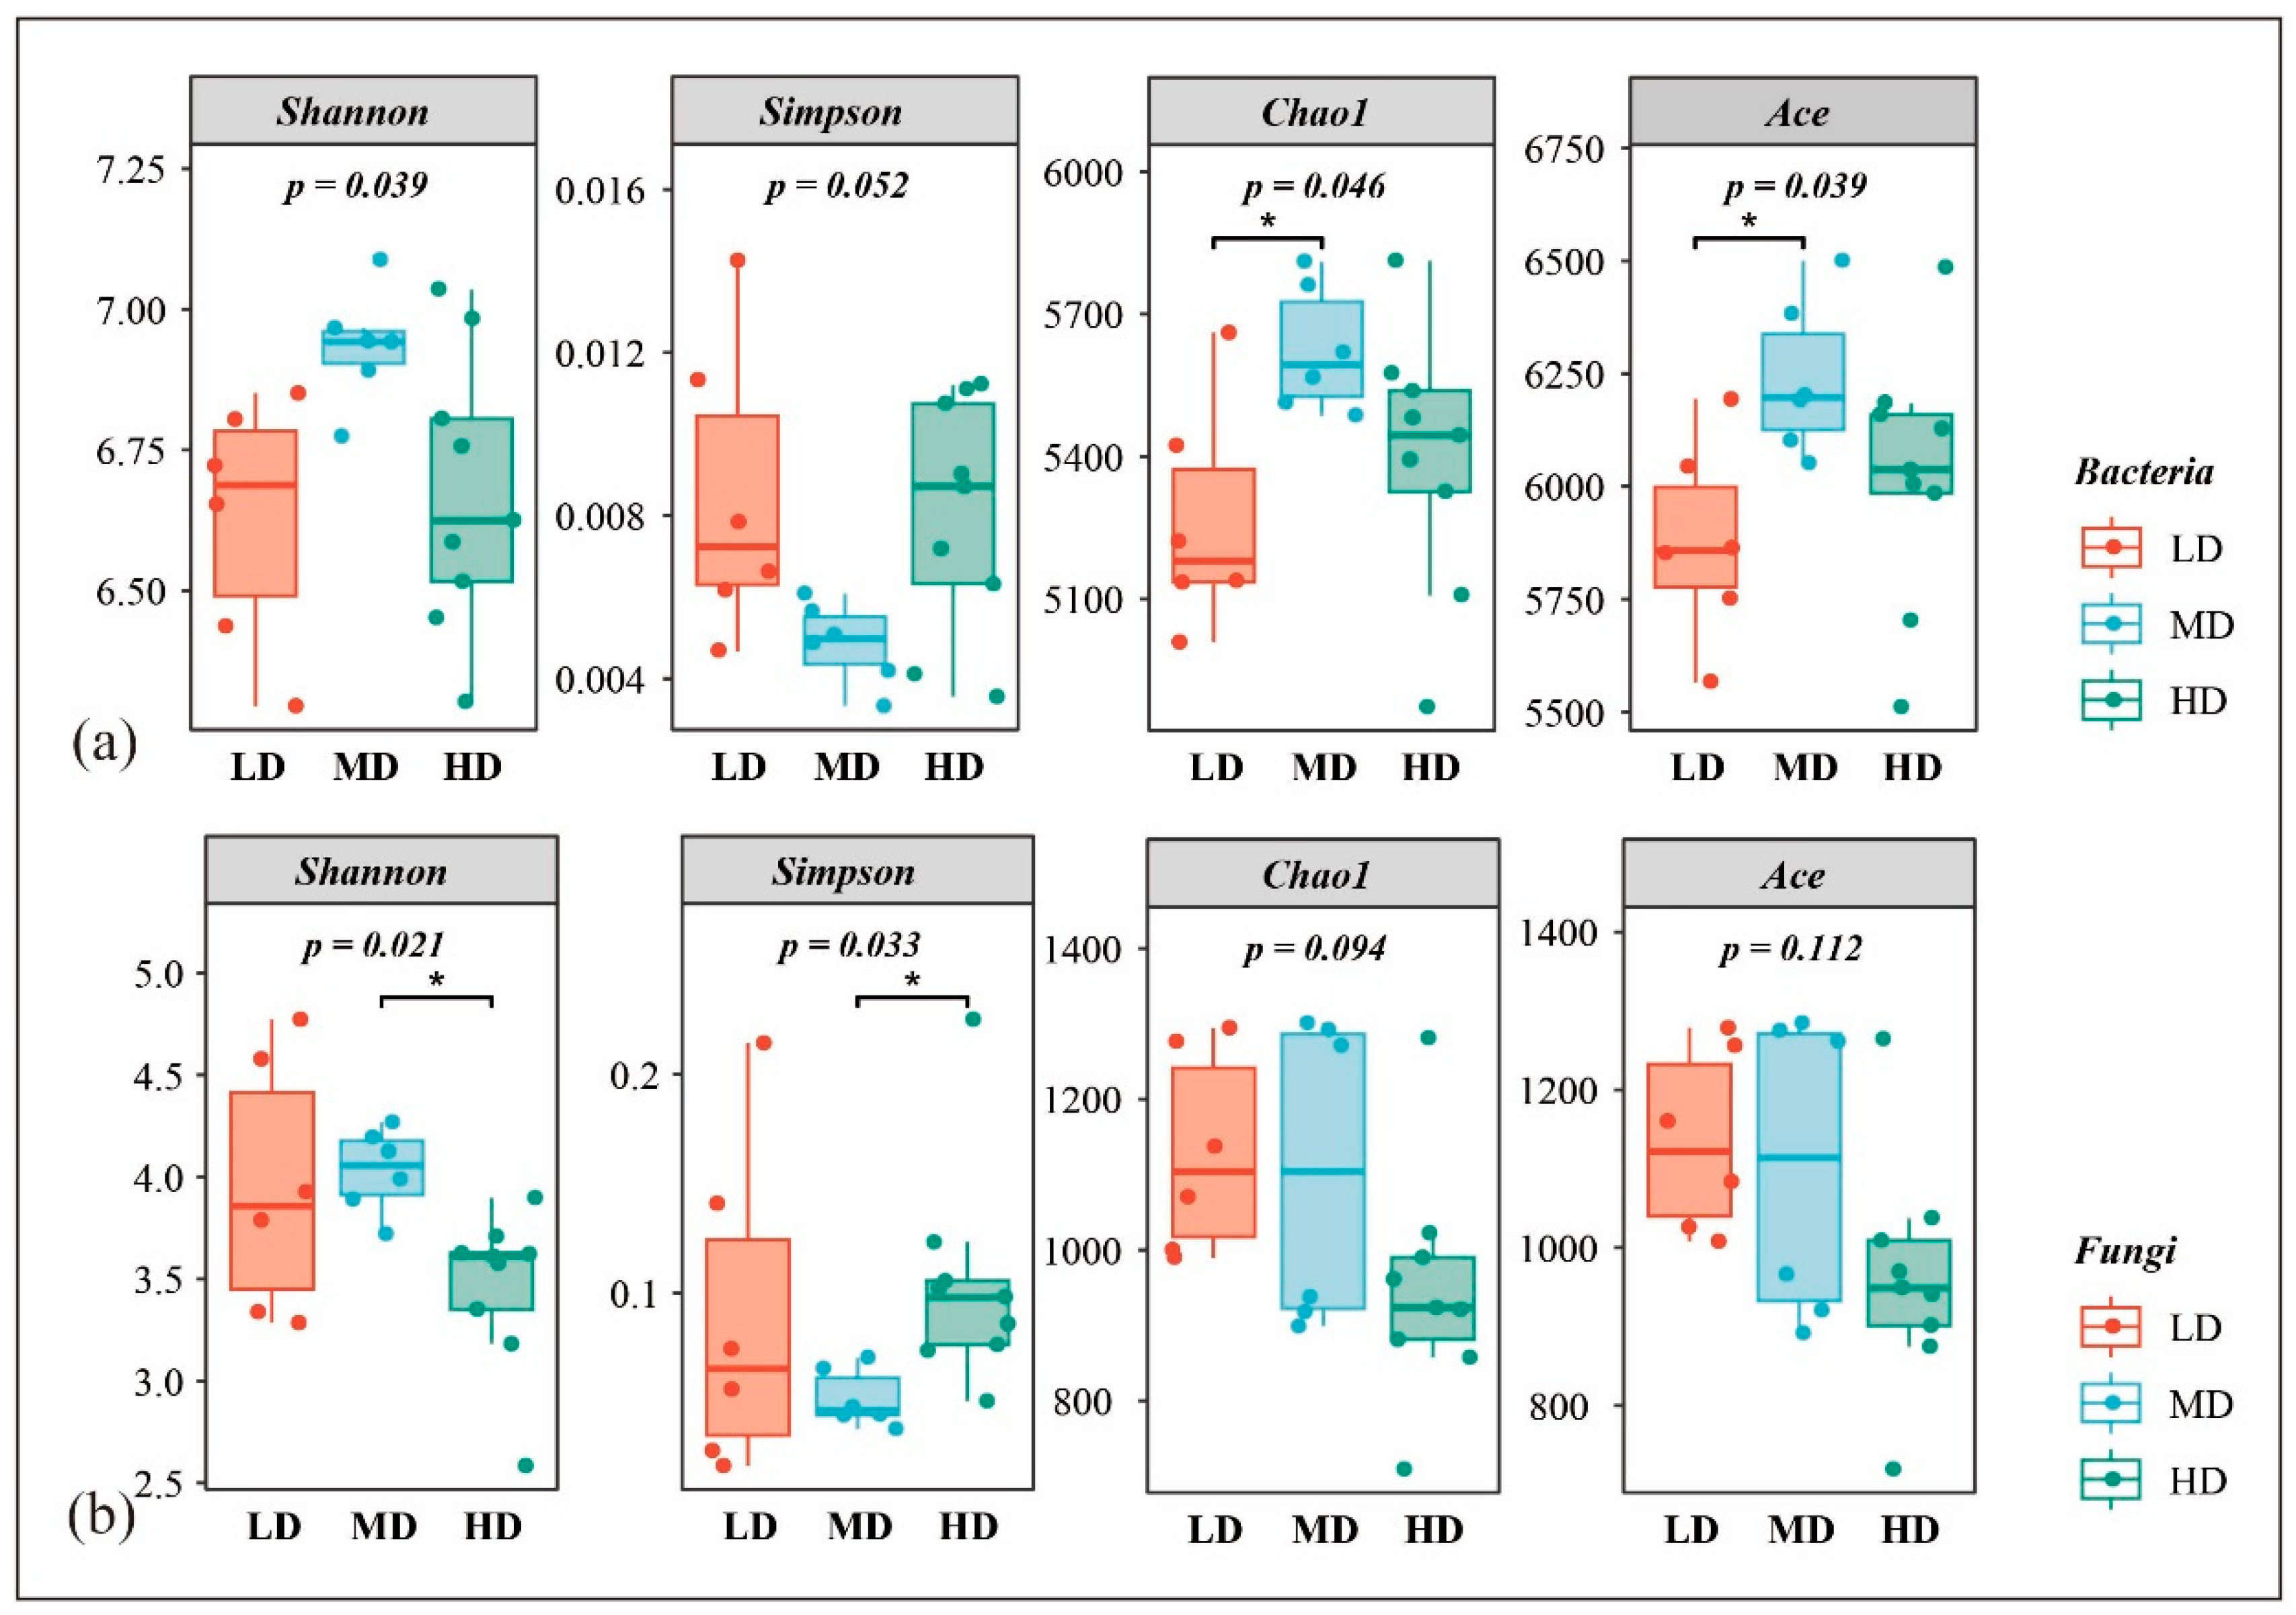
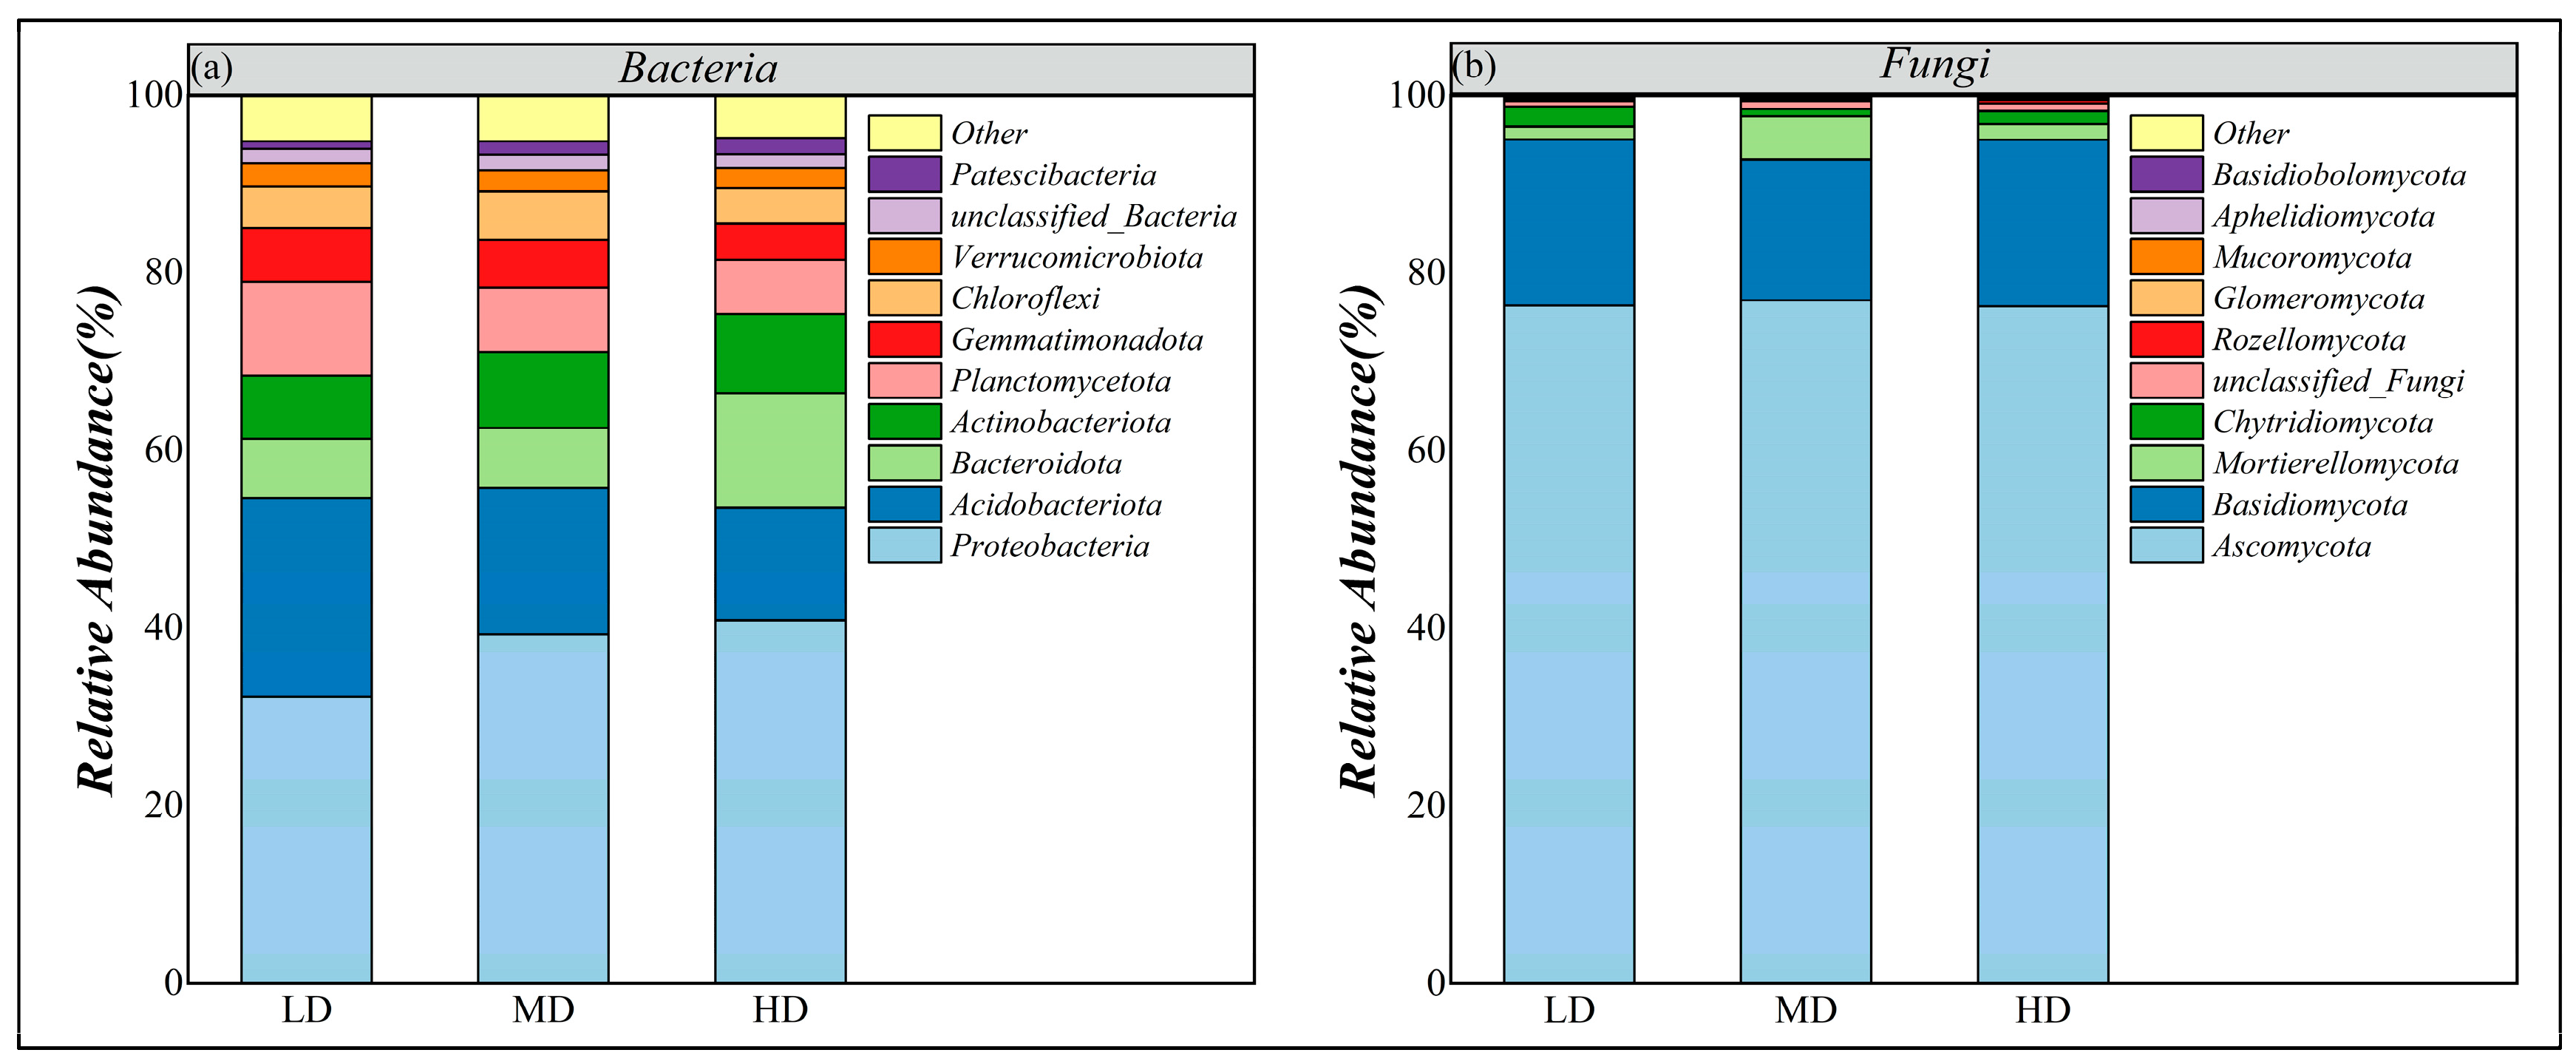
3.3.1. Species Diversity and Composition

This study evaluated soil microbial diversity and richness in maize fields across three irrigation deficit levels—low drought (LD), moderate drought (MD), and high drought (HD)—using the Shannon, Simpson, Chao1, and Ace indices (Figure 3). Significant variation in microbial diversity indices was observed across these drought levels (Figure 3). Mean bacterial operational taxonomic units (OTUs) per soil sample were 5723 (LD), 6365 (MD), and 5235 (HD), while fungal OTUs averaged 934 (LD), 900 (MD), and 729 (HD) per sample (Figure A1). Relative to LD, MD significantly increased bacterial Chao1 and Ace indices by 6.42% and 5.77%, respectively (p < 0.05; Figure 3a), indicating enhanced richness. Conversely, HD significantly reduced the fungal Shannon index by 14.11% and increased the Simpson index by 50.45% compared to MD (p < 0.05; Figure 3b), reflecting diminished diversity. While the bacterial Shannon and Simpson indices, as well as the fungal Chao1 and Ace indices, showed no significant differences across the drought gradient, these shifts, quantified via FAPROTAX, suggest reduced fungal decomposition activity under HD, potentially limiting soil carbon cycling, while bacterial nitrate reduction (1.19–1.53%) may enhance nitrogen availability, offering a compensatory mechanism for maize growth under water stress.
The dominant bacterial groups in the soil were Proteobacteria, Acidobacteriota, Bacteroidota, Actinobacteriota, Planctomycetota, and Gemmatimonadota, which collectively accounted for over 80% of the total bacterial population (Figure 4a; Table A1). Compared to low drought (LD), moderate drought (MD) significantly increased the average relative abundance of Proteobacteria from 32.31% to 39.34% and that of Patescibacteria from 0.81% to 1.51%. In contrast, it significantly decreased the average relative abundance of Acidobacteriota from 22.60% to 16.51%, Planctomycetota from 10.24% to 7.25%, and Gemmatimonadota from 6.12% to 5.38% (Figure 4a; Table A1). Compared to low drought (LD), high drought (HD) significantly increased the average relative abundance of Proteobacteria from 32.31% to 40.89%, Bacteroidota from 6.84% to 12.89%, and Patescibacteria from 0.81% to 1.84%. Conversely, it significantly decreased the average relative abundance of Acidobacteriota from 20.60% to 12.73%, Planctomycetota from 10.24% to 6.18%, and Gemmatimonadota from 6.12% to 4.07% (Figure 4a; Table A1).
In the soil fungal population, Ascomycota, Basidiomycota, Mortierellomycota, and Chytridiomycota were the dominant groups, with their combined relative abundance exceeding 96% of the total fungal population (Figure 4b; Table A2). Compared to low drought (LD), moderate drought (MD) significantly increased the average relative abundance of Mortierellomycota in the soil, from 1.00% to 4.66% (Figure 4b; Table A2). Compared to low drought (LD), high drought (HD) significantly decreased the average relative abundance of Aphelidiomycota in the soil, from 0.05% to 0.04% (Figure 4b; Table A2). The results indicate that the increase in drought severity (IWDI) had a significantly greater impact on the composition of soil bacterial communities in maize fields in arid regions than on soil fungal communities (Table A1 and Table A2).

3.3.2. Inter-Species Differences

Based on PCoA analysis, the composition of soil bacterial communities in maize fields significantly changed under different drought levels (IWDI). PCoA1 and PCoA2 explained 22.3% and 14.2% of the bacterial community variation, respectively (Figure 5a). Significant differences were observed in bacterial communities across different drought levels. However, in fungal communities, PCoA1 and PCoA2 explained 22.11% and 14.98% of the community variation, respectively (Figure 5b). Although some differences existed in fungal communities across different drought levels, their overall similarity was relatively high (Figure 5b).
Based on the PCoA principal component analysis results of soil microorganisms, bacterial and fungal communities exhibited significantly different distribution patterns across different agricultural drought levels (low, medium, high). Bacterial samples were more dispersed, indicating higher sensitivity to environmental changes, while fungal samples showed greater overlap, reflecting a higher degree of niche overlap (Figure 5).

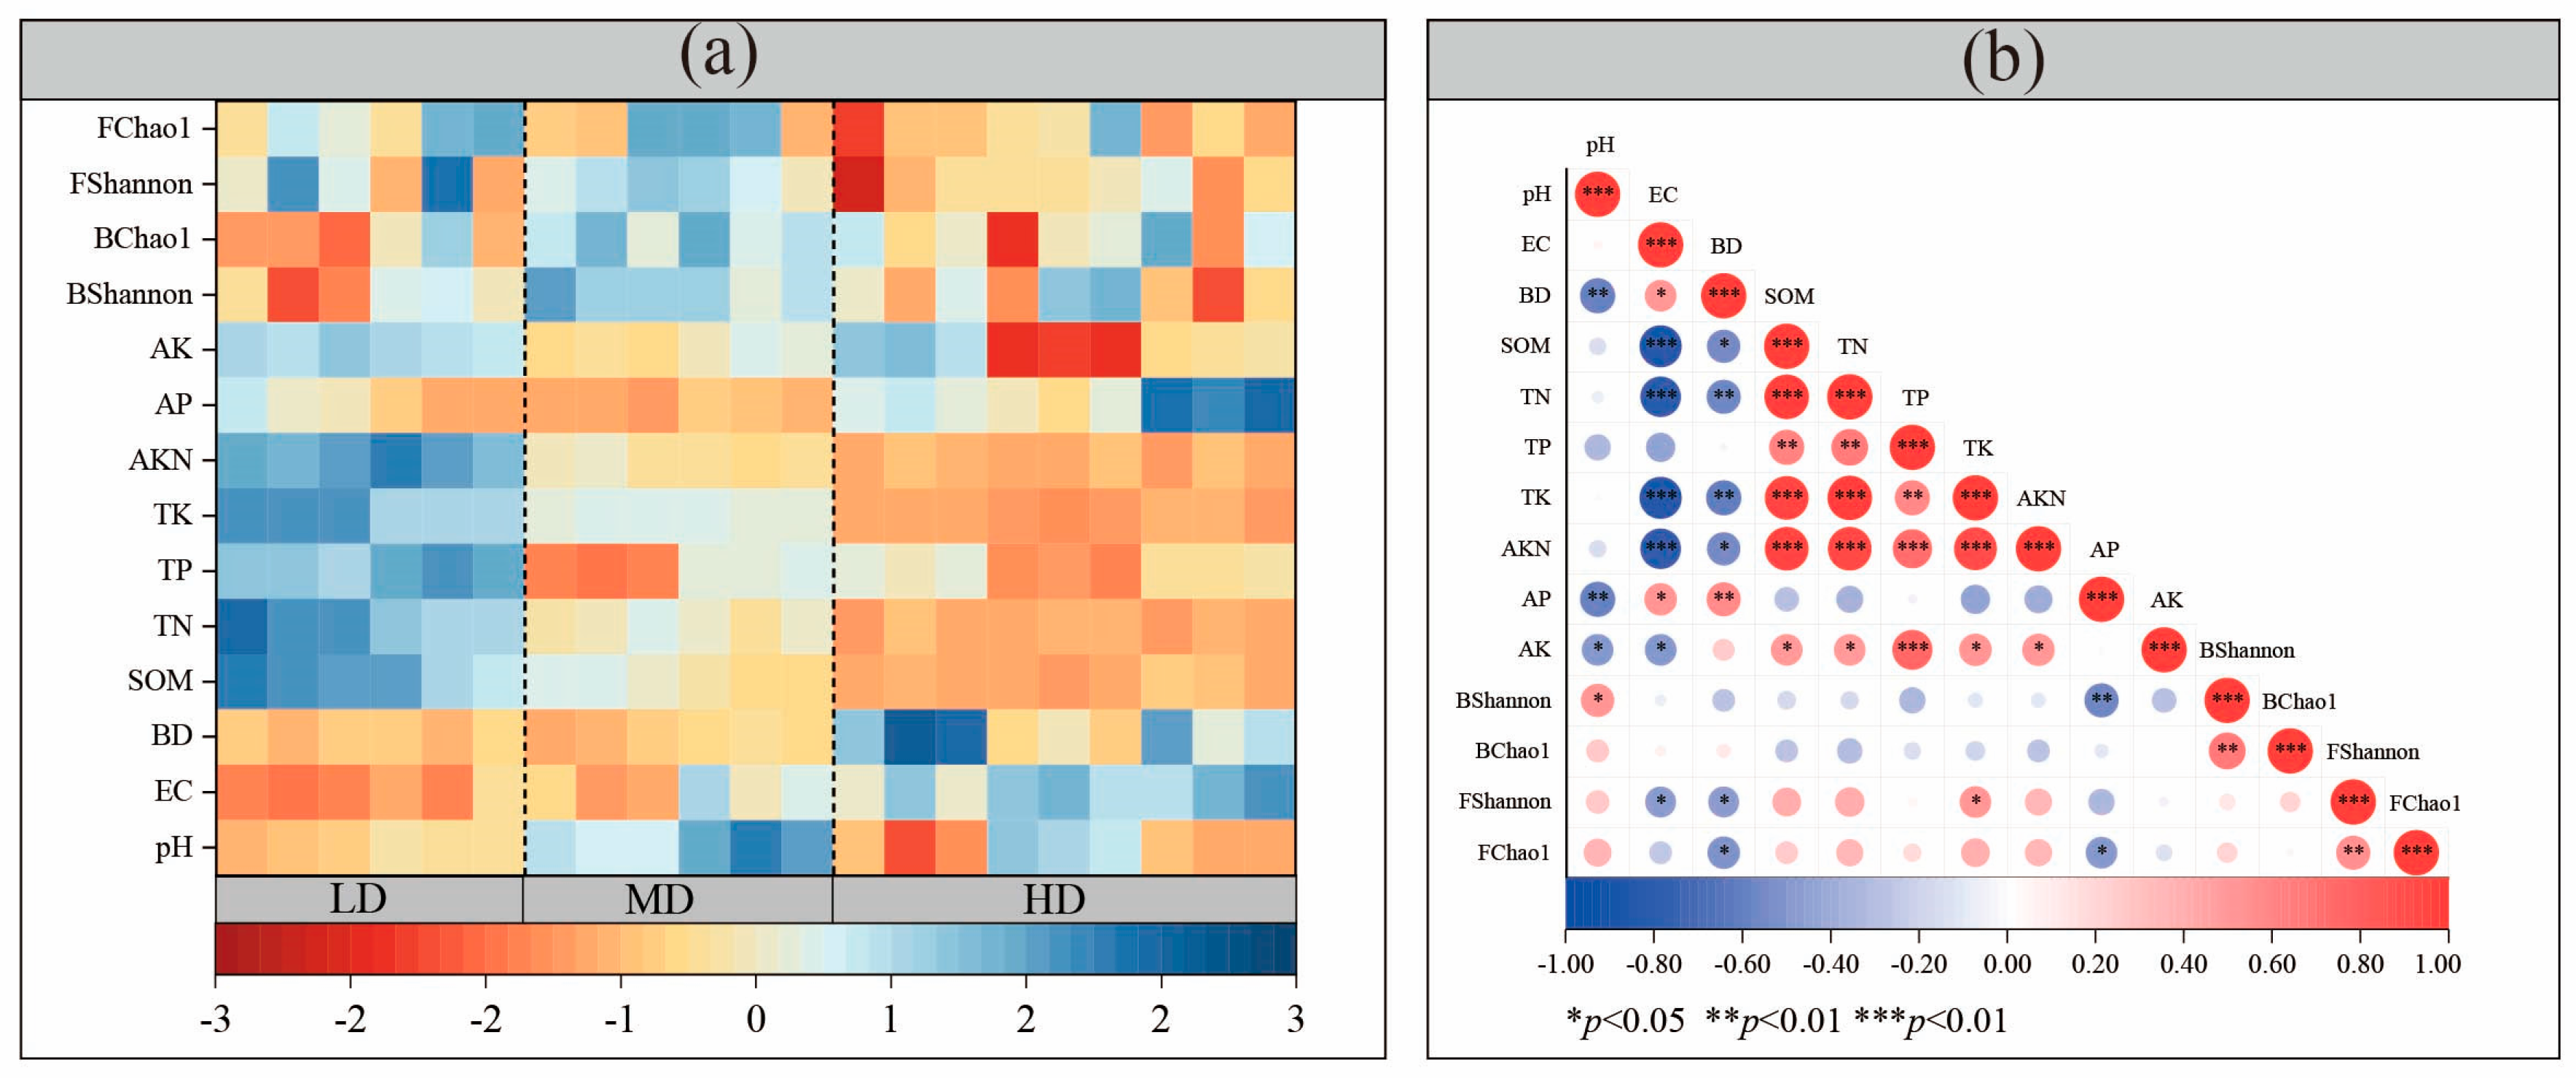
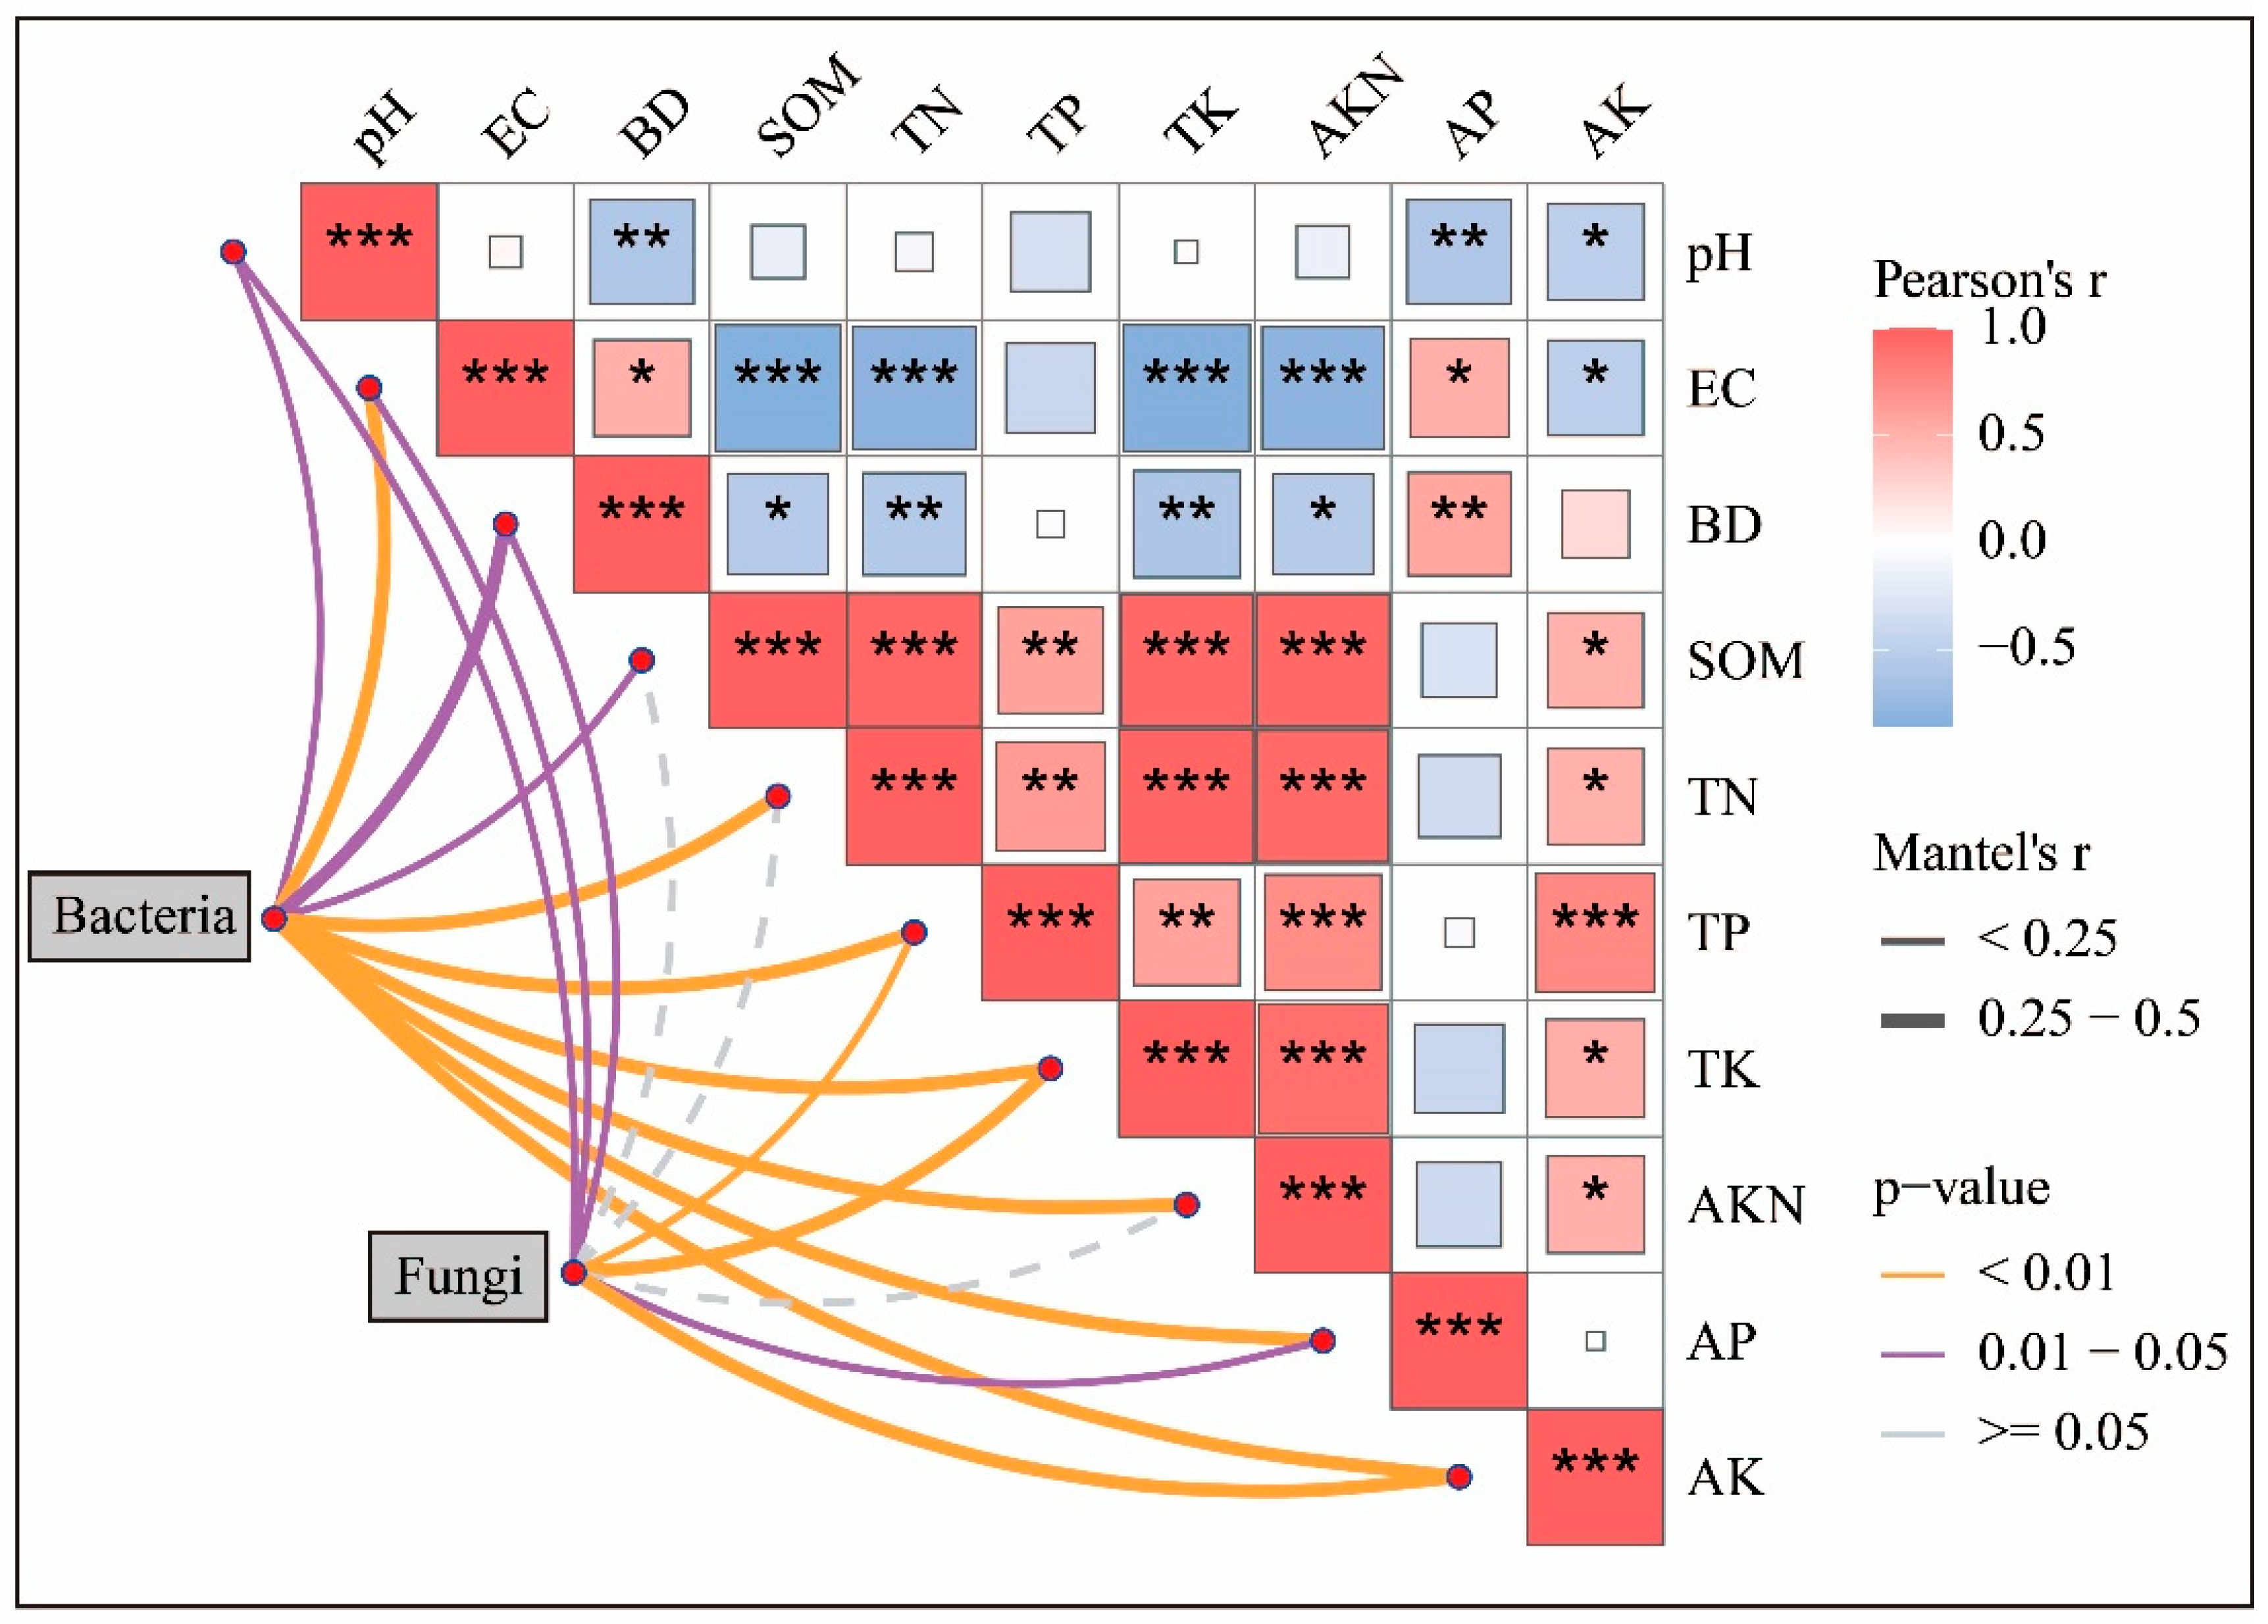
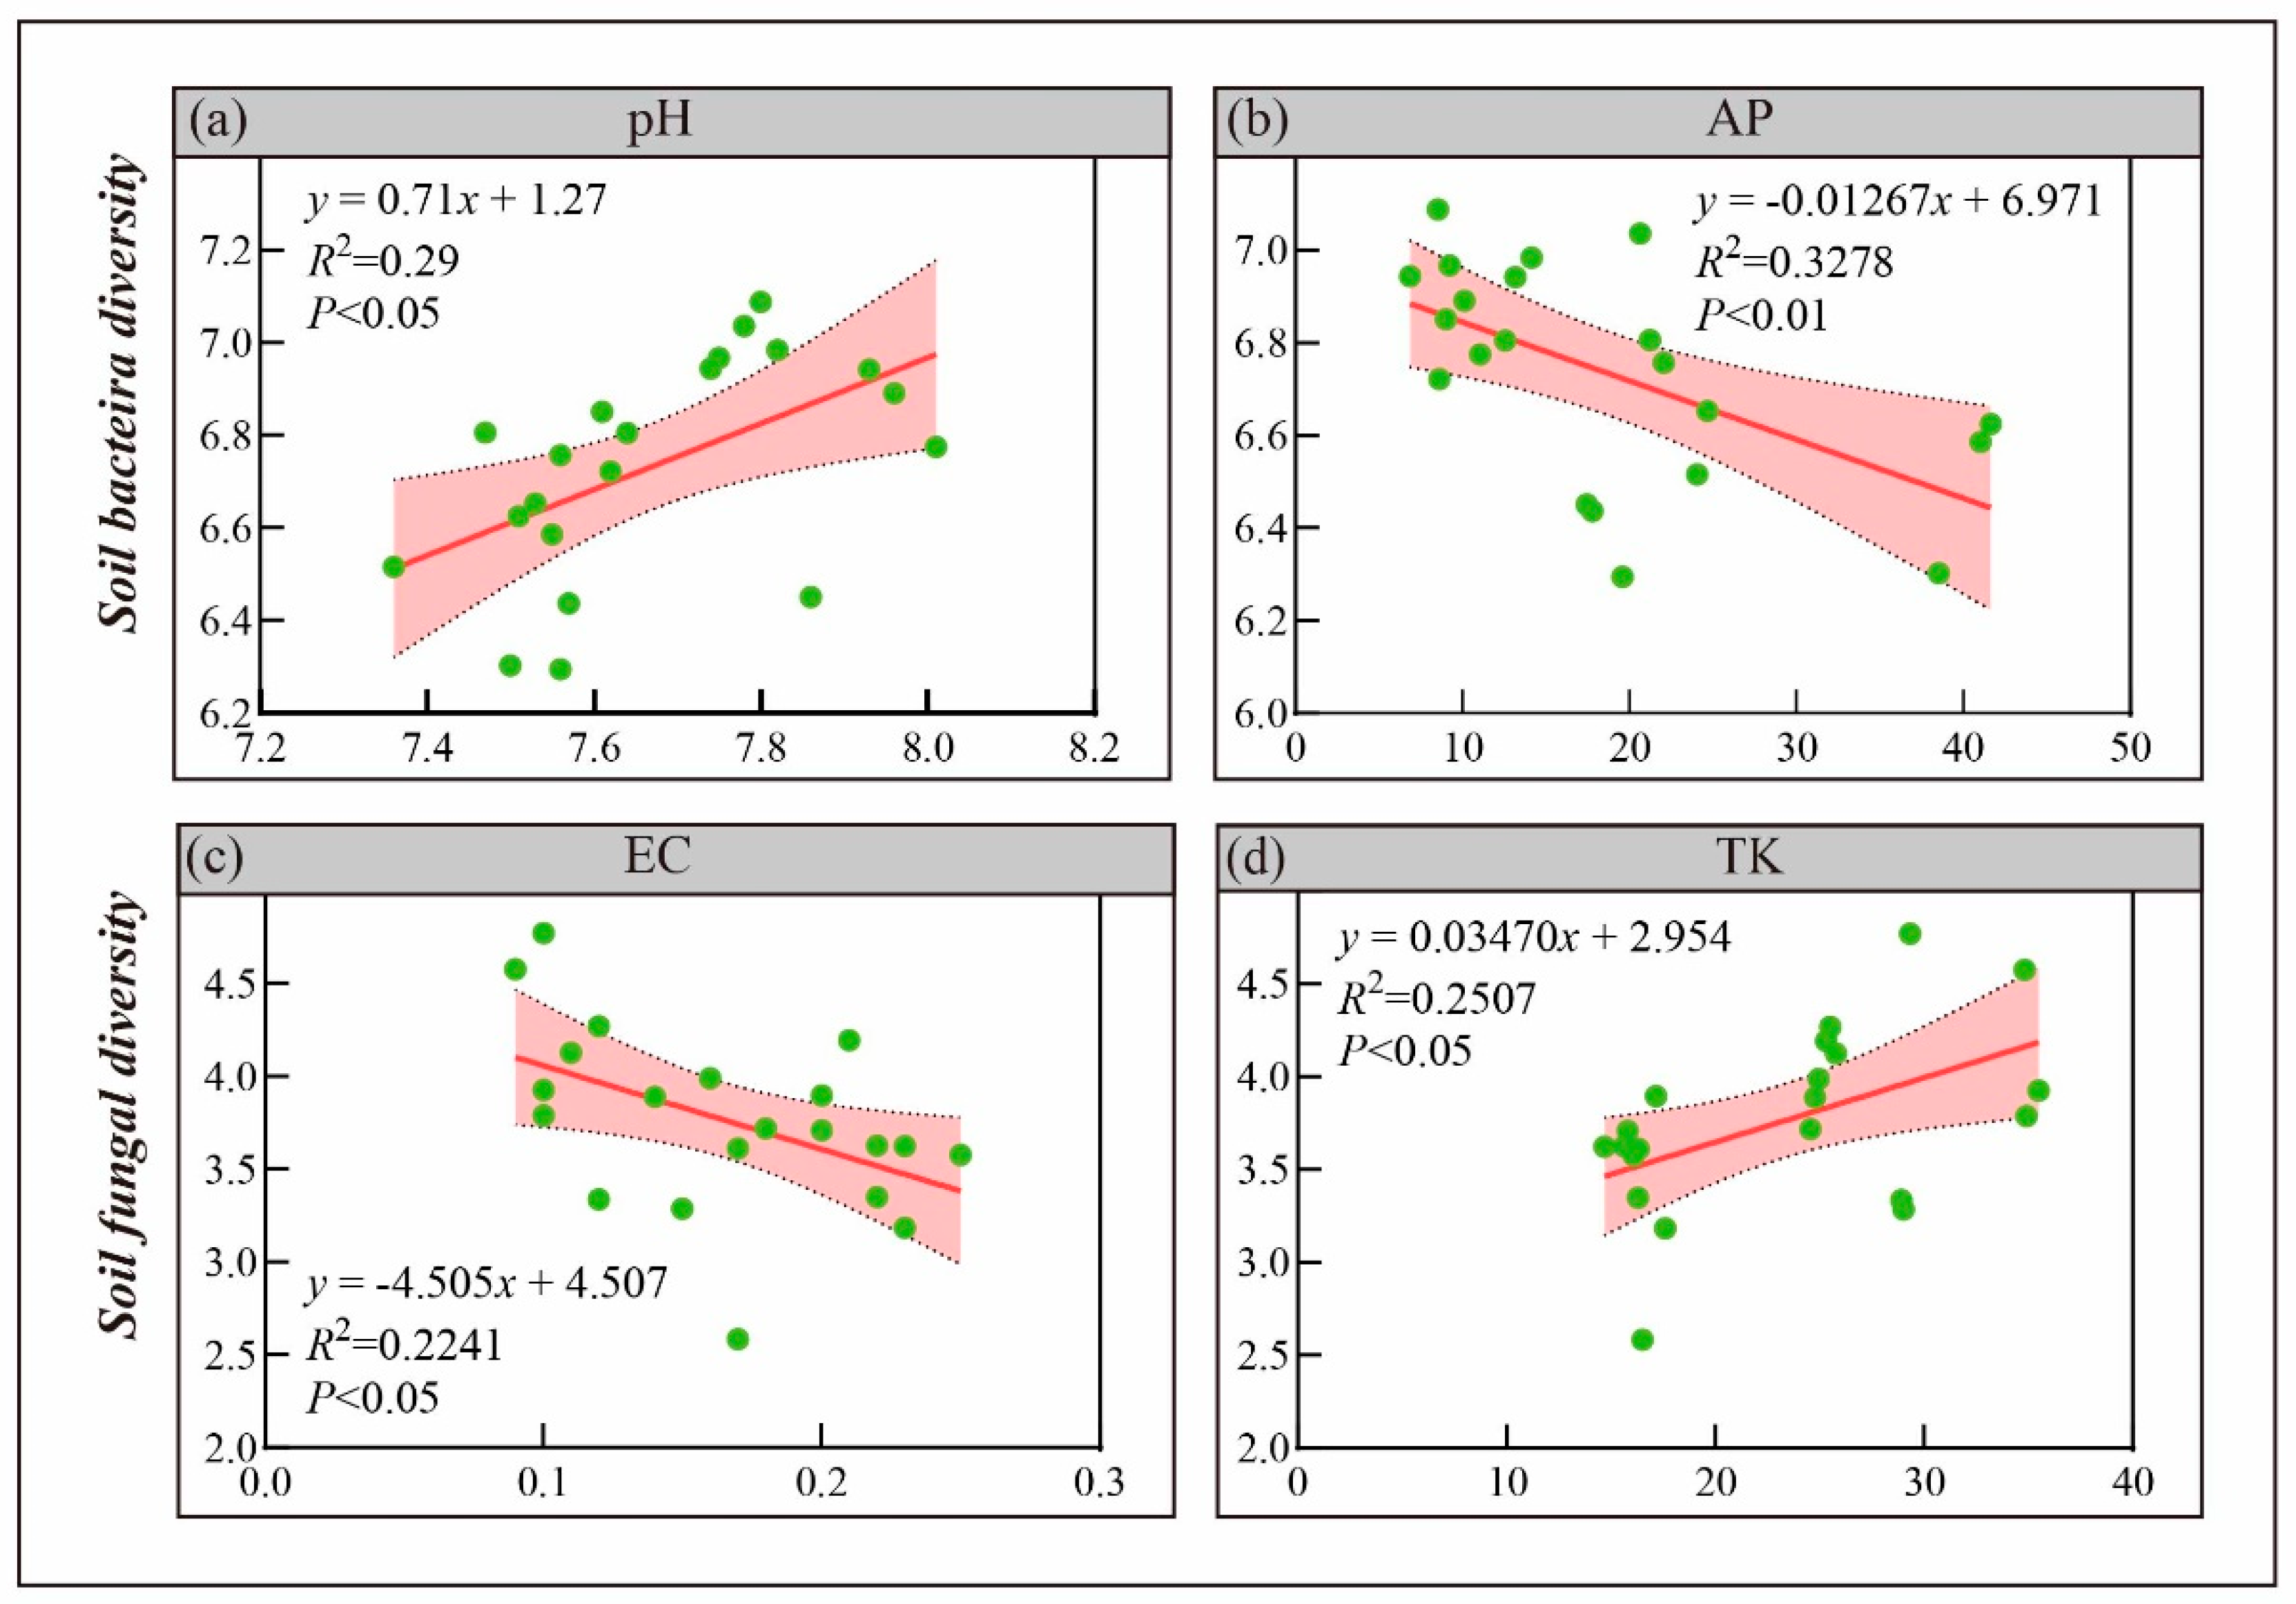
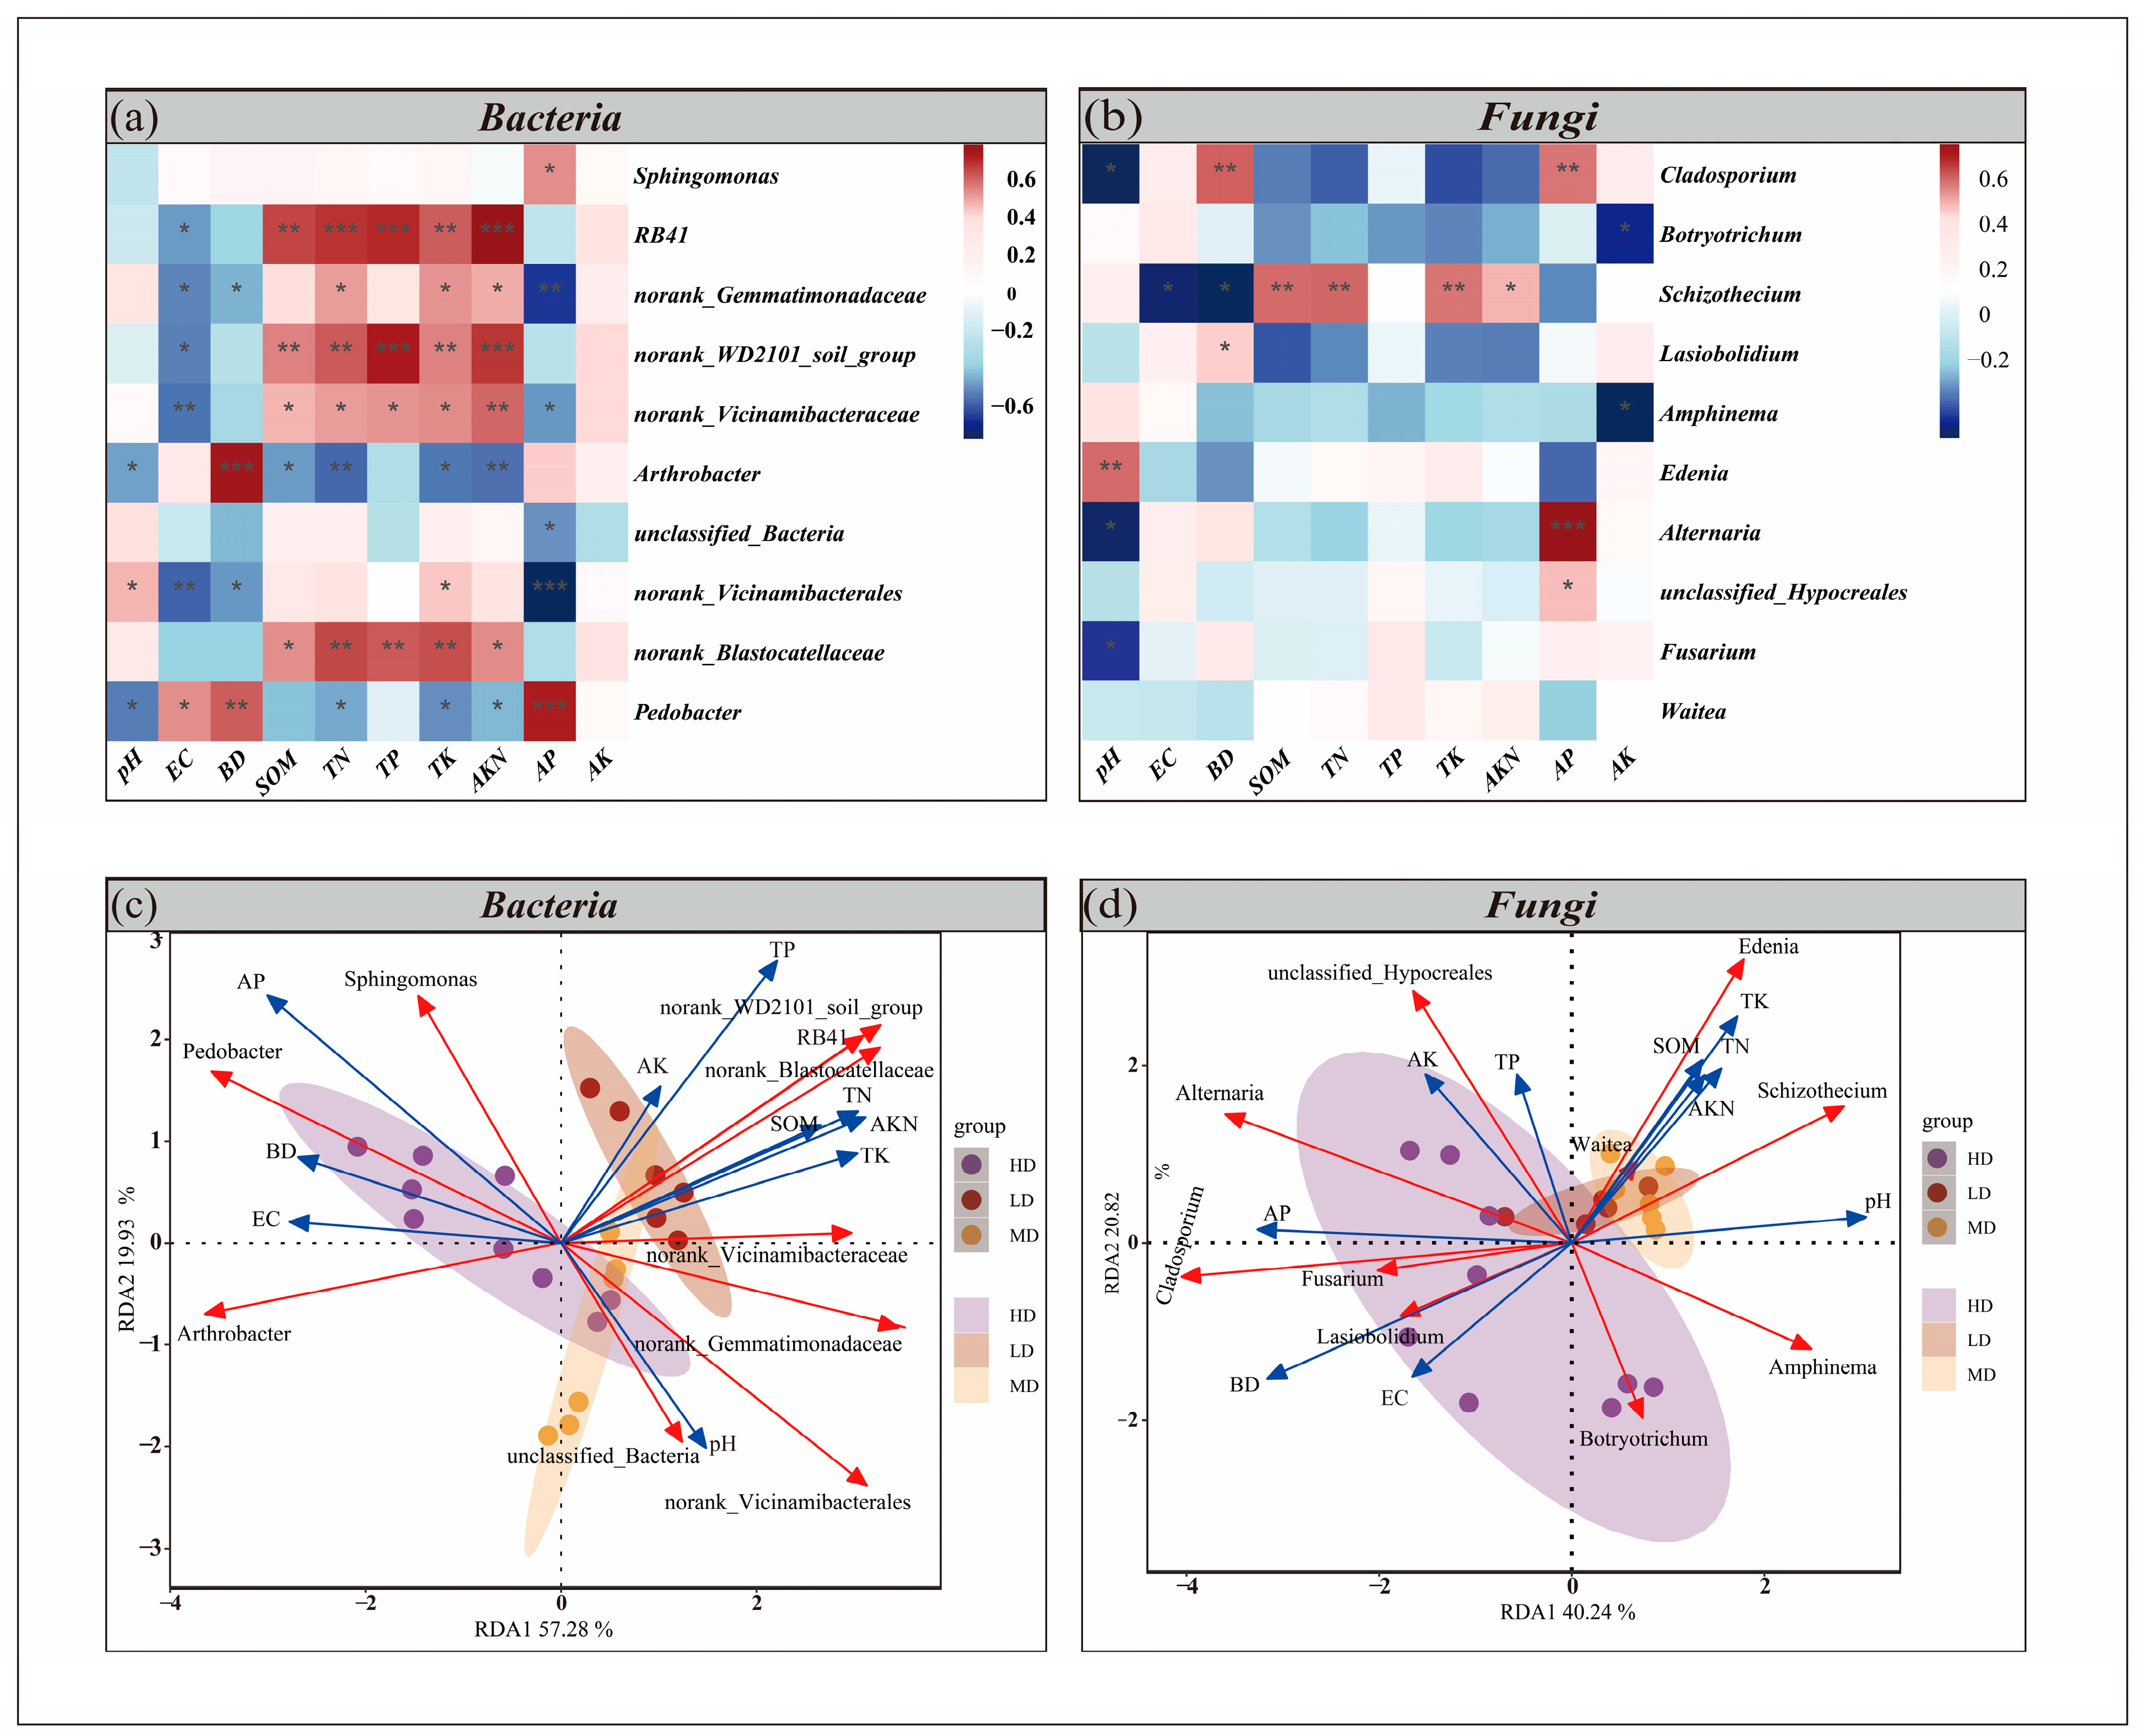
3.3.3. Relationship Between Soil Properties and Microorganisms

The Mantel test results indicated that all environmental factors significantly influenced bacterial community composition. However, fungal community composition was only significantly correlated with pH, EC, BD, TP, TK, AP, and AK (Figure 6). Significant correlations existed among environmental variables. For example, soil pH was significantly negatively correlated with all other environmental factors, while EC was significantly positively correlated only with BD and AP, and significantly negatively correlated with other environmental factors. A heatmap of correlations between dominant species at the genus level and environmental factors showed that, under different drought levels (IWDI), the dominant bacterial species in maize field soils in arid regions were more significantly affected by environmental factors. The linear regression analysis results showed that bacterial diversity (Shannon index) was negatively correlated with soil pH and positively correlated with soil available potassium (AP), while fungal diversity (Shannon index) was positively correlated with soil total potassium (TK). It was negatively correlated with soil electrical conductivity (EC) (Figure 7).
At the genus level, RDA1 and RDA2 explained 57.28% and 19.93% of the bacterial community variation, respectively (Figure 8c). Most dominant bacteria were significantly positively correlated with soil organic matter (SOM), total nitrogen (TN), total phosphorus (TP), total potassium (TK), and alkali-hydrolyzable nitrogen (AKN), while significantly negatively correlated with other environmental factors. For example, RB41 showed a highly significant positive correlation with SOM, TK, TN, and TP, and a significant negative correlation with EC. RDA1 and RDA2 explained 40.24% and 20.82% of the fungal community variation, respectively (Figure 8d). Among dominant fungi, only Cladosporium and Schizothecium showed relatively significant correlations with environmental factors. Additionally, Botryotrichum and Amphinema were significantly negatively correlated only with soil available potassium (AK), Lasiobolidium was significantly positively correlated only with soil bulk density (BD), and Edenia was highly significantly positively correlated only with soil pH. Therefore, drought severity (IWDI) primarily affects dominant bacteria in maize field soils in arid regions by altering environmental conditions (Figure 8a,b).

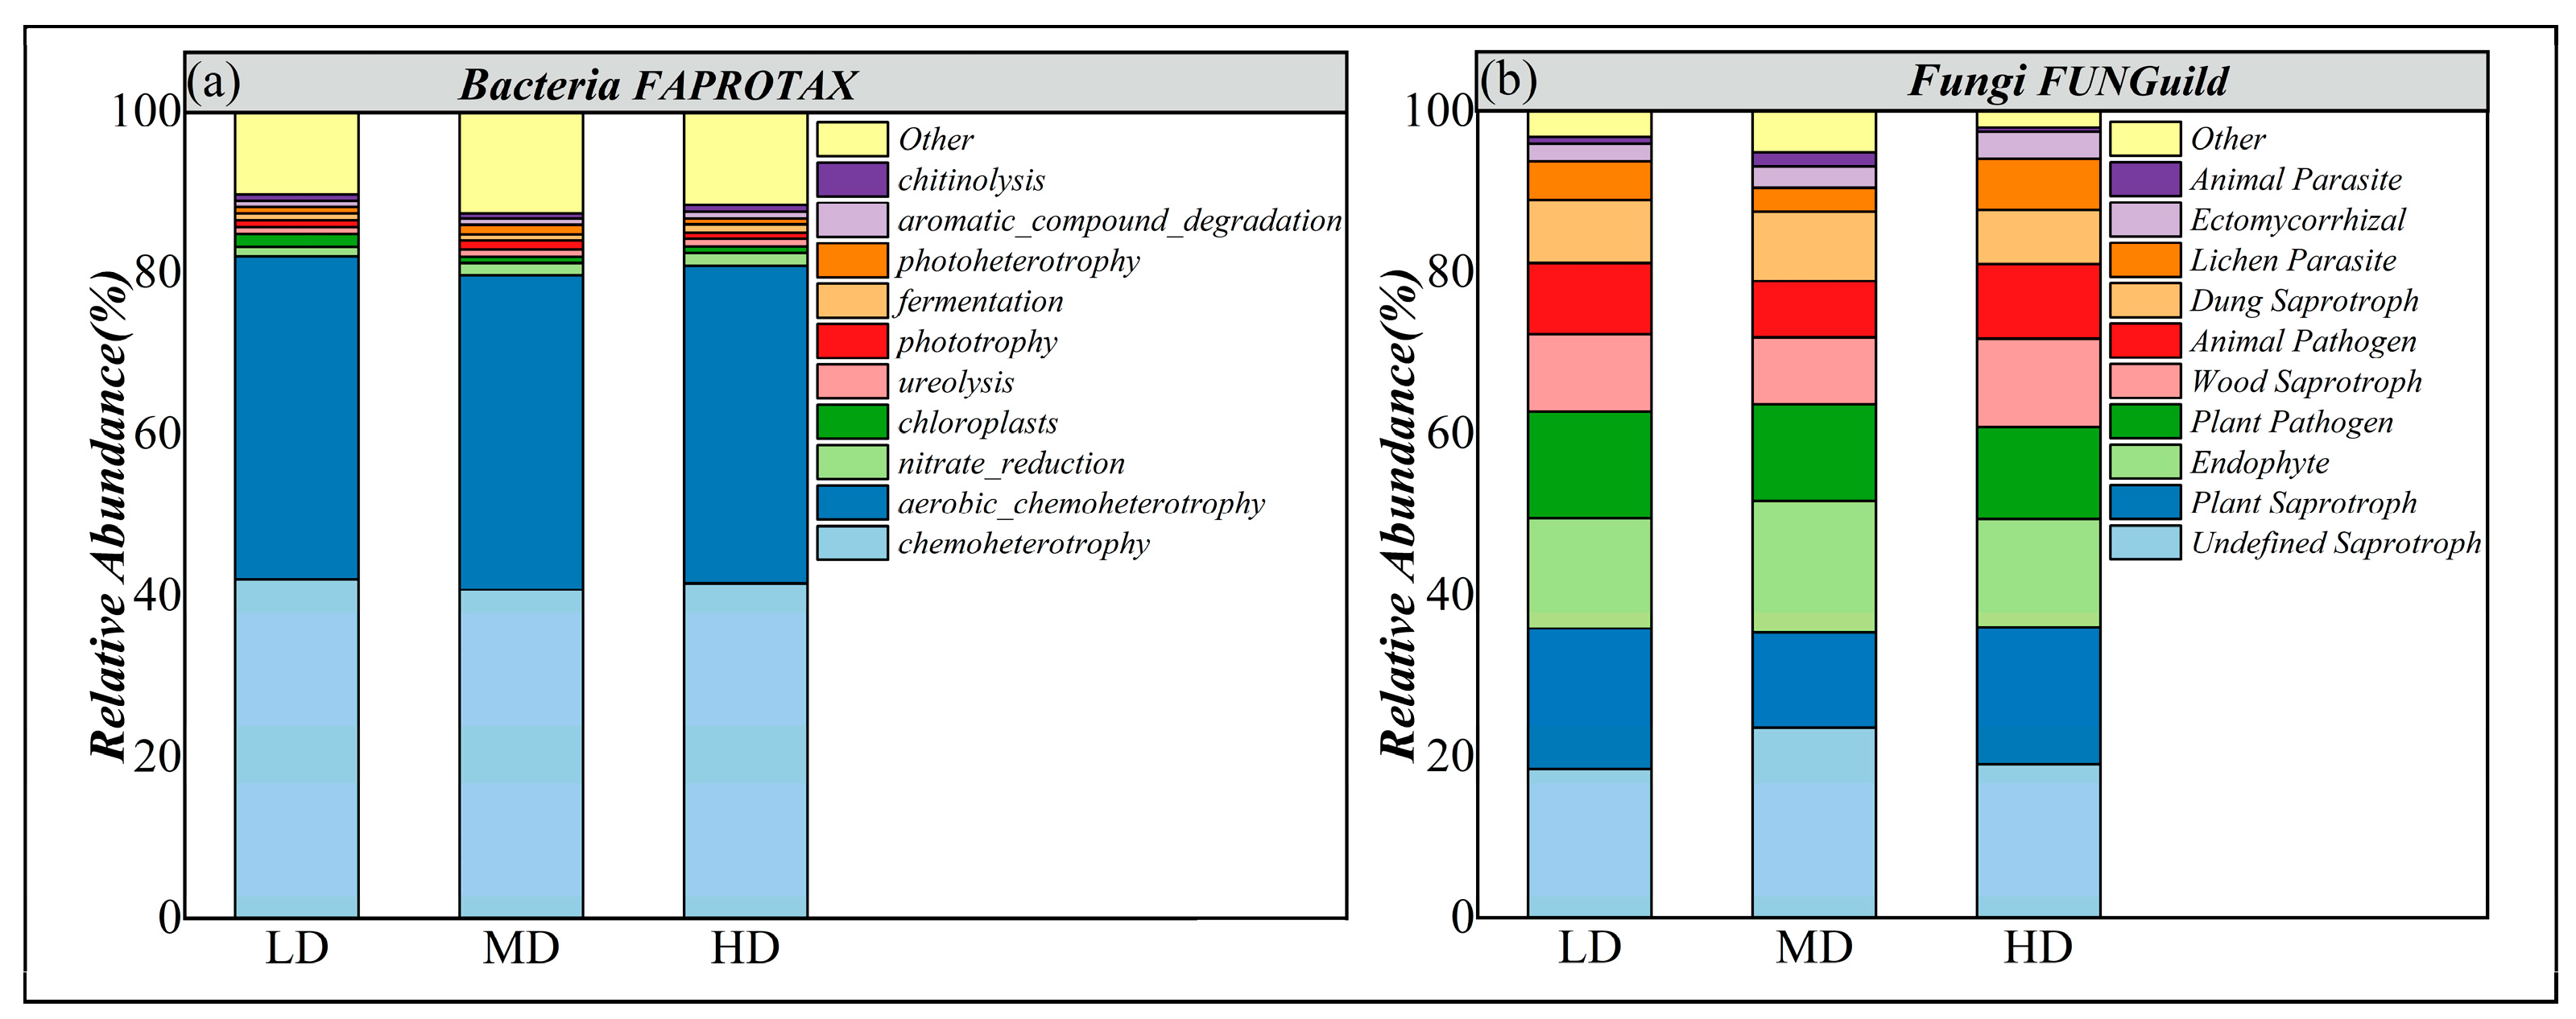
3.3.4. Functional Groups of Soil Microbial Communities

The top 10 bacterial functional groups were annotated based on the FAPROTAX database. The results showed that chemoheterotrophy (40.80–42.04%), aerobic chemoheterotrophy (38.97–40.04%), and nitrate reduction (1.19–1.53%) were the dominant functional types (Figure 9a; Table A3). Compared to low drought (LD), moderate drought (MD) significantly increased the relative abundance of phototrophy and photoheterotrophy, with average increases of 31.93% and 32.48%, respectively. However, as drought severity (IWDI) increased, the relative abundance of phototrophy and photoheterotrophy significantly decreased, by 36.97% and 40.17%, respectively (p < 0.05).
Analysis of fungal functional groups based on the FUNGuild database showed that Undefined Saprotroph (18.43–22.95%), Plant Saprotroph (12.60–17.44%), Endophyte (13.66–15.31%), and Plant Pathogen (10.70–13.23%) were the dominant functional types (Figure 9b; Table A4). The results indicated that, as drought severity (IWDI) increased, the composition of the soil fungal functional groups did not change significantly. Therefore, the composition of the soil bacterial communities in maize fields in arid regions responded significantly more strongly to drought severity (IWDI) than fungal communities.

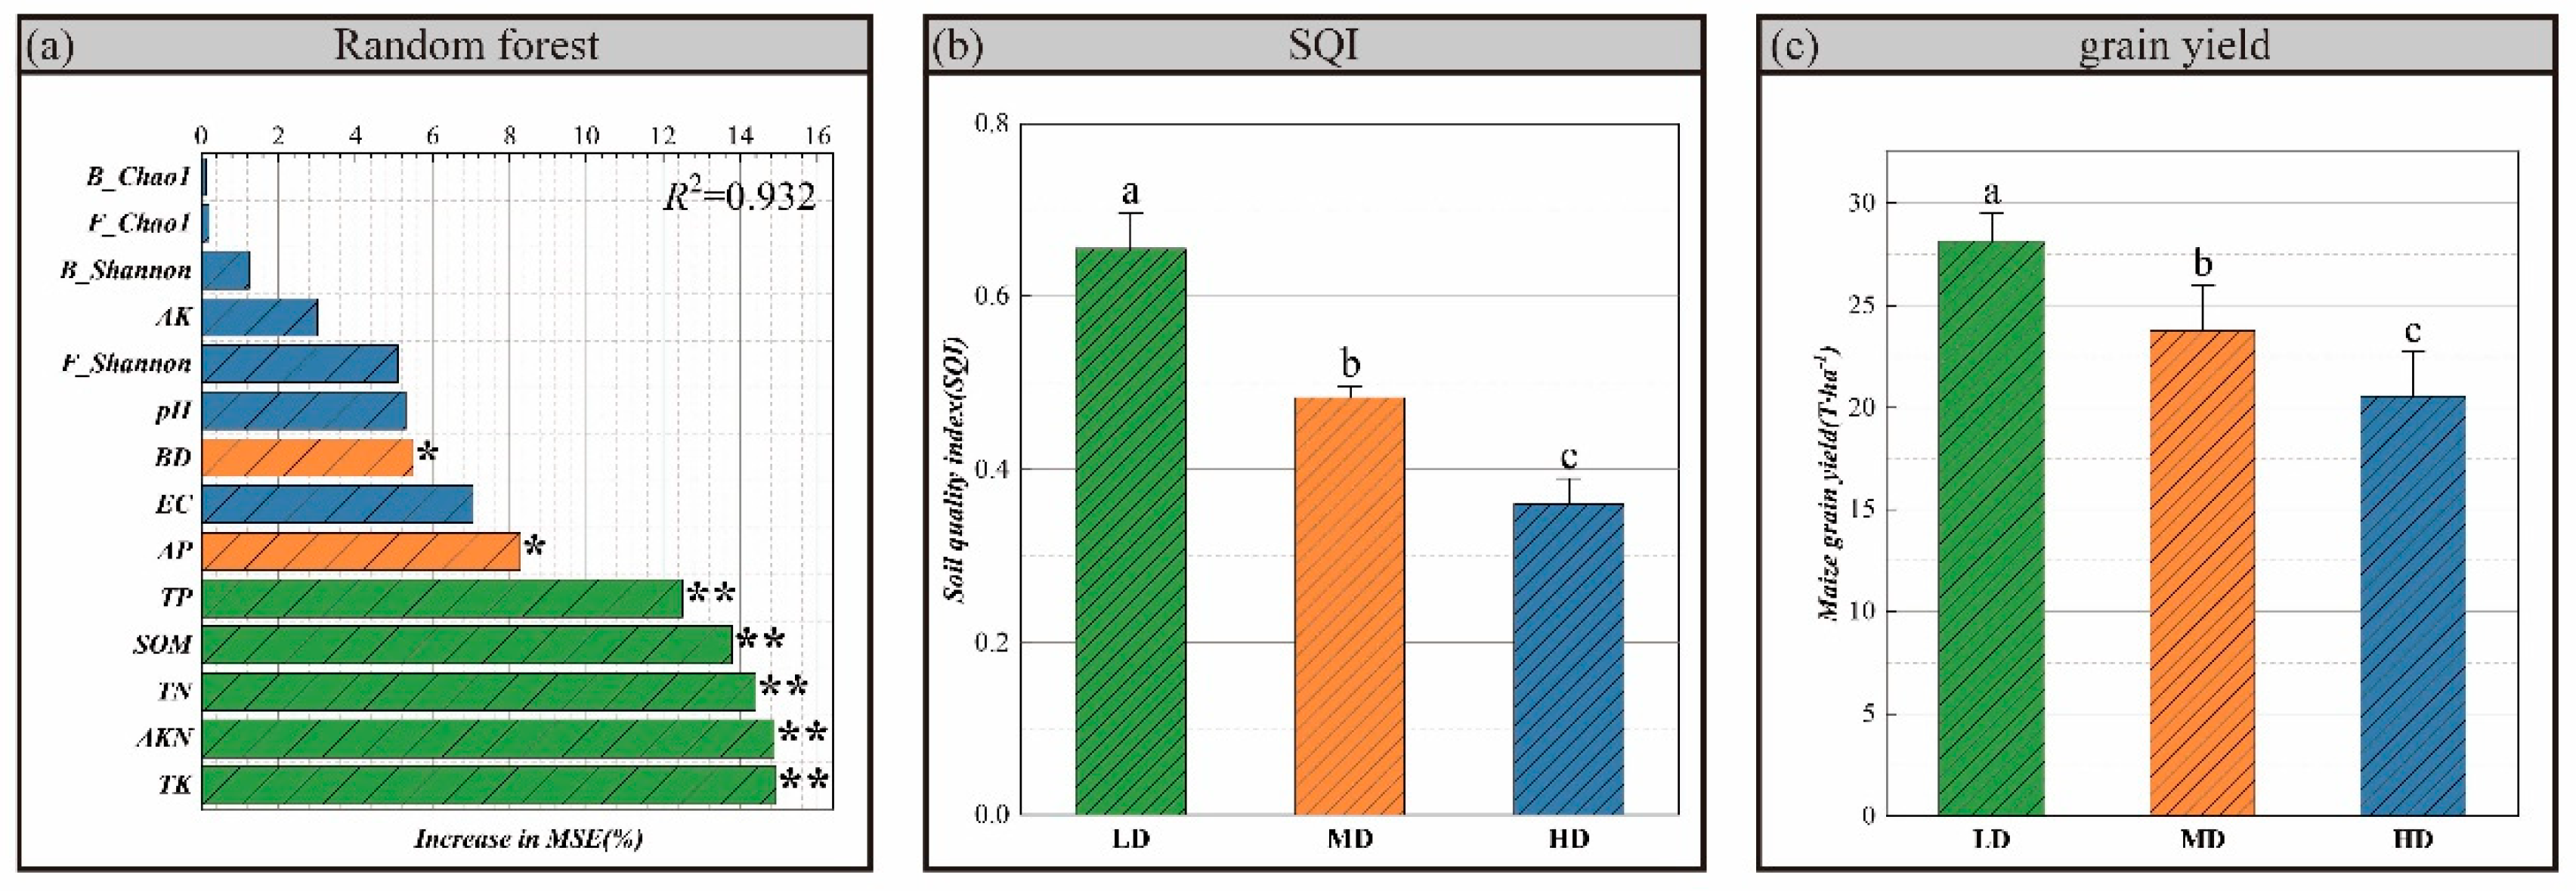
3.4. Soil Quality and Maize Yield

The study utilized a comprehensive dataset, collected over one year (April 2023 to March 2024), including 10 soil parameters and 4 soil microbial diversity parameters to assess the Soil Quality Index (SQI), capturing the long-term effects of sustained irrigation practices on soil health. Under different drought levels (IWDI), the Soil Quality Index (SQI) was ranked as follows: low drought (LD) > moderate drought (MD) > high drought (HD) (Figure 10b). Specifically, the SQI value for low drought (LD) was 26.18% and 45.02% higher than that for moderate drought (MD) and high drought (HD), respectively. The random forest analysis results indicate that soil nutrients (such as total potassium (TK), alkali-hydrolyzable nitrogen (AKN), total nitrogen (TN), organic matter (SOM), and total phosphorus (TP)) contributed most significantly to the Soil Quality Index (SQI), with soil bulk density (BD) also showing a notable contribution to SQI (Figure 10a).
In 2023, maize yield under low-drought (LD) conditions was 21.05% and 13.13% higher than under moderate-drought (MD) and high-drought (HD) conditions, respectively (Figure 10c). Under low-drought (LD, IWDI) conditions, maize yield was significantly higher than under moderate-drought (MD) and high-drought (HD) conditions (Figure 10c). These trends indicate that minimizing irrigation deficits, such as through enhanced drip irrigation in HD zones, could sustain soil quality and maize yields in arid regions.

4. Discussion

4.1. Irrigation Water Deficit Drives Gradient Changes in Soil Physicochemical Properties

This study demonstrates that irrigation, as a long-term management practice, critically shapes soil physicochemical properties in maize fields, with increasing Irrigation Water Deficit Index (IWDI) levels—monitored over one year (April 2023 to March 2024)—driving significant changes. These shifts reflect the cumulative impact of sustained irrigation patterns over multiple years. From low drought (LD) to high drought (HD), soil electrical conductivity (EC) and bulk density (BD) significantly increased, while soil organic matter (SOM), total nitrogen (TN), and available nutrients (such as alkali-hydrolyzable nitrogen (AKN), available phosphorus (AP), and available potassium (AK)) significantly decreased (Figure 2). This result is consistent with previous studies, suggesting that insufficient water exacerbates soil salinization and compaction by reducing leaching and increasing evapotranspiration [45,46]. Soil electrical conductivity (EC) rose from 0.09 mS·cm−1 in low drought (LD) to 0.25 mS·cm−1 in high drought (HD), reflecting the accumulation of soluble salts under drought conditions, possibly related to limited irrigation and high evaporative demand in arid regions. Similarly, soil bulk density (BD) increased from 1.11 g·cm−3 in low drought (LD) to 2.21 g·kg−1 in high drought (HD), indicating soil structure degradation, possibly due to reduced root activity and organic matter input under water stress [47]. The decline in soil organic matter (SOM) and other nutrient contents may be attributed to reduced microbial decomposition and plant residue input under water limitation [48,49]. Particularly in high-drought (HD) plots, soil organic matter (SOM) decreased from 31.15 g·kg−1 in low drought (LD) to 12.30 g·kg−1, highlighting the critical role of irrigation in maintaining soil fertility in arid regions. These findings emphasize the need for adaptive irrigation management, such as increasing water application frequency in high-drought areas, to counteract salinization and nutrient loss.

4.2. Differential Responses of Microbial Diversity to Water Stress

The impact of irrigation water deficit on soil microbial diversity shows significant differences between bacterial and fungal communities. Under high-drought (HD) conditions, bacterial richness (Chao1 and Ace indices) significantly increased by 6.42% and 5.77%, respectively, compared to low drought (LD) (Figure 3a), reflecting their metabolic flexibility. This suggests that certain bacterial groups may have a survival advantage in water-limited environments. This may be related to the proliferation of drought-tolerant groups such as Proteobacteria and Bacteroidota, which adapt to drought stress through spore formation or metabolic flexibility [50,51,52]. In contrast, under high-drought (HD) conditions, fungal diversity (Shannon and Simpson indices) significantly decreased by 14.11% and 50.45%, respectively, compared to moderate drought (MD) (Figure 3b), indicating that fungal communities are more sensitive to prolonged water deficits. This difference may reflect distinct microbial life strategies. Bacteria exhibit greater resilience to drought stress due to their rapid growth and adaptive mechanisms, whereas fungi rely on stable water availability for mycelial growth [53], resulting in more pronounced diversity loss under a high Irrigation Water Deficit Index (IWDI). The lack of significant changes in fungal richness (Chao1 and Ace indices) further suggests that, despite adjustments in community composition, the total number of fungal species remains relatively stable. These differential responses suggest that irrigation management should prioritize maintaining fungal diversity in high-drought areas, potentially through consistent water inputs to support mycelial functions. These findings reveal the differential impacts of irrigation deficits on microbial diversity and suggest that bacteria may maintain ecological functions through diversity under drought conditions.

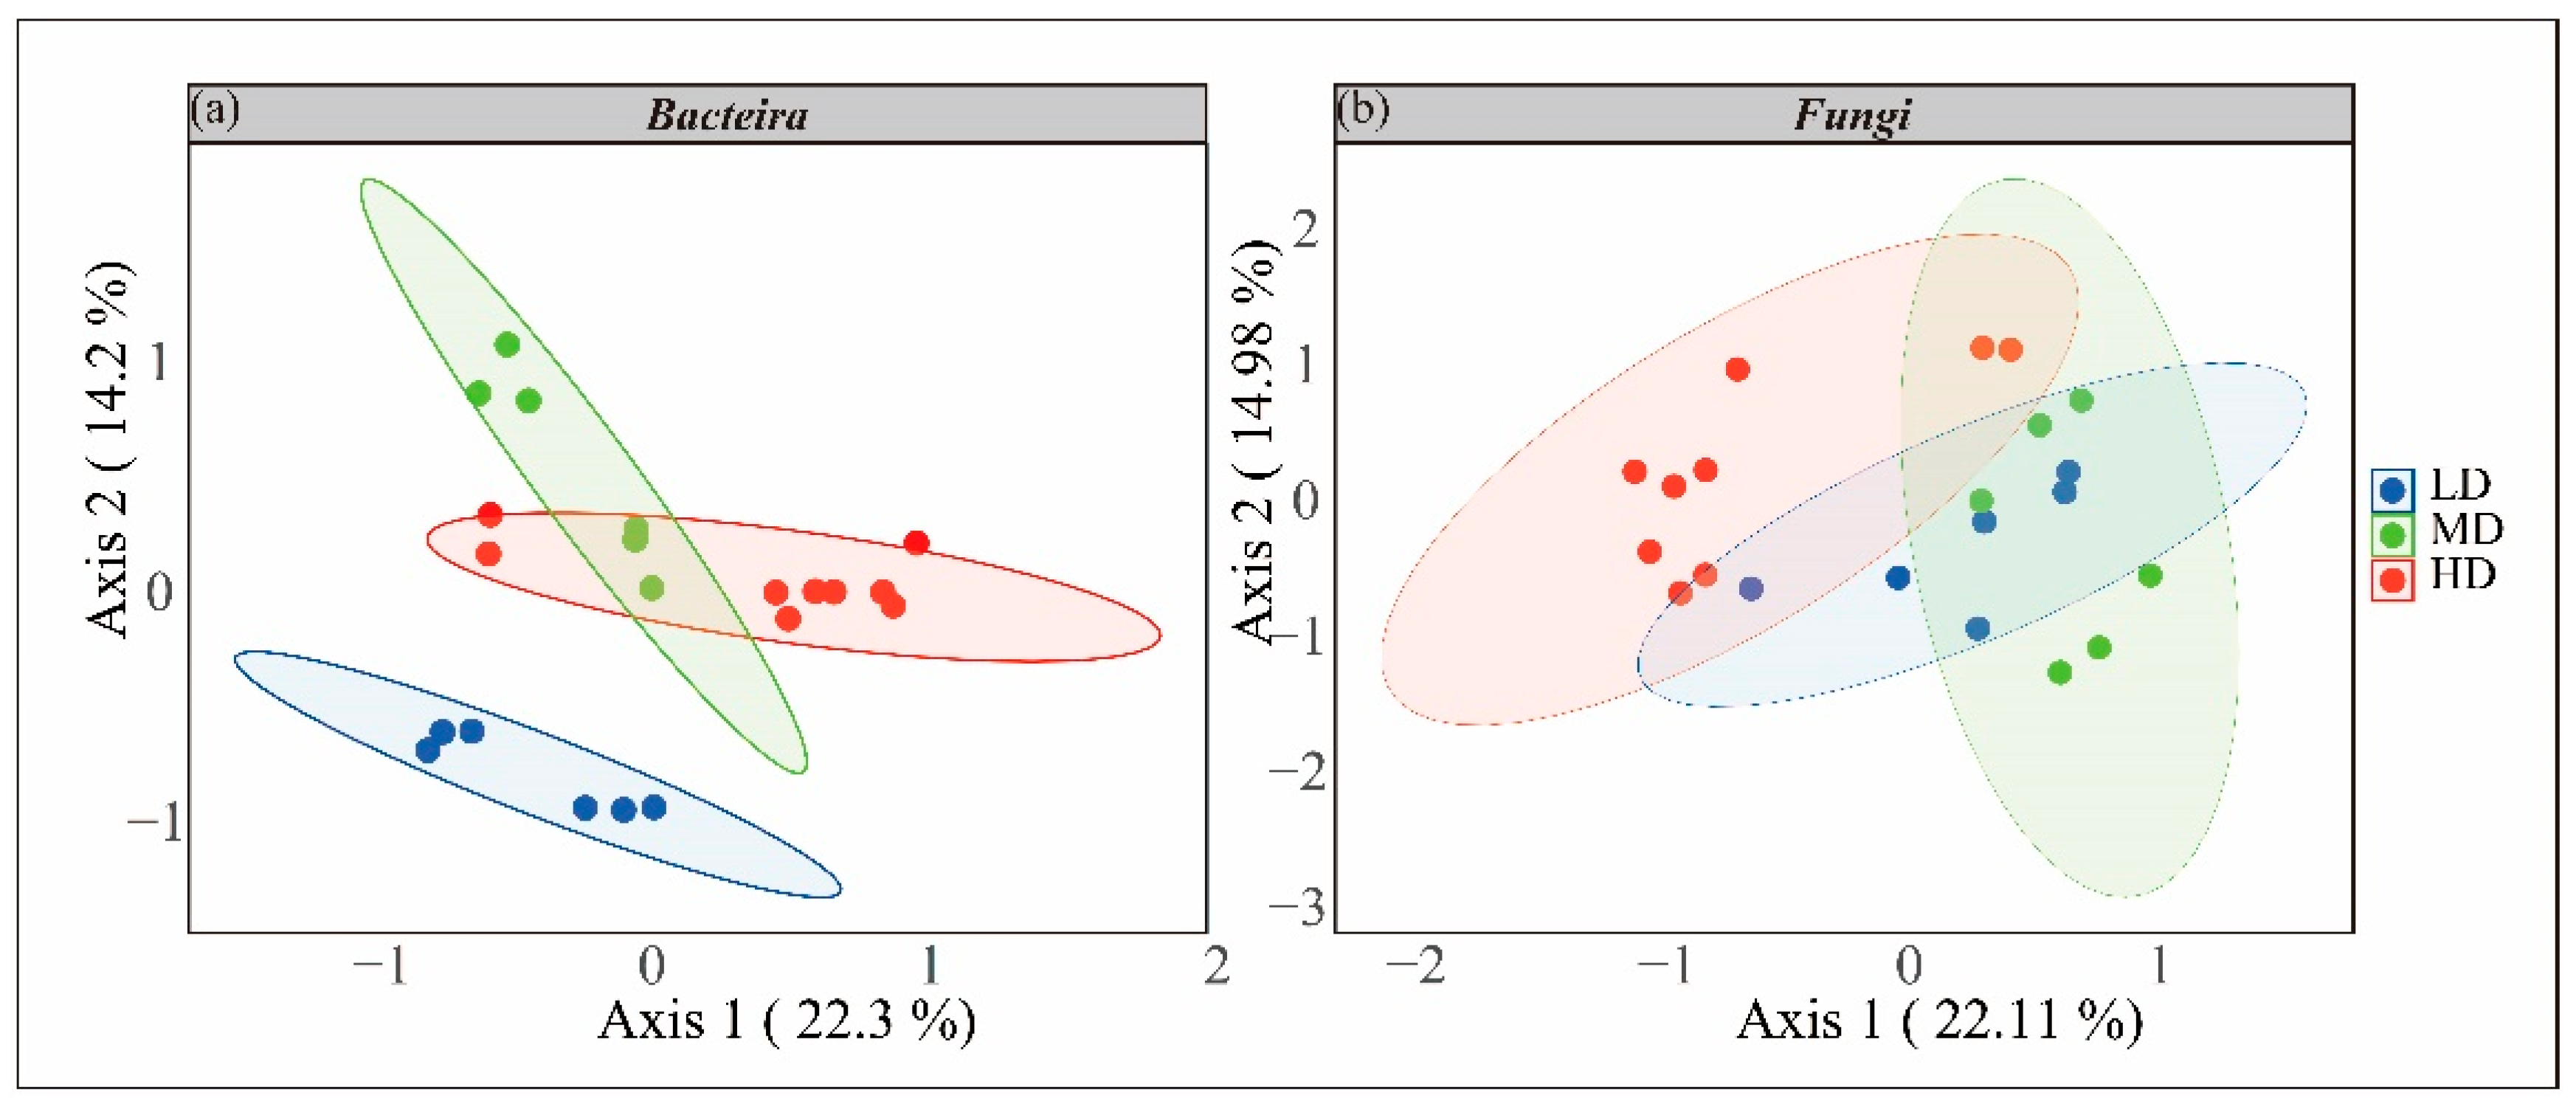
4.3. Water Gradient Shapes Microbial Community Restructuring

Irrigation water deficit significantly altered the taxonomic composition of soil microbial communities. For bacteria, under high-drought (HD) conditions, the relative abundance of Proteobacteria, Bacteroidota, and Patescibacteria significantly increased compared to low drought (LD), while Acidobacteriota, Planctomycetota, and Gemmatimonadota significantly decreased (Figure 4a, Table A1). These changes may reflect the ecological preferences of different phyla, with Proteobacteria and Bacteroidota dominating in nutrient-poor and high-salinity environments induced by a high IWDI [54], while Acidobacteriota, due to its strong dependence on organic matter, decreases in abundance as soil organic matter (SOM) declines [55]. Changes in fungal communities were relatively minor, with dominant phyla such as Ascomycota, Basidiomycota, and Mortierellomycota accounting for over 96% of sequences across all IWDI levels (Figure 4b, Table A2). However, under high-drought (HD) conditions, the abundance of Aphelidiomycota significantly decreased, while moderate drought (MD) significantly increased Mortierellomycota compared to low drought (LD). This suggests that fungi respond more moderately to the IWDI, with soil nutrient changes having a lesser impact on fungal community structure, possibly due to their broad ecological adaptability or symbiotic relationships with maize roots [56]. The PCoA and RDA analyses further confirmed that bacterial communities are more sensitive to environmental changes driven by the IWDI (e.g., pH, EC, SOM) (Figure 7 and Figure 8), indicating that drought exerts a more pronounced regulatory effect on bacterial-community composition in maize fields in arid regions.

4.4. Analysis of Soil Quality–Yield Coupling Mechanisms

The Soil Quality Index (SQI), assessed over one year (April 2023 to March 2024), significantly decreased with an increasing Irrigation Water Deficit Index (IWDI), underscoring irrigation’s pivotal role in sustaining soil quality over the long term. These findings reflect the enduring consequences of consistent irrigation practices across the study sites, following the order low drought (LD) > moderate drought (MD) > high drought (HD), with LD’s SQI being 26.18% and 45.02% higher than MD and HD, respectively (Figure 10b). Random forest analysis indicated that soil nutrients (such as total potassium (TK), alkali-hydrolyzable nitrogen (AKN), total nitrogen (TN), soil organic matter (SOM), and total phosphorus (TP)) and bulk density were the primary contributors to the SQI (Figure 10a), consistent with the reduced nutrient cycling and increased physical stress caused by the IWDI [57,58]. The deterioration of soil quality under a high IWDI may stem from water deficits damaging soil fertility and structure, aligning with studies on impaired soil ecosystem services in arid regions [59,60].
Maize yield under LD was 21.05% and 13.13% higher than under MD and HD, respectively (Figure 10c). The SQI was positively correlated with yield, and soil degradation under high drought limited root growth and nutrient uptake. It is recommended to use precision drip irrigation and organic fertilizers in HD areas to mitigate degradation and maintain productivity. High drought severity (IWDI) may exacerbate yield losses by restricting root growth and nutrient uptake [61,62]. Furthermore, changes in microbial community composition, particularly the reduction in beneficial groups like Acidobacteriota, may further limit soil nutrient supply, indirectly affecting maize growth. These findings reveal the cascading effects of irrigation deficits on soil quality and agricultural yield, underscoring the importance of sustainable water resource management in arid regions. Based on the strong correlation between the SQI and yield, it is recommended to mitigate soil degradation in high-drought areas through precision drip irrigation and organic fertilizer supplementation to sustain maize productivity. Such management practices could optimize water use efficiency and enhance soil nutrient retention, offering a viable strategy for arid agricultural systems facing increasing drought pressures.

4.5. Limitations and Future Research

While this study provides valuable insights into the long-term effects of irrigation water deficit (IWD) on soil quality, microbial diversity, and maize yield in Xinjiang’s arid maize fields, several limitations warrant consideration. First, the sampling was conducted only at the end of the irrigation season in March 2024, which may not fully capture the seasonal dynamics of soil properties and microbial communities throughout the maize growing cycle. Future studies should consider multiple sampling times to better understand the temporal variations in response to irrigation practices. Second, the study’s findings are based on a single year of monitoring, which may not account for interannual variability in climate conditions. Expanding the study duration to multiple years would enhance the robustness of the results. Third, the study focused on seven sites across Xinjiang, which may not fully capture the spatial heterogeneity of irrigation practices and soil types across broader arid zones. Finally, while microbial diversity and functional predictions (e.g., FAPROTAX, FUNGuild) were analyzed, the actual metabolic activities and interactions between bacteria, fungi, and maize roots under varying IWDI levels remain underexplored due to reliance on sequencing-based approaches rather than direct functional assays. Future studies should consider direct functional assays to more accurately assess microbial activities and their contributions to soil health and crop productivity.
Future research could address these limitations by extending the monitoring duration across multiple years to account for climatic variability and its interaction with long-term irrigation patterns. Incorporating additional sites with diverse soil textures, irrigation histories, and management practices would enhance the spatial robustness of the findings. Moreover, integrating metagenomic or metatranscriptomic analyses alongside field-based measurements (e.g., enzyme activities and nutrient cycling rates) could provide deeper insights into microbial functional dynamics and their contributions to soil quality and maize productivity under drought stress. Finally, experimental manipulation of irrigation levels—beyond observational data—could clarify causal relationships between IWDI, soil degradation, and microbial restructuring, offering practical guidance for refining irrigation schedules and integrating soil amendments to improve environmental management in arid agricultural ecosystems.

5. Conclusions

One-year monitoring (April 2023–March 2024) with a single end-of-cycle sampling in March 2024 in Xinjiang’s arid maize fields revealed that a long-term irrigation water deficit (IWDI) drives soil salinization, nutrient loss, and microbial shifts. Bacterial richness increased by ~6% under high drought (HD), while fungal diversity declined by 14–50%, impairing nutrient cycling functions critical for soil health. The SQI and maize yield decreased with drought severity (LD > MD by 26.18% and 21.05%; LD > HD by 45.02% and 13.13%), underscoring irrigation’s role in sustaining productivity. This study quantified microbial functional responses and their association with the SQI under long-term irrigation regimes, providing a scientific basis for optimizing water use efficiency in arid zones. By linking microbial shifts to soil quality and maize yield, it offers actionable insights for water management in water-scarce agricultural systems.

Author Contributions

D.Z.: writing—review and editing, writing—original draft, software, methodology, investigation, formal analysis, data curation, conceptualization. R.S.: writing—original draft, software, supervision, resources, methodology. H.D.: writing—review and editing, resources, project administration, funding acquisition. Z.H.: investigation, data curation. J.C.: investigation, formal analysis. S.D.: investigation, formal analysis, Data curation. All authors have read and agreed to the published version of the manuscript.

Funding

This research was funded by the Corps Guided Science and Technology Program Project (2023ZD051); the Xinjiang Uygur Autonomous Region Tianchi Talent Introduction Program (CZ001613); and the Sponsored by Shihezi University High-Level Talent Research Launch Project (RCZK202365).

Data Availability Statement

Acknowledgments

The authors would like to thank all the reviewers who participated in the review.

Conflicts of Interest

The authors declare no conflicts of interest.

Appendix A. Table

Table A1. Phylum-level relative abundance (IDWI) of bacteria at different drought levels (%).
PhylumGroupANOVO
LDMDHD
Proteobacteria32.31 b39.34 a40.89 a**
Acidobacteriota22.60 a16.53 b12.73 b**
Bacteroidota6.84 b6.77 b12.89 a**
Actinobacteriota7.08 a8.47 a8.82 ans
Planctomycetota10.24 a7.25 ab6.18 b*
Gemmatimonadota6.12 a5.38 ab4.07 b**
Chloroflexi4.63 a5.47 a3.97 ans
Verrucomicrobiota2.59 a2.37 a2.34 ans
unclassified_Bacteria1.63 a1.76 a1.52 ans
Patescibacteria0.81 b1.51 a1.84 a**
The values represent LD and MD according to the average of 6 replicates, and HD is the average of 9 replicates. The different lowercase letters indicate significant differences at different drought levels (IDWI) (p < 0.05). One-way ANOVA was performed using LD, MD, and HD, respectively. The different lowercase letters indicate significant differences between groups under different drought levels (IDWI). *: p < 0.05, **: p < 0.01, ns: p > 0.05.
Table A2. Phylum-level relative abundance (IDWI) of fungi under different drought levels (%).
PhylumGroupANOVO
LDMDHD
Ascomycota77.86 a77.09 a77.12 ans
Basidiomycota17.42 a15.40 a18.81 ans
Mortierellomycota1.00 b4.66 a1.00 b*
Chytridiomycota1.41 a0.90 a2.06 ans
unclassified_Fungi0.811 a1.19 a0.50 ans
Rozellomycota0.38 a0.18 a0.10 ans
Glomeromycota0.15 a0.14 a0.12 ans
Mucoromycota0.08 a0.04 a0.17 ans
Aphelidiomycota0.05 a0.18 ab0.04 b**
Basidiobolomycota0.13 a0.11 a0.01 ans
The values represent LD and MD according to the average of 6 replicates, and HD is the average of 9 replicates. The different lowercase letters indicate significant differences at different drought levels (IDWI) (p < 0.05). One-way ANOVA was performed using LD, MD, and HD, respectively. The different lowercase letters indicate significant differences between groups under different drought levels (IDWI). *: p < 0.05, **: p < 0.01, ns: p > 0.05.
Table A3. The abundance (%) of the top 10 soil bacterial functional groups in the FAPROTAX database under different drought levels (IDWI).
FunctionGroupANOVO
LDMDHD
chemoheterotrophy42.04 a40.80 a41.59 ans
aerobic_chemoheterotrophy40.04 a38.97 a39.38 ans
nitrate_reduction1.19 a1.53 a1.53 ans
chloroplasts1.65 a0.73 a0.83 ans
ureolysis0.85 a0.92 a0.97 ans
phototrophy0.81 b1.19 a0.75 b*
fermentation0.86 a0.72 a1.02 ans
photoheterotrophy0.79 ba1.17 a0.70 b*
aromatic_compound_degradation0.78 a0.75 a0.84 ans
chitinolysis0.83 a0.64 a0.86 ans
The values represent LD and MD according to the average of 6 replicates, and HD is the average of 9 replicates. The different lowercase letters indicate significant differences at different drought levels (IDWI) (p < 0.05). One-way ANOVA was performed using LD, MD, and HD, respectively. The different lowercase letters indicate significant differences between groups under different drought levels (IDWI). *: p < 0.05, ns: p > 0.05.
Table A4. The abundance (%) of the top 10 soil fungal functional groups in the FUNGuild database under different drought levels (IDWI).
FunctionGroupANOVO
LDMDHD
Undefined_Saprotroph18.43 a22.95 a21.55 ans
Plant_Saprotroph17.44 a12.60 a16.02 ans
Endophyte13.66 a15.31 a13.95 ans
Plant_Pathogen13.23 a12.21 a10.70 ans
Wood_Saprotroph9.55 a9.05 a9.06 ans
Animal_Pathogen8.89 a7.23 a7.89 ans
Dung_Saprotroph7.80 a7.84 a8.67 ans
Lichen_Parasite4.84 a3.27 a5.42 ans
Ectomycorrhizal2.10 a2.65 a3.34 ans
Animal_Parasite0.85 a1.69 a0.70 ans
The values represent LD and MD according to the average of 6 replicates, and HD is the average of 9 replicates. The different lowercase letters indicate significant differences at different drought levels (IDWI) (p < 0.05). One-way ANOVA was performed using LD, MD, and HD, respectively. The different lowercase letters indicate significant differences between groups under different drought levels (IDWI). ns: p > 0.05.

Appendix B. Figure

Figure A1. Venn diagram example. (a) Bacterial Venn diagram, (b) Fungal Venn diagram.
Agronomy 15 01355 g0a1
Figure A2. A heatmap of the correlation of environmental factors under different drought levels (IDWI). (a) Grouping correlation heatmap. (b) Ungrouped correlation heatmaps.
Agronomy 15 01355 g0a2

References

  1. Xing, Y.; Wang, X. Precision Agriculture and Water Conservation Strategies for Sustainable Crop Production in Arid Regions. Plants 2024, 13, 3184. [Google Scholar] [CrossRef] [PubMed]
  2. Rehaman, A.; Khan, S.; Rawat, B.; Gaira, K.S.; Asgher, M.; Semwal, P.; Tripathi, V. Mechanistic Insights into Plant Drought Tolerance: A Multi-Level Perspective. J. Crop Health 2025, 77, 53. [Google Scholar] [CrossRef]
  3. Morante-Carballo, F.; Montalván-Burbano, N.; Quiñonez-Barzola, X.; Jaya-Montalvo, M.; Carrión-Mero, P. What Do We Know about Water Scarcity in Semi-Arid Zones? A Global Analysis and Research Trends. Water 2022, 14, 2685. [Google Scholar] [CrossRef]
  4. Sun, M.; Dai, Y.; Zhang, S.; Liang, H. Risk Assessment of Extreme Drought and Extreme Wetness During Growth Stages of Major Crops in China. Sustainability 2025, 17, 2221. [Google Scholar] [CrossRef]
  5. Reynolds, J.F.; Smith, D.M.S.; Lambin, E.F.; Turner, B.L., II; Mortimore, M.; Batterbury, S.P.J.; Downing, T.E.; Dowlatabadi, H.; Fernández, R.J.; Herrick, J.E.; et al. Global Desertification: Building a Science for Dryland Development. Science 2007, 316, 847–851. [Google Scholar] [CrossRef]
  6. Schimel, D.S. Drylands in the Earth System. Science 2010, 327, 418–419. [Google Scholar] [CrossRef]
  7. Lyu, J.; Shi, Y.; Liu, T.; Xu, X.; Liu, S.; Yang, G.; Peng, D.; Qu, Y.; Zhang, S.; Chen, C.; et al. Extreme Drought-Heatwave Events Threaten the Biodiversity and Stability of Aquatic Plankton Communities in the Yangtze River Ecosystems. Commun. Earth Environ. 2025, 6, 1–12. [Google Scholar] [CrossRef]
  8. Stromberger, M.; Shah, Z.; Westfall, D. Soil Microbial Communities of No-till Dryland Agroecosystems across an Evapotranspiration Gradient. Appl. Soil Ecol. 2007, 35, 94–106. [Google Scholar] [CrossRef]
  9. Taskin, E.; Boselli, R.; Fiorini, A.; Misci, C.; Ardenti, F.; Bandini, F.; Guzzetti, L.; Panzeri, D.; Tommasi, N.; Galimberti, A.; et al. Combined Impact of No-Till and Cover Crops with or without Short-Term Water Stress as Revealed by Physicochemical and Microbiological Indicators. Biology 2021, 10, 23. [Google Scholar] [CrossRef]
  10. Wang, J.; Li, H.; Cheng, Z.; Yin, F.; Yang, L.; Wang, Z. Changes in Soil Bacterial and Fungal Community Characteristics in Response to Long-Term Mulched Drip Irrigation in Oasis Agroecosystems. Agric. Water Manag. 2023, 279, 108178. [Google Scholar] [CrossRef]
  11. Du, Y.; Lv, S.; Wang, F.; Xu, J.; Zhao, H.; Tang, L.; Wang, H.; Zhang, H. Investigation into the Temporal Impacts of Drought on Vegetation Dynamics in China during 2000 to 2022. Sci. Rep. 2025, 15, 6351. [Google Scholar] [CrossRef]
  12. You, Z.; Sun, X.; Sun, H.; Chen, L.; Lu, M.; Xue, J.; Ban, X.; Yan, B.; Tuo, Y.; Qin, H.; et al. Mechanisms of Meteorological Drought Propagation to Agricultural Drought in China: Insights from Causality Chain. npj Nat. Hazards 2025, 2, 1–15. [Google Scholar] [CrossRef]
  13. Mola, M.; Kougias, P.G.; Statiris, E.; Papadopoulou, P.; Malamis, S.; Monokrousos, N. Short-Term Effect of Reclaimed Water Irrigation on Soil Health, Plant Growth and the Composition of Soil Microbial Communities. Sci. Total Environ. 2024, 949, 175107. [Google Scholar] [CrossRef] [PubMed]
  14. Ngetich, K.F.; Diels, J.; Shisanya, C.A.; Mugwe, J.N.; Mucheru-muna, M.; Mugendi, D.N. Effects of Selected Soil and Water Conservation Techniques on Runoff, Sediment Yield and Maize Productivity under Sub-Humid and Semi-Arid Conditions in Kenya. Catena 2014, 121, 288–296. [Google Scholar] [CrossRef]
  15. Uwizeyimana, D.; Mureithi, S.M.; Karuku, G.; Kironchi, G. Effect of Water Conservation Measures on Soil Moisture and Maize Yield under Drought Prone Agro-Ecological Zones in Rwanda. Int. Soil Water Conserv. Res. 2018, 6, 214–221. [Google Scholar] [CrossRef]
  16. Deng, L.; Peng, C.; Kim, D.-G.; Li, J.; Liu, Y.; Hai, X.; Liu, Q.; Huang, C.; Shangguan, Z.; Kuzyakov, Y. Drought Effects on Soil Carbon and Nitrogen Dynamics in Global Natural Ecosystems. Earth-Sci. Rev. 2021, 214, 103501. [Google Scholar] [CrossRef]
  17. Muhammad, M.; Waheed, A.; Wahab, A.; Majeed, M.; Nazim, M.; Liu, Y.-H.; Li, L.; Li, W.-J. Soil Salinity and Drought Tolerance: An Evaluation of Plant Growth, Productivity, Microbial Diversity, and Amelioration Strategies. Plant Stress 2024, 11, 100319. [Google Scholar] [CrossRef]
  18. Peralta Ogorek, L.L.; Gao, Y.; Farrar, E.; Pandey, B.K. Soil Compaction Sensing Mechanisms and Root Responses. Trends Plant Sci. 2024, 30, 565–575. [Google Scholar] [CrossRef] [PubMed]
  19. Delgado-Baquerizo, M.; Reich, P.B.; Trivedi, C.; Eldridge, D.J.; Abades, S.; Alfaro, F.D.; Bastida, F.; Berhe, A.A.; Cutler, N.A.; Gallardo, A.; et al. Multiple Elements of Soil Biodiversity Drive Ecosystem Functions across Biomes. Nat. Ecol. Evol. 2020, 4, 210–220. [Google Scholar] [CrossRef]
  20. Gu, H.; Liu, Z.; Yao, Q.; Jiao, F.; Liu, J.; Jin, J.; Liu, X.; Wang, G. Distinct Effects of Abundant and Rare Microbial Communities on Ecosystem Multifunctionality across the Soil Profiles in Agricultural Isohumosols. Soil. Ecol. Lett. 2025, 7, 240289. [Google Scholar] [CrossRef]
  21. Philippot, L.; Chenu, C.; Kappler, A.; Rillig, M.C.; Fierer, N. The Interplay between Microbial Communities and Soil Properties. Nat. Rev. Microbiol. 2024, 22, 226–239. [Google Scholar] [CrossRef] [PubMed]
  22. Loiko, N.; Islam, M.N. Plant–Soil Microbial Interaction: Differential Adaptations of Beneficial vs. Pathogenic Bacterial and Fungal Communities to Climate-Induced Drought. Agronomy 2024, 14, 1949. [Google Scholar] [CrossRef]
  23. Oram, N.J.; Brennan, F.; Praeg, N.; Bardgett, R.D.; Illmer, P.; Ingrisch, J.; Bahn, M. Plant Community Composition and Traits Modulate the Impacts of Drought Intensity on Soil Microbial Community Composition and Function. Soil Biol. Biochem. 2025, 200, 109644. [Google Scholar] [CrossRef]
  24. Liu, K.; Deng, F.; Zeng, F.; Chen, Z.-H.; Qin, Y.; Chen, G. Plant Growth-Promoting Rhizobacteria Improve Drought Tolerance of Crops: A Review. Plant Growth Regul. 2025, 105, 567–581. [Google Scholar] [CrossRef]
  25. Hu, D.; Zhou, X.; Ma, G.; Pan, J.; Ma, H.; Chai, Y.; Li, Y.; Yue, M. Increased Soil Bacteria-Fungus Interactions Promote Soil Nutrient Availability, Plant Growth, and Coexistence. Sci. Total Environ. 2024, 955, 176919. [Google Scholar] [CrossRef]
  26. Kang, H.; Xue, Y.; Cui, Y.; Moorhead, D.L.; Lambers, H.; Wang, D. Nutrient Limitation Mediates Soil Microbial Community Structure and Stability in Forest Restoration. Sci. Total Environ. 2024, 935, 173266. [Google Scholar] [CrossRef]
  27. Li, S. The Effects of Different Irrigation Methods on Corn Growth and Soil Quality. Trop. Agric. Eng. 2024, 48, 77–79. [Google Scholar]
  28. Xing, Z.; Ma, M.; Wei, Y.; Zhang, X.; Yu, Z.; Yi, P. A New Agricultural Drought Index Considering the Irrigation Water Demand and Water Supply Availability. Nat. Hazards 2020, 104, 2409–2429. [Google Scholar] [CrossRef]
  29. Ding, Y.; Peng, S. Spatiotemporal Trends and Attribution of Drought across China from 1901–2100. Sustainability 2020, 12, 477. [Google Scholar] [CrossRef]
  30. Peng, S.; Ding, Y.; Liu, W.; Li, Z. 1 Km Monthly Temperature and Precipitation Dataset for China from 1901 to 2017. Earth Syst. Sci. Data 2019, 11, 1931–1946. [Google Scholar] [CrossRef]
  31. Peng, S.; Gang, C.; Cao, Y.; Chen, Y. Assessment of Climate Change Trends over the Loess Plateau in China from 1901 to 2100. Int. J. Climatol. 2018, 38, 2250–2264. [Google Scholar] [CrossRef]
  32. Peng, S.; Ding, Y.; Wen, Z.; Chen, Y.; Cao, Y.; Ren, J. Spatiotemporal Change and Trend Analysis of Potential Evapotranspiration over the Loess Plateau of China during 2011–2100. Agric. For. Meteorol. 2017, 233, 183–194. [Google Scholar] [CrossRef]
  33. Pereira, L.S.; Paredes, P.; Hunsaker, D.J.; López-Urrea, R.; Mohammadi Shad, Z. Standard Single and Basal Crop Coefficients for Field Crops. Updates and Advances to the FAO56 Crop Water Requirements Method. Agric. Water Manag. 2021, 243, 106466. [Google Scholar] [CrossRef]
  34. Rallo, G.; Paço, T.A.; Paredes, P.; Puig-Sirera, À.; Massai, R.; Provenzano, G.; Pereira, L.S. Updated Single and Dual Crop Coefficients for Tree and Vine Fruit Crops. Agric. Water Manag. 2021, 250, 106645. [Google Scholar] [CrossRef]
  35. Boundi, A.; Yacine, Z.A.; Lahyane, S.A.; Elhabty, M.; Mouradi, A.; Saaf, M. Efficiency of Usual Irrigation Systems and Water Productivity for Crops in Mediterranean and Semi-Arid Climates with Reduce Hydric Requirements. Review. Arab. J. Chem. Environ. Res. 2017, 4, 107–126. [Google Scholar]
  36. Wang, C.; Wang, G.; Wang, Y.; Rafique, R.; Ma, L.; Hu, L.; Luo, Y. Urea Addition and Litter Manipulation Alter Plant Community and Soil Microbial Community Composition in a Kobresia humilis Meadow. Eur. J. Soil Biol. 2015, 70, 7–14. [Google Scholar] [CrossRef]
  37. Doran, J.W.; Parkin, T.B. Defining and Assessing Soil Quality. In Defining Soil Quality for a Sustainable Environment; John Wiley & Sons, Ltd.: Hoboken, NJ, USA, 1994; pp. 1–21. ISBN 978-0-89118-930-5. [Google Scholar]
  38. Shukla, M.K.; Lal, R.; Ebinger, M. Determining Soil Quality Indicators by Factor Analysis. Soil Tillage Res. 2006, 87, 194–204. [Google Scholar] [CrossRef]
  39. Chao, A. Non-Parametric Estimation of the Classes in a Population. Scand. J. Stat. 1984, 11, 265–270. [Google Scholar] [CrossRef]
  40. Shannon, C.E. A Mathematical Theory of Communication. Bell Syst. Tech. J. 1948, 27, 379–423. [Google Scholar] [CrossRef]
  41. Simpson, E.H. Measurement of Diversity. Nature 1949, 163, 688. [Google Scholar] [CrossRef]
  42. Chao, A.; Yang, M.C.K. Stopping Rules and Estimation for Recapture Debugging with Unequal Failure Rates. Biometrika 1993, 80, 193–201. [Google Scholar] [CrossRef]
  43. Guan, H.; Zhang, Y.; Mao, Q.; Zhong, B.; Chen, W.; Mo, J.; Wang, F.; Lu, X. Consistent Effects of Nitrogen Addition on Soil Microbial Communities across Three Successional Stages in Tropical Forest Ecosystems. Catena 2023, 227, 107116. [Google Scholar] [CrossRef]
  44. Louca, S.; Parfrey, L.W.; Doebeli, M. Decoupling Function and Taxonomy in the Global Ocean Microbiome. Science 2016, 353, 1272–1277. [Google Scholar] [CrossRef] [PubMed]
  45. Hagage, M.; Abdulaziz, A.M.; Elbeih, S.F.; Hewaidy, A.G.A. Monitoring Soil Salinization and Waterlogging in the Northeastern Nile Delta Linked to Shallow Saline Groundwater and Irrigation Water Quality. Sci. Rep. 2024, 14, 27838. [Google Scholar] [CrossRef]
  46. Kramer, I.; Peleg, N.; Mau, Y. Climate Change Shifts Risk of Soil Salinity and Land Degradation in Water-Scarce Regions. Agric. Water Manag. 2025, 307, 109223. [Google Scholar] [CrossRef]
  47. Zhu, X.; Peng, W.; Xie, Q.; Ran, E. Effects of Soil Compaction Stress Combined with Drought on Soil Pore Structure, Root System Development, and Maize Growth in Early Stage. Plants 2024, 13, 3185. [Google Scholar] [CrossRef]
  48. Huang, F.; Zhang, W.; Xue, L.; Razavi, B.; Zamanian, K.; Zhao, X. The Microbial Mechanism of Maize Residue Decomposition under Different Temperature and Moisture Regimes in a Solonchak. Sci. Rep. 2025, 15, 2215. [Google Scholar] [CrossRef]
  49. Wang, J.; Li, X.; Chen, A.; Li, Y.; Xue, M.; Feng, S. Effects of Exogenous Organic Matter on Soil Nutrient Dynamics and Its Role in Replacing Chemical Fertilizers for Vegetable Yield and Quality. Horticulturae 2024, 10, 1355. [Google Scholar] [CrossRef]
  50. Canarini, A.; Fuchslueger, L.; Schnecker, J.; Metze, D.; Nelson, D.B.; Kahmen, A.; Watzka, M.; Pötsch, E.M.; Schaumberger, A.; Bahn, M.; et al. Soil Fungi Remain Active and Invest in Storage Compounds during Drought Independent of Future Climate Conditions. Nat. Commun. 2024, 15, 10410. [Google Scholar] [CrossRef]
  51. Kaushal, M.; Wani, S.P. Plant-Growth-Promoting Rhizobacteria: Drought Stress Alleviators to Ameliorate Crop Production in Drylands. Ann. Microbiol. 2016, 66, 35–42. [Google Scholar] [CrossRef]
  52. Parasar, B.J.; Kashyap, S.; Sharma, I.; Marme, S.D.; Das, P.; Agarwala, N. Microbe Mediated Alleviation of Drought and Heat Stress in Plants- Current Understanding and Future Prospects. Discov. Plants 2024, 1, 26. [Google Scholar] [CrossRef]
  53. Wang, Z.; Li, Z.; Zhang, Y.; Liao, J.; Guan, K.; Zhai, J.; Meng, P.; Tang, X.; Dong, T.; Song, Y. Root Hair Developmental Regulators Orchestrate Drought Triggered Microbiome Changes and the Interaction with Beneficial Rhizobiaceae. Nat. Commun. 2024, 15, 10068. [Google Scholar] [CrossRef]
  54. Wu, C.; Zhang, X.; Liu, Y.; Tang, X.; Li, Y.; Sun, T.; Yan, G.; Yin, C. Drought Stress Increases the Complexity of the Bacterial Network in the Rhizosphere and Endosphere of Rice (Oryza sativa L.). Agronomy 2024, 14, 1662. [Google Scholar] [CrossRef]
  55. Dai, Z.; Zang, H.; Chen, J.; Fu, Y.; Wang, X.; Liu, H.; Shen, C.; Wang, J.; Kuzyakov, Y.; Becker, J.N.; et al. Metagenomic Insights into Soil Microbial Communities Involved in Carbon Cycling along an Elevation Climosequences. Environ. Microbiol. 2021, 23, 4631–4645. [Google Scholar] [CrossRef]
  56. Ding, J.-L.; Jiang, X.; Ma, M.-C.; Guan, D.-W.; Zhao, B.-S.; Wei, D.; Cao, F.-M.; Li, L.; Li, J. Structure of soil fungal communities under long-term inorganic and organic fertilization in black soil of Northeast China. zwyyyflxb 2017, 23, 914–923. [Google Scholar] [CrossRef]
  57. Gao, M.; Hu, W.; Li, M.; Wang, S.; Chu, L. Network Analysis Was Effective in Establishing the Soil Quality Index and Differentiated among Changes in Land-Use Type. Soil Tillage Res. 2025, 246, 106352. [Google Scholar] [CrossRef]
  58. Sarkar, S.; Dhar, A.; Dey, S.; Chatterjee, S.K.; Mukherjee, S.; Chakraborty, A.; Chatterjee, G.; Ravisankar, N.; Mainuddin, M. Natural and Organic Input-Based Integrated Nutrient-Management Practices Enhance the Productivity and Soil Quality Index of Rice–Mustard–Green Gram Cropping System. Land 2024, 13, 1933. [Google Scholar] [CrossRef]
  59. Araujo, F.F.; Salvador, G.L.O.; Lupatini, G.C.; Pereira, A.P.D.A.; Costa, R.M.; De Aviz, R.O.; De Alcantara Neto, F.; Mendes, L.W.; Araujo, A.S.F. Exploring the Diversity and Composition of Soil Microbial Communities in Different Soybean-Maize Management Systems. Microbiol. Res. 2023, 274, 127435. [Google Scholar] [CrossRef]
  60. Zhang, Y.; Feng, S.; Wang, J.; Chen, M.; Wang, K.; Liu, C.; Shangguan, Z. Assessing the Change in Soil Water Deficit Characteristics from Grassland to Forestland on the Loess Plateau. Ecol. Indic. 2024, 167, 112616. [Google Scholar] [CrossRef]
  61. Gangana Gowdra, V.M.; Lalitha, B.S.; Halli, H.M.; Senthamil, E.; Negi, P.; Jayadeva, H.M.; Basavaraj, P.S.; Harisha, C.B.; Boraiah, K.M.; Adavi, S.B.; et al. Root Growth, Yield and Stress Tolerance of Soybean to Transient Waterlogging under Different Climatic Regimes. Sci. Rep. 2025, 15, 6968. [Google Scholar] [CrossRef]
  62. He, H.; Xu, M.; Li, W.; Chen, L.; Chen, Y.; Moorhead, D.L.; Brangarí, A.C.; Liu, J.; Cui, Y.; Zeng, Y.; et al. Linking Soil Depth to Aridity Effects on Soil Microbial Community Composition, Diversity and Resource Limitation. Catena 2023, 232, 107393. [Google Scholar] [CrossRef]
Figure 1. Geographical location map of the study area.
Agronomy 15 01355 g001
Figure 2. Changes in soil physicochemical properties under different IWDI gradients: (a) pH, (b) EC, (c) BD, (d) SOM, (ej) nutrient indicators. Significant differences are marked with lowercase letters (p < 0.05).
Agronomy 15 01355 g002
Figure 3. The alpha diversity of the soil bacterial and fungal communities in maize fields under different drought indices. (a) Soil bacterial diversity. (b) Soil fungal diversity. The Shannon, Simpson, Chao1, and Ace indices were used to represent the α-diversity of microbes. *: p < 0.05.
Agronomy 15 01355 g003
Figure 4. Composition of soil bacterial and fungal communities at the phylum level in maize fields under different drought indices. (a) Soil bacterial composition. (b) Soil fungal composition.
Agronomy 15 01355 g004
Figure 5. Dimensionality reduction analysis (PCoA) of soil bacterial and fungal communities in maize fields under different drought indices, based on OTU level and Bray–Curtis distance algorithm. (a) PCoA of soil bacteria. (b) PCoA of soil fungi.
Agronomy 15 01355 g005
Figure 6. Pearson correlation analysis between bacterial and fungal communities and soil properties. The width and thinness of the lines indicate the strength of the relationship between soil microbial communities and soil factors. The color and size of the squares represent the correlations between soil factors. Analysis of the relationship between soil properties and microbial communities. * p < 0.05, ** p < 0.01, *** p < 0.001.
Agronomy 15 01355 g006
Figure 7. Correlation between soil microbial diversity and soil factors. (a) pH value, soil pH. (b) AP, soil available phosphorus. (c) EC, soil electrical conductivity. (d) TK, soil potassium. Linear regression was used for statistical analysis, with significance at (p < 0.05). Due to the large number of soil parameters in this study, only soil factors related to soil microbial diversity are shown here.
Agronomy 15 01355 g007
Figure 8. Soil physicochemical indexes, redundancy analysis (RDA) and heat map analysis of bacteria and fungi at the genus level under different IWDI indices based on environmental factors. (a) Correlation heat map of the top 10 genera of bacterial abundance with environmental factors. (b) Correlation heat map of the top 10 genera with fungal abundance and environmental factors. (c) RDA analysis of bacterial communities at the genus level. (d) RDA analysis of fungal communities at the genus level. The blue arrows in the figure indicate the soil physicochemical factors, and the red arrows indicate the names of the species genus level. The significance level is marked as: * p < 0.05, ** p < 0.01, *** p < 0.001.
Agronomy 15 01355 g008
Figure 9. Functional prediction of soil bacterial and fungal communities under different IWDI indices, displaying the top 10 abundant functional genes. (a) Soil bacterial functional prediction based on FAPROTAX. (b) Soil fungal functional prediction based on FUNG.
Agronomy 15 01355 g009
Figure 10. Soil Quality Index (SQI) and maize yield under different IWDI levels, with soil factor contributions to SQI (a). SQI (b) and yield (c) in 2023, with significant differences (p < 0.05) are indicated by lowercase letters. *: p < 0.05, **: p < 0.01.
Agronomy 15 01355 g010
Table 1. Irrigation Water Deficit Index.
SiteLat and LonTotal P (mm)Total ETcrop (mm)Total Wgross (mm)IWDIGroup
Wenquan44°57′ N, 81°20′ E212.07604.4143016.37%LD
Yining43°52′ N, 81°45′ E157.54663.3340022.30%LD
Tuoli46°04′ N, 83°48′ E148.90579.5735030.54%MD
Chaxian43°42′ N, 81°03′ E159.67667.4835038.10%MD
Qinghe46°41′ N, 90°23′ E112.63545.2126048.36%HD
Wushi41°12′ N, 79°02′ E130.04644.5830047.49%HD
Altai47°25′ N, 88°03′ E108.86592.2428050.00%HD
Note: Total P, total precipitation; Total ETcrop, total crop evapotranspiration; Wgross, total irrigation volume; drought levels are classified as LD, low drought, MD, moderate drought, HD, high drought.
Disclaimer/Publisher’s Note: The statements, opinions and data contained in all publications are solely those of the individual author(s) and contributor(s) and not of MDPI and/or the editor(s). MDPI and/or the editor(s) disclaim responsibility for any injury to people or property resulting from any ideas, methods, instructions or products referred to in the content.

