Article

How the Functional Constitution of Plant Communities in Field Margins Affects Wild Bee Community Composition and Functional Structure

by
Jane Morrison
1,2,3,*,
Jordi Izquierdo
1,
Eva Hernández Plaza
2,4 and
José L. González-Andújar
2
1
Department of Agri-Food Engineering and Biotechnology, Universitat Politècnica de Catalunya, Campus del Baix Llobregat, C/Esteve Terradas 8, 08860 Castelldefels, Spain
2
Institute for Sustainable Agriculture (CSIC), Avda. Menéndez Pelayo s/n, Campus Alameda del Obispo, Aptdo, 14004 Cordoba, Spain
3
Department of Environment, Agriculture and Geography, Bishop’s University, 2600 College St., Sherbrooke, QC J1M 1Z7, Canada
4
Department of Plant Protection, National Institute for Agricultural and Food Research and Technology, Spanish National Research Council (INIA-CSIC), Carretera de la Coruña, Km 7.5, 28040 Madrid, Spain
*
Author to whom correspondence should be addressed.
Agronomy 2025, 15(6), 1354; https://doi.org/10.3390/agronomy15061354
Submission received: 6 May 2025 / Revised: 23 May 2025 / Accepted: 27 May 2025 / Published: 31 May 2025
(This article belongs to the Section Farming Sustainability)

Abstract

:
Concerns about a global decline in pollinators have called for more knowledge about the drivers of wild pollinator abundance and diversity in agroecosystems. Maintaining flowering plants in agricultural field margins is often recommended as a cost-effective and efficient method of offering habitat for wild pollinator conservation. This research involved a three-year, multi-farm study, examining Mediterranean cereal field margins in order to investigate which general and functional characteristics of margin plant communities were important for sustaining wild bee abundance, diversity, community evenness and functional diversity. Wild bees were collected and identified to genus, and a database was compiled listing the morpho-physiological features and behaviours of the observed genera. A database was also compiled of the flowering plant species observed and relevant trait values. General and generalized linear models indicated that margins with a higher percentage of trees and shrubs and higher floral richness displayed positive effects on wild bee diversity and visits to flowers in Mediterranean cereal agroecosystems. They also indicated that high plant functional diversity, in terms of flower colour and morphology, as well as high nectar accessibility, were important to encourage bee visits and community evenness within wild bee assemblages in these field margins. This study stresses the importance of maintaining protected field margins and, when necessary to restore their functionality, sowing floral mixtures with diverse native species, including trees and shrubs, and providing plenty of accessible nectar and a diverse assortment of colours and shapes.

1. Introduction

Maintaining high biodiversity in agroecosystems is generally understood to improve the sustainability of agriculture and the preservation of the environment [1]. A diverse and abundant community of effective pollinators is important not only in its own right but also for maintaining native plant species diversity and ensuring the efficiency and stability of agricultural production [2]. Biologically diverse communities are especially important for enhancing ecosystem resilience and stability [3]. However, as a result of intensive agricultural practices and other human-induced environmental changes, we are experiencing what is being called a ‘global pollinator crisis’—a marked reduction in the diversity, density and distribution of pollinators around the world [4].
Concerns regarding pollinator declines have largely been directed towards wild bees (Hymenoptera: Apiformes), as they are extremely important pollinators due to their high efficiency [5]. In agroecosystems, wild bee declines have been associated with loss of habitat and reduction of floral resources [6,7]. Numerous studies have shown that maintaining a matrix of natural or semi-natural land amongst crops results in more abundant and diverse native bee species [8].
Field margins refer to the uncultivated land between crops. They may contain a great diversity of plants, including trees, shrubs and herbaceous species. Maintaining field margins can be a cost-effective and minimally invasive conservation strategy for bee populations in agroecosystems [9,10]. Yet, the characteristics that make a field margin attractive for bees are not well known [11]. Most studies regarding the restoration of field margins have been carried out with herbaceous plant species in temperate regions, while the role of field margins in Mediterranean agroecosystems is less well known [12]. We are interested in how the general characteristics of plant communities in these field margins influence wild bee communities, including the presence of trees and shrubs in addition to herbaceous plants, as well as the importance of floral richness versus the presence of certain plant families.
Functional diversity and resource accessibility may also play a role. One possibility is that margins with more resource accessibility and with high plant functional diversity will support more abundant and diverse bee communities than functionally homogeneous margins with resources that are more scarce or difficult to access [13]. This is because flowering plant species possess particular morphological and physiological characteristics that attract certain groups of floral visitors over others [14,15]. Higher variability in the attributes of the plant community in the margin would then attract different bee species with distinct requirements, behaviours and morphologies.
Nectar (for carbohydrates) and pollen (for protein, vitamins and minerals) [16] are the ultimate attractive forces driving insect visitors, while flower colour, odour and shape act like “cues” to help insects discriminate between the variety of reward sources available [17]. Plant height may also be an important discerning factor, as many pollinating insects, including bees, attempt to fly and forage at a constant height in order to conserve energy [18]. Margins composed of plant species differing in their attributes for these traits may then be more suitable habitats for a wider variety of bee species. In this manner, higher plant functional diversity may correspond to bee communities with higher functional diversity for morphological and behavioural traits.
Mediterranean cereal agroecosystems are usually rainfed systems in which cereals alternate in short crop sequences with fallow, forage and/or legume crops. Increasing agricultural intensification has led to a reduction in the number and surface area of field margins in these systems, and disturbances (e.g., herbicide drift, tillage, spraying or mowing in the margins) have had negative impacts on their plant community composition [19]. These field margins can vary widely in their structure and composition of plants [20,21], which will likely affect the ecosystems services they can provide.
This work focuses on the relationships between plant and wild bee communities in margins from Mediterranean cereal agroecosystems. The main objectives are as follows:
  • To determine which general characteristics of the plant communities of cereal margins are important for bees (objective 1a) and how these characteristics influence the functional structure of bee communities (objective 1b);
  • To understand the role of functional diversity and resource accessibility in the plant communities of cereal margins and how these factors influence wild bee abundance and community composition (objective 2a), as well as the functional structure of the wild bee community (objective 2b).
This work builds upon the foundational work presented in the author’s PhD thesis [22]. We expect this knowledge could be applied to help conserve wild bee populations in Mediterranean cereal agroecosystems.

2. Materials and Methods

2.1. Study Sites

Sampling of both plant and wild bee communities was carried out at a total of 27 cereal field margins from 2014 to 2016, with different margins being sampled each year. The fields were located in Catalonia, Spain, in the northeastern corner of the Iberian Peninsula. All the fields were located in the cereal belt of this region, which experiences a typical Mediterranean climate: hot and dry summers, cold and dry winters, and wet springs and autumns. From 2014 to 2016, the mean monthly temperature in the cereal belt was 13.8 ± 0.3 °C, and the mean yearly rainfall was 454 ± 164.7 mm [23]. Margins in the studied area are usually comprised of herbaceous plants, with a predominance of evergreen perennials, and often with scattered trees or shrubs. The sampled margins had the following characteristics:
  • They were well established margins, more than one-metre wide.
  • They were located between two cereal crops, between a cereal crop and fallow land, or between a cereal crop and a low traffic country road.
  • The distance between the sampled margins was greater than two kilometres. This distance was chosen because the typical foraging range of most wild bee species is less than one kilometre [24]. This approach allowed us to reasonably assume that the bee community sampled at each site each year was likely distinct [25].
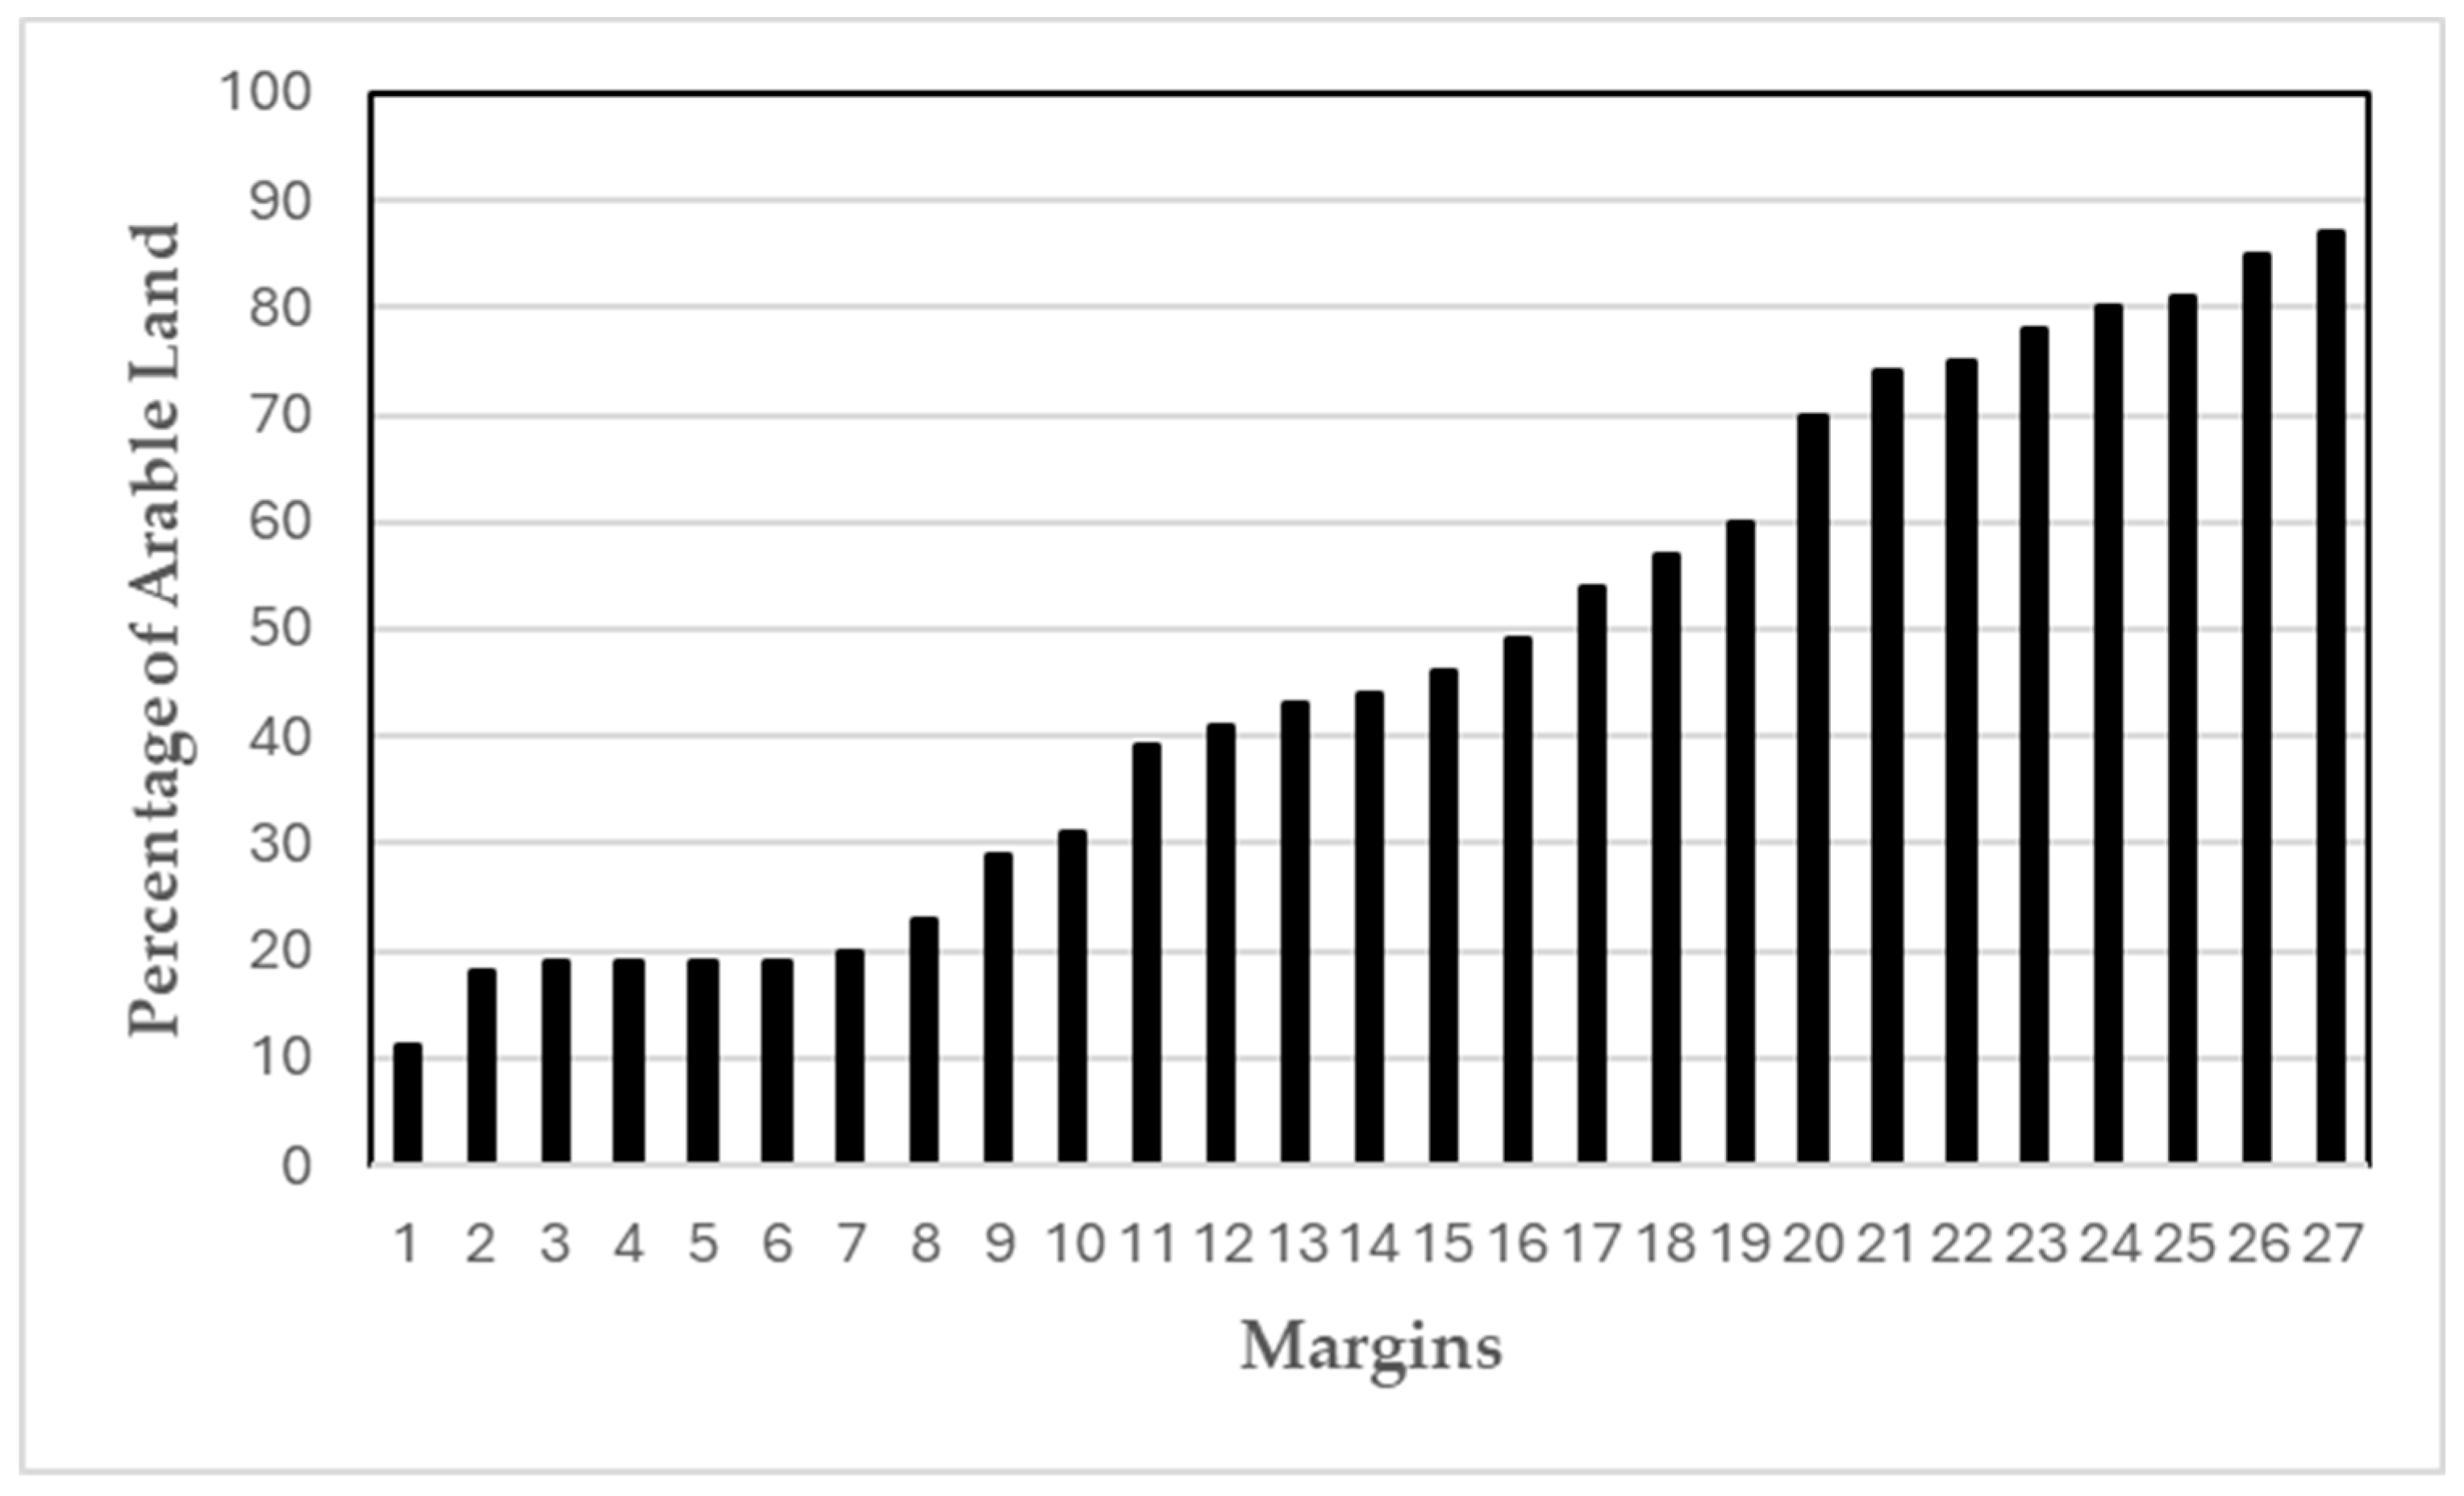
  • The landscapes surrounding the margins show a gradient in percentage of surrounding arable land in order to have a good representation of margins from landscapes with different agricultural intensities.

2.2. Sampling of the Wild Bee Community

This study comprised four days of sampling per margin, dispersed evenly between May and July, the highest period of bee activity. Sampling took place when the temperature was at least 13 °C in 60% clear sky or 17 °C in any sky, with low wind velocity and no rain, following Pywell et al. [26].
Sampling of the wild bee community was realized using pan traps, according to the standard methodology outlined by Westphal et al. [27]. Pan trapping is recognized as the most efficient and least biased method of sampling bee diversity [27]. This methodology has been observed to have no significant negative effect on bee populations [28].
For each margin, a 50-m transect was selected where five trap posts, constructed with rebar and three adjustable metal rings, were placed 10 m apart. On each sampling day, before 10:00 h for all sites, three 500 mL plastic bowls were half-filled with water plus a few drops of liquid detergent and placed on each trap post, situated just above the height of the predominant vegetation. The bowls were painted yellow, blue and white with special UV-bright paint (Spray-Color GmbH, Merzenich, Germany) and placed in the same order from top to bottom along the post for all the traps at all the sites. After 17:00 h, the bowls were removed, filtered, and the contents of the bowls were temporarily stored in sampling jars containing 70% ethanol. The order that margins were sampled varied systematically, and the traps were collected in the same order they were placed.
The bees were pinned into entomological boxes and identified to genus [29], and the inter-tegular distance (ITD) of each specimen was measured as a representation of body size [30]. Specimens were further classified into morphospecies groups according to body size for up to seven discrete categories per genus [31]. Honey bees, Apis mellifera L., were not included in this study as they were likely managed and therefore influenced by external factors [25]. However, we monitored their presence in traps to ensure that high densities, which could indicate nearby managed hives and potential impacts on wild bee communities, were not present. Each year, data from all the pan traps at each margin were combined for all the sampling days, and the total number of wild bee captures (abundance) per margin was calculated. Morphospecies diversity (computed as the Hill number of order one [32]) and evenness (Pielou index) were also calculated for each margin.

2.3. Observations of Bee Foraging Activity in Margins

Observational sampling of bee foraging activity was carried out in order to supplement pan trap data. Visual observations of bee foraging took place on pan trap sampling days between 10:00 h and 17:00 h. In each margin, five 2 m2 observation plots were set surrounding each trap post. During a five-minute period for each observation plot (25 min/margin), the number of times a bee made contact with the sexual organs of a flower was recorded. The order and time of day that each margin was observed varied systematically. Data from all observation plots at each margin were combined for all sampling days, and the total number of visits (foraging activity) was calculated.

2.4. Sampling of the Vegetation Community

On the first day of pan trap sampling, all the living plant species present in 1 × 1 m2 quadrants surrounding each trap post (five per margin) were recorded and their coverage was estimated visually as a percentage. Tree or shrub species were recorded if the canopy was present vertically over the quadrant. In subsequent visits, the plant species inventory was reviewed and updated if necessary. Plants were identified according to Flora Europaea [33]. At the end of the sampling season, an inventory of all the plant species present and the total abundance of each species was compiled for each margin.

2.5. Landscape Structure

Landscape structure was assessed within a circular zone with a 1 km radius from the centre of each transect using the geographic information system program SIGPAC [20,34]. This radius captures an area greater than the average foraging range of the majority of the bee species that were collected in the pan traps [11]. Land use was grouped into seven categories, as defined by SIGPAC: arable land, vineyard or orchard, forest, shrub pasture, tree pasture, grass pasture and other (e.g., water, roads, urban zones). Subsequently, the percentage of arable land surrounding each margin was determined.

2.6. Functional Trait Analysis

2.6.1. Vegetation

All the recorded plant species, including shrubs and trees, from all margins were compiled, and an extensive database was created of all flowering non-Gramineae species, cataloguing the important functional floral trait values of each species (Supplementary Materials, Table S1). Although there have been reports that bees may occasionally collect pollen from grasses [35], because the flowers do not have corollas or nectar, species belonging to the Poaceae family were not included in this analysis. The traits were selected based on their significance for bees and pollination, and their values were collected from several plant databases, encyclopaedias, textbooks and scientific articles. All qualitative floral traits were categorized into distinct groups in order to be further analysed with functional indices (Table 1).
In order to characterize plant functional diversity in each margin, the functional dispersion (FDis) of plant height, flower colour, corolla size and corolla morphology were calculated. Here, FDis calculates the mean distance of the trait value of each plant species to the centroid of that value for all species in the margin. The abundance of each plant species is taken into account by shifting the position of the centroid towards the trait value of the more abundant species and by weighting the distances to the centroid of individual species by their relative abundances [36]. The accessibility of resources in each margin was accessed by computing the community-weighted mean (CWM) for nectar accessibility. CWM is the mean trait value of all species present in the margin, weighted by the relative abundance of each species [37]. Higher values of CWM reflect greater resource accessibility. FDis and CWM were computed using the function dbFD from package FD in R version 4.1.0 [38], omitting any ‘NA’ values.

2.6.2. Bee Genera

In order to identify the bee community functional characteristics that are related to the general and functional characteristics of the plant communities in the margins, a list of values for six functional traits (Table 2) was created (Supplementary Materials, Table S2).
Using the model developed by Greenleaf et al. [24] in package BeeIT, with R software version 4.1.0 [38], tongue length was estimated for all captured specimens. This value is based on ITD and family membership. Due to a limitation in the model, tongue length could not be calculated for bees from the family Melittidae (1.5% of specimens).
Body size and tongue length were calculated as the median value for each genus from our collected specimens. All other values were collected from entomological literature. In cases where these traits could not be generalized to the genus level, bees were categorized according to the properties of the great majority of species within the genus, or, when no great majority was present, multiple categories were listed [40].
The functional structure of bee assemblages was also described by the diversity (FDis) and the abundance (CWM) of each bee trait at each margin. In order to calculate these indices, there could only be one value per trait for each bee genus. Therefore, sociality was expressed as degree of sociality with a value of 1 for genera with only eusocial and semi-social species, 0.5 for genera comprising both social and solitary species, and 0 for genera with only solitary species [41]. Likewise, a value of 1 was given for genera with only oligolectic species, 0.5 for genera with both polylectic and oligolectic species, and 0 for genera with only polylectic species. CWM was not calculated for pollen organ since it is a nominal trait, and FDis was not calculated for sociality and lecty because of the limitations with regards to their categories (presence of overlap between categories).

2.7. Statistical Analysis

General or generalized linear models were used to assess the relationships between the characteristics (general and functional) of the plant communities in the field margins and the abundance, community composition and functional structure of bee assemblages. The models were divided into two types.
Model 1 evaluates the effects of the general characteristics of the plant communities in the margins on bee assemblages and takes into account the influence of surrounding landscape structure. The predictor variables are thus as follows: percentage of surrounding arable land, floral richness, percentage of cover of non-herbaceous plants (trees and shrubs) and percentage of cover of species belonging to families identified in the literature as being important to bees, including Apiaceace, Asteraceae, Fabaceae and Lamiaceae [42]. Margin width was previously found to be non-important for bee diversity [43]; therefore, it was not included in the model.
Model 2 evaluates the effects of the functional diversity and resource accessibility of the plant communities in the margins on bee assemblages. The following predictor variables were selected as indicators of these properties: CWM of nectar accessibility, FDis of flower colour, FDis of mean height, FDis of corolla size and FDis of morphology.
In order to determine which general characteristics of the plant communities of these margins are important for bees (objective 1a), model 1 was run with the following response variables: abundance (total number of wild bee captures in traps), morphospecies diversity (Hill number of order one), morphospecies evenness (Pielou index) and foraging activity (total number of wild bee visits to flowers). To see how these general characteristics influence the functional structure of bee communities (objective 1b), model 1 was run again with the following response variables: the CWM of functional bee traits (sociality, lecty, body size, tongue length and parasitism) and the FDis of functional bee traits (body size, tongue length, parasitism and pollen organ).
To determine which functional characteristics (functional diversity and resource accessibility) of the plant communities are important for bees (objective 2a), model 2 was run with the same community composition response variables as above: abundance, morphospecies diversity, morphospecies evenness and foraging. Finally, to identify relationships between the functional characteristics of both plant and bee communities (objective 2b), model 2 was run with the response variables for the CWM and the FDis of functional bee traits, as identified above.
A Gaussian error distribution was generally used, except in the models explaining the effect of plant functional characteristics on the CWM and FDis of parasitism, where a negative binomial error distribution was used to meet model assumptions. Model assumptions were graphically checked using DHARMa [44]. Analyses were performed in R version 4.1.0 [38].

3. Results

The percentage of arable land surrounding the margins ranged from 11% to 87% (mean = 47%; see Figure 1). In total, 175 different plant species were identified, from 50 different families, of which 149 were non-Gramineae and 33 were shrubs or trees. Over all years, 3489 wild bee specimens were collected in the pan traps, representing 24 different genera from six different families. The most abundant genera were Halictus (52% of all captures), Lasioglossum (19%) and Andrena (7%). A large majority of the bees collected (71% of all captures) belonged to the family Halictidae. See Table 3 for community composition details. The average maximum foraging distance, estimated for all captured specimens based on ITD using the model created by Greenleaf et al. [24], was 0.59 km.
According to the bee trait data, only 3% of all the captured bees were cleptoparasitic. In terms of sociality, 17% of the bees belonged to genera which were strictly solitary, 3% belonged to genera which were strictly social and 80% could be both. For lecty, 78% of the bees belonged to genera known to be polylectic (pollen generalists), while only 2% were oligolectic (pollen specialists), and 20% could not be assigned. For pollen organ, 93% of the bees collected pollen using scopas situated on the legs, 1% used a scopa situated under the abdomen, 3% used corbiculae (pollen baskets) situated on the legs and 3% had no pollen carrying organ (i.e., cleptoparasitic species).
A positive relationship was observed between percentage of surrounding arable land and wild bee abundance and between floral richness and foraging activity (Table 4). An increase in the percentage of cover of non-herbaceous plants also tended to increase morphospecies diversity, though in this case the effect is non-significant (p = 0.05; estimate (EST) = 0.1, and standard error (SE) = 0.06).
The percentage of surrounding arable land was negatively related to the CWM of tongue length, parasitism and body size (though in this case p = 0.05; EST = −0.3, and SE = 0.2) and to the FDis of the same traits (Table 5). The percentage of cover of plant species belonging to important families for bees (Lamiaceae, Apiaceae, Fabaceae and Asteraceae) was significantly positively related with the CWM and the FDis of parasitism.
Regarding the role of specific flower traits, a positive relationship was observed between the FDis of flower colour and morphospecies evenness, between the CWM of nectar accessibility and foraging activity, and between the FDis of morphology and foraging activity (Table 6).
There were no significant relationships between the functional characteristics of plant communities and the functional characteristics of wild bee communities in field margins (Appendix A, Table A1).

4. Discussion

4.1. General Observations

Overall, dynamic insect foraging was witnessed, and bee traps allowed us to collect ample specimens. In terms of wild bee richness, 26 different genera were observed (from 3489 specimens). This level of diversity is in line with other pan trap studies in agroecosystems across the world [45,46,47]. Halictidae bees were the most abundant family of bees collected, which is also the observed dominant family in other studies [45,46]. There was a low proportion of cleptoparasitic and pollen specialist bees, which could indicate poor-quality habitat for these types of species [11,48]. While the cleptoparasitic genera observed in this study nest underground and may be affected by frequent tillage in adjacent cereal fields [49], this pattern was not observed in their ground-nesting hosts. Species-level identification could have provided deeper insight into host–parasite dynamics and improved interpretation of these findings.

4.2. Relationships Between General Characteristics of Plant Communities and Wild Bee Abundance, Community Composition and Functional Structure (Objective 1)

Bee abundance in the field margins increased with the proportion of surrounding arable land, suggesting that, in more homogeneous agricultural landscapes, where continuous nesting sites and floral resources are scarce, field margins may function as concentrated resource patches and ecological refuges. In such contexts, wild bees may depend more heavily on these margins for foraging and nesting [50]. However, these bees tended to be smaller with shorter tongue lengths and comprised fewer cleptoparasitic genera. Additionally, the percentage of surrounding arable land was related to lower diversity of bee communities in these traits (body size, tongue length and parasitism). The fact that fewer cleptoparasitic bees were observed in more intensive agricultural landscapes could be a result of the tilling events taking place in those landscapes and disrupting underground nests, as described above. In general, low cleptoparasitic bee presence could indicate poor quality nesting habitats, as these bees cannot be sustained if there are no adequate host nests [11].
Cleptoparasitic bee presence has been proposed as an indicator of the overall state of a bee community, where a low abundance and diversity of cleptoparasitic bees could imply instability and low diversity within the bee community [46]. This was also reflected in our study by a reduced diversity of body size (with smaller bodies) and tongue length (with shorter tongues). This may explain why a higher abundance and diversity of cleptoparasitic bees were observed when there was a greater percentage of cover of species belonging to plant families important to bees despite the fact that cleptoparasitic bees spend less time foraging than non-parasitic bees [40].
Margins with a higher percentage of cover of trees and shrubs tended to be related to a higher diversity of bees. This trend has been observed in similar studies (e.g., Refs. [8,51]) and could be the result of increased nesting opportunities (greater amounts of dead branches). More specifically, Hannon and Sisk [51] found that flowering shrubs attracted bees that were otherwise uncommon in the landscape. Cirujeda et al. [21] describe how shrubs contribute to the structural complexity of field margins and found that field margins with high percentages of woody and evergreen perennials demonstrated a lower probability of hosting crop weeds that might outcompete valuable floral species that support bee diversity.
Floral species richness positively affected foraging activity (total number of bee visits to a margin). Similarly, numerous other studies using visual observations and netting reported positive influences of floral resources on the presence of flower-visiting insects [7,52]. As floral richness increases, so does variety in bloom periods and potentially the overall temporal availability of pollen and nectar resources in the margin (i.e., across all our sampling dates).
In general, for maintaining bee diversity and visits to the margin, floral richness and the presence of non-herbaceous (in addition to herbaceous) species were found to be more important than having a higher cover of species belonging to plant families important to bees, which only had an effect on cleptoparasitic bees.

4.3. Relationships Between Functional Characteristics of Plant Communities and Wild Bee Abundance, Community Composition and Functional Structure (Objective 2)

Our results indicate that the composition of the wild bee community in the sampled margins was influenced by the functional diversity of the plant communities and the accessibility of floral resources. While none of the plant community functional traits were found to influence wild bee abundance in traps, foraging activity was positively associated with nectar accessibility and diversity in corolla morphology. This contrast likely reflects the different ecological processes captured by each method, highlighting the value of combining approaches. Pan trap efficiency can decline in areas with abundant floral resources due to competition with nearby flowers [53], whereas foraging observations more directly reflect active resource use and account for adjustments based on localized resource availability [54].
A greater variability of flower colours in the margins had a positive influence on the stability of the bee community, as it was related to an increase in morphospecies evenness. Community evenness, a greater similarity between the abundances of different groups of species, is important for preserving the functional stability of an ecosystem because a high majority of one or a few species would be more likely to make the community less resistant to environmental stress [55].
Variability in flower colour and morphology may be acting as gross indicators of variability in multiple other traits (not considered here) in plant communities. This is interesting with regard to establishing management recommendations—it may be more straightforward to select plants with diverse values of these two traits, as opposed to alternate and more complex traits.
Despite our hypothesis that varying vegetation heights in the margin may attract a greater variety of pollinators due to the benefits of niche differentiation (with different species foraging at different vertical levels), in our study, a diversity of plant heights had no influence on bee community composition or foraging activity in the field margins. Furthermore, there were no significant relationships between the functional characteristics of the plant communities and the functional characteristics of the wild bee communities in the field margins. It could be that a larger number of sites or wild bee identification to species would reveal these more subtle relationships.

5. Conclusions

In order to optimize the restoration of field margins for the purpose of conserving pollinating insects in Mediterranean cereal agroecosystems, the characteristics of the plant community should be taken into consideration. Margins with a higher percentage of trees and shrubs and high floral richness displayed positive effects on wild bee diversity and visits to flowers in field margins (objective 1). Margins with flowers with more accessible nectar and high functional diversity in terms of flower colour and morphology encouraged bee visits to the margin and promoted evenness within bee communities (objective 2).
In some situations, maintaining natural field margins may be sufficient for supporting a diverse and stable wild bee community. However, in areas where the presence and diversity of natural vegetation has been drastically reduced, margins could be restored. Floral density, richness and specific floral traits can be increased by supplementing naturally occurring vegetation with sown flower species. Based on this work, it is recommended that, when necessary, sown floral mixtures include a diverse range of native species—including trees and shrubs—and provide abundant, accessible nectar along with a variety of flower colours and shapes to support the widest possible range of bee species.

Supplementary Materials

The following supporting information can be downloaded at: https://www.mdpi.com/article/10.3390/agronomy15061354/s1, Table S1: Functional flowering plant traits; Table S2: Functional bee genera traits; Table S3: Estimate and standard error of significant relationships between general characteristics of plant communities and wild bee abundance and community composition in field margins (Table 4 and Table 5); Table S4: Estimate and standard error of significant relationships between functional characteristics of plant communities and wild bee abundance and community composition in field margins (Table 6).

Author Contributions

Conceptualization, J.M., J.I. and J.L.G.-A.; methodology, J.M., J.I., E.H.P. and J.L.G.-A.; formal analysis, J.M., E.H.P. and J.L.G.-A.; investigation, J.M. and J.I.; writing—original draft preparation, J.M.; writing—review and editing, J.M., J.I., E.H.P. and J.L.G.-A.; supervision, J.I. and J.L.G.-A.; project administration, J.M., J.I. and J.L.G.-A.; funding acquisition, J.M. and J.L.G.-A. All authors have read and agreed to the published version of the manuscript.

Funding

This research was funded by the European Regional Development Fund (ERDF) and the Spanish Ministry of Economy and Competitiveness (projects AGL2012-33736 and AGL2015-64130-R). The Natural Sciences and Engineering Research Council of Canada (NSERC) provided J.M. with a doctoral scholarship (CGS D).

Data Availability Statement

Trait data supporting the findings of this study are available in Supplementary Materials. Additional plant data from this study can be found in the TRY Plant Trait Database: https://doi.org/10.1111/gcb.14904. Additional raw data is available from the corresponding author upon reasonable request.

Acknowledgments

We thank the farmers for their cooperation and allowing us access to their lands.

Conflicts of Interest

The authors declare no conflicts of interest.

Abbreviations

The following abbreviations are used in this manuscript:
FDisFunctional dispersion
CWMCommunity-weighted mean
ESTEstimate
SEStandard error

Appendix A

Table A1. Relationships between functional characteristics of plant communities and functional characteristics of wild bee communities in field margins (objective 2b). Summary of F-test (F) on general linear models for CWM response variables. Degrees of freedom of predictor variables = 1 in all cases, and n = 27.
General Characteristics (Predictor Variables) Wild Bee Community (Response Variables)
CWM SocialityCWM LectyCWM Body SizeCWM Tongue LengthCWM ParasitismFDis Body SizeFDis Tongue LengthFDis ParasitismFDis Pollen Organ
FpFpFpFpFpFpFpFpFp
FDis Mean Height0.00.940.01.000.90.351.30.272.90.110.10.730.50.500.70.400.30.60
FDis Corolla Size3.70.072.70.112.20.163.30.081.80.200.50.480.50.482.90.113.70.07
FDis Flower Colour0.20.660.20.670.80.392.20.161.00.320.50.470.50.470.30.602.90.10
CWM Nectar Accessibility0.30.603.70.071.40.250.00.840.00.971.00.320.40.540.50.480.70.41
FDis Morphology1.00.331.30.272.60.122.70.120.00.922.80.113.00.101.70.212.50.13
Adjusted R20.1 0.2 0.1 0.10.10.00.0 0.1 0.2

References

  1. Feledyn-Szewczyk, B.; Kuś, J.; Stalenga, J.; Berbeć, A.K.; Radzikowski, P. The Role of Biological Diversity in Agroecosystems and Organic Farming. In Organic Farming: A Promising Way of Food Production; Konvalina, P., Ed.; IntechOpen: Rijeka, Croatia, 2016. [Google Scholar]
  2. Balzan, M.V.; Bocci, G.; Moonen, A.-C. Augmenting Flower Trait Diversity in Wildflower Strips to Optimise the Conservation of Arthropod Functional Groups for Multiple Agroecosystem Services. J. Insect Conserv. 2014, 18, 713–728. [Google Scholar] [CrossRef]
  3. Senapathi, D.; Fründ, J.; Albrecht, M.; Garratt, M.P.D.; Kleijn, D.; Pickles, B.J.; Potts, S.G.; An, J.; Andersson, G.K.S.; Bänsch, S.; et al. Wild Insect Diversity Increases Inter-Annual Stability in Global Crop Pollinator Communities. Proc. R. Soc. B Biol. Sci. 2021, 288, 20210212. [Google Scholar] [CrossRef] [PubMed]
  4. Shivanna, K.R.; Tandon, R.; Koul, M. Diversity. In Reproductive Ecology of Flowering Plants: Patterns and Processes; Tandon, R., Shivanna, K., Koul, M., Eds.; Springer Singapore: Singapore, 2020; pp. 395–413. [Google Scholar]
  5. Ricketts, T.H.; Lonsdorf, E. Mapping the Margin: Comparing Marginal Values of Tropical Forest Remnants for Pollination Services. Ecol. Appl. 2013, 23, 1113–1123. [Google Scholar] [CrossRef]
  6. Koh, I.; Lonsdorf, E.V.; Williams, N.M.; Brittain, C.; Isaacs, R.; Gibbs, J.; Ricketts, T.H. Modeling the Status, Trends, and Impacts of Wild Bee Abundance in the United States. Proc. Natl. Acad. Sci. USA 2016, 113, 140–145. [Google Scholar] [CrossRef] [PubMed]
  7. Nicholls, C.I.; Altieri, M.A. Plant Biodiversity Enhances Bees and Other Insect Pollinators in Agroecosystems. A Review. Agron. Sustain. Dev. 2013, 33, 257–274. [Google Scholar] [CrossRef]
  8. Morandin, L.A.; Kremen, C. Hedgerow Restoration Promotes Pollinator Populations and Exports Native Bees to Adjacent Fields. Ecol. Appl. 2013, 23, 829–839. [Google Scholar] [CrossRef]
  9. Cirujeda, A.; Pardo, G. The Role of Field Margins in Biodiversity Conservation in Agroecosystems. In Reconciling Agricultural Production with Biodiversity Conservation; Bàrberi, P., Moonen, A.-C., Eds.; Burleigh Dodds Science Publishing: London, UK, 2020; pp. 146–176. [Google Scholar]
  10. Lagerlöf, J.; Stark, J.; Svensson, B. Margins of Agricultural Fields as Habitats for Pollinating Insects. Agric. Ecosyst. Environ. 1992, 40, 117–124. [Google Scholar] [CrossRef]
  11. McKechnie, I.M.; Thomsen, C.J.M.; Sargent, R.D. Forested Field Edges Support a Greater Diversity of Wild Pollinators in Lowbush Blueberry (Vaccinium Angustifolium). Agric. Ecosyst. Environ. 2017, 237, 154–161. [Google Scholar] [CrossRef]
  12. Sanchez, J.; Carrasco, A.; La Spina, M.; Pérez-Marcos, M.; Ortiz-Sánchez, F. How Bees Respond Differently to Field Margins of Shrubby and Herbaceous Plants in Intensive Agricultural Crops of the Mediterranean Area. Insects 2019, 11, 26. [Google Scholar] [CrossRef]
  13. Campbell, A.J.; Biesmeijer, J.C.; Varma, V.; Wäckers, F.L. Realising Multiple Ecosystem Services Based on the Response of Three Beneficial Insect Groups to Floral Traits and Trait Diversity. Basic. Appl. Ecol. 2012, 13, 363–370. [Google Scholar] [CrossRef]
  14. Bosch, J.; Retana, J.; Cerdá, X. Flowering Phenology, Floral Traits and Pollinator Composition in a Herbaceous Mediterranean Plant Community. Oecologia 1997, 109, 583–591. [Google Scholar] [CrossRef] [PubMed]
  15. Morrison, J.; Izquierdo, J.; Hernández Plaza, E.; González-Andújar, J.L. The Attractiveness of Five Common Mediterranean Weeds to Pollinators. Agronomy 2021, 11, 1314. [Google Scholar] [CrossRef]
  16. Sammataro, D.; Yoder, J. Honey Bee Colony Health: Challenges and Sustainable Solutions; CRC Press: Boca Raton, FL, USA, 2011. [Google Scholar]
  17. Real, L. Pollination Biology; Elsevier: Raleigh, NA, USA, 2012. [Google Scholar]
  18. Dafni, A.; Potts, S.G. The Role of Flower Inclination, Depth, and Height in the Preferences of a Pollinating Beetle (Coleoptera: Glaphyridae). J. Insect Behav. 2004, 17, 823–834. [Google Scholar] [CrossRef]
  19. José-María, L.; Armengot, L.; Blanco-Moreno, J.M.; Bassa, M.; Sans, F.X. Effects of Agricultural Intensification on Plant Diversity in Mediterranean Dryland Cereal Fields. J. Appl. Ecol. 2010, 47, 832–840. [Google Scholar] [CrossRef]
  20. Pallavicini, Y.; Bastida, F.; Hernández-Plaza, E.; Petit, S.; Izquierdo, J.; Gonzalez-Andujar, J.L. Local Factors Rather than the Landscape Context Explain Species Richness and Functional Trait Diversity and Responses of Plant Assemblages of Mediterranean Cereal Field Margins. Plants 2020, 9, 778. [Google Scholar] [CrossRef]
  21. Cirujeda, A.; Pardo, G.; Marí, A.I.; Aibar, J.; Pallavicini, Y.; González-Andújar, J.L.; Recasens, J.; Solé-Senan, X.O. The Structural Classification of Field Boundaries in Mediterranean Arable Cropping Systems Allows the Prediction of Weed Abundances in the Boundary and in the Adjacent Crop. Weed Res. 2019, 59, 300–311. [Google Scholar] [CrossRef]
  22. Morrison, J. Flowering Native Weeds for the Conservation of Wild Pollinators in Agroecosystems; Universitat Politècnica de Catalunya: Castelldefels, Spain, 2018. [Google Scholar]
  23. Ruralcat. Available online: http://ruralcat.gencat.cat (accessed on 1 March 2023).
  24. Greenleaf, S.S.; Williams, N.M.; Winfree, R.; Kremen, C. Bee Foraging Ranges and Their Relationship to Body Size. Oecologia 2007, 153, 589–596. [Google Scholar] [CrossRef]
  25. Riedinger, V.; Mitesser, O.; Hovestadt, T.; Steffan-Dewenter, I.; Holzschuh, A. Annual Dynamics of Wild Bee Densities: Attractiveness and Productivity Effects of Oilseed Rape. Ecology 2015, 96, 1351–1360. [Google Scholar] [CrossRef]
  26. Pywell, R.F.; Warman, E.A.; Carvell, C.; Sparks, T.H.; Dicks, L.V.; Bennett, D.; Wright, A.; Critchley, C.N.R.; Sherwood, A. Providing Foraging Resources for Bumblebees in Intensively Farmed Landscapes. Biol. Conserv. 2005, 121, 479–494. [Google Scholar] [CrossRef]
  27. Westphal, C.; Bommarco, R.; Carré, G.; Lamborn, E.; Morison, N.; Petanidou, T.; Potts, S.G.; Roberts, S.P.M.; Szentgyörgyi, H.; Tscheulin, T.; et al. Measuring Bee Diversity in Different European Habitats and Biogeographical Regions. Ecol. Monogr. 2008, 78, 653–671. [Google Scholar] [CrossRef]
  28. Gezon, Z.J.; Wyman, E.S.; Ascher, J.S.; Inouye, D.W.; Irwin, R.E. The Effect of Repeated, Lethal Sampling on Wild Bee Abundance and Diversity. Methods Ecol. Evol. 2015, 6, 1044–1054. [Google Scholar] [CrossRef]
  29. Ascher, J.S.; Pickering, J. Discover Life Bee Species and World Checklist (Hymenoptera: Apoidea: Anthophila). Available online: https://www.discoverlife.org (accessed on 1 September 2014).
  30. Cane, J.H. Estimation of Bee Size Using Intertegular Span (Apoidea). J. Kans. Entomol. Soc. 1987, 60, 145–147. [Google Scholar]
  31. van Rijn, I.; Neeson, T.M.; Mandelik, Y. Reliability and Refinement of the Higher Taxa Approach for Bee Richness and Composition Assessments. Ecol. Appl. 2015, 25, 88–98. [Google Scholar] [CrossRef] [PubMed]
  32. Chao, A.; Chiu, C.H.; Jost, L. Unifying Species Diversity, Phylogenetic Diversity, Functional Diversity, and Related Similarity and Differentiation Measures through Hill Numbers. Annu. Rev. Ecol. Evol. Syst. 2014, 45, 297–324. [Google Scholar] [CrossRef]
  33. Tutin, T. Flora Europaea; Cambridge University Press: Cambridge, UK, 1964. [Google Scholar]
  34. Sistema de Información Geográfica de Parcelas Agrícolas. 1 March. Available online: http://sigpac.mapa.es/fega/visor/ (accessed on 1 March 2023).
  35. Gous, A.; Eardley, C.D.; Johnson, S.D.; Swanevelder, D.Z.H.; Willows-Munro, S. Floral Hosts of Leaf-Cutter Bees (Megachilidae) in a Biodiversity Hotspot Revealed by Pollen DNA Metabarcoding of Historic Specimens. PLoS ONE 2021, 16, e0244973. [Google Scholar] [CrossRef]
  36. Laliberté, E.; Legendre, P. A Distance-based Framework for Measuring Functional Diversity from Multiple Traits. Ecology 2010, 91, 299–305. [Google Scholar] [CrossRef]
  37. Lavorel, S.; Grigulis, K.; McIntyre, S.; Williams, N.S.G.; Garden, D.; Dorrough, J.; Berman, S.; Quétier, F.; Thébault, A.; Bonis, A. Assessing Functional Diversity in the Field—Methodology Matters! Funct. Ecol. 2008, 22, 134–147. [Google Scholar] [CrossRef]
  38. R Development Core Team, R. A Language and Environment for Statistical Computing; R Development Core Team R: Auckland, New Zealand, 2021. [Google Scholar]
  39. Williams, N.M.; Crone, E.E.; Roulston, T.H.; Minckley, R.L.; Packer, L.; Potts, S.G. Ecological and Life-History Traits Predict Bee Species Responses to Environmental Disturbances. Biol. Conserv. 2010, 143, 2280–2291. [Google Scholar] [CrossRef]
  40. Russell, K.N.; Ikerd, H.; Droege, S. The Potential Conservation Value of Unmowed Powerline Strips for Native Bees. Biol. Conserv. 2005, 124, 133–148. [Google Scholar] [CrossRef]
  41. Forrest, J.R.K.; Thorp, R.W.; Kremen, C.; Williams, N.M. Contrasting Patterns in Species and Functional-trait Diversity of Bees in an Agricultural Landscape. J. Appl. Ecol. 2015, 52, 706–715. [Google Scholar] [CrossRef]
  42. Kuppler, J.; Neumüller, U.; Mayr, A.V.; Hopfenmüller, S.; Weiss, K.; Prosi, R.; Schanowski, A.; Schwenninger, H.-R.; Ayasse, M.; Burger, H. Favourite Plants of Wild Bees. Agric. Ecosyst. Environ. 2023, 342, 108266. [Google Scholar] [CrossRef]
  43. Morrison, J.; Izquierdo, J.; Plaza, E.H.; González-Andújar, J.L. The Role of Field Margins in Supporting Wild Bees in Mediterranean Cereal Agroecosystems: Which Biotic and Abiotic Factors Are Important? Agric. Ecosyst. Environ. 2017, 247, 216–224. [Google Scholar] [CrossRef]
  44. Hartig, F. DHARMa: Residual Diagnostics for Hierarchical (Multi-Level/Mixed) Regression Models; The Comprehensive R Archive Network: Berlin, Germany, 2022. [Google Scholar]
  45. Droege, S.; Tepedino, V.J.; Lebuhn, G.; Link, W.; Minckley, R.L.; Chen, Q.; Conrad, C. Spatial Patterns of Bee Captures in North American Bowl Trapping Surveys. Insect Conserv. Divers. 2010, 3, 15–23. [Google Scholar] [CrossRef]
  46. Le Féon, V.; Poggio, S.L.; Torretta, J.P.; Bertrand, C.; Molina, G.A.R.; Burel, F.; Baudry, J.; Ghersa, C.M. Diversity and Life-History Traits of Wild Bees (Insecta: Hymenoptera) in Intensive Agricultural Landscapes in the Rolling Pampa, Argentina. J. Nat. Hist. 2016, 50, 1175–1196. [Google Scholar] [CrossRef]
  47. Nielsen, A.; Steffan-Dewenter, I.; Westphal, C.; Messinger, O.; Potts, S.G.; Roberts, S.P.M.; Settele, J.; Szentgyörgyi, H.; Vaissière, B.E.; Vaitis, M.; et al. Assessing Bee Species Richness in Two Mediterranean Communities: Importance of Habitat Type and Sampling Techniques. Ecol. Res. 2011, 26, 969–983. [Google Scholar] [CrossRef]
  48. Kleijn, D.; Winfree, R.; Bartomeus, I.; Carvalheiro, L.G.; Henry, M.; Isaacs, R.; Klein, A.-M.; Kremen, C.; M’Gonigle, L.K.; Rader, R.; et al. Delivery of Crop Pollination Services Is an Insufficient Argument for Wild Pollinator Conservation. Nat. Commun. 2015, 6, 7414. [Google Scholar] [CrossRef]
  49. Ullmann, K.S.; Cane, J.H.; Thorp, R.W.; Williams, N.M. Soil Management for Ground-Nesting Bees. In Towards Sustainable Crop Pollination Services—Measures at Field, Farm and Landscape Scales; Gemmill-Herren, B., Azzu, N., Bicksler, A., Guidotti, A., Eds.; FAO: Rome, Italy, 2020; ISBN 978-92-5-132578-0. [Google Scholar]
  50. Carvell, C.; Osborne, J.L.; Bourke, A.F.G.; Freeman, S.N.; Pywell, R.F.; Heard, M.S. Bumble Bee Species’ Responses to a Targeted Conservation Measure Depend on Landscape Context and Habitat Quality. Ecol. Appl. 2011, 21, 1760–1771. [Google Scholar] [CrossRef]
  51. Hannon, L.E.; Sisk, T.D. Hedgerows in an Agri-Natural Landscape: Potential Habitat Value for Native Bees. Biol. Conserv. 2009, 142, 2140–2154. [Google Scholar] [CrossRef]
  52. Rosa García, R.; Miñarro, M. Role of Floral Resources in the Conservation of Pollinator Communities in Cider-Apple Orchards. Agric. Ecosyst. Environ. 2014, 183, 118–126. [Google Scholar] [CrossRef]
  53. Chamorro, F.J.; Faria, C.M.A.; Araújo, F.S.; Freitas, B.M. Elevated Pan Traps Optimise the Sampling of Bees, Including When the Availability of Floral Resources Is High. Insect Conserv. Divers. 2023, 16, 16–32. [Google Scholar] [CrossRef]
  54. Ogilvie, J.E.; Forrest, J.R. Interactions between Bee Foraging and Floral Resource Phenology Shape Bee Populations and Communities. Curr. Opin. Insect Sci. 2017, 21, 75–82. [Google Scholar] [CrossRef] [PubMed]
  55. Wittebolle, L.; Marzorati, M.; Clement, L.; Balloi, A.; Daffonchio, D.; Heylen, K.; De Vos, P.; Verstraete, W.; Boon, N. Initial Community Evenness Favours Functionality under Selective Stress. Nature 2009, 458, 623–626. [Google Scholar] [CrossRef] [PubMed]
Figure 1. The percentage of arable land surrounding the studied margins, assessed within a circular zone with a 1 km radius centred on the midpoint of each margin transect.
Agronomy 15 01354 g001
Table 1. Functional plant and floral traits and the categories used for coding.
TraitCategories
Nectar AccessibilityNone, Concealed, Partly Exposed, Fully Exposed
Flower ColourBlue/Dark Purple, Green, Orange/Red, Pink/Light Purple, White/Cream, Yellow
Height (Mean)Continuous
Corolla Size (Mean Radius)Continuous
Flower MorphologyBell, Disk, Flag, Funnel, Lip, Ray, Ray and Disk
Table 2. Functional bee traits and the categories used for coding.
TraitCategories
Sociality1 (only social 1 species)
0.5 (both social and solitary species)
0 (only solitary species)
Lecty (diet specialization) 21 (only oligolectic species)
0.5 (both oligolectic and polylectic species)
0 (only polylectic species)
Body Size (Median ITD)Continuous
Tongue Length (Median)Continuous
Parasitism1 (cleptoparasitic)
0 (non-parasitic)
Pollen OrganCorbicula, Crop (“honey stomach”), Scopa Abdomen (scopa found on abdomen), Scopa Leg (scopa found on leg), Scopa Abdomen & Leg (scopa found on both the abdomen and the leg), Scopa Leg & Propodeum (scopa found on both the leg and the propodeum), Scopa & Floccus Leg (scopa and floccus found on the leg), None
1 Social includes eusocial and semi-social species [39]. 2 Includes oil preference and refers only to nectar for cleptoparasites.
Table 3. Wild bee community composition details.
Across Individual MarginsOverall
Total Bee AbundanceMorphospecies RichnessMorphospecies DiversityMorphospecies EvennessBody Size (ITD; mm)Tongue Length (mm)
Min.3893.20.450.40.6
Max.2953117.80.937.715.1
Mean1292111.20.781.82.5
Table 4. Relationships between general characteristics of plant communities and wild bee abundance and community composition in field margins (objective 1a). Summary of F-test (F) or Chi-square (Chi-sq) on general or generalized linear models, respectively, for response variables. Degrees of freedom of predictor variables = 1 in all cases, and n = 27.
General Characteristics (Predictor Variables)Wild Bee Community (Response Variables)
AbundanceMorphospecies DiversityMorphospecies EvennessForaging Activity 1
FpFpFpChi-sqp
% Arable Land6.00.02 (+)0.30.601.50.231.50.23
% Non-herbaceous Plants0.30.614.20.050.70.430.240.63
Floral Richness0.00.870.00.910.00.945.70.02 (+)
% Important Families0.10.780.10.770.30.620.90.34
Adjusted R20.10.20.1
Significant p values (p < 0.05) are in bold, where (+) = a positive relationship. Estimate and standard error for significant relationships can be found in Supplementary Materials, Table S3. 1 Foraging activity model uses a negative binomial distribution.
Table 5. Relationships between general characteristics of plant communities and functional characteristics of wild bee communities in field margins (objective 1b). Summary of F-test (F) on general linear models for CWM response variables. Degrees of freedom of predictor variables = 1 in all cases, and n = 27.
General Characteristics (Predictor Variables)Wild Bee Community (Response Variables)
CWM SocialityCWM LectyCWM Body SizeCWM Tongue LengthCWM ParasitismFDis Body SizeFDis Tongue LengthFDis ParasitismFDis Pollen Organ
FpFpFpFpFpFpFpFpFp
% Arable Land0.10.710.40.514.10.058.10.009 (−)7.00.02 (−)12.70.002 (−)12.00.002 (−)6.30.02 (−)3.90.06
% Non-herbaceous Plants2.60.120.60.451.60.221.00.321.40.240.10.780.10.741.60.210.00.99
Floral Richness0.40.520.90.350.00.880.90.353.30.080.10.760.30.572.20.151.10.31
% Important Families0.00.960.40.560.30.590.10.807.20.01 (+)0.20.640.10.726.70.02 (+)0.60.46
Adjusted R20.0 0.1 0.1 0.20.40.30.3 0.4 0.3
Significant p values (p < 0.05) are in bold, where (+) = a positive relationship and (−) = a negative relationship. Estimate and standard error for significant relationships can be found in Supplementary Materials, Table S3.
Table 6. Relationships between functional characteristics of plant communities and wild bee abundance and community composition in field margins (objective 2a). Summary of F-test (F) or Chi-square (Chi-sq) on general or generalized linear models, respectively, for response variables. Degrees of freedom of predictor variables = 1 in all cases, and n = 27.
Functional Characteristics (Predictor Variables)Wild Bee Community (Response Variables)
AbundanceMorphospecies DiversityMorphospecies EvennessForaging Activity 1
FpFpFpChi-sqp
FDis Mean Height0.80.370.00.840.20.670.10.76
FDis Corolla Size0.20.634.50.052.20.152.20.14
FDis Flower Colour0.90.362.10.165.20.03 (+)0.40.53
CWM Nectar Accessibility2.30.140.20.660.30.5911.80.001 (+)
FDis Morphology0.10.760.80.370.20.6814.60.0001 (+)
Adjusted R20.10.10.2
Significant p values (p < 0.05) are in bold, where (+) = a positive relationship. Estimate and standard error for significant relationships can be found in Supplementary Materials, Table S4. 1 Foraging activity model uses a negative binomial.
Disclaimer/Publisher’s Note: The statements, opinions and data contained in all publications are solely those of the individual author(s) and contributor(s) and not of MDPI and/or the editor(s). MDPI and/or the editor(s) disclaim responsibility for any injury to people or property resulting from any ideas, methods, instructions or products referred to in the content.

