Article

Integrated Effects of Warming Irrigation, Aeration, and Humic Acid on Yield, Quality, and GHG Emissions in Processing Tomatoes in Xinjiang

1
College of Water Conservancy & Architectural Engineering, Shihezi University, Shihezi 832000, China
2
Key Laboratory of Modern Water–Saving Irrigation of Xinjiang Production & Construction Group, Shihezi University, Shihezi 832000, China
3
Technology Innovation Center for Agricultural Water and Fertilizer Efficiency Equipment of Xinjiang Production & Construction Corps, Shihezi 832000, China
4
Key Laboratory of Northwest Oasis Water–Saving Agriculture, Ministry of Agriculture and Rural Affairs, Shihezi 832000, China
5
Xinjiang Xinlianxin Energy and Chemical Company Limited, Manasi 832200, China
*
Author to whom correspondence should be addressed.
Agronomy 2025, 15(6), 1353; https://doi.org/10.3390/agronomy15061353
Submission received: 30 April 2025 / Revised: 22 May 2025 / Accepted: 28 May 2025 / Published: 31 May 2025
(This article belongs to the Section Horticultural and Floricultural Crops)

Abstract

Agricultural greenhouse gas emissions continue to rise year after year, contributing significantly to global warming—an escalating crisis that demands urgent attention. In order to address this issue, it is crucial to investigate the relationship between greenhouse gas emissions from farmland and crop yield and quality through comprehensive regulation of the soil micro-environment by inputting water, fertilizer, gas, and heat. Therefore, we conducted field experiments in 2024 to examine the effects of different water, fertilizer, gas, and heat conditions on the yield, quality, greenhouse gas emissions, net global warming potential (NGWP), and greenhouse gas emission intensity (GHGI) of processing tomatoes in Xinjiang, China. This study established two irrigation water temperatures (T0: the local irrigation water temperature, approximately 10–15 °C; and T1: warming irrigation, 20–25 °C), two humic acid application rates (H0: 0% and H1: 0.5%, % as a percentage of total fertilizer application), and three aeration methods (A0: no aeration, A1: Venturi aerated, and A2: micro–nano aerated) during the growth period. The results showed that the number of fruits per hectare (NP), vitamin C (VC) content, titratable acidity and lycopene content were all significantly increased with increasing temperature, application of 0.5% humic acid, and aeration. Warming has little effect on GHGI, while humic acid application and aeration have significant and extremely significant effects on GHGI. The GHGI of humic acid treatment was 7.70% lower than that of H0, and the GHGI of micro–nano aeration and Venturi aeration treatment was 18.95% and 6.85% lower than that of A0, respectively. We employed a comprehensive evaluation model that focused on overall differences to assess yield, quality, economic benefits, and environmental impact (GHGI, global warming potential). The optimal strategy identified comprised 20–25 °C irrigation, micro–nano aeration, and 0.5% humic acid, which collectively achieved the highest scores in yield, quality, and emission reduction. This study establishes a theoretical and technical foundation for the sustainable and efficient production of tomatoes in the arid regions of Northern Xinjiang.

1. Introduction

Processing tomatoes hold an important position in agricultural production due to their edible, medicinal, and economic value and vitality [1]. Xinjiang has sufficient sunshine, a large temperature difference between daytime and nighttime, and predominantly sandy soils and sandy loams, which provide suitable light, heat, and soil conditions for the growth of processing tomato [2]. However, the scarcity of rainfall in Xinjiang has become a constraint to further developing the ‘red industry’. In order to grow processing tomatoes in large areas of the region, drip irrigation was introduced, which can effectively conserve water and moisture. However, its shortcomings have gradually become apparent in the long-term use of drip irrigation under the membrane. Long-term sub-film drip irrigation reduces soil porosity near the drip head, which hinders oxygen diffusion [3] and thus affects soil aeration, which is exacerbated by film covering [4]. Micro–nano aerated irrigation is an aeration method that uses micro–nano aerated water to circulate the aeration of irrigation water, thereby increasing its oxygen content. Studies have shown that aerated irrigation can increase soil microbial and enzyme activity [5], which in turn increases root vigor [6], enhances root uptake of nutrients and water, helps roots transport nutrients from the soil, and ultimately improves yield quality [7]. Micro–nano aeration exhibits superior stability and higher dissolution efficiency compared to traditional methods, such as Venturi aeration, chemical aeration, and air pumps [8]. Additionally, when integrated with drip irrigation, the irrigation water containing micro–nano bubbles is delivered directly to the area near the crop roots via drippers, thereby further enhancing the aeration efficiency [9]. Micro–nano bubble water, owing to the diminutive size of its bubbles, exhibits enhanced stability in the soil when irrigated over extended periods. These bubbles are more prone to adhere to the root surface, thereby altering the adsorption characteristics of the root surface and facilitating root growth, as well as nutrient absorption [10]. However, micro–nano aeration are mostly applied in industry, and less research has been conducted on its use in field crops.
Soil temperature is a critical factor influencing crop growth [11], with the optimal range for processing tomato growth being 15–26 °C. In Xinjiang, however, agricultural irrigation primarily relies on glacier meltwater and groundwater from wells, which typically have temperatures ranging from 8 to 12 °C and can be even lower for glacier meltwater. This issue is exacerbated in shallow-buried sub-film drip irrigation systems, where the natural warming of irrigation water by sunlight is minimized [12]. Consequently, direct irrigation using well water or glacier meltwater can significantly reduce soil temperature within the root zone, inhibiting water and nutrient uptake by the crop root system [13]. Additionally, this decreased temperature can suppress the enzyme activities involved in biochemical metabolism [14] and reduce stomatal conductance in leaves, thereby inhibiting photosynthesis [15]. Ultimately, these factors negatively impact crop yield and quality [16].
Over-application of fertilizer has led to low fertilizer utilization and soil and groundwater pollution in recent years. Adding humic acid to fertilizers has been found to improve the utilization of nitrogen, phosphorus, and potassium [17]. Humic acid is widely used in synthetic and organic fertilizers and can effectively improve soil structure, promote plant cell elongation, root growth, and nutrient transport and absorption, as well as increase the photosynthetic rate, thereby positively affecting root, leaf, and fruit development [18]. Therefore, humic acid has great potential to enhance fertilizer efficiency, reduce agricultural surface pollution, improve soil fertility, and promote crop growth and development [19]. Since micro–nano aeration and humic acid application have significant effects on improving soil structure, increasing soil aeration, and thus improving the soil micro-environment and promoting crop growth and development, as well as increasing yield and improving quality [20], is it possible to achieve high crop yield and high quality through the synergistic effect of these two factors?
Agricultural ecosystems are an important source of greenhouse gas emission [21]. With social development and people’s needs, greenhouse gas emissions from agriculture have been increasing, and the high irrigation and nitrogen application in current agricultural production have resulted in a large amount of greenhouse gases, which has more seriously exacerbated global warming [22], with agricultural CO2, N2O, and CH4 emissions accounting for 31%, 78%, and 53%, respectively, of the global emissions from anthropogenic activities (IPCC 2021). As an important economic pillar in China, facility-based agriculture is also a major source of carbon emission and has considerable potential for emission reduction. We aim to identify an optimal coupled drip irrigation model that effectively balances yield enhancement, quality improvement, and emission reduction, based on a comprehensive differential combination evaluation. In this study, a joint evaluation method was used to comprehensively evaluate the yield, quality, and greenhouse effect under different humic acid application rates, aerification amounts, and warming–coupling modes, and the optimal coupling mode was screened out to provide a reference for irrigation decision-making in processing tomato.

2. Materials and Methods

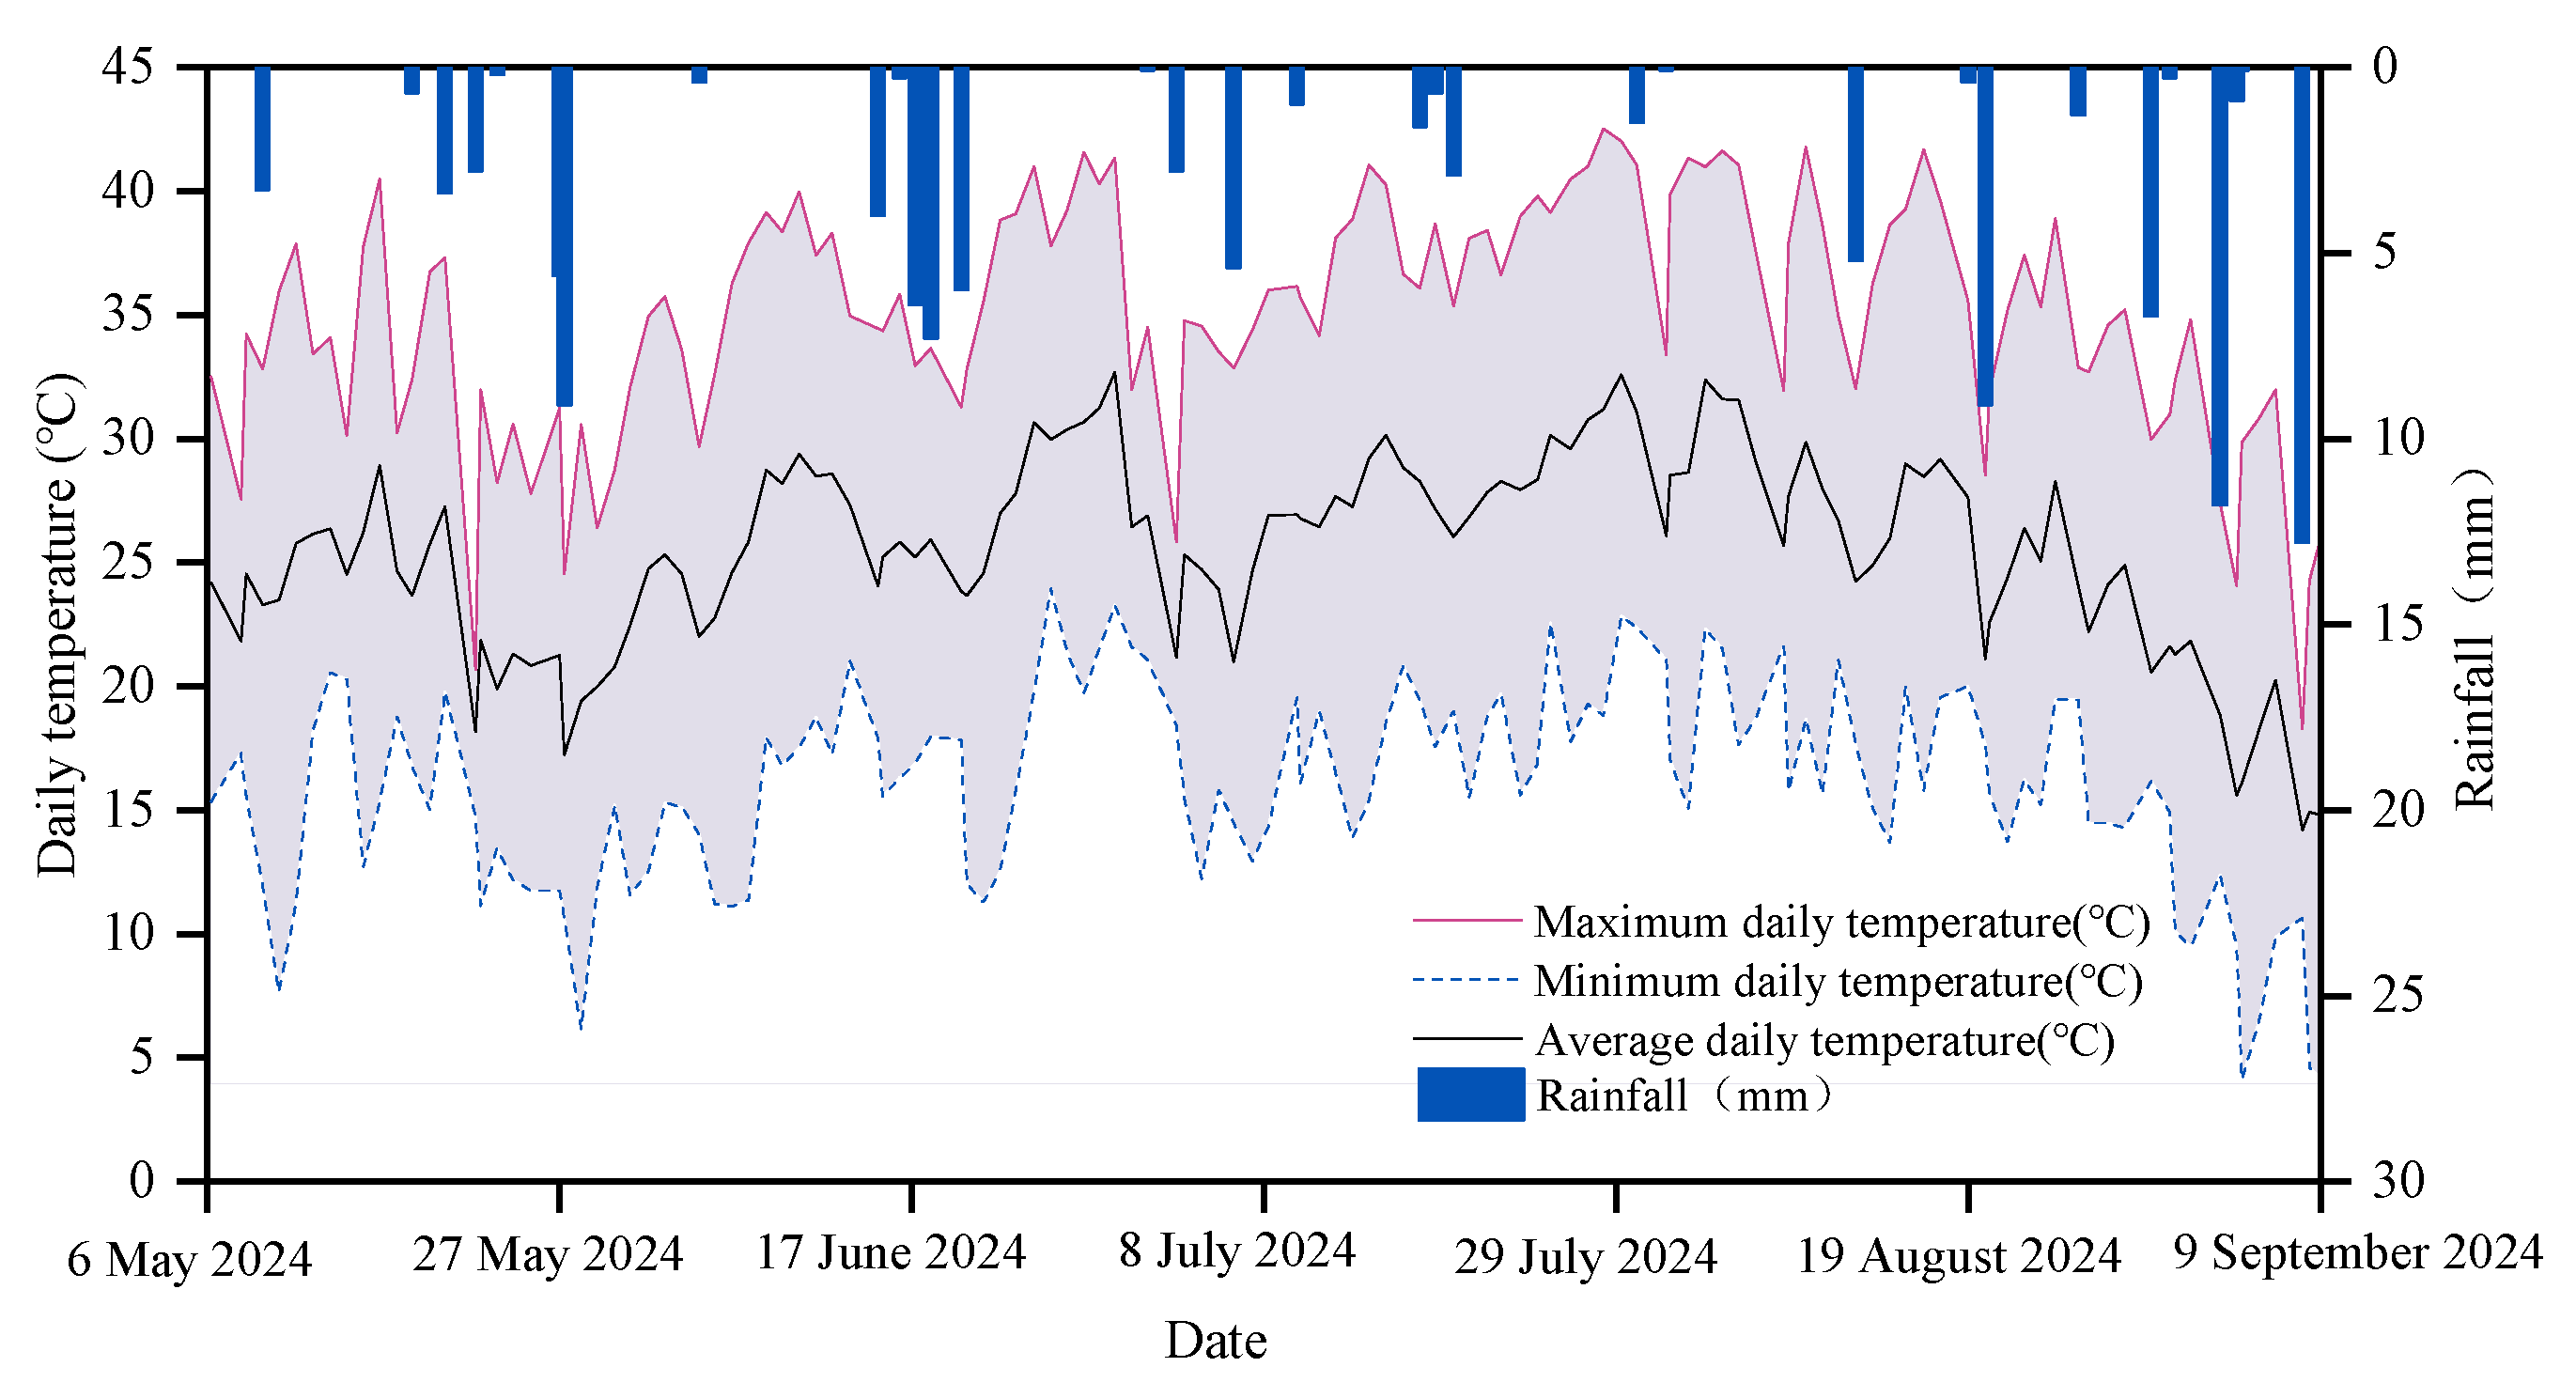
2.1. Site Description and Experimental Design

The experimental crop was processing tomato (Lycopersicum esculentum Miller.), and the selected variety was Jinfan 3166, which is widely cultivated in the local area. The transplanting of processing tomato seedlings was conducted, with the seedlings originating from local greenhouse cultivation. Each plot had an area of 14.5 m2 (10 m × 1.45 m). The tomato plants were carefully set out in early May and harvested at full maturity in late August. The one-film, two-tube, four-row planting method with a film width of 145 cm and two-tube spacing of 75 cm was practiced, which provided a spacing of 30 cm between rows and 35 cm within rows (Figure 1). Drip irrigation was carried out using a single-winged labyrinth drip irrigation belt with a drip head spacing of 30 cm (Xinjiang Tianye Co., Ltd., Xinjiang, China), and the amount of water was controlled by a water meter. The drip head flow rate was maintained at 3.2 L·h−1, and the irrigation volume was set at 4500 m3·hm−2 based on local irrigation practices. A total of 188 kg·hm−2 of potassium dihydrogen phosphate and 240 kg·hm−2 of nitrogen fertilizer were applied throughout the entire fertility period, and the field management practices and agronomic measures, including weed control and pesticide spraying, followed local guidelines.
The experiment was conducted in 2024 at the Key Laboratory of Modern Water-Saving Irrigation of the Xinjiang Production and Construction Corps, located in the Manasi River Irrigation District, Xinjiang, China (44°18′29″ N, 86°03′45″ E, elevation 412 m, slope 6‰). The soil type was sandy clay loam with a bulk density of 1.52 g·cm−3 in the 0–100 cm soil layer and an average salinity of 0.5–0.8 g·L−1. The region is characterized by abundant sunlight and a warm climate, yet it faces limitations due to low precipitation. The temperature and precipitation throughout the entire growth period of processing tomato are shown in Figure 2.
Based on productive irrigation experience in the Manasi River Irrigation District, the irrigation water volume was set at 4500 m3·hm−2 [23], and the experiment was conducted with two irrigation temperature treatments, including no temperature increase (T0, local irrigation water, with temperature ranging approximately between 10 and 15 °C) and temperature increase (T1, 20–25 °C, in the optimal temperature range for the growth of processed tomatoes, Figure 3b); three types of aeration, including no aeration (A0, dissolved oxygen content was about 5 mg·L−1), Venturi aeration (A1, the dissolved oxygen content was about 9 mg·L−1, Figure 3a), and micro–nano aeration (A2, dissolved oxygen content was about 18 mg·L−1, Figure 3c); and two humic acid addition amounts, including 0% (H0) and 0.5% (H1), where % represents the proportion of humic acid to the total weight of potassium dihydrogen phosphate, urea, and humic acid Micro–nano aeration was implemented using a specialized micro–nano bubble generator, model TL-MBG50-A, produced by Beijing Zhongnong Tianlu Micro–nano Bubble Technology Co., Ltd., China. As the experiment was conducted during the hot summer months, the water temperature was carefully controlled and maintained within the range of 20–25 °C. Humic acid is formed through the artificial oxidation of coal. Specific irrigation and fertilization practices are shown in Table 1. The comprehensive combinatorial experimental design resulted in 12 treatment conditions (Table 2), with three replicates per treatment and a total of 36 experimental plots, with each treatment irrigated eight times during the reproductive period (Table 1).

2.2. Soil CO2, N2O, and CH4 Collection and Calculation

In this experiment, the CO2, N2O, and CH4 emission fluxes from the soil of processing tomato were measured by the ‘static dark box-gas chromatography’ method [24] during the whole life cycle of the tomato, and the box was made of 304 stainless steel with a thickness of 2 mm, and its dimensions were 40 cm × 40 cm × 40 cm. On the day of tomato transplantation, two seedlings in the center of the plot were driven into a square base with a groove for the static dark box (Figure 3), and water was injected into the groove to prevent water leakage during sampling. The sampling interval was 3–6 d. Sampling was carried out on the 2nd day after irrigation at 10:00, 10:10, 10:20, and 10:30, respectively. The fan in the box was turned on to ensure uniformity of the gas in the box, and a syringe was used to collect the gas. An amount of 30 mL of gas was taken each time, and the concentration was analyzed on the same day. The temperature of the box was read with a thermometer inserted into the box while the gas was collected and used to calculate the gas emission flux. Singularities were removed to ensure that the concentration measurements of the three samples were linearly and positively correlated with time, with R2 ≥ 0.90. CO2, N2O, and CH4 concentrations were determined using an Agilent gas chromatograph, and the gas emission fluxes were calculated using Formula (1):
F = ρ h 273 273   +   T dc dt
where F represents the emission fluxes of CO2, N2O, and CH4 gases (mg·m−2·h−1 for both CO2 and CH4; μg·m−2·h−1 for N2O); ρ is the density of the gas in the standard state (g·cm−3); h is the height of the static box (0.4 m); d c d t is the rate of change of gas concentration (mL·m−3·h−1); T is the temperature inside the box (°C).
The cumulative emissions of soil CO2, N2O and CH4 during the whole life span of the tomato were calculated using Formula (2) [25]:
R = i = 1 n F i + F i + 1 2 × D × 24
where R is the cumulative emission of soil CO2, N2O, and CH4 (kg·hm−2); F is the emission flux of soil CO2, N2O, and CH4 gases; D is the number of days between two measurements (d); i is the ith measurement; and n is the number of measurements.

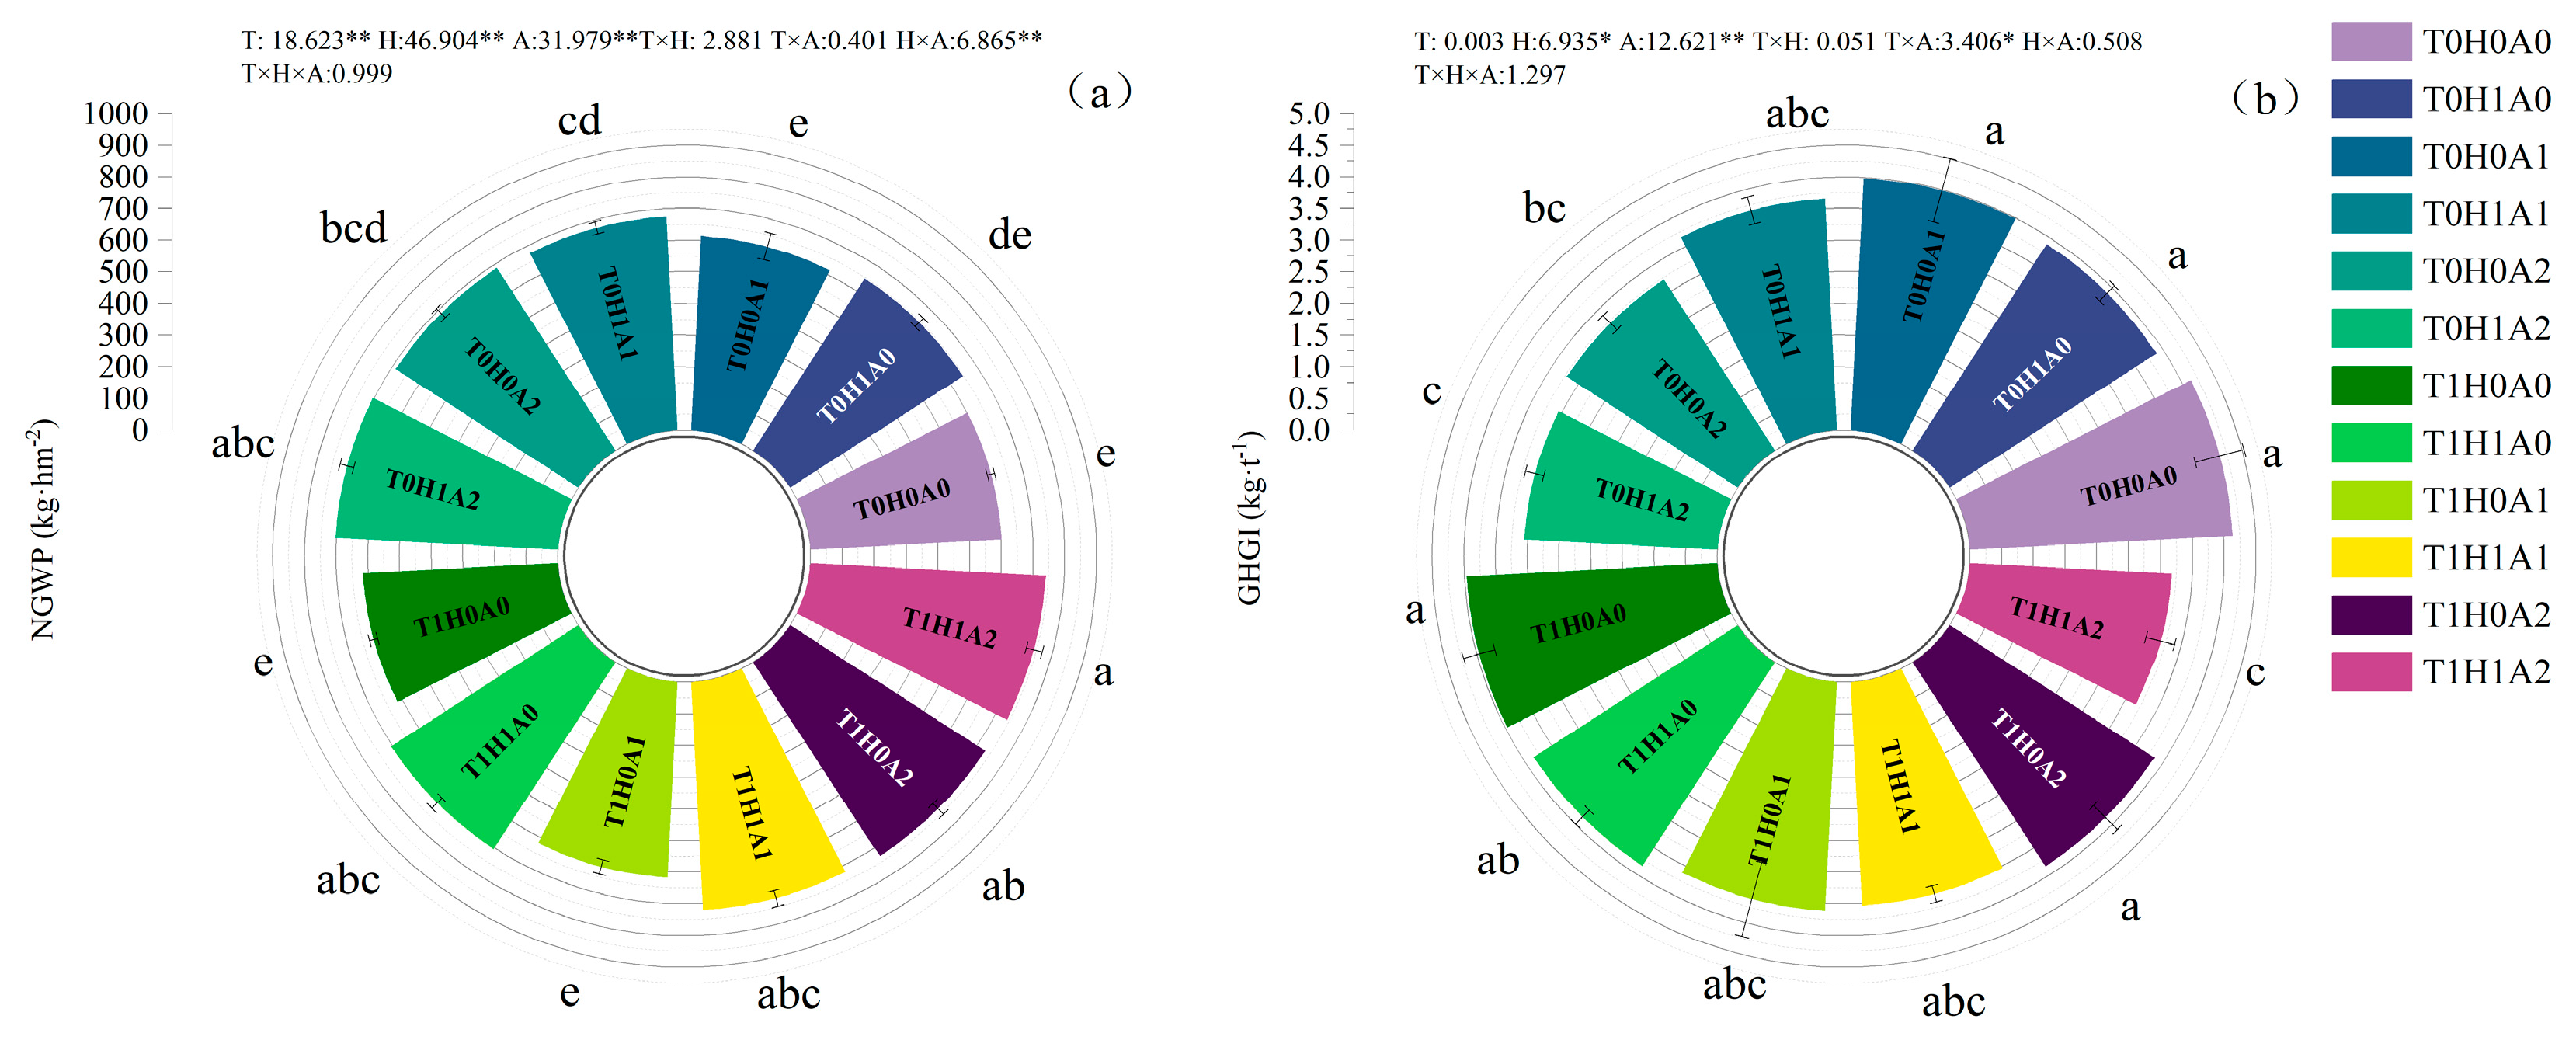
2.3. Net Global Warming Potential and Greenhouse Gas Emission Intensity

Net global warming potential (NGWP) and greenhouse gas intensity (GHGI) are currently the commonly used indicators for evaluating the impact of greenhouse gases on climate change. On a 100-year impact scale, the warming effect per unit mass of N2O and CH4 is 273 and 27.9 times that of CO2, respectively (IPCC 2021). The duration of this experiment was short, and the change of soil organic carbon was negligible. The NGWP was calculated using Formula (3) [26]:
N G W P = 273 × R N 2 O + 27.9 × R C H 4
where GHGI is the ratio of NGWP to production and represents the equivalent CO2 emissions required to produce a unit of tomato production, calculated using Formula (4) [27]:
G H G I = N G W P Y
where GHGI is the greenhouse gas emission intensity (kg·t−1), and Y is the tomato yield (t·hm−2).

2.4. Yield and Quality Indicators

Five processing tomato samples were randomly selected from each test plot at the maturity stage for yield determination. Each plant was weighed individually, and the average value was calculated to obtain the mean single fruit weight (WF, g). The number of fruits per processing tomato plant was recorded, and the average value was computed to determine the mean fruit count per plant. Based on the mean fruit count and the planting area, the total fruit count per hectare (NP, G·hm⁻2) was estimated. Finally, the yield per hectare (t·hm⁻2) was calculated using the total fruit count per hectare and the mean single fruit weight. Soluble solids (%) and titratable acids (g·kg−1) were determined using a hand-held Brix refractometer (Model RHBO-90, YHEQUIPMENT Co., Ltd., Shenzhen, China) and a base titration indicator method, respectively [28]. In addition, the lycopene content (mg·kg−1) was estimated using an ultraviolet–visible spectrophotometer (EV300PC model, Beijing Yuwei Technology Co., Ltd., Beijing, China), while the VC (Vitamin C, mg·100 g−1) content was determined by molybdenum blue colorimetry. Finally, the content of soluble sugars (for convenience of presentation, mg·g−1 was converted to g·kg−1) was analyzed using anthrone colorimetry [29].

2.5. Model Construction

The compatibility test for single composite evaluation using Kendall’s W coefficient of concordance (W) was calculated as Formula (5) [30].
W = 12 i = 1 n R i 2 3 m 2 n ( n + 1 ) 2 m 2 n ( n 2 1 )
where m is the number of evaluation methods, N is the number of evaluation objects, and R is the sum of the ranks of each evaluation object.
The matrix A is used to represent i evaluation objects (Equation (6)) (without loss of generality, let i ≥ 3 and j ≥ 3).
A = a ij n × m = a 11 a 1 m a n 1 a nm
where i is the number of treatments of the test, and j is the evaluation value obtained by the evaluation methods (i.e., the TOPSIS model, the RSR rank-sum ratio method, principal component analysis).
Matrix B (i = 1, 2, … n; j = 1, 2 … m) was obtained by standardizing the matrix A of the evaluated values of multiple evaluation methods using Equation (7).
B = f a i j 1 / n i = 1 n f a i j 1 n 1 i = 1 n f a i j 1 / n i = 1 n f a i j
where i is the number of treatments of the test, and j is the evaluation value obtained by the evaluation methods (i.e., the TOPSIS model, the RSR rank-sum ratio method, and principal component analysis).
The real symmetric matrix C, C = BTB, is constructed, and the maximum eigenvalue of C and its eigenvector λi′ are solved using Matlab R2023a. Determine the combined weight vector λi′ according to the value of each component in the eigenvalue. Use Equation (8) to calculate the combined weight vector λi′.
λ i = λ i i = 1 m λ i
where λi is the portfolio weight vector of the ith treatment, and λi′ is the eigenvector of matrix C.
Substituting the combination weight vector into Equation (9), the combination evaluation value yi can be found.
y i = λ i a i j + λ i a i j + + λ n a nm   i = 1 , 2 , n ;   j = 1 , 2 , m , i = j
where λi is the combination evaluation value of the ith treatment, and anm is the score of the mth evaluation method of the nth treatment.
Following the principle that a greater overall difference in portfolio evaluation values indicates a superior evaluation object, the evaluation object is ranked according to the portfolio evaluation value.

2.6. Data Analyses and Statistics

Excel 2016 was used for the basic organization of the experimental data, and SPSS 26.0 (IBM, Armonk, NY, USA) was used to perform a three-way analysis of variance (ANOVA), while for multiple comparisons, the least significant difference (LSD) method was selected. The threshold of statistical significance was determined to be p < 0.05. Techniques for order preference by similarity to an ideal solution, rank-sum ratio, and principal component analysis were selected for preliminary evaluation, and then the overall differences were comprehensively evaluated based on the combined scores of the three single evaluation methods. An overall score and ranking were then given. Matlab R2023a (MathWorks, Natick, MA, USA) was used to solve the operations of matrices in the combined evaluation. Origin 2021 (OriginLab, Northampton, MA, USA) was used to perform blotting analyses.

3. Results

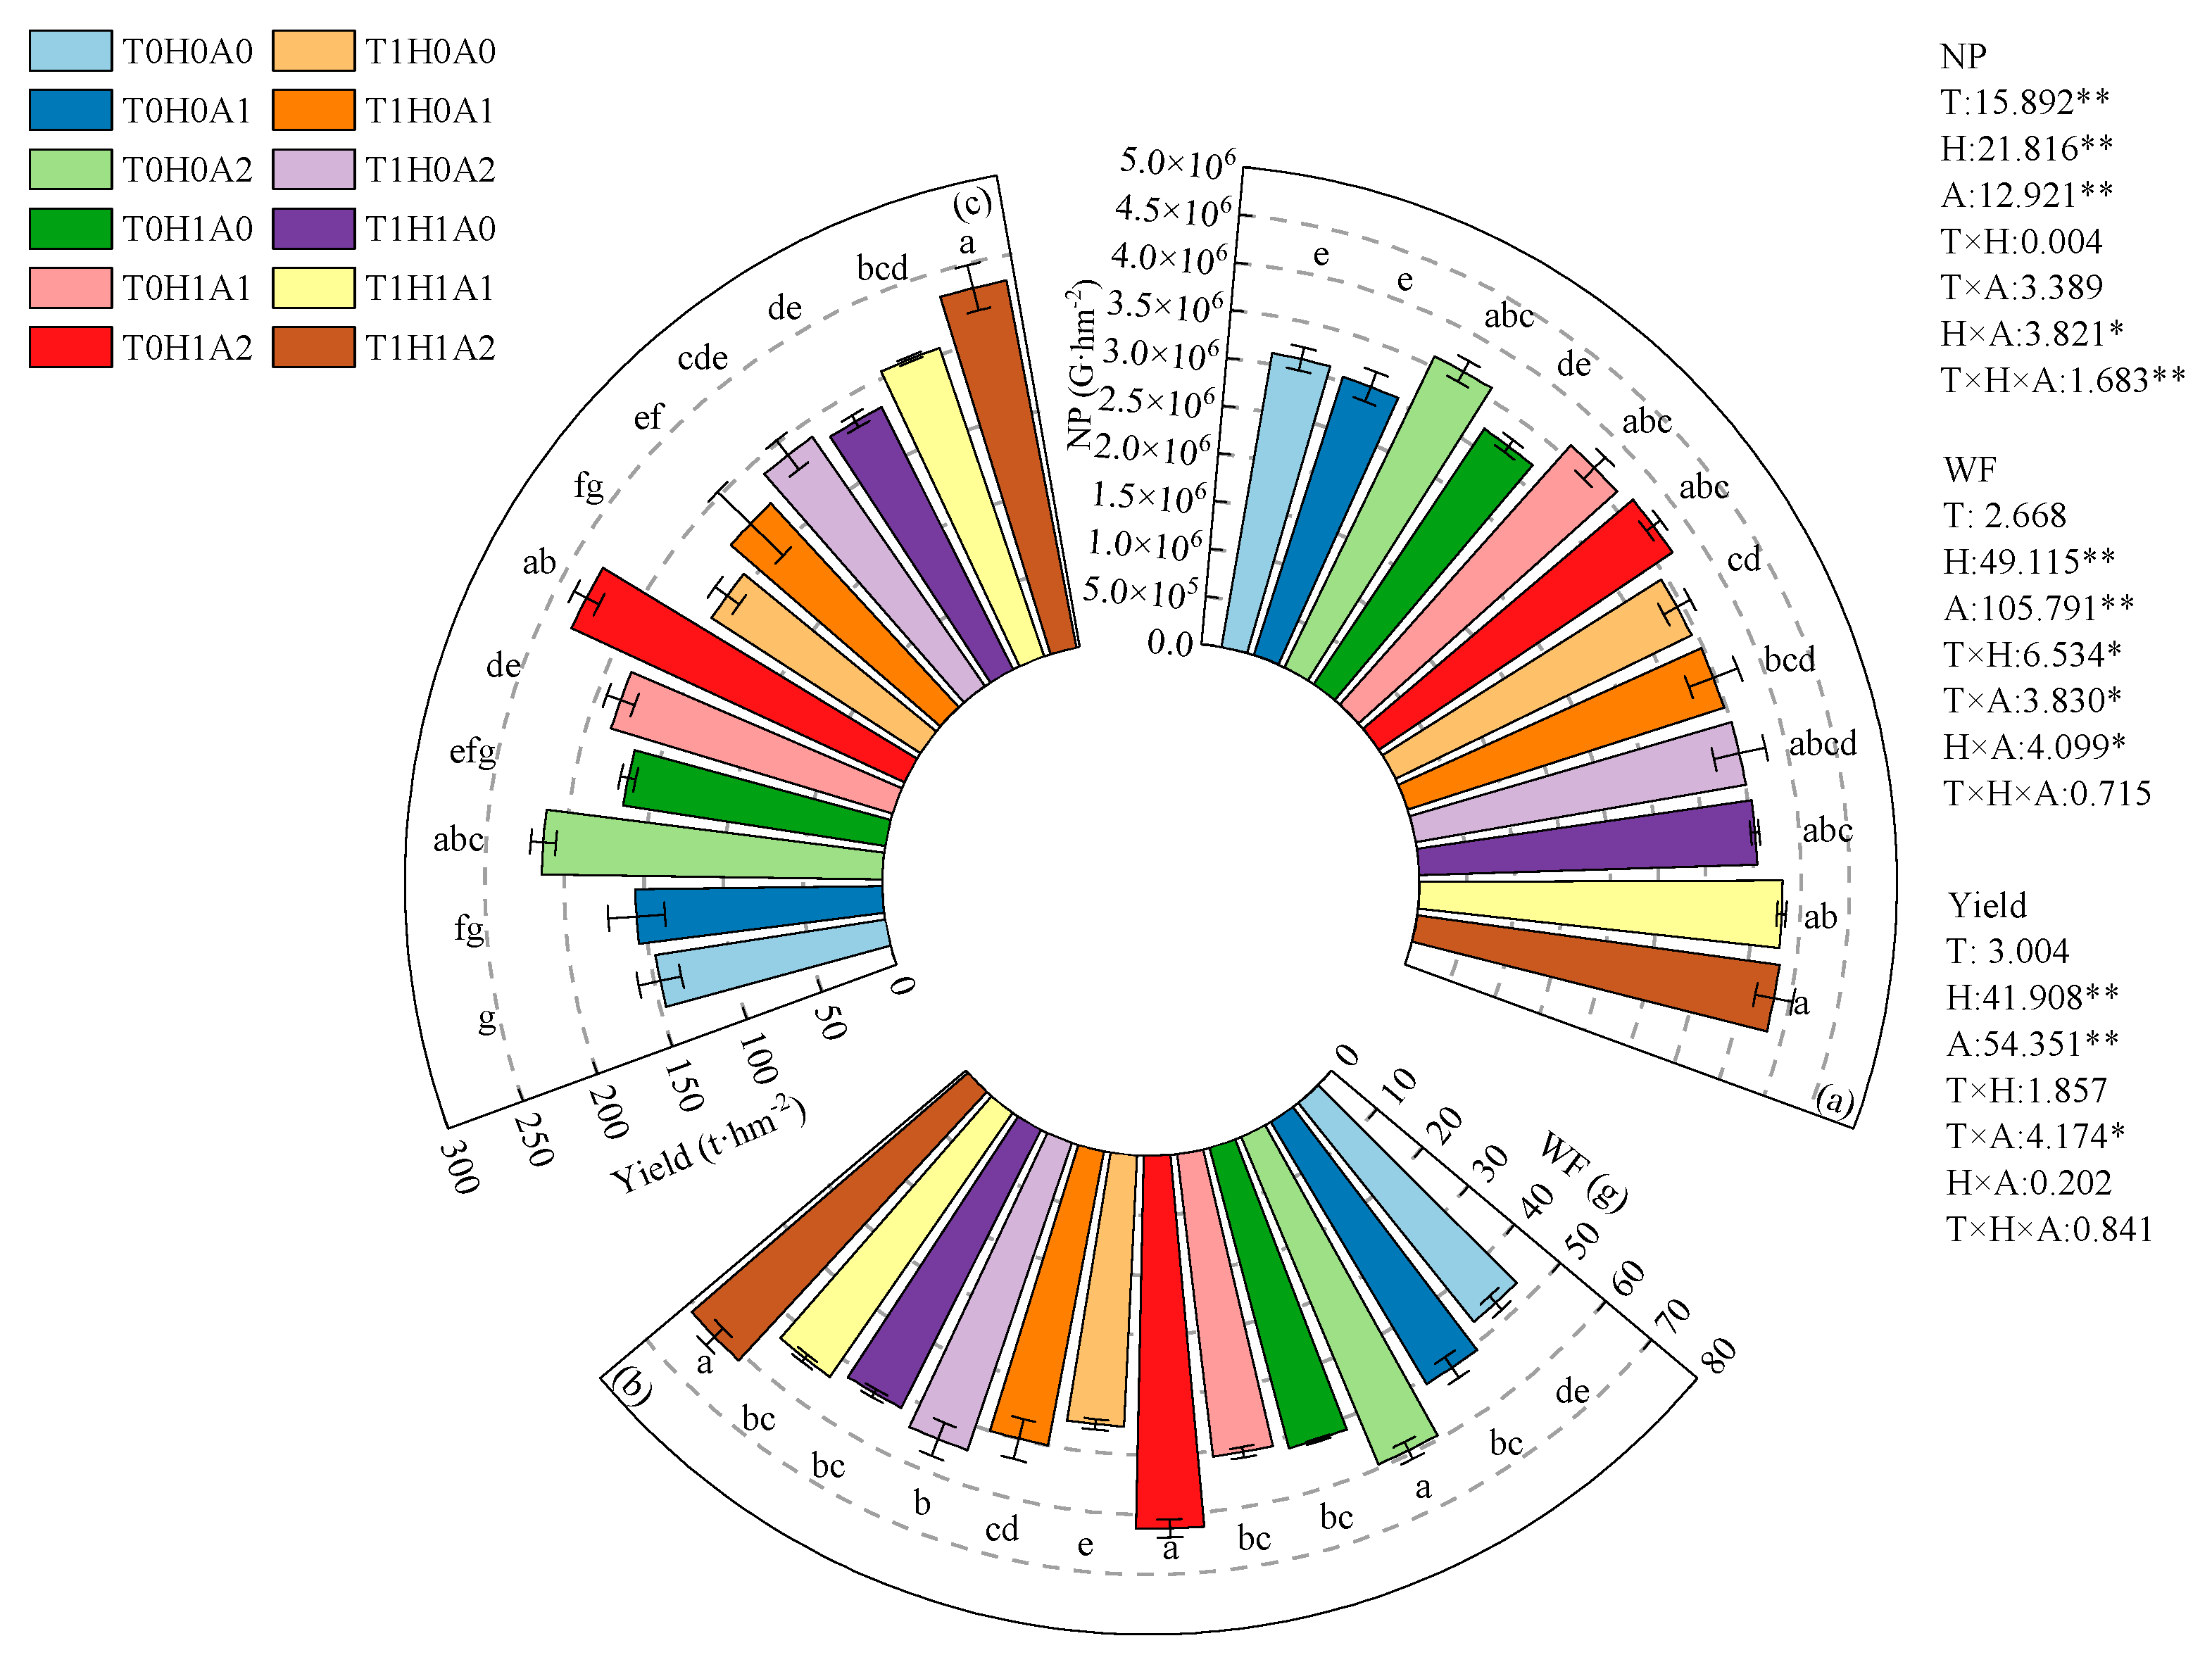
3.1. Effects of Water, Fertilizer, Air, and Heat Coupling on Yield and Quality of Processing Tomato

Warming has a significant impact on the NP (p < 0.01, Figure 4); however, it does not significantly affect WF and the overall yield. The application of humic acid and aeration significantly impacts the NP, WF, and the yield of processing tomato (p < 0.01). The interaction between warming and humic acid significantly influences WF (p < 0.05). Similarly, the interaction between warming and aeration significantly affects WF and the yield (p < 0.05). Additionally, the interaction between humic acid and aeration significantly affects the NP and WF (p < 0.05). Furthermore, the combined interaction between warming, the application of humic acid, and aeration significantly affects the NP (p < 0.01).
As the irrigation water temperature rises, the average NP value at the T1 level is notably high, reaching 3.60 × 10⁶ G hm−2, which represents an increase of 6.34% compared to the T0 treatment. With the increasing concentration of humic acid, the average values of NP, WF, and yield at the H1 level attain 3.62 × 10⁶ G hm−2, 55.34 g, and 200.72 t·hm−2, respectively, indicating significant increases of 7.47%, 8.24%, and 16.28% compared to H1. As the concentration of dissolved oxygen increases, the average values of NP, WF, and yield at level A2 reached 3.66 × 10⁶ G hm−2, 59.26 g, and 217.25 t·hm−2, respectively. Among these, the highest average values for the NP (3.83 × 10⁶ G hm−2) and yield (234.26 t·hm−2) were observed under the T1H1A2 treatment, while the maximum average value for WF (62.33 g) was recorded under the T0H1A2 treatment.
Increased irrigation water temperature significantly affected the contents of VC, titratable acid, and lycopene (p < 0.05; Figure 5), with a particularly pronounced effect on the lycopene content (p < 0.01). The application of humic acid significantly (p < 0.01) affected other indices, except soluble sugar (p < 0.01). Additionally, aeration had a significant or highly significant impact on all quality indicators (p < 0.01 and < 0.05). Notably, aeration and humic acid interaction significantly affected soluble solids (p < 0.05).
In our experiment, increasing the irrigation water temperature resulted in increases of 16.87%, 6.51%, and 8.65% in VC, titratable acid, and lycopene content, respectively, with mean values reaching 51.2 mg·100 g⁻1, 3.40 g·kg−1, 52.44 mg·kg⁻1, respectively. Humic acid application increased VC, soluble solids, and lycopene by 26.61%, 8.60%, and 22.76%, respectively, with corresponding mean values of 53.1 mg·100 g⁻1, 6.87%, and 55.50 mg·kg⁻1. The VC, soluble sugars, soluble solids, and lycopene levels were positively correlated with dissolved oxygen concentration in the water column. The highest mean values for these parameters were observed under treatment A2, reaching 58.1 mg·100 g⁻1, 6.32 g·kg⁻1, 7.15%, and 56.37 mg·kg⁻1, representing increases of 28.02% and 48.68%, 21.12% and 29.87%, 7.25% and 13.61%, as well as 13.21% and 25.54%, when compared to A1 and A0, respectively. It is worth noting that titratable acid content decreased with increasing concentrations of humic acid and dissolved oxygen, with maximum reductions of 12.42% and 16.45%, respectively, and the minimum titratable acid value (3.10 g·kg⁻1 and 3.09 g·kg⁻1) was recorded at H1 and A2 levels. Among these, the highest average values for VC (67.9 mg·100 g⁻1), soluble sugars (7.19 g·kg⁻1), soluble solids (7.59%), and lycopene (62.50 mg·kg⁻1) were observed under the T1H1A2 treatment, while the maximum average value for titratable acid (4.04 g·kg⁻1) was recorded under the T0H1A2 treatment.

3.2. Effects of Water–Fertilizer–Gas Coupling on the Root Zone Environment of Processing Tomato Fields

The variation patterns of CO2 emission fluxes in all treatments during the entire growth period of processing tomato were similar, all showing a double-peak curve (Figure 6a–c). Both the application rate of humic acid and the content of dissolved oxygen significantly increased the average emission rate of CO2 (p < 0.01). In addition, the irrigation water temperature also had a significant impact on the emission rate of CO2 (p < 0.05). The CO2 emission fluxes in processing tomato fields throughout the growth period ranged from 104.92 to 1639.76 mg·m−2·h−1. Compared with T0 and H0, the CO2 emission fluxes in the T1 and H1 treatments increased significantly by 7.12% and 32.88%, respectively. Compared with A1 and A0, the CO2 emission fluxes in the A2 treatment increased significantly by 9.98% and 17.54%, respectively. Compared with A0, the CO2 emission fluxes in the A1 treatment increased significantly by 6.88%.
The variation patterns of CH4 emission fluxes in all treatments during the entire growth period of processing tomato were similar, showing an amplitude form (Figure 6d–f). Irrigation temperature, the amount of humic acid applied, and dissolved oxygen content all significantly increased the average CH4 emission rate (p < 0.01). In addition, the interaction between irrigation temperature and humic acid, as well as the interaction between irrigation temperature and aeration, also had a significant impact on the CH4 emission rate (p < 0.05). The CH4 emission fluxes in processing tomato fields throughout the growth period ranged from −0.122 to 0.010 mg·m−2·h−1. Compared with T0 and H0, the CH4 emission fluxes in the T1 and H1 treatments increased significantly by 7.24% and 22.01%, respectively. Compared with A1 and A0, the CH4 emission fluxes in the A2 treatment increased significantly by 7.61% and 14.27%, respectively. Compared with A0, the CH4 emission fluxes in the A1 treatment increased significantly by 6.20%.
The variation patterns of N2O emission fluxes in all treatments during the entire growth period of processing tomato were similar, showing an amplitude form and a maximum peak at 80 d (Figure 6g–i). Both the application rate of humic acid and the content of dissolved oxygen significantly increased the average emission rate of N2O (p < 0.01). In addition, the irrigation water temperature also had a significant impact on the emission rate of N2O (p < 0.05). The N2O emission fluxes in processing tomato fields throughout the growth period ranged from 27.91 to 382.70 µg·m−2·h−1. Compared with T0 and H0, the N2O emission fluxes in the T1 treatment increased significantly by 4.85% and 10.96%. Compared with A1 and A0, the N2O emission fluxes in the A2 treatment increased significantly by 9.69% and 12.41%, respectively. Compared with A0, the N2O emission fluxes in the A1 treatment increased significantly by 2.48%.
The cumulative CH4 emission fluxes ranged from −1.307 to −0.878 kg·hm−2. Warming, the addition of humic acid, and aeration all significantly increased the amount of CH4 absorbed by the soil (p < 0.01) (Figure 7a). Additionally, the interaction between warming and humic acid application significantly increased the amount of CH4 absorbed by the soil (p < 0.05). Among them, the cumulative CH4 emission fluxes in the processing tomato field under the T1 and H1 treatments were significantly higher than those under the T0 and H0 treatments by 7.10% and 18.39%, respectively. Under the A2 treatment, the cumulative CH4 emission fluxes in the processing tomato field were significantly increased by 6.74% and 12.99% compared with the A1 and A0 treatments, respectively; the cumulative CH4 emission fluxes in the processing tomato field under the A1 treatment were significantly increased by 5.85% compared with the A0 treatment.
The cumulative N2O emission fluxes ranged from 2.293 to 2.853 kg·hm−2. Warming, the addition of humic acid, and aeration all significantly increased the N2O emissions from the soil (p < 0.01) (Figure 7b). Additionally, the interaction between humic acid application and aeration significantly increased the soil’s cumulative N2O emission fluxes (p < 0.05). Among them, the cumulative N2O emission fluxes in the processing tomato field under the T1 and H1 treatments were significantly higher than those under T0 and H0 treatments by 5.31% and 8.84%. Under the A2 treatment, the cumulative N2O emission fluxes in the processing tomato field were significantly increased by 8.85% and 11.49% compared with the A1 and A0 treatments, respectively. The cumulative N2O emission fluxes in the processing tomato field under the A1 treatment were significantly higher by 2.43% compared with those under the A0 treatment.
The cumulative CO2 emission fluxes ranged from 1.705 to 1.034 kg·hm−2. Warming, the addition of humic acid, and aeration all significantly increased the CO2 emissions from the soil (p < 0.01) (Figure 7c). Additionally, the interaction between humic acid application and aeration significantly increased the soil’s cumulative CO2 emission fluxes (p < 0.05). Among them, the cumulative CO2 emission fluxes in the processing tomato field under the T1 and H1 treatments were significantly higher than those under the T0 and H0 treatments by 6.78% and 30.73%. Under the A2 treatment, the cumulative CO2 emission fluxes in the processing tomato field were significantly increased by 10.52% and 16.64% compared with those under the A1 and A0 treatments, respectively. The cumulative CO2 emission fluxes in the processing tomato field under the A1 treatment were significantly higher by 5.54% compared with the A0 treatment.
Warming, humic acid application, and aeration all led to a significant increase in the NGWP (p < 0.01) (Figure 8a). The interaction between humic acid and aeration also significantly increased the NGWP (p < 0.05). Among them, the NGWP processed by T1 and H1 significantly increased by 5.23% and 8.43% compared to that processed by T0 and H0, respectively. Under the A2 treatment, the NGWP increased significantly by 8.95% and 11.43% compared with the A1 and A0 treatments, respectively, and the NGWP under the A1 treatment increased significantly by 2.28% compared with A0 treatment.
Aeration significantly reduced GHGI (p < 0.01) (Figure 8b), while humic acid application and the interaction between warming and aeration also significantly reduced GHGI (p < 0.05). The GHGI of the H1 treatment was significantly reduced by 7.70% compared with the H0 treatment. Under the A2 treatment, the GHGI of the A1 treatment and A0 treatment was significantly reduced by 11.32% and 18.95%, respectively, and the A1 treatment was significantly reduced by 6.85% compared with the A0 treatment.

3.3. Economic Benefits

It is easy to see that T1H1A1 was the treatment with the highest net profit under the present test conditions (Table 3). Venturi aeration was not as effective as micro–nano aeration, but due to the cheaper price of the Venturi aerating equipment, A1 treatment achieved the largest net profit of CNY 60,068·hm−2 (Table 3). The outputs of micro–nano aerated treatments were 21.02% and 33.11% higher than those of Venturi aeration and no aeration, respectively, but their net benefits were 39.77% and 24.29% lower than those of Venturi aeration and no aeration, respectively, due to the fact that the inputs of micro–nano-aerated treatments are about twice as high as those of conventional drip treatment, which suggests that although micro–nano aeration has a great potential to increase yield and improve quality, the problem of high cost still needs to be solved. Since the operation of the heating equipment incurred high electricity costs and its impact on both output and net benefits did not reach significant levels, we observed in the experiment that heat addition improved titratable acidity, VC, and lycopene in processing tomato. However, these improvements were not reflected in the uniform wholesale price of processing tomatoes. Therefore, heat addition is expected to be applied in the production of high-quality, high-priced, and differently-flavored tomato sauces. Humic acid application showed positive results in improving crop yield quality, with output and net profit in the H1 treatment being significantly higher than those in the H0 treatment by 18.13% and 33.63%, respectively. T1H1A2 undoubtedly achieved the highest output, but its higher economic input indicated that it was probably not the treatment with the highest net profit. Meanwhile, the highest net profit was recorded in T1H1A1, which had a relatively high output (ranking fourth), combined with a lower input (ranking sixth), making it the optimal treatment oriented towards net profit. We also found that the interaction between warming and aerating had a significant effect (p < 0.05) on increasing output and net profit. Therefore, T1H1A1, T1H1A0, and T0H1A1 are the recommended treatments for the present study under the condition of net profit only.
Note: irrigation system inputs in 2024 include micro–nano aerated equipment, heating equipment and pipes, etc. Utility costs are divided into two parts: water and electricity, which are the cost of water for agricultural irrigation, electricity, which includes electricity generated by pumping and consumed by heating rods, as well as fertilizers, which include urea, potassium dihydrogen phosphate, and humic acid. Other costs include the purchase of tomato seedlings, mulch, and pesticides.

3.4. Combinatorial Evaluation Based on Overall Differences

In summary, in order to select the best plan that can balance stable production, reduce emission, and improve economic benefits, this study selected 12 evaluation indicators from three aspects: yield indicators (NP, WF, yield, economic benefits), quality indicators (lycopene content, VC content, soluble solids, soluble sugar, titratable acid), and environmental indicators (NGWP, GHGI). Three methods, namely TOPSIS, RSR (rank-sum ratio method), and PCA (principal component analysis), were used for comprehensive evaluation. NGWP and GHGI are negative indicators, whereas all other indicators are positive. The comprehensive scores and rankings of different water, humic acid, and aeration modes are shown in Table 4. All three evaluation methods indicated that the T1H1A2 treatment had the highest comprehensive score, followed by T0H1A2, whereas T0H0A0 had the lowest comprehensive score. However, the evaluation results of each method were not the same, and we observed differences in T1H1A0, T1H0A2, T1H0A0, T0H1A1, and T0H0A1, and they mainly appear in the PCA method. It seems that although the ranking gap is one place, the PCA method tends to comprehensively rank the warming treatment higher and slightly lowers the comprehensive ranking of the aerated treatment, indicating that further evaluation is needed.
The rankings obtained by different evaluation methods show certain differences, and a unified conclusion cannot be obtained. Therefore, a combination evaluation model based on overall differences is adopted to integrate the above three evaluation methods and build a combination evaluation model. The comprehensive scores of the three single evaluation models were tested using Kendall’s W concordance coefficient (Equation (5)) test to ensure the compatibility of the three evaluation methods. The consistency test results showed that the overall data significance (p = 0.028 < 0.05) showed significance at the 0.05 level (Table 5), rejecting the null hypothesis; therefore, the data presented consistency. At the same time, the value of Kendall’s concordance coefficient (W) for the model is 0.799, which meets the requirements of the prior consistency test.
The three comprehensive evaluation score matrices A in Table 5 were standardized using Equation (6) to obtain matrix B. Matlab R2023a was used to solve the real symmetric matrix C (C = BTB, Equation (7)), from which the maximum eigenvalue of C and the standard eigenvector λi′ were obtained. According to the standard eigenvector λ’, the value of each component was used to determine the combination of the eigenvectors λi (Equation (8)). The combination of eigenvectors was substituted into Equation (9) to obtain an evaluation result. As shown in Table 6, the combined evaluation results show that T1H1A2 has the highest combined score, while T0H0A0 has the lowest combined score. The total score of A2 is higher than that of A1 and A0. Compared with H0, H1 can obtain higher combined scores. Compared with T0, T1 can obtain higher combined scores.

4. Discussion

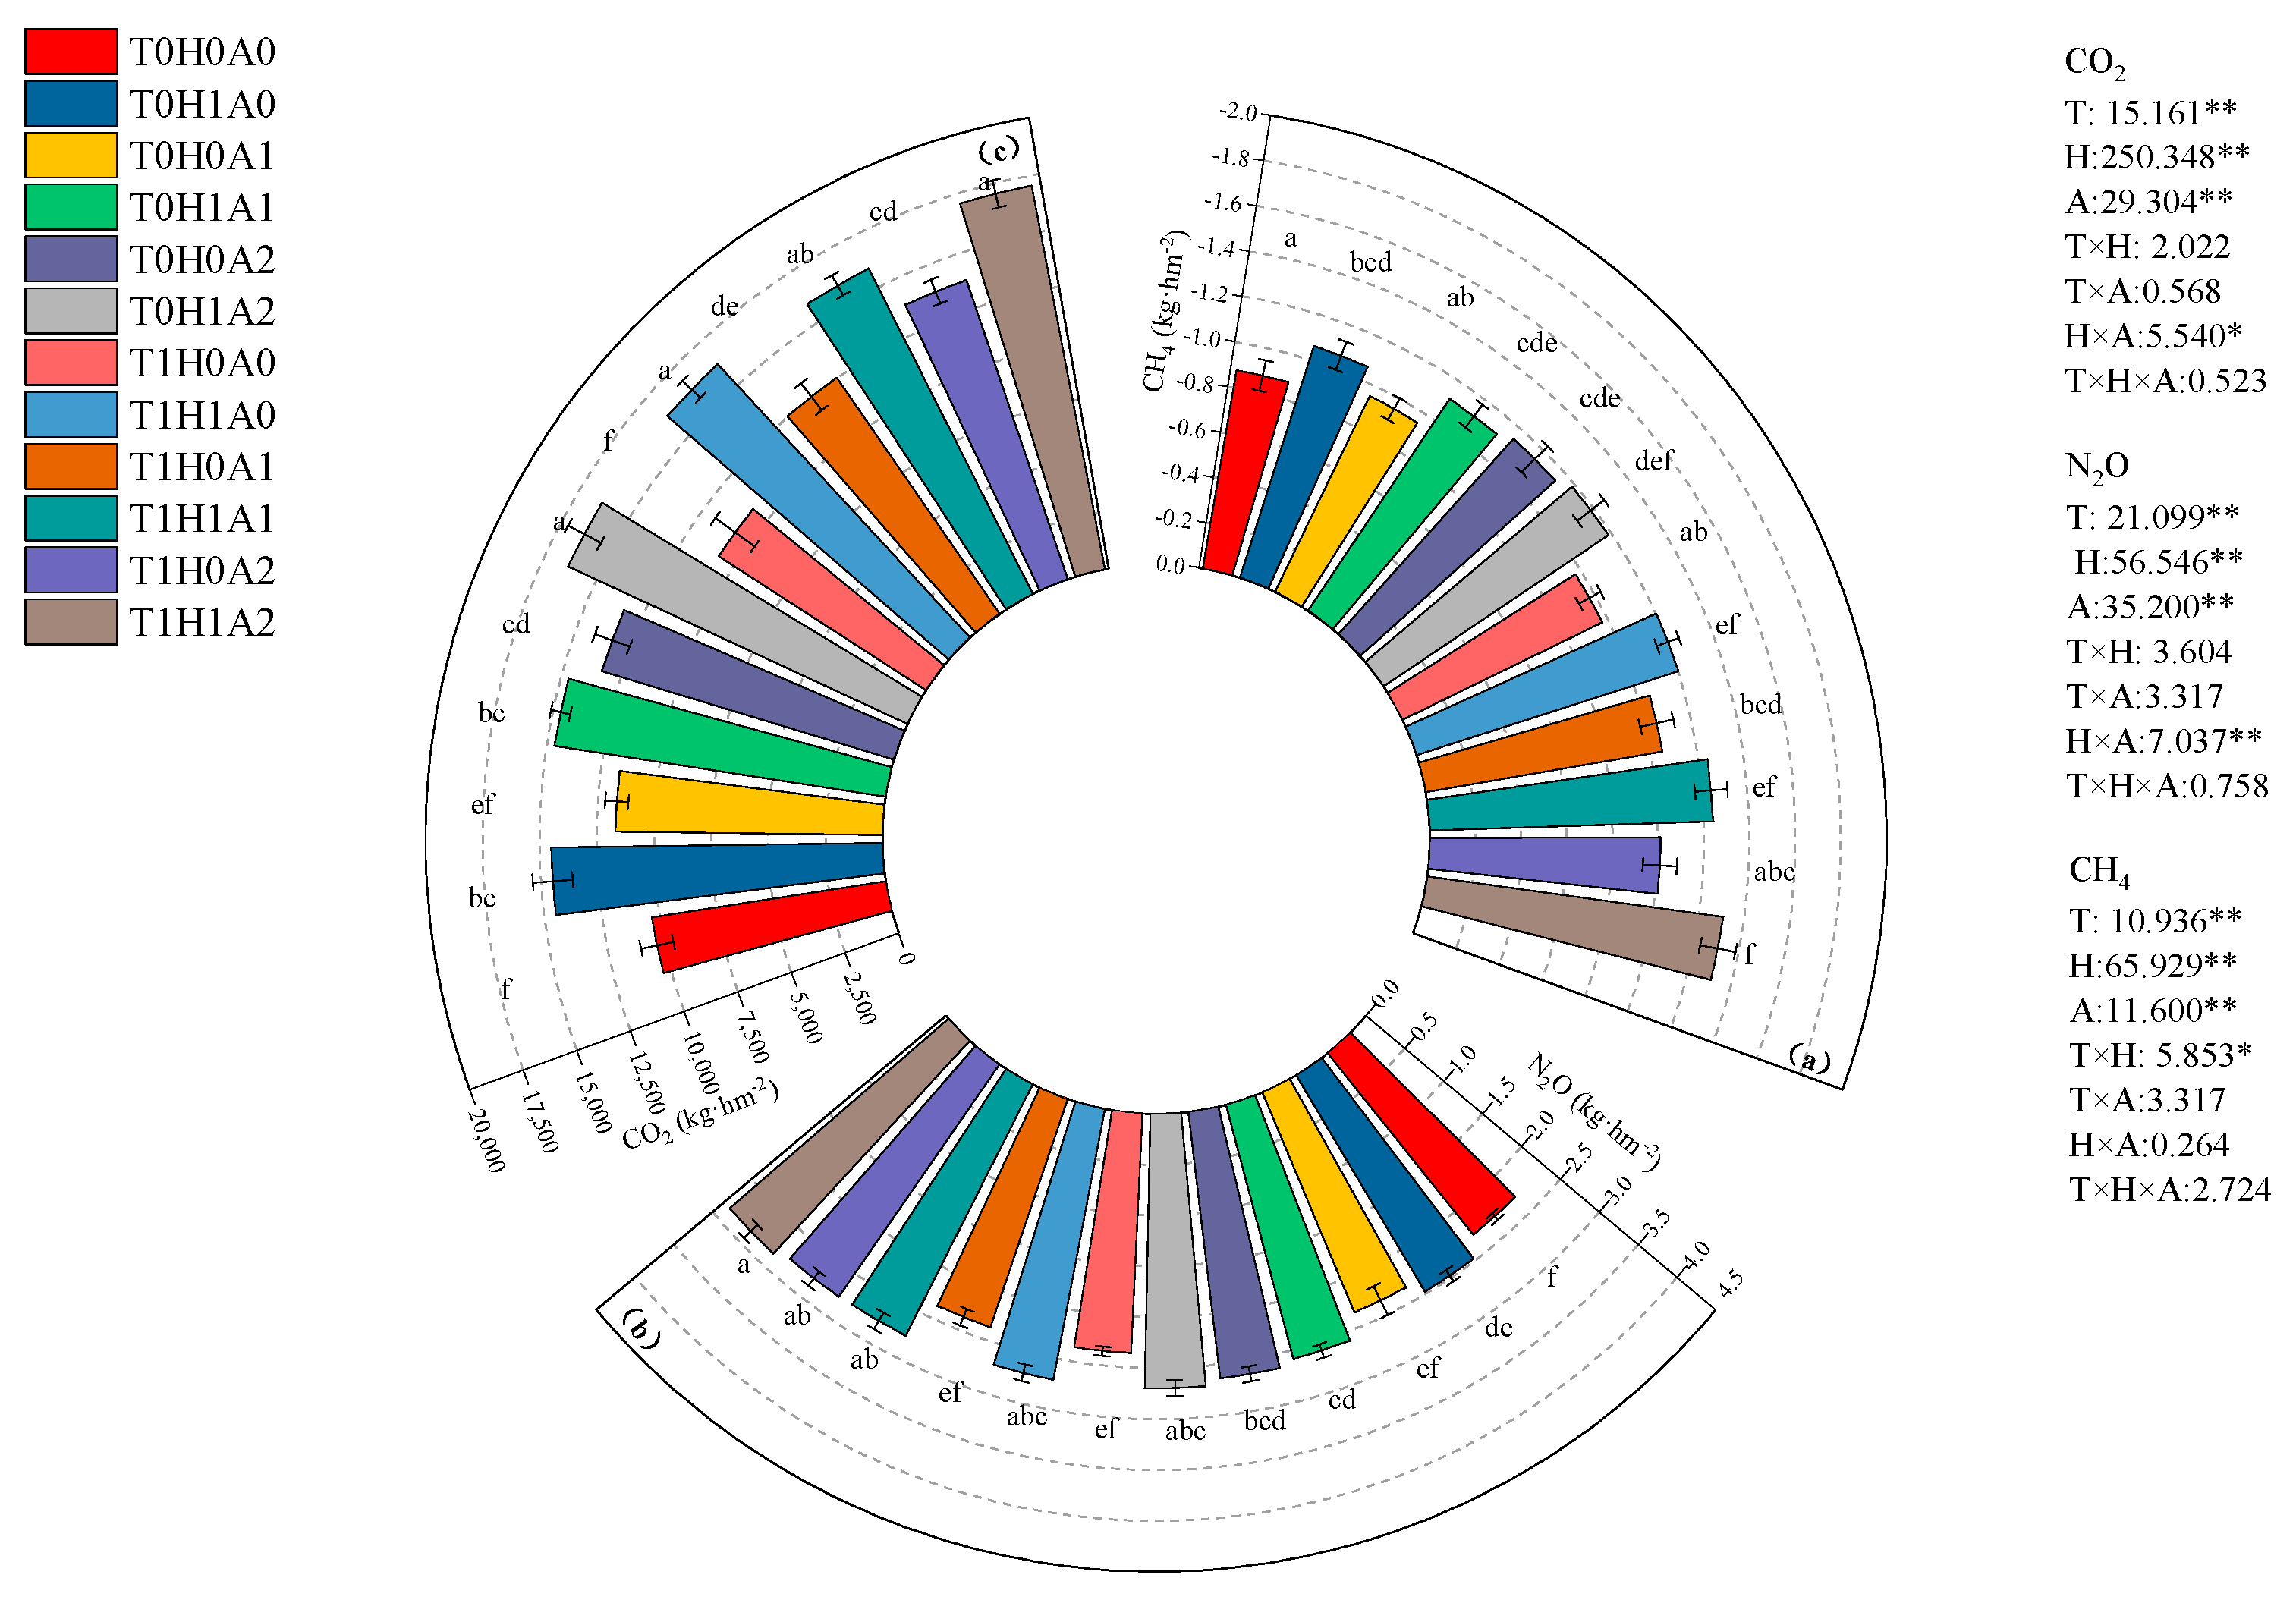
4.1. The Impact of Humic Acid, Aeration, and Warming-Coupled Irrigation on Greenhouse Gas Emissions

Agricultural soil CO2 emissions are mainly from crop root autotrophic respiration and heterotrophic respiration of soil organisms, whereas different irrigation and fertilizer treatments change the soil environment near the crop root system, which in turn affects the crop root system, as well as soil microbial activity, and thus soil CO2 emissions [31]. In this study, the CO2 emission flux increased by 7.12% (p < 0.05) in the warming irrigation treatment compared with the conventional water-temperature irrigation treatment because most of the irrigation water in Manasi Irrigation District comes from glacier meltwater, which itself has a temperature of only 10–15 °C, while the optimal irrigation water temperature for processing tomato is around 24 °C. The lower irrigation water temperature inhibited soil respiration, and warming treatment of the irrigation water reduced the low-temperature cold damage caused by irrigation water to the crop root system. The increase in CO2 emissions was similar with findings that higher soil temperatures lead to increased crop root and microbial respiration [32]. The present study showed that the application of humic acid significantly increased CO2 emission flux by 32.88% (p < 0.05), and the application of humic acid promoted the growth of processing tomato plants and their root systems, which, on the one hand, led to increased root secretion and promoted microbial activity [33]. On the other hand, the withered fruits and leaves of processing tomato provided reactive substrates for the soil carbon cycle, and the two synergistically increased soil respiration [34]. In addition, it was concluded in this experiment that aeration increased the CO2 emission flux by an average of 17.54% (p < 0.05), which was attributed to the fact that aeration improved soil aeration, promoted root respiration, enhanced soil microbial activity, and promoted heterotrophic respiration, which in turn promoted soil CO2 emission [35]. These results are also consistent with the findings of previous studies [36,37].
Soil N2O emission is mainly generated by the nitrification process under aerobic conditions and the denitrification process under anaerobic conditions. The primary factors influencing soil N2O emissions include the application of nitrogen fertilizers, soil moisture, soil temperature, and other related variables [38]. Humic acid can increase the total soil aggregates and water-stable aggregates, which can then improve the water, air, and thermal conditions of the soil tillage layer [39]. In this study, the application of humic acid resulted in higher N2O emissions, which may be due to the fact that humic acid provides an abundant nitrogen source for the soil, increasing the substrate NO3-N for denitrification reactions and promoting the denitrification process. Existing studies have shown that the denitrification process is more conducive to the production of N2O [40]. In this study, N2O emission was higher in the warming treatment, which was attributed to the fact that the warming water changed the soil temperature, affecting the uptake and release of oxygen from the soil solution [41]. It has been shown that soil denitrification bioactivity can be increased by 1.5 to 3.0 times when the soil temperature ranges from 10 to 35 °C [42]. The peak in N2O emissions during fruit expansion likely occurs because it coincides with the highest temperature of the year. This leads to an increase in soil temperature and, at the same time, an increase in microbial activity and the conversion of NO3-N in the soil to N2O. These results are similar to those reported in a previous study, which showed that the optimal emission temperature of N2O is 25–40 °C [43]. Factor analysis shows that, in addition to the single factors of humic acid, aeration, and warming, the interaction between humic acid and aeration also had a significant effect on the cumulative N2O emission flux. This may be because, when the irrigation water carrying micro–nano aerated and humic acid acted directly on the soil near the crop root system through the drip tip, the nano-sized bubbles in the water made the soil resemble a porous sponge. The colloidal nature of the humic acid could reinforce this structure, providing a more suitable water–gas environment for the crop root system and the microorganisms in the soil in the root zone. This promotes root respiration and microbial respiration, thereby increasing N2O emissions.
Soil CH4 emissions are mainly produced in anaerobic environments, where organic acids, CO2, H2, and other substances produced by microbial metabolism generate CH4 under the action of methanogenic bacteria, mainly in soils with high humidity and poor aeration [44]. In terrestrial ecosystems, soil both produces and absorbs CH4. Soil CH4 is produced by the combined action of methanogenic and methane-oxidizing bacteria. A large number of studies have demonstrated that dryland agricultural soils are sinks for CH4 [45], and that CH4 emission and uptake are affected by irrigation, fertilizer application, and soil physicochemical properties, among others [46]. The present study showed that increased temperature and the application of humic acid significantly reduced cumulative CH4 emissions by 7.10% and 18.39%, respectively. In addition, the Venturi aeration and micro–nano aeration decreased methane emissions by 5.85% and 12.99%. This reduction can be attributed to the rise in irrigation water temperature, which enhances the activity of methanotrophic bacteria, which in turn promotes inter-root CH4 oxidation in processing tomato and reduces CH4 emissions. On the other hand, the application of humic acid and aeration reduces CH4 emissions by improving the aeration of the soil, where the methane-oxidizing bacteria oxidize CH4, which in turn reduces CH4 emissions.

4.2. The Impact of Humic Acid, Aerated, and Warming-Coupled Irrigation on Yield and Quality

Humic acid is an important component of organic matter, and its unique chemical composition and physicochemical properties can regulate the ‘plant-soil-fertiliser’ system and promote crop growth, yield, and quality [47]. Studies have shown that the total yield of tomato increased by 19–21% when humic acid was applied [48]. In the present experiment, NP, WF, yield, VC, titratable acid, lycopene, and soluble solids were significantly increased by 7.47%, 8.24%, 16.28%, 26.61%, 17.32%, 22.76%, and 8.60%, respectively, in H1 compared to the H0 treatment (p < 0.05). This enhancement in the H1 treatment can primarily be attributed to the ability of humic acid to bind loose soil particles into aggregates through flocculation, thereby creating a robust water-stable aggregate structure [49], which improves the hydrothermal condition of the crop’s root zone and enhances the soil’s fertilizer supply capacity. On the other hand, humic acid enhances biological resistance by stimulating the crop root system, ultimately improving the quality of the crop [50].
Aerated irrigation is the process of delivering aerated irrigation water to the soil in the crop root zone [51], and several studies have demonstrated that aerated irrigation positively affects crop developmental parameters, yield, quality, and water use efficiency [52,53]. The results of the present study showed that the NP, WF, yield, VC, soluble sugar, titratable acid, lycopene, and soluble solids of processing tomato were significantly increased by 10.07%, 20.82%, 33.11%, 48.68%, 29.87%, 29.87%, 25.54%, and 13.61% (p < 0.05), respectively, under the micro–nano aerated treatments as compared to the conventional treatments. Furthermore, all the above indexes were still enhanced by 4.91%, 15.34%, 21.02%, 28.02%, 21.12%, 11.83%, 13.21%, and 7.25% under micro–nano aerated treatments compared with Venturi aerated treatments. The nanoscale bubbles generated by the micro–nano bubble machine do not easily escape from the irrigation water and can effectively act on the crop root zone through the drip irrigation pipeline [54]. In this study, due to the addition of humic acid to the irrigation water, when the irrigation water carrying humic acid and micro–nano bubbles reached the root zone of the crop through the drip irrigation pipe, the colloidal property of humic acid strengthened the inner wall of the cavity created by micro–nano bubbles. The coupling effect of the two resulted in NP and WF reaching 369.89 × 10⁶ G hm−2 and 62.33 g at the T0 level, respectively, which were 18.72% and 32.85% higher than those of the corresponding T0 treatment (p < 0.05). The coupling effect of the two resulted in NP and WF reaching 383.11 × 10⁶ G hm−2 and 61.15 g at the T1 level, respectively, an increase of 11.31% and 34.88% compared with the corresponding T1 treatment (p < 0.05).
Warming water irrigation can effectively increase soil temperature in all soil layers, improve crop root and microbial respiration [32], prevent crop root hypoxia [55], and improve root uptake of water and nutrients [56]. In this study, it was concluded that raising the irrigation water temperature to 20–25 °C resulted in a significant increase in the NP, VC, titratable acid, and lycopene by 6.34%, 16.87%, 6.51%, and 8.65%, respectively, compared to the T0 treatment (p < 0.05), which may be attributed to the fact that higher irrigation water temperatures increased soil temperatures. Soil enzyme activities and microbial populations were elevated [54], accelerating the movement of soil water [57] and thereby promoting faster transfer of nutrients from the processing tomato roots to other plant parts [58]. As a result, nutrients were more fully absorbed, and ultimately improved yield quality.
Combined with the conclusion that temperature increase, humic acid application, and aeration measures can all increase the yield and quality in this study, we realize that high yield and quality are often accompanied by higher NGWP, which is not a good phenomenon. However, from the perspective of GHGI, although increasing temperature, applying humic acid, and aeration will increase NGWP, the higher yield resulting from the water, fertilizer, gas, and heat treatments results in a lower GHGI. To draw harmonized conclusions based on many indicators, including yield, quality, NGWP, and GHGI together indicators, we first used the TOPSIS, RSR, and PCA methods to obtain three rankings lists. Since the rankings were not the same, we used the overall difference-based combination evaluation. The results obtained comprehensively consider the processing tomato yield, quality, NGWP, and GHGI, so the top-ranked treatments take into account the high yield and quality, while also considering lower NGWP and GHGI, thereby achieving increased yield, enhanced quality, and reduced emissions.

5. Conclusions

The integration of temperature-controlled irrigation, humic acid application, and various aeration techniques in a three-factorial experiment is novel and relevant. We assess multiple parameters, including agronomic performance (yield components, fruit quality traits), and environmental metrics (GHGI, NGWP), which allows for a holistic interpretation of treatment effects. In the short term (1 year) under warming irrigation (20–25 °C), the combination of 0.5% humic acid and micro–nano gas aeration not only improved various quality indicators but also significantly increased the yield of processing tomatoes (234.26 t·hm−2). However, we also observed a significant increase in the cumulative emission fluxes of CO2 (17,047.16 kg·hm−2), N2O (2.853 kg·hm−2), and CH4 (−1.307 kg·hm−2), as well as the NGWP (742.46 kg·hm−2), which was not the desired outcome. Meanwhile, the results showed that, due to the significant increase in yield, the GHGI decreased and only ranked eleventh among the twelve treatments, for the T1H1A2 treatment. The goal of relative emission reduction was achieved based on high yield and quality. Considering various indicators, such as yield, quality, greenhouse gases, and economic benefits, the results calculated by the comprehensive evaluation model based on overall differences show that T1H1A2 remains the recommended irrigation model under the conditions of this study. Nevertheless, a limitation of this study is that it encompasses only one year of experiments. Subsequent studies will incorporate annual repeated trials. As the application of soil conditioners expands, an increasing number of farmers are attaining high yields and considerable benefits. However, there are currently few studies investigating the synergistic effects of two or more soil conditioners. The authors propose that this presents a promising avenue for future research.

Author Contributions

Conceptualization, C.W. and Y.Z.; methodology, C.W., Y.Z., and L.S.; software, C.W. and Y.L.; validation, J.W. and Y.L.; formal analysis, J.W. and Y.Z.; data curation, J.M. and J.Z.; writing—original draft preparation, C.W., writing—review and editing, C.W. and Y.Z.; funding acquisition, Y.Z., L.S., and J.Z. All authors have read and agreed to the published version of the manuscript.

Funding

This research was funded by the National Natural Science Foundation of China (52269016, 52169011), Tianchi Talent Young Doctoral Talent Program of the Autonomous Region, Research and Application of Key Technologies for Optimizing Irrigation Systems for High-Quality Development of the Economic Belt on the North Slope of Tianshan Mountain (2023CB010), Shihezi University Youth Top Program Project (BJZK202412).

Data Availability Statement

The data supporting the findings of this study are available from the first authors upon reasonable request.

Acknowledgments

The authors are grateful to the anonymous reviewers and the editor for their helpful and constructive comments and suggestions, which have improved the manuscript.

Conflicts of Interest

Author Jiliang Zheng was employed by the company Xinjiang Xinlianxin Energy and Chemical Company Limited. The remaining authors declare that the research was conducted in the absence of any commercial or financial relationships that could be construed as a potential conflict of interest.

Abbreviations

The following abbreviations are used in this manuscript:
NGWPNet global warming potential
GHGIGreenhouse gas emission intensity
NPNumber of fruits per hectare
VCVitamin C
WFWeight of single fruit
kg·hm⁻2Kilograms per hectare
L·h⁻1Liters per hour

References

  1. Schmidt, J.E.; Vannette, R.L.; Igwe, A.; Blundell, R.; Casteel, C.L.; Gaudin, A.C. Effects of agricultural management on rhizosphere microbial structure and function in processing tomato plants. Appl. Environ. Microbiol. 2019, 85, e01064-19. [Google Scholar] [CrossRef] [PubMed]
  2. Alordzinu, K.E.; Appiah, S.A.; Al Aasmi, A.; Darko, R.O.; Li, J.; Lan, Y.; Adjibolosoo, D.; Lian, C.; Wang, H.; Qiao, S. Evaluating the influence of deficit irrigation on fruit yield and quality indices of tomatoes grown in sandy loam and silty loam soils. Water 2022, 14, 1753. [Google Scholar] [CrossRef]
  3. Loch, R.; Grant, C.; McKenzie, D.; Raine, S. Improving Plants’ Water Use Efficiency and Potential Impacts from Soil Structure Change-Research Investment Opportunities; Land and Water Australia: Perth, Australia, 2005. [Google Scholar]
  4. Li, Z.; Zhang, R.; Wang, X.; Wang, J.; Zhang, C.; Tian, C. Carbon Dioxide Fluxes and Concentrations in a Cotton Field in Northwestern China: Effects of Plastic Mulching and Drip Irrigation. Pedosphere 2011, 21, 178–185. [Google Scholar] [CrossRef]
  5. Drew, M.C. Oxygen deficiency and root metabolism: Injury and acclimation under hypoxia and anoxia. Annu. Rev. Plant Biol. 1997, 48, 223–250. [Google Scholar] [CrossRef]
  6. Niu, W.; Jia, Z.; Zhang, X.; Shao, H. Effects of soil rhizosphere aeration on the root growth and water absorption of tomato. CLEAN–Soil Air Water 2012, 40, 1364–1371. [Google Scholar] [CrossRef]
  7. Munns, R.; Sharp, R. Involvement of abscisic acid in controlling plant growth in soil of low water potential. Funct. Plant Biol. 1993, 20, 425–437. [Google Scholar] [CrossRef]
  8. Nguyen, N.T.; Vo, T.S.; Tran-Nguyen, P.L.; Nguyen, M.N.; Pham, V.H.; Matsuhashi, R.; Kim, K.; Vo, T.T.B.C. A comprehensive review of aeration and wastewater treatment. Aquaculture 2024, 591, 741113. [Google Scholar] [CrossRef]
  9. Li, R.; Han, Q.B.; Dong, C.H.; Nan, X.; Li, H.; Sun, H.; Li, H.; Li, P.; Hu, Y.W. Effect and Mechanism of Micro–nano Aeration Treatment on a Drip Irrigation Emitter Based on Groundwater. Agron. J. 2023, 13, 2059. [Google Scholar] [CrossRef]
  10. Lyu, T.; Wu, S.; Mortimer, R.J.; Pan, G. Nanobubble Technology in Environmental Engineering: Revolutionization Potential and Challenges. Environ. Sci. Technol. 2019, 53, 7175–7176. [Google Scholar] [CrossRef]
  11. Campbell, G.S. Plants and their environment. In An Introduction to Environmental Biophysics; Springer: New York, NY, USA, 1977; pp. 115–126. [Google Scholar]
  12. Bassirirad, H. Kinetics of nutrient uptake by roots: Responses to global change. New Phytol. 2000, 147, 155–169. [Google Scholar] [CrossRef]
  13. Jia, Y.; Wang, J.; Qu, Z.; Zou, D.; Sha, H.; Liu, H.; Sun, J.; Zheng, H.; Yang, L.; Zhao, H. Effects of low water temperature during reproductive growth on photosynthetic production and nitrogen accumulation in rice. Field Crops Res. 2019, 242, 107587. [Google Scholar] [CrossRef]
  14. Kübarsepp, L.; Laanisto, L.; Niinemets, Ü.; Talts, E.; Tosens, T. Are stomata in ferns and allies sluggish? Stomatal responses to CO2, humidity and light and their scaling with size and density. New Phytol. 2020, 225, 183–195. [Google Scholar] [CrossRef] [PubMed]
  15. Drake, B.; Salisbury, F. Aftereffects of low and high temperature pretreatment on leaf resistance, transpiration, and leaf temperature in Xanthium. Plant Physiol. 1972, 50, 572–575. [Google Scholar] [CrossRef]
  16. Lee, S.; Chung, G.; Jang, J.; Ahn, S.; Zwiazek, J.J. Overexpression of PIP2; 5 aquaporin alleviates effects of low root temperature on cell hydraulic conductivity and growth in Arabidopsis. Plant Physiol. 2012, 159, 479–488. [Google Scholar] [CrossRef]
  17. Gao, S.; Zhang, S.; Yuan, L.; Li, Y.; Zhao, L.; Wen, Y.; Xu, J.; Hu, S.; Zhao, B. Effects of humic acid–enhanced phosphate fertilizer on wheat yield, phosphorus uptake, and soil available phosphorus content. Crop Sci. 2023, 63, 956–966. [Google Scholar] [CrossRef]
  18. DiDonato, N.; Chen, H.; Waggoner, D.; Hatcher, P.G. Potential origin and formation for molecular components of humic acids in soils. Geochim. Cosmochim. Acta 2016, 178, 210–222. [Google Scholar] [CrossRef]
  19. Suleimenov, B.; Kaisanova, G.; Suleimenova, M.; Tanirbergenov, S. Influence of Organic Humic Fertilizer “Tumat” on the Productivity of Sugar Beet. Agron. J. 2024, 14, 1100. [Google Scholar] [CrossRef]
  20. Zhao, H.; Li, L.; Fan, G.H.; Xie, S.Z.; Li, F.H. Effects of aerated brackish water irrigation on growth of Lycium barbarum seedlings. Sci. Hortic. 2023, 310, 111721. [Google Scholar] [CrossRef]
  21. Duxbury, J.M. The significance of agricultural sources of greenhouse gases. Fertil. Res. 1994, 38, 151–163. [Google Scholar] [CrossRef]
  22. Hou, H.; Chen, H.; Cai, H.; Yang, F.; Li, D.; Wang, F. CO2 and N2O emissions from Lou soils of greenhouse tomato fields under aerated irrigation. Atmos. Environ. 2016, 132, 69–76. [Google Scholar] [CrossRef]
  23. Ma, J.; Chen, R.; Wen, Y.; Zhang, J.; Yin, F.; Javed, T.; Zheng, J.; Wang, Z. Processing tomato (Lycopersicon esculentum Miller) yield and quality in arid regions through micro–nano aerated drip irrigation coupled with humic acid application. Agric. Water Manag. 2025, 308, 109317. [Google Scholar] [CrossRef]
  24. Yu, L.; Wang, M. Study on model of greenhouse gas N2O emission flux of rice field in cold region in growing season in water-saving irrigation mode. Int. J. Eng. Syst. Model. Simul. 2018, 10, 87–96. [Google Scholar]
  25. Wei, C.; Ren, S.; Yang, P.; Wang, Y.; He, X.; Xu, Z.; Wei, R.; Wang, S.; Chi, Y.; Zhang, M. Effects of irrigation methods and salinity on CO2 emissions from farmland soil during growth and fallow periods. Sci. Total Environ. 2021, 752, 141639. [Google Scholar] [CrossRef]
  26. Zhang, A.; Cheng, G.; Hussain, Q.; Zhang, M.; Feng, H.; Dyck, M.; Sun, B.; Zhao, Y.; Chen, H.; Chen, J. Contrasting effects of straw and straw–derived biochar application on net global warming potential in the Loess Plateau of China. Field Crops Res. 2017, 205, 45–54. [Google Scholar] [CrossRef]
  27. Lee, J.; Cho, S.; Jeong, S.; Hwang, H.; Kim, P. Different response of plastic film mulching on greenhouse gas intensity (GHGI) between chemical and organic fertilization in maize upland soil. Sci. Total Environ. 2019, 696, 133827. [Google Scholar] [CrossRef]
  28. Wang, C.; Gu, F.; Chen, J.; Yang, H.; Jiang, J.; Du, T.; Zhang, J. Assessing the response of yield and comprehensive fruit quality of tomato grown in greenhouse to deficit irrigation and nitrogen application strategies. Agric. Water Manag. 2015, 161, 9–19. [Google Scholar] [CrossRef]
  29. Leyva, A.; Quintana, A.; Sánchez, M.; Rodríguez, E.N.; Cremata, J.; Sánchez, J.C. Rapid and sensitive anthrone–sulfuric acid assay in microplate format to quantify carbohydrate in biopharmaceutical products: Method development and validation. Biologicals 2008, 36, 134–141. [Google Scholar] [CrossRef]
  30. Guo, Y.; Yi, P. Whole diversity-based reasoning for objective combined evaluation. Chin. J. Manag. Sci. 2006, 14, 60–64. [Google Scholar]
  31. Bond-Lamberty, B.; Wang, C.; Gower, S.T. A global relationship between the heterotrophic and autotrophic components of soil respiration? Glob. Chang. Biol. 2004, 10, 1756–1766. [Google Scholar] [CrossRef]
  32. Ben-Noah, I.; Friedman, S. Aeration of clayey soils by injecting air through subsurface drippers: Lysimetric and field experiments. Agric. Water Manag. 2016, 176, 222–233. [Google Scholar] [CrossRef]
  33. Galambos, N.; Compant, S.; Moretto, M.; Sicher, C.; Puopolo, G.; Wäckers, F.; Sessitsch, A.; Pertot, I.; Perazzolli, M. Humic acid enhances the growth of tomato promoted by endophytic bacterial strains through the activation of hormone-, growth-, and transcription-related processes. Front. Plant Sci. 2020, 11, 582267. [Google Scholar]
  34. Soong, J.L.; Marañon-Jimenez, S.; Cotrufo, M.F.; Boeckx, P.; Bodé, S.; Guenet, B.; Peñuelas, J.; Richter, A.; Stahl, C.; Verbruggen, E. Soil microbial CNP and respiration responses to organic matter and nutrient additions: Evidence from a tropical soil incubation. Soil Biol. Biochem. 2018, 122, 141–149. [Google Scholar]
  35. Qian, Z.; Zhuang, S.; Gao, J.; Tang, L.; Harindintwali, J.D.; Wang, F. Aeration increases soil bacterial diversity and nutrient transformation under mulching-induced hypoxic conditions. Sci. Total Environ. 2022, 817, 153017. [Google Scholar] [CrossRef] [PubMed]
  36. Du, Y.; Gu, X.; Wang, J.; Niu, W. Yield and gas exchange of greenhouse tomato at different nitrogen levels under aerated irrigation. Sci. Total Environ. 2019, 668, 1156–1164. [Google Scholar]
  37. Singh, J.S.; Gupta, S. Plant decomposition and soil respiration in terrestrial ecosystems. Bot. Rev. 1977, 43, 449–528. [Google Scholar] [CrossRef]
  38. Wang, C.; Amon, B.; Schulz, K.; Mehdi, B. Factors that influence nitrous oxide emissions from agricultural soils as well as their representation in simulation models: A review. Agron. J. 2021, 11, 770. [Google Scholar] [CrossRef]
  39. Ndzelu, B.S.; Dou, S.; Zhang, X.; Zhang, Y.; Ma, R.; Liu, X. Tillage effects on humus composition and humic acid structural characteristics in soil aggregate-size fractions. Soil Tillage Res. 2021, 213, 105090. [Google Scholar] [CrossRef]
  40. Kool, D.M.; Dolfing, J.; Wrage, N.; Van Groenigen, J.W. Nitrifier denitrification as a distinct and significant source of nitrous oxide from soil. Soil Biol. Biochem. 2011, 43, 174–178. [Google Scholar] [CrossRef]
  41. Atkin, O.K.; Edwards, E.J.; Loveys, B.R. Response of root respiration to changes in temperature and its relevance to global warming. New Phytol. 2000, 147, 141–154. [Google Scholar] [CrossRef]
  42. Braker, G.; Schwarz, J.; Conrad, R. Influence of temperature on the composition and activity of denitrifying soil communities. FEMS Microbiol. Ecol. 2010, 73, 134–148. [Google Scholar]
  43. Li, S.; Yue, A.; Moore, S.S.; Ye, F.; Wu, J.; Hong, Y.; Wang, Y. Temperature-related N2O emission and emission potential of freshwater sediment. Processes 2022, 10, 2728. [Google Scholar] [CrossRef]
  44. Conrad, R. Methane production in soil environments—Anaerobic biogeochemistry and microbial life between flooding and desiccation. Microorganisms 2020, 8, 881. [Google Scholar] [CrossRef] [PubMed]
  45. Dalal, R.; Allen, D.; Livesley, S.; Richards, G. Magnitude and biophysical regulators of methane emission and consumption in the Australian agricultural, forest, and submerged landscapes: A review. Plant Soil 2008, 309, 43–76. [Google Scholar] [CrossRef]
  46. Mehmood, F.; Wang, G.; Gao, Y.; Liang, Y.; Zain, M.; Rahman, S.U.; Duan, A. Impacts of irrigation managements on soil CO2 emission and soil CH4 uptake of winter wheat field in the North China plain. Water 2021, 13, 2052. [Google Scholar] [CrossRef]
  47. Ampong, K.; Thilakaranthna, M.S.; Gorim, L.Y. Understanding the role of humic acids on crop performance and soil health. Front. Agron. 2022, 4, 848621. [Google Scholar] [CrossRef]
  48. Tringovska, I. The effects of humic and bio-fertilizers on growth and yield of greenhouse tomatoes. In Proceedings of the V Balkan Symposium on Vegetables and Potatoes 960, Tirana, Albania, 30 September 2012; pp. 443–449. [Google Scholar]
  49. De Melo, B.A.G.; Motta, F.L.; Santana, M.H.A. Humic acids: Structural properties and multiple functionalities for novel technological developments. Mater. Sci. Eng. C 2016, 62, 967–974. [Google Scholar] [CrossRef]
  50. Maffia, A.; Oliva, M.; Marra, F.; Mallamaci, C.; Nardi, S.; Muscolo, A. Humic Substances: Bridging Ecology and Agriculture for a Greener Future. Agron. J 2025, 15, 410. [Google Scholar] [CrossRef]
  51. Bhattarai, S.P.; Su, N.; Midmore, D.J. Oxygation unlocks yield potentials of crops in oxygen-limited soil environments. Adv. Agron. 2005, 88, 313–377. [Google Scholar]
  52. Chen, X.; Dhungel, J.; Bhattarai, S.P.; Torabi, M.; Pendergast, L.; Midmore, D.J. Impact of oxygation on soil respiration, yield and water use efficiency of three crop species. J. Plant Ecol. 2011, 4, 236–248. [Google Scholar] [CrossRef]
  53. Bhattarai, S.; McHugh, A.; Lotz, G.; Midmore, D. The response of cotton to subsurface drip and furrow irrigation in a vertisol. Exp. Agric. 2006, 42, 29–49. [Google Scholar] [CrossRef]
  54. Bian, Q.; Dong, Z.; Zhao, Y.; Feng, Y.; Fu, Y.; Wang, Z.; Zhu, J. Phosphorus Supply Under Micro–nano Bubble Water Drip Irrigation Enhances Maize Yield and Phosphorus Use Efficiency. Plants 2024, 13, 3046. [Google Scholar] [CrossRef] [PubMed]
  55. Apostol, K.G.; Jacobs, D.F.; Wilson, B.C.; Salifu, K.F.; Dumroese, R.K. Growth, gas exchange, and root respiration of Quercus rubra seedlings exposed to low root zone temperatures in solution culture. For. Ecol. Manag. 2007, 253, 89–96. [Google Scholar] [CrossRef]
  56. He, J.; Qin, L.; Lee, S. Root-zone CO2 and root-zone temperature effects on photosynthesis and nitrogen metabolism of aeroponically grown lettuce (Lactuca sativa L.) in the tropics. Photosynthetica 2013, 51, 330–340. [Google Scholar] [CrossRef]
  57. Cassel, D.; Nielsen, D.; Biggar, J. Soil-water movement in response to imposed temperature gradients. Soil Sci. Soc. Am. J. 1969, 33, 493–500. [Google Scholar] [CrossRef]
  58. Nambiar, E.S. Interplay between nutrients, water, root growth and productivity in young plantations. For. Ecol. Manag. 1990, 30, 213–232. [Google Scholar] [CrossRef]
Figure 1. A schematic diagram of the planting pattern and experimental layout of processing tomato with a one film–two pipes–four rows configuration.
Agronomy 15 01353 g001
Figure 2. Mean daily precipitation and mean air temperature in the study area in 2024.
Agronomy 15 01353 g002
Figure 3. Micro–nano aeration, Venturi aeration and warming treatments. (a) Venturi aerated drip irrigation. (b) Warming drip irrigation. (c) Micro–nano aerated drip irrigation.
Agronomy 15 01353 g003
Figure 4. NP (number of fruits, a), WF (weight per fruit, b), and yield (c) of processing tomato under different temperatures, fertilizers and aerated treatments. Different lowercase letters (a, b, c…) in the same column indicate significant differences between treatments for the same indicator (p < 0.05). T0 and T1 denote irrigation temperatures of 10–15 °C and 20–25 °C, respectively. H0 and H1 indicate the absence and presence of humic acid application, with H1 representing a 0.5% humic acid concentration. A0, A1, and A2 correspond to unaerated conditions, Venturi aeration, and micro–nano aeration, respectively. ** indicates that there is a highly significant difference between treatments on the same day the data were collected (p < 0.01), * indicates that there is a significant difference (p < 0.05).
Agronomy 15 01353 g004
Figure 5. Changes in vitamin C, soluble sugars, titratable acids, soluble solids, and lycopene content under different temperatures, fertilizers and aerated treatments. Different lowercase letters (a, b, c…) in the same column indicate significant differences between treatments for the same indicator (p < 0.05). ** indicates that there is a highly significant difference between treatments on the same day of data collection (p < 0.01), * indicates that there is a significant difference (p < 0.05).
Agronomy 15 01353 g005
Figure 6. Effects of different water, fertilizer and gas treatments on CO2, CH4, and N2O emissions from tomato fields. SS, BFS, FFS, and RRS denote the seedling stage, blossoming and fruiting stage, full fruit stage, and red ripening stage. The arrows in the graph indicate the date of irrigation and fertilizer application; different lowercase letters (a, b, c…) in the same column indicate significant differences between treatments for the same indicator (p < 0.05). * indicates that there is a significant difference (p < 0.05), and ns indicates that there is no significant difference (p > 0.05). ** indicates that there is a highly significant difference between treatments on the same day of data collection (p < 0.01).
Agronomy 15 01353 g006
Figure 7. Effects of water–fertilizer–gas–thermal coupling on cumulative greenhouse gas emission fluxes in tomato fields. (a) CH4 emission flux. (b) N2O emission flux. (c) CO2 emission flux. Different lowercase letters (a, b, c…) in the same column indicate significant differences between treatments for the same indicator (p < 0.05). T0 and T1 denote irrigation temperatures of 10–15 °C and 20–25 °C, respectively. H0 and H1 indicate the absence and presence of humic acid application, with H1 representing a 0.5% humic acid concentration. A0, A1, and A2 correspond to unaerated conditions, Venturi aeration, and micro–nano aeration, respectively. ** indicates that there is a highly significant difference between treatments on the same day of data collection (p < 0.01), * indicates that there is a significant difference (p < 0.05).
Agronomy 15 01353 g007
Figure 8. Effect of water–fertilizer–gas–warming coupling on NGWP and GHGI. Different lowercase letters (a, b, c…) in the same column indicate significant differences between treatments for the same indicator (p < 0.05). (a) NGWP. (b) GHGI. T0 and T1 denote irrigation temperatures of 10–15 °C and 20–25 °C, respectively. H0 and H1 indicate the absence and presence of humic acid application, with H1 representing a 0.5% humic acid concentration. A0, A1, and A2 correspond to unaerated conditions, Venturi aeration, and micro–nano aeration, respectively. ** indicates that there is a highly significant difference between treatments on the same day of data (p < 0.01), * indicates that there is a significant difference (p < 0.05).
Agronomy 15 01353 g008
Table 1. Irrigation and fertilizer management during the growth period of processing tomato.
Reproductive PeriodDateDuration of Crop Fertility
(d)
Irrigation Amount
(m3·hm−2)
KH2PO4
(K2O: 33.8%)
(P2O5: 51.0%)
kg·hm−2
CH4N2O
(N: 46.4%)
kg·hm−2
Frequency of Irrigation and FertilizationDate for Irrigation and Fertilization
Seedling stage6 May–8 June 2024–33562.523.53018 June 2024
Blossoming and fruiting stage9–27 June 20241811254760217 June 2024, 27 June 2024
Full fruit stage28 June–2 August 20243522509412046 July 2024, 12 July 2024, 19 July 2024, 26 July 2024,
Red ripening stage3–18 August 202415562.523.530115 August 2024
Full life span6 May 2024–18 August 202411145001882408
Table 2. Experimental treatments and irrigation schemes.
TreatmentTemperature of Irrigation Water (°C)Humic Acid Addition
(%)
Dissolved Oxygen Content (mg·L−1)
T0H0A010–1505
T0H0A19
T0H0A218
T0H1A00.55
T0H1A19
T0H1A218
T1H0A020–2505
T1H0A19
T1H0A218
T1H1A00.55
T1H1A19
T1H1A218
Table 3. Analysis of economic benefits of different treatments.
TreatmentInput (CNY·hm−2)Outputs
(CNY·hm−2)
Net Profit (CNY·hm−2)
Irrigation SystemFertilizerWater and ElectricityOtherTotal
T0H0A024,1534936171747636,73681,863 ± 7667 g45,126 ± 7667 c
T0H0A126,6334936171747639,21686,991 ± 10,021 fg47,774 ± 10,022 c
T0H0A264,8564936171747677,439119,779 ± 4459 abc42,339 ± 4459 c
T0H1A024,1534939171747636,74093,329 ± 2712 efg56,589 ± 2712 bc
T0H1A126,6334939171747639,220103,466 ± 5236 de64,246 ± 5236 ab
T0H1A264,8564939171747677,443129,116 ± 4947 ab51,673 ± 4948 bc
T1H0A024,15349362662747639,22787,375 ± 5219 fg48,148 ± 5220 c
T1H0A126,63349362662747641,70797,386 ± 16,064 ef55,679 ± 16,064 bc
T1H0A264,85649362662747679,930106,572 ± 6465 cde26,642 ± 6465 d
T1H1A024,15349392662747639,231103,028 ± 2438 de63,798 ± 2438 ab
T1H1A126,63349392662747641,711114,281 ± 959 bcd72,570 ± 959 a
T1H1A264,85649392662747679,934131,184 ± 8135 a51,250 ± 8135 bc
Three-way ANOVA
T (irrigation water temperature)3.0040.502
H (humic acid application)41.908 **41.888 **
A (dissolved oxygen content)54.351 **16.741 **
T × H1.8571.857
T × A4.174 *4.174 *
H × A0.2020.202
T × H × A0.8410.841
Note: different lowercase letters (a, b, c…) in the same column indicate significant differences between treatments for the same indicator (p < 0.05). “±” represents the standard deviation among processing three processing group repetitions, ** indicates that there is a highly significant difference between treatments on the same day of data (p < 0.01), * indicates that there is a significant difference (p < 0.05).
Table 4. Comprehensive scores and rankings of various water–fertilizer–gas–thermal coupling modes based on three integrated evaluation methods.
TreatmentTOPSISRSRPCA
D+D−CRakingRSRRakingPCA1PCA2PCA3ScoreRaking
T0H0A00.9130.3390.271120.20112−1.523−0.4880.077−1.32812
T0H0A10.8070.3450.299100.34010−1.107−0.5210.272−0.97111
T0H0A20.4700.5990.56040.60540.453−0.9491.6870.3684
T0H1A00.6840.3760.35490.3889−0.5780.219−0.117−0.4689
T0H1A10.5480.4880.47150.55750.0251.149−0.1430.1366
T0H1A20.3130.7950.71820.74421.246−0.4071.4121.0772
T1H0A00.8220.3490.298110.28311−1.1360.072−0.043−0.94910
T1H0A10.6130.4640.43180.4318−0.420.4780.736−0.2638
T1H0A20.5740.5080.47060.51460.397−1.931−2.0170.027
T1H1A00.5670.4770.45770.47370.130.997−1.0490.1615
T1H1A10.4510.6420.58730.66330.7251.727−0.4520.773
T1H1A20.3430.9080.72610.87311.788−0.345−0.3621.4461
Note: TOPSIS denotes the superior–inferior solution distance method; RSR denotes the rank-sum ratio method; PCA denotes principal component analysis; D+ and D− denote the distances of the treatments from the optimal and inferior solutions; C represents the score of the TOPSIS-based comprehensive evaluation, respectively, after normalization. PCA1 denotes Principal Component 1, PCA2 denotes Principal Component 2, and PCA3 denotes Principal Component 3.
Table 5. Kendall’s W consistency test.
Evaluation ModelRank Average ValueMedianKendall’s W
Coefficient
χ2p
TOPSIS evaluation value1.9170.4630.7997.1670.028 *
RSR evaluation value2.5830.493
PCA evaluation value1.5−0.08
* indicates that there is a significant difference (p < 0.05)
Table 6. Evaluation results of the combined evaluation model based on overall difference (ODCA).
TreatmentCombined Weight Vector 1Combined Weight Vector 2Combined Weight Vector 3TOPSIS ScoreRSR
Score
PCA
Score
Evaluation ValueRanking
T1H1A20.33090.34020.32890.7260.8731.4461.0131
T0H1A20.33090.34020.32890.7180.7441.0770.8452
T1H1A10.33090.34020.32890.5870.6630.7700.6733
T0H0A20.33090.34020.32890.5600.6050.3680.5124
T0H1A10.33090.34020.32890.4710.5570.1360.3905
T1H1A00.33090.34020.32890.4570.4730.1610.3656
T1H0A20.33090.34020.32890.4700.5140.0200.3377
T1H0A10.33090.34020.32890.4310.431−0.2630.2038
T0H1A00.33090.34020.32890.3540.388−0.4680.0959
T0H0A10.33090.34020.32890.2990.340−0.971−0.10510
T1H0A00.33090.34020.32890.2980.283−0.949−0.11711
T0H0A00.33090.34020.32890.2710.201−1.328−0.27912
Disclaimer/Publisher’s Note: The statements, opinions and data contained in all publications are solely those of the individual author(s) and contributor(s) and not of MDPI and/or the editor(s). MDPI and/or the editor(s) disclaim responsibility for any injury to people or property resulting from any ideas, methods, instructions or products referred to in the content.

