Article

Long-Term Film Mulching with Manure Amendment Drives Trade-Offs Between Spring Maize Nutrient Uptake and Topsoil Carbon Stability on the Loess Plateau

1
College of Life Science, Luoyang Normal University, Luoyang 471934, China
2
State Key Laboratory of Soil Erosion and Dryland Farming on the Loess Plateau, Northwest A&F University, Xianyang 712100, China
3
Institute of Ecology, College of Urban and Environmental Sciences, Peking University, Beijing 100871, China
4
College of Resources and Environmental Sciences, Gansu Agricultural University, Lanzhou 730070, China
*
Authors to whom correspondence should be addressed.
Agronomy 2025, 15(6), 1352; https://doi.org/10.3390/agronomy15061352 (registering DOI)
Submission received: 17 April 2025 / Revised: 20 May 2025 / Accepted: 29 May 2025 / Published: 31 May 2025
(This article belongs to the Section Farming Sustainability)

Abstract

:
Film mulching and gravel mulching are effective methods for increasing crop yields in Northwest China but exacerbate soil organic carbon (SOC) mineralisation. Manure amendment is a viable method for offsetting carbon (C) losses from mulching. SOC stability is a key factor in determining the nutrient supply capacity of soils, as it affects the C sources available to microorganisms. However, the synergistic effects of film mulching and manure amendment on SOC stability and crop nutrient uptake are still unclear. Therefore, four treatments—no mulching (CK), gravel mulching (GM), film mulching (FM), and film mulching with manure amendment (FCM)—were established on the Loess Plateau. Experiments were conducted to measure plant and grain nitrogen (N), phosphorus (P), potassium (K) uptake, SOC, labile organic C fractions (LOCFs), stability-based organic C fractions (SOCFs), and the C management index (CMI) in 2019 and 2020. The results showed that the FM and FCM treatments significantly improved crop dry matter accumulation in both years compared to the control. The FCM treatment significantly increased the two-year NPK averages of plants to 44.9%, 50.7%, and 54.5% and significantly increased those of grains to 46.7%, 58.2%, and 30.4%. The FCM treatment significantly increased all LOCFs, water solution C (WSC), hot-water-extractable C (HWC), permanganate oxidisable C (POXC), and particulate organic C (POC) in the topsoil (0–20 cm) in both years. The fractions of the active C pool (AP) in the SOCFs, namely, very labile C (CVL) and labile C (CL), were significantly increased, suggesting that the FCM treatment significantly decreased C stability in the topsoil. The sensitivity index showed that, among all SOC fractions, POC (21.5–72.9%) and less labile C (CLL) (20.8–483.8%) were the most sensitive fractions of LOCFs and SOCFs compared to SOC (1.93–35.8%). A random forest analysis showed that most labile C fractions and the CMI significantly contributed to crop N, P, and K uptake, especially POXC to crop N uptake, the CMI to crop P uptake, and the AP to crop K uptake. It was concluded that the FCM treatment synergistically enhanced SOC lability, crop NPK uptake, and labile C fractions, especially POXC, the AP, and the CMI, which serve as robust indicators for guiding precision nutrient management in semi-arid croplands.

Graphical Abstract

1. Introduction

Maize is the most widely grown and productive food crop in the world and plays an important role in ensuring food security [1]. Nitrogen (N), phosphorus (P), and potassium (K) are the three macronutrients required for maize growth [2], and optimising the supply and uptake of these elements is critical to improving crop yields. Therefore, it is imperative to improve soil nutrient availability to increase the uptake of N, P, and K by maize. Effective agricultural management practices, including crop rotation systems and balanced fertilisation, are well known to play a role in improving soil nutrient availability [3,4]. Recent studies have shown a strong correlation between changes in soil organic carbon (SOC) and its fractions, as influenced by agricultural management practices, and crop nutrient uptake [5,6]. SOC plays a crucial role in enhancing soil properties and supporting crop production [7], as many soil biogeochemical processes are mediated by SOC [8]. Consequently, nutrient uptake by crops is influenced not only by agricultural practices, but also by the content of different carbon (C) fractions [6,9]. Therefore, the effects of agricultural practices on soil nutrient supply and crop N, P, and K uptake may be mediated by their effects on soil C dynamics.
The Loess Plateau is a typical dryland area in China, where limited water resources and increasing soil degradation are the main constraints to maize yield [10]. Gravel mulching and plastic film mulching have been effective agricultural practices to alleviate water scarcity and maintain crop yield in this semi-arid region [11], but previous studies have reported that long-term mulching can lead to a decrease in topsoil SOC content (0–20 cm) [12,13,14,15]. Manure amendment is an effective way to improve soil fertility and increase SOC [16]. Manure can not only provide a large amount of available C and various nutrients, but also improve soil structure, reduce soil bulk density (BD), and improve soil porosity and water storage capacity, thus supporting higher planting densities [17,18,19]. Studies have shown that long-term organic matter application improves SOC accumulation and N use efficiency [7,20]. However, there is a lack of quantification of the effects of film mulching with manure amendment on crop nutrient uptake in dry farming areas.
SOC varies widely with different agricultural practices and is often positively correlated with aboveground nutrient uptake [6,21]. However, SOC is not sensitive enough to reflect changes in soil quality due to higher background levels and natural soil variability [22]. Labile organic C fractions (LOCFs), such as water solution C (WSC), hot-water extractable C (HWC), permanganate oxidisable C (POXC), and particulate organic C (POC), have been used as early indicators to reflect soil quality dynamics [23,24]. LOCFs are SOC fractions that can be directly utilised by microorganisms and are often considered to be the primary energy source for microorganisms [22]. Previous studies have found that LOCFs directly influence the supply of soil nutrients to crops [6,25]. However, it should be noted that SOC is a heterogeneous substance composed of multiple compounds, each with different levels of stability [26]. The degree of stabilisation of different SOC fractions varies due to differences in physicochemical properties and turnover times [27]. Based on these differences in the stability of SOC fractions, they can be broadly classified into active C pools and passive C pools [27]. Active C pools behave similarly to LOCFs, whereas passive C pools are very slowly altered by microbes. This suggests that the C sources available to microorganisms are also limited by the stability of SOC pools [28]. Furthermore, it has been shown that microorganisms can also mediate the conversion of passive C pools into active C pools [29,30]. Different agricultural practices affect different soil properties, which are essential for the sustainability of cropping systems [30,31]. Based on the above two classifications, LOCFs together with CVL, CL, and the AP are referred to as labile C fractions. Changes in soil quality due to agricultural practices can be more accurately and sensitively indicated by the C pool management index (CMI), which can be used as an indicator of soil C lability and availability and is often used to assess the relative potential of different agricultural practices to affect SOC pools [23,32]. However, few studies have focused on the effects of the stability of SOC fractions on soil nutrient supply and crop nutrient uptake under different agricultural practices in semi-arid areas, particularly film mulching with manure amendment. Microorganisms play a crucial role in soil–plant nutrient cycling [33], and their enzyme activities have been shown to correlate with SOC fractions [31,34]. This is obviously related to the fact that the C sources available to microorganisms are also limited by the stability of the SOC fractions. Therefore, in the present study, it was hypothesised that film mulching with manure amendment stimulates NPK uptake in maize by accelerating labile C fractions that drive nutrient mineralisation.
A field experiment was initiated in 2009 to understand how mulching practices and manure amendment interact with soil organic matter (SOC) fractions and crop nutrient uptake (NPK) in semi-arid regions. The experiment was designed to test our hypothesis and provide valuable insights into these interactions. The specific objectives of the study were to (i) determine the effect of mulching practices and manure amendment on aboveground dry matter accumulation, crop NPK uptake, and SOC pools; (ii) determine the effect of mulching practices and manure amendment on the stability of different SOC fractions and the contribution of SOC fractions to crop NPK uptake; and (iii) quantify the effect of labile C fractions on NPK uptake in spring maize, with a view towards establishing their potential application in crop nutrient uptake.

2. Materials and Methods

2.1. Experimental Site

The field experiment was established at the Changwu Agro-ecological Experimental Station (35.28° N, 107.88° E; 1200 m a.s.l) on the Loess Plateau in 2009. The area has a semi-arid monsoon climate with a mean annual air temperature of 9.2 °C and an average annual precipitation of 582 mm (with about 73% received between May and September), while the average annual free evaporation is 1564.5 mm. The groundwater table is as deep as 60 m, making it unavailable for plants. The soil is classified as Cumuli-Ustic Isohumosols in the U.S. Department of Agriculture (USDA) classification system. The average monthly temperature and precipitation during the spring maize growth seasons in 2019 and 2020 and the average monthly precipitation from 2009 to 2020 are shown in Figure 1. At the beginning of the experiment in 2009, the soil had the following initial properties in the 0–20 cm soil layer [35]: BD of 1.3 g cm−3, pH of 8.4, SOC of 8.2 g kg−1, total N of 1.05 g kg−1, available P of 20.7 mg kg−1, available K of 133.1 mg kg−1, and mineral N of 28.8 mg kg−1.

2.2. Experimental Design

The field experiment in this study was conducted in 2019 and 2020. In this experiment, four treatments were established with three replicates using a randomised completed block design. The treatments were no mulching + NPK fertilisation (CK), gravel mulching + NPK fertilisation (GM), film mulching + NPK fertilisation (FM), and film mulching + NPK fertilisation + cow manure (FCM). The size of each plot was 56 m2 (7 × 8 m), and all plots had alternating wide and narrow row spacings of 60 cm and 40 cm. The GM treatment was covered with gravel 2–4 cm in diameter and about 5 cm thick at the joint. The FM and FCM treatments were mulched with plastic film all year round and re-mulched before sowing in the second year. The N fertiliser (urea, 46% N) was applied at a rate of 225 kg ha−1 three times, as follows: 40% before sowing, 30% at the 10-leaf stage, and 30% at the silking stage. All plots received 40 kg P ha−1 as calcium superphosphate (12% P2O5) and 80 kg K ha−1 as potassium sulphate (45% K2O) before sowing. The manure (cow dung) was applied at a rate of 30 t ha−1, with average contents of 12.0 g N kg−1, 2.0 g P kg−1, and 1.5 g K kg−1 on a dry weight basis [30]. The manure added mineral N, available P, and available K at 25, 4, and 3 kg ha−1, respectively. The P and K fertilisers and manure were applied as basal fertilisers before sowing. The topdressing fertiliser was applied using a hole-sowing machine. Pioneer 335 maize (Zea mays L.) was sown in late April and harvested in late September each year, and all straws were completely removed after harvest. The only water in the field was precipitation.

2.3. Plant Sampling and Determination

Three maize plants were randomly selected in each plot at harvest [36] and separated into different plant organs (including leaves, stems, sheaths, cobs, and grains), dried at 105 °C for 30 min, and then dried at 75 °C to a constant weight to obtain the aboveground biomass. The dried plant samples were crushed and digested to determine NPK concentrations. The Kjeldahl method, molybdenum–antimony colorimetric method, and flame spectrophotometric method were used to determine the N, P, and K concentrations, respectively [37].

2.4. Soil Sampling and Analysis

2.4.1. Soil Sampling

After the maize harvest, three soil samples were taken with an auger in the 0–20, 20–40, and 40–60 cm soil layers. A composite sample was taken by mixing the three samples from the same soil layer in each plot. The fresh soil was passed through a 2 mm sieve and then immediately divided into two subsamples. One subsample was refrigerated (4 °C) and the other subsample was air-dried for further analysis.

2.4.2. Labile Organic Carbon Fractions Determination

WSC and HWC were determined using the method described by Ghani et al. (2003) [38]. Briefly, WSC was extracted from moist soil (10.00 g) using a 1:5 ratio of soil to deionised water at 25 ◦C and shaken at 220 rpm for 30 min. The samples were then centrifuged at 4000 rpm for 20 min, after which the supernatant was filtered through a 0.45 mm membrane filter. The filtrate was analysed using a C & N analyser (Analytik Jena Ltd., Jena, Germany, Multi N/C 3000). A further 50 mL of deionised water was then added to the centrifuge tube to extract the HWC. The samples were shaken at 220 rpm for 5 min and then heated in a water bath at 80 °C for 16 h. They were then centrifuged at 4000 rpm for 20 min. The supernatant was then filtered through a 0.45 mm membrane filter. The filtrate was also analysed using a C & N analyser (Analytik Jena Ltd., Jena, Germany, Multi N/C 3000).
POXC was determined using the method described by Weil et al. (2003) [39]. Briefly, 2.50 g air-dried soil samples were weighed into centrifuge tubes, and 50 mL of a 0.02 M KMnO4 solution (prepared in 0.1 mol L−1 CaCl2) was added to each tube. All samples were immediately shaken for 1 h and centrifuged for 5 min at 4000 rpm. The diluted samples and standards were colorimetric with a UV–visible spectrophotometer (Tianmei Co., Ltd., Shanghai, China, 2300) at 565 nm. The change in KMnO4 concentration was used to estimate the amount of oxidiszed C (assuming that 1 mM of KMnO4 was consumed in the oxidation of 9 mg of C).
POC was determined according to the method described by Zhang et al. (2024) [30]. Briefly, 20.00 g of air-dried soil, sieved through a 2 mm mesh, was weighed and dispersed in a 100 mL sodium hexametaphosphate solution (5 g L−1) with shaking on a reciprocating shaker (120 rpm) for 16 h at room temperature. The soil suspension and precipitate were poured into a 53 μm sieve. The soil was subjected to a flow of distilled water to rinse the soil into a big beaker until the water flowing out was no longer turbidized. The soil on the sieve was dried at 60 °C, weighed and ground, and then measured by dichromate oxidation.

2.4.3. Stability-Based Organic Carbon Fractions Determination and Carbon Management Index Calculation

SOC was determined by the Walkley–Black method [40]. The stability-based organic carbon fractions (SOCFs) were determined according to the modified Walkley and Black method [27]. Briefly, 0.50 g of soil sample was placed in each of a set of 3 oven-dried Erlenmeyer flasks (250 mL). Then, 10 mL of 2 mol L−1 K2Cr2O7 (i.e., 0.167 mol L−1), followed by 5, 10, and 20 mL of concentrated H2SO4 (98%, sp. Gr. 1.84), was added to each corresponding flask, resulting in 6, 9, and 12 mol L−1 of H2SO4, respectively. After 30 min of oxidation, 200 mL of distilled water was added to each flask and the content was titrated with 1 mol L−1 FeSO4·7H2O using phenanthroline as an indicator. The SOCFs with decreasing degrees of oxidation were very labile C (CVL), labile C (CL), less labile C (CLL), and non-labile C (CNL). CVL and CL together constituted the active C pool (AP), and CLL and CNL together constituted the passive C pool (PP) [27].
According to the stability of the different fractions, CVL, CL, and CLL were given weights of 3, 2, and 1, respectively. The lability index (LI) was then calculated using the following equation [41].
LI = 3 C VL C SOC + 2 C L C SOC + C LL C SOC
The C pool index (CPI) and CMI were calculated using the following equations, taking the soil in the different soil layers of the control as the reference [32]:
CPI =   SOC   in   sample   soil / SOC   in   reference soil
CMI =   CPI ×   LI × 100

2.4.4. Sensitivity Index Calculation

The sensitivity index (SI, %) of SOC fractions was calculated according to the formula described by Zhang et al. (2022) [14], as follows:
SI = SOC   fractions   in   treatment - SOC   fractions   in   control SOC   fractions   in   control
For multi-year results, the higher the mean value of the SI, the more sensitive the SOC fraction; the lower the coefficient of variation (CV), the more stable the SI of the SOC fraction.

2.5. Statistical Analysis

An analysis of variance and Pearson’s correlation analysis were conducted using IBM SPSS Statistics 25.0 (IBM Corporation, Armonk, NY, USA). The normality of the data distribution was determined using the Shapiro–Wilk method, and the homogeneity of variance was determined using a one-way analysis of variance (ANOVA). Multiple comparisons of mean values between treatments were performed using the least significant difference (LSD) at p < 0.05. Pearson’s correlation analysis between crop NPK uptake, SOC fractions, and the CMI was performed at the 0.05 and 0.01 probability levels. Random forest analysis was conducted using the R package “randomForest”, and Origin 2021 (OriginLab Corporation, Northampton, MA, USA) was used to draw figures.

3. Results

3.1. Crop Nitrogen, Phosphorus, Potassium Uptake

After ten years of long-term mulching and manure amendment, there were significant differences in crop dry matter accumulation and NPK uptake (Table 1). Compared to the control, both the FM and FCM treatments significantly improved crop dry matter accumulation over the two years, but the GM treatment decreased dry matter accumulation. Compared to the control, the two-year means of the plant NPK of the FCM treatment were found to be significantly higher at 44.9%, 50.7%, and 54.5%, respectively. Similarly, the grain NPK of the FCM treatment was found to be significantly higher at 46.7%, 58.2%, and 30.4%, respectively. These results demonstrate that the FCM treatment resulted in a significant increase in aboveground biomass and plant and grain NPK in both years.

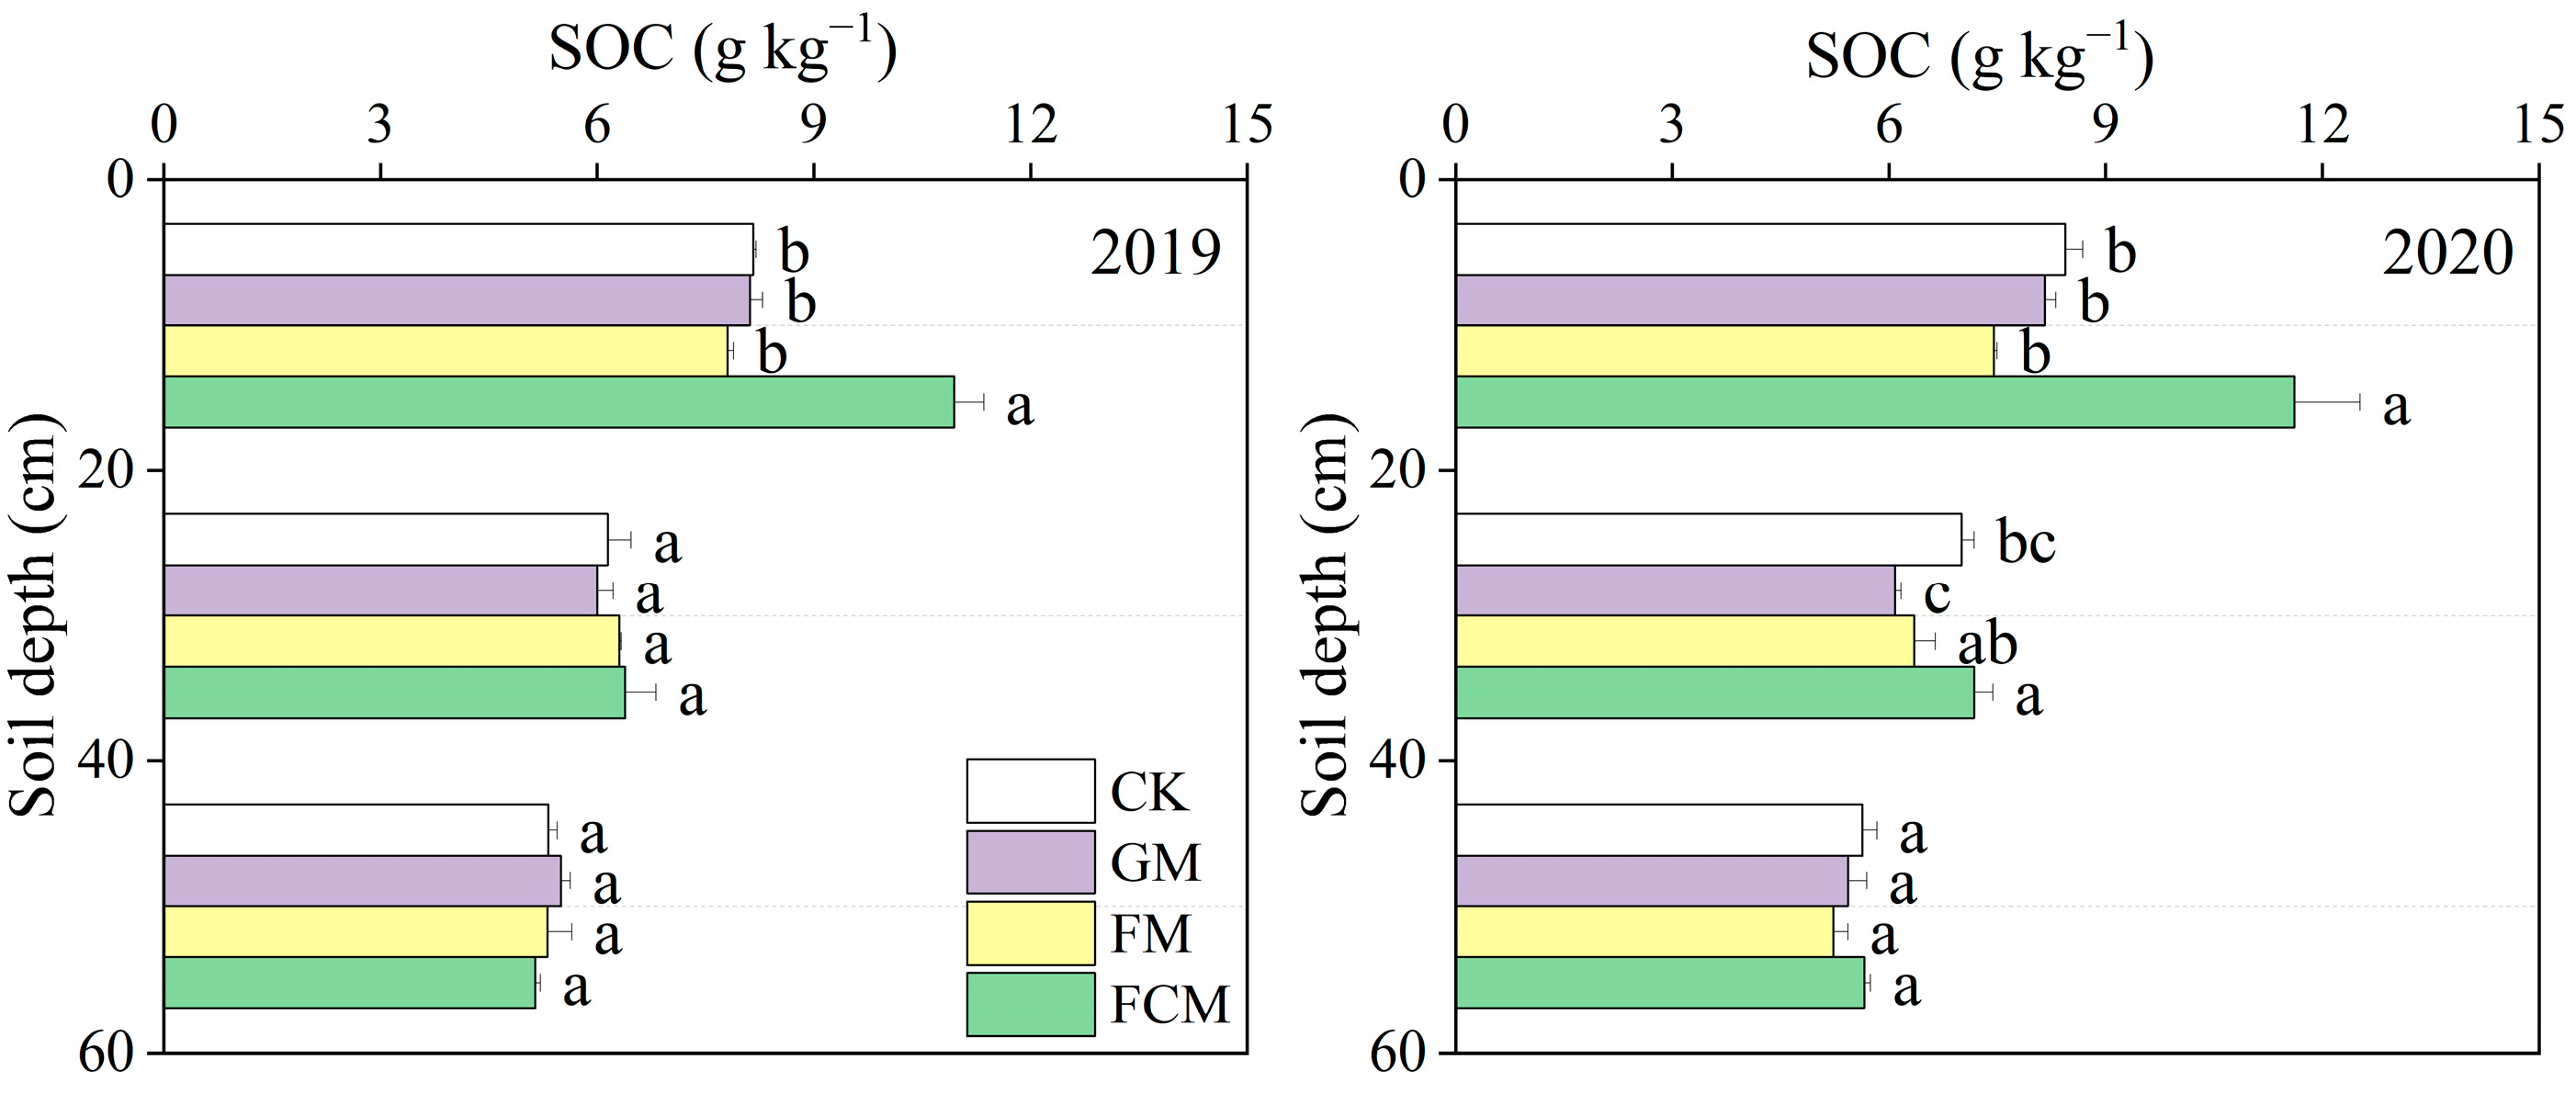
3.2. Soil Organic Carbon

The effects of long-term mulching and manure amendment on SOC at different soil depths are shown in Figure 2. In the 0–20 cm soil layer, the SOC in the GM and FM treatments showed a decreasing trend compared to the control, while FCM significantly increased SOC in both years. The initial SOC in the experiment in 2009 was 8.20 g kg−1 in the topsoil, and 12 years of FCM treatment significantly increased the SOC content by 11.61 g kg−1, while the GM and FM treatments decreased the SOC content by 8.16 and 7.45 g kg−1, respectively. In the 20–40 cm soil layer, only the FCM treatment significantly increased SOC in 2020 compared to the control. In the 40–60 cm soil layer, there was no significant difference in SOC between treatments. Linear regression analysis of NPK in both plants and grains with SOC content in both years showed highly significant positive correlations between SOC content and both plant NPK and grain NPK (Figure 3), although the low R2 values show that they also depend on other variables. These results demonstrate that the FCM treatment increased SOC in the 0–40 cm soil layers, especially in the topsoil, reaching significant levels, and that SOC content was significantly correlated with both plant and grain NPK.

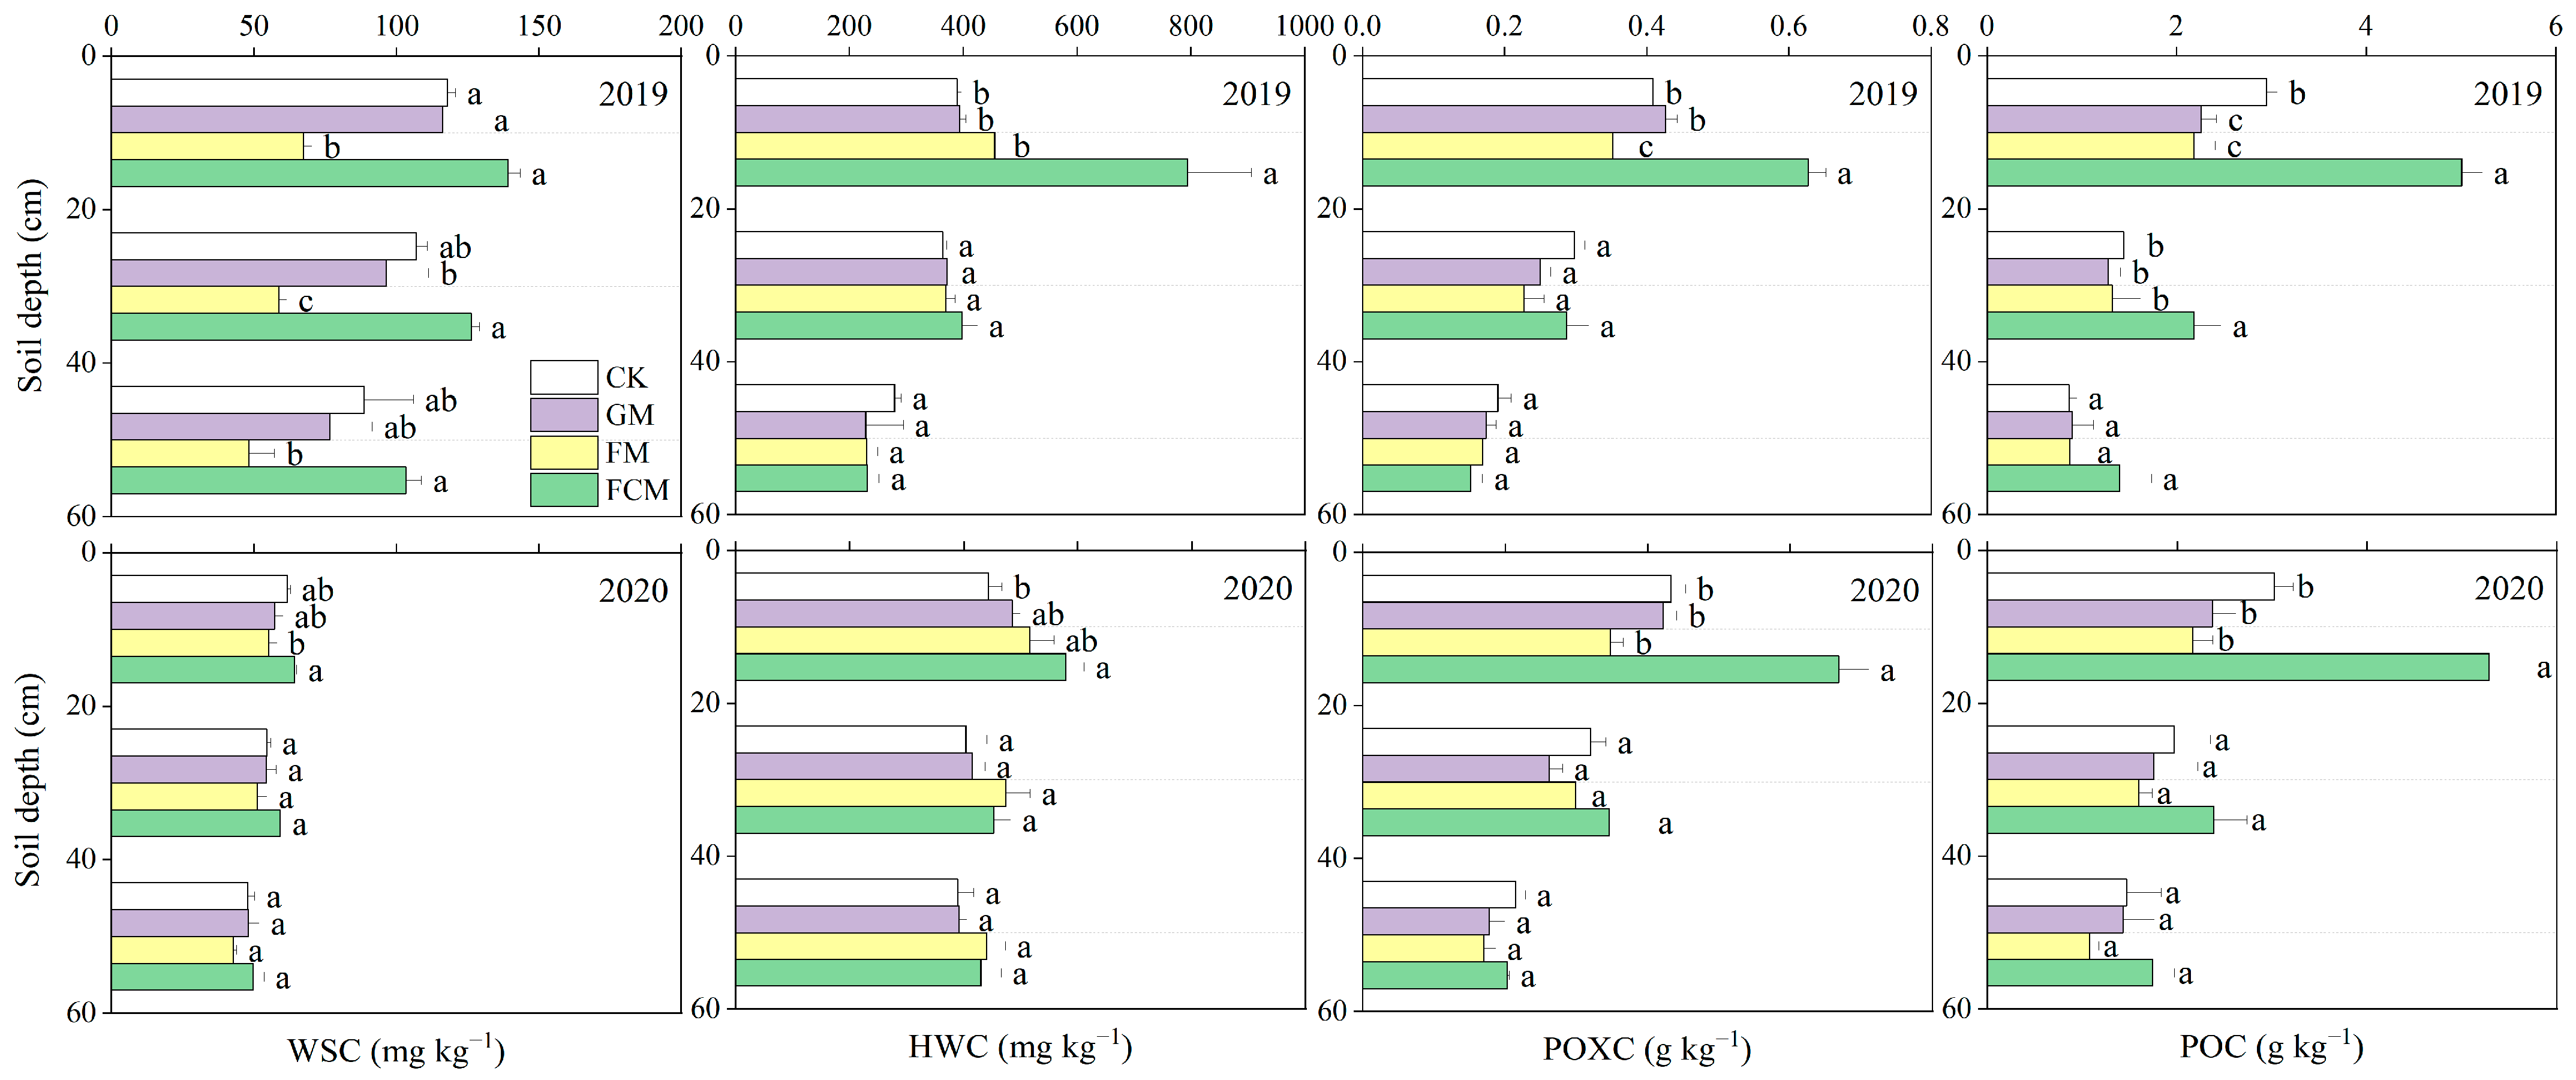
3.3. Labile Organic Carbon Fractions

The effects of long-term mulching and manure amendment on LOCFs at different soil depths in 2019 and 2020 are shown in Figure 4. In both years, the WSC in the topsoil was decreased in both the GM and FM treatments compared to the control, but it was significantly increased in the FCM treatment when compared to the FM treatment. HWC increased significantly in the topsoil in the FCM treatment in both years as compared to the control, while there was no significant change in the other soil layers. Compared to the control, POXC was decreased in the FM treatment and significantly increased in the FCM treatment in the topsoil in both years, while there was no significant difference in POXC between treatments in the other soil layers. The variation trends in POXC and POC were basically the same between treatments. Compared to the control, the GM and FM treatments significantly decreased the POC in the topsoil in 2019, while the FCM treatment significantly increased the POC in both years. The variation trends in POC in the 20–40 and 40–60 cm soil layers were consistent with those in the topsoil. These results suggest that the FM treatment decreased WSC and POXC, and the FCM treatment resulted in a significant increase in all the LOCFs in the topsoil.

3.4. Stability-Based Organic Carbon Fractions and Carbon Management Index

Long-term mulching and manure amendment affected SOCFs at different soil depths in 2019 and 2020 (Table 2). In the 0–20 cm soil layer, the FCM treatment significantly increased CVL compared to the CK in both years, while the FM treatment decreased CVL, reaching significant levels, especially in 2020. Compared to the CK, the FCM treatment increased CL and CLL in both years, but the FM treatment significantly decreased CLL in both years. Compared to the CK, the FM and FCM treatments increased CNL in both years, reaching significant levels, especially in 2020. Compared to the CK, the CAP in the topsoil increased significantly in the FCM treatment in both years, whereas CPP showed no significant difference. Overall, compared to the control, the AP in the topsoil was decreased in the FM treatment and significantly increased in the FCM treatment. These results suggest that the FM treatment improved SOC stability, whereas the FCM treatment decreased it.
The above results on SOC stability were well confirmed by the CMI (Table S1). Compared to the CK, the GM and FM treatments decreased the LI and CPI, while the FCM treatment significantly increased them in the topsoil in both years. The FCM treatment significantly increased the LI only in 2020 and did not significantly affect the CPI in the subsoil. Compared to the control, the FM treatment decreased the CMI in the topsoil in both years, reaching a significant level in 2020, while the FCM treatment significantly increased the CMI in both years. The variation trend in the CMI in the subsoil of all treatments was basically the same as that in the topsoil. The CMI in the 0–20 and 20–40 cm soil layers among the treatments showed a trend of FCM > CK > GM > FM. Overall, in the topsoil, the FM treatment decreased the CMI, while the FCM treatment significantly increased it in both years.

3.5. Sensitivity Index

The two-year SIs of all SOC fractions under long-term mulching and manure amendment in the topsoil are shown in Table 3. The average SIs of HWC (30.0%), POXC (24.6%), and POC (40.6%) were higher than that of SOC (15.2%). The same was true for CVL (40.3%), CL (19.9%), CLL (181.7%), and the AP (23.0%), whose SIs were higher than that of SOC. POC and CLL were highly sensitive to all treatments—the SIs followed the order FCM > FM > GM, while the SIs in the FCM treatment followed the order CLL > CVL > POC > HWC > POXC > AP. Overall, CLL and POC were the most sensitive to long-term mulching and manure amendment on the Loess Plateau.

3.6. Correlations Between Crop Nitrogen, Phosphorus, Potassium Uptake, and Soil Organic Carbon Parameters

SOC, various organic C fractions (HWC, POXC, POC, CVL, AP, etc.), and the CMI showed significant correlations with crop NPK uptake in different treatments (Table 4). Crop NPK uptake was not significantly correlated with WSC or the stable organic C fraction (CNL). Significant positive correlations were found between SOC and its fractions (Table S2). SOC had the strongest correlation with POXC and POC, with a value of 0.929. Among the SOC fractions, the strongest correlation was observed between POXC and AP (r = 0.916), followed by POXC and POC (r = 0.877).
The effects of the SOC fractions and CMI on crop NPK uptake were analysed using the random forest method to quantitatively evaluate the relative contribution of each SOC fraction and the CMI to crop NPK uptake (Figure 5). The largest contributor to both plant N and grain N was POXC (p < 0.01), and the largest contributor to both plant P and grain P was the CMI (p < 0.01). The top three contributors to plant K were the CMI (p < 0.05), HWC (p < 0.01), and the AP (p < 0.01), and the top three contributors to grain K were the CVL (p < 0.01), the AP (p < 0.01), and POXC (p < 0.05). It was evident that the AP made a very significant contribution to both plant and grain K. It can be concluded that film mulching combined with manure amendment can improve crop NPK uptake by increasing the contents of labile C fractions and the CMI. Among them, POXC, the CMI, and the AP contributed the most to crop N, crop P, and crop K, respectively. Overall, most labile C fractions (POXC, HWC, POC, etc.) and the CMI had significant effects on crop NPK uptake.

4. Discussion

4.1. The Effects of Long-Term Mulching and Manure Amendment on Crop Nitrogen, Phosphorus, Potassium Uptake, and Soil Organic Carbon Content

Mulching and fertilisation practices are closely related to nutrient uptake, translocation, and partitioning in maize [9,42]. The results of this study indicated that plant and grain N uptake were significantly higher in the FM treatment in both years, and plant and grain NPK uptake were significantly higher in the FCM treatment. The main reason for this is that film mulching can significantly improve N use efficiency [42], while manure amendment applied to improve soil fertility can provide sufficient soil NPK for maize growth [43]. The significant improvement in crop nutrient uptake with manure amendment can be attributed to several factors. Firstly, manure amendment mitigates the competition between soil microbes and crop nutrients for N, thereby reducing nutrient loss through regulated soil stoichiometry [44]; secondly, manure amendment has been shown to increase soil active organic N, and an increase in SOC can increase soil microbial biomass, which, in turn, increases soil microbial N sequestration capacity, thereby reducing N loss [7]; thirdly, manure amendment results in well-structured soil aggregates, which contributes to an increased availability of soil nutrients [45]. The results indicate that the FM treatment only had significant effects on crop N uptake, while the FCM treatment had significant effects on crop NPK uptake. This suggests that film mulching with manure amendment significantly improved crop NPK uptake by improving soil fertility.
SOC content is a key indicator of soil fertility, which directly affects crop growth [43]. The present study found that the SOC content of the topsoil was significantly higher in the FCM treatment compared with the initial SOC content in 2009. This is clearly because the manure itself can input large amounts of organic C and can also contribute to increased C input from the crop root [46]. The regression analysis of crop NPK uptake and SOC content revealed that an increase in SOC content was significantly correlated with crop NPK uptake, which is consistent with the results of previous research [6,7]. Manure amendment can significantly improve the physical and chemical properties of soil and promote the transformation of soil nutrients by enhancing the C metabolism activity of soil microorganisms, which, in turn, improves the nutrient supply capacity of the soil and promotes nutrient uptake by crops [7]. Therefore, SOC was closely related to crop NPK uptake, and manure amendment can significantly improve crop NPK uptake.

4.2. The Effects of Long-Term Mulching and Manure Amendment on Soil Organic Carbon Fractions

The dynamics of LOCFs are of great significance for monitoring the impact of agricultural management practices on soil fertility. The dynamics of WSC and HWC exhibited distinct patterns across the soil profiles. Both labile fractions exhibited rapid turnover rates and collectively accounted for less than 5% of SOC [24], consistent with their roles as microbial energy substrates. The observed divergence in vertical distribution patterns between WSC and HWC was likely due to their different microbial associations—WSC primarily serves as an immediate microbial substrate [47], whereas HWC better reflects microbial biomass [38]. Notably, both the GM and FM treatments decreased topsoil WSC while increasing HWC compared to the control. This could be attributed to improved hydrothermal conditions under mulching, which may stimulate microbial growth and enzyme activity with accelerated WSC utilisation [12]. POXC was particularly sensitive to management practices, as evidenced by its strong correlations with SOC (Table S1). This is consistent with previous findings that identified POXC as the most oxidation-sensitive SOC fraction and a robust indicator of labile C dynamics [39,48]. The differential responses of topsoil POXC to the mulch type, with a significant reduction in the FM treatment versus a non-significant reduction in the GM treatment, may reflect the superior temperature- and moisture-elevating capacities of film mulch, potentially increasing the oxidative losses of LOCFs [11]. Contrary to expectations, POC was significantly depleted in the mulching treatment, although mulching may have increased root inputs [46]. As POC is derived from particulate plant and microbial residues [49], its decline suggests that accelerated microbial mineralisation outpaced the accumulation of fresh input. This observation supports the emerging concept that POC serves as a preferred microbial energy reservoir in disturbed systems [50]. The apparent decoupling between POC dynamics and belowground root inputs may have been due to the fact that roots are inherently more resistant to microbial attacks, combined with the long and cold winters in the region, and are, therefore, more difficult to exploit, to the extent that they were removed from the soil when ploughed the following year. However, there are a number of methods available for determining LOCFs. Despite differences in mechanisms and objectives, there are numerous intersections and overlaps among the C fractions that are actually measured. Therefore, standardising different C fraction determination methods is of great significance for accurately predicting the impact of management practices on soil quality. The FCM treatment uniquely increased all SOC fractions relative to the control, establishing its superiority over single management. This synergistic effect was likely due to the following two mechanisms: (1) the direct input of manure-derived labile organic compounds [23] and (2) the gradual conversion of low-stability SOC into various LOCFs [30]. Our results suggested that the strategic integration of manure amendment with film mulching can effectively counteract the labile C depletion associated with film mulching.
The modified Walkley–Black method revealed differential responses of SOC stability pools to management practices (Table 2). The FM treatment decreased the CVL in the topsoil by 13.6% relative to the control, consistent with enhanced decomposition rates under improved hydrothermal conditions [12]. This accelerated CVL depletion is consistent with its role as microbial ‘fast food’ during the early stages of decomposition [51], which was particularly pronounced under the intensive organic matter mineralisation of FM. The cellulose-like fraction (CL) maintained relatively stable proportions (16.7–27.5% of SOC) across treatments (Table 2, Figure S1), supporting its characterisation as an intermediate C pool [30]. In contrast, chemically resistant lignin-derived C (CLL) was significantly depleted (−5.6–−11.7%) in the FM treatment, likely reflecting the preferential degradation of aromatic compounds requiring high activation energy [52]. The observed CLL–CVL flux (ΔCLL = −0.77 g kg−1 vs. ΔCVL = +0.44 g kg−1) in the topsoil suggests the active microbial funnelling of recalcitrant compounds into labile pools in the FM treatment [28], although this conversion efficiency requires further isotopic verification. The FCM treatment increased both CLL and CNL by 49.1% and 14.7% in the topsoil, which is attributed to lignin polyphenol inputs from manure and microbial necromass and extracellular metabolites [29,53]. The superior SOC sequestration capacity of FCM compared to conventional mulching is explained by this dual enhancement mechanism. The turnover of SOC fractions is a key process for releasing nutrients that can affect crop growth [30]. The FCM treatment significantly increased the AP content but not the PP content in the topsoil, probably because the AP content was higher than the PP content in the manure itself, suggesting that the manure application reduced SOC stability to some extent. This result is inconsistent with the findings of Shao et al. (2024) [54], possibly due to more active microbial activity in the rhizosphere soil. In our study, the FCM treatment significantly increased the total ratio of CVL, CL, and CLL and decreased the stability of SOC, which also led to an increase in greenhouse gas emissions to some extent, as previously reported by our team [35].
The CMI dynamics provide critical insights into system sustainability [23]. The reduction in the CMI in the GM and FM treatments signalled accelerated C cycling in excess of input rates, potentially reflecting long-term fertility depletion. Conversely, FCM significantly increased the topsoil CMI by 60.8%, demonstrating the dual role of manure in replenishing labile pools while building stable C [23]. The divergence from Yang et al.’s results [55] may be due to differences in baseline SOC and regional precipitation gradients (450 mm vs. 582 mm annually), modulating the decomposition–input balance. Overall, there was a significant decrease in SOC stability in the FCM treatment compared to the FM treatment.

4.3. Relationships Between Crop Nitrogen, Phosphorus, Potassium Uptake, and Soil Organic Carbon Parameters

Consistent with the results reported by Wang et al. (2024b) [6], this study revealed a significant correlation between the LOCFs (except WSC), CVL, the AP, the CMI, and NPK uptake in plants and grains. It was confirmed that the SIs of POC, CVL, and the AP to the FCM treatment were consistent with that of SOC. This result is consistent with previous studies in which WSC and CL were not correlated with SOC [31]. The probable reason for this is that WSC and CL were more easily degraded by microorganisms and had much lower proportions when accounting for SOC [30]. A meta-analysis also showed that the addition of organic matter continuously increased SOC composition and promoted microbial diversity, and dissolved organic C (DOC) (similar to WSC in this study) and microbial biomass C (similar to HWC in this study) increased with increasing organic matter addition, but the two were negatively correlated [56]. It was suggested that an increase in soil microbial abundance and enzyme activity may promote an increase in labile C fractions, with relatively fast turnover rates in soil with the addition of manure.
Manure application directly increased C inputs and indirectly improved soil aggregate stability [20], which enhanced nutrient uptake by the crops [7,44]. In this study, the results showed that SOC and its fractions were significantly higher in the FCM treatment than in the other treatments, which is similar to the variation in crop NPK uptake between treatments. The results showed significant correlations between SOC parameters and plant and grain NPK uptake, which is similar to the results of Tang et al. (2022) [7]. Thus, we concluded that the main contributors to N, P, and K uptake in plants and grains were the labile SOC fractions in this study. The random forest analysis showed that POXC contributed the most to crop nitrogen uptake, the CMI contributed the most to crop P uptake, and the AP contributed significantly to crop K uptake (Figure 5). To further investigate the relationships between POXC and crop N, the CMI and crop P, and the AP and crop K, linear regression analysis was used to clarify the quantitative relationships (Figure 6). The R2 values of the linear regressions of the CMI on plant P (R2 = 0.6591, p < 0.001) and grain N (R2 = 0.5685, p < 0.001) were the highest; followed by the AP on plant P (R2 = 0.5198, p < 0.001) and grain N (R2 = 0.5243, p < 0.001); and then the POXC on plant N (R2 = 0.3634, p = 0.002) and grain N (R2 = 0.3319, p = 0.003). Therefore, the CMI was found to be the most effective predictor of crop P uptake, followed by the AP for crop K uptake and then POXC for crop N uptake.

5. Conclusions

A 12-year spring maize field experiment revealed that both the FM and FCM treatments significantly increased aboveground dry matter accumulation, while the FCM treatment significantly increased NPK uptake in plants and grains. Both the GM and FM treatments decreased SOC and most labile C fractions in the topsoil, while the FCM treatment significantly increased SOC and all labile C fractions and resulted in a great improvement in the CMI, suggesting that the FCM treatment significantly decreased the SOC stability in the topsoil. The SI results indicated that POC and CLL can be used as early indicators of the potential effects of mulching treatments on SOC dynamics in the short term. SOC and most labile C fractions had positive effects on crop NPK uptake, among which the CMI, the AP, and POXC had the highest relative contributions to crop P uptake, crop K uptake, and crop N uptake, respectively. From the results, it is concluded that film mulching with manure amendment is a key technology for improving soil fertility and promoting crop NPK uptake, and that labile C fractions (such as POXC and the AP) and the CMI are effective predictors of crop nutrient uptake.

Supplementary Materials

The following supporting information can be downloaded at: https://www.mdpi.com/article/10.3390/agronomy15061352/s1, Figure S1: The proportion of C fractions based on gradient oxidation under different treatments in 2019 and 2020; Table S1: The lability index (LI), carbon management index (CPI) and carbon management index (CMI) under different treatments in 2019 and 2020; Table S2: Pearson correlations among SOC parameters and microbial enzyme activities in the topsoil (n = 24); R code S1: Random forest analysis of R codes and results.

Author Contributions

Conceptualisation, Q.S. and S.L.; formal analysis, L.W., R.L. and K.W.; investigation, F.Z.; resources, Q.S., J.H. and S.L.; data curation, K.L.; writing—original draft, F.Z.; writing—review and editing, J.H.; supervision, Q.S., J.H. and S.L. All authors have read and agreed to the published version of the manuscript.

Funding

This work was financially supported by the National Key R&D Program of China (No.: 2021YFD1900700), the National Natural Science Foundation of China (No.: 42077102), Henan Province Science and Technology Breakthrough Project (No.: 232102110046, 242102320148), Key Research Projects of High Education Institutions in Henan Province (No.: 24A210019), and the core technology research category of the public welfare special of Luoyang (No.: 2302036A).

Data Availability Statement

The original contributions presented in the study are included in the article and the Supplementary Materials; further inquiries can be directed to the corresponding authors.

Acknowledgments

We sincerely thank the West Henan Yellow River Wetland Ecosystem Observation and Research Station and the Engineering Research Center for Wetland Ecological Restoration in the Middle–Lower Reaches of the Yellow River for providing follow-up support, as well as the three anonymous reviewers for their efforts to improve the quality of the manuscript.

Conflicts of Interest

The authors declare no conflicts of interest.

References

  1. Erenstein, O.; Jaleta, M.; Sonder, K.; Mottaleb, K.; Prasanna, B.M. Global maize production, consumption and trade: Trends and R&D implications. Food Secur. 2022, 14, 1295–1319. [Google Scholar]
  2. Hao, D.; Li, X.; Kong, W.; Chen, R.; Liu, J.; Guo, H.; Zhou, J. Phosphorylation regulation of nitrogen, phosphorus, and potassium uptake systems in plants. Crop J. 2023, 11, 1034–1047. [Google Scholar] [CrossRef]
  3. Sainju, U.M.; Lenssen, A.W.; Allen, B.L.; Stevens, W.B.; Jabro, J.D. Soil total carbon and nitrogen and crop yields after eight years of tillage, crop rotation, and cultural practice. Heliyon 2017, 3, e00481. [Google Scholar] [CrossRef]
  4. Kucerik, J.; Brtnicky, M.; Mustafa, A.; Hammerschmiedt, T.; Kintl, A.; Sobotkova, J.; Alamri, S.; Baltazar, T.; Latal, O.; Naveed, M.; et al. Utilization of diversified cover crops as green manure-enhanced soil organic carbon, nutrient transformation, microbial activity, and aaize growth. Agronomy 2024, 14, 2001. [Google Scholar] [CrossRef]
  5. Major, J.; Rondon, M.; Molina, D.; Riha, S.J.; Lehmann, J. Maize yield and nutrition during 4 years after biochar application to a Colombian savanna oxisol. Plant Soil 2010, 333, 117–128. [Google Scholar] [CrossRef]
  6. Wang, M.; Feng, X.; Zhou, Z.; Ma, H.; Ge, T.; Tang, C.; Wang, D.; Chen, S. Labile organic carbon fractions in the rhizosphere contribute to nitrogen and phosphorus uptake in rice under long-term crop rotations and nitrogen application. Appl. Soil Ecol. 2024, 200, 105459. [Google Scholar] [CrossRef]
  7. Tang, H.; Cheng, K.; Shi, L.; Li, C.; Wen, L.; Li, W.; Sun, M.; Sun, G.; Long, Z. Effects of long-term organic matter application on soil carbon accumulation and nitrogen use efficiency in a double-cropping rice field. Environ. Res. 2022, 213, 113700. [Google Scholar] [CrossRef]
  8. Chen, L.; Liu, L.; Qin, S.; Yang, G.; Fang, K.; Zhu, B.; Kuzyakov, Y.; Chen, P.; Xu, Y.; Yang, Y. Regulation of priming effect by soil organic matter stability over a broad geographic scale. Nat. Commun. 2019, 10, 5112. [Google Scholar] [CrossRef]
  9. Li, G.H.; Cheng, Q.; Li, L.; Lu, D.L.; Lu, W.P. N, P and K use efficiency and maize yield responses to fertilization modes and densities. J. Integr. Agric. 2021, 20, 78–86. [Google Scholar] [CrossRef]
  10. Liu, C.A.; Jin, S.L.; Zhou, L.M.; Jia, Y.; Li, F.M.; Xiong, Y.C.; Li, X.G. Effects of plastic film mulch and tillage on maize productivity and soil parameters. Eur. J. Agron. 2009, 31, 241–249. [Google Scholar] [CrossRef]
  11. Bu, L.; Liu, J.; Zhu, L.; Luo, S.; Chen, X.; Li, S.; Lee Hill, R.; Zhao, Y. The effects of mulching on maize growth, yield and water use in a semi-arid region. Agric. Water Manag. 2013, 123, 71–78. [Google Scholar] [CrossRef]
  12. Li, F.; Song, Q.; Hao, J.; Jemba, P.; Shi, Y. Dynamics of soil microbial biomass C and soil fertility in cropland mulched with plastic film in a semiarid agroecosystem. Soil Biol. Biochem. 2004, 36, 1893–1902. [Google Scholar] [CrossRef]
  13. Steinmetz, Z.; Wollmann, C.; Schaefer, M.; Buchmann, C.; David, J.; Tröger, J.; Muñoz, K.; Frör, O.; Schaumann, G.E. Plastic mulching in agriculture. trading short-term agronomic benefits for long-term soil degradation? Sci. Total Environ. 2016, 550, 690–705. [Google Scholar] [CrossRef]
  14. Zhang, F.; Li, S.; Yue, S.; Song, Q. The effect of long-term soil surface mulching on SOC fractions and the carbon management index in a semiarid agroecosystem. Soil Tillage Res. 2022, 216, 105233. [Google Scholar] [CrossRef]
  15. Ren, A.T.; Li, J.Y.; Zhao, L.; Zhou, R.; Ye, J.S.; Wang, Y.B.; Zhang, X.C.; Wesly, K.; Ma, M.S.; Xiong, Y.C. Reduced plastic film mulching under zero tillage boosts water use efficiency and soil health in semiarid rainfed maize field. Resour. Conserv. Recy. 2023, 190, 106851. [Google Scholar] [CrossRef]
  16. Abdalla, K.; Sun, Y.; Zarebanadkouki, M.; Gaiser, T.; Seidel, S.; Pausch, J. Long-term continuous farmyard manure application increases soil carbon when combined with mineral fertilizers due to lower priming effects. Geoderma 2022, 428, 116216. [Google Scholar] [CrossRef]
  17. Jiang, H.; Han, X.; Zou, W.; Hao, X.; Zhang, B. Seasonal and long-term changes in soil physical properties and organic carbon fractions as affected by manure application rates in the Mollisol region of Northeast China. Agric. Ecosyst. Environ. 2018, 268, 133–143. [Google Scholar] [CrossRef]
  18. Wang, X.; Ren, Y.; Zhang, S.; Chen, Y.; Wang, N. Applications of organic manure increased maize (Zea mays L.) yield and water productivity in a semi-arid region. Agric. Water Manag. 2017, 187, 88–98. [Google Scholar] [CrossRef]
  19. Lin, J.Y.; Sayre, J.M.; Schmidt, R.; Fonte, S.J.; Rodrigues, J.L.M.; Scow, K.M. Compost amendment maintains soil structure and carbon storage by increasing available carbon and microbial biomass in agricultural soil—A six-year field study. Geoderma 2022, 427, 116117. [Google Scholar]
  20. Chen, S.; Zhang, X.; Shao, L.; Sun, H.; Niu, J.; Liu, X. Effects of straw and manure management on soil and crop performance in North China Plain. Catena 2020, 187, 104359. [Google Scholar] [CrossRef]
  21. Xie, J.; Evgenia, B.; Zhang, Y.; Wan, Y.; Hu, Q.J.; Zhang, C.M.; Wang, J.; Zhang, Y.Q.; Shi, X.J. Substituting nitrogen and phosphorus fertilizer with optimal amount of crop straw improves rice grain yield, nutrient use efficiency and soil carbon sequestration. J. Integr. Agric. 2022, 21, 3345–3355. [Google Scholar] [CrossRef]
  22. Haynes, R.J. Labile organic matter fractions as central components of the quality of agricultural soils: An overview. Adv. Agron. 2005, 85, 221–268. [Google Scholar]
  23. Chaudhary, S.; Dheri, G.S.; Brar, B.S. Long-term effects of NPK fertilizers and organic manures on carbon stability and management index under rice-wheat cropping system. Soil Tillage Res. 2017, 166, 59–66. [Google Scholar] [CrossRef]
  24. Bongiorno, G.; Bünemann, E.K.; Oguejiofor, C.U.; Meier, J.; Gort, G.; Comans, R.; Mäder, P.; Brussaard, L.; de Goede, R. Sensitivity of labile carbon fractions to tillage and organic matter management and their potential as comprehensive soil quality indicators across pedoclimatic conditions in Europe. Ecol. Indic. 2019, 99, 38–50. [Google Scholar] [CrossRef]
  25. Zhang, Z.M.; Yan, J.; Han, X.Z.; Zou, W.X.; Chen, X.; Lu, X.C.; Feng, Y.T. Labile organic carbon fractions drive soil microbial communities after long-term fertilization. Glob. Ecol. Conserv. 2021, 32, e01867. [Google Scholar] [CrossRef]
  26. Deb, S.; Bhadoria, P.B.S.; Mandal, B.; Rakshit, A.; Singh, H.B. Soil organic carbon: Towards better soil health, productivity and climate change mitigation. Clim. Change Environ. Sust. 2015, 3, 26. [Google Scholar] [CrossRef]
  27. Chan, K.Y.; Bowman, A.; Oates, A. Oxidizible organic carbon fractions and soil quality changes in an Oxic Paleustalf under different pasture leys. Soil Sci. 2001, 166, 61–67. [Google Scholar] [CrossRef]
  28. Davidson, E.A.; Janssens, I.A. Temperature sensitivity of soil carbon decomposition and feedbacks to climate change. Nature 2006, 440, 165–173. [Google Scholar] [CrossRef] [PubMed]
  29. Liang, C.; Schimel, J.P.; Jastrow, J.D. The importance of anabolism in microbial control over soil carbon storage. Nat. Microbiol. 2017, 2, 17105. [Google Scholar] [CrossRef]
  30. Zhang, F.; Song, Q.; Ma, T.; Gao, N.; Han, X.; Shen, Y.; Yue, S.; Li, S. Long-term maintenance of high yield and soil fertility with integrated soil-crop system management on the Loess Plateau. J. Environ. Manag. 2024, 351, 119687. [Google Scholar] [CrossRef]
  31. Jat, H.S.; Datta, A.; Choudhary, M.; Sharma, P.C.; Yadav, A.K.; Choudhary, V.; Gathala, M.K.; Jat, M.L.; McDonald, A. Climate Smart Agriculture practices improve soil organic carbon pools, biological properties and crop productivity in cereal-based systems of North-West India. Catena 2019, 181, 104059. [Google Scholar] [CrossRef]
  32. Blair, G.J.; Lefroy, R.D.B.; Lise, L. Soil carbon fractions based on their degree of oxidation, and the development of a carbon management index for agricultural systems. Aust. J. Agric. Res. 1995, 46, 1459–1466. [Google Scholar] [CrossRef]
  33. Liu, J.; Li, S.; Yue, S.; Tian, J.; Chen, H.; Jiang, H.; Siddique, K.H.M.; Zhan, A.; Fang, Q.; Yu, Q. Soil microbial community and network changes after long-term use of plastic mulch and nitrogen fertilization on semiarid farmland. Geoderma 2021, 396, 115086. [Google Scholar] [CrossRef]
  34. Li, S.; Zhang, S.; Pu, Y.; Li, T.; Xu, X.; Jia, Y.; Deng, O.; Gong, G. Dynamics of soil labile organic carbon fractions and C-cycle enzyme activities under straw mulch in Chengdu Plain. Soil Tillage Res. 2016, 155, 289–297. [Google Scholar] [CrossRef]
  35. Nan, W.; Li, S.; Dong, Z.; Yao, P. CH4 fluxes and diffusion within soil profiles subjected to different fertilizer regimes on China’s Loess Plateau. Agric. Ecosyst. Environ. 2020, 287, 106679. [Google Scholar] [CrossRef]
  36. Yakoub, A.; Lloveras, J.; Biau, A.; Lindquist, J.L.; Lizaso, J.I. Testing and improving the maize models in dssat: Development, growth, yield, and n uptake. Field Crop Res. 2017, 212, 95–106. [Google Scholar] [CrossRef]
  37. Bao, S.D. Soil Agrochemical Analysis, 3rd ed.; China Agriculture Press: Beijing, China, 2000. [Google Scholar]
  38. Ghani, A.; Dexter, M.; Perrott, K.W. hot-water extractable carbon in soils: A sensitive measurement for determining impacts of fertilisation, grazing and cultivation. Soil Biol. Biochem. 2003, 35, 1231–1243. [Google Scholar] [CrossRef]
  39. Weil, R.R.; Islam, K.R.; Stine, M.A.; Gruver, J.B.; Samson-Liebig, S.E. Estimating active carbon for soil quality assessment: A simplified method for laboratory and field use. Am. J. Altern. Agric. 2003, 18, 3–17. [Google Scholar] [CrossRef]
  40. Walkley, A.; Black, I.A. An examination of the Degtjareff method for determining organic carbon in soils: Effect of variations in digestion conditions and inorganic soil constituents. Soil Sci. 1934, 63, 251–263. [Google Scholar] [CrossRef]
  41. Majumder, B.; Mandal, B.; Bandyopadhyay, P.K.; Chaudhury, J. Soil organic carbon pools and productivity relationships for a 34 year old rice-wheat-jute agroecosystem under different fertilizer treatments. Plant Soil 2007, 297, 53–67. [Google Scholar] [CrossRef]
  42. Liu, Z.; Chen, Z.; Ma, P.; Meng, Y.; Zhou, J. Effects of tillage, mulching and N management on yield, water productivity, N uptake and residual soil nitrate in a long-term wheat-summer maize cropping system. Field Crops Res. 2017, 213, 154–164. [Google Scholar] [CrossRef]
  43. Cai, A.; Xu, M.; Wang, B.; Zhang, W.; Liang, G.; Hou, E.; Luo, Y. Manure acts as a better fertilizer for increasing crop yields than synthetic fertilizer does by improving soil fertility. Soil Tillage Res. 2019, 189, 168–175. [Google Scholar] [CrossRef]
  44. Yan, B.J.; Zhang, Y.P.; Wang, Y.Z.; Rong, X.M.; Peng, J.W.; Fei, J.C.; Gongwen, L. Biochar amendments combined with organic fertilizer improve maize productivity and mitigate nutrients loss by regulating the C–N–P stoichiometry of soil, microbiome, and enzymes. Chemosphere 2023, 324, 138293. [Google Scholar] [CrossRef]
  45. Zhang, Y.; E, S.; Wang, Y.; Su, S.; Bai, L.; Wu, C.; Zeng, X. Long-term manure application enhances the stability of aggregates and aggregate-associated carbon by regulating soil physicochemical characteristics. Catena 2021, 203, 105342. [Google Scholar] [CrossRef]
  46. Lai, Z.; Zhang, H.; Ding, X.; Liao, Z.; Zhang, C.; Yu, J.; Pei, S.; Dou, Z.; Li, Z.; Fan, J. Ridge-furrow film mulch with nitrogen fertilization improves grain yield of dryland maize by promoting root growth, plant nitrogen uptake and remobilization. Soil Tillage Res. 2024, 241, 106118. [Google Scholar] [CrossRef]
  47. Li, Y.; Chen, Z.M.; Chen, J.; Castellano, M.J.; Ye, C.L.; Zhang, N.; Miao, Y.C.; Zheng, H.J.; Li, J.J.; Ding, W.X. Oxygen availability regulates the quality of soil dissolved organic matter by mediating microbial metabolism and iron oxidation. Global Change Biol. 2022, 28, 7410–7427. [Google Scholar] [CrossRef] [PubMed]
  48. Culman, S.W.; Snapp, S.S.; Freeman, M.A.; Schipanski, M.E.; Beniston, J.; Lal, R.; Drinkwater, L.E.; Franzluebbers, A.J.; Glover, J.D.; Grandy, A.S.; et al. Permanganate oxidisable carbon reflects a processed soil fraction that is sensitive to management. Soil Sci. Soc. Am. J. 2012, 76, 494–504. [Google Scholar] [CrossRef]
  49. Cotrufo, M.F.; Lavallee, J.M. Soil organic matter formation, persistence, and functioning: A synthesis of current understanding to inform its conservation and regeneration. Adv. Agron. 2022, 172, 1–66. [Google Scholar]
  50. Witzgall, K.; Vidal, A.; Schubert, D.I.; Hoschen, C.; Schweizer, S.A.; Buegger, F.; Pouteau, V.; Chenu, C.; Mueller, C.W. Particulate organic matter as a functional soil component for persistent soil organic carbon. Nat. Commun. 2021, 12, 4115. [Google Scholar] [CrossRef]
  51. Cotrufo, M.F.; Soong, J.L.; Horton, A.J.; Campbell, E.E.; Haddix, M.L.; Wall, D.H.; Parton, W.J. Formation of soil organic matter via biochemical and physical pathways of litter mass loss. Nat. Geosci. 2015, 8, 776–779. [Google Scholar] [CrossRef]
  52. Hammel, K.E. Fungal degradation of lignin. In Driven by Natire: Plant Litter Quality and Decomposition; Cadish, E.D.S.G., Giller, K.E., Eds.; CAB International: Wallingford, UK, 1997; pp. 33–45. [Google Scholar]
  53. Tian, G.; Kang, B.T.; Brussaard, T. Biological effects of plant residues with contrasting chemical compositions under humid tropical conditions decomposition and nutrients release. Soil Biol. Biochem. 1992, 24, 1051–1060. [Google Scholar] [CrossRef]
  54. Shao, G.; Xu, Y.; Zhou, J.; Tian, P.; Ai, J.; Yang, Y.; Zamanian, K.; Zeng, Z.; Zang, H. Enhanced soil organic carbon stability in rhizosphere through manure application. Soil Tillage Res. 2024, 244, 106223. [Google Scholar] [CrossRef]
  55. Yang, J.; Ren, L.; Zhang, N.; Liu, E.; Sun, S.; Ren, X.; Jia, Z.; Wei, T.; Zhang, P. Can soil organic carbon sequestration and the carbon management index be improved by changing the film mulching methods in the semiarid region? J. Integr. Agric. 2024, 23, 1541–1556. [Google Scholar] [CrossRef]
  56. Chen, L.; Zhou, S.; Zhang, Q.; Zou, M.; Yin, Q.; Qiu, Y.; Qin, W. Effect of organic material addition on active soil organic carbon and microbial diversity: A meta-analysis. Soil Tillage Res. 2024, 241, 106128. [Google Scholar] [CrossRef]
Figure 1. The average monthly temperature and average monthly precipitation during maize growing season in 2019 and 2020 and the 12-year average at the experiment site.
Agronomy 15 01352 g001
Figure 2. Soil organic carbon content in different soil layers under soil surface mulching and manure amendment in 2019 and 2020. Different lowercase letters denote significant differences between treatments at p < 0.05. CK, GM, FM, and FCM represent no mulching, gravel mulching, film mulching, and film mulching with amendment, respectively.
Agronomy 15 01352 g002
Figure 3. Linear regression analysis between soil organic carbon content of the topsoil and nitrogen (N), phosphorus (P), and potassium (K) in the plant (A) and grain (B) (n = 24).
Agronomy 15 01352 g003
Figure 4. The contents of labile organic carbon fractions under long-term mulching and amendment in 2019 and 2020. Error bars are standard errors of means (n = 3). Different lowercase letters denote significant differences between treatments at p < 0.05. CK, GM, FM, and FCM represent no mulching, gravel mulching, film mulching, and film mulching with amendment, respectively. WSC: water solution carbon; HWC: hot-water extractable carbon; POXC: permanganate oxidisable carbon; POC: particulate organic carbon.
Agronomy 15 01352 g004
Figure 5. Random forest analysis of soil organic carbon fractions and carbon pool management index in the topsoil on nitrogen (N), phosphorus (P), and potassium (K) in the plant and grain. * indicates significant difference at p < 0.05, ** indicates significant difference at p < 0.01.
Agronomy 15 01352 g005
Figure 6. Linear regression analysis of permanganate oxidisable carbon and crop nitrogen (N), the carbon pool management index and crop phosphorus (P), the active carbon pool and crop potassium (K) (n = 24).
Agronomy 15 01352 g006
Table 1. Dry matter accumulation, nitrogen (N), phosphorus (P), and potassium (K) in the plant and grain under long-term mulching and amendment in 2019 and 2020.
YearTreatmentDry Matter AccumulationPlant NPlant PPlant KGrain NGrain PGrain K
--Mg ha−1kg ha−1kg ha−1kg ha−1kg ha−1kg ha−1kg ha−1
2019CK25.2 b209.2 bc28.3 b118.2 b156.1 b23.8 b31.6 b
GM21.9 c200.3 c31.7 ab117.8 b156.9 b29.3 ab28.7 b
FM26.1 b250.5 ab31.9 ab127.3 b196.3 a28.6 ab32.9 b
FCM29.6 a290.5 a44.6 a173.4 a224.0 a39.7 a40.3 a
2020CK22.7 b207.2 c34.8 b119.1 c145.2 c28.7 b28.1 c
GM20.0 b179.6 c32.0 b95.2 d126.6 c26.9 b23.9 bc
FM26.9 a261.0 b36.3 b147.1 b183.8 b31.6 b31.2 b
FCM28.8 a313.0 a50.5 a193.2 a218.2 a43.4 a37.5 a
Data are presented as the mean values (n = 3). Different lowercase letters denote significant differences between treatments at p < 0.05. CK, GM, FM, and FCM represent no mulching, gravel mulching, film mulching, and film mulching with amendment, respectively.
Table 2. The contents of carbon fractions based on gradient oxidation under long-term mulching and manure amendment.
2019 2020
Treat
Ment
CVLCLCLLCNLAPPPCVLCLCLLCNLAPPP
g kg−1g kg−1g kg−1g kg−1g kg−1g kg−1g kg−1g kg−1g kg−1g kg−1g kg−1g kg−1
0–20 cm
CK2.85 b1.36 b1.01 a2.94 a4.21 b3.95 a2.02 b1.99 a1.54 ab2.88 b4.01 b4.42 ab
GM2.88 b1.44 b0.92 a2.87 a4.32 b3.80 a1.77 bc2.22 a1.03 b3.13 ab4.00 b4.16 b
FM2.56 b1.35 b0.53 b3.37 a3.91 b3.90 a1.44 c2.05 a0.49 b3.47 a3.49 b3.96 b
FCM4.40 a2.17 a1.13 a3.24 a6.58 a4.37 a4.14 a2.17 a2.87 a3.43 a6.31 a6.30 a
20–40 cm
CK2.29 a1.35 a0.84 a1.67 a3.64 a2.51 a1.72 b1.26 b1.44 a2.59 a2.97 b4.03 a
GM1.86 a0.92 a0.89 a2.33 a2.78 a3.22 a1.06 b2.52 a0.58 b1.92 b3.58 b2.50 b
FM2.20 a0.70 a1.04 a2.38 a2.90 a3.41 a1.05 b2.15 ab0.61 b2.54 a3.20 b3.15 ab
FCM2.54 a1.18 a1.28 a1.89 a3.72 a3.17 a3.00 a1.76 ab1.51 a1.91 b4.76 a3.42 a
40–60 cm
CK1.78 a1.18 a1.16 a1.20 b2.96 a2.36 a0.80 b0.53 b1.89 a2.41 a1.34 c4.29 a
GM1.61 a1.30 a0.39 b2.20 a2.91 a2.59 a0.60 b2.17 a0.94 c1.72 ab2.77 ab2.66 b
FM1.49 a1.38 a0.39 b2.05 ab2.87 a2.44 a0.90 b1.32 ab1.20 bc1.81 ab2.22 b3.01 b
FCM1.80 a1.10 a0.88 ab1.52 ab2.90 a2.40 a1.92 a1.43 ab1.72 ab1.08 b3.35 a2.80 b
Data are presented as the mean values (n = 3). Different lowercase letters denote significant differences between treatments at p < 0.05. CK, GM, FM, and FCM represent no mulching, gravel mulching, film mulching, and film mulching with amendment, respectively. CVL: very labile carbon; CL: labile carbon; CLL: less labile carbon; CNL: non-labile carbon; AP: active carbon pool; PP: passive carbon pool.
Table 3. Sensitivity index of soil organic carbon and its fractions in the topsoil under long-term mulching and manure amendment in the topsoil in 2019 and 2020.
Treat
Ment
YearSOCLOCFsSOCFs
--WSCHWCPOXCPOCCVLCLCLLCNLAPPP
GM20190.59 1.50 1.39 4.45 22.8 1.35 8.13 6.22 0.53 2.79 3.40
20203.27 7.24 9.59 2.35 20.1 12.6 12.9 35.4 8.68 0.50 6.40
Mean1.93 4.37 5.49 3.40 21.5 6.98 10.5 20.8 4.61 1.64 4.90
CV97.9 93.0 105.6 43.6 8.90 114.11 31.8 99.2 125.1 98.32 43.34
FM20194.36 42.8 17.0 13.8 25.8 11.7 3.06 41.8 16.7 6.79 1.03
202011.6 10.4 16.2 18.9 28.9 15.5 5.76 39.5 11.9 13.09 9.61
Mean7.98 26.6 16.6 16.3 27.3 13.6 4.41 40.6 14.3 9.94 5.32
CV64.3 86.4 3.52 22.2 7.89 19.3 43.4 3.92 23.8 44.84 114.03
FCM201934.1 18.1 105.3 53.4 70.7 66.3 82.5 126.5 1.67 57.66 10.71
202037.4 4.11 30.6 54.7 75.1 134.1 7.28 841.1 1.14 56.99 41.64
Mean35.8 11.1 67.9 54.1 72.9 100.2 44.9 483.8 1.40 57.33 26.18
CV6.50 89.1 77.8 1.70 4.25 47.9 118.5 104.4 26.4 0.82 83.54
GM, FM, and FCM represent no mulching, gravel mulching, film mulching, and film mulching with amendment, respectively. SOC: soil organic carbon; WSC: water solution carbon; HWC: hot-water extractable carbon; POXC: permanganate oxidisable carbon; POC: particulate organic carbon; CVL: very labile carbon; CL: labile carbon; CLL: less labile carbon; CNL: non-labile carbon; AP: active carbon pool; PP: passive carbon pool.
Table 4. Correlation analysis of soil organic carbon fractions and carbon management index in the topsoil and nitrogen (N), phosphorus (P), and potassium (K) in the plant and grain (n = 24).
Plant NPlant PPlant KGrain NGrain PGrain K
SOC0.726 **0.790 **0.746 **0.682 **0.719 **0.618 **
WSC0.0510.0190.1390.2120.0360.363
HWC0.608 **0.439 *0.571 **0.635 **0.490 *0.622 **
POXC0.603 **0.820 **0.748 **0.576 **0.778 **0.627 **
POC0.699 **0.754 **0.743 **0.644 **0.690 **0.648 **
CVL0.603 **0.704 **0.662 **0.681 **0.672 **0.756 **
CL0.2510.510 *0.3290.1220.480 *0.106
CLL0.481 *0.570 **0.497 *0.3280.468 *0.191
CNL0.398−0.0370.2710.389−0.0050.218
AP0.638 **0.826 **0.721 **0.662 **0.786 **0.724 **
PP0.579 **0.482 *0.542 **0.442 *0.406 *0.253
CMI0.655 **0.812 **0.728 **0.651 **0.754 **0.702 **
SOC: soil organic carbon; WSC: water solution carbon; HWC: hot-water extractable carbon; POXC: permanganate oxidisable carbon; POC: particulate organic carbon; CVL: very labile carbon; CL: labile carbon; CLL: less labile carbon; CNL: non-labile carbon; AP: active carbon pool; PP: passive carbon pool. CMI: carbon management index. * indicates significant difference at p < 0.05, ** indicates significant difference at p < 0.01.
Disclaimer/Publisher’s Note: The statements, opinions and data contained in all publications are solely those of the individual author(s) and contributor(s) and not of MDPI and/or the editor(s). MDPI and/or the editor(s) disclaim responsibility for any injury to people or property resulting from any ideas, methods, instructions or products referred to in the content.

