1. Introduction
Capnodium spp. produces dark, threadlike mycelium on substrate rich in sugars, such as honeydews. These are produced by pests that are present in the region, such as aphids, whiteflies, mealybugs, and scales, which secrete honeydew after feeding, making sooty mould grow and expand. Excessive proliferation of sooty mould may have a significant economic impact on the industry. EU marketing standards indicate that for the fruit to be considered ‘Extra’ grade, and therefore a higher priced product on the market, homogeneity in colouring is required [
1]. For this reason, current practice is to meticulously wash the fruit before marketing it, thus increasing production costs.
Although sooty mould is toxic neither to plants nor to humans, it reduces the photosynthetic capacity of the plant [
2]. This reduction results in reduced plant vigour and increased photosynthetic stress and therefore lower yields and lower quality fruit.
Traditionally, studies of infestation levels of pest and diseases have been carried out in the laboratory using field samples and conventional microscopy. The Valencian Institute for Agricultural Research (IVIA) has been a pioneer in using electronic sensors for the detection of pests and diseases of citrus [
3,
4,
5]. These studies assessed how different pests and diseases affecting the fruit skin caused changes in how it reflected light, both in visible and near-infrared (NIR) parts of the spectrum. This research helped develop a method to detect sooty mould on fruit with 82% accuracy using multispectral cameras.
Summy and Little [
6] used colour and NIR imaging and spectrometry of leaves to detect sooty mould in several varieties of orange trees. Their studies showed that honeydew accumulation leads to significant increases in the NIR/red ratio and that honeydew-covered leaves absorb a considerable amount of light around 850 nm, probably due to melanin of the fungal cell walls.
Sims [
7] conducted spectral measurements using spectrophotometers and chlorophyll metres on whitefly (
Bemisia tabaci)-affected and fungus-infected leaves in cassava plantations. They used various spectral indexes in the red and NIR range to identify different physiological processes linked to the photosynthetic activity in the leaf and related them with infestations of different fungi.
The spectral index used to detect photosynthetical changes include: the modified chlorophyll absorption ratio index (MCARI) [
8], which is sensitive to the relative abundance of chlorophyll; the photochemical reflectance index (PRI) [
9] related to light use efficiency; and the carotenoid reflectance index (CRI550) [
10], linked to the concentration of carotenoids relative to chlorophyll, which can be interpreted as a measure of plant stress. Other broadband vegetation indexes, such as the normalised difference vegetation index (NDVI) [
11] and the enhanced two-band vegetation index (EVI2) [
12], are also reported in the literature to detect photosynthetical changes and for potential use in remote sensing.
The development of remote sensing for crop monitoring, based on satellites and drones, offers numerous advantages. On the one hand, it offers the possibility of covering large surfaces with minimal sampling time, but also at relatively short revisit frequency. For instance, the Sentinel mission of the European Union’s Copernicus Programme can provide satellite images every 5 days [
13].
However, the relatively low spatial resolution of satellite sensors presents several challenges, especially in many European regions such as the Comunitat Valenciana, where agricultural areas are highly fragmented. In these areas, agriculture is predominantly managed by smallholders, whose land is often divided into several non-contiguous orchards, typically smaller than 1 ha. As a result, boundary pixels make up a large proportion of each field and may include various sources of noise, such as fences, roads, and the reflectance of adjacent crops. Moreover, while arable crop fields tend to be larger and more homogeneous, orchards are smaller, and their trees are usually surrounded by bare soil or by natural or sown vegetation covers. Consequently, the signal captured by satellites from within orchards is often a mixture of reflectances from different plant species and exposed soil.
To address the shortcomings of standalone satellite, UAV, and ground-based datasets, researchers are increasingly adopting data-fusion techniques. By integrating imagery from diverse platforms and ground observations, data fusion leverages the spatial detail, temporal frequency, and spectral richness of each input source [
14]. In this sense, Moltó [
15] proposed a method for merging images with different temporal and spatial resolutions and with different degrees of spectral quality by combining images from Sentinel 2, orthophotos, and drones.
Similarly, the combined use of imagery from multiple sources with varying spatial resolutions has been explored in previous studies to enhance sooty mould detection. For example, Fletcher [
16] integrated hyperspectral, Red, Green, and Blue (RGB), and NIR aerial images at spatial resolutions of 2.44 m and 0.61 m, respectively, to detect citrus sooty mould, achieving a high level of spatial detail (<1 m) and enabling the identification of affected areas in orchards of approximately 2 ha. In contrast, Olsson [
17] adopted a multitemporal approach based on vegetation index time series derived from medium and coarse resolution imagery. Specifically, they utilised NDVI and the Green Normalised Difference Vegetation Index (GNDVI) obtained from 10 m SPOT data and 250 m MODIS imagery to monitor sooty mould infestation associated with
Physokermes inopinatus in spruce (
Picea abies) forests across Sweden. Their method demonstrated the capability to detect defoliation and discoloration patterns, successfully identifying 78% of the affected area within a 3000 km
2 region. However, the system tended to overestimate damage extent by approximately 46%, highlighting the trade-off between spatial coverage and detection precision.
The aim of this study is to classify the severity of citrus sooty mould infestation using spectral indices related to photosynthetic stress, by applying image fusion techniques that combine medium spatial resolution satellite imagery with high spatial resolution orthophotos.
2. Materials and Methods
2.1. Study Area and Field Monitoring
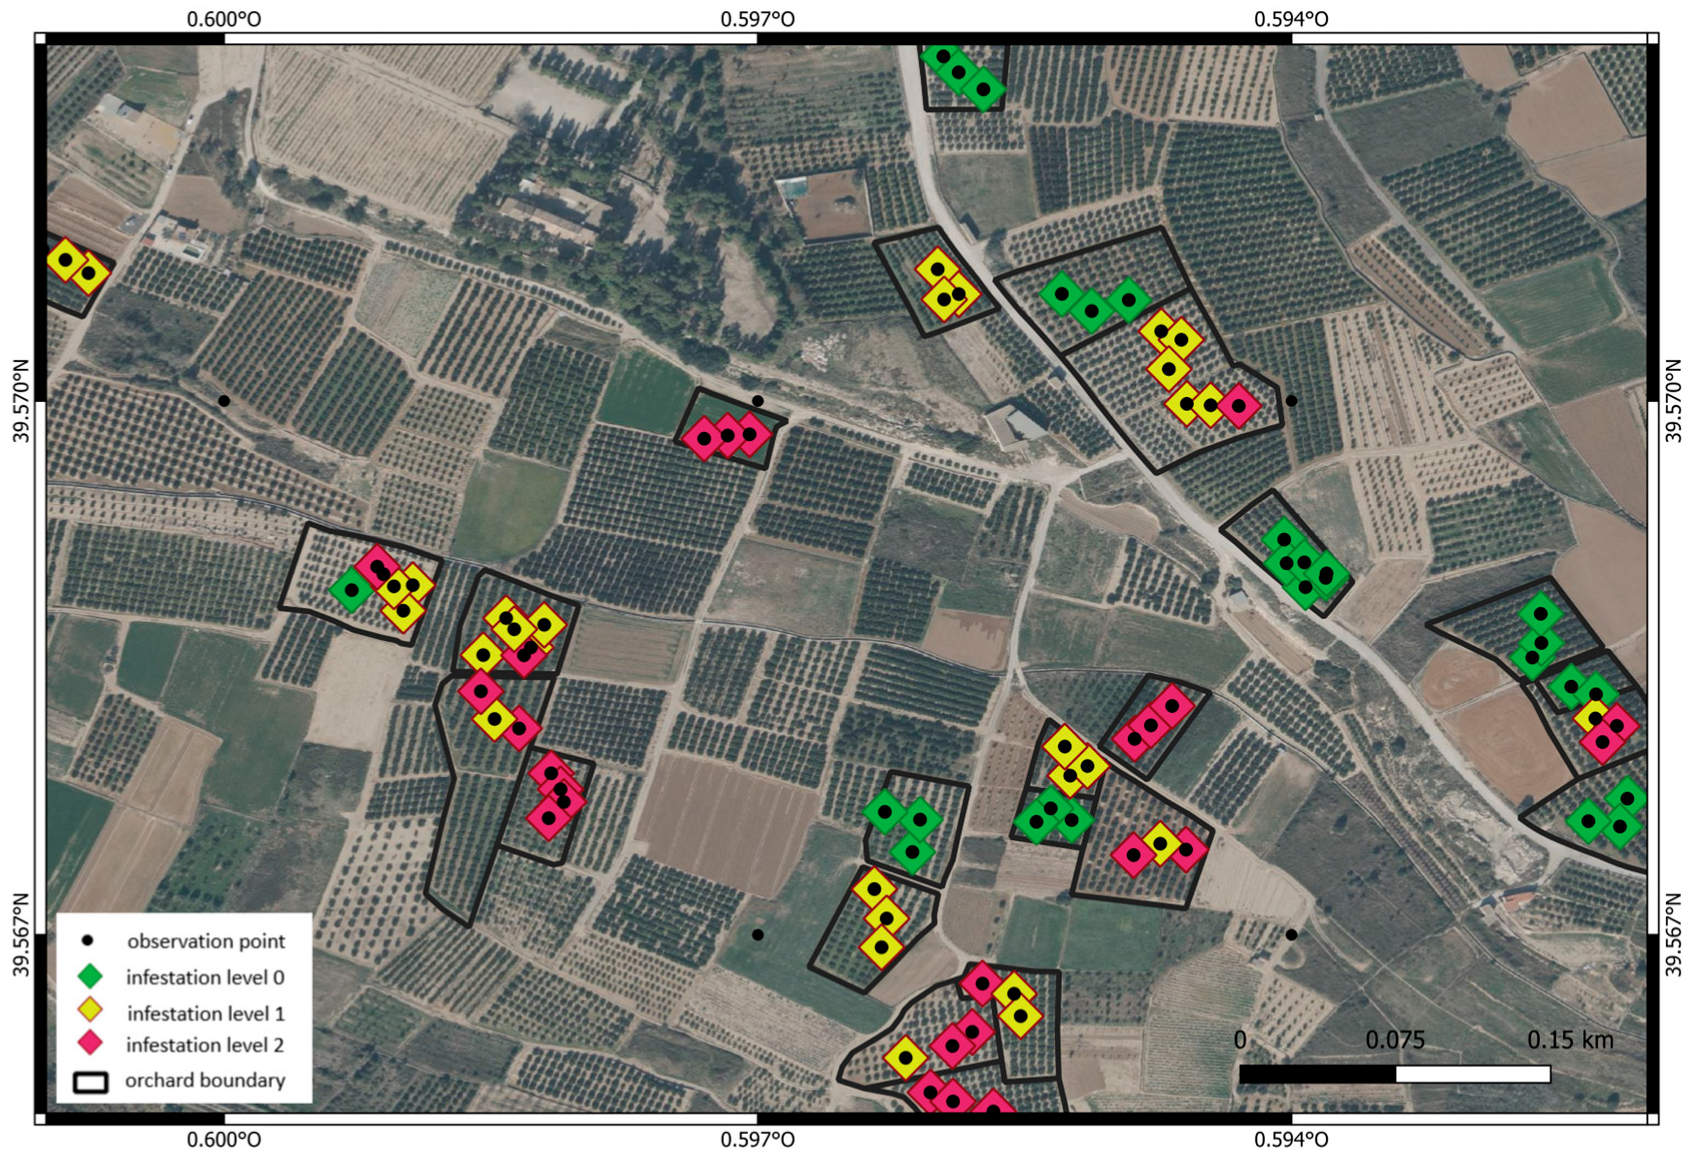
The study area covers 180 ha and is located in Valencia, Spain (−0.60872° W to −0.58186° E, 39.57955° N to 39.56421° S); it is characterised by a high prevalence of citrus, fruit, and vegetable farms. Monitoring of citrus sooty mould was conducted by expert entomologists from IVIA (Valencian Institute of Agricultural Research) through field visits on 2 August and on 19 October 2022. These dates were selected to capture the initial appearance of sooty mould (August) and its peak development before harvest (October).
The experts provided georeferenced data, consisting of one to three representative observation points at various locations within each orchard. Each observation was assumed to represent an area range of about 200 m2. Three levels of infestation were defined arbitrarily: 0—no visible presence, 1—incipient infestation, and 2—abundant presence.
In total, 33 orchards were surveyed, resulting in 37 observation points in August and 69 in October. While some orchards were sampled at both dates, observations were not taken from the exact same locations. This yielded a georeferenced dataset of 106 sampling points, each annotated with its corresponding infestation level.
Figure 1 shows in detail a region of the study area.
2.2. Overall Image Processing
Sentinel-2 Multispectral Instrument (MSI) Level-2A satellite images (S2-MSI-L2A) were used in this study. MSI provides multispectral imagery at spatial resolutions of 10 m for visible and NIR bands, 20 m for red-edge and shortwave infrared (SWIR) bands, and 60 m for atmospheric correction bands. The mission offers a revisit frequency of approximately five days by combining data from the Sentinel-2A and Sentinel-2B satellites. Particularly relevant for vegetation monitoring are the three narrow red-edge bands (centred at 705, 740, and 783 nm), located between the red and NIR regions of the spectrum and provided at 20 m resolution. These features make Sentinel-2 especially suitable for detecting subtle changes in vegetation condition and photosynthetic activity [
18].
The image processing workflow was structured into three steps:
Exploratory analysis: to assess the temporal evolution of spectral reflectance across all bands and various vegetation indices, to identify those more correlated with the presence of sooty mould.
Band selection and generation of condensed synthetic images: based on the previous step, specific bands and indices were selected to generate two synthetic multiband images representing the months when surveys were conducted (August and October).
Pixel selection: Pixels at 10 m resolution often include not only citrus canopies but also weeds, vegetation covers, or bare soil. A filtering process based on orthophotos with a spatial resolution of 0.25 m was applied to remove mostly mixed pixels.
2.3. Exploratory Analysis
The period analysed was from 1 March 2022 to 22 October 2022, corresponding to the beginning of spring and the last sampling date. Time series of S2-MSI-L2A images were filtered to remove cloud pixels and cloud shadows using the Scene Classification Layer (SCL band), a quality assurance band provided with S2-MSI-L2A products that classifies each pixel into different surface types (e.g., clouds, shadows, vegetation, etc.). Additionally, pixels with NIR and red-edge reflectance values lower than 2000, potentially indicating poor-quality data, such as shadows, haze, or very dark surfaces, were also excluded.
Furthermore, since orchard edge pixels often contain noisy information, they were filtered using field boundaries obtained from the Land Parcel Identification System (SIGPAC, Sistema de Información Geográfica de Parcelas Agrícolas), a geographic information system used in Spain to identify agricultural plots eligible for EU agricultural subsidies.
Several vegetation spectral indexes were generated in a subsequent step (
Table 1).
The exploratory analysis involved studying the temporal evolution of the average response of S2-MSI-L2A bands and various vegetation indices in relation to sooty mould infestation at the sampling points. Signals exhibiting a logically ordered evolution, either increasing or decreasing with respect to the infestation level, were selected.
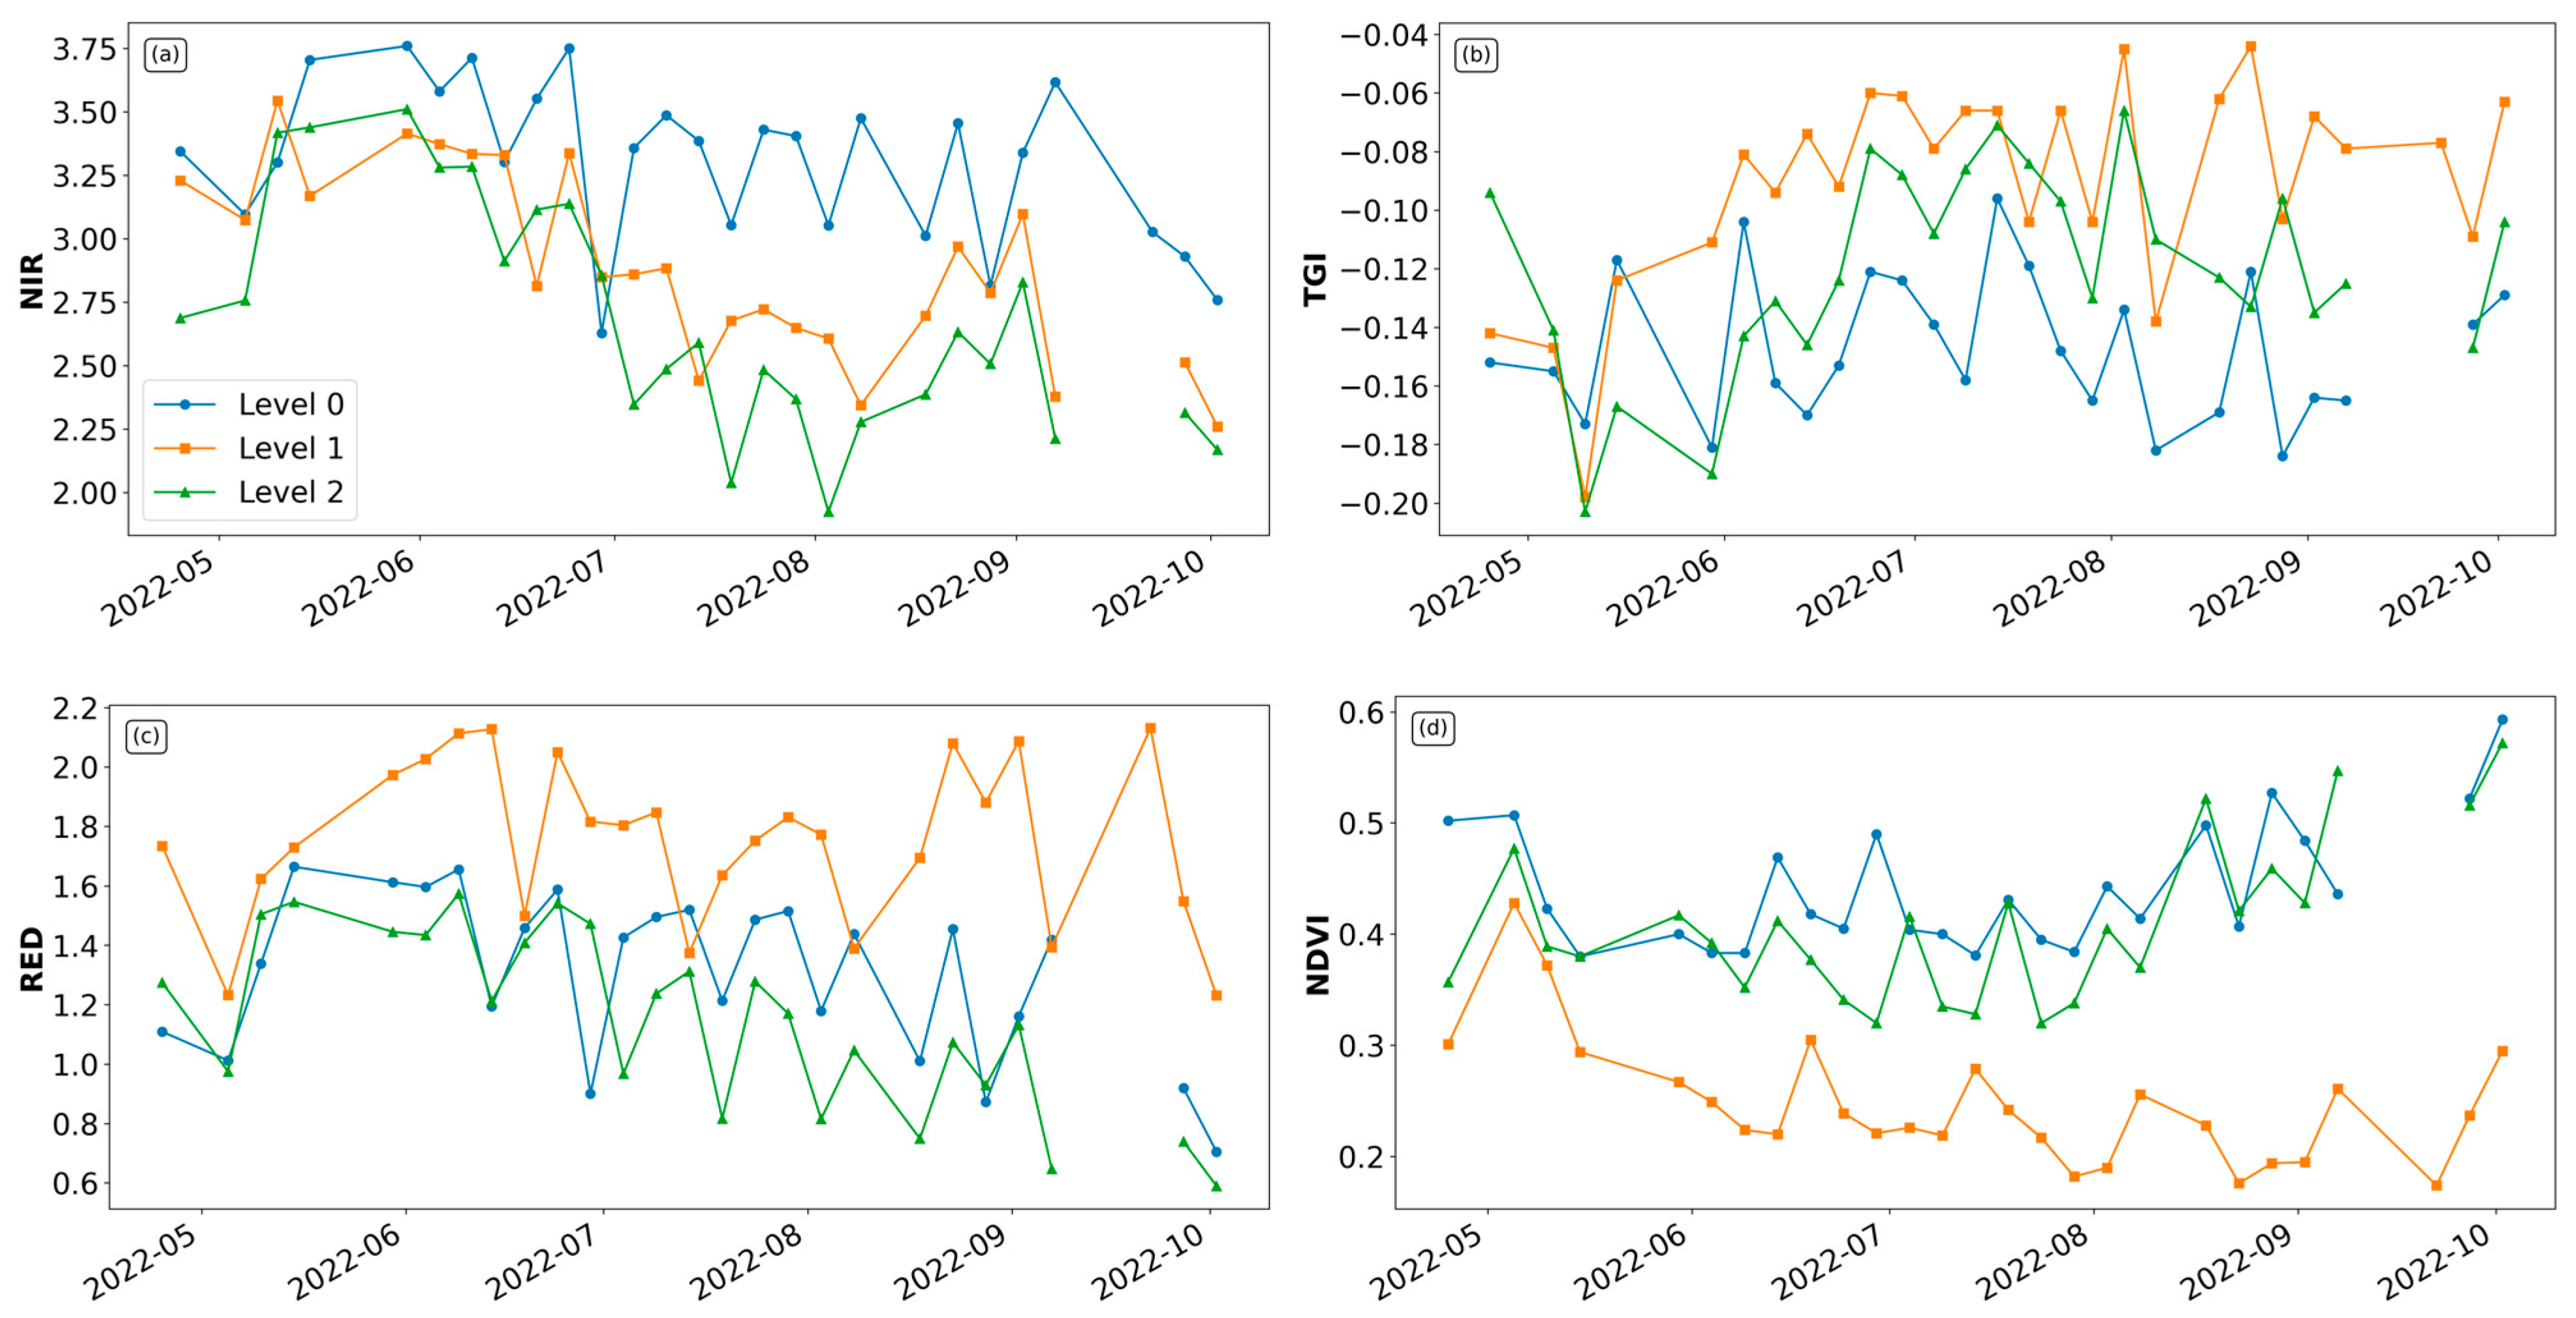
Figure 2a–d show examples of the temporal evolution of the average signals from the NIR band, TGI, red band, and NDVI, respectively. A presumably appropriate ordered pattern is observed in the NIR reflectance (
Figure 2a), where the signal is lower for higher infestation levels from July onwards. The TGI index evolution (
Figure 2b) shows that levels 1 and 2 (orange and green lines) clearly distance themselves from level 0, particularly since mid-June. However,
Figure 2c,d, corresponding to red and NDVI band reflectances, does not show any of these patterns.
After this process, B6, B7, B8A (all narrow red-edge bands), B8 (NIR), B11 (SWIR), and the spectral index TGI (red, green, blue) were selected.
2.4. Condensed, Synthetic Images Representing August and October
In order to condense the monthly information around the two sampling dates, two synthetic images were generated from 7-band (B6, B7, B8, B8A, B11 and TGI) images acquired 14 days before and after each sampling date. All the bands were resampled by bilinear interpolation at 10 m after the cloud and cloud shadow pixel removal. The value of each pixel in the synthetic image was the median of the resulting series.
2.5. Pixel Filtering Using Orthophotos
Institut Cartogràfic Valencià (ICV) [
28] delivers a comprehensive set of high-resolution (0.25 m) multispectral RGBI orthophotos on an annual basis. These orthophotos are produced using aerial imagery captured during dedicated flights over the Valencian Community during May. The images are then processed, corrected, and georeferenced to generate updated, reliable representations of the territory.
These images were used to identify S2-MSI-L2A pixels containing at least an arbitrary percentage of citrus canopies. A 0.25 m spatial resolution NDVI image of the study area was generated from the orthophotos. NDVI values above 0.1 are typically indicative of vegetation presence. This threshold is often used to distinguish vegetated areas from bare soil or non-vegetated surfaces [
29]. However, analysis of various agricultural crops demonstrated that the relationship between NDVI and canopy cover can differ based on crop species [
30]. A threshold of 0.25 was set empirically to differentiate between plants and soil after testing in different areas of the orthophotos that positively included citrus trees.
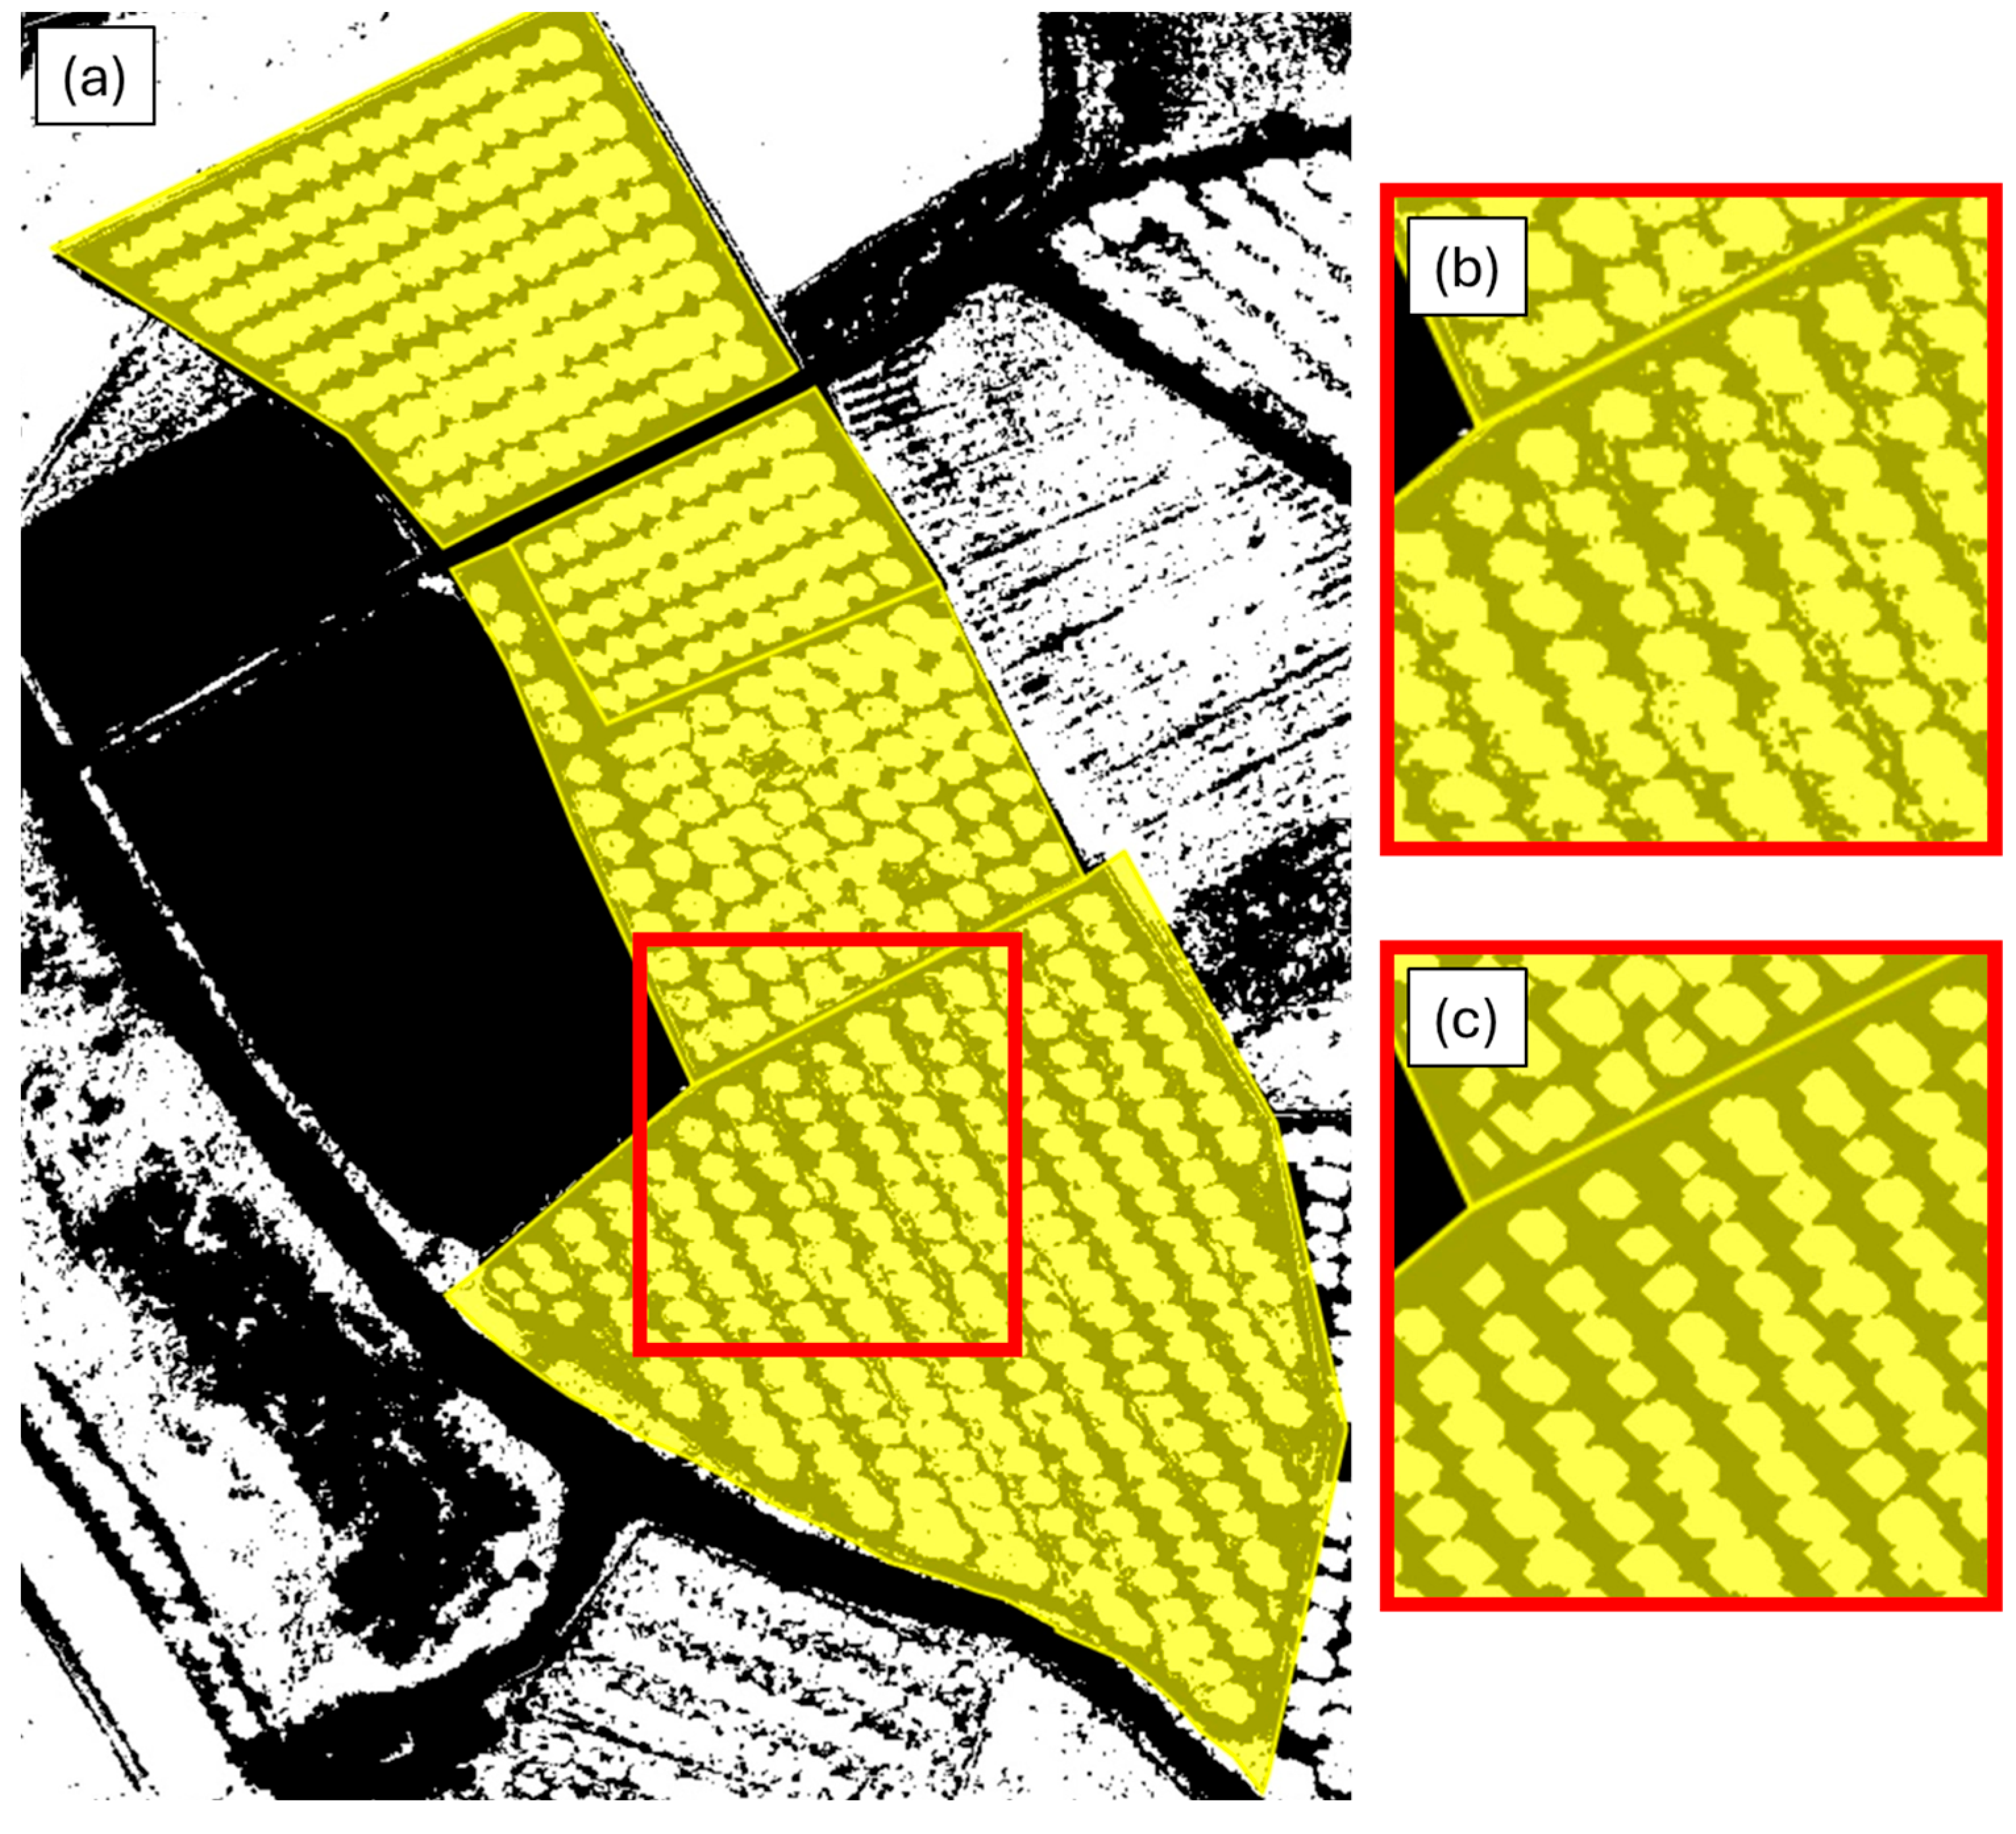
Figure 3 represents the resulting binary image, with yellow pixels indicating NDVI > 0.25 and black pixels indicating NDVI < 0.25. Subsequently, a morphological opening (erosion followed by dilation) was applied to mark isolated citrus canopies.
Figure 3a shows the thresholded NDVI image, while
Figure 3b,c depict the before and after images when applying the morphological filter to an arbitrarily selected area marked with a red box. In
Figure 3b, the presence of vegetation covers between the rows and at the field edges can be observed.
Figure 3c shows that only citrus canopies remain after the morphological opening.
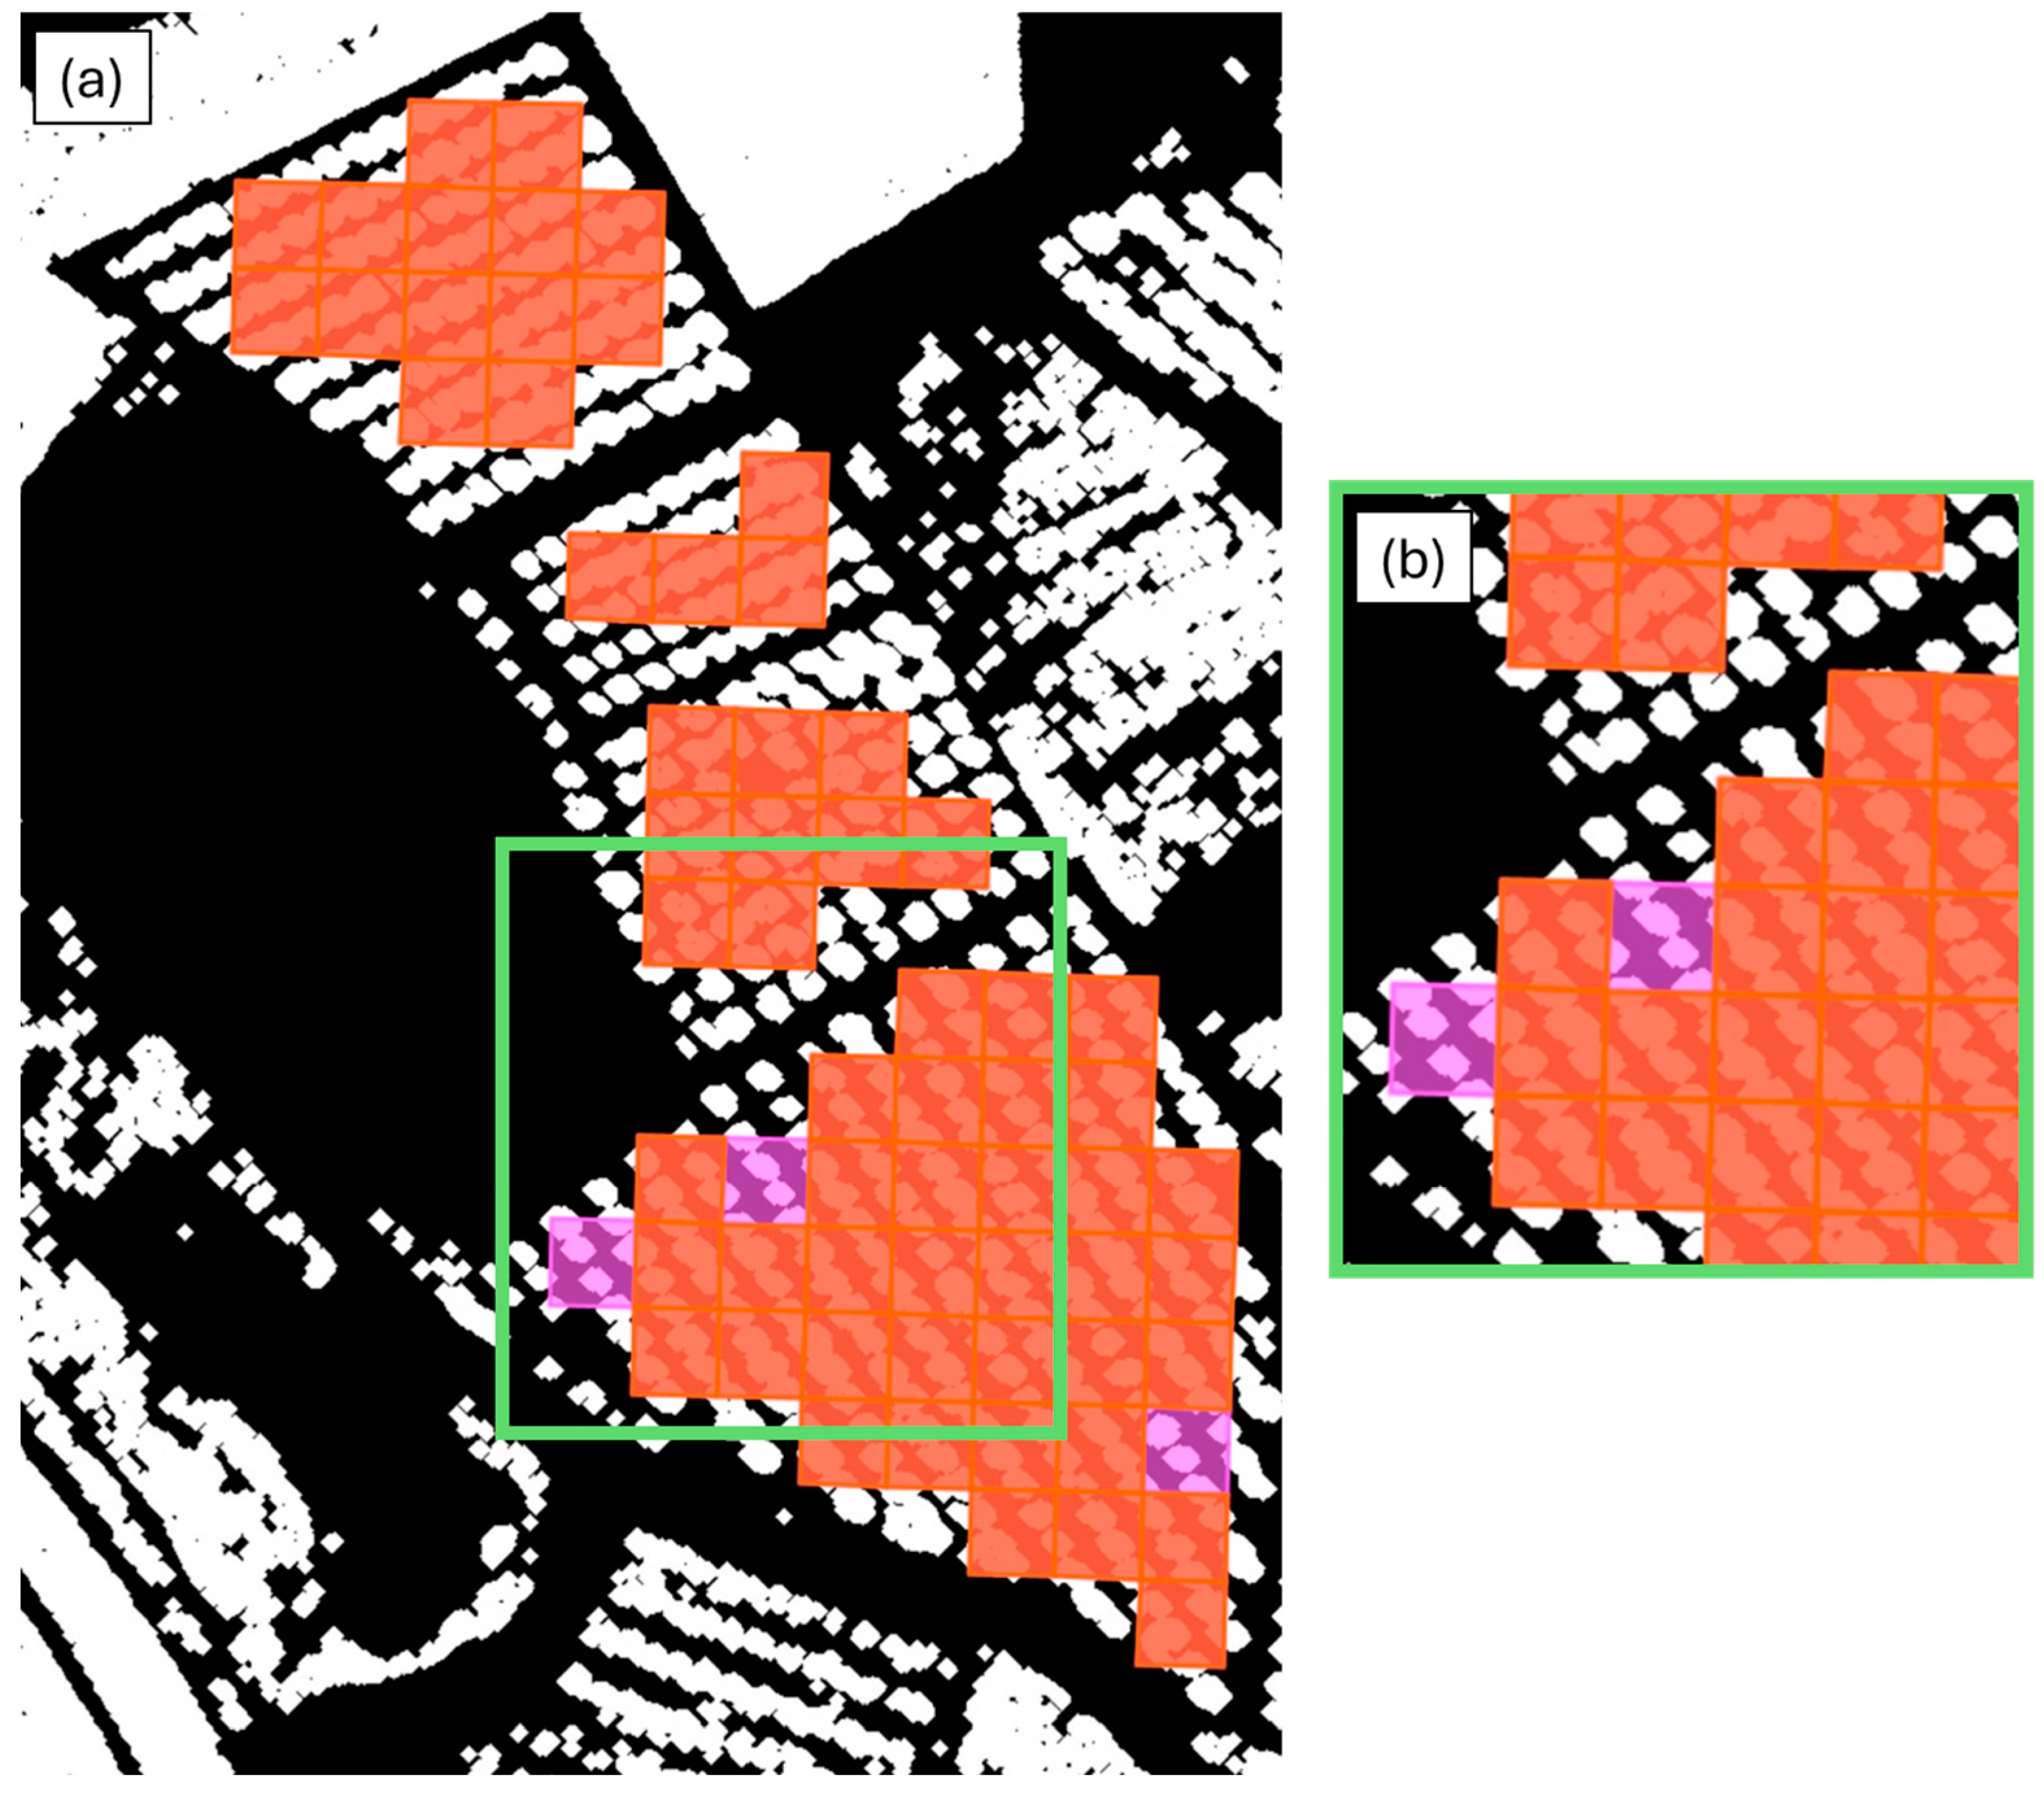
A 10 × 10 m grid was superimposed on the image obtained in the previous step, with each grid cell corresponding to a S2-MSI-L2A pixel. Only those S2-MSI-L2A pixels containing more than 45% canopy cover were considered reliable. This threshold was arbitrarily selected after trial-and-error visual inspection of the results in different parts of the image containing citrus orchards not used in the study.
Figure 4a displays the S2-MSI-L2A pixel grid overlaid on the binary image. The green box highlights the area shown in greater detail in
Figure 4b. In this enlarged view, pixels with canopy cover greater than 45% are shown in orange and were selected for the next step, while pixels with less than 45% canopy cover appear in purple and were excluded from further analysis.
2.6. Classification and Accuracy Estimation
Throughout this study, it was assumed that each expert observation corresponds approximately to a circular area with an 8 m radius (around 200 m2). Therefore, all pixels deemed reliable according to the criteria defined in the previous section and located within a circle of 8 m radius centred on each sampling point were assigned the corresponding observed infestation class. Based on this approach, a dataset of 146 pixels was constructed using the two synthetic multiband images (August and October).
Given the limited dataset size, an iterative cross-validation strategy was employed to evaluate the classification system’s accuracy. Specifically, 30 iterations were performed, where in each run, a random training set comprising 80% of the data was used to train the model, and the remaining 20% was reserved for validation.
Figure 5 illustrates how pixels were assigned to training and validation sets in an iteration. The circular shapes in yellow and green represent field-sampled locations, with green indicating infestation level 0 and yellow indicating level 1. In each iteration, pixels selected for the training set are shown in white, while those used for validation are shown in blue.
Classifiers were constructed using the Random Forest (RF) algorithm. RF is an ensemble method that averages predictions across many decision trees, each trained on a bootstrapped subset of the data. This approach reduces variance and helps prevent overfitting, which is particularly important when working with limited data. RF also down-weights less relevant features, improving generalisation even with a small sample size. In addition, individual noisy data points are less likely to affect the overall model, as their influence is diluted across multiple trees. Since comparative analysis was beyond the scope of this research, no other classification method was employed.
For each cross-validation iteration, the confusion matrix was used to compute the overall classification accuracy and the kappa index [
31]. Additionally, the average producer’s accuracy (i.e., the probability that a reference sample is correctly classified) and user’s accuracy (i.e., the probability that a pixel labelled as a certain class corresponds to that class on the ground) were calculated.
To further characterise the distribution of classification accuracy across iterations, the Bowley–Yule skewness coefficient [
32] was computed. This coefficient is a robust, non-parametric measure of skewness based on the quartiles of the distribution, defined as Equation (1):
where
SkewnessBY is Bowley–Yule skewness coefficient, and
Q1,
Q2, and
Q3 are the first, second (median), and third quartiles, respectively. A positive coefficient indicates a distribution skewed to the right (with a longer tail of higher values), while a negative coefficient indicates left skewness. Values close to zero mean that the distribution is nearly symmetrical.
To assess the effect of integrating high-resolution orthophoto data with satellite imagery, the entire classification process was repeated under two conditions: with and without the exclusion of S2-MSI-L2A pixels having less than 45% vegetation cover.
3. Results
As demonstrated below, the fusion of medium- and high-resolution imagery substantially enhances our ability to detect varying levels of infestation. In fact, across thirty-fold cross-validation, we observed marked improvements in overall accuracy, Cohen’s kappa values, and shifts in Bowley–Yule skewness coefficients that underscore the robustness and sensitivity gains afforded by multi-resolution data fusion.
Table 2 summarises the statistics of the overall accuracy and kappa values obtained with and without filtering the S2-MSI pixels with the orthophoto images. Classification using the Random Forest algorithm without image fusion yielded an average overall accuracy of 0.75 and a median value of 0.76. Based on the first (0.71) and third (0.78) quartiles, the Bowley–Yule skewness coefficient was −0.42, indicating a clear negative skewness, which suggests a higher frequency of below-average accuracy values. The average kappa index was 0.60, with a median of 0.61, and first and third quartiles of 0.53 and 0.65, respectively. This resulted in a Bowley–Yule skewness coefficient of −0.45, reflecting a clear negative skewness in the distribution of kappa values.
A general improvement in performance is observed: the average overall accuracy increases by 5 percentage points from 0.75 (without image fusion) to 0.80 (with image fusion), while the median rises substantially from 0.76 to 0.78. The Bowley–Yule skewness coefficient for overall accuracy is +0.50, indicating a clear positive skew, which suggests a higher frequency of above-average accuracy values.
Regarding the kappa index, which accounts for the agreement expected merely by chance, both the mean (0.67) and median (0.66) improve compared to the results without using the image fusion procedure (0.60 and 0.61, respectively). The skewness of the kappa distribution, with a Bowley–Yule coefficient of +0.28, also indicates a mild positive skew, albeit less pronounced than that observed for overall accuracy. The table also shows that the standard deviation of overall accuracy is below 0.10, reflecting a modest spread in the results, while that of the kappa index is slightly higher (0.13).
Table 3 presents the average producer and user accuracies obtained over the 30 iterations using and not using the proposed image fusion methodology. The results indicate improved classification performance using the image fusion procedure, particularly in the producer accuracy for infestation levels 1 and 0, which reach averages of 89% and 79%, respectively. However, the producer’s accuracy for level 2 is in both cases lower (65% with image fusion and 0.43% without), suggesting greater classification difficulty for this class. User’s accuracies are consistently higher across levels 0 and 2, with values ranging from 65% to 84% without image fusion and from 78% to 88% with image fusion. This indicates a stronger agreement in the latter case between predicted and observed classes from the user’s perspective.
Table 4 shows the aggregate confusion matrix over the results of the classifiers on all test sets without image fusion over the 30 iterations. Equivalent producer accuracies are reflected in brackets. An important confusion occurs between adjacent classes. Over the 30 iterations, 2.5% of the data classified as level 0 were actually level 2 and 14.3% of the data classified as level 2 were actually level 0, which compromises the practical use of the classifier.
Table 5 shows the aggregate confusion matrix over the results of the classifiers on all test sets using the proposed fusion procedure data over the 30 iterations. Again, equivalent producer accuracies are reflected in brackets. It is important to note that most of the confusion occurs between adjacent classes. Over the 30 iterations, only 1.9% of the data classified as level 0 were actually level 2 and 6.5% of the data classified as level 2 were actually level 0, thus considerably improving the performance.
4. Discussion
This study demonstrates the effectiveness of fusing freely available S2-MSI-L2A imagery with high-resolution orthophotos for detecting sooty mould in citrus orchards in a typical Mediterranean fragmented landscape. Three different infestation levels were defined and identified by experts through field visits in August and October 2022. The bands and indices most adapted to the presence of sooty mould were selected. Then, two synthetic images, one for each date, were generated with the purpose of condensing the spectral information around the sampling dates. A filtering preprocess was carried out by fusing these synthetic images with high-resolution images, allowing only selected pixels to be used to train and validate the classification algorithm. This has resulted in a clearly improved performance with respect to a non-fused approach.
Unlike Fletcher [
16], who worked with commercial aerial imagery and suggested that fused images perform better in areas larger than 0.2 ha, this study succeeded in applying the fusion approach in a substantial number of smaller plots (average < 0.3 ha) by adopting a pixel evaluation strategy based on 10 × 10 m grids overlapping the high-resolution images. This adaptation broadens the applicability of image fusion techniques to fragmented agricultural landscapes.
The segmentation process based on NDVI thresholding and morphological filtering was key to isolating citrus canopy pixels. This allowed only S2-MSI-L2A pixels with more than 45% canopy cover to be retained for classification, significantly improving the reliability of the dataset. The classification results using Random Forest yielded consistent overall accuracies above 0.70, with an average of 0.80 after fusion, and kappa values also improved compared to the non-fusion case. The Bowley–Yule skewness coefficients calculated for both accuracy and kappa metrics reflect a slight to moderate positive skewness after fusion (+0.50 and +0.28, respectively), suggesting that the fusion process not only improves average performance but also results in more consistently high values across iterations. In contrast, the skewness values close to zero or slightly negative in the non-fused case suggest a more symmetric or even slightly left-skewed distribution, indicative of lower performance.
Compared with other studies, such as that of Olsson [
17], who reported 78% accuracy using NDVI/GNDVI but with a 46% overestimation due to confusion with non-target species, this approach achieves comparable or better accuracy while reducing misclassification risk by incorporating morphological filtering and pixel selection based on canopy coverage. Moreover, instead of relying exclusively on spectral indices, this study employed multiband time series associated with photosynthetic stress. This strategy agrees with prior laboratory-based research by Blasco [
3,
4] and Moltó [
5], which identified the NIR band as highly effective for detecting sooty mould symptoms in fruits.
It is important to remark that there is a lack of recent scientific literature related to sooty mould detection using satellite imagery, although the latest studies have taken proximal approaches, using images from surveillance home security cameras [
33] or mobile phones [
34]. Nevertheless, the importance of detecting and monitoring citrus pests and diseases is undeniable and is still under research. For instance, Della Bellver et al. [
35] analysed the spectral differences between healthy plots and those affected by
Delottococcus aberiae, a mealybug. Similarly, Vieira et al. [
36] investigated, under laboratory conditions, how the bacterium
Candidatus Liberibacter alters the reflectance profile of asymptomatic citrus leaves.
Despite the above-mentioned achievements, the study presents some limitations, primarily related to the relatively small sample size (146 observations). While the Random Forest algorithm is well-suited for small datasets, it remains challenging to fully eliminate spatial autocorrelation between training and validation sets. Although this issue was partially addressed through the cross-validation strategy, it may still result in overly optimistic accuracy estimates and limit the model’s generalizability. To enhance robustness and reliability, future research should include a larger number of samples distributed across more diverse spatial and temporal conditions. For instance, a larger number of sampling points distributed over a wider area could allow for a targeted train/test split where train and test pixels came from different sampling points, thus decreasing spatial autocorrelation.
Spectral unmixing techniques could also be explored in future research. By estimating the fractional contribution of different land cover components within each S2-MSI-L2A pixel, spectral unmixing could isolate the spectral signature of the citrus canopy more precisely. This approach might prove especially useful where background interference significantly affects pixel-level spectral responses.
It must be noticed that satellite imagery can highlight shifts in vegetation health but often lacks the spatial detail and contextual clues needed to pinpoint pest outbreaks. By integrating ground-based observations, weather records, historical infestation maps, and crop-type data, future work could gain a richer, multidimensional perspective that may distinguish pest-induced stress from abiotic factors.


