Abstract
Pig slurry fertigation can modify soil biochemical properties by promoting glomalin production and shifting microbial communities; however, its impacts under varying water regimes remain insufficiently quantified. We assessed irrigated and rainfed systems by integrating the soil quality index (SQI) with total and easily extractable glomalin (T-GRSP, EE-GRSP), determining microbial diversity via eDNA amplicon sequencing, and evaluating enzyme activities across three soil depths (0–10, 10–20, and 20–30 cm). Robust regression revealed that T-GRSP and EE-GRSP accounted for 75% of the SQI variability in irrigated soils and 46% in rainfed soils (p < 0.001), with the strongest correlations in the 0–10 cm layer. Irrigation increased T-GRSP concentrations by 66% (1.78 vs. 1.07 mg g−1) and raised its contribution to total soil carbon from 2.0% to 3.2%. The EE-GRSP levels were slightly lower in the irrigated soils (0.73 vs. 0.76 mg g−1) yet remained a sensitive early-warning indicator of moisture stress in rainfed plots. Microbial profiling showed a 19% increase in Shannon bacterial diversity (3.44 vs. 2.89), even more bacterial communities under irrigation, intermediate fungal diversity, higher fungal abundance, and no detectable arbuscular mycorrhizal fungi in either system. Combining GRSP fractions with microbial and enzymatic markers provides a responsive framework for assessing soil health and guiding organic amendment strategies in fertigation-based agriculture under fluctuating water availability.
1. Introduction
Soil quality is a complex, multifaceted concept that reflects the soil’s ability to function efficiently within an ecosystem while supporting plant growth. Since its formal introduction in 1994, attention has increasingly turned to the assessment of chemical, physical, and biological parameters that define both the intrinsic characteristics of soil and its capacity to sustain crops [1]. Recent reviews have highlighted the growing relevance of advanced soil quality assessments to guide sustainable land-use and management strategies [2].
Among the most informative biological indicators are those reflecting microbial community structure and the activity of extracellular enzymes. Enzymes like β-glucosidase, arylsulfatase, and acid phosphatase serve as valuable proxies for microbial activity and nutrient cycling, offering critical insights into organic matter turnover and carbon fluxes in soil ecosystems [3,4]. Simultaneously, innovations in environmental DNA (e-DNA) sequencing have opened the door to in-depth profiling of microbial communities, deepening our understanding of soil functionality [5,6].
A key biological marker in evaluating soil quality is the glomalin-related soil protein (GRSP), synthesized by arbuscular mycorrhizal fungi (AMF). These fungi establish mutualistic associations with plants and play a central role in soil carbon dynamics by producing glomalin—a glycoprotein that promotes soil aggregation and carbon stabilization [7,8,9]. GRSPs are typically quantified in the following two fractions: the more labile extractable GRSP (EE-GRSP) and the more stable total GRSP (T-GRSP), with the latter being more resistant to degradation [7]. Research suggests that GRSPs contribute approximately 4% of total soil carbon and plays a fundamental role in maintaining soil structure and ecological function [9,10], although some studies have also discussed its limitations and emerging theoretical models [11].
Land-use practices, including agricultural interventions, can have substantial impacts on both microbial diversity and GRSP synthesis, often leading to a decline in overall soil health [12]. While conventional soil quality tests remain informative, they are often costly and labor-intensive. A more efficient alternative lies in combining GRSP analysis with modern genomic tools like e-DNA sequencing. This dual approach allows for the concurrent evaluation of soil biochemical traits and microbial population shifts [3,5,6], offering a more holistic and cost-effective means of monitoring soil health.
In this study, we examine GRSP concentrations across two distinct management regimes—irrigated fields utilizing pig slurry fertigation and a rainfed system—by assessing associated physical, chemical, and biological parameters across a soil depth gradient. Our goal is to clarify the interrelations among GRSP fractions, soil structure, nutrient dynamics, and microbial profiles, with the broader aim of positioning glomalin as a reliable indicator for sustainable soil management.
2. Materials and Methods
2.1. Study Area
The study was conducted at Fazenda Capuaba, located at −13°15′8.47′′ S, 56°04′52.58′′ W, at an altitude of 425 m in Lucas do Rio Verde, Mato Grosso, Brazil (see Figure 1). The farm is situated within the Cerrado biome, one of the largest and most diverse savannas in the world; the soil is classified as a Dystrophic Red-Yellow Latosol [13], characterized by low natural fertility and high acidity, typical of tropical climates. These characteristics reflect the native condition of the soil under natural vegetation, prior to any agricultural use.
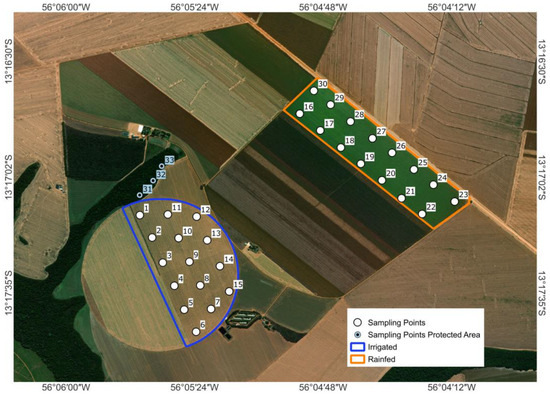
Figure 1.
Geographic location of the experimental areas (Permanent Preservation Area, Rainfed Irrigated).
The study compared two adjacent agricultural systems managed identically, except for the water regime. The irrigated field (136 ha) was served by a single-span center pivot (480 m radius, low-pressure nozzles), applying 7.5 mm h−1 every 4–6 days from June to mid-October, totaling approximately 220 mm of irrigation during the dry season. This application maintained the soil moisture near 90% of field capacity. The adjacent rainfed field relied solely on precipitation, which totaled ~160 mm over the same period.
Historical data from this site, collected by Lathuillière et al. [14], describe soil moisture dynamics in the rainfed system using GS3 and MPS-2 sensors (Decagon Devices, now part of METER Group, Pullman, WA, USA) placed at depths of 5, 10, 30, and 60 cm. These instruments continuously recorded volumetric water content and soil matric potential throughout the crop cycle.
Daily rainfall and reference evapotranspiration (ET0) were recorded by an on-site automatic weather station. For broader climatic context, the Diamantino meteorological station (14°40′ S, 56°27′ W) (14°40′ S, 56°27′ W) reports a long-term annual rainfall average of 2144 mm annual rainfall of 2144 mm (1999–2024), with 1982 mm during the wet season (October–April) and 162 mm during the dry season (May–September).
The center-pivot system applied 6000 m3 of anaerobically digested swine slurry per event, with two applications conducted exclusively during the dry season (June and September), totaling 12,000 m3 annually. Based on the average nutrient concentrations—2.5 kg N, 0.6 kg P2O5, and 1.7 kg K2O per cubic meter—each application delivered 110 kg N ha−1, 26 kg P2O5 ha−1, and 75 kg K2O ha−1. The timing corresponded to key phenological stages, as follows: V4–V5 and R2–R3 for soybean, V6 and VT for maize, and panicle initiation plus heading for rice. The rainfed control received the same basal mineral fertilizer—45 kg P2O5 ha−1 at sowing and 60 kg K2O ha−1 split between sowing and V4—and maintained identical row spacing (0.50 m). Planting densities followed crop-specific guidelines, as follows: soybean at 180,000 to 300,000 plants ha−1, depending on cultivar and sowing date, and maize at 60,000 to 68,000 plants ha−1, adjusted for hybrid and season.
2.2. Site Selection and Sampling Collection
Soil samples were collected out post-harvest in June 2022 across both management systems, targeting the following three depth intervals: 0–10 cm, 10–20 cm, and 20–30 cm. A preserved reference site representing undisturbed conditions was also sampled—limited to the 0–10 cm layer—and used exclusively for microbial community assessment via e-DNA techniques.
Sampling followed a stratified pattern, with mini-trenches excavated at 225 m intervals, collecting 15 subsamples per depth per field, resulting in a total of 90 samples. The following two types of samples were obtained: undisturbed samples using Kopeck rings for evaluating soil structure and bulk density, and disturbed samples for other analyses including particle size distribution, total carbon and nitrogen, enzymatic activity, GRSP levels, and microbial profiling. All samples were placed in labeled polyethylene bags, transported in ice-cooled containers, and stored at approximately 4°C in the Biotechnology and Microbial Ecology Laboratory (UFMT) until further processing.
2.3. Soil Physical and Chemical Characterization
The physical and chemical properties were assessed by determining particle size distribution through combined chemical and physical methods. Soil aggregates were separated using dry sieving and dispersion, according to the procedures described by Santon et al. [15], and the mean geometric diameter (GMD) was calculated using the equation of Kemper and Rosenau [16], as follows:
where “wi” is the weight of aggregates in a given size class, and “xi” is their average diameter.
GMD = (∑ wi × log xi)/(∑ wi)
Phosphorus and potassium were extracted using the Mehlich-1 method, calcium and magnesium were determined using 1 N KCl, and soil pH was measured in a CaCl2 solution. The effective cation exchange capacity (CEC) was calculated as the sum of the Ca2⁺, Mg2⁺, K⁺, and Al3⁺ contents. All analyses were conducted according to the procedures described in the Brazilian Soil Analysis Manual [17].
Bulk density was determined by drying undisturbed samples at 105 °C, and total carbon and nitrogen were measured using a LECO® CHN 628 elemental analyzer via the Dumas combustion method.
A modified soil quality index (SQI) was calculated based on Mendes et al. [18] by integrating biological and chemical indicators. It considered the following three key functions: nutrient cycling (F1), based on enzyme activities (β-glucosidase and Arylsulfatase); nutrient storage (F2), represented by soil organic matter (SOM) and cation exchange capacity (CEC); and nutrient supply (F3), which included P, K, Ca, Mg, pH, and Al3⁺ saturation. Indicators were normalized on a 0-to-1 scale using the “more is better” principle, except for Al3⁺, where “less is better” was applied. The SQI value was obtained as the weighted mean of F1, F2, and F3, reflecting the soil’s capacity to sustain fertility. Normalization followed the thresholds established by Lobato [19], ensuring comparability across variables.
2.4. Determination of Soil Enzyme Activity
Enzyme assays for β-glucosidase, arylsulfatase, and acid phosphatase were performed colorimetrically, following the methodology described by Silveira et al. [20], based on the release of p-nitrophenol with absorbance readings at 410 nm. All enzyme analyses were conducted on soil samples maintained at field moisture levels.
2.5. Determination of Soil Spores and GRSPs
Glomalin-related soil proteins (GRSPs) were extracted from fresh soil using a sodium citrate buffer (Na3C6H5O7) at two pH levels—7.0 for easily extractable glomalin (EE-GRSP) and 8.0 for total glomalin (T-GRSP). The extraction was conducted at 121 °C for 30 min, following a modified protocol by Reyna and Wall [21]. Protein concentrations were determined via the Bradford assay [22], with absorbance read at 570 nm.
Spore density was determined using a combination of wet sieving and centrifugation. A total of 50 g of field-moist soil was processed according to the methods described by Gerdemann and Nicolson [23] and Jenkins [22]. After centrifugation in a 50% sucrose solution, spores were quantified on Petri dishes using a stereomicroscope. The equipment used was a Zeiss Stemi 508 binocular stereomicroscope (Carl Zeiss AG, Oberkochen, Germany).
2.6. Soil Microbial Community Analysis
For microbial community analysis, total DNA was extracted from soil samples using the DNeasy Power Soil Kit (Qiagen, Hilden, Germany), following the manufacturer’s protocol. DNA integrity was confirmed by electrophoresis on a 0.8% agarose gel stained with SYBR Safe. Amplification targeted the 16S rRNA gene for bacterial communities, and the ITS region (for fungi) were targeted using specific primers. The bacterial V3–V4 region was amplified using the primers CCTACGGGNGGCWGCAG (forward) and GACTACHVGGGTATCTAATCC (reverse) [24,25]; ITS1 and ITS2 primers were used for fungi [26,27]. Sequencing was performed on the Illumina MiSeq platform (https://www.illumina.com/systems/sequencing-platforms.html, accessed on 1 January 2025), achieving a minimum of 30,000 reads per sample and maintaining a Q20 score exceeding 99%.
2.7. Statistical Analysis
Non-parametric statistical tests (Mann–Whitney and Kruskal–Wallis) were performed using SPSS (version 30) and Jamovi software (https://www.jamovi.org/, accessed on 1 January 2025) Due to the lack of normal distribution in the dataset, robust regression with MM-estimation was employed to explore associations between the soil quality index (SQI) and primary soil attributes, including GRSP fractions, bulk density, and geometric mean diameter (GMD), ensuring the stability and reliability of the coefficient estimates.
3. Results
3.1. Soil Chemical Properties
The chemical properties of the Oxisols varied by depth within the 0–30 cm profile and showed measurable differences between the irrigated and rainfed systems (Table 1), following nutrient classifications defined by Sousa & Lobato (2004) [19]. Organic matter (OM) content was highest in the top 0–10 cm layer, with 6.07 ± 0.60 g/kg in the irrigated soil and 5.35 ± 0.86 g/kg in the rainfed soil, both of which were considered high. A significant decline in OM was observed with depth (p < 0.001), but the difference between systems was not statistically significant (p = 0.080). Phosphorus availability also showed a strong depth gradient, with surface values at 67.0 ± 22.9 mg/dm3 for the irrigated soil and 42.2 ± 20.1 mg/dm3 for the rainfed soil, decreasing below 10 cm and dropping below 5 mg/dm3 at 20–30 cm. Potassium levels were consistently higher in the rainfed system across all layers, with surface concentrations of 78.3 ± 32.2 mg/dm3 (classified as high) compared to 48.4 ± 11.0 mg/dm3 (medium) in the irrigated soil (p < 0.001).

Table 1.
Soil chemical properties by depth and management system (mean ± standard deviation).
Cation exchange capacity (CEC) was moderate to high in the surface horizon—8.77 ± 0.59 cmol6/dm3 in the irrigated soil and 8.13 ± 0.69 cmol6/dm3 in the rainfed soil—and decreased significantly with depth (p < 0.001). Exchangeable calcium and magnesium were both adequate in the surface layer but also declined with depth, with significant differences observed (p < 0.001 for both elements).
3.2. Correlation Matrix and Glomalin Fractions
Spearman correlation analysis showed different patterns of association between the glomalin fractions and the soil quality indicators, depending on the irrigation regime (Figure 2A,B). Total glomalin (T-GRSP) had consistent positive correlations with all measured variables in both systems, showing significant associations (p < 0.01) with nutrient cycling (F1; ρ = 0.424), nutrient storage (F2; ρ = 0.447), nutrient supply (F3; ρ = 0.398), and the soil quality index (SQI; ρ = 0.448). In contrast, the easily extractable glomalin fraction (EE-GRSP) responded differently depending on the water regime. Under irrigation (Figure 2A), EE-GRSP was strongly correlated with nutrient storage (F2; ρ = 0.548), nutrient supply (F3; ρ = 0.611), and SQI (ρ = 0.580). Under rainfed conditions (Figure 2B), these associations were weaker, and no significant correlation was found between EE-GRSP and the enzymatic activity (F1; ρ = 0.284). Additionally, the two glomalin fractions were weakly negatively correlated in the rainfed system (T-GRSP × EE-GRSP; ρ = –0.139), indicating a shift in their relationship under limited water availability.
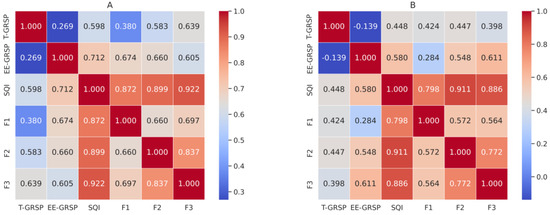
Figure 2.
Heatmaps of Spearman correlation coefficients among soil parameters in (A) rainfed and (B) irrigated systems. Parameters: EE-GRSP = easily extractable glomalin; T-GRSP = total glomalin; SQI = soil quality index; F1 = nutrient cycling; F2 = nutrient storage; F3 = nutrient supply.
3.3. Enzymatic Activity
As shown in Figure 3A, β-glucosidase activity did not differ significantly between irrigation regimes (p > 0.05) but decreased consistently with increasing soil depth (p < 0.001; Figure 3B). Post hoc comparisons of depth intervals (Figure 3B) indicated significantly higher activity in the surface layer (0–10 cm) compared to both the intermediate (10–20 cm) and deepest layers (20–30 cm), with all three depth intervals showing significant differences from each other (p < 0.05). In contrast, acid phosphatase activity followed a different pattern (Figure 3C,D). This enzyme showed significantly higher activity under irrigation compared to rainfed conditions (p < 0.05; Figure 3C). It also varied with depth (p < 0.05; Figure 3D), with post hoc results indicating that the surface layer (0–10 cm) had significantly higher activity than deeper layers, while the intermediate (10–20 cm) and deepest (20–30 cm) layers showed intermediate and similar responses. These findings suggest that enzyme responses to irrigation and depth are enzyme-specific, with acid phosphatase showing sensitivity to both water availability and soil stratification, while β-glucosidase was more affected by depth than irrigation.
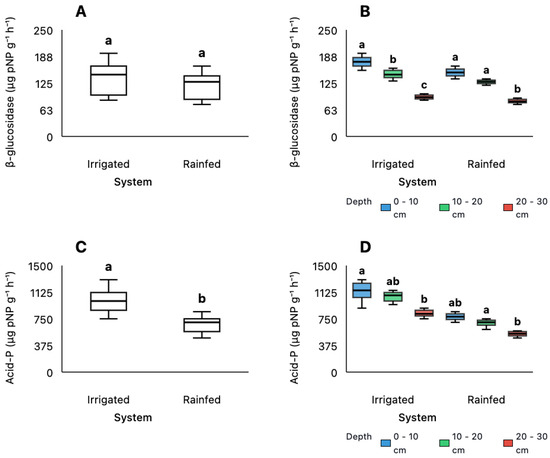
Figure 3.
Values of β-glucosidase (A,B) and acid phosphatase (C,D) activities under different management systems (Irrigated and Rainfed) and soil depths (0–10 cm, 10–20 cm, and 20–30 cm). Statistical analyses were performed using the non-parametric Kruskal–Wallis test, followed by pairwise comparisons with Bonferroni adjustment. Groups denoted by different letters represent statistically significant differences (p < 0.05).
Spore abundance showed no significant difference between irrigated and rainfed systems (p > 0.05; Figure 4A) but varied significantly with soil depth (p < 0.001; Figure 4B). Surface layers (0–10 cm) had significantly higher spore counts than deeper layers, while the intermediate (10–20 cm) and deepest (20–30 cm) layers did not differ significantly from each other in both irrigation systems. Phosphorus concentrations differed significantly between irrigation systems, with higher levels under irrigation compared to rainfed conditions (p < 0.05; Figure 4C). Phosphorus also varied significantly with depth (p < 0.001; Figure 4D), showing a consistent decline from surface to deeper layers. Post hoc comparisons revealed significant differences between all depth intervals in both systems (p < 0.05), with the steepest gradient occurring between surface (0–10 cm) and deeper layers (10–20 cm and 20–30 cm). The distribution patterns revealed that while spore abundance remained consistent across management systems, it showed strong depth stratification. In contrast, phosphorus responded to both irrigation management and depth, suggesting different ecological controls on these soil biological and chemical parameters.
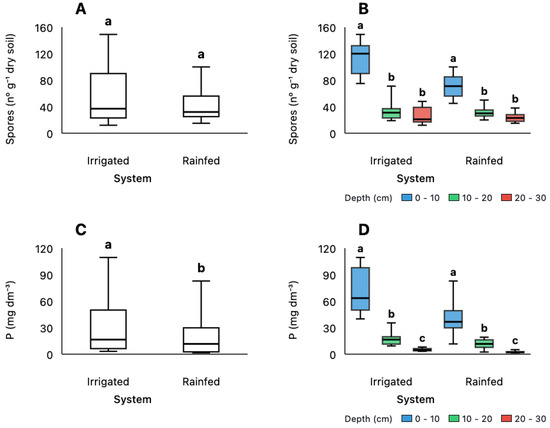
Figure 4.
Spore density (A,B) and available phosphorus (C,D) across different management systems (Irrigated and Rainfed) and soil depths (0–10 cm, 10–20 cm, 20–30 cm). The Irrigated system received fertigation with swine manure for 20 years and supports three cropping cycles per year. Statistical analyses were performed using the Kruskal–Wallis test with Bonferroni adjustment. Different letters indicate statistically significant differences (p < 0.05) between systems (A,C) and among depths within each system (B,D).
3.4. Relationships Between GRSP and Soil Quality Index (SQIFERTBio)
Robust regression analysis identified both T-GRSP and EE-GRSP as significant predictors of the soil quality index (SQI) in the irrigated and rainfed systems (p < 0.001; Table 2). EE-GRSP had a stronger influence in the rainfed system (β = 0.501) compared to the irrigated system (β = 0.177), while T-GRSP showed similar effects across both systems (β = 0.239 for rainfed and β = 0.162 for irrigated).
Table 2.
Results of robust regression for soil quality index (IQS).
To examine their individual contributions to SQI, separate linear regressions were conducted (Figure 5A,B). In irrigated soil, T-GRSP explained 50.1% of the variation in SQI (R2 = 0.501, p < 0.001), and EE-GRSP accounted for 49.5% (R2 = 0.495, p < 0.001). In the rainfed system, T-GRSP explained 28.7% of SQI variability (R2 = 0.287, p < 0.001), while EE-GRSP explained 42.4% (R2 = 0.424, p < 0.001). These results indicate that both glomalin fractions are statistically associated with SQI, with EE-GRSP showing a higher explanatory contribution under rainfed conditions.
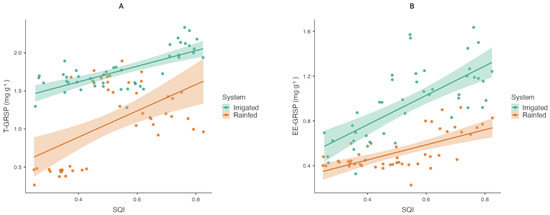
Figure 5.
Relationships between EE-GRSP, T-GRSP, and soil quality indices (SQI-(A), SQI-(B)) in irrigated and rainfed systems. Scatterplots show pairwise comparisons.
Predicted SQI values were compared with observed measurements for validation (Figure 6). In the irrigated system, a correlation of R2 = 0.75 (p < 0.001) indicated a strong match between the predicted and observed SQI values. In the rainfed system, the correlation was lower, with R2 = 0.46 (p < 0.001), indicating greater variability in prediction accuracy. The differences between systems reflect variations in the model performance under different soil and environmental conditions.
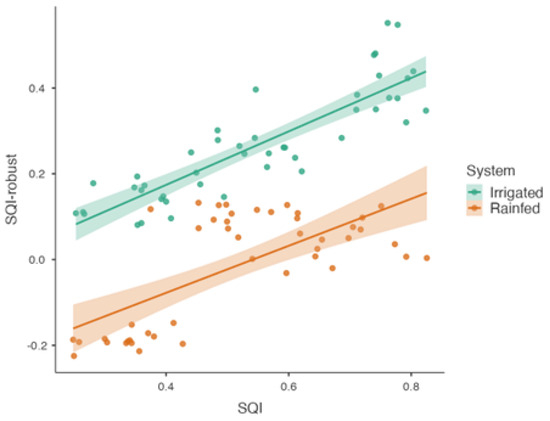
Figure 6.
Comparison of robust regression-predicted SQI values with observed SQI values in both irrigated and rainfed systems.
3.5. Soil Protein Related to Glomalin and Its Contribution to Total Soil Carbon
As shown in Table 3, in the irrigated system, total glomalin (T-GRSP) was highest in the 0–10 cm layer (2.07 mg g−1) and lower in the 10–20 cm and 20–30 cm layers (1.64 mg g−1). Mean T-GRSP values were higher under irrigation compared to rainfed conditions, where concentrations declined from 1.60 mg g−1 at 0–10 cm to 0.44 mg g−1 at 20–30 cm. The carbon associated with total glomalin (C_T-GRSP) followed the same trend, with greater values in the irrigated system. The percentage of C_T-GRSP in total soil carbon (C_T-GRSP/CS) increased with depth under irrigation but peaked at 10–20 cm in the rainfed system, with the lowest value at 20–30 cm. Easily extractable glomalin (EE-GRSP) showed similar concentrations in both systems at the surface layer (0–10 cm), decreasing at greater depths. The carbon fraction of EE-GRSP (C_EE-GRSP) did not differ significantly between systems, although the ratio of EE-GRSP carbon to total soil carbon (C_EE-GRSP/CS) was, on average, higher under rainfed conditions.
Table 3.
Effect of soil management practices on the total GRSP concentration and its contribution to soil carbon. a. Calculated based on glomalin containing 43.1% [28].
3.6. Microbial Diversity and Community Composition
The microbial diversity varied substantially across the management systems, with distinct patterns observed for the bacterial and fungal communities (Table 4).
Table 4.
Microbial diversity metrics across management and reference systems.
The irrigated site recorded the highest bacterial species richness (S = 61), along with the highest values for diversity (Simpson = 0.945; Shannon = 3.43) and evenness (0.507), showing a relatively uniform species distribution. The protected area had the largest bacterial population (N = 10,208) but lower diversity (Simpson = 0.904; Shannon = 2.84) and evenness (0.335), pointing to the dominance of fewer species. The rainfed site showed the lowest richness (S = 45) and abundance (N = 5060), though its evenness (0.397) was higher than that of the protected site.
Fungal patterns followed a similar structure. The irrigated site had the highest richness (S = 317) and abundance (N = 102,151), with the top diversity scores (Simpson 1−D = 0.779; Shannon H′ = 2.80) but the lowest evenness (0.0517), reflecting the prevalence of a few species. The protected site showed moderate richness (S = 277) and abundance (N = 72,800) but the lowest diversity and evenness values. The rainfed area had the lowest richness (S = 201) and abundance (N = 68,119), but its evenness (0.0583) was the highest, indicating a more balanced species distribution.
3.7. Influence of Irrigated and Rainfed Management Systems on Soil Microbial Community Structure
3.7.1. Bacterial Community Structure
Figure 7 displays the relative abundance of bacterial species exceeding 1% across the three systems. In the protected area, bacterial diversity was the highest, with a balanced representation of taxa. The dominant species included Bacteroides vulgatus (20.9%), Bacteroides massiliensis (15.8%), Faecalibacterium prausnitziii (9.3%), and Bacteroides plebeius (7.1%). The rainfed system was characterized by a pronounced dominance of Romboutsia sedimentorum (27.2%), followed by Bacteroides vulgatus (15.5%) and Roseburia intes-tinalis (7.8%), reflecting adaptations to lower moisture availability and potential nutrient limitations. In contrast, the irrigated system exhibited a more balanced community structure, with Bacteroides acidifaciens (14.2%), Bacteroides plebeius (11.7%), and Roseburia inu-linivorans (7.8%) as the most abundant taxa. Despite having lower total bacterial abundance than the rainfed soils, this system showed the highest evenness.
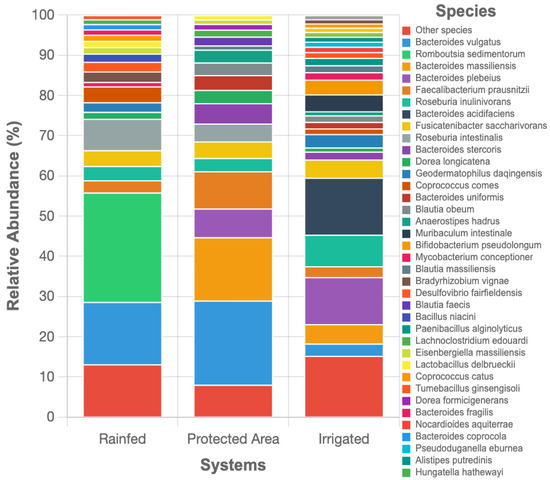
Figure 7.
Relative abundance of bacterial species exceeding 1% across land-use types (Irrigated, Protected Area, and Rainfed).
3.7.2. Fungal Community Structure and Absence of AMF
Figure 8 presents the relative abundance of fungal species exceeding 1% across the three land-use systems. The protected area exhibited the highest fungal diversity, with the greatest proportion of rare species (36.9% classified as ‘Others’), while the irrigated system showed intermediate diversity (32.7%), and the rainfed system displayed the lowest fungal richness and evenness (25.0%). In the irrigated soils, there was a marked increase in the relative abundance of certain phytopathogenic fungi and beneficial microorganisms. Notably, Penicillium citrinum and Stachylidium bicolor dominated the irrigated system (12.6% and 12.5%, respectively), while Trichoderma turrialbense was also highly abundant (5.3%), suggesting a compensatory response to high organic matter inputs and potentially enhanced biocontrol activity. The rainfed system was characterized by the dominance of Fusarium oxysporum (12.6%) and Trichoderma turrialbense (7.7%). In contrast, the protected area showed a more balanced community structure, with Beauveria bassiana (16.1%) and Metarhizium anisopliae (14.6%) being the most abundant species, indicating a prevalence of entomopathogenic fungi in this undisturbed environment. Despite these differences, no sequences corresponding to arbuscular mycorrhizal fungi (AMF; phylum Glomeromycota) were detected in any of the soils. This finding is particularly noteworthy given that high levels of glomalin-related soil protein (GRSP) were measured in the irrigated system, indicating a discrepancy between biochemical markers and DNA-based detection methods.
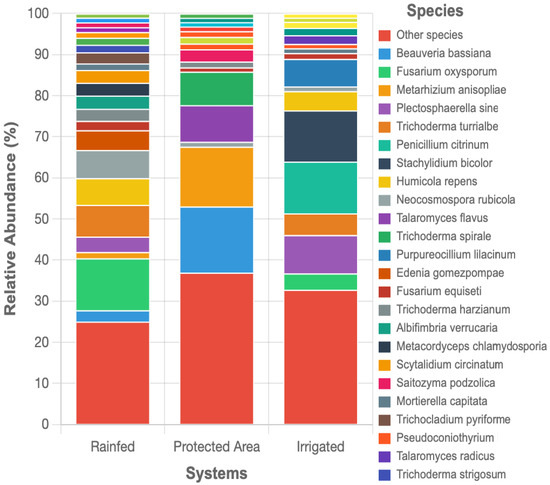
Figure 8.
Relative abundance of fungal species exceeding 1% across Systems (Irrigated, Protected Area, and Rainfed).
3.8. Principal Component Analysis
Principal Component Analysis (PCA) applied to the chemical, physical, and biological soil attributes explained 61.1% of the total variance across management regimes (irrigated vs. rainfed) and soil depths (0–10, 10–20, and 20–30 cm). In the PC1–PC2 biplot differentiating systems (Figure 9A), PC1 accounted for 45.2% of the variance and encompassed the following three functional domains of the modified SQI: nutrient cycling (β-glucosidase and arylsulfatase activities), nutrient storage (soil organic matter and cation exchange capacity), and nutrient supply (available P, K, Ca, Mg, pH, and Al3⁺ saturation). Higher PC1 scores in irrigated soils indicate improved nutrient dynamics under pig slurry fertigation.
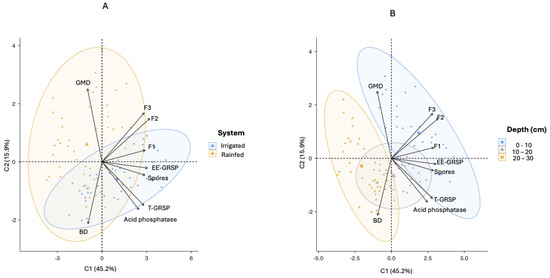
Figure 9.
Principal component analysis (PCA) biplots of chemical, physical, and biological soil attributes measured at three depths (0–10 cm, 10–20 cm, and 20–30 cm) under two management systems (Irrigated and Rainfed). (A) Separation of samples by management systems. (B) Separation of samples by soil depths. Variables: GMD, geometric mean diameter of aggregates; BD, bulk density; EE-GRSP, easily extractable glomalin; T-GRSP, total glomalin; F1, nutrient cycling; F2, nutrient storage; F3, nutrient supply.: GMD: Geometric Mean Diameter of the aggregates; BD: Bulk density; Acid phosphatase; Spores: spore density; EE-GRSP: easily extractable glomalin; T-GRSP: total glomalin; F1: Nutrient Cycling; F2: Nutrient Storage; F3: Nutrient Supply.
PC2 explained 15.9% of the variance and was associated with structural attributes, showing positive loadings for aggregate size (geometric mean diameter, GMD) and negative loadings for bulk density (BD). When analyzed by depth (Figure 9B), the surface layers (0–10 cm) showed higher PC2 values, while the 10–20 and 20–30 cm layers shifted to lower scores, consistent with decreased aggregate size and increased compaction with depth.
These trends were partially supported by direct measurements. The rainfed soils exhibited significantly greater GMD (1.50 ± 0.31 mm) than the irrigated soils (1.30 ± 0.18 mm; p < 0.001), whereas BD did not differ significantly between systems (1.15 ± 0.06 vs. 1.15 ± 0.08 g cm−3; p = 0.569).
The mean PC1 and PC2 scores for each management system and soil depth are presented in Table 5. Overall, irrigation improved nutrient-related properties in the surface soil layer, as evidenced by higher PC1 scores. In contrast, structural attributes represented by PC2 did not show consistent improvement under irrigation, since aggregate size was greater in the rainfed soils, and bulk density remained unchanged. Both systems showed declining PC1 and PC2 scores with increasing depth, indicating reduced aggregation and nutrient-associated functions in subsurface layers.
Table 5.
Mean ± standard deviation (SD) of Principal Component Analysis (PCA) scores for PC1 and PC2 according to system and depth. Positive PC1 values reflect greater nutrient cycling, storage and supply; positive PC2 values indicate higher aggregate stability and lower compaction.
4. Discussion
4.1. Irrigation Effects on Soil Physical Properties and Enzyme Activity
The center-pivot irrigation system applied approximately 220 mm of water during the dry season, maintaining soil moisture near 90% of field capacity. In contrast, the rainfed system received only 160 mm of precipitation during the same period [14]. This difference in water availability, combined with pig slurry fertigation and minimal soil disturbance, led to increased glomalin accumulation in the irrigated soils. However, aggregate size, as measured by geometric mean diameter (GMD), was significantly higher in the rainfed system, indicating that physical aggregation processes may have played a more prominent role under limited moisture conditions. Moreover, the negative correlation between GMD and total glomalin (T-GRSP; r = –0.382, p < 0.001) suggests that glomalin levels do not increase proportionally with aggregate size, reinforcing the notion that glomalin may not directly reflect structural aggregation in these soils [29].
Although T-GRSP concentrations were significantly higher in irrigated soils, no correlation was observed between glomalin content and aggregate size. This apparent disconnect may be attributed to the coexistence of biogenic and physicogenic aggregates, which respond differently to biological inputs and are not equally influenced by glomalin-related proteins [30]. Aggregate size alone may not adequately capture biologically mediated aggregation, particularly when physical processes dominate.
This interpretation is further supported by previous research showing that structural improvements from organic amendments like manure are more strongly associated with biogenic aggregation processes than with increases in aggregate size per se [31]. Similarly, the balance between the biogenic and physicogenic aggregates may vary depending on the management system, which could explain the observed decoupling between GMD and microbial indicators such as glomalin [32]. Consequently, the larger GMD observed in the rainfed soils may reflect a predominance of physical aggregation mechanisms rather than enhanced microbial binding or glomalin-mediated structure formation.
The center-pivot irrigation system applied approximately 220 mm of water during the dry season, maintaining soil moisture near 90% of field capacity. In contrast, the rainfed system received only 160 mm of precipitation during the same period [14]. This moisture difference, combined with pig slurry fertigation and minimal soil disturbance, contributed to reduced bulk density and greater formation of biogenic aggregates, as indicated by higher geometric mean diameter (GMD) values [33]. However, the observed negative correlation between GMD and total glomalin (T-GRSP; r = –0.382, p < 0.001) suggests that glomalin levels do not increase proportionally with aggregate size [29].
Enzyme activity patterns followed similar trends. β-glucosidase activity showed no significant difference between irrigation regimes, suggesting that substrate availability, rather than soil moisture, may be the main limiting factor for this enzyme [34]. In contrast, acid phosphatase activity was higher under irrigation, likely due to increased organic phosphorus inputs and greater microbial biomass driven by long-term organic fertilization [35]. Both enzymes declined significantly with depth, consistent with reductions in organic matter and microbial abundance in subsurface horizons [36,37].
4.2. Microbial Community and Glomalin Responses to Water and Nutrient Availability
Land-use and management practices exert a strong influence on the structure and functional potential of soil microbial communities. In this study, irrigated systems consistently supported higher microbial richness and diversity across both bacterial and fungal domains. This trend is likely associated with increased resource inputs, improved soil moisture, and enhanced habitat heterogeneity, resulting from long-term irrigation and organic fertilization [38].These factors may promote niche differentiation, enabling the persistence of functionally diverse and taxonomically balanced microbial communities [39]. In contrast, the rainfed system was characterized by lower richness but higher evenness, suggesting adaptation to moisture-limited conditions, while the protected area, though less managed, supported diverse but uneven communities potentially shaped by ecological stability and reduced nutrient turnover [40].
Irrigated plots exhibited increased arbuscular mycorrhizal fungal (AMF) spore density [41], although AMF sequences were not detected in the eDNA analyses despite the presence of elevated glomalin levels. The following our factors may explain this discrepancy: (1) High phosphorus concentrations can suppress AMF colonization. (2) Glomalin may persist after AMF decline, representing a historical signal of former activity [42,43,44]. (3) Standard ITS primers are inefficient for AMF detection, leading to underrepresentation in sequencing datasets [45]. (4) Competitive interactions with phosphorus-tolerant fungi, such as Fusarium and Trichoderma, may limit AMF colonization in fertilized soils [46,47].
Beyond AMF, irrigation and organic inputs affected broader microbial dynamics. The irrigated soils supported a more evenly distributed bacterial community and higher fungal richness compared to the rainfed soils, where drought-adapted taxa were dominant [5,6]. The integration of enzyme profiles with eDNA data suggests that water availability supports microbial functions related to nutrient turnover [48].
4.3. Glomalin Fractions and Their Relationship with Soil Quality Indicators
In the rainfed system, the SQI was more strongly associated with both nutrient storage (F2: 0.91, p < 0.001) and nutrient supply (F3: 0.89, p < 0.001), while the enzymatic activity (F1: ρ0.80, p < 0.001) was comparatively weaker. These results indicate that, under water-limited conditions, soil organic matter and nutrient retention are more relevant to maintaining soil quality than microbial activity. This aligns with findings from dryland systems, where carbon inputs and nutrient retention have been identified as key determinants of soil health due to microbial activity being constrained by moisture availability [48]. In contrast, in the irrigated system, microbial processes become more relevant, as evidenced by the stronger correlation between EE-GRSP (0.67, p < 0.001) and enzymatic activity (F1), while this association remained weak and non-significant in rainfed soils (0.28, p = 0.059). This reinforces, the idea that soil microbial communities respond positively to increased moisture, particularly in systems with conservative management practices that favor mycorrhizal development and glomalin production [49,50]
Another key distinction is the relationship between T-GRSP and EE-GRSP. In the rainfed system, these fractions show a weak negative correlation (–0.139), suggesting that they operate independently under drier conditions, possibly due to differences in stability and turnover rates of glomalin fractions under moisture-limited conditions [51]. While long turnover times of total glomalin have been reported [52], the concentration of EE-GRSP appears quite vulnerable to environmental changes and agricultural management practices [50]. However, in the irrigated system, they exhibit a positive correlation (0.269), implying a more interconnected role, potentially due to increased microbial activity influencing glomalin production and stabilization, as observed in previous research on fungal dynamics in humid environments [28]. These findings suggest that moisture availability plays a crucial role in determining how these glomalin-related fractions contribute to soil structure and nutrient cycling [53].
5. Future Perspectives
Combining glomalin measurements with enzyme activity and genomic approaches creates an effective method for evaluating soil quality. Future research should focus on targeted AMF detection techniques, optimizing manure application rates to prevent phosphorus oversupply, and studying glomalin persistence in relation to soil structure. These integrated approaches will help advance sustainable land management practices and improve carbon sequestration in agricultural systems.
Future investigations could use Glomeromycota-specific primers and trap cultures to better evaluate AMF presence, diversity, and function in managed soils. These approaches—combined with morphological spore identification—may reveal the ecological roles and symbiotic patterns of AMF that standard ITS-based protocols miss, especially in environments with high phosphorus or complex microbial interactions. Improved AMF detection methods would help researchers understand soil aggregation, nutrient cycling, and carbon sequestration. Seeliger et al. [54] showed that specialized primers improved AMF detection in agricultural soils.
6. Conclusions
Our findings demonstrate that glomalin-related soil proteins, particularly T-GRSP and EE-GRSP, are effective indicators of soil quality in both the irrigated and rainfed systems. In irrigated soils under pig slurry fertigation, T-GRSP levels were 66% higher than in rainfed soils, accounting for up to 3.1% of total soil carbon and contributing to improved aggregate stability. Despite reduced microbial activity in rainfed soils due to limited moisture, EE-GRSP remained significantly correlated with soil quality metrics, highlighting its potential as an early indicator under stress conditions. The absence of AMF sequences, despite elevated glomalin levels, suggests a legacy effect of past colonization, methodological limitations, or competitive exclusion by other fungal groups. Overall, integrating glomalin quantification with soil monitoring can enhance the evaluation of structural integrity, carbon dynamics, and long-term resilience in sustainable agroecosystems.
Author Contributions
Conceptualization, J.G.M. and E.G.C.; methodology, M.A.S.; software, J.G.M.; validation, O.L.S.W. and R.T.T.; formal analysis, E.G.C.; investigation, J.M.M.; resources, M.A.S.; data curation, E.G.C.; writing—original draft preparation, J.G.M.; writing—review and editing, E.G.C., J.G.M. and O.L.S.W.; visualization, J.G.M.; supervision, E.G.C.; project administration, G.N.T.; funding acquisition, E.G.C. and O.L.S.W. All authors have read and agreed to the published version of the manuscript.
Funding
This research was funded by Mato Grosso State Research Support Foundation, grant number 004/2021 and “The APC was funded by Mato Grosso State Research Support Foundation”. The funders had no role in study design, data collection and analysis, decision to publish, or preparation of the manuscript.
Data Availability Statement
All datasets are included in the manuscript, and additional datasets are available upon reasonable request.
Acknowledgments
We thank James Moraes de Moura for formatting the English text of this manuscript.
Conflicts of Interest
The authors declare that they have no known competing financial interests or personal relationships that could have appeared to influence the research reported in this paper.
References
- Doran, J.W.; Parkin, T.B. Defining and Assessing Soil Quality. In Defining Soil Quality for a Sustainable Environment; Wiley: Minneapolis, MN, USA, 1994; pp. 3–21. Available online: https://acsess.onlinelibrary.wiley.com/doi/10.2136/sssaspecpub35.c1 (accessed on 19 May 2025).
- Karlen, D.L.; Veum, K.S.; Sudduth, K.A.; Obrycki, J.F.; Nunes, M.R. Soil Health Assessment: Past Accomplishments, Current Activities, and Future Opportunities. Soil Tillage Res. 2019, 195, 104365. [Google Scholar] [CrossRef]
- Bardgett, R.D.; Freeman, C.; Ostle, N.J. Microbial contributions to climate change through carbon cycle feedbacks. ISME J. 2008, 2, 805–814. [Google Scholar] [CrossRef] [PubMed]
- Curtright, A.J.; Tiemann, L.K. Meta-analysis dataset of soil extracellular enzyme activities in intercropping systems. Data Brief 2021, 38, 107284. [Google Scholar] [CrossRef]
- Nkongolo, K.K.; Narendrula-Kotha, R. Advances in monitoring soil microbial community dynamic and function. J. Appl. Genet. 2020, 61, 249–263. [Google Scholar] [CrossRef] [PubMed]
- Pawlowski, J.; Apothéloz-Perret-Gentil, L.; Altermatt, F. Environmental DNA: What’s behind the term? Clarifying the terminology and recommendations for its future use in biomonitoring. Mol. Ecol. 2020, 29, 4258–4264. [Google Scholar] [CrossRef]
- Wright, S.F.; Upadhyaya, A. Extraction of an abundant and unusual protein from soil and comparison with hyphal protein of arbuscular mycorrhizal fungi. Soil Sci. 1996, 161, 575–586. Available online: https://journals.lww.com/soilsci/fulltext/1996/09000/extraction_of_an_abundant_and_unusual_protein_from.3.aspx (accessed on 29 May 2022). [CrossRef]
- Zhu, R.; Zheng, Z.; Li, T.; He, S.; Zhang, X.; Wang, Y.; Liu, T. Effect of tea plantation age on the distribution of glomalin-related soil protein in soil water-stable aggregates in southwestern China. Environ. Sci. Pollut. Res. 2019, 26, 1973–1982. [Google Scholar] [CrossRef] [PubMed]
- Wang, W.; Zhong, Z.; Wang, Q.; Wang, H.; Fu, Y.; He, X. Glomalin contributed more to carbon, nutrients in deeper soils, and differently associated with climates and soil properties in vertical profiles. Sci. Rep. 2017, 7, 13003. [Google Scholar] [CrossRef]
- Singh, A.K.; Chen, C.; Zhu, X.; Yang, B.; Khan, M.N.; Zakari, S.; Jiang, X.J.; del Mar Alguacil, M.; Liu, W. Unraveling the impact of global change on glomalin and implications for soil carbon storage in terrestrial ecosystems. Resour. Environ. Sustain. 2024, 18, 100174. [Google Scholar] [CrossRef]
- Purin, S.; Rillig, M.C. The arbuscular mycorrhizal fungal protein glomalin: Limitations, progress, and a new hypothesis for its function. Pedobiologia 2007, 51, 123–130. [Google Scholar] [CrossRef]
- Fokom, R.; Teugwa Mofor, C.; Nana Wakam, L.; Ngonkeu Megapche, E.L.; Tchameni, S.; Nwaga, D.; Rillig, C.M.; Amvam Zollo, P.H. Glomalin, carbon, nitrogen and soil aggregate stability as affected by land use changes in the humid forest zone in South Cameroon. Appl. Ecol. Environ. Res. 2013, 11, 581–592. [Google Scholar] [CrossRef]
- Santos, H.G.; Jacomine, P.K.T.; Dos Anjos, L.H.C.; De Oliveira, V.A.; Lumbreras, J.F.; Coelho, M.R.; De Almeida, J.A.; de Araujo Filho, J.C.; De Oliveira, J.B.; Cunha, T.J.F. Sistema Brasileiro de Classificação de Solos; Embrapa: Brasília, Brazil, 2018; Available online: https://www.agroapi.cnptia.embrapa.br/portal/assets/docs/SiBCS-2018-ISBN-9788570358004.pdf (accessed on 19 May 2025)ISBN -9788570358004.
- Lathuilliere, M.J.; Dalmagro, H.J.; Black, T.A.; de Arruda, P.H.Z.; Hawthorne, I.; Couto, E.G.; Johnson, M.S. Rain-fed and irrigated cropland-atmosphere water fluxes and their implications for agricultural production in Southern Amazonia. Agric. For. Meteorol. 2018, 256, 407–419. [Google Scholar] [CrossRef]
- Salton, J.C.; Silva, W.M.; Tomazi, M.; Hernani, L.C. Determinação da Agregação do Solo-Metodologia em uso na Embrapa Agropecuária Oeste. 2012. Available online: https://www.infoteca.cnptia.embrapa.br/infoteca/bitstream/doc/952808/1/COT2012184.p (accessed on 19 May 2025).
- Kemper, W.D.; Rosenau, R.C. Aggregate Stability and Size Dlstributlon. In Methods 339 Soil Analysis Part 1 Physical and Mineralogical Methods; United States Department of Agriculture: Washington, DC, USA, 1986; Volume 340. Available online: https://eprints.nwisrl.ars.usda.gov/id/eprint/732 (accessed on 27 May 2025).
- Teixeira, P.C.; Donagemma, G.K.; Fontana, A.; Teixeira, W.G. Manual de Métodos de Análise de Solo; Embrapa: Brasília, Brazil, 2017; p. 574. [Google Scholar]
- Mendes, I.C.; Martinhão Gomes Sousa, D.; Dario Dantas, O.; Alves Castro Lopes, A.; Bueno Reis Junior, F.; Ines Oliveira, M.; Montandon Chaer, G. Soil quality and grain yield: A win–win combination in clayey tropical oxisols. Geoderma 2021, 388, 114880. [Google Scholar] [CrossRef]
- Sousa, D.M.G.; Lobato, E. Cerrado: Correção do Solo e Adubação; Embrapa Informação Tecnológica: Brasília, Brazil, 2004; Available online: https://www.infoteca.cnptia.embrapa.br/infoteca/bitstream/doc/555355/1/Cerrado-Correcao-solo-adubacao-ed-02-8a-impressao-2017.pdf (accessed on 29 May 2022).
- Silveira, A.P.D.; Abreu, M.F.; Cantarella, H.; Zambrosi, F.C.B. Determinação da Atividade de Enzimas em Solos. Available online: http://lab.iac.sp.gov.br/Publicacao/ProtocoloIACEnzimasSolosAbril2022.pdf (accessed on 29 May 2022).
- Reyna, D.L.; Wall, L.G. Revision of two colorimetric methods to quantify glomalin-related compounds in soils subjected to different managements. Biol. Fertil. Soils 2014, 50, 395–400. [Google Scholar] [CrossRef]
- Bradford, M.M. A rapid and sensitive method for the quantitation of microgram quantities of protein utilizing the principle of protein-dye binding. Anal. Biochem. 1976, 72, 248–254. [Google Scholar] [CrossRef]
- Gerdemann, J.; Nicolson, T. Spores of mycorrhizal Endogone species extracted from soil by wet sieving & decanting. Trans. Br. Mycol. Soc. 1963, 46, 235–244. [Google Scholar] [CrossRef]
- Caporaso, J.G.; Lauber, C.L.; Walters, W.A.; Berg-Lyons, D.; Huntley, J.; Fierer, N.; Owens, S.M.; Betley, J.; Fraser, L.; Bauer, M.; et al. Ultra-high-throughput microbial community analysis on the Illumina HiSeq and MiSeq platforms. ISME J. 2012, 6, 1621–1624. [Google Scholar] [CrossRef]
- Parada, A.E.; Needham, D.M.; Fuhrman, J.A. Every base matters: Assessing small subunit rRNA primers for marine microbiomes with mock communities, time series and global field samples. Environ. Microbiol. 2016, 18, 1403–1414. [Google Scholar] [CrossRef]
- Gardes, M.; Bruns, T.D. ITS primers with enhanced specificity for basidiomycetes—Application to the identification of mycorrhizae and rusts. Mol. Ecol. 1993, 2, 113–118. [Google Scholar] [CrossRef]
- Smith, D.P.; Peay, K.G. Sequence Depth, Not PCR Replication, Improves Ecological Inference from Next Generation DNA Sequencing. PLoS ONE 2014, 9, e90234. [Google Scholar] [CrossRef]
- Rillig, M.C.; Ramsey, P.W.; Morris, S.; Paul, E.A. Glomalin, an arbuscular-mycorrhizal fungal soil protein, responds to land-use change. Plant Soil 2003, 253, 293–299. [Google Scholar] [CrossRef]
- Yang, H.; Wang, G.; Wang, J.; Xiao, Q.; Li, Z.; De Clerck, C.; Meersmans, J.; Colinet, G.; Zhang, W. No-tillage facilitates soil organic carbon sequestration by enhancing arbuscular mycorrhizal fungi-related soil proteins accumulation and aggregation. Catena 2024, 245, 108323. [Google Scholar] [CrossRef]
- Silva, T.P.; de Sousa Morais, I.; Dos Santos, G.L.; Zonta, E.; da Silva Rodrigues Pinto, L.A.; de Souza Fagundes, H.; Pereira, M.G. Biogenic and physicogenic aggregates as indicators of quality in soils with sandy texture in areas of organic agriculture. Rev. Bras. De Cienc. Do Solo 2023, 47, e0230007. [Google Scholar] [CrossRef]
- Melo, T.R.D.; Pereira, M.G.; Cesare Barbosa, G.M.D.; Silva Neto, E.C.D.; Andrello, A.C.; Filho, J.T. Biogenic aggregation intensifies soil improvement caused by manures. Soil Tillage Res. 2019, 190, 186–193. [Google Scholar] [CrossRef]
- Pinto, L.A.D.S.R.; Torres, J.L.R.; Morais, I.S.; Ferreira, R.; da Silva Júnior, W.F.; Lima, S.S.; Beutler, S.J.; Pereira, M.G. Physicogenic and biogenic aggregates under different management systems in the cerrado region, Brazil. Rev. Bras. De Cienc. Do Solo 2021, 45, e0200114. [Google Scholar] [CrossRef]
- Loss, A.; Ventura, B.S.; Júnior, V.M.; Gonzatto, R.; Battisti, L.F.Z.; Lintemani, M.G.; da Costa Erthal, M.E.; Vidal, R.F.; Scopel, G.; Lourenzi, C.R.; et al. Carbon, nitrogen, and aggregation index in Ultisol with 11 years of application of animal manures and mineral fertilizer. J. Soil Water Conserv. 2021, 76, 547–557. [Google Scholar] [CrossRef]
- Adetunji, A.T.; Lewu, F.B.; Mulidzi, R.; Ncube, B. The biological activities of β-glucosidase, phosphatase and urease as soil quality indicators: A review. J. Soil Sci. Plant Nutr. 2017, 17, 794–807. [Google Scholar] [CrossRef]
- Jiang, Y.; Kuang, D.; Li, W.; Han, C.; Deng, H.; Liu, K.; Huang, S.; Zhong, W. Predominant effects of soil organic carbon quality on phosphatase activity in upland Ultisols under long-term fertilizations. Geoderma 2025, 454, 117186. [Google Scholar] [CrossRef]
- Nannipieri, P.; Trasar-Cepeda, C.; Dick, R.P. Soil enzyme activity: A brief history and biochemistry as a basis for appropriate interpretations and meta-analysis. Biol. Fertil. Soils 2017, 54, 11–19. [Google Scholar] [CrossRef]
- Yang, H.; Xiao, Q.; Huang, Y.; Cai, Z.; Li, D.; Wu, L.; Meersmans, J.; Colinet, G.; Zhang, W. Long-term manuring facilitates glomalin-related soil proteins accumulation by chemical composition shifts and macro-aggregation formation. Soil Tillage Res. 2024, 235, 105904. [Google Scholar] [CrossRef]
- Frenk, S.; Hadar, Y.; Minz, D. Resilience of soil bacterial community to irrigation with water of different qualities under Mediterranean climate. Environ. Microbiol. 2014, 16, 559–569. [Google Scholar] [CrossRef]
- Juan-Ovejero, R.; Briones, M.J.I.; Öpik, M. Fungal diversity in peatlands and its contribution to carbon cycling. Appl. Soil Ecol. 2020, 146, 103393. [Google Scholar] [CrossRef]
- Procópio, L.; Barreto, C. The soil microbiomes of the Brazilian Cerrado. J. Soils Sediments 2021, 21, 2327–2342. [Google Scholar] [CrossRef]
- Xu, J.; Liu, S.; Song, S.; Guo, H.; Tang, J.; Yong, J.W.H.; Ma, Y.; Chen, X. Arbuscular mycorrhizal fungi influence decomposition and the associated soil microbial community under different soil phosphorus availability. Soil Biol. Biochem. 2018, 120, 181–190. [Google Scholar] [CrossRef]
- Aliasgharzad, N.; Malekzadeh, E. Glomalin and Carbon Sequestration in Terrestrial Ecosystems. In Arbuscular Mycorrhizal Fungi and Higher Plants: Fundamentals and Applications; Ahammed, G.J., Hajiboland, R., Eds.; Springer Nature: Singapore, 2024; pp. 239–258. [Google Scholar] [CrossRef]
- Cissé, G.; van Oort, F.; Chenu, C.; Essi, M.; Staunton, S. Is the operationally defined fraction of soil organic matter, “GRSP” (glomalin-related soil protein), stable in soils? Evidence from trends in long-term bare fallow soil. Eur. J. Soil Sci. 2021, 72, 1101–1112. [Google Scholar] [CrossRef]
- Yang, H.; Cai, Z.; De Clerck, C.; Meersmans, J.; Colinet, G.; Zhang, W. Long-Term Manuring Enhanced Compositional Stability of Glomalin-Related Soil Proteins through Arbuscular Mycorrhizal Fungi Regulation. Agriculture 2024, 14, 1510. [Google Scholar] [CrossRef]
- Kryukov, A.A.; Gorbunova, A.O.; Machs, E.M.; Mikhaylova, Y.V.; Rodionov, A.V.; Zhurbenko, P.M.; Yurkov, A.P. Perspectives of using Illumina MiSeq for identification of arbuscular mycorrhizal fungi. Vavilovskii Zhurnal Genet. I Sel. 2020, 24, 158–167. [Google Scholar] [CrossRef]
- Cruz-Paredes, C.; Diera, T.; Davey, M.; Rieckmann, M.M.; Christensen, P.; Dela Cruz, M.; Laursen, K.H.; Joner, E.J.; Christensen, J.H.; Nybroe, O.; et al. Disentangling the abiotic and biotic components of AMF suppressive soils. Soil Biol. Biochem. 2021, 159, 108305. [Google Scholar] [CrossRef]
- Hamaoui, G.S.; Rodrigues, J.L.M.; Bohannan, B.J.M.; Tiedje, J.M.; Nüsslein, K. Land-use change drives abundance and community structure alterations of thaumarchaeal ammonia oxidizers in tropical rainforest soils in Rondônia, Brazil. Appl. Soil Ecol. 2016, 107, 48–56. [Google Scholar] [CrossRef]
- Jia, J.; de Goede, R.; Li, Y.; Zhang, J.; Wang, G.; Zhang, J.; Creamer, R. Unlocking soil health: Are microbial functional genes effective indicators? Soil Biol. Biochem. 2025, 204, 109768. [Google Scholar] [CrossRef]
- Moura, J.B.; Ramos, M.L.G.; Freitas Konrad, M.L.; Saggin Júnior, O.J.; Santos Lucas, L.; Ribeiro Junior, W.Q. Effects of direct and conventional planting systems on mycorrhizal activity in wheat grown in the Cerrado. Sci. Rep. 2024, 14, 24793. [Google Scholar] [CrossRef]
- Chi, G.-G.; Kumar, S.A.; and Wu, Q.-S. Exogenous easily extractable glomalin-related soil protein improves drought tolerance of trifoliate orange. Arch. Agron. Soil Sci. 2018, 64, 1341–1350. [Google Scholar] [CrossRef]
- Li, X.; Feng, G.; Tewolde, H.; Adeli, A.; Jenkins, J.N. Critical soil organic carbon for improving available water content of silt loam soils. Soil Use Manag. 2024, 40, e13144. [Google Scholar] [CrossRef]
- Singh, A.K.; Zhu, X.; Chen, C.; Wu, J.; Yang, B.; Zakari, S.; Jiang, X.J.; Singh, N.; Liu, W. The role of glomalin in mitigation of multiple soil degradation problems. Crit. Rev. Environ. Sci. Technol. 2022, 52, 1604–1638. [Google Scholar] [CrossRef]
- Akter, S.; Mahmud, U.; Shoumik, B.A.A.; Khan, M.Z. Although invisible, fungi are recognized as the engines of a microbial powerhouse that drives soil ecosystem services. Arch. Microbiol. 2025, 207, 79. [Google Scholar] [CrossRef]
- Seeliger, M.; Hilton, S.; Muscatt, G.; Walker, C.; Bass, D.; Albornoz, F.; Standish, R.J.; Gray, N.D.; Mercy, L.; Rempelos, L.; et al. New fungal primers reveal the diversity of Mucoromycotinian arbuscular mycorrhizal fungi and their response to nitrogen application. Env. Microbiome 2024, 19, 71. [Google Scholar] [CrossRef]
Disclaimer/Publisher’s Note: The statements, opinions and data contained in all publications are solely those of the individual author(s) and contributor(s) and not of MDPI and/or the editor(s). MDPI and/or the editor(s) disclaim responsibility for any injury to people or property resulting from any ideas, methods, instructions or products referred to in the content. |
© 2025 by the authors. Licensee MDPI, Basel, Switzerland. This article is an open access article distributed under the terms and conditions of the Creative Commons Attribution (CC BY) license (https://creativecommons.org/licenses/by/4.0/).