1. Introduction
The quality inspection of fruits and vegetables has become imperative, given the levels of fresh food. Furthermore, practical quality inspection ensures that consumers receive goods that meet the required standards while simultaneously providing producers with the assurance that their products are in optimal condition. For many years, this process was carried out using invasive methods that physically damaged the fruits or vegetables, resulting in their discard. With the advancement of technology, specifically artificial intelligence (AI) through machine learning (ML) and deep learning (DL) algorithms, quality detection has been achieved through non-invasive methods, preserving the integrity of the product.
An urgent need is to enhance the quality inspection of fruits and vegetables during the harvest or post-harvest phase. This challenge necessitates developing and implementing advanced automated applications that optimize time management, quality control, and yield estimation. Manual grading of fruit and vegetable quality and freshness incurs significant time costs and introduces a high risk of human error. Intelligent and autonomous systems, powered by object detection models, have the potential to contribute to precise monitoring, enabling real-time decision-making through applications such as smart agriculture.
DL has two specialized algorithms for quality identification in fruits and vegetables: classification and object detection. Object detection is a fundamental topic in AI, with applications in various areas such as agriculture, security, and medicine. Several DL-based object detection models have been developed in recent years, proving very effective in detecting and classifying objects in images and in real time.
Object detection models combine DL techniques with advanced image processing to assess the quality, freshness, and ripeness of fruits and vegetables. Various modalities can perform this task, including hyperspectral analysis and thermal imaging. Integrating hyperspectral imaging (HSI) with ML techniques captures spectral data and features such as texture. These data are utilized in support vector machines (SVMs) and artificial neural networks (ANNs) for quality grading [
1].
Quality detection in fruits and vegetables combines object detection models such as YOLO, Faster R-CNN, and hybrid models [
2]. Gowrishankar D. et al. utilized pre-trained CNN model architectures like DenseNet121, Xception, and MobileNetV2 [
3]. Pawan B. et al. proposed a CNN and a pre-trained VGG16 architecture using transfer learning, achieving an accuracy of 98% and 99% [
4]. Yuan Y. et al. developed a paper utilizing a CNN and a bidirectional long short-term memory (BiLSTM) model for freshness detection, achieving an accuracy of 97% [
5]. The paper by Mukhiddinov et al. presents an enhanced YOLOv4-based model for classifying the freshness of fruits and vegetables [
6]. Ahmed R. et al. implemented a CNN for freshness detection, utilizing six pre-trained models. [
7].
The research by Sri Lakshmi A. et al. focuses on applying models with transfer learning for freshness detection in fruits [
8]. Narvekar et al. propose a classification system using DL methods, specifically transfer learning and CNN, to classify various varieties of fruits and vegetables based on their size, shape, and color [
9]. The implementation of pre-trained architectures, such as VGG16, ResNet50, MobileNetV2, DenseNet121, VGG19, Xception, EfficientNetB0, and Inception V3, among others, is used in the classification of ripening stages in fruits and vegetables [
10,
11,
12,
13].
In addition to classification techniques, there are also grading techniques for detecting fruit and vegetables, as well as their maturity and quality. Additionally, there are other techniques related to image processing. Li L. et al. used hyperspectral imaging to locate damage to produce [
14]. In the work of Natarajan S. et al., colorimetry and spectroscopy techniques were employed to analyze physical properties like color and firmness, determining product quality [
15].
For the topic of object detection, several frameworks and model architectures exist, such as MMDetection, which possess the capability to detect objects in real time. The Real-Time Model for Detection (RTMDet) model proposed by Lyu et al. is a variant of real-time object detectors that can identify objects in images [
16]. The RetinaNet model implemented by Lin et al. uses a CNN architecture with a feature pyramid network (FPN) [
17]. The Dynamic Dual-Head Object Detector (DDOD) model, proposed by Chen et al., employs a disentanglement strategy to improve object detection accuracy [
18]. Meanwhile, the Task-Aligned One-Stage Object Detection (TOOD) model implemented by Feng et al. utilizes a task-aligned single-stage object detection method [
19]. The VarifocalNet model, by Zhang et al., employs a variable targeting strategy based on its intersection over union (IoU)-aware dense object detection approach [
20].
The Probabilistic Anchor Assignment (PAA) model by Kim K. et al. uses a probabilistic anchor allocation strategy based on their IoU-predictive probabilistic anchor allocation approach [
21]. Meanwhile, the adaptive training sample selection (ATSS) model employed by Zhang et al. uses an adaptive training sample selection approach to close the gap between anchor-based and anchor-free detection [
22]. Conditional Detection Transformer (DETR), Dynamic Anchor Boxes Detection Transformer (DAB-DETR), Dynamic Denoising Query (DDQ), and Detection Transformer with Improved Denoising Anchor Boxes (DINO) models, proposed by Meng et al., Liu et al., Zhang et al., and Zhang et al., respectively, employ conditional detection strategies, dynamic anchor boxes, distinct and dense queries, and detection utilizing enhanced anchor boxes, respectively [
23,
24,
25,
26]. The Fully Convolutional One-Stage Object Detection (FCO) model, proposed by Tian et al., uses a fully CNN architecture for single-stage object detection [
27].
It is essential to leverage AI methods in the agricultural sector to address challenges, such as optimizing harvesting times, minimizing post-harvest costs, and reducing food waste. This can contribute to the field of precision agriculture by developing intelligent systems that automatically detect the quality of fruits and vegetables. The research aims to create a novel DL approach for precision agriculture by detecting the quality of fruits and vegetables on an unripe, ripe, and overripe scale using object detection models. MMDetection open-source DL-based models are implemented, utilizing a crafted and curated dataset comprising 39 distinct quality classes derived from images sourced from the network and containing the necessary characteristics to predict the quality status for use in precision agriculture, focusing on detecting quality in fruits and vegetables.
Twelve distinct models were trained and compared to identify the most effective model through performance evaluation over loss, mAP, confusion matrix, ROC curve, and AUC curve. The DINO and DDQ models achieved a mAP of 0.65, a loss of 1.8 and 1.9, and AUC scores of 0.89 and 0.95, respectively. The findings indicate that both models are the most suitable from the MMDetection framework for quality detection in fruits and vegetables. This research contributes to the state-of-the-art by systematically benchmarking contemporary object detection models for agricultural quality assessment and demonstrating the applicability of advanced DL-based architectures in practical farm scenarios.
2. Materials and Methods
This section outlines the methodology employed to implement object detection models for quality identification in fruits and vegetables using MMDetection-based frameworks. Additionally, it details the dataset used, the data preprocessing techniques, the model architectures applied, the training process, and the evaluation metrics used.
2.1. Context of Study
The objective of this study is to assess the quality of fruits and vegetables by implementing DL-based object detection models. In this instance, twelve distinct models from the MMDetection framework were trained, each with a unique architectural configuration.
In the contemporary context, procuring quality in fruits and vegetables assumes paramount importance due to the substantial levels of wastage that prevail. Consequently, these models are designed to function as instruments or mechanisms that facilitate the preservation of fresh food.
The methodology, delineated in
Figure 1, begins with the aggregation of a dataset from internet images. Following this, the data undergoes a preprocessing or cleaning procedure, aimed at making it suitable for use as input for the training models. Subsequently, the models are evaluated using evaluation metrics employed in object detection algorithms. Ultimately, the results are obtained and can be visualized through data inference.
As illustrated in
Figure 1, the proposed methodology consists of five distinct steps, starting with the dataset, which includes images of fruits and vegetables, some of which are unripe, ripe, or overripe. After collecting the dataset, it undergoes preprocessing, meaning it is cleansed of images that do not address the problem, are in a different format, or are corrupted. The third stage of the process involves training the models, which total 12. In this case, the dataset was prepared and integrated as input for the learning process. The trained models are of the MMDetection type, which is an open-source library containing all the models tested in the case study.
The evaluation of the models occurs in the penultimate step, after the training process has been completed. This evaluation utilizes metrics that are most employed in the literature for object detection. Finally, the models undergo an inference process, where an image is presented and the model is tasked with identifying the objects within the image. In this instance, the objects consist of the three quality states of fruits and vegetables.
2.2. Dataset
Any model in ML or DL requires data as input to perform the generalization achieved through training on that data. In this case, image data were used. The dataset was created and collected with images included in the network that have the necessary characteristics to predict the quality status of fruits and vegetables. The search was conducted based on the needs of the problem at hand.
The dataset consists of 39 classes and a total of 1535 images. Ripe quality stage can only be detected in the classes of garlic, eggplant, beetroot, pepper, cauliflower, corn, Spinach, jalapeño, kiwi, lettuce, morron, cucumber, pear, pineapple, radish, cabbage, watermelon, and grape. For the remaining classes, multiple quality detections can be observed.
Table 1 and
Table 2 present the fruit and vegetable classes that exhibit multiple quality detections, along with their respective qualities.
2.3. Data Preprocessing
The preprocessing stage is critical and fundamental for the algorithm to train properly and, in turn, obtain good results. The process entails the cleaning, transformation, and normalization of the input data prior to their utilization in a learning model. The objective of this initiative is to enhance the quality of the data and ensure their suitability for utilization.
Labeling the images is necessary to train an object detection model. In other words, for each image, a set of coordinates must define the exact location of the object(s) within the image. The labeling process can be performed semi-automatically or manually by using specialized algorithms. In this case study, we will proceed with manual labeling using a specialized and freely available software program called LabelImg 1.8.6. The software utilizes Python 3.7, which facilitates the acquisition of labels in the desired format, depending on the specific requirements of the algorithm used. In this case, the algorithm under consideration is MMDetection.
The labeling process, when performed manually, can be considered time-consuming. However, this method offers the possibility of achieving greater precision in labeling images. It is important to emphasize that this process should be conducted image by image, with meticulous attention paid to identifying and labeling each object of interest.
In the manual labeling process, the visual characteristics of fruits and vegetables, such as color, texture, shape, size, and defects, were considered. Based on these characteristics, freshness or quality can be categorized as unripe, ripe, or overripe. Labeling considerations were aligned with the standards that humans commonly use to assess the qualities of fruits and vegetables. Annotation protocols are highly customized to suit the application, utilizing widely accepted quality indicators and expert domain knowledge to ensure effective grading in DL models [
1].
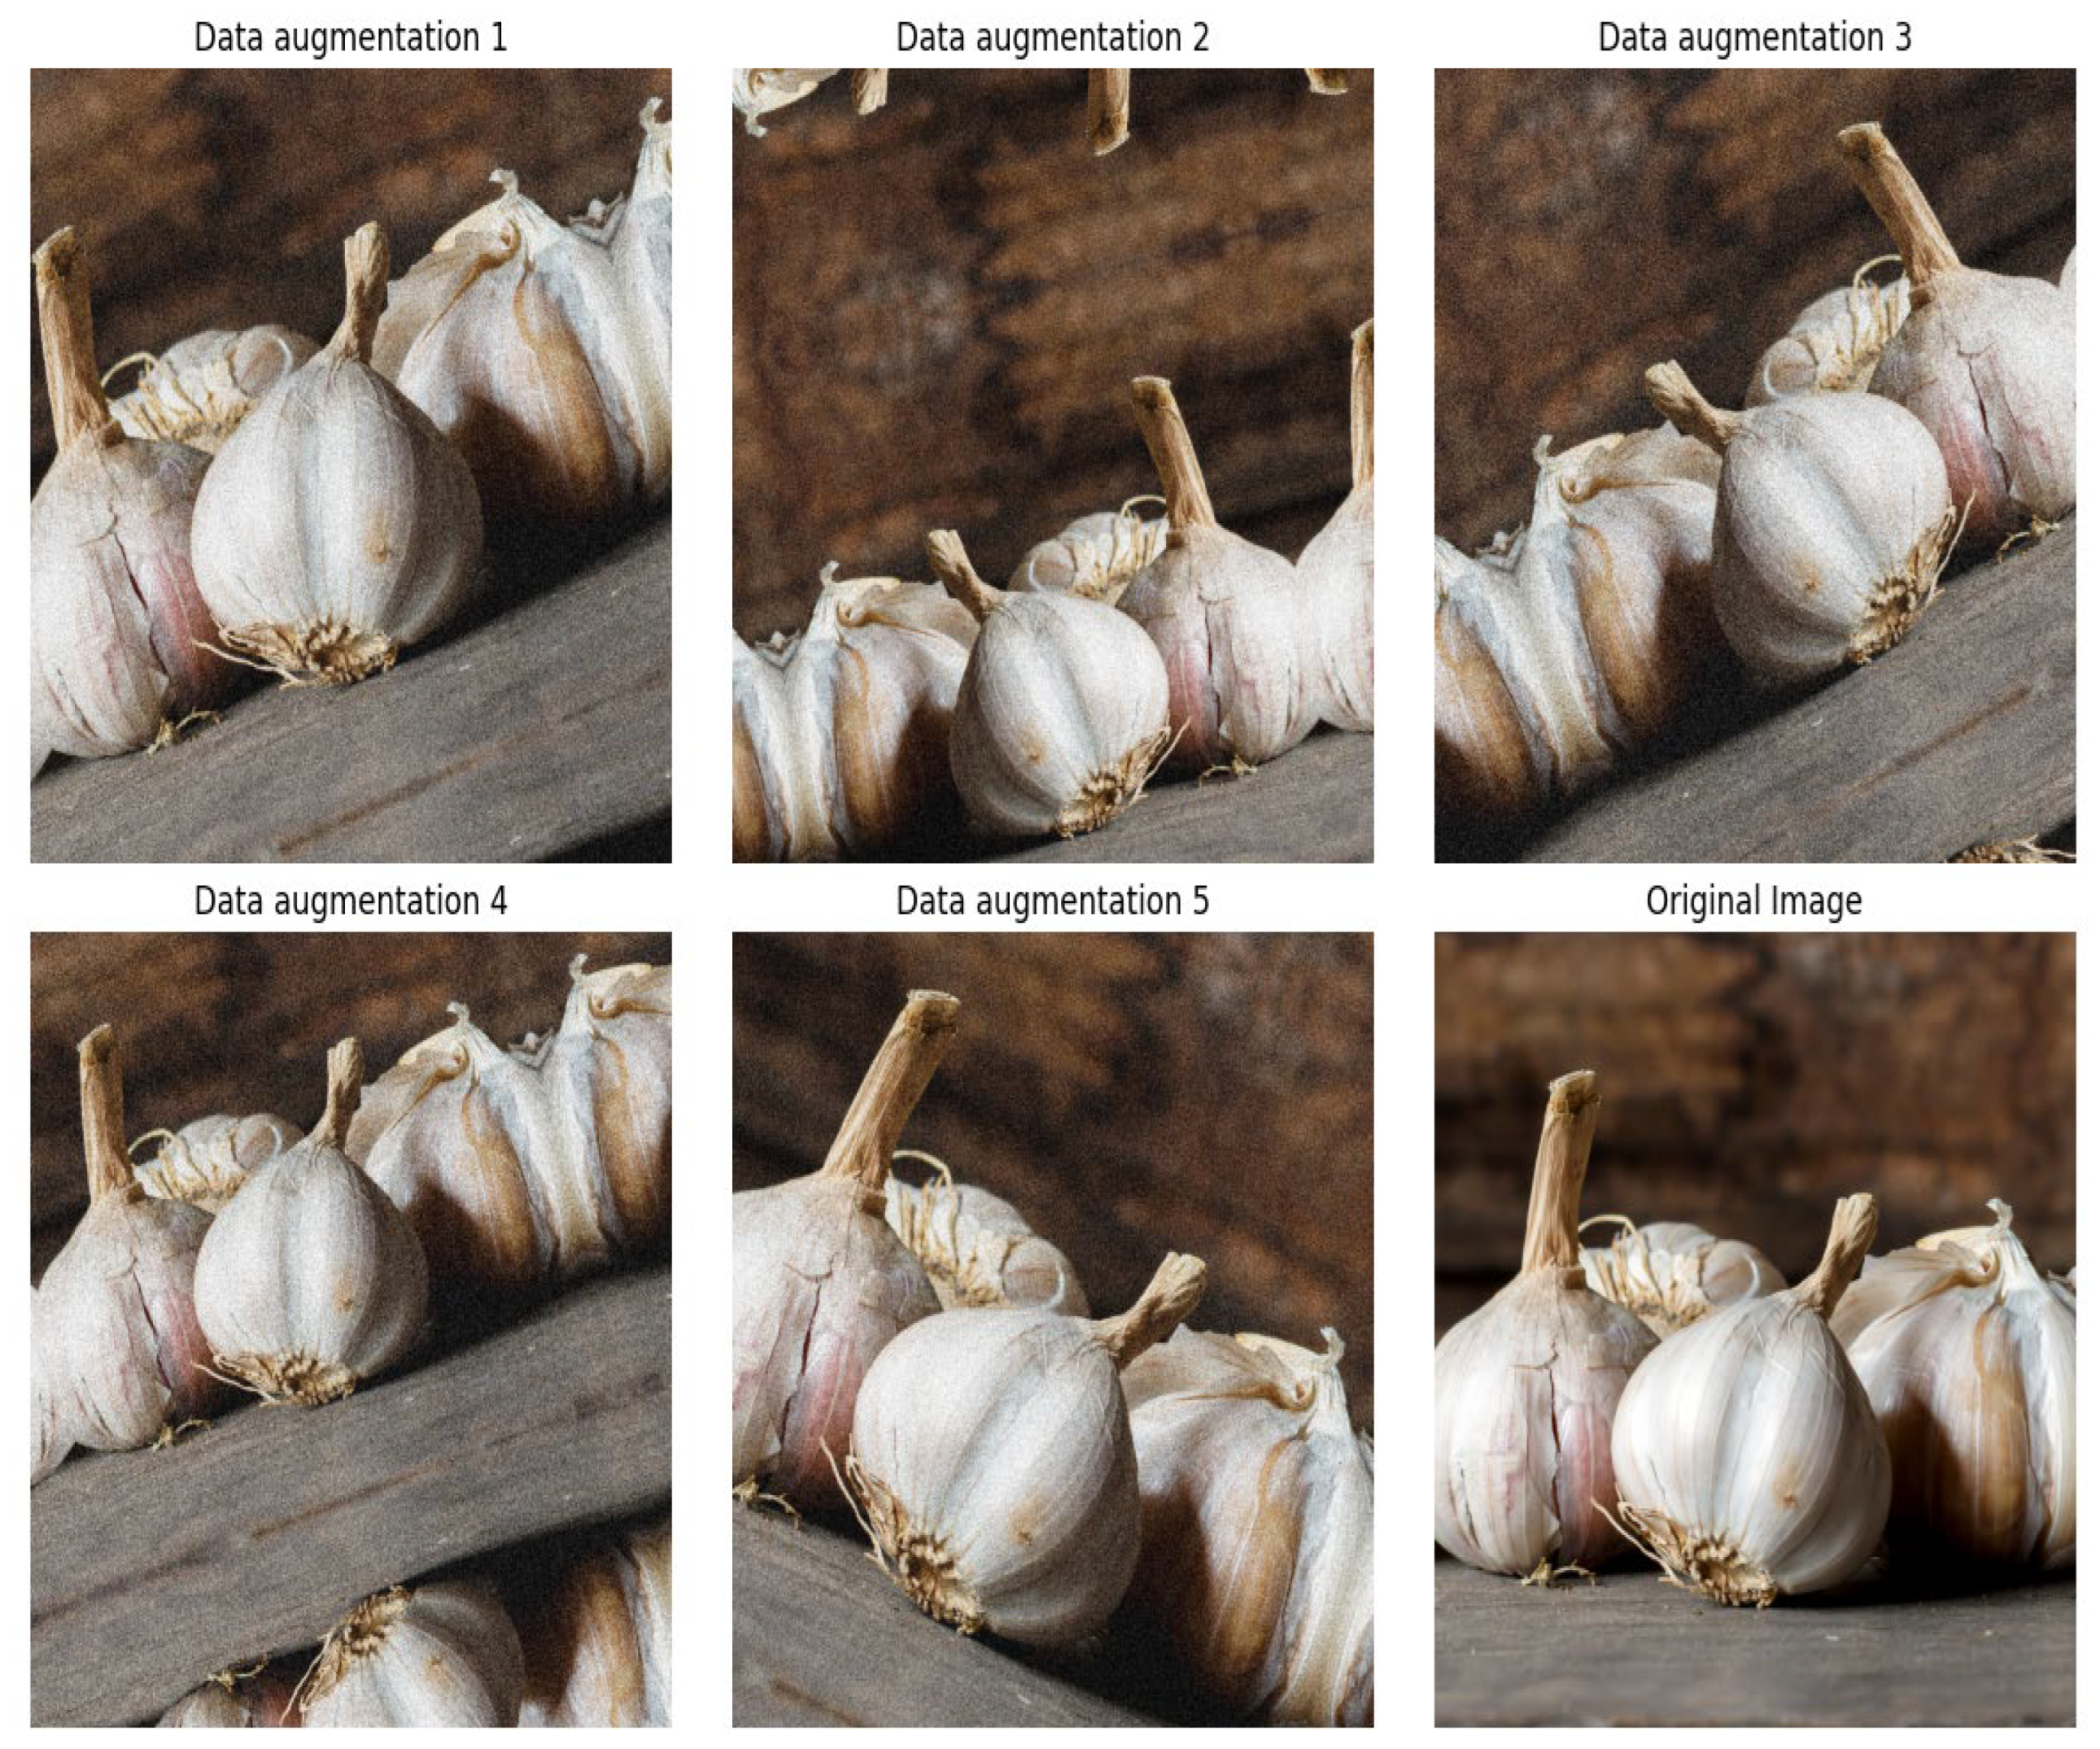
Additionally, to enhance the model’s generalization capability and compensate for the limited number of images per class, a diverse set of data augmentation techniques was applied during the preprocessing stage. Data augmentation included techniques such as transformations, including random rotation between −15° and 15°, horizontal flipping with a probability of 50%, random scaling between 80% and 120%, brightness and contrast adjustments with variation limits of ±20%, saturation adjustment in a range from 50% to 150%, and color perturbations in the HSV color space. These augmentations were complemented by random resizing with a ratio range from 0.1 to 2.0, random cropping to 512 × 512 pixels, and padding where necessary to maintain consistent input dimensions. These operations were carefully selected to preserve the semantic integrity of the objects in the images, avoiding distortions that could hinder correct identification during training. Data augmentation was applied exclusively to the training set and was handled automatically during the data loading process within the MMDetection framework, as illustrated in
Figure 2.
The data augmentations consisted of random rotation, horizontal flipping, scaling, translation, and the addition of Gaussian noise. These transformations were implemented to maintain object semantics while enhancing variability in the training data.
2.4. Training and Model’s Architecture
The dataset was divided into three subsets, with approximate proportions of 75% for training, 15% for validation, and 10% for testing, resulting in a total of 1535 images. This division yielded 1149 images for training, 229 for validation, and 157 for testing. While these figures do not reflect the exact percentages due to rounding to whole images, they remain close to the intended proportions. Each training class consisted of approximately 30 images, except for the corn class, which included only 15 images due to limited availability. For the validation and testing sets, each class was represented by 9 to 10 images, ensuring a balanced and consistent distribution for evaluation purposes. It is of paramount importance to emphasize that the data utilized for training, validation, and testing were randomly selected to mitigate information biases in the model’s generalization process. Furthermore, both the validation and test datasets are data that the model does not employ during training, thereby preventing overfitting.
The following models for object detection were implemented to assess the quality of fruits and vegetables: RTMDet, RetinaNet, DDOD, TOOD, VarifocalNet, PAA, ATSS, Conditional DETR, DAB-DETR, DDQ, DETR, DINO, and FCO. As illustrated in
Table 3, the models under discussion are outlined in terms of their respective architectural typologies and salient characteristics.
As shown in
Table 3, there are two categories of architecture: single-stage and transformer-based. The first type is characterized by predefined anchor boxes and CNNs. The purpose of these anchor boxes is to predict classes and bounding box offsets using dense anchor grids. The architecture under consideration employs a multi-scale FPN and non-maximum suppression (NMS) to filter out duplicates. This approach aims to prioritize two factors: processing speed and system simplicity. Conversely, the transformer-based topology replaces anchors and CNNs with attention mechanisms to predict objects end-to-end without the need for anchors or NMS.
The hyperparameters considered during model training are shown in
Table 4. It is important to note that the training configuration may vary depending on the model and the specific problem being addressed. In this instance, a standard configuration was utilized for all models.
All training and testing procedures were conducted on a workstation equipped with an AMD Ryzen 5 5600G processor (12 threads), 48 GB of RAM, an NVIDIA RTX A4000 GPU, and 1 TB of storage capacity.
2.5. Evaluation Metrics
Each training process of a learning algorithm must undergo rigorous evaluation to ensure the efficacy of the algorithm’s performance. It is important to note that this process is iterative, continuing until enhanced performance is achieved. In the context of object detection models, two metrics are conventionally used for evaluation purposes: loss and mAP. The loss function measures the model’s efficacy in predicting the bounding boxes and classes during the training process. The mAP is a standard metric in object detection that assesses the accuracy and recall of all classes.
The calculation of mAP involves four distinct steps. First, an IoU threshold is applied to determine whether a predicted bounding box is a true positive (TP) by measuring its overlap with a ground-truth box. Then, a precision–recall curve is generated for each class by varying confidence thresholds, illustrating how precision balances correctness and recall measures completeness. Thirdly, the average precision (AP) is computed as the area under the precision–recall curve. Finally, the mAP is derived by averaging the AP values across all classes, providing a measure of detection accuracy. Equations (1)–(5) show the precision, recall, IoU, AP, and mAP formulas, respectively.
TP, TN, FP, and FN denote true positive, true negative, false positive, and false negative, respectively.
There are also two additional graphical tools for evaluating the performance of DL models, namely the confusion matrix and the ROC curve, which is assessed by the area under the curve (AUC). The confusion matrix visualizes the accuracy of a model’s performance compared to the actual true values in the classification task. It provides a breakdown of correct and incorrect predictions across all classes as columns, and vice versa. This detailed information offers deeper insights into where the model is succeeding, failing, or confusing.
The ROC curve is used to evaluate performance across all possible classification thresholds by plotting sensitivity against the false positive rate (FPR). A curve that turns towards the top-left corner indicates high performance, representing a high true positive rate (TPR) with a low false positive rate (FPR). The area under the curve (AUC) is a metric that provides a measurable assessment of the overall performance depicted by the entire receiver operating characteristic (ROC) curve. This metric indicates the likelihood that the classifier will rank a randomly chosen positive instance higher than a randomly chosen negative instance, thereby gauging the model’s ability to differentiate between positive and negative classes across all thresholds; the AUC is used to evaluate classifier performance. When the AUC reaches 1, it indicates that the classifier is highly effective at distinguishing between classes. Conversely, an AUC of 0.5 suggests that the classifier’s performance is indistinguishable from random chance.
3. Results
This section presents the results obtained after training the object detection models. The reported metrics include loss, ROC curve, AUC, confusion matrices, and mAP, which is the average precision over a range of 0.5 to 0.95. The mAP metric is calculated by averaging the AP values at each step of 0.5. The loss and mAP metrics are displayed throughout the training process, which spans 10,000 iterations for loss and 200 epochs for mAP.
Table 5 provides a comprehensive summary of the evaluation results for the object detection models used in the dataset, focused on assessing the freshness quality of fruits and vegetables. This table enables a comparative analysis of each model’s performance, showcasing the metrics of loss and mAP.
The DDQ and DINO models excel in achieving the highest mAP value of 0.65. Notably, both models demonstrated successful convergence during training, as evidenced by their loss values of 1.8 and 1.9, respectively. These outcomes indicate that the architecture and training processes of these models effectively produce high-quality classifications of fruits and vegetables.
Other models, such as RTMDet, Conditional DETR, and PAA, achieved similar results in terms of mAP, with values of 0.61, 0.61, and 0.6, respectively. These models also displayed reasonable loss values, indicating adequate convergence during training.
On the other hand, the DAB-DETR model achieved a significantly lower mAP result, with a value of 0.23. Furthermore, this model exhibited a very high loss value, indicating a deficiency in adequate convergence during training. This implies that the architecture or training process of this model may require adjustments.
To corroborate the correct training of the models,
Figure 3 and
Figure 4 present the plots of the mAP and loss metrics obtained during the training of the twelve MMDetection-type models.
Figure 3 illustrates the mAP curves for each of the twelve models, thereby facilitating the assessment of performance in terms of accuracy. The epochs range from 0 to 200, and an upward trend is evident throughout the training. Except for the DAB-DETR model, all other models have values above 0.5, indicating their general applicability.
Transformer-based models, exemplified by DINO and DDQ, exhibit superior performance by leveraging global context and dynamic box refinement. However, these models require extensive training to surpass CNN-based models such as RetinaNet and FCOS. The latter show rapid early convergence due to their anchor-free designs, yet they plateau earlier.
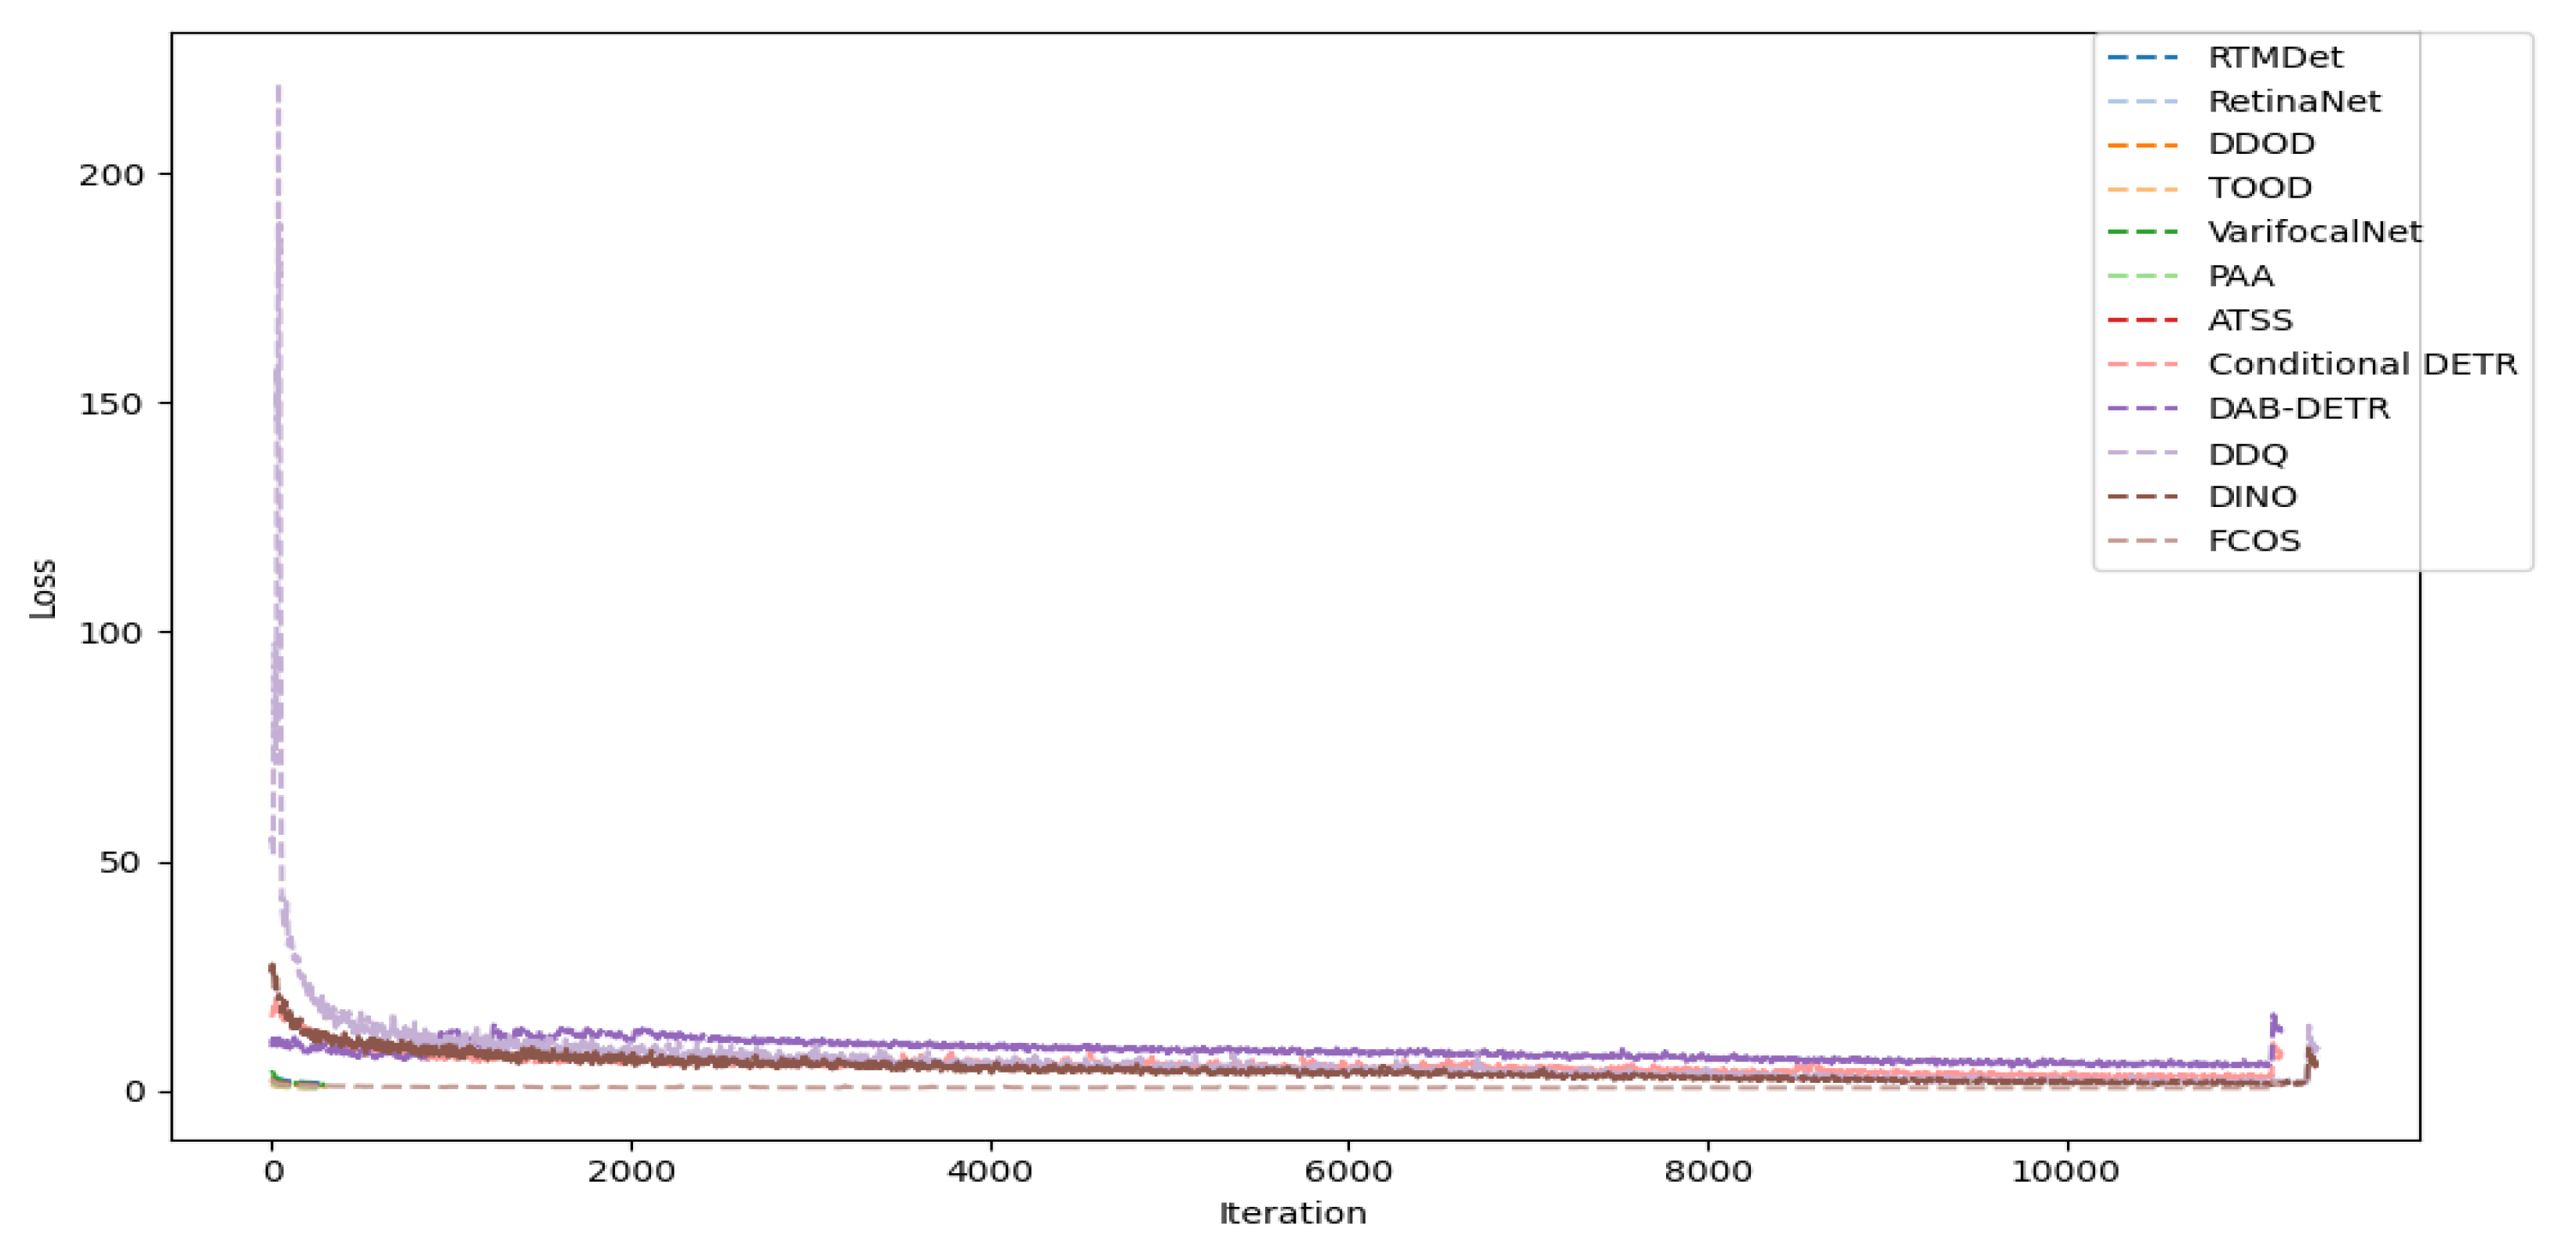
Figure 4 shows the loss curves for each of the twelve models, enabling the visualization of the evolution of the loss metric throughout the training process. As the iterations progress, a decrease in loss is observable, consistent with the hypothesis that the trend should decrease with more iterations.
The results highlight CNN’s emphasis on rapid early optimization and its tendency to reach saturation quickly. In contrast, transformer-based models demonstrate proficiency in sustained refinement, achieving lower final loss, though at the expense of an extended training process. This finding is consistent with their mAP performance, where lower loss is associated with higher accuracy, highlighting the trade-off between training efficiency and model capacity.
In addition to loss and mAP, the ROC curve, presented in
Figure 5, is a graphical tool that evaluates a model’s ability to distinguish between classes by representing the relationship between the true positive rate and the false positive rate. The ROC curves of the best-performing models, according to their training value, DDQ, and DINO, as measured by the AUC, are presented below.
A macro-average AUC above 0.5 is shown on the ROC curves presented in
Figure 5, indicating acceptable performance for both models. The obtained values demonstrate that both models can differentiate between the classes across the classification thresholds. Both models exhibit high TPR at FPR, as indicated by the proximity of their curves to the top-left corner, reflecting robust precision–recall trade-offs. The AUC of DDQ, with a value of 0.95, positions the model as being competitively effective.
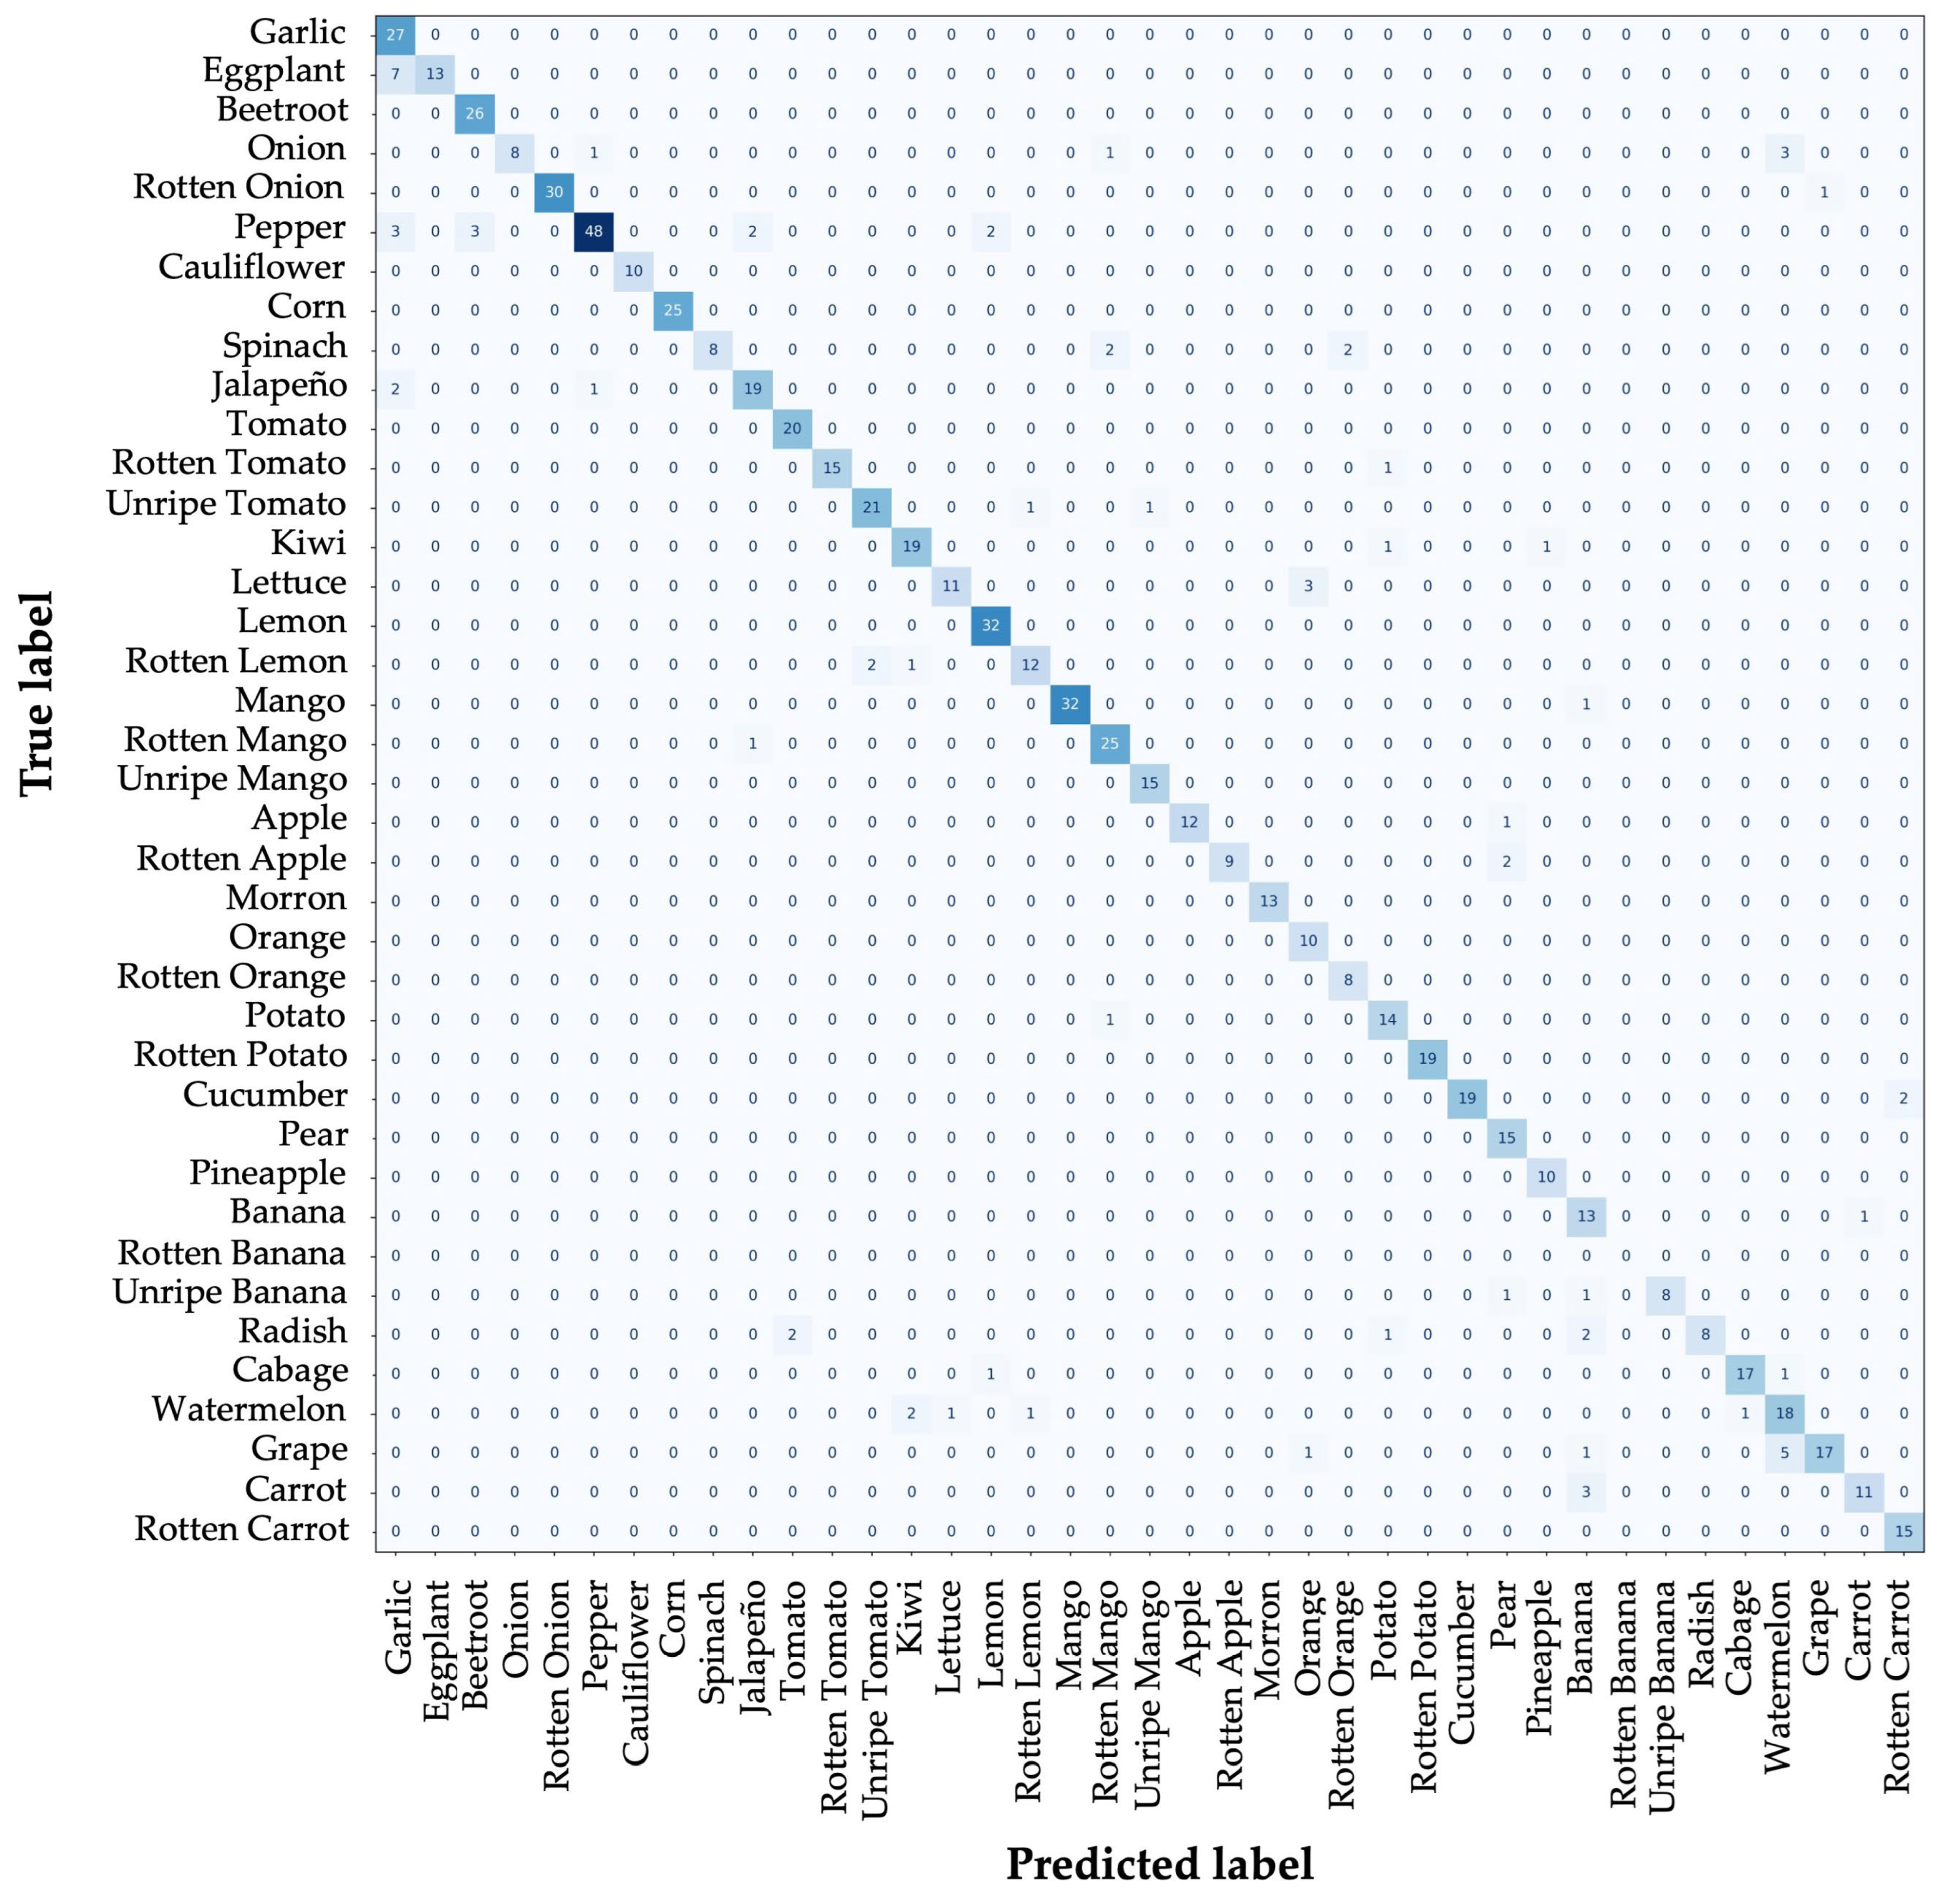
Confusion matrices are valuable visual metrics for evaluation, as they facilitate the understanding of the model’s classification of each class. As illustrated in the following figures, the confusion matrices of the two models that demonstrated superior performance are presented.
Figure 6 presents the confusion matrix of the DINO model, while
Figure 7 displays the confusion matrix for the DDQ model.
As shown in
Figure 6, the DINO model excels in classification tasks and is capable of recognizing various classes. However, the model has room for improvement, particularly in distinguishing between visually similar classes such as onion, morron, pear, and grape.
In
Figure 7, the confusion matrix of the DDQ model is shown. It is very close to perfectly classifying all classes, but it also has areas for improvement. The classes that get confused by the model are eggplant and grape, with the highest rate of incorrect classification.
A comparison of the confusion matrices of the DINO and DDQ models reveals that DDQ performs better in the classification task, achieving an 81% success rate compared to DINO’s 67%. This finding confirms that the DDQ model has the best capacity to distinguish between classes.
Inferences were made using images extracted from the network that the model had not previously encountered during the training process. Making predictions with this data results in an adequate evaluation since if the model were tested with the data it used for generalization, it would most likely obtain accurate results in all cases.
Making predictions with the trained models is part of verifying results, i.e., the possibility of real validation. This process is called data-driven inference and is an effective methodology for checking that the model makes predictions adequately.
In this particular case, inference using the DDQ model was conducted, as it demonstrates a greater ability to detect all classes in the AUC metric, reaching a value of 0.95, while the DINO model showed values of 0.89.
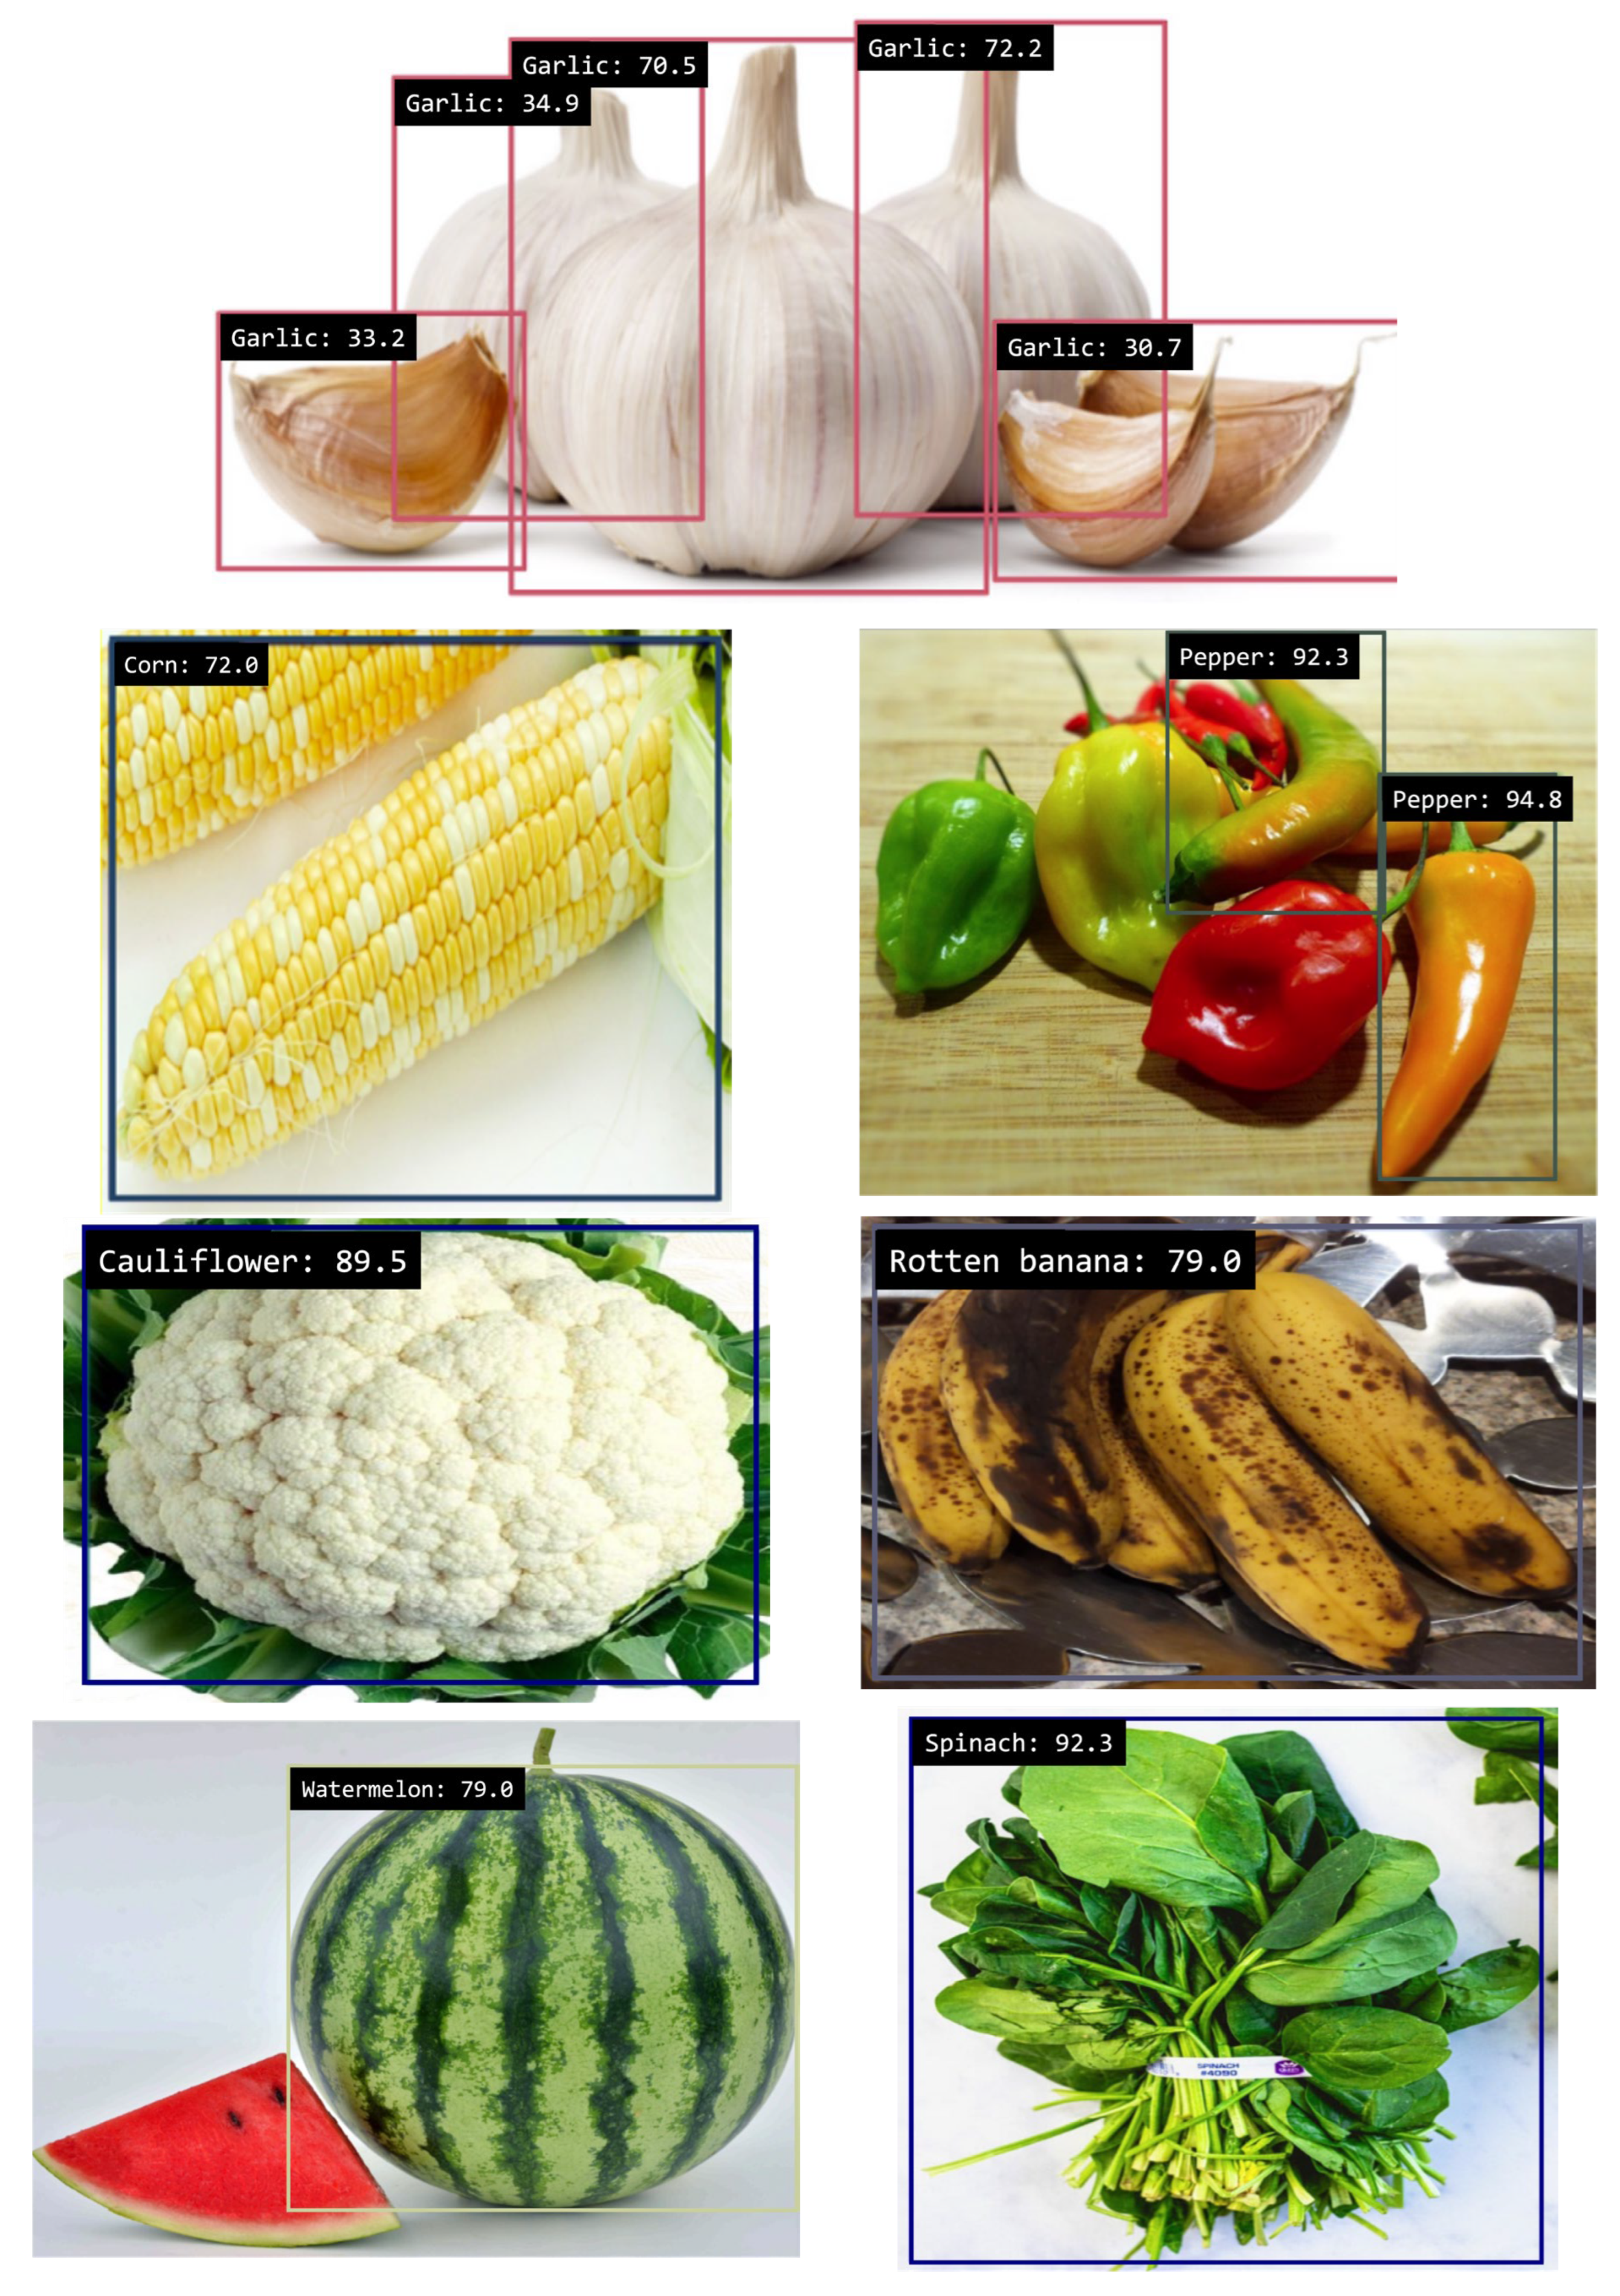
The results of the inferences drawn from the DDQ model are presented in
Figure 8.
In
Figure 8, seven data inferences made with the trained DDQ model are presented. Upon analyzing each inference, the model demonstrates its ability to accurately predict fruits, vegetables, and their respective qualities. The box frames the detection performed, and the top left corner indicates the class and the model’s reliability. This latter metric is an interpretation generated by the model, representing its confidence in determining the prediction class. Additionally, it is evident that the model effectively distinguishes the classes it was tested on, correctly predicting garlic, corn, pepper, cauliflower, rotten banana, watermelon, and spinach. As previously discussed, the prediction lacking a quality label signifies that the detected quality is ripe.
4. Discussion
The findings of this study align with contemporary research in the field of quality detection in fruits and vegetables, emphasizing the importance of employing deep learning methodologies and object detection techniques to enhance the accuracy and efficiency of food product quality assessment. The study supports the efficacy of the DDQ and DINO object detection models, which have demonstrated substantial potential in the field of freshness detection.
The model’s mAP score of 0.65 is comparable to other studies that have employed deep learning techniques for fruit and vegetable quality detection.
Table 6 presents a comparative analysis of research employing object detection models for the quality assessment of fruits and vegetables.
For instance, Mukhiddinov et al. achieved similar performance levels but were limited to a smaller set of 10 fruit and vegetable classes [
6]. In contrast, our approach effectively handles 39 distinct classes, representing a broader and more complex visual domain. This difference in class diversity underscores the robustness and scalability of the models used compared to existing approaches.
However, it is crucial to acknowledge that the number of training iterations can influence model performance, and an excessive number may lead to overfitting. Additionally, one limitation of this study is the limited diversity of fruit and vegetable types included in the training dataset. While the models demonstrated relatively stable performance within the available classes, image-level variations such as differences in color, shape, lighting, and surface texture can significantly affect the generalizability of the results.
This highlights the need for future work to incorporate a more diverse and extensive dataset that encompasses a wider range of fruit types, growth conditions, and presentation formats. Additionally, targeted model fine-tuning and the inclusion of domain adaptation techniques could help address intra-class variability and enhance practical performance metrics.
According to the literature, the achieved metric mAP level varies depending on the application context. For object detection models in natural images, a mAP of approximately 65% is desirable. In remote sensing tasks, the acceptable mAP is around 60%. However, lightweight or quantized models, as well as those applied to challenging scenarios involving occlusion or mobile inference, may have a lower acceptable mAP within the range of 30% to 50%. In this case study, all three scenarios apply, with remote sensing utilizing actual or natural imagery for precision agriculture. This verification demonstrates that the results obtained in this research are acceptable [
32,
33,
34,
35,
36,
37,
38,
39].
In this context, the results of our study indicate that implementing object detection models such as DDQ and DINO could substantially impact the quality monitoring of agricultural products. This would enable more accurate and efficient freshness detection, thereby reducing food waste. Moreover, integrating these techniques with other technologies, such as computer vision and robotics, has the potential to create new opportunities for automating and optimizing quality assessment processes. This research contributes to the development of intelligent solutions for monitoring the quality of agricultural products.
5. Conclusions
The use of object detection models for evaluating the quality of fruits and vegetables demonstrates clear advantages over traditional methods, which are often time-consuming and prone to human error, leading to inconsistent quality assessments. In contrast, deep learning-based object detection models significantly enhance speed, accuracy, efficiency, and the detection of fine-grained visual features critical for assessing product freshness.
This study employed a curated dataset of 39 fruit and vegetable classes to train and evaluate multiple object detection architectures over 200 training iterations. The DDQ and DINO models achieved impressive results, with a mAP of 0.65, outperforming the traditional YOLOv3 and YOLOv4 models. Beyond mAP, their classification reliability was confirmed through ROC curve analysis, with the DDQ model obtaining an AUC of 0.95 and the DINO model an AUC of 0.89, indicating robust discriminative performance in quality classification tasks.
The use of 200 training iterations provided a good balance between model accuracy and training stability; however, it also emphasized the need to carefully monitor for overfitting, as performance gains may diminish with excessive iterations. Moreover, the limited diversity of the dataset, particularly regarding fruit types, growing conditions, and image variability, presents a constraint on the model’s generalizability to real-world applications.
The potential application of this research lies in developing intelligent monitoring systems for real-world agriculture. By integrating these systems into harvesting and post-harvesting tools and machines, precision agriculture can be improved, helping address food waste issues and promoting sustainable food production practices.
Future research should prioritize expanding the dataset’s scope and visual diversity by incorporating a broader range of environmental conditions and presentation formats. Additionally, integrating domain adaptation and targeted fine-tuning techniques could enhance the models’ ability to generalize across various contexts. Overall, this research contributes to the development of intelligent, scalable solutions for quality monitoring of agricultural products and provides a solid foundation for future advancements in precision agriculture technologies.


 ,
, 


