Article

Optimizing Cotton Irrigation Strategies in Arid Regions Under Water–Salt–Nitrogen Interactions and Projected Climate Impacts

1
College of Water Conservancy & Architectural Engineering, Shihezi University, Shihezi 832000, China
2
Key Laboratory of Modern Water-Saving Irrigation of Xinjiang Production & Construction Group, Shihezi University, Shihezi 832000, China
3
Yangtze River Water Resources Commission Yangtze River Three Gorges Hydrology and Water Resources Survey, Yichang 443000, China
4
College of Hydraulic and Civil Engineering, Xinjiang Agricultural University, Urumqi 830052, China
*
Author to whom correspondence should be addressed.
These authors contributed equally to this work.
Agronomy 2025, 15(6), 1305; https://doi.org/10.3390/agronomy15061305
Submission received: 19 April 2025 / Revised: 19 May 2025 / Accepted: 22 May 2025 / Published: 27 May 2025

Abstract

:
Optimizing irrigation and nitrogen (N) management in saline soils is critical for sustainable cotton production in arid regions that have been subjected to climate change. In this study, a two-year factorial field experiment (3 salinity levels × 3 N rates × 3 irrigation quotas) is integrated with the RZWQM2 model to (1) identify water–N–salinity thresholds for cotton yield and (2) to project climate change impacts under SSP2.4-5 and SSP5.8-5 scenarios (2031–2090) in Xinjiang, China, a global cotton production hub. The results demonstrated that a moderate salinity (6 dS/m) combined with a reduced irrigation (3600 m3/hm2) and N input (210 kg/hm2) achieved a near-maximum yield (6918 kg/hm2), saving 20% more water and 33% more fertilizer compared to conventional practices. The model exhibited a robust performance (NRMSE: 5.94–12.88% for soil–crop variables) and revealed that warming shortened the cotton growing season by 1.2–9.5 days per decade. However, elevated CO2 (832 ppm by 2090) levels under SSP5.8-5 increased yields by 22.6–42.1%, offsetting heat-induced declines through enhanced water use efficiency (WUE↑27.5%) and biomass accumulation. Critically, high-salinity soils (9 dS/m) required 25% additional irrigation (4500 m3/hm2) and a full N input (315 kg/hm2) to maintain yield stability. These findings provide actionable strategies for farmers to optimize irrigation schedules and nitrogen application, balancing water conservation with yield stability in saline-affected arid agroecosystems that have been subjected to climate change.

1. Introduction

As a typical arid oasis agricultural core area, Xinjiang, China, plays a pivotal role in the national cotton industry. According to 2023 statistics from the National Bureau of Statistics of China, its cotton output and planting area account for 85% and 91% of the national totals, respectively. However, the region has been combatting three major challenges for a long time—water scarcity, soil salinization, and nitrogen management imbalance. Water, salt, and nitrogen exhibit significant interactions in soil. Excessive irrigation leads to nitrogen loss through water migration, while high salinity inhibits soil nitrification and root nitrogen uptake [1]. Only under appropriate moisture conditions can the mineralization rate of soil organic nitrogen, as well as the nitrification rate of ammonium nitrogen, increase with soil water content, while excess salts are leached and nutrients are diffused with water movement, creating the potential for water–salt–nitrogen synergistic optimization [2]. Although studies on single-factor or two-factor (water–nitrogen and water–salt) interactions do exist, the dynamic synergistic mechanisms of the three factors under climate change remain unclear, restricting the development of precise drought-resistant and fertilizer-efficient irrigation strategies.
The high sensitivity of cotton growth to climatic conditions exacerbates these challenges [3]. Climate change alters environmental factors related to cotton growth, such as sunlight, moisture, and soil conditions, through changes in temperature and precipitation, ultimately affecting cotton phenology, growth potential, planting systems, pest control, and field management [4]. In Xinjiang, temperatures are rising at a rate of 0.32 °C per decade, shortening the cotton growing season by 1.2–9.5 days per decade [5,6], which alters water demand patterns and dry matter allocation due to advanced phenological stages. While elevated atmospheric CO2 concentrations can enhance water use efficiency by improving photosynthesis and reducing stomatal conductance [7], Na+-induced ion toxicity in high-salinity soils may offset the CO2 fertilization effect, hindering carbon allocation to reproductive organs like cotton bolls [8]. This complex interaction among climate, soil, and crops is particularly evident in typical cotton regions such as Shihezi, Xinjiang, where agricultural water use accounts for 91% (with cotton accounting for 40.12%), and the “Three Red Lines” (“Three Red Lines” refer to the ecological protection red line, permanent basic farmland line, and urban development boundary line control lines) policy requires a 21.5% reduction in total agricultural water use by 2030 (from 11.48 × 10⁸ m3 to 9.01 × 10⁸ m3), forcing a balance between water conservation and stable yields.
However, it is challenging to control all factors in field experiments evaluating climate change impacts on cotton yields. Crop models provide a key tool for analyzing multi-factor interactions, but traditional models only simulate water–salt transport unidirectionally, lacking the simulation of cotton growth processes and eCO2 effects [9,10]. The RZWQM2 model, which integrates soil–plant–climate dynamics, has demonstrated a high accuracy (NRMSE < 12%) in studies such as maize nitrogen cycling [11] and cotton water demand simulation [12]. Nevertheless, its application in arid saline cotton fields has gaps. Existing research focused on single climate factors or two-factor interactions, lacking a systematic analysis of water–salt–nitrogen–climate synergies. For example, Cheng [13] confirmed that temperature and CO2 increases can alleviate water stress in cotton using RZWQM2 but did not address responses across salinity gradients. Additionally, Amouzou [14] considered the applicability of the model and the impact of climate change on cotton yield, water use efficiency (WUE), and nitrogen use efficiency (NUE) but did not explain the influence of the combination of water, salt, and nitrogen on cotton yield. Thus, systematic research integrating water–salt–nitrogen–climate interactions is urgently needed to fill these gaps and guide sustainable cotton production in arid saline environments.
This study aimed to fill these scientific gaps by coupling a two-year field experiment with the RZWQM2 model to construct a multi-factor synergistic regulation framework for saline cotton fields in arid regions. By observing water absorption, fertilizer utilization, salt accumulation, and crop yields under different water–salt–nitrogen regulation measures, optimal irrigation and fertilization strategies for different salinity conditions will be screened. Using the calibrated and validated RZWQM2 model, future climate change and cotton growth will be predicted under SSP2.4-5 and SSP5.8-5 scenarios with 10 GCMs and eCO2. The objectives were as follows: (1) to explore the synergistic mechanisms of water–salt–nutrient in mulch drip-irrigated farmland and to simulate multiple water–salt–nitrogen gradient combinations using the validated model to determine optimal water–nitrogen regulation measures for different salinity areas; and (2) to assess climate change impacts and quantify their effects on cotton growth. This research not only provides a three-element matching scheme of “soil salinity–climate scenario–regulation strategy” for the sustainable management of arid saline farmland but also offers a cross-scale research paradigm for similar eco-regions across the world to address climate change through integrating empirical agronomy and process-based modeling.

2. Materials and Methods

2.1. Field Trial

The experimental site was located at the Key Laboratory of Modern Water-saving Irrigation at Xinjiang Production and Construction Corps, Shihezi University (44°18′ N, 86°02′ E), which has a history of cotton cultivation. As previously documented by Xu [15], this field was used for previous cotton studies. To eliminate residual effects from previous crops, the soil underwent annual salt leaching (washing) and deep plowing with a tractor before each planting season, aiming to restore baseline soil conditions and minimize carryover impacts on soil fertility, pest, or disease levels. As illustrated in Figure 1,the experimental site is located in the Manas Irrigation District, which is the sixth largest irrigation area in China (Figure 1a). The test site is located in a temperate continental climate zone, with an average annual temperature of 6 to 8 degrees Celsius, an average annual precipitation of 180 to 270 mm, and an evaporation of 1000 to 1500 mm (Figure 1c). The annual variations in measured wind speed, relative humidity, sunshine hours, and reference evapotranspiration (ET0) are shown in Supplementary Figure S1. The soil at the test site is a sandy clay loam, with a physical clay particle content (particle size < 0.01 mm) of greater than 20% and a groundwater depth of more than 15 m. The initial average mass water content of the soil layer for the experiment was approximately 11.50%, the average initial soil electrical conductivity was about 0.5 dS/m, and the average initial nitrate nitrogen content was approximately 23.03 mg/kg. Furthermore, the average initial ammonium nitrogen content was about 6.76 mg/kg (Figure 1b). Specific data are listed in Supplementary Table S2.
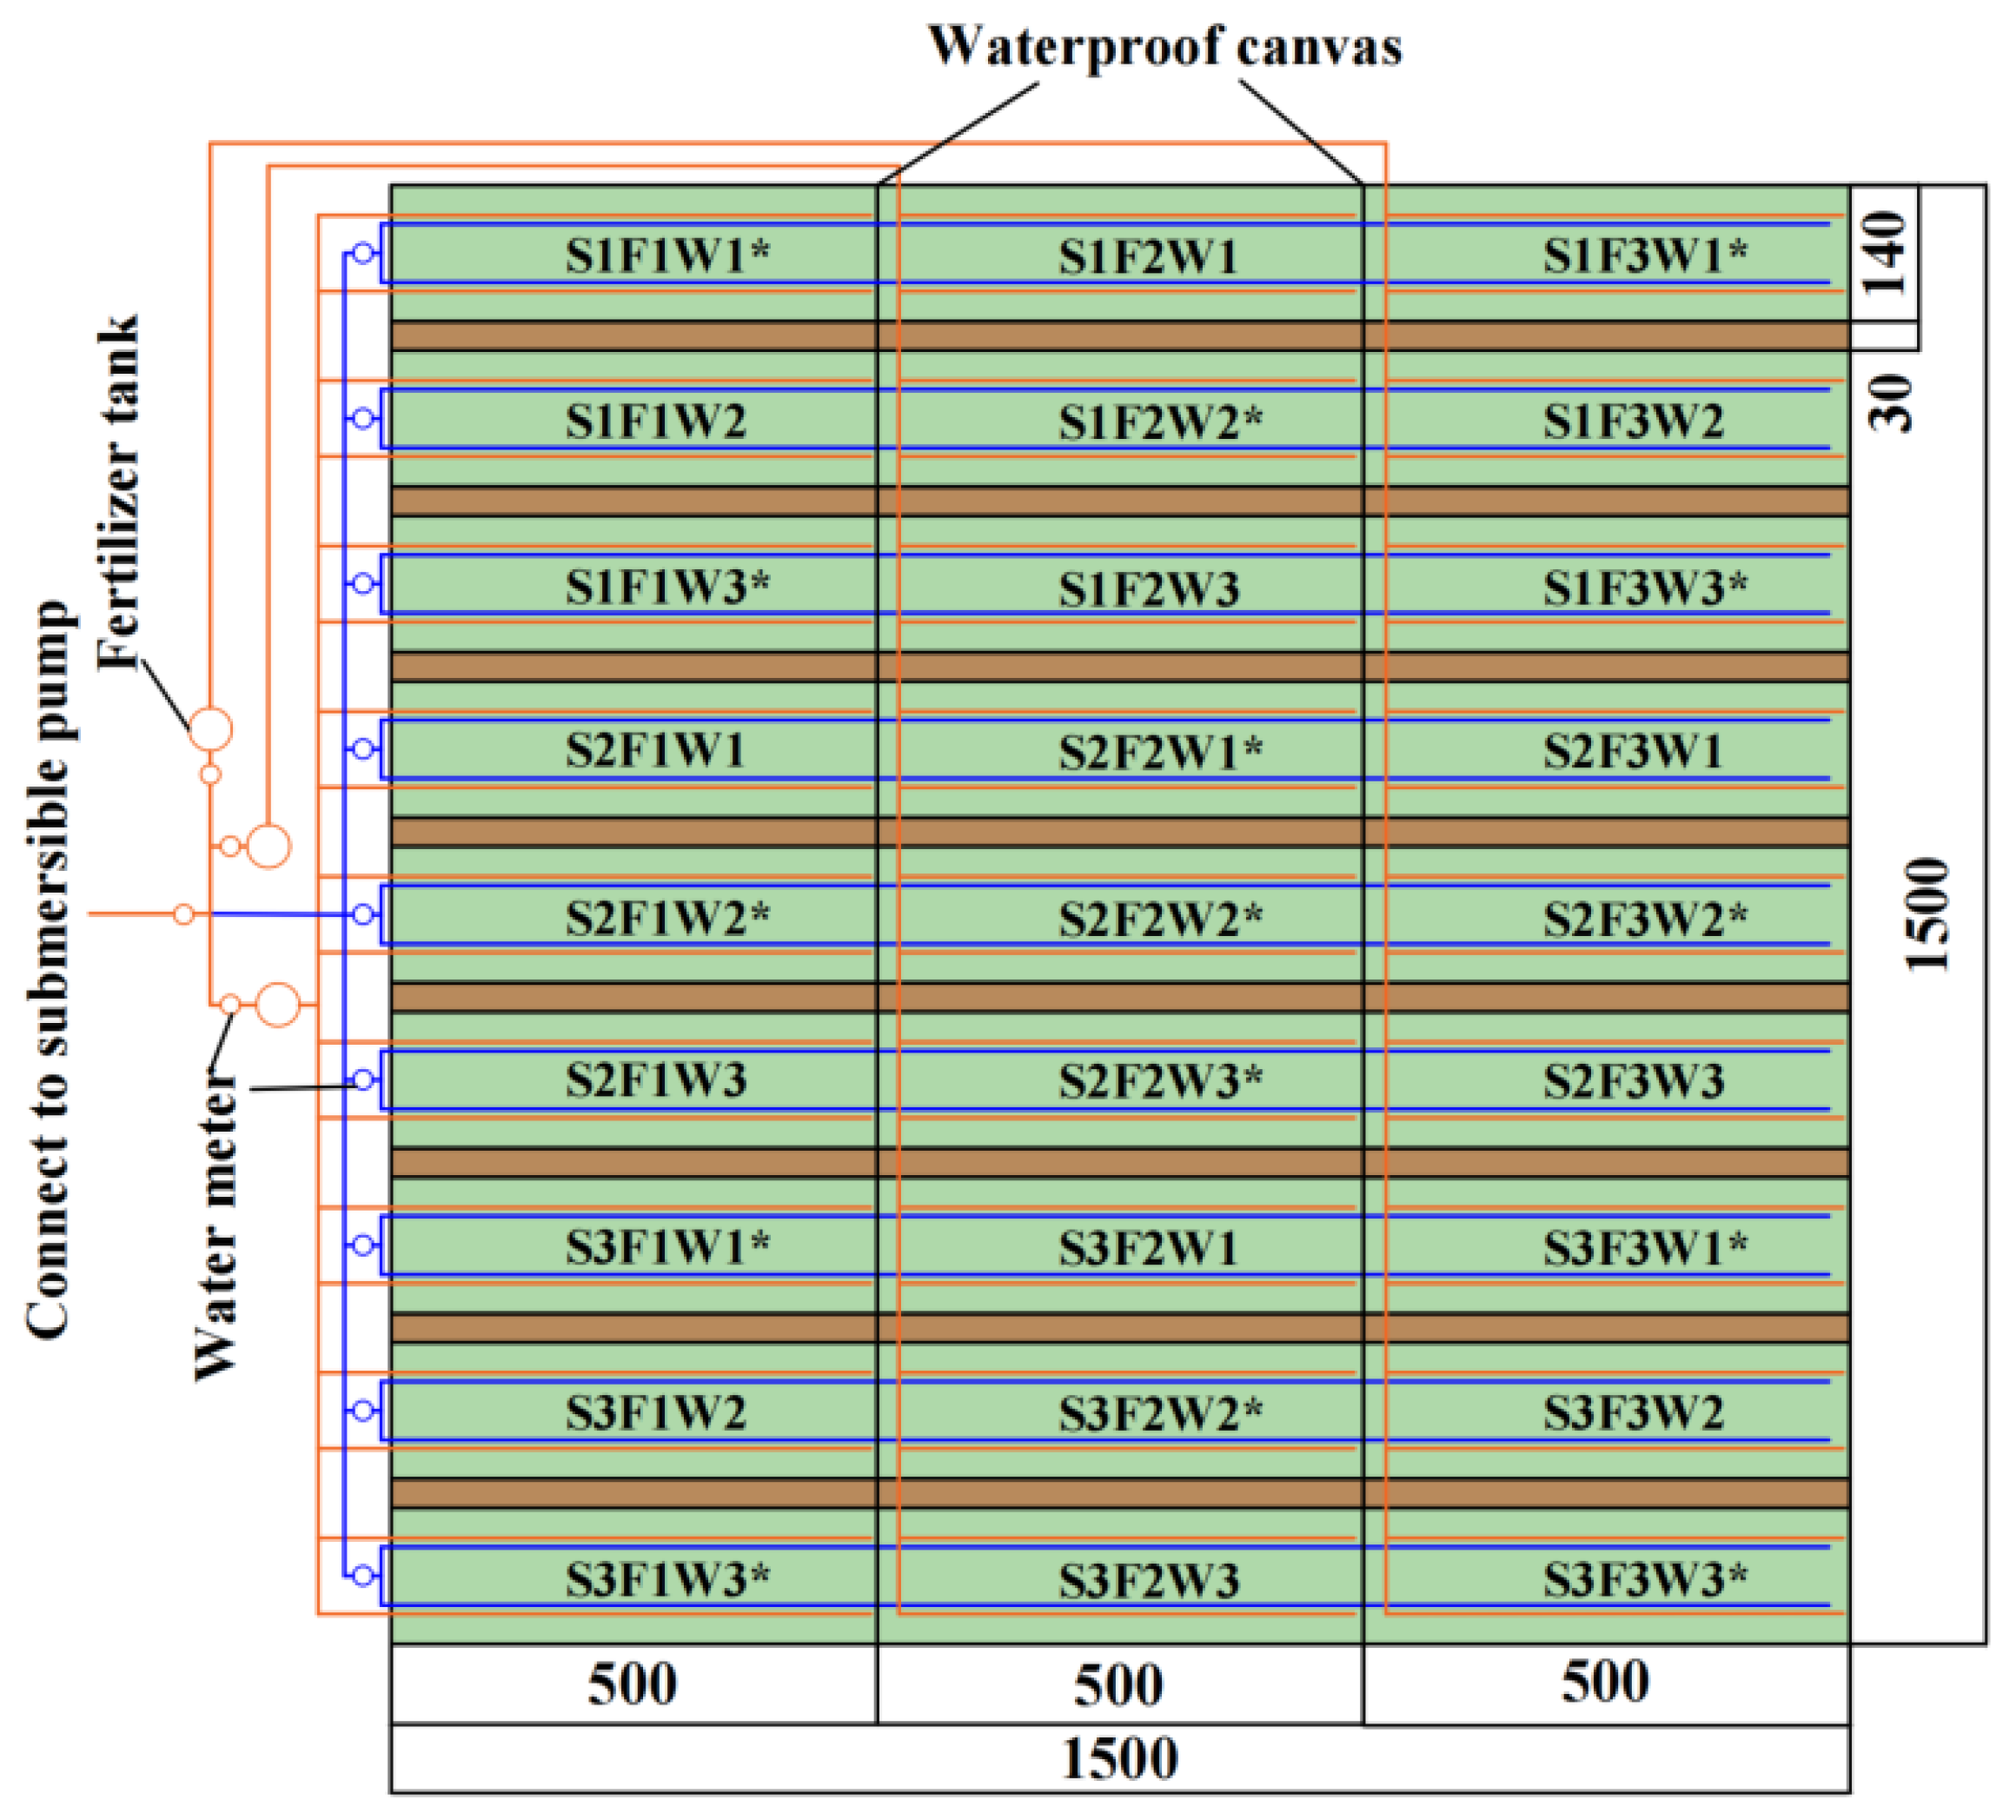
The experimental design is shown in Figure 2: (3 W(irrigation amount) levels × 3 F(nitrogen application) levels × 3 S(soil salinity) levels) = 27 plots (in 225 m2), with randomized repeated sampling performed within each plot. The selected variety for sampling is a commonly grown and representative variety of cotton—“Jinken 1442” (Xinjiang Chuchuang Gaoke Seed Industry Co., Ltd.). The experimental site was historically cultivated with continuous cotton under a subsurface drip irrigation system. Prior to this study, the plots were managed annually to reset soil conditions. Cultivation was performed using the locally adopted “one film, two tubes, four rows” subsurface drip irrigation system (Figure 2), with a 1.4 m film width, a 30 cm inter-film spacing, and a 60 cm intra-film drip line spacing. Control treatments (CK) mimicked conventional practices as follows: 3 dS/m salinity (CK1), 315 kg/hm2 nitrogen (CK2), and 4500 m3/hm2 irrigation (CK3). Based on the experience of local farmers and the results of previous studies [16], the irrigation and fertilization plan was set up. Three irrigation quotas were set as 2700 m3/hm2 (W1), 3600 m3/hm2 (W2), and 4500 m3/hm2 (CK3). The irrigation water was groundwater with an electrical conductivity of 0.80 dS/m and a pH value of 7.8; the groundwater quality met the irrigation standards and there was no pollution affecting this study (Supplementary Text S1). To control the variables, the same water source was used for all treatments. Based on the current salt content and classification of saline–alkali soil in Xinjiang [17], low-salt (3 dS/m), medium-salt (6 dS/m), and high-salt (9 dS/m) soils were selected for configuration, and they were labeled as CK1, S2, and S3, respectively. Salinity levels were maintained at target values (3, 6, and 9 dS/m) in the initial test to simulate stable field conditions, with no temporal fluctuations. The method used to adjust the soil salt content before the experiment is described in Supplementary Text S2.
Appropriate amounts of nitrogen, phosphorus, and potassium fertilizers have a significant positive effect on the physiological growth of crops, with nitrogen fertilizer being the most obvious [18]. Therefore, in this study, the same amount of phosphorus and potassium fertilizers were given to each treatment (using KH_2PO_4 for uniform fertilization, purchase from Xinjiang Zhongnong Hongyuan Agricultural Science and Technology Co., Ltd.). There were three nitrogen application rates—105 kg/hm2 (F1), 210 kg/hm2 (F2), and 315 kg/hm2 (CK2). The fertilizers were applied along with the irrigation water, and the nitrogen fertilizer was urea (Xinjiang Zhongnong Hongyuan Agricultural Science and Technology Co., Ltd.). The fertilization process was carried out 10 times throughout the entire growth period. Three irrigation quotas were set—2700 m3/hm2 (W1), 3600 m3/hm2 (W2), and 4500 m3/hm2 (CK3). Nitrogen (urea) was applied in 10 split doses at F1, F2, or CK2. The total number of irrigations carried out during the entire growth period was 11. The cotton irrigation and fertilization plan is shown in Table 1.
Hydraulic isolation between plots was ensured via 1 m deep waterproof barriers (Shihezi Henglong Plastics Industry Co., Ltd.). Trials were conducted over two growing seasons (2022: 9 May–10 October; 2023: 28 April–28 September), following regional agronomic protocols.

2.2. Data Sources

2.2.1. Site Data

The experimental station is located near the Shihezi Meteorological Station, where the observation data were recorded (1960–2014 and 2022–2023). Post-2014 data (2015–2021) were excluded due to incomplete records caused by reservoir construction in the Manas River Basin. In addition, wind speed, relative humidity, and sunshine hours measured using small- and medium-sized weather stations were used as the initial meteorological conditions for 2022–2023 model simulation. No solar radiation data were included in the collected basic meteorological data; therefore, the Angstrom formula [19] was used to calculate sunshine hours.

2.2.2. GCM Data

Ten GCMs (https://esgf-index1.ceda.ac.uk/projects/cmip6-ceda/ (accessed on 10 October 2024)) were selected to evaluate the simulation ability of meteorological data in the study area, all of which produced complete daily maximum and minimum temperature, precipitation, wind speed, relative humidity, and solar radiation data (Supplementary Tables S3 and S4). Based on the earliest year that can be predicted by the existing observational data and climate models, the period from 1960 to 2014 was taken as the base period for historical climate simulation evaluation, and representative climate scenarios SSP2-4.5 and SSP5-8.5 were selected for future periods [20]. The SSP scenarios resulted in near-term (2031–2060) and long-term (2061–2090) climates, with an eCO2 of 330 ppm for the baseline period. Under representative concentration path (RCP) 2.4-5 and 5.8-5 scenarios, eCO2 was set at 548 and 628 ppm, respectively, during the period from 2031 to 2060; correspondingly, this value was set as 631 and 832 ppm during the period from 2061 to 2090 [12].

2.3. RZWQM2 Application

The Root Zone Water Quality Model (RZWQM2 2.0) was used in this study. Data established in the initial stage included meteorological data and basic soil data, and the impact of eCO2 changes on future cotton growth was also considered. The parameters not observed during the experiment were the base values of the model. The parameter calibration of the model included the water, nutrient, and crop modules. The three modules in RZWQM2 were calibrated using the measurement data from the CK1F1W1 field experiment from 2022 to 2023, and the corresponding measured data of other treatments during the same period were verified. Due to the interaction among the components of the model, it is difficult to determine the objective function of the optimization with interdependent processes, and a high correlation leads to the “non-uniqueness” problem [21]. Using singular-value decomposition in PEST software (The built-in automatic parameter optimization program in RZWQM2) can mitigate the effects of highly correlated and insensitive parameters. Therefore, we used the PEST program of the model, as well as the trial-and-error method, for parameter calibration. The optimal cotton plant genetic parameters and soil hydraulic parameters obtained based on the above methods are shown in Table 2 and Table 3.
Three statistical test criteria were used to evaluate the simulation effect of the model, and the mean relative deviation (MRE), mean square error (RMSE), and standard mean square error (NRMSE) were used to reflect the degree of fitting between the measured and simulated values [22]. The smaller the value of the RMSE and MRE, the smaller the difference between simulated and measured values and the more accurate the simulation result of the model. According to the size of the NRMSE value, the model performance can be divided into four categories as follows: <10%, “excellent”; 10–20%, “good”; 20–30%, “medium”; and >30%, “poor”.

2.4. Test Items and Methods

2.4.1. Soil and Plant Parameter Measurements

Soil texture, bulk density, and initial nutrient content were uniformly collected and characterized prior to mulching. Soil water content (SWC), salinity, and nitrate nitrogen (NO3-N) sampling followed a cross-method protocol across 15 experimental plots (Figure 2). SWC and salinity were monitored twice per growth stage—once at 1 day before irrigation and once at 2 days after irrigation. NO3-N was measured once at each critical phenological phase (seedling, bud, flowering and bolling, and boll opening stages). Soil samples were collected beneath the drip tape (Xinjiang Tianye Water-saving Irrigation Co., Ltd.), sampled at six 10 cm depth increments (0–60 cm).
(1) Soil water content: Determined gravimetrically using a soil auger (Tianjin Xingao Weiye Technology Co., Ltd.). Fresh soil was placed into pre-weighed aluminum boxes (Tianjin Xingao Weiye Technology Co., Ltd.), recorded for wet weight, oven-dried at 105 °C for 8 h until constant weight, and reweighed to calculate mass water content.
(2) Soil salinity: Expressed as electrical conductivity (EC; dS/m). Air-dried soil samples were sieved through a 2 mm mesh, mixed with deionized water (1:5 soil-to-water ratio), equilibrated for 24 h, and filtered. The EC of the supernatant was measured using a conductivity meter (DDS-11A Conductivity Meter.).
(3) Nitrate nitrogen: Quantified via ultraviolet spectrophotometry at 210 nm and 275 nm following standard protocols.
(4) Water use efficiency (WUE): Calculated by dividing the seed cotton yield by seasonal crop evapotranspiration (ETa), where ETa was derived from the RZWQM2 model outputs.
(5) Soil hydraulic parameters: The saturated hydraulic conductivity of soil was determined using the ring knife method combined with laboratory permeability tests; the field capacity was measured using the ring knife method; and the wilting point was determined using the oven drying method, respectively. Detailed procedures are provided in Supplementary Text S3.

2.4.2. Effective Accumulated Temperature and Compensation Coefficient

Since the film covering the RZWQM2 model was not perfect, the effective accumulated temperature method was used to simulate the temperature reached by cotton during film-coated growth [23]. The calculation formula is as follows:
T a c = Σ n 1 n = i T T b
where Tac is the effective accumulated temperature, °C; T is the average daily air temperature (Ta) or ground temperature (Ts), °C; and Tb is the biological starting temperature of cotton (the biological starting temperature of cotton in RZWQM2 is 12 °C).

2.4.3. Cotton Growth Index

At each cotton growth stage, 15 plots (marked with a * in Figure 2) were selected using the cross method, and three cotton plants were randomly selected for each plot. The plant height, stem diameter, leaf length, and leaf width were recorded with a tape measure and Vernier caliper. The leaf area index (LAI) [24] was calculated as follows:
L A I = 0.84 × L × W × n A
where n is the number of blades, and A is the area of a single cotton plant, cm2.
The roots, stems, leaves, and buds/flower bolls of each cotton plant were taken from another three plants and were retained. The cotton plants were first killed at 105 °C for 60 min, before being dried at 75 °C to a constant weight; then, the dry matter mass (g) was recorded. The plant height, LAI, and dry matter content of each part were averaged. The cotton yield (kg/hm2) in the plot was recorded and estimated after the boll opening stage.

2.4.4. Data Processing and Analysis Methods

Excel 2010 was used for data processing, while SPSS 26.0 software was used to conduct variance analysis. Origin 2021 software was used for data visualization. AutoCAD 2020 and Microsoft PowerPoint 2021 software were used for drawing pictures. The bilinear interpolation method [25] was used for the spatial downscaling of GCM data; the unified spatial resolution was 0.5° × 0.5°. Then, the quantile mapping method [26] was used to correct the error. The numerical model itself has systematic biases and uncertainties in the initial field, so a single “optimal” model has significant biases. Therefore, transitioning from a single numerical model to a multi-model ensemble forecast is an effective way to improve model accuracy [27]. This paper used the bias-corrected ensemble mean (MME) from Feng et al. to obtain the data-driven and empirically validated RZWQM2 model. Python 2021 software implementing the bilinear interpolation and quantile mapping bias correction was used for GCMs.

3. Results

3.1. Cotton Growth Response to Different Water, Salt, and Nitrogen Treatments

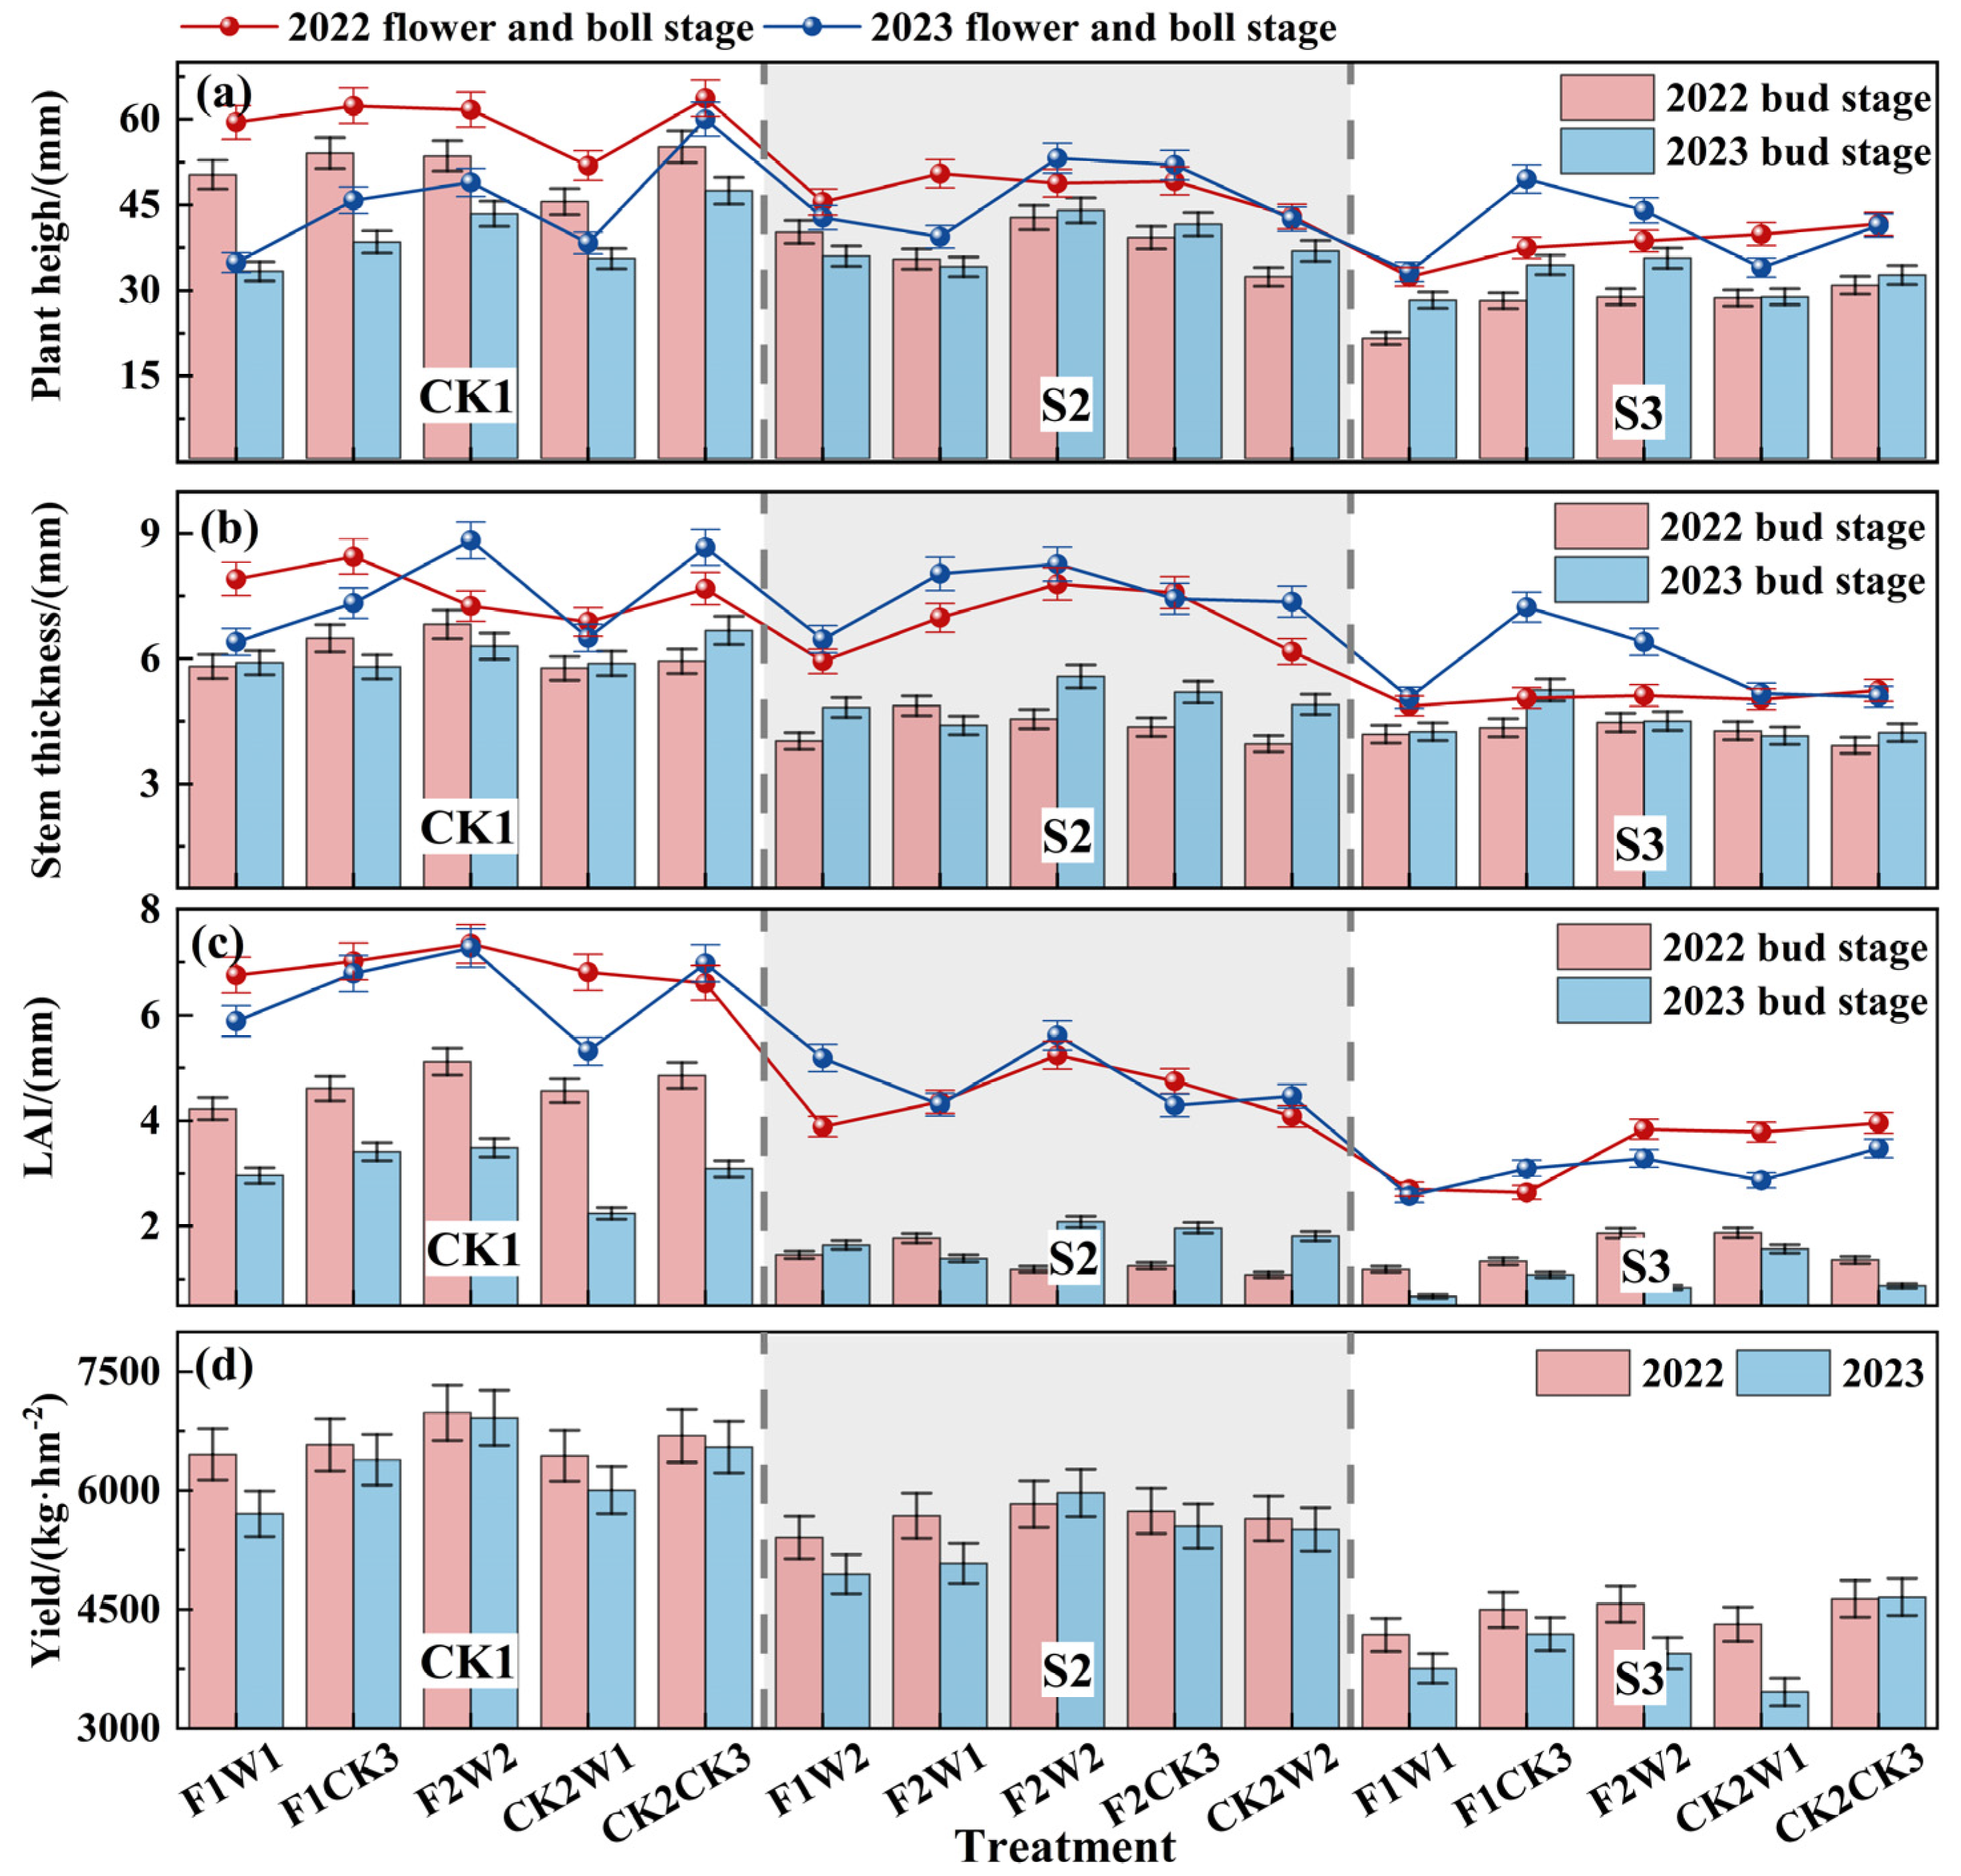
As illustrated in Figure 3, to investigate the response of cotton growth to different water, salt, and nitrogen treatments under subsurface drip irrigation, 15 experimental plots were selected at each growth stage of cotton and a cross method was used to select three cotton plants in each plot. The height, stem diameter, LAI, aboveground dry matter accumulation, and yield data were measured, and the effects of different water, salt, and nitrogen regulations on cotton growth were analyzed to form corresponding irrigation regulation recommendations. The growth of the bud stage, as well as the flowering and bolling stage, was more significant; therefore, the relevant indicators for these stages were analyzed.

3.1.1. Physiological Indexes and Yield of Cotton

Different water–salt–nitrogen treatments exhibited significant interactive effects on cotton’s physiological indices and yield. Data on plant height, stem diameter, LAI, yield, and correlations under various treatments are provided in Supplementary Table S5. The key findings indicate that under low-salt soil (3 dS/m), the combination of moderate irrigation (3600 m3/hm2) and reduced nitrogen (210 kg/hm2) input (CK1F2W2) achieved a near-maximum yield (6918 kg/hm2) by enhancing plant height, stem thickness, LAI, and dry matter accumulation, saving 20% more water and 33% more nitrogen compared to conventional practices (Figure 3d). In medium-salt soil (6 dS/m), S2F2W2 maintained a high yield (5830 kg/hm2), likely due to improved water use efficiency via osmotic adjustment under moderate salinity. However, in high-salt soil (9 dS/m), full irrigation (4500 m3/hm2) and nitrogen input (315 kg/hm2) were required to mitigate salinity effects; however, the yield remained 42% lower (4636 kg/hm2) than in medium-salt soil, which can be attributed to the Na+ accumulation-induced inhibition of photosynthetic rates and reduced assimilate allocation to reproductive organs [23]. Nitrogen demonstrated compensatory effects under high-salt conditions, whereby an increased nitrogen application (315 kg/hm2) enhanced K+/Na+ selectivity and boll dry matter partitioning, partially restoring yield [28]. Furthermore, the LAI showed a significant positive correlation with yield (p < 0.01), highlighting the critical role of leaf area expansion in light capture (Figure 3c,d). Collectively, salinity constrained productivity by suppressing stomatal conductance and photosynthetic enzyme activity, while optimizing water–nitrogen management synergistically regulated osmotic protectant synthesis [29], enhancing climate resilience in saline–alkali cotton fields. These findings provide quantitative support for the “Three Red Lines” water resource policy in arid agroecosystems.

3.1.2. Characteristics of Aboveground Dry Matter Accumulation in Cotton

The aboveground dry matter accumulation in cotton exhibited distinct stage-specific characteristics and was dynamically regulated by water–salt–nitrogen interactions (p < 0.01). As illustrated in Figure 4, under low-salt soil (3 dS/m), the combination of moderate irrigation and reduced nitrogen input (CK1F2W2) achieved peak dry matter accumulation during the flowering and boll stage (Figure 4c,g), which can primarily be attributed to leaf area expansion and enhanced assimilate allocation to reproductive organs (bolls). In medium-salt soil (6 dS/m), moderate salinity improved the osmotic adjustment capacity, resulting in an 18% increase in dry matter accumulation for S2F2W2 compared to CK1F2W2, indicating that salinity effects within a certain threshold can stimulate compensatory crop responses to promote biomass accumulation. However, high-salt soil (9 dS/m) significantly suppressed dry matter accumulation, with S3CK2CK3 showing a 31% reduction compared to medium-salt soil. This suppression was linked to Na+ accumulation-induced photosynthetic inhibition and excessive assimilate allocation to vegetative organs. The synergistic effects of nitrogen and irrigation were particularly pronounced under high-salt conditions, whereby a full nitrogen application (315 kg/ha) combined with increased irrigation (4500 m3/ha) enhanced the selective absorption of K+/Na+ and proline accumulation, with S3CK2CK3 achieving the highest dry matter accumulation under high-salt conditions. In conclusion, salinity disrupts normal plant resource allocation strategies (prioritizing survival over yield), leading to reduced economic yield. Optimized water–nitrogen management can counteract this allocation imbalance, providing a theoretical foundation for improving productivity in saline–alkali cotton fields in arid regions.

3.2. Adaptability Test of the RZWQM2 Model

The amounts of S, F, and W applied were compared using field test data, and the RZWQM2 model was improved using parameter calibration and trial-and-error. The interaction mechanism of S, F, and W was further analyzed using the model simulation results, and the collaborative mechanism of water, salt, and nutrients in drip irrigation under film was explored. The combined simulation of multiple water, nitrogen, and salt gradients was carried out using this model. Optimal water and nitrogen control measures in different salt conditions were obtained, providing a reference for the formulation of farmland irrigation schemes with different salinity levels.

3.2.1. Simulation of Soil Water Using the RZWQM2 Model

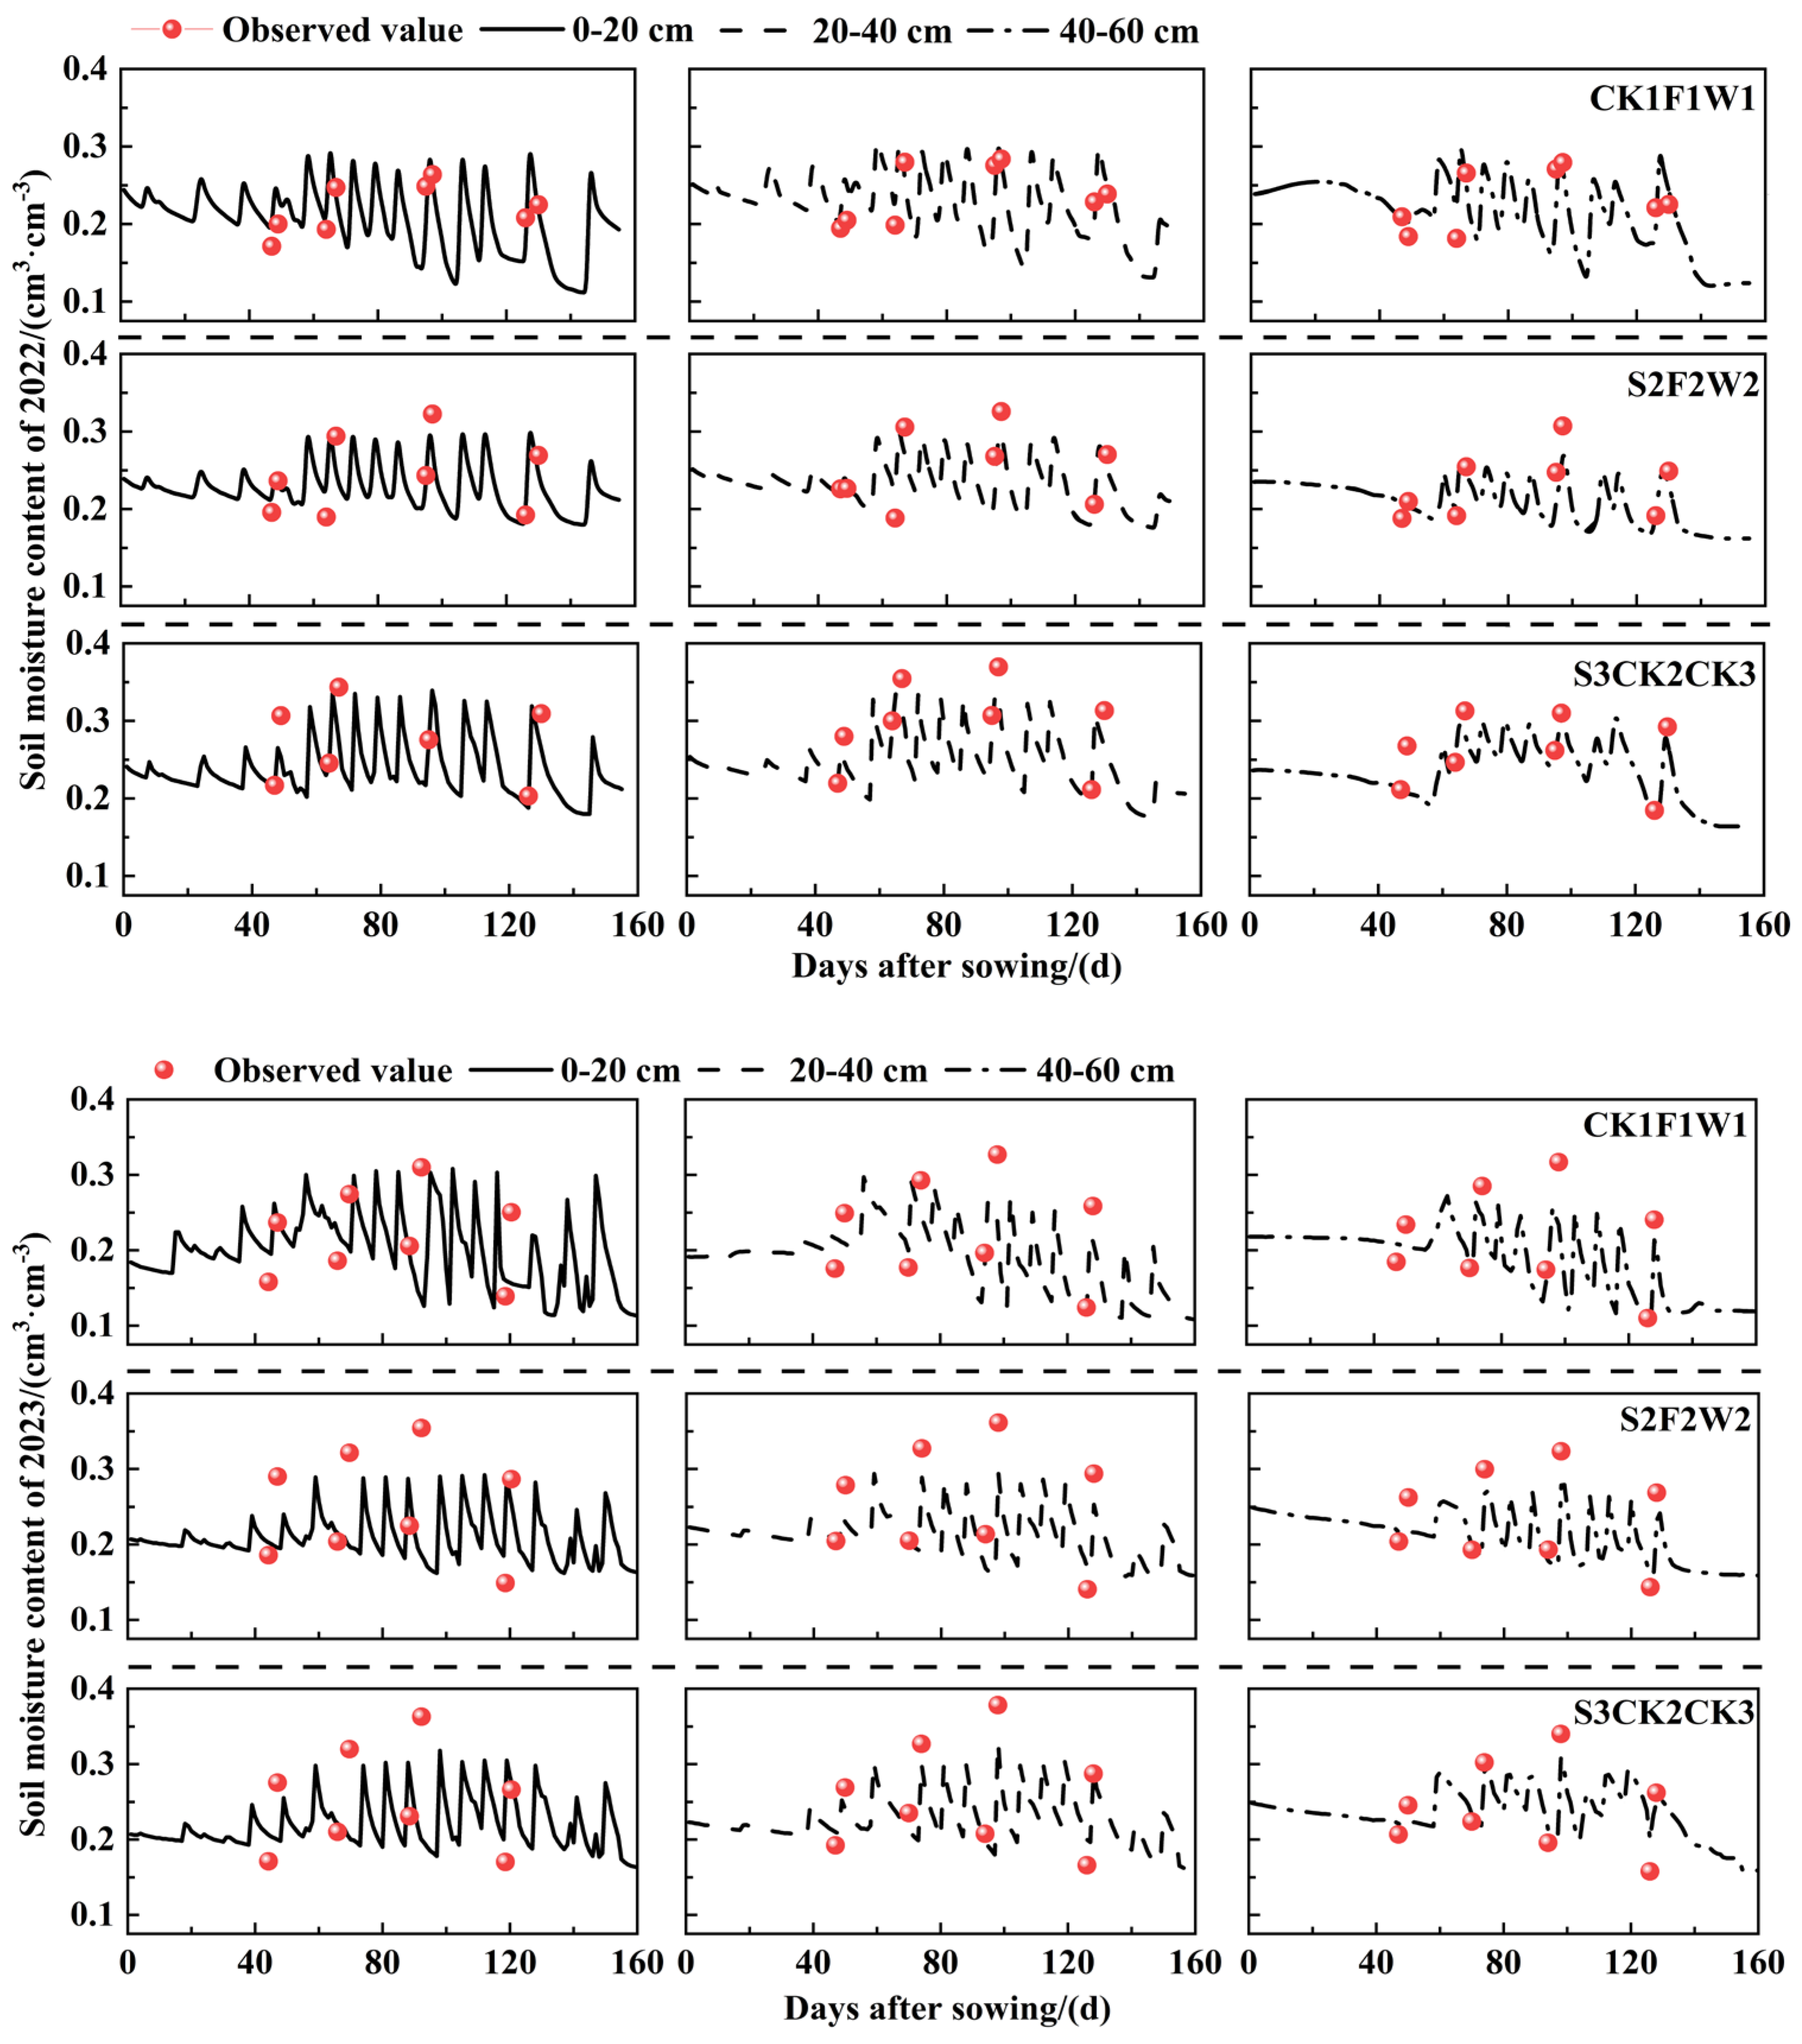
The accuracy of simulating soil moisture in the 0–60 cm soil layer for 15 treatments using the RZWQM2 model is shown in Supplementary Table S6. The changes in simulated and measured soil moisture content in 0–60 cm soil layers of CK1F1W1, S2F2W2, and S3CK2CK3 over time are shown in Figure 5. The error index in 2022 was relatively low, and the error index in 2023 generally increased, especially in shallow soil layers. However, the error gradually decreased with increased soil depth. The MRE ranged from −18.67% to 16.27%, and the mean values of the 0–20, 20–40, and 40–60 cm soil layers were −6.87%, −4.78%, and −4.94%, respectively. The RMSE ranged from 0.01 to 0.05 cm3/cm3, and the mean values of the 0–20, 20–40, and 40–60 cm soil layers were 0.036, 0.027, and 0.025 cm3/cm3, respectively. The range of NRMSE was 5.94 to 20.26%, and the mean values of the 0–20, 20–40, and 40–60 cm soil layers were 14.13%, 11.28%, and 9.99%, respectively. Partial value discrepancies were concentrated in the 0–20 cm soil layer, primarily due to surface mulch movement and irrigation-induced disturbances [30]. Although parameter calibration effectively reduced systematic biases in water–salt interactions, the model’s static representation of dynamic mulch processes may lead to an overestimation of shallow evaporation [31]. Nevertheless, the overall trend indicated an improved simulation accuracy with increasing soil depth, as evidenced by the strong agreement between measured and simulated water content values across all metrics. Therefore, the RZWQM2 model can reliably simulate soil water content dynamics. Future studies should integrate dynamic mulch modules and site-specific root architecture data to enhance topsoil simulation accuracy while extending the model’s applicability to extreme climate scenarios.

3.2.2. Simulation of Soil Nitrate Nitrogen Using the RZWQM2 Model

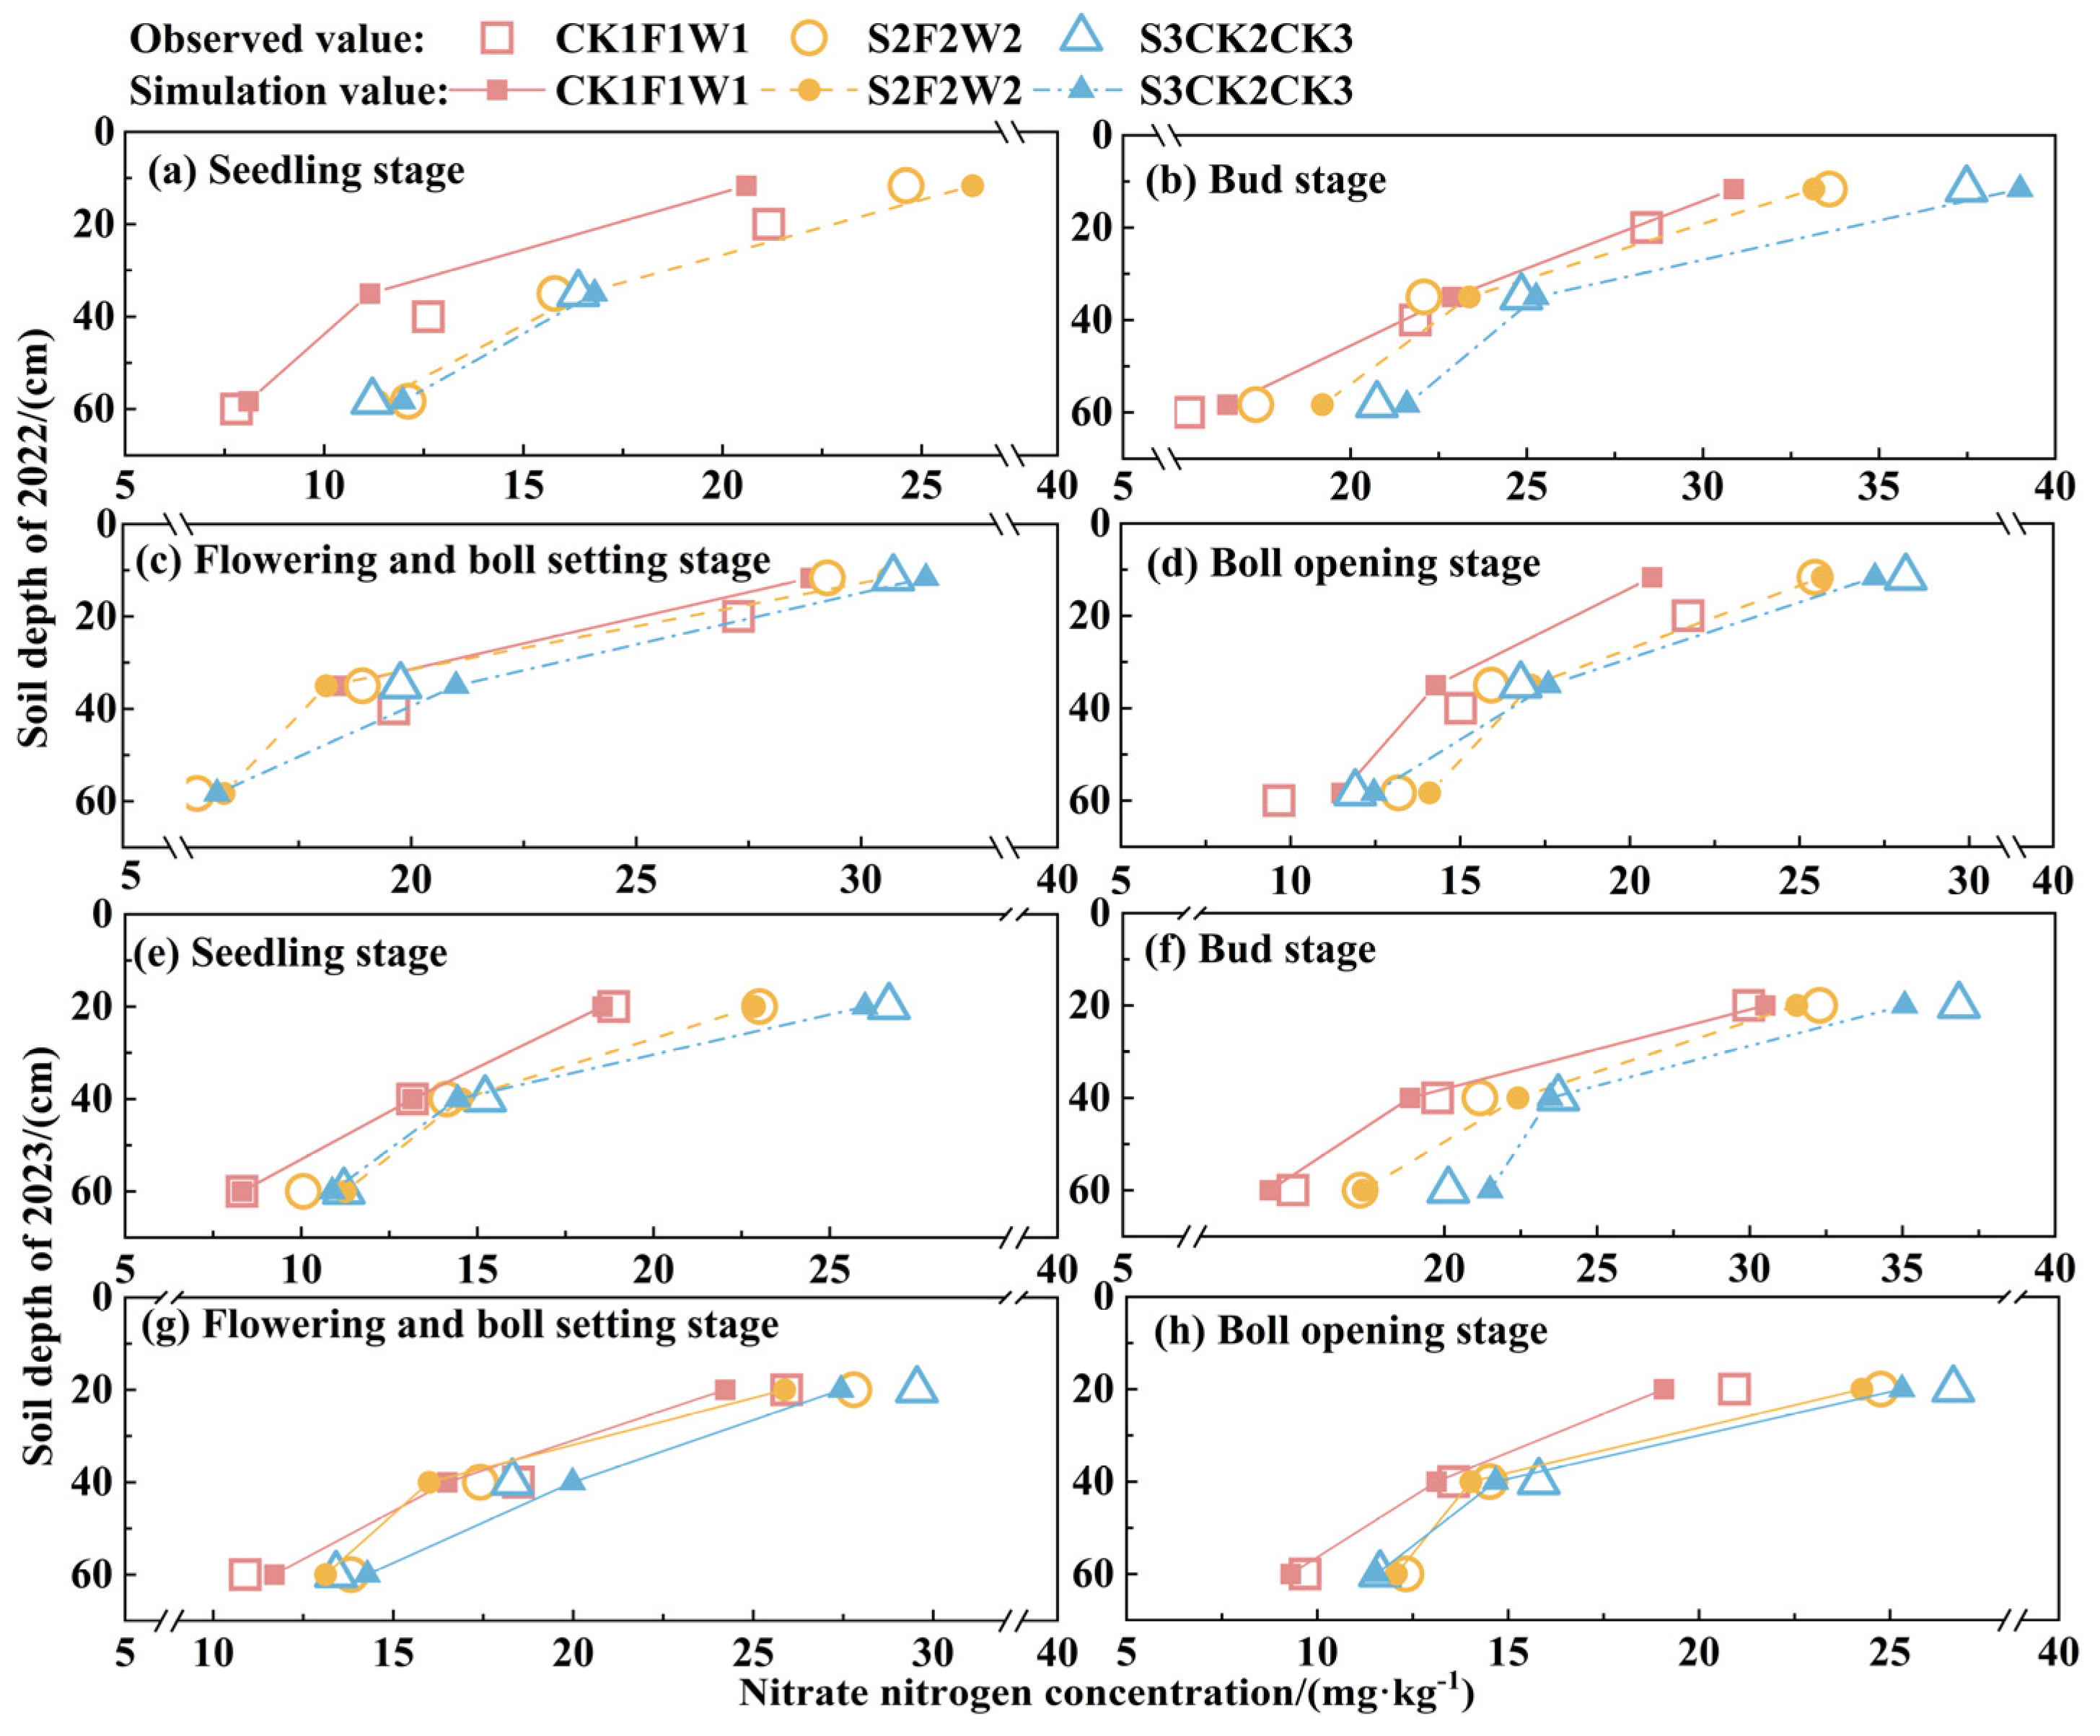
As illustrated in Figure 6, The accuracy of simulating soil nitrate nitrogen (NO3-N) using the RZWQM2 model varied significantly across cotton growth stages and salinity gradients, with the lowest errors being observed during the bud stage and increased dynamic fluctuations being observed during the flowering and boll stage due to multiple nitrogen applications (Supplementary Table S7). The model demonstrated an optimal performance under the S2F2W2 treatment, which is likely attributed to the inhibition of nitrification under salinity–nitrogen coupling effects, which reduced the complexity of nitrogen transport [32]. However, simulation errors for S3CK2CK3 were notably elevated during the seedling stage, primarily due to the model’s simplified assumptions regarding changes in denitrifying microbial activity under salinity effects [33].
The MRE, RMSE, and NRMSE values of NO3-N content in the simulated seedling stage were −8.72% to 11.12%, 0.24–2.20 mg/kg, and 2.16–12.24%, respectively; in the simulated bud stage, these values were −3.47% to 6.87%, 0.37–2.09 mg/kg, and 1.10–7.65%, respectively; in the simulated flowering and bolling stage, these values were −9.86% to 9.11%, 0.63–2.20 mg/kg, and 3.07–10.94%, respectively; and during the boll opening stage, these values were −9.28% to 4.29%, 0.39–2.30 mg/kg, and 2.16–9.51%, respectively. A comprehensive analysis of the simulation accuracy of the RZWQM2 model for NO3-N in different treatments showed that the average levels of MRE, RMSE, and NRMSE in different growth stages were −0.84%, 1.21 mg/kg, and 7.73% at the seedling stage, respectively; 3.56%, 1.25 mg/kg, and 5.16% at the bud stage; 0.91%, 1.24 mg/kg, and 5.96% at the flowering stage; and −0.78%, 1.02 mg/kg, and 5.55% at the boll opening stage. Thus, the RZWQM2 model can simulate NO3-N change and provide reliable data for simulating cotton growth. In the future, it is necessary to integrate in situ microbial community data and high-resolution root imaging technology to enhance the mechanistic characterization of the interaction between salt and nitrogen, as well as to improve the predictive ability of the model under extreme fertilization scenarios.

3.2.3. Simulation of Aboveground Biomass and Yield of Cotton Using the RZWQM2 Model

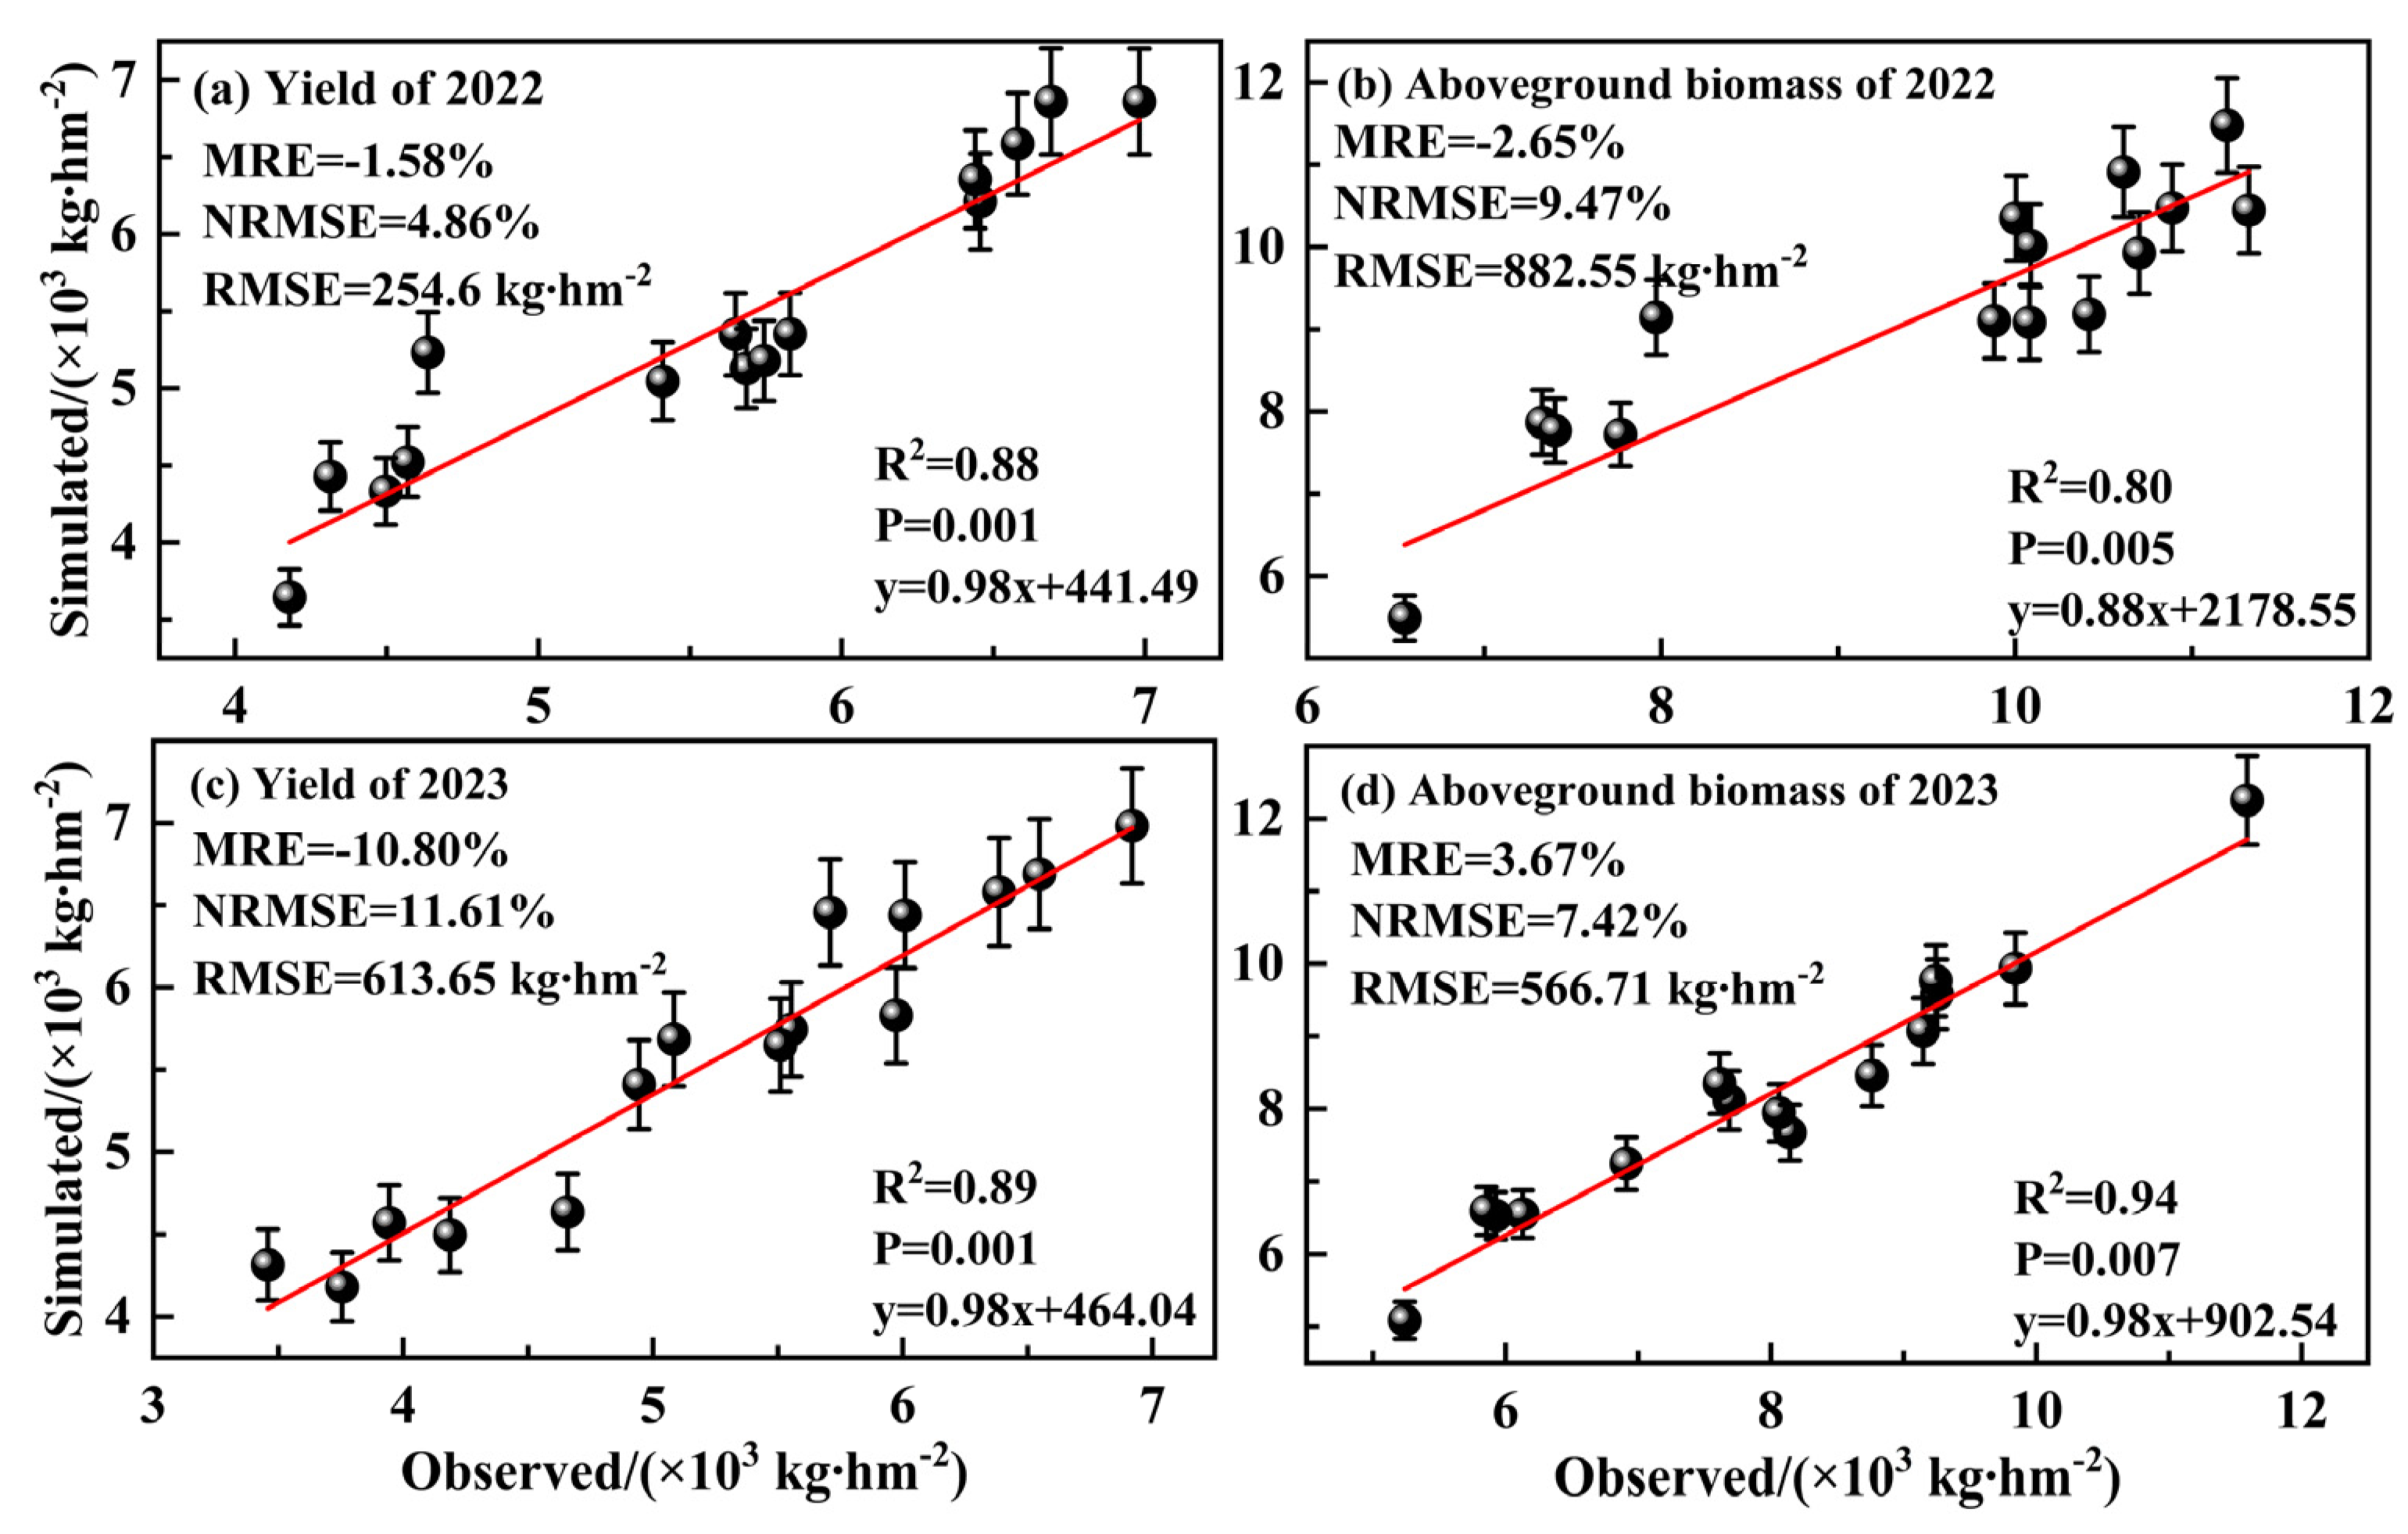
The simulation accuracy of the RZWQM2 model for the yield and aboveground biomass of 15 treatments is shown in Supplementary Table S8. As illustrated in Figure 7, there was a linear relationship between the simulated and measured values of each treatment. The R2 values for the yield regression equation for 2022 and 2023 were 0.88 and 0.89, respectively, and for the aboveground biomass regression equation, they were 0.80 and 0.94, indicating that the simulated values of yield and aboveground biomass were significantly positively related to the measured values (p < 0.01). The comparison and evaluation of actual and simulated yields of cotton under different treatments showed MRE values between −10.80% and −1.58%, an RMSE of 254.60–613.65 kg/hm2, and an NRMSE of 4.86–11.61%. The MRE values of the simulation accuracy of cotton shoot biomass in different treatments were −2.65% to 3.67%, the RMSE values were 566.71 to 882.55 kg/hm2, and the NRMSE values were 7.42 to 9.47%. The error between simulated and measured values was stable, and the RZWQM2 model simulated the effects of different treatments on cotton growth.

3.3. Selection of Irrigation Schemes Under Different Water, Salt, and Nitrogen Regulations for Cotton

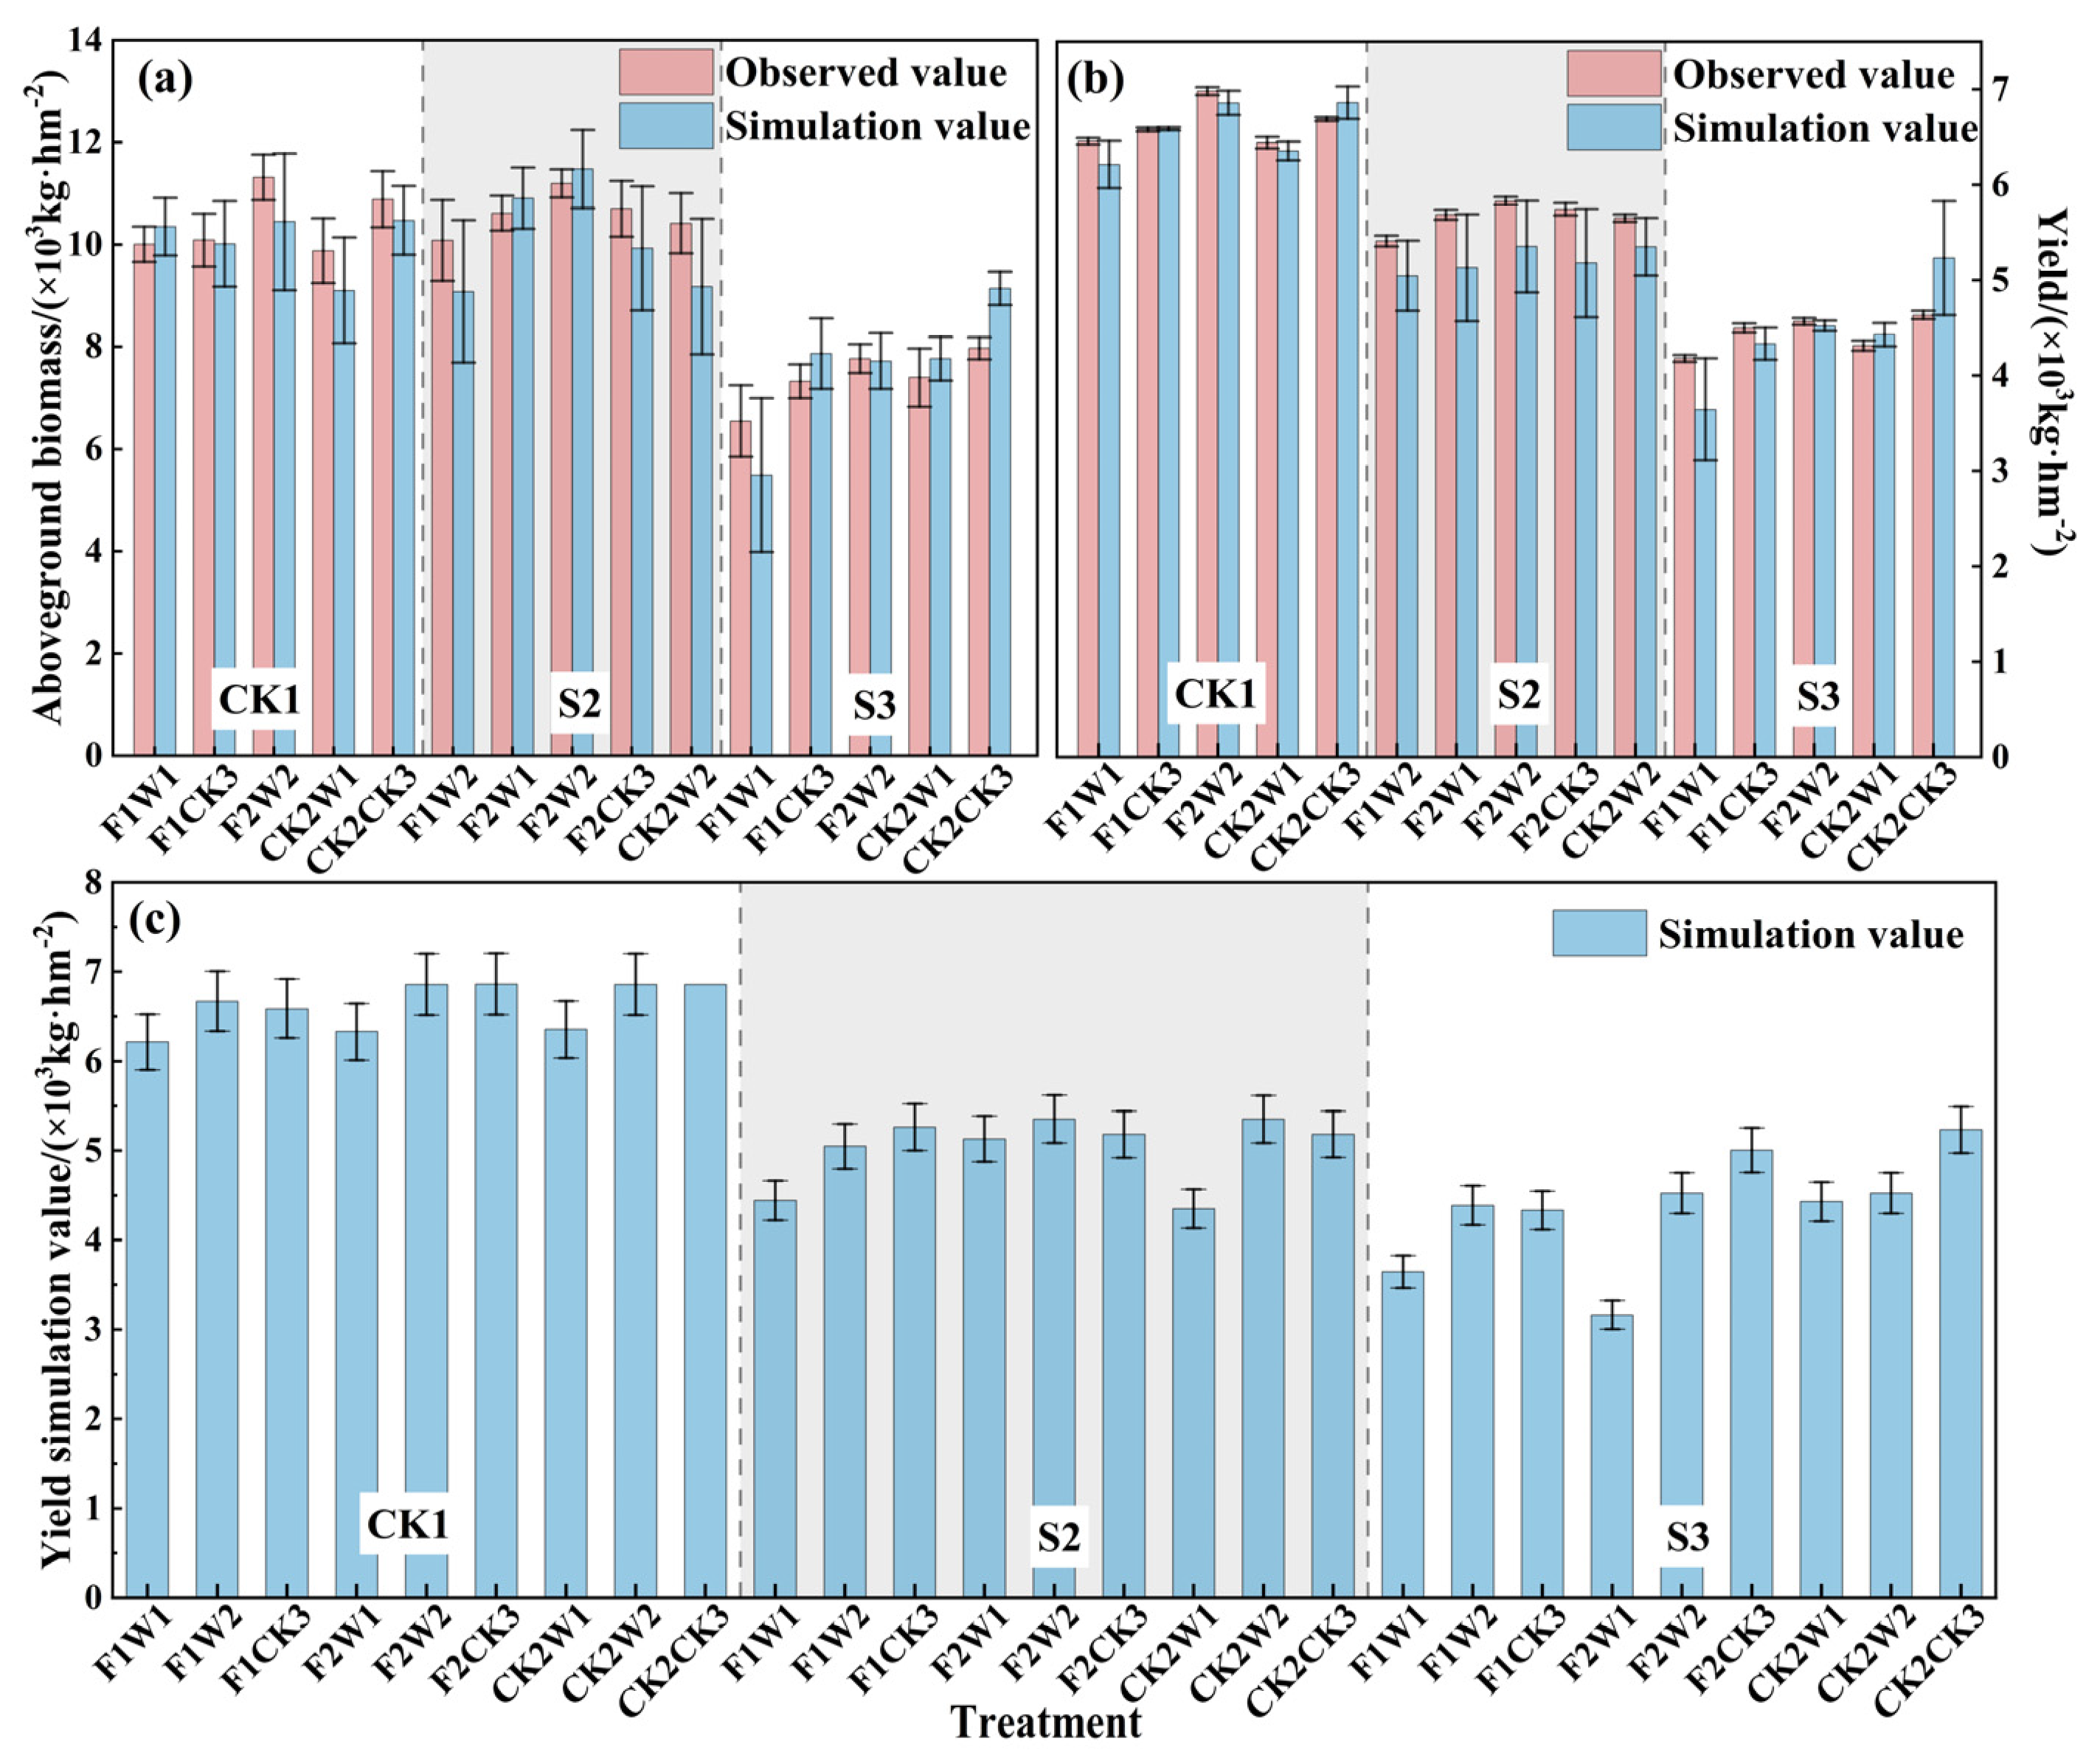
As illustrated in Figure 8, Model validation demonstrated a strong agreement between simulated and measured aboveground biomass (R2 = 0.80−0.94) across 15 treatments (Figure 8a). For high-salt soils (9 dS/m, S3), increasing irrigation to 3600 m3/hm2 (W2) mitigated salinity effects, recovering biomass losses by diluting root-zone salinity. Medium-salt soils (6 dS/m, S2) enhanced biomass accumulation compared to low-salt controls (CK1), which can be attributed to improved water–nutrient synergy under optimized irrigation (3600 m3/hm2) and nitrogen regimes (210 kg/hm2, F2), which maximized dry matter production while avoiding yield penalties from deficit (F1) or excessive (CK2) fertilization. Yield simulations revealed nonlinear thresholds—the maximum productivity for low-to-medium-salt soils (S1–S2) occurred at 3600 m3/hm2 (W2), beyond which waterlogging reduced yields. However, high-salt soils (S3) required a full irrigation (4500 m3/hm2, CK3) combined with an elevated nitrogen input (315 kg/hm2, CK2) to stabilize yields at an 85% potential (Figure 8b). Under non-saline soil conditions, when the nitrogen fertilizer application rate exceeds 210 kg/hm2, the effect of nitrogen fertilizer on cotton yield tends to stabilize and the marginal benefit of further increasing nitrogen fertilizer application significantly decreases. An expanded scenario analysis (27 treatments; Figure 8c) identified that CK1/S2 soils achieved a peak yield (6918 kg/hm2) at F2W2 (210 kg/hm2 + 3600 m3/hm2), enabling 20% more water and 33% more fertilizer savings versus conventional practices. In contrast, S3 soils necessitated full irrigation and nitrogen inputs (CK2CK3) to counter salt-induced yield declines (−42% vs. S2), highlighting the importance of salinity-specific management strategies. These findings provide actionable thresholds for balancing water conservation and yield stability in arid agroecosystems under climate uncertainty.

3.4. Response of Cotton Growth to Future Climate Changes

3.4.1. Climate Characteristics of the Study Area Under Future Climate Scenarios

The long-term average highest and lowest temperatures were 26.09 °C and 11.19 °C, respectively (Table 4). The temperature will increase year by year, with rates of 0.32 °C∙10 a−1 and 0.44 °C∙10 a−1 for the highest and lowest temperatures, respectively. The climate increase rate was greater for the lowest than the highest temperature, indicating that the temperature difference reduced year by year. The annual mean values of solar radiation and precipitation were 9.65 MJ/m2/day and 136.76 mm, respectively. The climate tendency rate increased slowly. The annual means of wind speed and relative humidity were 146.40 km/day and 52.89%, respectively, with no obvious trend with climate change.
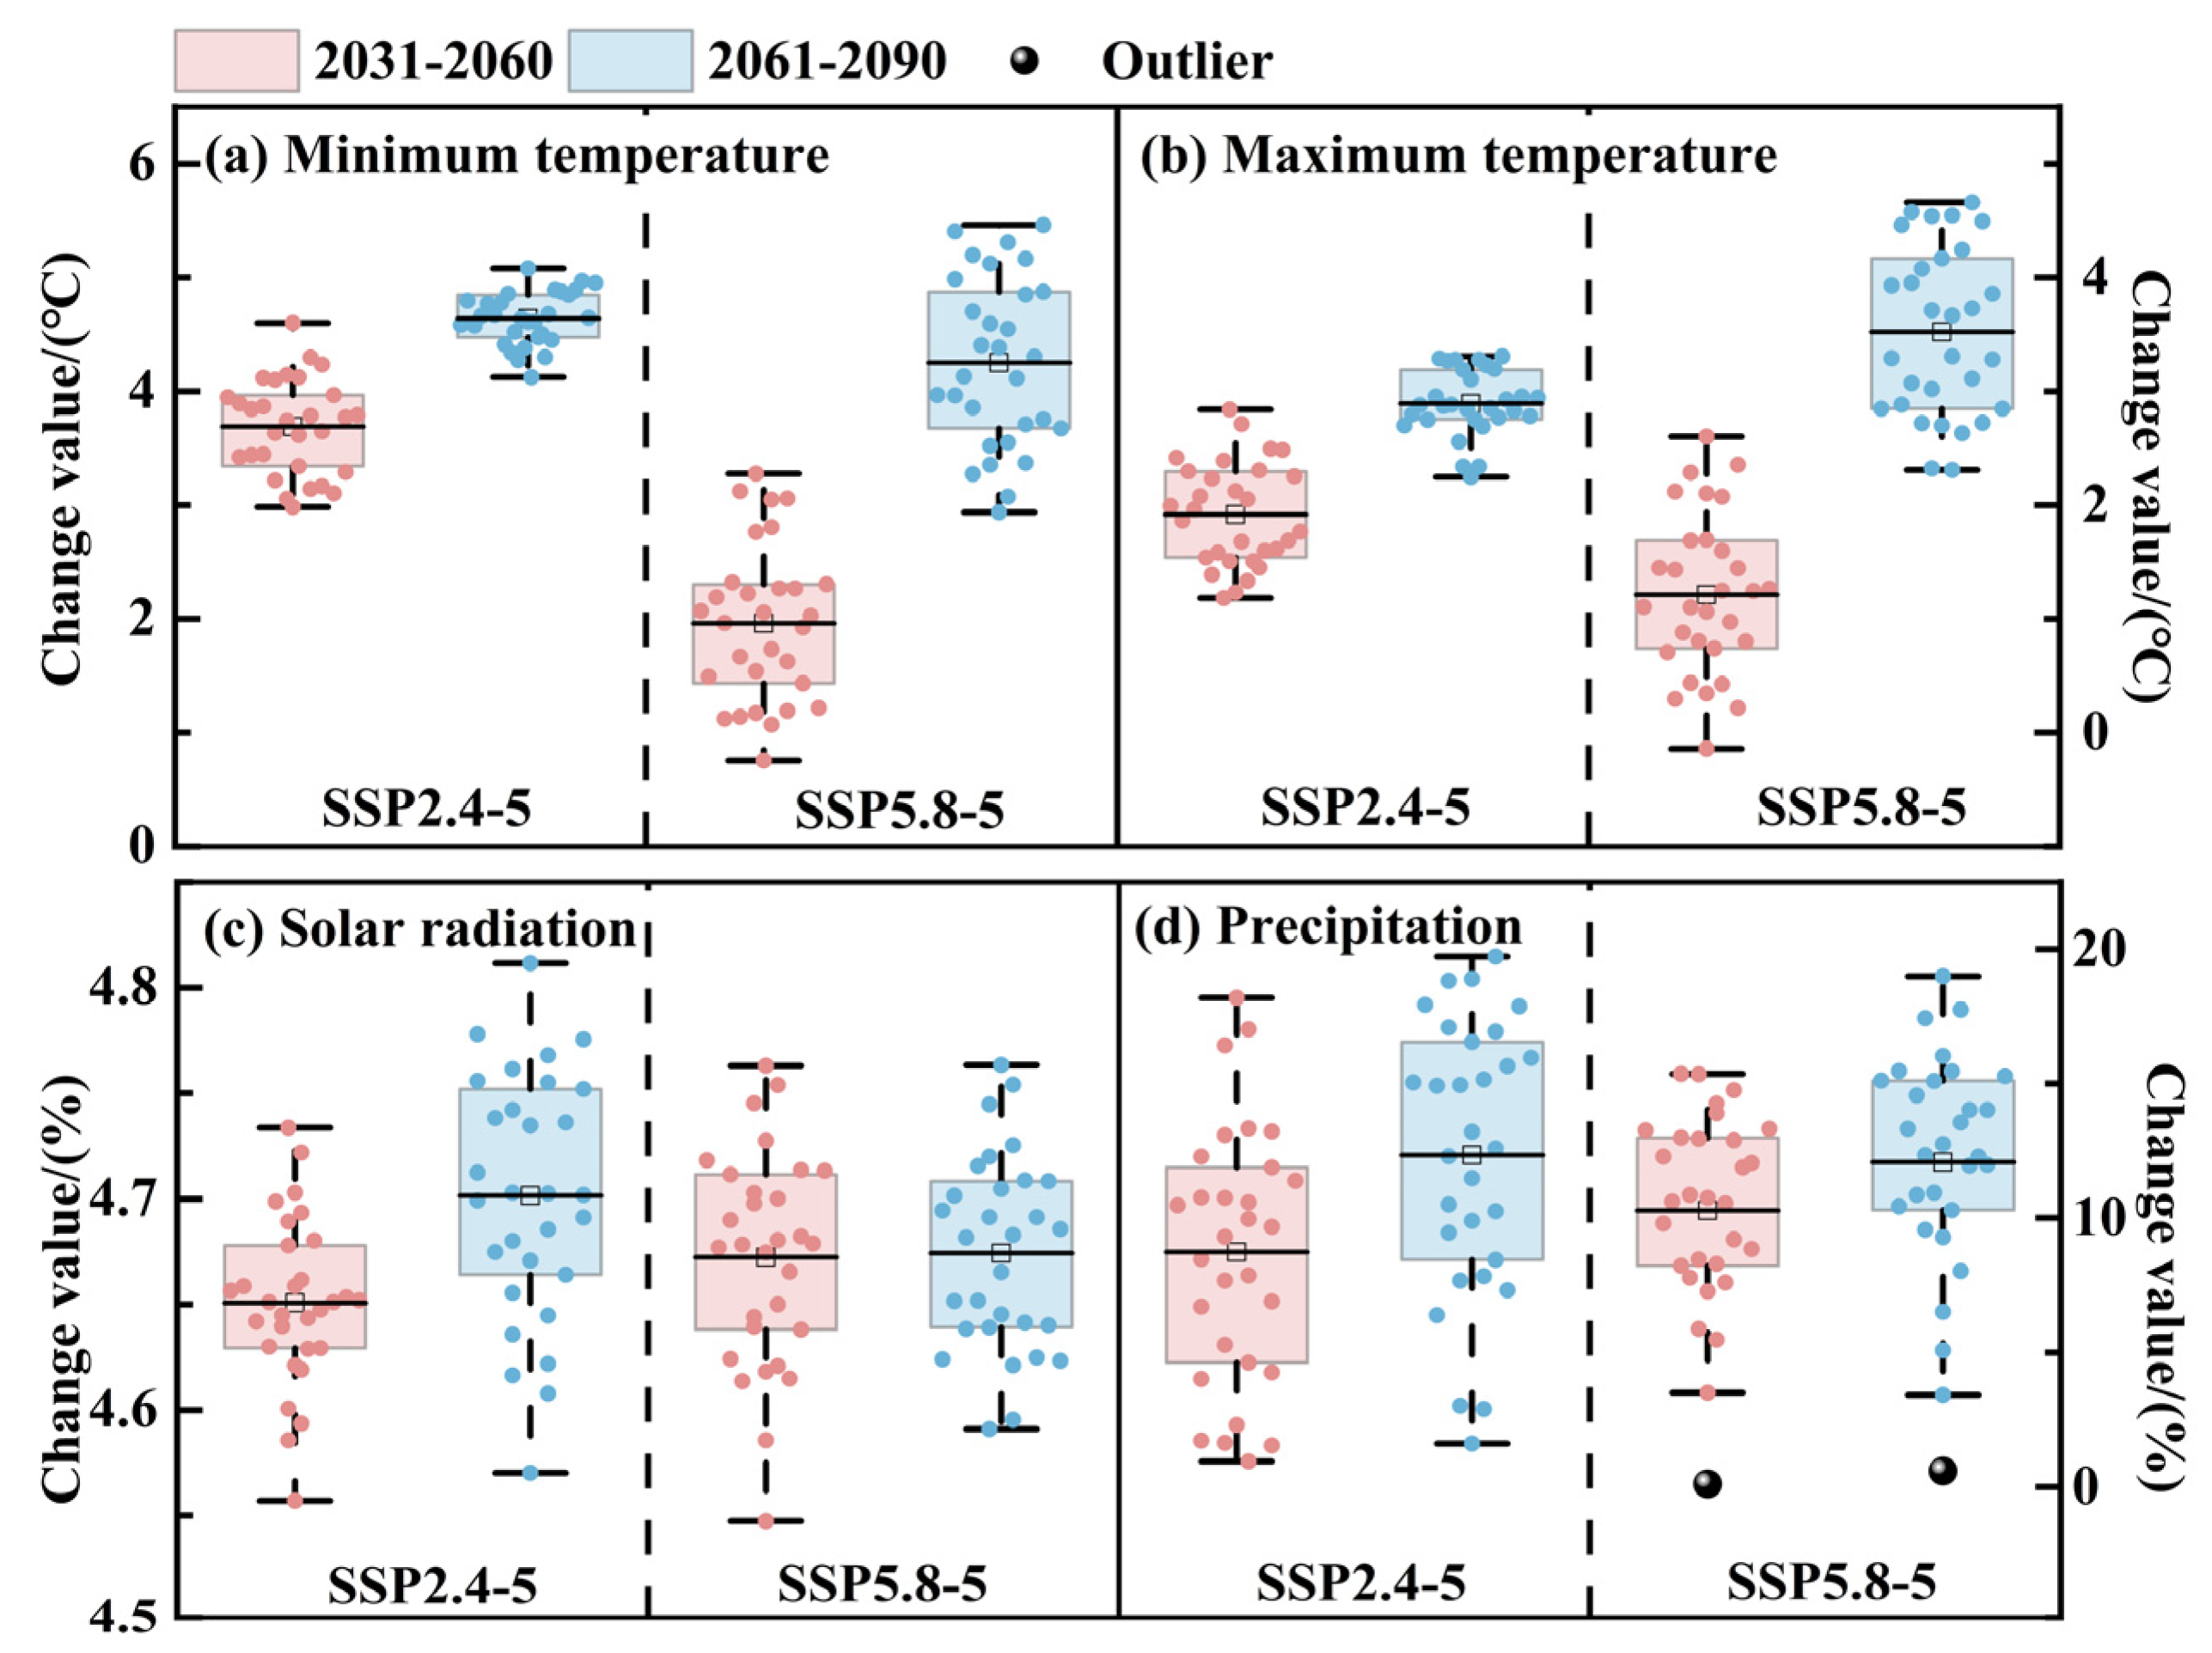
Figure 9 shows the average climate change relative to the historical reference period for the MME model in the 2031–2060 and 2061–2090 periods. The warming value in the study area gradually increased from the recent to the distant period. Under the SSP2.4-5 scenario, the maximum temperature in the 2031–2060 and 2061–2090 periods increased by 1.92 °C and 2.89 °C, respectively, which are increases of 7.36% and 11.08% compared to the average historical value. The minimum temperature increased by 3.69 °C and 4.64 °C, respectively, with increases of 32.98% and 41.47% compared to the average historical value. Under the SSP5.8-5 scenario, the maximum temperature for 2031–2060 and 2061–2090 increased by 1.21 °C and 3.52 °C, respectively, which was 4.64% and 13.49% higher than the historical average; the minimum temperature increased by 1.96 °C and 4.25 °C, respectively, which was 17.52% and 37.98% higher than the historical average. The minimum temperature increased more than the maximum temperature, resulting in the temperature difference gradually decreasing. In the SSP2.4-5 scenario, precipitation in the 2031–2060 and 2061–2090 periods increased by 42.75 and 55.31 mm, respectively, demonstrating increases of 8.74% and 12.35% compared with the historical average; in the SSP5.8-5 scenario, precipitation increased by 47.75 and 50.44 mm, respectively, increasing by 10.28% and 12.08% compared with the historical average. The future trend in solar radiation was relatively flat, with an increase of 4.65–4.70%.

3.4.2. Prediction of Cotton Growth Cycle Under Future Climate Change

The RZWQM2 model was used to simulate the changes in the growth cycle of CK1F2W2, S2F2W2, and S3CK2CK3 in the near- (2031–2060) and long-term (2061–2090) futures under two scenarios. With the increase in temperature, the whole growth period of cotton in the study area gradually decreased with time. Under the SSP2.4-5 scenario, the growth period of CK1F2W2, S2F2W2, and S3CK2CK3 in the period from 2031 to 2060 decreased by 4.2, 6.07, and 1.17 d, respectively; under the SSP5.8-5 scenario, the growth period decreased by 4.2, 6.07, and 1.17 d, respectively. Meanwhile, the growth period of CK1F2W2, S2F2W2, and S3CK2CK3 shortened by 4.03, 1.27, and 5.50 d, respectively. In 2061–2090, the growth period shortened by the maximum amount. Under the SSP2.4-5 scenario, the growth period of CK1F2W2, S2F2W2, and S3CK2CK3 shortened by 3.67, 9.50, and 5.27 d, respectively. Under the SSP5.8-5 scenario, the growth period of CK1F2W2, S2F2W2, and S3CK2CK3 shortened by 5.47, 2.07, and 6.03 d, respectively.

3.4.3. Prediction of Yield and Aboveground Biomass Under Future Climate Change

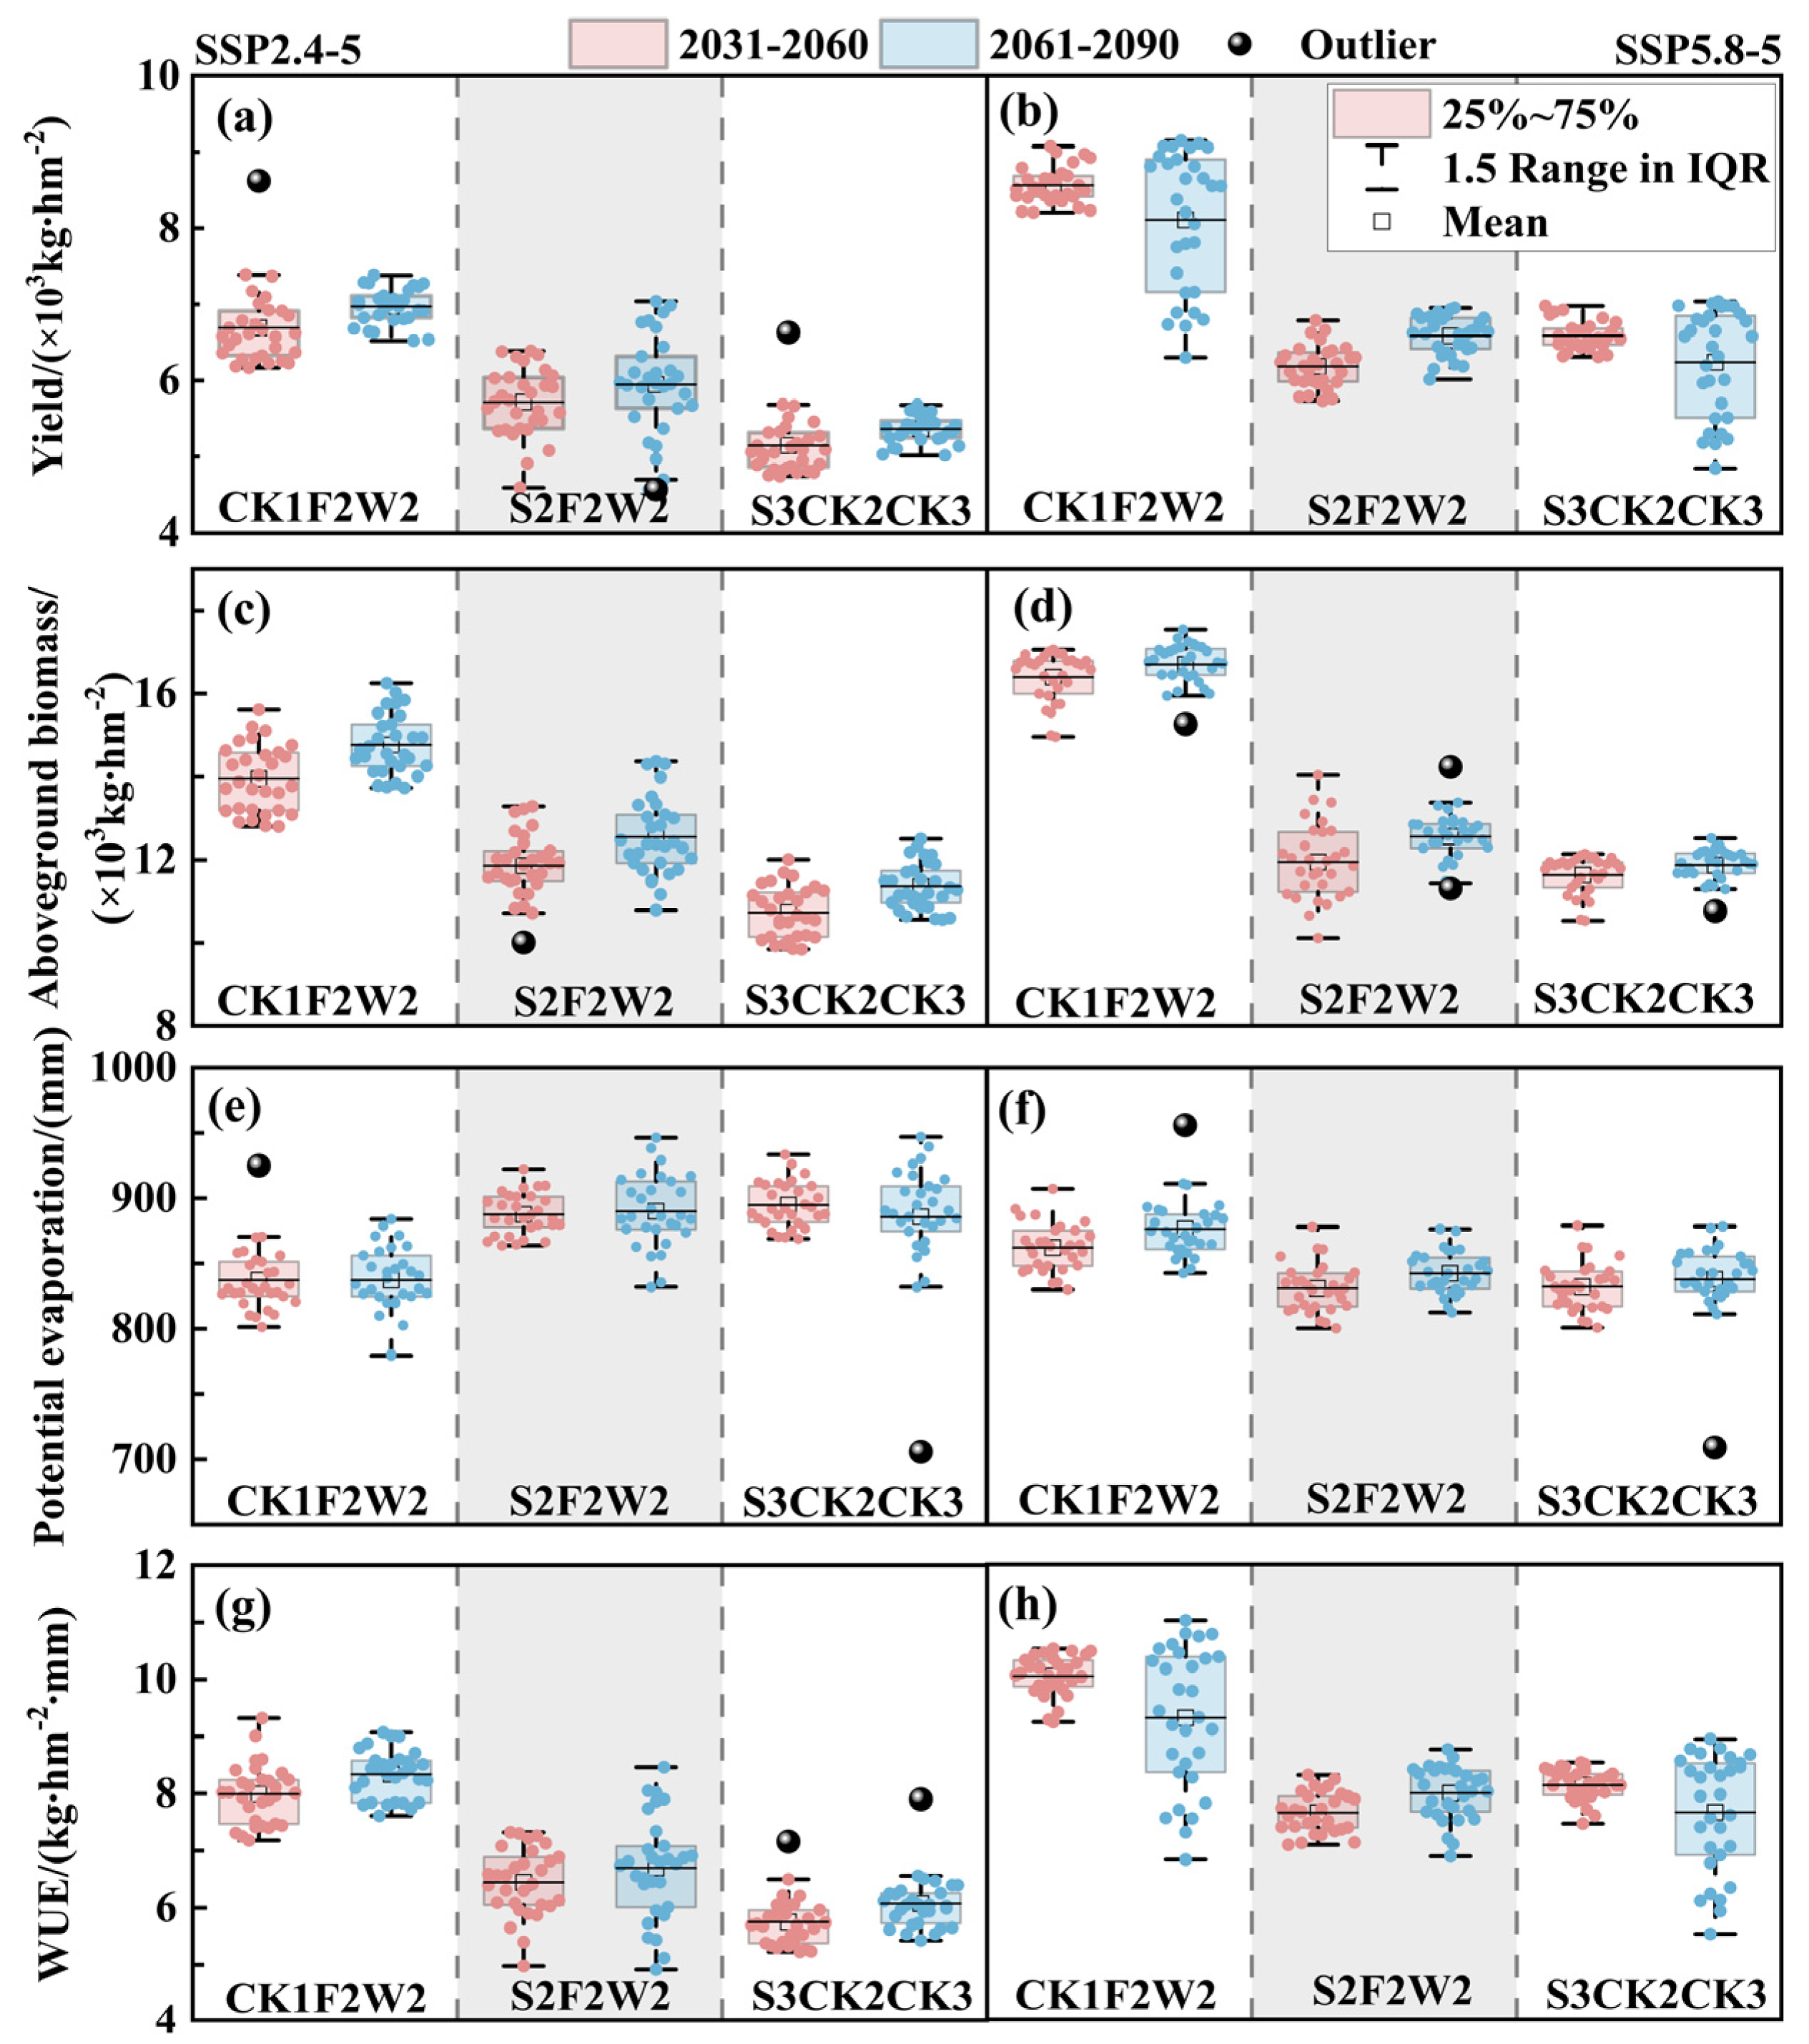
As illustrated in Figure 10, the average cotton yields of CK1F2W2, S2F2W2, and S3CK2W2 under the baseline were 6982, 5830, and 4636 kg∙hm−2, respectively. Under the SSP2.4-5 scenario, annual production changes in CK1F2W2, S2F2W2, and S3CK2CK3 during the period from 2031 to 2060 were −4.17%, −1.96%, and 11.02%, respectively, while during the period from 2061 to 2090, these values were −0.14%, 1.95%, and 15.68% (Figure 10a). Under the SSP5.8-5 scenario, the yields of the three treatments all showed an increasing trend, and S3CK2CK3 increased the most, with the annual yields of CK1F2W2, S2F2W2, and S3CK2CK3 changing by 22.63%, 6.07%, and 42.08% during the period from 2031 to 2060. During the 2061–2090 period, the yields of CK1F2W2 and S3CK2CK3 differed greatly in different years, and the annual yields of CK1F2W2, S2F2W2, and S3CK2CK3 changed by 16.16%, 12.95%, and 34.58%, respectively (Figure 10b). Aboveground biomass will continue to increase in the future, but it will increase by a larger margin compared to the yield, with S3CK2CK3 increasing the most. Under the baseline, the average aboveground biomass of cotton in CK1F2W2, S2F2W2, and S3CK2CK3 was 13,300, 11,125, and 9157 kg∙hm−2, respectively. In the SSP2.4-5 scenario (Figure 10c), the three treatments all increased the most during the 2061–2090 period, and CK1F2W2, S2F2W2, and S3CK2CK3 increased by 11.05%, 12.81%, and 24.06%, respectively. In the SSP5.8-5 scenario (Figure 10d), CK1F2W2, S2F2W2, and S3CK2CK3 still increased the most during the period from 2061 to 2090, by 28.74%, 23.41%, and 43.85%, respectively. Increasing temperature and eCO2 can increase yield and aboveground biomass, while in S3 soil, increasing irrigation water and nitrogen application can promote cotton growth, increase cotton leaf area, improve light energy capture and photosynthesis efficiency, and further promote biomass accumulation.

3.4.4. ETpot and WUE Predictions Under Future Climate Change

The average potential evaporation (ETpot) of simulated cotton CK1F2W2, S2F2W2, and S3CK2CK3 treatments was 859.34, 865.53, and 871.69 mm, respectively. As the future temperature increased, ETpot gradually decreased. Under the SSP2.4-5 scenario (Figure 10e), the changes in ETpot for CK1F2W2, S2F2W2, and S3CK2CK3 for the period from 2031 to 2060 were −2.64%, 2.54%, and 2.65%, respectively, and for the 2061 to 2090 period, these values were −2.58%, 2.82%, and 1.6%. In the SSP5.8-5 scenario (Figure 10f), there was no significant difference in all treatments at different time periods, and ETpot was less for the 2061–2090 period than the 2031–2060 period.
The average WUE in simulated cotton CK1F2W2, S2F2W2, and S3CK2CK3 treatments was 7.12, 6.34, and 5.32, respectively. In the SSP245 scenario (Figure 10g), WUE gradually increased with time. The WUE for CK1F2W2, S2F2W2, and S3CK2CK3 increased by 12.22%, 1.74%, and 8.08% for the 2031–2060 period, respectively, and increased by 17.13%, 5.68%, and 14.29% for the 2061–2090 period. In the SSP5.8-5 scenario (Figure 10h), WUE increased first and then decreased with time. The WUE for CK1F2W2, S2F2W2, and S3CK2CK3 increased by 23.65%, 13.50%, and 27.55% for the period from 2031 to 2060, respectively, and increased by 14.66%, 18.55%, and 15.55% for the 2061 to 2090 period. The increase in temperature can increase the evaporation rate of water in plants and promote the movement of water from plants to the atmosphere, while excessive temperature will change the physiological activities and water dynamics of plants, thus reducing the WUE [34].

4. Discussion

4.1. Effects of Different Water, Salt, and Nitrogen Conditions on Cotton Growth

The impact of irrigation on cotton growth exhibits threshold effects that vary across regions, with both insufficient and excessive irrigation volumes being detrimental to plant development [35]. Insufficient irrigation induces water stress, leading to structural damage to chloroplasts, reduced photosynthetic efficiency, enzyme inactivation, and disrupted osmotic regulation [36], ultimately stunting growth or causing plant mortality. Conversely, excessive irrigation promotes excessive vegetative growth at the expense of boll formation, thereby reducing yield. Lin [37] observed that cotton seedling height and leaf area initially increased but subsequently declined with reduced irrigation quotas. For water conservation in arid regions, reducing late-growth-stage irrigation while ensuring adequate water supply during flowering, combined with optimized nitrogen application, can improve soil moisture distribution and enhance crop productivity [38]. These findings align with our study, which demonstrated that moderate irrigation (W2) outperformed conventional high irrigation (CK3) in promoting cotton growth in low-salt soils (CK1). Water availability critically governs physiological indices such as leaf expansion and aboveground biomass accumulation, playing a dominant role in yield formation [39]. While Bo [40] reported greater biomass accumulation under higher irrigation levels, this study highlights that excessive irrigation disrupts yield by prioritizing vegetative over reproductive growth.
Cotton exhibits moderate salt tolerance, with a salinity threshold of approximately 7.7 dS/m [41]. In this study, cotton growth under low- (CK1) and medium-salt (S2) conditions significantly outperformed that under high-salt (S3) conditions. High-salt (S3) conditions markedly inhibited aboveground growth through Na+ toxicity and osmotic stress, impairing photosynthesis and delaying development [42]. As soil salinity increased, key growth metrics (plant height, stem diameter, and LAI) declined sharply, which is consistent with findings from Ma [43], who emphasized nitrogen’s role in mitigating salt-induced damage. Although nitrogen supplementation partially alleviated stress in S3 plots, plants remained stunted, resulting in a reduced biomass accumulation and yield losses.
Nitrogen management significantly influenced cotton productivity. The maximum LAI and yield initially increased but later declined with rising nitrogen application, reflecting an optimal threshold [44]. While Tian [45] reported minimal yield impact from reduced nitrogen inputs, this study found that moderate nitrogen application (F2) enhanced dry matter accumulation during the flowering and bolling stages by supplying nutrients for reproductive organ development. Under CK1 and S2 conditions, F2 achieved high yields, whereas S3 required full nitrogen input (CK2) to counteract salinity effects. Nitrogen application exerted highly significant effects on yield (p < 0.01), likely by alleviating ion toxicity and improving osmotic adjustment under salinity effects.

4.2. Application of the RZWQM2 Model in Cotton Growth Simulation

The RZWQM2 model demonstrated a robust performance in simulating cotton growth dynamics under water–salt–nitrogen interactions [46]. Building on previous single-factor simulation studies [12], this research enhanced the model’s predictive capability through three key improvements—the site-specific calibration of soil hydraulic parameters, the introduction of a salinity-dependent nitrification inhibition mechanism, and dynamic CO2 response adjustments. The simulation errors fell within acceptable ranges for agricultural modeling, e.g., replacing default soil hydraulic parameters with field-measured values (Table 3) reduced soil water content simulation errors from ±25% to ±8%, with a particularly strong performance being observed in the deeper soil layers (40–60 cm; NRMSE = 9.99%). NO3-N simulations achieved NRMSE values of 5.16–12.24% across growth stages, performing best during the bud stage and slightly higher during the flowering and bolling stages, reflecting the complexity of nitrogen transport under frequent fertilization. Simulated yield and aboveground biomass values closely matched field data, with NRMSE values being consistently below 12%. However, the model exhibited notable limitations under extreme or heterogeneous field conditions. Its static characterization of plastic mulch effects led to the systematic overestimation of topsoil evaporation (0–20 cm layer; NRMSE = 14.13%) as it failed to account for dynamic changes in mulch permeability during degradation—a critical oversight in arid regions where mulch management directly shapes soil microenvironments. Additionally, while the RZWQM2 model captured baseline warming trends, it underestimated the impacts of episodic extreme heat on reproductive processes, overpredicting boll retention rates under the SSP5-8.5 scenario. This discrepancy stems from the model’s assumption of linear developmental responses beyond 30 °C, which diverges from observed nonlinear declines in physiological activity under extreme temperatures. Despite these limitations, the calibration process improved phenological simulation accuracy (Table 2), and the model’s irrigation recommendations for varying salinity levels aligned with local agronomic practices. Overall, the RZWQM2 model provides a reliable framework for optimizing water–nitrogen management in saline agroecosystems. Future work should prioritize the development of dynamic mulch-effect models, temperature–reproduction interaction mechanisms, and 3D root architecture analysis methods to enhance the model’s capacity to simulate complex farmland processes.

4.3. Effect of Elevated eCO₂ Levels on Cotton

Elevated levels of eCO2 are generally thought to increase the photosynthesis rate of crops and reduce crop transpiration by reducing the degree of leaf stomatal opening [47]. If only an increase in temperature is considered and eCO2 is ignored, future climate change will shorten the biological period of time; increase ETpot; and reduce yield, aboveground biomass, and WUE, which is not conducive to improving cotton yield (Supplementary Text S4). This is consistent with the views of Reddy and Zhao [48] and Luo [49], who stated that high-temperature conditions, especially in the cracking stage of cotton, promote the development of cotton bolls but also lead to a reduced cotton boll size and further reduces the cotton yield. Elevated temperatures negatively impact cotton yield by reducing flower and boll retention rates, primarily due to accelerated phenological development and heat-induced physiological disruptions (e.g., pollen sterility). However, rising atmospheric CO2 concentrations can partially offset these losses. Specifically, eCO2 enhances photosynthesis and biomass accumulation while reducing stomatal conductance and transpiration, thereby improving water use efficiency (WUE↑27.5%) and mitigating heat stress [50]. Despite these compensatory effects, current modeling approaches often oversimplify eCO2 responses by applying uniform adjustment coefficients to photosynthetic and transpiration rates across cultivars. This limitation hinders the accurate prediction of varietal differences in climate adaptation, as genetic traits (e.g., stomatal density and root architecture) modulate crop responses to eCO2. To improve predictive accuracy, future models should incorporate cultivar-specific eCO2 response parameters from controlled experiments (e.g., stomatal density and C/N allocation), couple carbon–nitrogen dynamics through mechanistic root–microbe interaction modules, and implement temperature-sensitive stomatal modeling (e.g., the Ball–Berry framework) to simulate feedback among eCO2, transpiration, and heat stress [45,46].
In addition, high temperatures can reduce the retention rate of flowers and bolls in cotton plants, which, in turn, has a negative impact on yield. Increased eCO2 positively affects cotton growth, biomass, and yield by promoting photosynthesis, reducing transpiration and stomatal conductance, and increasing WUE. Although the effects of elevated eCO2 are considered in this paper, most existing model studies adjusted photosynthetic efficiency and crop transpiration rate based on simplified coefficients in order to cope with elevated eCO2 levels. Using this method, it is often difficult to accurately measure the differences between different crop varieties. Therefore, more environmental control experiments are necessary to improve the model so that it can more accurately predict changes in the transpiration rates of different crop varieties under high eCO2 conditions.

4.4. Uncertainty Analysis of Future Climate Scenarios

Climate model data are another important basis for assessing the impact of climate change. There are significant differences in the simulated average cotton yield among different climate models [12], but climate models usually have a coarse spatial resolution and systematic bias [51]. For example, all climate models significantly overestimate the number of precipitation days and underestimate the frequency of heavy rainfall [52]. The bias correction method used in this paper is widely used to adjust the statistical characteristics of climate model simulations to match the observed data [53]. However, all the bias correction methods are poor in relation to the simulation of extreme climate, and it is believed that the frequency distribution between historical observation data and future simulation data is consistent. That is, the bias of the default climate model in historical periods will remain unchanged in future periods. Therefore, the accuracy of future climate data after bias correction still depends on the climate data themselves [54].
Previous studies showed that crop adaptation to high temperatures has increased [55]. Therefore, this study may overestimate the possible negative effects of climate change on cotton growth processes (Figure 8a). In addition, existing crop models generally assume that the rate of crop development will remain constant once the temperature exceeds a specific threshold, such as 30 °C [56]. However, some studies suggested that the rate of crop development may slow as temperatures continue to rise, meaning that crops have more time to accumulate dry matter [57], leading to a possible overestimation of the adverse effects of climate change in this study.

5. Conclusions

This study provides critical strategies for sustainable cotton management in arid saline–alkali regions. In low-to-medium-salinity soils (3–6 dS/m), moderate irrigation (3600 m3/hm2) combined with a reduced nitrogen input (210 kg/hm2) achieves a near-maximum yield (6918 kg/hm2) while conserving 20% more water and 33% more fertilizer compared to conventional practices. However, high-salinity soils (9 dS/m) require full irrigation (4500 m3/hm2) and nitrogen application (315 kg/hm2) to mitigate salt-induced damage. Climate projections reveal that future warming will shorten the cotton growing season by 1.2–9.5 days per decade, but elevated CO2 concentrations (832 ppm under SSP5-8.5) enhance water use efficiency (↑27.5%) and biomass accumulation, confirming that the CO2 fertilization effect can partially offset heat-driven yield declines, highlighting its dual role in climate resilience. The RZWQM2 model demonstrates a robust performance in simulating water–salt–nitrogen interactions (NRMSE: 5.94–12.88%), yet the integration of dynamic mulch modules and extreme temperature response mechanisms is required to optimize its prediction accuracy. The findings provide scientific support for Xinjiang’s water resource policies, emphasizing the importance of salinity gradient management in balancing water conservation and yield stability. Farmers are advised to adopt salinity-adaptive irrigation schedules and leverage CO2 benefits, while policymakers should incorporate saline–alkali thresholds into regional agricultural guidelines. Future efforts should validate threshold universality, enhance model capabilities for extreme climate characterization, and explore socio-economic barriers to implementing optimized practices.

Supplementary Materials

The following supporting information can be downloaded at https://www.mdpi.com/article/10.3390/agronomy15061305/s1. Text S1. The groundwater quality of the experimental base of the Key Laboratory of Modern Water-saving Irrigation in the Corps of Shihezi University; Text S2. Soil salinity adjustment in the experimental area; Text S3. Soil hydraulic parameters; Text S4. Simulation of cotton growth under Future climate change (without eCO2). Table S1. Concentrations of ions in the groundwater; Table S2. Initial nutrient content of soil in experimental area; Table S3. Climate model information; Table S4. Data sources and descriptions; Table S5. Cotton plant height, stem diameter, LAI and yield of different treatments; Table S6. Simulation accuracy of RZWQM2 on soil water content in each soil layer of different treatments; Table S7. Simulation accuracy of RZWQM2 on soil nitrate nitrogen content at each fertility stage of different treatments; Table S8. Simulation accuracy of RZWQM2 on aboveground biomass and yield of cotton in different treatments; Figure S1. The annual variations in relative humidity, wind speed, sunshine hours, and reference evapotranspiration (ET0) during 2022–2023; Figure S2. Latitude and longitude of groundwater sampling. Note: No.: 1341-032-9063; Shooting Time: 2024.09.03 10:25; Weather: Cloudy, 15°C; Location: Erlian, Experimental Farm of Shihezi University, Shihezi City; Altitude: 365.0 meters; Azimuth: 183° South; Longitude: 85.995631° E; Latitude: 44.324257° N; Figure S3. Physical properties of 0–60 cm soil in experimental area; Figure S4. Changes of yield, aboveground biomass, potential evaporation and water use coefficient under future scenarios.

Author Contributions

F.Z. conceived the experiments, analyzed the results, and wrote the manuscript. Z.Z. conceived the experiments, analyzed the results, and wrote and revised the manuscript. T.H. provided important feedback, making the article more complete. X.H. reviewed the article and provided suggestions. All authors have read and agreed to the published version of the manuscript.

Funding

This research was funded by The Key Field Science and Technology Research Project of Xinjiang Uygur Autonomous Region Corps (Project No. 2023AB059), 2024 Bingtuan Graduate Innovation Project (Project No. BTYJXM-2024-S10).

Data Availability Statement

The CMIP6 data used in this study were sourced from the World Climate Research Programme’s Working Group on Coupled Modelling and are freely available through the Earth System Grid Federation (ESGF) at https://esgf-index1.ceda.ac.uk/search/cmip6-ceda/, accessed on 10 November 2024. The original contributions presented in the study are included in the article; further inquiries can be directed to the corresponding or first author.

Conflicts of Interest

The authors declare no conflicts of interest.

References

  1. Chen, T.; Yang, X.; Zuo, Z.; Xu, H.; Yang, X.; Zheng, X.; He, S.; Wu, X.; Lin, X.; Li, Y.; et al. Shallow wet irrigation reduces nitrogen leaching loss rate in paddy fields by microbial regulation and lowers rate of downward migration of leaching water: A 15N-tracer study. Front. Plant Sci. 2024, 15, 1340336. [Google Scholar] [CrossRef] [PubMed]
  2. Zhang, F.; Qu, Z.; Zhao, Q.; Xi, Z.; Liu, Z. Mechanisms of N2O Emission in Drip-Irrigated Saline Soils: Unraveling the Role of Soil Moisture Variation in Nitrification and Denitrification. Agronomy 2025, 15, 10. [Google Scholar] [CrossRef]
  3. Duc, K.N.; Ancev, T.; Randall, A. Evidence of climatic change in Vietnam: Some implications for agricultural production. J. Environ. Manag. 2018, 231, 524–545. [Google Scholar]
  4. Kim, K.-H.; Lee, B.-M. Effects of Climate Change and Drought Tolerance on Maize Growth. Plants 2023, 12, 3548. [Google Scholar] [CrossRef] [PubMed]
  5. Wang, H.L.; Gan, Y.T.; Wang, R.Y.; Niu, J.Y.; Zhao, H.; Yang, Q.G.; Li, G.C. Phenological trends in winter wheat and spring cotton in response to climate changes in northwest China. Agric. For. Meteorol. 2008, 148, 1242–1251. [Google Scholar] [CrossRef]
  6. Abbas, G.; Ahmad, S.; Ahmad, A.; Nasim, W.; Fatima, Z.; Hussain, S.; Rehman, M.H.u.; Khan, M.A.; Hasanuzzaman, M.; Fahad, S.; et al. Quantification the impacts of climate change and crop management on phenology of maize-based cropping system in Punjab, Pakistan. Agric. For. Meteorol. 2017, 247, 42–55. [Google Scholar] [CrossRef]
  7. Dermody, O.; Weltzin, J.F.; Engel, E.C.; Allen, P.; Norby, R.J. How do elevated [CO2], warming, and reduced precipitation interact to affect soil moisture and LAI in an old field ecosystem? Plant Soil 2007, 301, 255–266. [Google Scholar] [CrossRef]
  8. Tavakkoli, E.; Rengasamy, P.; McDonald, G.K. High concentrations of Na+ and Cl ions in soil solution have simultaneous detrimental effects on growth of faba bean under salinity stress. J. Exp. Bot. 2010, 61, 4449–4459. [Google Scholar] [CrossRef]
  9. Broughton, K.; Nunn, C.; Bange, M. The here and now of climate change: Climatic trends throughout Australian cotton regions and implications for the growing season. Field Crops Res. 2024, 315, 109491. [Google Scholar] [CrossRef]
  10. Ahmad, S.; Ahmad, I.; Ahmad, B.; Ahmad, A.; Wajid, A.; Khaliq, T.; Abbas, G.; Wilkerson, C.J.; Hoogenboom, G. Regional integrated assessment of climate change impact on cotton production in a semi-arid environment. Clim. Res. 2023, 89, 113–132. [Google Scholar] [CrossRef]
  11. Wang, Z.; Qi, Z.; Xue, L.; Bukovsky, M. RZWQM2 simulated management practices to mitigate climate change impacts on nitrogen losses and corn production. Environ. Model. Softw. 2016, 84, 99–111. [Google Scholar] [CrossRef]
  12. Chen, X.; Qi, Z.; Gui, D.; Gu, Z.; Ma, L.; Zeng, F.; Li, L. Simulating impacts of climate change on cotton yield and water requirement using RZWQM2. Agric. Water Manag. 2019, 222, 231–241. [Google Scholar] [CrossRef]
  13. Cheng, H.; Shu, K.; Qi, Z.; Ma, L.; Jin, V.L.; Li, Y.; Schmer, M.R.; Wienhold, B.J.; Feng, S. Effects of residue removal and tillage on greenhouse gas emissions in continuous corn systems as simulated with RZWQM2. J. Environ. Manag. 2021, 285, 112097. [Google Scholar] [CrossRef] [PubMed]
  14. Amouzou, K.A.; Naab, J.B.; Lamers, J.P.A.; Borgemeister, C.; Becker, M.; Vlek, P.L.G. CROPGRO-Cotton model for determining climate change impacts on yield, water- and N- use efficiencies of cotton in the Dry Savanna of West Africa. Agric. Syst. 2018, 165, 85–96. [Google Scholar] [CrossRef]
  15. Xu, Y. Effects of Film Amount on Soil Physical Properties and Crop Growth in Cotton Field. Master’s Thesis, Shihezi University, Shihezi, China, 2022. [Google Scholar]
  16. Wu, L.; Zhang, F.; Zhou, H.; Suo, Y.; Xue, F.; Zhou, J.; Liang, F. Effect of drip irrigation and fertilizer application on water use efficiency and cotton yield in North of Xinjiang. Trans. Chin. Soc. Agric. Eng. 2014, 30, 137–146. [Google Scholar]
  17. Liu, L. Constitute and Distributing Character of Salinity in Soil in Xinjiang. Arid Environ. Monit. 2009, 23, 227–229. [Google Scholar]
  18. Wu, F.; Qiu, Y.; Huang, W.; Guo, S.; Han, Y.; Wang, G.; Li, X.; Lei, Y.; Yang, B.; Xiong, S.; et al. Water and heat resource utilization of cotton under different cropping patterns and their effects on crop biomass and yield formation. Agric. For. Meteorol. 2022, 323, 109091. [Google Scholar] [CrossRef]
  19. Hinrichsen, K. The Ångström formula with coefficients having a physical meaning. Sol. Energy 1994, 52, 491–495. [Google Scholar] [CrossRef]
  20. Xiang, Y.; Cheng, R.; Wang, M.; Ding, Y. Response of Matching Degree between Precipitation and Maize Water Requirement to Climate Change in China. Agronomy 2024, 14, 181. [Google Scholar] [CrossRef]
  21. Nolan, B.T.; Puckett, L.J.; Ma, L.; Green, C.T.; Bayless, E.R.; Malone, R.W. Predicting Unsaturated Zone Nitrogen Mass Balances in Agricultural Settings of the United States. J. Environ. Qual. 2010, 39, 1051–1065. [Google Scholar] [CrossRef]
  22. Jamieson, P.D.; Porter, J.R.; Wilson, D.R. A test of computer simulation model ARC-WHEAT1 on wheat crops grown in New Zealand. Field Crop Res. Field Crops Res. 1991, 27, 337–350. [Google Scholar] [CrossRef]
  23. Ding, D.; Li, T.; Wu, L.; Zhang, X.; Zhao, Y.; Feng, H.; Zhang, C.; Wendroth, O. Energy Compensation for Crop Growth under Plastic Mulching: Theories, Models, and Limitations. Agronomy 2024, 14, 1005. [Google Scholar] [CrossRef]
  24. Hussain, S.; Teshome, F.T.; Tulu, B.B.; Awoke, G.W.; Hailegnaw, N.S.; Bayabil, H.K. Leaf area index (LAI) prediction using machine learning and UAV based vegetation indices. Eur. J. Agron. 2025, 168, 127557. [Google Scholar] [CrossRef]
  25. Zhang, D.; Liang, H.; He, X.; Shi, Y. Estimation of runoff and hydrological drought in the Jinsha River Basin based on CMIP6. Water Resour. Prot. 2023, 39, 53–62. [Google Scholar]
  26. Tong, Y.; Gao, X.; Han, Z.; Xu, Y.; Xu, Y.; Giorgi, F. Bias correction of temperature and precipitation over China for RCM simulations using the QM and QDM methods. Clim. Dyn. 2020, 57, 1425–1443. [Google Scholar] [CrossRef]
  27. He, C.; Luo, C.; Chen, F.; Long, A.; Tang, H. CMIP6 multi-model prediction of future climate change in the Hotan River Basin. Earth Sci. Front. 2023, 30, 515–528. [Google Scholar]
  28. Wang, H.; Yin, Z.; Zhang, L.; Zhao, F.; Huang, W.; Wang, X.; Gao, Y. Irrigation modulates the effect of increasing temperatures under climate change on cotton production of drip irrigation under plastic film mulching in southern Xinjiang. Front. Plant Sci. 2022, 13, 1069190. [Google Scholar] [CrossRef]
  29. An, M.; Zhu, Y.; Chang, D.; Wang, X.; Wang, K. Metabolic and Photosynthesis Analysis of Compound-Material-Mediated Saline and Alkaline Stress Tolerance in Cotton Leaves. Plants 2025, 14, 394. [Google Scholar] [CrossRef]
  30. Shangguan, X.; Wang, X.; Yuan, M.; Gao, M.; Liu, Z.; Li, M.; Zong, R.; Sun, C.; Zhang, M.; Li, Q. Effects of long-term biodegradable film mulching on yield and water productivity of maize in North China Plain. Agric. Water Manag. 2024, 304, 109094. [Google Scholar] [CrossRef]
  31. Chen, H.; Jeanne Huang, J.; Li, H.; Wei, Y.; Zhu, X. Revealing the response of urban heat island effect to water body evaporation from main urban and suburb areas. J. Hydrol. 2023, 623, 129687. [Google Scholar] [CrossRef]
  32. Huang, X.; Xu, B.; Tan, S.; Huang, Y.; Xi, J.; Qin, X.; Chen, T.; Chen, H.; Yang, X.; Yi, K. Transcriptome Sequencing of Agave angustifolia Reveals Conservation and Diversification in the Expression of Cinnamyl Alcohol Dehydrogenase Genes in Agave Species. Agriculture 2022, 12, 1003. [Google Scholar] [CrossRef]
  33. Jiang, X.; Liu, C.; Hu, Y.; Shao, K.; Tang, X.; Gao, G.; Qin, B. Salinity-Linked Denitrification Potential in Endorheic Lake Bosten (China) and Its Sensitivity to Climate Change. Front. Microbiol. 2022, 13, 922546. [Google Scholar] [CrossRef] [PubMed]
  34. Wang, Z.; Wang, C. Interactive effects of elevated temperature and drought on plant carbon metabolism: A meta-analysis. Glob. Change Biol. 2023, 29, 2824–2835. [Google Scholar] [CrossRef]
  35. Li, Y.; Feng, Q.; Li, D.; Li, M.; Ning, H.; Han, Q.; Hamani, A.K.M.; Gao, Y.; Sun, J. Water-Salt Thresholds of Cotton (Gossypium hirsutum L.) under Film Drip Irrigation in Arid Saline-Alkali Area. Agriculture 2022, 12, 1769. [Google Scholar] [CrossRef]
  36. Parkash, V.; Snider, J.L.; Virk, G.; Dhillon, K.K.; Lee, J.M. Diffusional and Biochemical Limitations to Photosynthesis Under Water Deficit for Field-Grown Cotton. Physiol. Plant. 2024, 176, e14281. [Google Scholar] [CrossRef]
  37. Lin, M.; Wang, L.; Lv, G.; Gao, C.; Zhao, Y.; Li, X.; He, L.; Sun, W. Deficit Irrigation Effects on Cotton Growth Cycle and Preliminary Optimization of Irrigation Strategies in Arid Environment. Plants 2024, 13, 1403. [Google Scholar] [CrossRef]
  38. Kumar, R.; Pareek, N.K.; Kumar, U.; Javed, T.; Al-Huqail, A.A.; Rathore, V.S.; Nangia, V.; Choudhary, A.; Nanda, G.; Ali, H.M.; et al. Coupling Effects of Nitrogen and Irrigation Levels on Growth Attributes, Nitrogen Use Efficiency, and Economics of Cotton. Front. Plant Sci. 2022, 13, 890181. [Google Scholar] [CrossRef]
  39. He, P.; Yu, S.e.; Zhang, F.; Ma, T.; Ding, J.; Chen, K.; Chen, X.; Dai, Y. Effects of Soil Water Regulation on the Cotton Yield, Fiber Quality and Soil Salt Accumulation under Mulched Drip Irrigation in Southern Xinjiang, China. Agronomy 2022, 12, 1246. [Google Scholar] [CrossRef]
  40. Bo, L.; Zhao, Y.; Mao, X.; Chen, S. Response and Simulation of Farmland Water Salt Transport and Growth of Crops to Deficit Drip Irrigation. Trans. Chin. Soc. Agric. Mach. 2021, 52, 248–255. [Google Scholar]
  41. Qadir, M.; Shams, M. Some Agronomic and Physiological Aspects of Salt Tolerance in Cotton (Gossypium hirsutum L.). J. Agron. Crop Sci. 1997, 179, 101–106. [Google Scholar] [CrossRef]
  42. Wang, T.; Wang, Z.; Zhang, J.; Ma, K. An optimum combination of irrigation amount, irrigation water salinity and nitrogen application rate can improve cotton (for fiber) nitrogen uptake and final yield. Ind. Crops Prod. 2022, 187, 115386. [Google Scholar] [CrossRef]
  43. Ma, Y.Y.; Wei, Z.H.; Liu, J. Growth and physiological responses of cotton plants to salt stress. J. Agron. Crop Sci. 2021, 207, 565–576. [Google Scholar] [CrossRef]
  44. Hussain, K.; Ilyas, A.; Ali, S.; Bibi, I.; Shakil, Q.; Farid, M.; Saqib, Z.; Habib, A.; Hakki, E. Impacts of Nitrogen Fertilizer Application and Mulching on the Morpho-Physiological and Yield-Related Traits in Cotton. Agriculture 2022, 13, 12. [Google Scholar] [CrossRef]
  45. Tian, Y.; Tian, L.; Wang, F.; Shi, X.; Shi, F.; Hao, X.; Li, N.; Chenu, K.; Luo, H.; Yang, G. Optimizing nitrogen application improves its efficiency by higher allocation in bolls of cotton under drip fertigation. Field Crops Res. 2023, 298, 108968. [Google Scholar] [CrossRef]
  46. Saseendran, S.A.; Ma, L.; Malone, R.; Heilman, P.; Ahuja, L.R.; Kanwar, R.S.; Karlen, D.L.; Hoogenboom, G. Simulating management effects on crop production, tile drainage, and water quality using RZWQM–DSSAT. Geoderma 2007, 140, 297–309. [Google Scholar] [CrossRef]
  47. Challinor, A.J.; Koehler, A.K.; Ramirez-Villegas, J.; Whitfield, S.; Das, B. Current warming will reduce yields unless maize breeding and seed systems adapt immediately. Nat. Clim. Change 2016, 6, 954–958. [Google Scholar] [CrossRef]
  48. Reddy, K.R.; Zhao, D. Interactive effects of elevated CO2 and potassium deficiency on photosynthesis, growth, and biomass partitioning of cotton. Field Crops Res. 2005, 94, 201–213. [Google Scholar] [CrossRef]
  49. Luo, Q. Temperature thresholds and crop production: A review. Clim. Change 2011, 109, 583–598. [Google Scholar] [CrossRef]
  50. Zhang, M.; Wei, G.; Cui, B.; Liu, C.; Wan, H.; Hou, J.; Chen, Y.; Zhang, J.; Liu, J.; Wei, Z. CO2 elevation and N fertilizer supply modulate leaf physiology, crop growth and water use efficiency of maize in response to progressive soil drought. J. Agron. Crop Sci. 2024, 210, e12692. [Google Scholar] [CrossRef]
  51. Ding, Q.; Luo, Y. Adaptation of paddy rice in China to climate change: The effects of shifting sowing date on yield and irrigation water requirement. Agric. Water Manag. 2020, 228, 105890. [Google Scholar] [CrossRef]
  52. Li, C.; Zwiers, F.; Zhang, X.; Li, G.; Sun, Y.; Wehner, M. Changes in annual extremes of daily temperature and precipitation in CMIP6 models. J. Clim. 2020, 34, 3441–3460. [Google Scholar] [CrossRef]
  53. Song, Y.-H.; Chung, E.-S.; Shahid, S. The New Bias Correction Method for Daily Extremes Precipitation over South Korea using CMIP6 GCMs. Water Resour. Manag. 2022, 36, 5977–5997. [Google Scholar] [CrossRef]
  54. Maraun, D. Bias Correcting Climate Change Simulations—A Critical Review. Curr. Clim. Change Rep. 2016, 2, 211–220. [Google Scholar] [CrossRef]
  55. Fu, G.; Song, J.; Xiong, J.; Liao, X.-y.; Zhang, X.-f.; Wang, X.; Le, M.-k.; Tao, L.-x. Thermal Resistance of Common Rice Maintainer and Restorer Lines to High Temperature During Flowering and Early Grain Filling Stages. Rice Sci. 2012, 19, 309–314. [Google Scholar] [CrossRef]
  56. Wit, A.d.; Boogaard, H.; Fumagalli, D.; Janssen, S.; Knapen, R.; Kraalingen, D.v.; Supit, I.; Wijngaart, R.v.d.; Diepen, K.v. 25 years of the WOFOST cropping systems model. Agric. Syst. 2019, 168, 154–167. [Google Scholar] [CrossRef]
  57. Li, T.; Angeles, O.; Marcaida, M.; Manalo, E.; Manalili, M.P.; Radanielson, A.; Mohanty, S. From ORYZA2000 to ORYZA (v3): An improved simulation model for rice in drought and nitrogen-deficient environments. Agric. For. Meteorol. 2017, 237–238, 246–256. [Google Scholar] [CrossRef]
Figure 1. Schematic of the study area.
Agronomy 15 01305 g001
Figure 2. Schematic diagram of cotton trials. Note: * indicates the sampling area using the crossing method after equidistant placement.
Agronomy 15 01305 g002
Figure 3. Changes in cotton plant height, stem thickness, LAI, and yield in 2022 and 2023. (a) Changes in plant height under different water-salt-nitrogen treatments from 2022 to 2023, (b) Changes in stem thickness under different water-salt-nitrogen treatments from 2022 to 2023, (c) Changes in LAI under different water-salt-nitrogen treatments from 2022 to 2023, (d) Changes in yield under different water-salt-nitrogen treatments from 2022 to 2023.
Agronomy 15 01305 g003
Figure 4. Aboveground dry matter accumulation of cotton in the growing stage.
Agronomy 15 01305 g004
Figure 5. Comparison of measured and RZWQM2-simulated values of water content for different treatments in the 0–60 cm soil layer.
Agronomy 15 01305 g005
Figure 6. A comparison of the measured and RZWQM2-simulated values of nitrate nitrogen in 0–60 cm soil profiles of different treatments.
Agronomy 15 01305 g006
Figure 7. Relationship between simulated and measured yields, as well as aboveground biomass.
Agronomy 15 01305 g007
Figure 8. Comparison of measured aboveground biomass and yield of different treatments with simulated values of the RZWQM2 model. (a) Comparison of measured aboveground biomass of different treatments with simulated values of the RZWQM2 model, (b) Comparison of measured yield of different treatments with simulated values of the RZWQM2 model, (c) Comparison of simulation values of the RZWQM2 model under 27 treatments.
Agronomy 15 01305 g008
Figure 9. Multi-model mean changes in major meteorological elements in the three periods in the future scenario relative to the historical base period (1960–2014).
Agronomy 15 01305 g009
Figure 10. Changes in yield, aboveground biomass, ETpot and water use coefficient under future scenarios. (a) Changes in yield of three treatments under the SSP2.4-5 Scenario, (b) Changes in yield of three treatments under the SSP5.8-5 Scenario, (c) Changes in aboveground biomass of three treatments under the SSP2.4-5 Scenario, (d) Changes in aboveground biomass of three treatments under the SSP5.8-5 Scenario, (e) Changes in ETpot of three treatments under the SSP2.4-5 Scenario, (f) Changes in ETpot of three treatments under the SSP5.8-5 Scenario, (g) Changes in WUE of three treatments under the SSP2.4-5 Scenario, (h) Changes in WUE of three treatments under the SSP5.8-5 Scenario.
Agronomy 15 01305 g010
Table 1. Irrigation and fertilization schedule for cotton.
Growth PeriodIrrigation Time/
(Month-Day)
Irrigation Amount/(m3/hm2)Nitrogen Amount/(kg/hm2)Phosphate and Potash Fertilizer/(kg/hm2)
20222023W1W2CK3F1F2CK2
Seedling stage15 June05 June108.0144.0180.06.613.119.76.8
25 June15 June
Bud stage05 July25 June297.0396.0495.013.126.339.413.6
12 July10 July
19 July17 July
Flower and boll stage26 July24 July275.4367.2459.010.521.031.516.3
02 August03 August
12 August10 August
22 August17 August
29 August24 August
Batting stage12 September02 September216.0288.0360.00000
Table 2. Crop parameters after calibration.
ParameterNameValue
Before CalibrationAfter Calibration
EM-FLThe time between germination and flowering of crops/d30~5032
FL-SHThe time from first flower to first pod/d8~128
FL-SDThe time from first flower to first bell/d12~2012
SD-PMThe time from the first boll to the ripening of cotton/d40~6047
FL-LFThe time from first flower to full leaf development/d52~7575
LFMAXMaximum leaf photosynthetic rate at 30 °C, 350 mg∙kg−1 CO2, and maximum light intensity/(mg⸱m−2/s)0.95~1.151.15
SLAVRSpecific leaf area of crops under normal growing conditions/(cm2/g)170~250179
SIZLFThe maximum size of the whole leaf/cm2250~300280
XFRTThe maximum size of the whole leaf0.5~1.00.92
WTPSDMaximum mass per seed/g0.180.18
SFDURGrout duration of pods under normal growth conditions/d20~4035
SDPDVThe average number of seeds per pod under normal growing conditions20~3027
PODURThe average number of seeds per pod under normal growing conditions/d8~158
Table 3. Optimal soil hydraulic parameters in the RZWQM2 model.
Soil Depth/cmHydraulic Conductivity/(g/cm3)Field Capacity/
(cm3/cm3)
Wilting Point/(cm3/cm3)
0~200.42400.21650.1095
>20~400.23000.19700.0917
>40~600.43000.23350.1163
Note: the field water holding capacity and wilting water content were determined using the ring knife method and the pressure film method, respectively.
Table 4. Climatic characteristics of the study area during the period from 1960 to 2014.
Climate VariableMeanClimate Tendency Rate (10 y)−1
Maximum temperature of growing season (°C)26.090.32
Minimum temperature of growing season (°C)11.190.44
Solar radiation of growing season (MJ/m2/day)9.650.04
Precipitation of growing season (mm)136.763.72
Wind speed of growing season (km/day)146.40−1.66
Relative humidity of growing season (%)52.89−0.26
Disclaimer/Publisher’s Note: The statements, opinions and data contained in all publications are solely those of the individual author(s) and contributor(s) and not of MDPI and/or the editor(s). MDPI and/or the editor(s) disclaim responsibility for any injury to people or property resulting from any ideas, methods, instructions or products referred to in the content.