Article

Fungal Necromass Carbon Stabilizes Rhizosphere Soil Organic Carbon: Microbial Degradation Gene Insights Under Straw and Biochar

1
Key Laboratory of Agricultural Resources and Ecology in Poyang Lake Watershed of Ministry of Agriculture and Rural Affairs in China, Nanchang 330045, China
2
College of Land Resources and Environment, Jiangxi Agricultural University, Nanchang 330045, China
3
College of Forestry, Hebei Agricultural University, Baoding 071000, China
*
Author to whom correspondence should be addressed.
Agronomy 2025, 15(6), 1303; https://doi.org/10.3390/agronomy15061303
Submission received: 20 April 2025 / Revised: 22 May 2025 / Accepted: 24 May 2025 / Published: 27 May 2025
(This article belongs to the Section Agricultural Biosystem and Biological Engineering)

Abstract

:
Microbial necromass carbon (MNC) is the dominant contributor to soil organic carbon (SOC). However, the contribution of MNC in different soil compartments to SOC sequestration has not been comprehensively studied, especially under the organic fertilizers input. To address this gap, we conducted a rice root box experiment by adding organic fertilizer (straw and straw biochar) and chemical fertilizer alone to red loamy paddy soil, respectively. We found that although SOC accumulation was stimulated by both biochar and straw in the rhizosphere, more substantial SOC was sequestered in the rhizosphere due to biochar addition (increased by 25.82% compared to straw addition). Additionally, the input of organic fertilizers resulted in varying degrees of MNC retention in the different soil compartments. Compared with that in bulk soil, fungal necromass carbon (FNC) content was reduced by 1.37% and 7.06%, and bacterial necromass carbon (BNC) content was reduced by 5.53% and 9.49% in the rhizosphere and hyphosphere, respectively, following straw addition. Conversely, the addition of biochar leads to a significant increase of FNC (increased by 2.92%) and BNC (increased by 2.00%) in the rhizosphere compared with bulk soil. However, straw addition also significantly enhanced SOC thermal stability within the rhizosphere and hyphosphere soils. Based on partial least squares path modeling, we found that SOC thermal stability was significantly and positively influenced by FNC, which was strongly associated with carbon degradation gene abundance. These results emphasize the critical role of soil compartments in SOC sequestration under organic fertilizer application and underscore the importance of FNC in enhancing SOC stability in the rhizosphere.

Graphical Abstract

1. Introduction

Soil organic carbon (SOC) is the largest terrestrial carbon (C) pool [1], crucial for maintaining ecosystem adaptability and productivity [2]. Slight changes in the SOC pool greatly influence atmospheric CO2 levels [1], which will trigger positive feedback to enhance climate warming. As the largest wetland cropping system [3], the enhancement of the C pool in paddy soils has been considered to hold potential for C sequestration [4]. Thus, evaluating paddy SOC sequestration is considered vital for mitigating global climate change impacts and ensuring the sustainability of agricultural systems. In recent years, agricultural soil management practices, such as the return of straw and biochar to farmland, have become increasingly important to input exogenous organic C into farmland soil and promote C sequestration [5,6]. However, poor agricultural management may aggravate SOC mineralization and loss [7,8]. Therefore, insights into the effects of fertilization regimes on SOC sequestration are critical for guiding agroecosystem management strategies.
Soil microorganisms play a crucial role in SOC sequestration, which can assimilate organic carbon components and transform them into their own components, and then promote the formation and accumulation of necromass (cellular components from both living and senesced biomass) through growth–death iteration [9]. Microbial necromass carbon (MNC) is essential for SOC accumulation [6]. MNC contributes between 27% and 82% of SOC [10,11], whereas the contribution of living microbial biomass to SOC is less than 5% [12]. MNC accumulation is shaped by various factors, among which agricultural soil management is pivotal. Increasing experimental evidence has demonstrated that the addition of straw and biochar can significantly influence MNC accumulation [13]. However, fungal and bacterial necromass responded inconsistently to different types of organic amendments. Sun et al. [14] found that biochar addition mainly increased fungal necromass carbon (FNC), whereas straw increased not only FNC but also bacterial necromass carbon (BNC). Following biochar addition into paddy soil, Chen et al. [15] observed that the contribution of FNC to SOC exceeded that of BNC. However, these studies treated soil as a homogeneous entity when examining the response of MNC to straw or biochar addition, without considering the potential heterogeneity introduced by microbial hotspots, such as the rhizosphere.
The rhizosphere, i.e., the soil zone that is affected by roots, is recognized to be a crucial driver of C, nutrients, and their dynamics and cycling in terrestrial systems [16]. Compared with bulk soil, rhizosphere soil exhibits greater microbial diversity and contains higher microbial abundance [17,18]. In general, higher microbial biomass concentration leads to greater microbial necromass accumulation [6]. Fungal and bacterial biomass tends to be more stable in the rhizosphere [19]. In addition, the input of rhizosphere deposits can accelerate the ‘in vivo’ turnover of microorganisms [20], thereby promoting the formation and iteration of microbial necromass in the rhizosphere [21,22]. Studies by Luo et al. [23] and Jia et al. [24] found that microbial byproducts are more concentrated in the rhizosphere, primarily because of the higher microbial abundance in that region, which continuously assimilates, synthesizes, and turns over root-derived C. Consequently, Sokol et al. [22] speculated that MNC may have greater potential to contribute to SOC in rhizosphere than that in bulk soil. Recently, this suggestion has been supported by Wang et al. [25] based on measurements of alpine soils. However, the input of labile root-derived C can also trigger a rhizosphere priming effect (PE), thereby leading to existing SOC undergoing decomposition and mineralization [26,27]. In addition, Zhu et al. [28] observed that the response of MNC to nitrogen addition differs between the root pathway and hyphal pathway, suggesting that MNC accumulation and its contribution to SOC vary significantly across distinct microbial hotspots, such as the rhizosphere and the hyphosphere. The hyphosphere refers to the narrow zone encompassing the extraradical hyphae, where the presence of hyphal exudates causes the chemical, physical, and biological properties of this region to differ from the bulk soil [29]. As in the rhizosphere, on the one hand, the hyphosphere leads to differences in microbial composition. Bacteria numbers tend to be greater in the rhizosphere than that in the hyphosphere [30], and the microbial structure and diversity in the hyphosphere are distinctly separated from those in the rhizosphere and bulk soils [31]. Moreover, hyphae can continuously contribute necromass to the soil owing to rapid hyphal growth and turnover, as well as the high production of fungal necromass [32,33]. In addition, the unstable C and organic acids secreted by living hyphae can also trigger a PE similar to that in the rhizosphere, leading to SOC decomposition [34]. Overall, because the rhizosphere and hyphosphere differ in interactions with surrounding soil microorganisms and in the intensity of the PE [35], these differences likely intensify the variation in contribution of microbe-derived organic matter to the total organic matter between the rhizosphere and the hyphosphere in paddy soil. However, these differences among the bulk soil, rhizosphere, and hyphosphere in paddy soils have not been quantified to date.
Numerous experiments have confirmed that MNC is important in the stabilization of organic C. First, microbial necromass is stabilized and retained in the soil by its incorporation into soil aggregates, and influences the formation and distribution of aggregates [36]. Furthermore, soluble compounds from living microbial cells tend to adsorb onto soil mineral surfaces during cell senescence [37], and this mineral adsorption protective mechanism reduces the interaction between MNC and decomposers. A portion of the fungal necromass, composed of fungal cell wall components such as chitin and melanin [38], has a more stable molecular structure and is less prone to decomposition compared with bacterial residues [39,40], effectively enhancing the stability of the organic C pool. The transformation of the initial C substrate into stabilized SOC is a complex process [41]. To effectively evaluate the persistence and stability of organic C, the simple and rapid thermogravimetric analysis method has been increasingly applied [32,42]. SOC thermal stability is strongly correlated with its decomposition and mineralization rates, directly influencing its dynamic changes [42]. However, the influence of MNC on SOC thermal stability in different soil compartments remains unclear.
To fill these knowledge gaps, we performed a rice pot experiment with the addition of organic materials and used a root box to separate the bulk, rhizosphere, and hyphosphere soil compartments. We measured soil properties and employed amino sugars to quantify FNC and BNC within each soil compartment. In addition, we quantified the differences in C-cycle functional genes in different soil compartments by metagenomic sequencing. We aimed (I) to investigate the response of SOC to organic fertilizer addition across different soil compartments, (II) to reveal the role of MNC in SOC accumulation within bulk, rhizosphere, and hyphosphere soils, and (III) to explore the relationship between microbe-derived organic matter and SOC thermal stability.

2. Materials and Methods

2.1. Root Box Experiment

Red loamy cultivated soils (0–20 cm depth) derived from Quaternary red clay parent material were collected from a rice paddy in Nanchang, Jiangxi Province, China. After removing stones and plant residues, the soil was naturally air-dried, then passed through a 2 mm mesh sieve for use. Straw used in the experiment was rice straw of variety Guangtai 8. The biochar was prepared by pyrolysis of the rice straw at 550 °C for 2 h in a muffle furnace and, after cooling, was passed through a 0.15 mm mesh sieve for use. The basic characteristics of the soil, straw, and biochar are listed in Table 1.
First, PVC root boxes (cuboid-shaped, length 30 cm, width 20 cm, and height 20 cm) were uniformly divided into three compartments by inserting two nylon mesh sheets. One nylon mesh had a 38 µm pore size, which fungal hyphae could pass through but not plant roots; the pore size of the second mesh was 0.45 µm, which could not be penetrated by fungal hyphae or plant roots. In this manner, the root box was divided into three compartments (Figure 1): bulk soil (S), rhizosphere soil (R), and hyphosphere soil (H).
The experiment included three treatments: chemical fertilizer containing nitrogen, phosphorus, and potassium (NPK); NPK plus rice straw biochar (NPKB); and NPK plus rice straw (NPKS). The air-dried soil (10 kg) was first mixed with the chemical fertilizer, which comprised 150 kg hm−2 N, 75 kg hm−2 P2O5, and 150 kg hm−2 K2O. Thereafter, the NPKB and NPKS soils were immediately thoroughly mixed with 1% biochar and 1% straw, respectively. The prepared soils were placed into the respective root box compartment. Tap water was used to flood the soil, with an approximately 5 cm deep layer of standing water above the soil surface. Seven days later, three seedlings of the rice cultivar ‘Guangtai 8’ were transplanted into each root box. Each treatment was replicated with three boxes, and all boxes were placed outdoors on the campus. The soil in the rice box was maintained as fully flooded during the rice growth period.
At the rice maturity stage, soil was sampled from each compartment within each root box. Approximately 0–15 cm depth of soil in each compartment was sampled with a soil extractor and divided into three portions: one portion was stored in a refrigerator at 4 °C for measurement of the soil aggregates distribution; one portion was air-dried and passed through 0.15 mm mesh and 1 mm mesh sieves for analysis of soil properties, MNC, and thermal stability; and the remaining portion was stored at −80 °C for subsequent metagenomic analysis.

2.2. Soil Properties Analysis

Soil samples were mixed with deionized water (solid/liquid = 1:2.5), then the pH value of the soil–water slurry was measured by using a pH meter (FiveEasy Plus PHS-2, Mettler-Toledo, Zurich, Switzerland). SOC and total nitrogen (TN) concentrations of each sample were quantified via an element analyzer (vario MACRO cube, Elementar, Franfurt, Germany). Soil available nitrogen (AN) was measured using the alkaline dissolved diffusion method. Soil available phosphorus (AP) was measured using the molybdenum–antimony colorimetric method with a UV-Vis spectrophotometer (759S, LengGuang Technology, Shanghai, China). Soil available potassium (AK) was determined using the ammonium acetate leaching method and measured with a flame photometer (FP6410, LengGuang Technology, Shanghai, China).
The thermal stability of SOC was determined with a thermogravimetric analyzer (Discovery TGA 55, New Castle, DE, USA). The thermogravimetric data reflect the change in mass loss of the samples during the heating process. The data were analyzed and processed to determine the mass losses between different temperature regions, and to calculate the ratios and the thermal stability indices [43] using first exotherm (Exo1), second exotherm (Exo2), and third exotherm (Exo3) to characterize the stability indices, which indicate the decomposition of different C groups (labile, recalcitrant, and refractory C, respectively) [44]. In addition, the temperature at which half of the total mass was lost during thermogravimetric analysis (TG-T50) and the ratio of labile C to the sum of recalcitrant C and refractory C (Exo1/(Exo2 + Exo3)) were used to indicate SOC thermal stability; the smaller the Exo1/(Exo2 + Exo3) value and the larger the TG-T50 value, the higher the SOC thermal stability [45].

2.3. Isolation of Soil Aggregates

The separation of different particle size aggregates was performed according to the wet sieving method of Six et al. [46]. In brief, 60–80 g fresh soil was placed in 0.25 and 0.053 mm mesh sieves, flooded with water for 30 min, then the sieves were moved up and down manually (frequency 25 cycles min−1, amplitude 3 cm, for 2 min). After one 2 min cycle, the soil aggregates > 0.25 mm, 0.25–0.053 mm, and <0.053 mm were separated. Then, the individual aggregates of each distinct particle size were subjected to desiccation (at 60 °C) and subsequently weighed.

2.4. Determination of MNC

The MNC was derived using the conversion of glucosamine (GluN) and muramic acid (MurA) data, where GluN and MurA were measured according to the gas chromatography method of Zhang and Amelung [47]. The specific steps for the separation and measurement of amino sugar derivatives are provided in the Supplementary Text S1. In this study, BNC = MurA × 45 × 10−3, where 45 is the conversion coefficient for MurA to BNC, and FNC = (GluN/179.17 − 2 × MurA/251.23) × 179.17 × 9 × 10−3, where 179.17 and 251.23 are the molecular mass of GluN and MurA, respectively, and 9 is the conversion coefficient for GluN to FNC [48].
To further reveal the differential contribution of MNC (comprising bacterial and fungal necromass C) to SOC sequestration following the addition of organic fertilizers in the bulk, rhizosphere, and hyphosphere soils, the ratio of net changes in MNC and SOC contents represents the microbial carbon pump (MCP) efficacy [49], calculated as follows: MCP efficacy (%SOC) = (MNCOF − MNCNPK)/(SOCOF − SOCNPK) × 100, where MNCOF and MNCNPK are the microbial necromass C contents under treatment with biochar or straw addition and under treatment with chemical fertilizers alone, respectively; and SOCOF and SOCNPK are the SOC contents under treatment with biochar or straw addition and under treatment with chemical fertilizers alone, respectively.

2.5. Screening of C-Cycle Functional Genes

Samples of the bulk, rhizosphere, and hyphosphere soils from the three treatments were subjected to metagenomic sequencing analysis. In total, 27 samples (three treatments × three compartments × three replicates) were analyzed. In brief, DNA was extracted, metagenomic libraries were prepared, and paired-end sequencing was conducted using an Illumina NovaSeq 6000 PE150 platform by Magigene Biotechnology Co., Ltd. (Shenzhen, China). Details of soil DNA extraction and metagenomic sequencing are provided in Supplementary Text S2. Targeted C-cycling genes were identified by filtering for genes associated with major C-cycling pathways that consistently appeared across all metagenomic samples. For statistical analysis, we removed the genes with absolute abundance <0.01% in the previous step. The relative abundances of C-cycling genes were then calculated by normalizing the original counts to the housekeeping gene rplB, and subsequently scaled to 104 cells [50]. Details of the selected functional genes are listed in the Supplementary Table S1.

2.6. Data Analysis

All samples were analyzed in triplicate. Variations in soil properties, MNC, and the thermal stability of SOC across different treatments and soil compartments were analyzed using ANOVA within the IBS SPSS Statistics (v. 27.0). According to the Duncan test, statistically significant differences among treatments or soil compartments were identified at a significance level of p < 0.05. Statistical analysis of the metagenomic data was mainly conducted with RStudio (v. 4.4.0). Principal coordinates analysis (PCoA) and similarity analysis (Anosim) were conducted using the “APE” and “vegan” packages in the RStudio, respectively, to evaluate variations in carbon cycle functional gene profiles across different treatments and soil compartments. Additionally, to assess the variation in functional genes affected by the addition of organic materials and the soil compartments, the log2-fold changes in the NPKB and NPKS treatments relative to the NPK treatment were determined using the “DESeq2” package in RStudio. Then, we used the “rstatix” package in RStudio to perform a Wilcoxon test, which analyzes the significance differences (p < 0.05) between these DESeq2 median ratios. Partial least squares path modeling (PLS-PM) was conducted to identify the crucial factors influencing SOC thermal stability using the “devtools” and “plspm” packages of R. GraphPad Prism 9.5.0 and the “ggplot2” package of R were used for visualization of the data.

3. Results

3.1. Changes in Soil Properties

The organic fertilizers and the different soil compartments significantly affected the soil properties (Table 2). Compared with NPK, soil contents of SOC, AK, and TN were significantly increased under NPKB and NPKS, and the strength of significance of the differences among treatments was ranked as NPKB > NPKS > NPK. SOC varied owing to the existence of the rhizosphere in each treatment. In general, the rhizosphere SOC was higher than that of bulk and hyphosphere soils, but the difference was significant only under NPKB. Similar to SOC, the pH value of the rhizosphere soil was significantly higher than that of bulk and hyphosphere soils under each treatment. In contrast, the lowest AN content was observed in rhizosphere soils under each treatment. The AP concentration in rhizosphere soil under NPK and NPKB was significantly lower than that of the bulk and hyphosphere soils. These results indicate the variability in soil properties responses to straw and biochar addition, along with the impact of different soil compartments on these properties.

3.2. Changes in Soil Aggregate Distribution

The soil aggregate size distributions are shown in Figure 2. For all soils, particles exceeding 0.053 mm in size accounted for the majority, with proportions varying between 74.91% and 88.76%. Compared with that under NPK, each soil compartment under NPKB and NPKS contained a higher proportion of macroaggregates (>0.25 mm). NPKS increased the percentage of macroaggregates in the rhizosphere and hyphosphere soils to a greater degree. The highest percentage of macroaggregates was observed in rhizosphere soils under NPKS (53.25%). The distribution of small aggregates (<0.053 mm) differed from that of macroaggregates. The proportion of small aggregates under NPKS exceeded that under NPKB, with the highest percentage present in bulk soil (24.17%). The medium-sized aggregates (0.053–0.25 mm) exhibited relatively greater variation in each soil compartment under the different treatments, and the percentages under NPKB and NPKS were less than those under NPK.

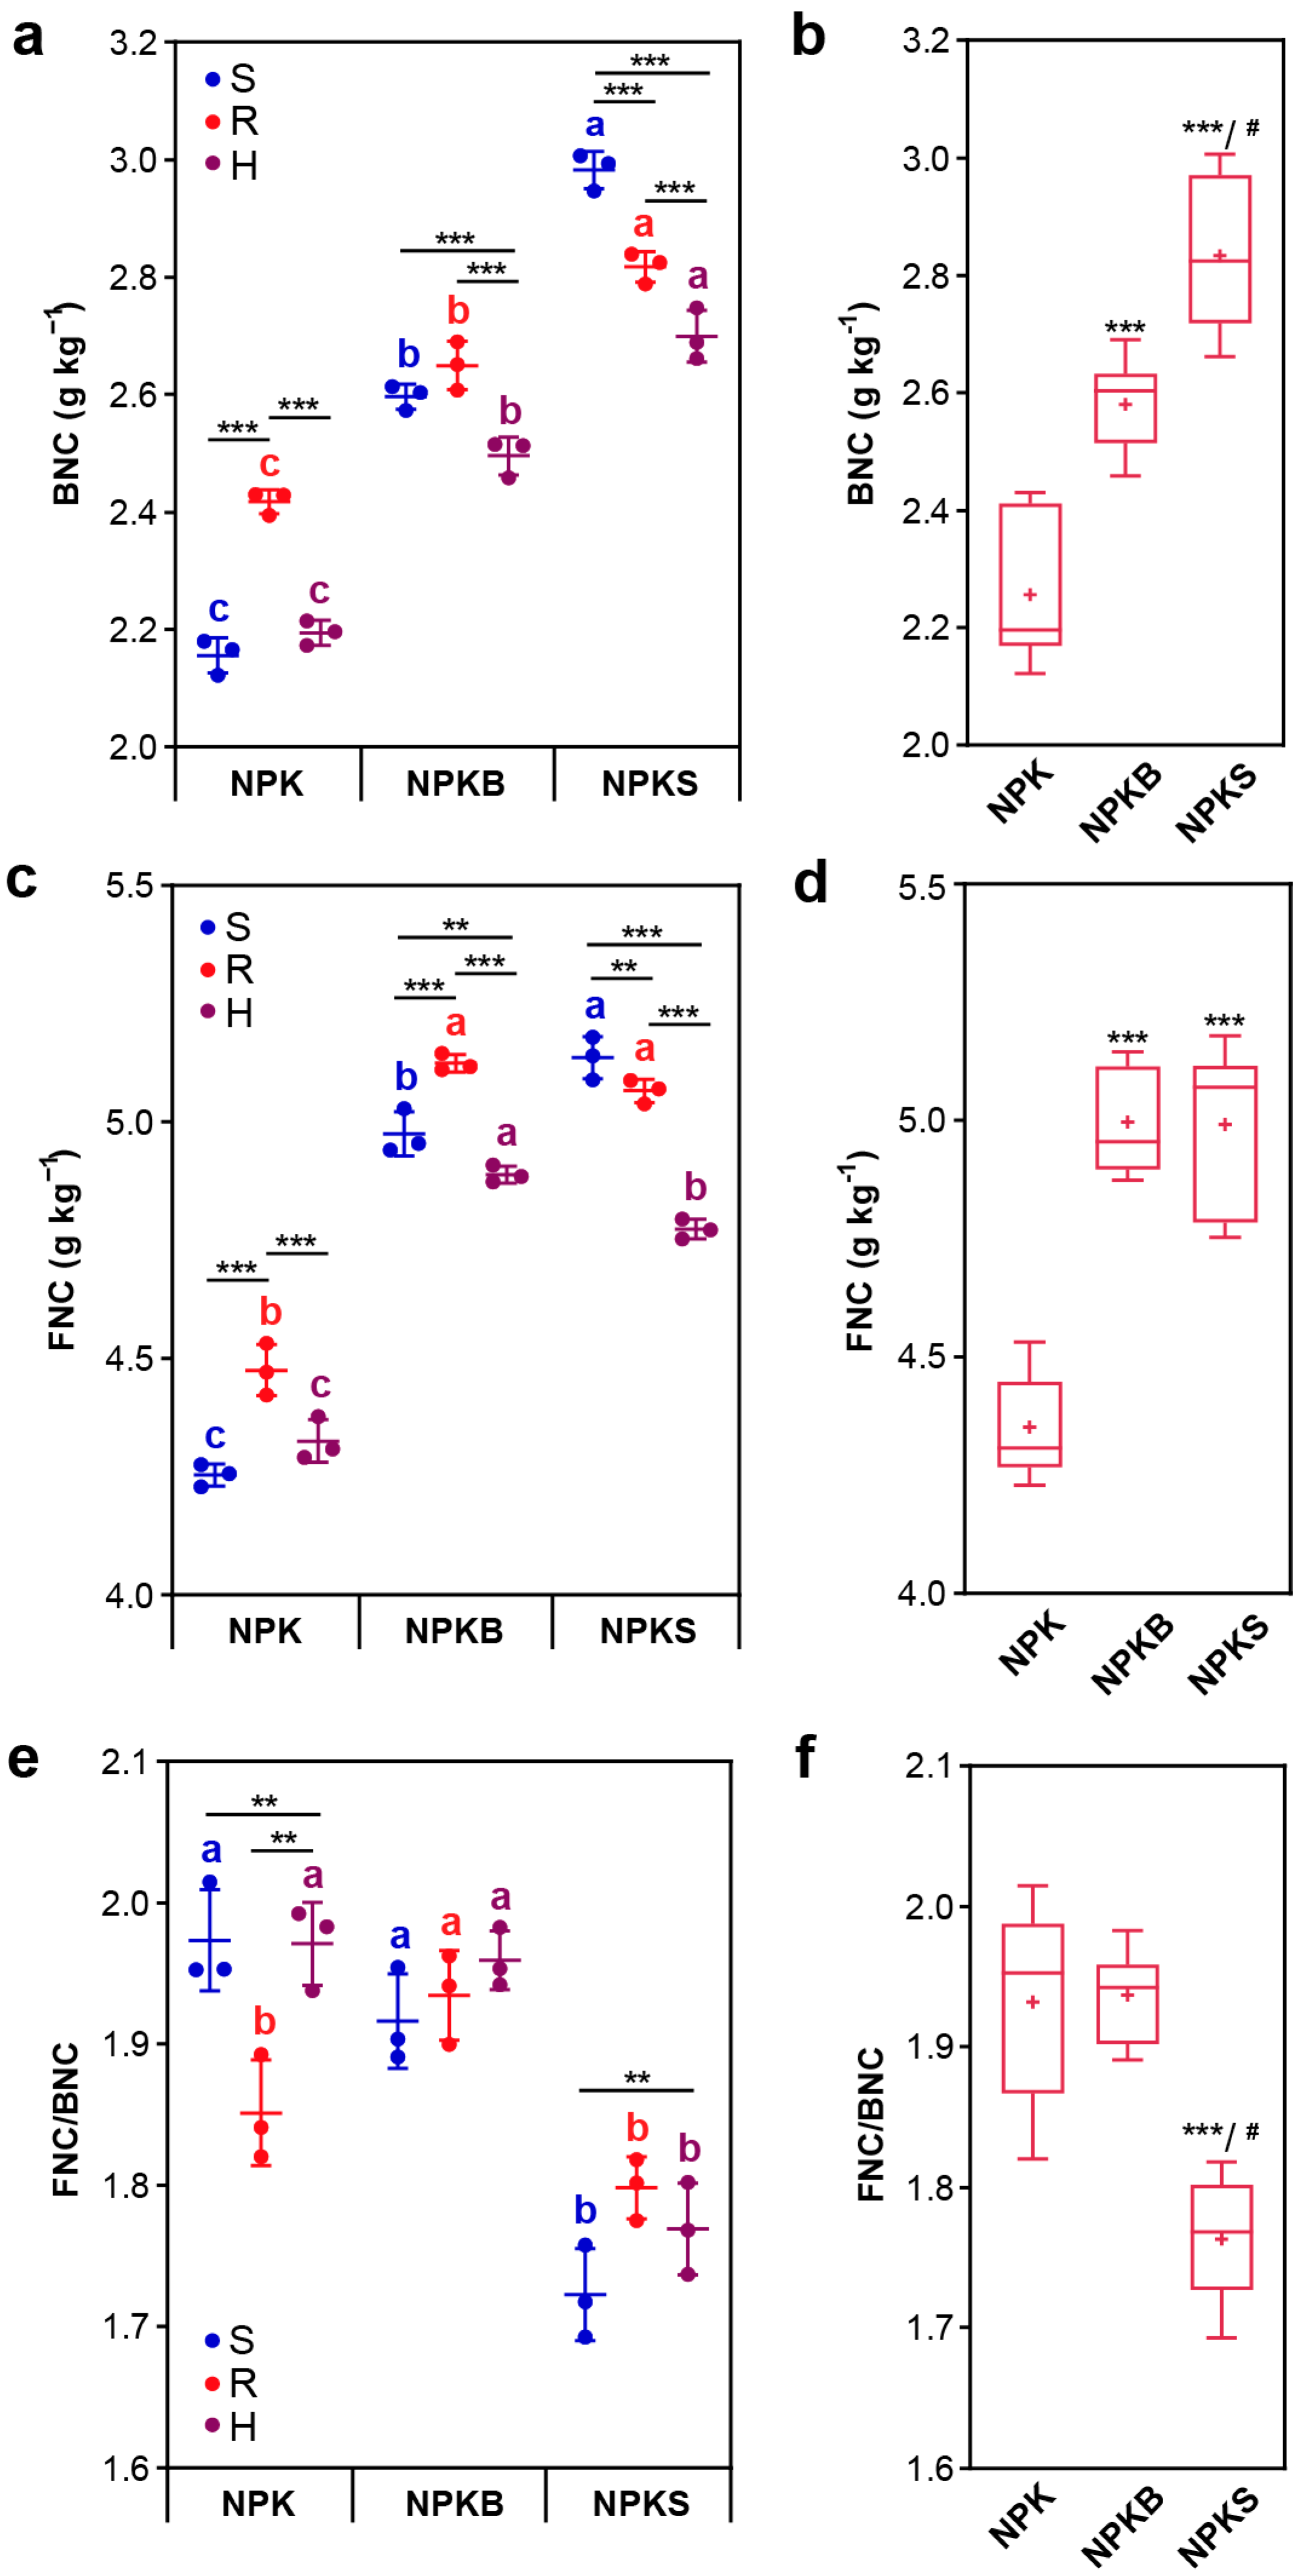
3.3. MNC and Its Contribution to SOC

Organic fertilizer application significantly promoted the accumulation of microbial necromass (Figure 3b,d). NPKS induced greater accumulation of BNC than that under NPKB. The relative accumulation of FNC and BNC in the different soil compartments under NPK was in the following rank order: rhizosphere > hyphosphere > bulk soil (Figure 3a,c). Organic fertilizer addition induced different responses in the accumulation of MNC in the rhizosphere and hyphosphere, contrasting with the bulk soil (Figure 3a,c). Specifically, under NPKS, FNC and BNC concentrations in the rhizosphere and hyphosphere were significantly lower than those in bulk soil. Conversely, FNC and BNC concentrations in the rhizosphere were significantly higher compared to bulk soil under NPKB. Fungi contributed approximately twice as much necromass C as that from bacteria (FNC/BNC ratios 1.77–1.97) (Figure 3c). Biochar addition barely affected the FNC/BNC ratio, whereas the application of straw significantly decreased the ratio compared with the application of NPK (Figure 3f).
The MCP efficacy (the enhanced MNC contributing to the enhancement of SOC due to organic fertilizer inputs) differed significantly between NPKB and NPKS (Figure 4). Regardless of the bacterial or fungal contribution, the MCP efficacy under NPKS was greater than that under NPKB. The MCP efficacy was significantly greater in bulk soil compared to rhizosphere and hyphosphere in response to organic fertilizer addition, but the impact under NPKS and NPKB differed. Specifically, the bacterial MCP efficacy in the rhizosphere and hyphosphere under NPKB was 3.86% and 2.45% lower than that of bulk soil, respectively, whereas the bacterial MCP efficacy in the rhizosphere and hyphosphere under NPKS was 19.84% and 18.52% lower compared to bulk soil (Figure 4a). Similarly, the fungal MCP efficacy in the rhizosphere and hyphosphere under NPKB was 2.84% and 2.96% lower compared to bulk soil, respectively, whereas the decrease under NPKS was as high as 12.11% and 24.91%, respectively (Figure 4b). In general, compared with biochar, the addition of straw resulted in a more significant difference in the MCP efficacy of the rhizosphere and hyphosphere compared with that of bulk soil, especially with regard to the fungal MCP efficacy in the hyphosphere.

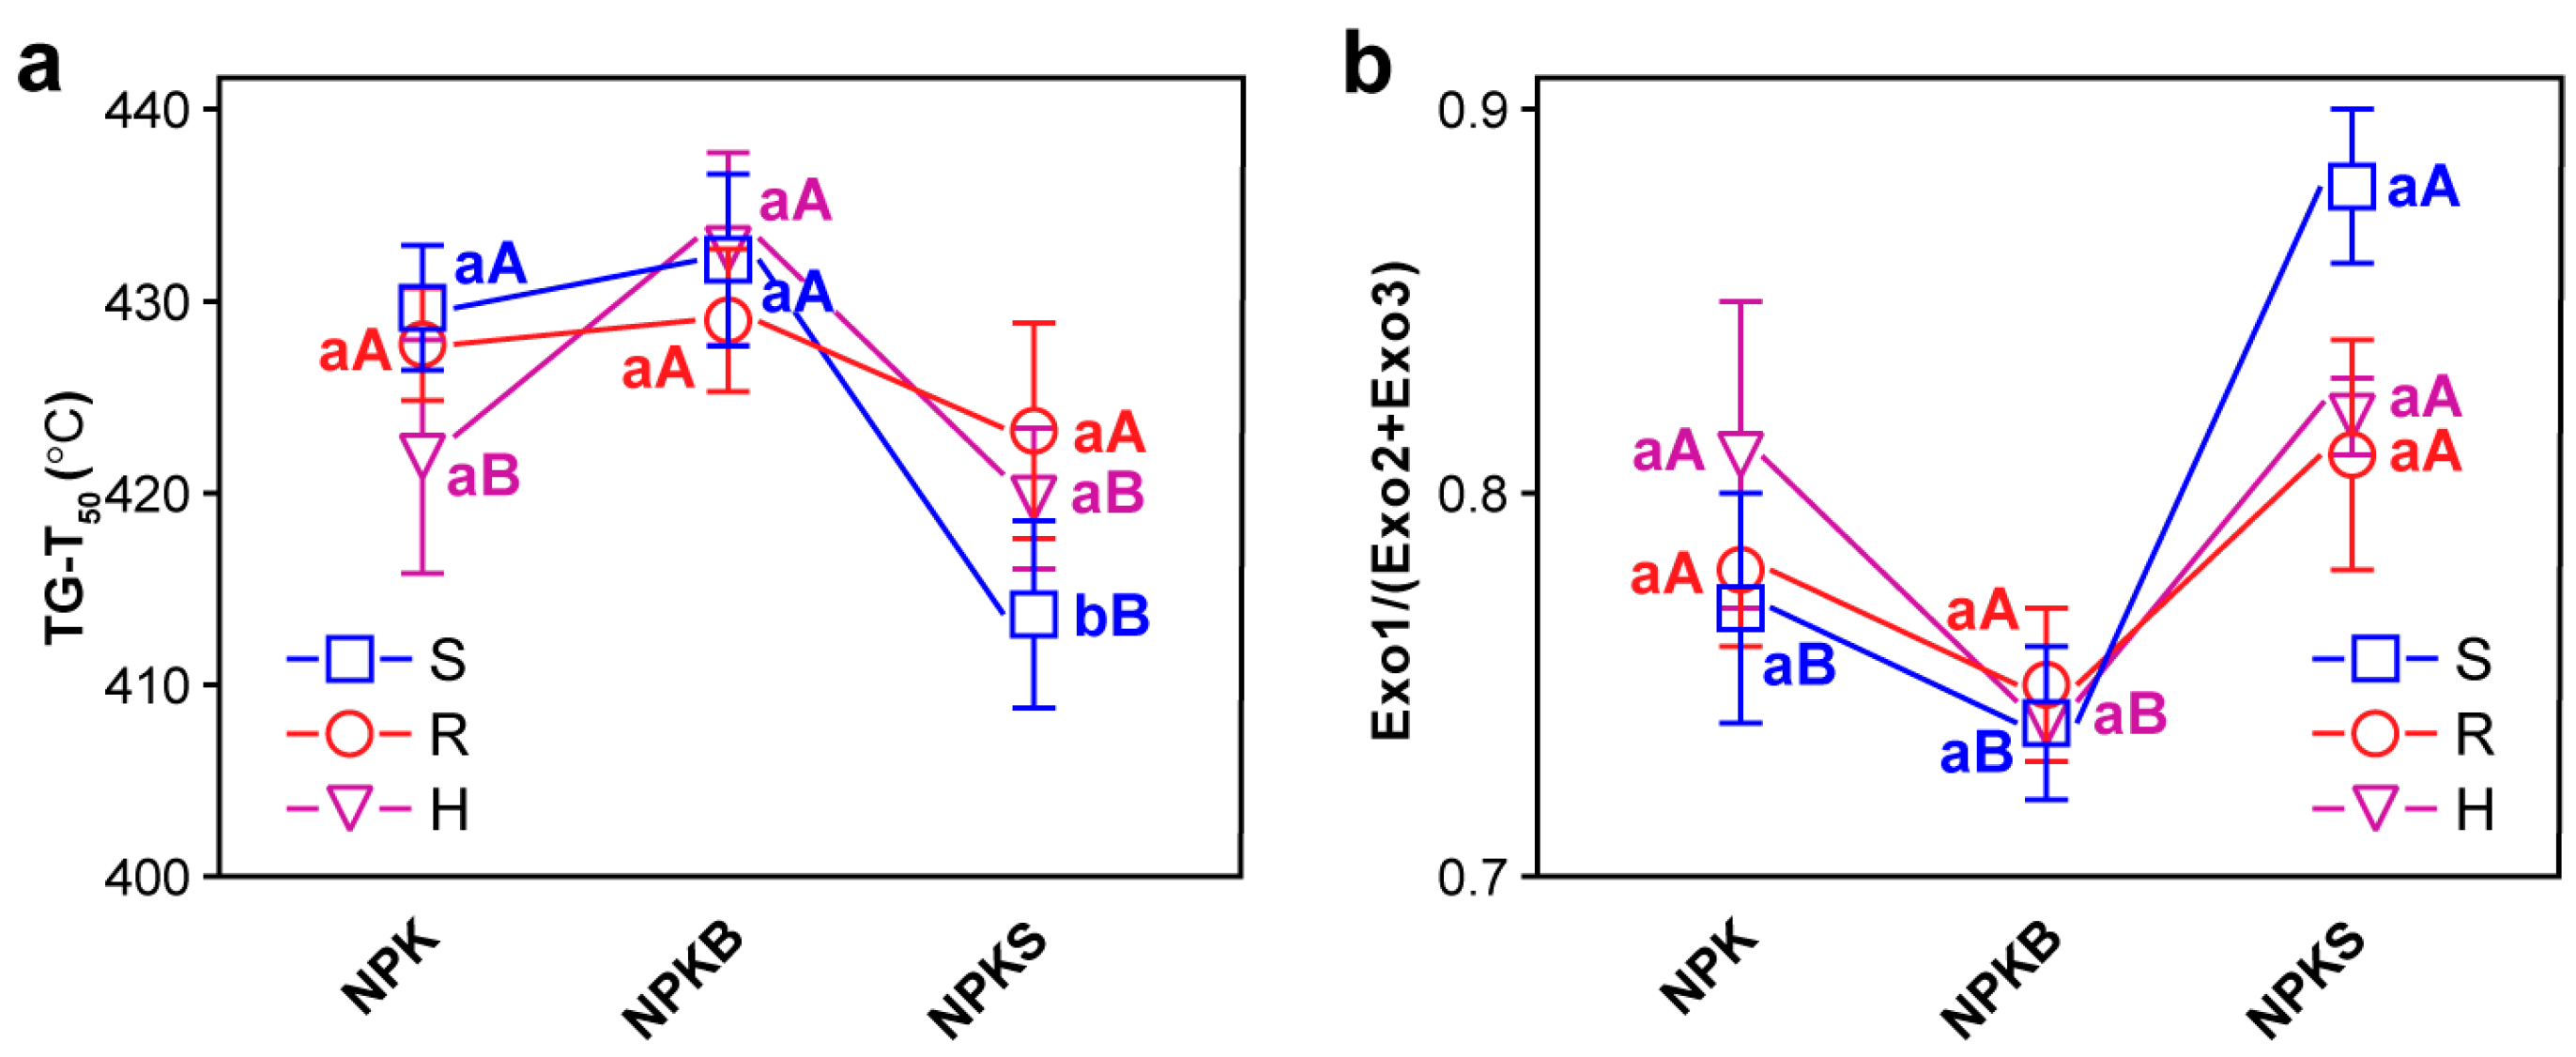
3.4. Thermal Stability of SOC

Mass losses during thermogravimetric analysis under the different treatments are presented in Table 3. The percentage of labile C (Exo1) ranged from 42.66% to 46.81%, the percentage of recalcitrant C (Exo2) ranged from 45.33% to 49.01%, and the percentage of refractory C (Exo3) varied from 7.69% to 8.67% among the soil samples. Significant differences between the C groups were only observed under NPKS, whereby Exo1 in bulk soil was higher compared to the rhizosphere and hyphosphere soils, whereas Exo2 in bulk soil was the lowest among the soil compartments.
The TG-T50 ranged from 413.68 to 432.75 °C and differed among the samples analyzed (Figure 5a). The highest TG-T50 in the bulk, rhizosphere, and hyphosphere soils were all observed under NPKB, with values of 432.15, 429.02, and 432.75 °C, respectively. In addition, the soils of the three compartments under NPKB contained the highest SOC content among all treatments. In contrast, compared with NPK, NPKS decreased the TG-T50 in each soil compartment, and the lowest TG-T50 was observed in bulk soil. The Exo1/(Exo2 + Exo3) ratio essentially showed the opposite trend to that of TG-T50 (Figure 5b); thus, the lower the SOC thermal stability, the higher the Exo1/(Exo2 + Exo3) value and the lower the TG-T50 value.

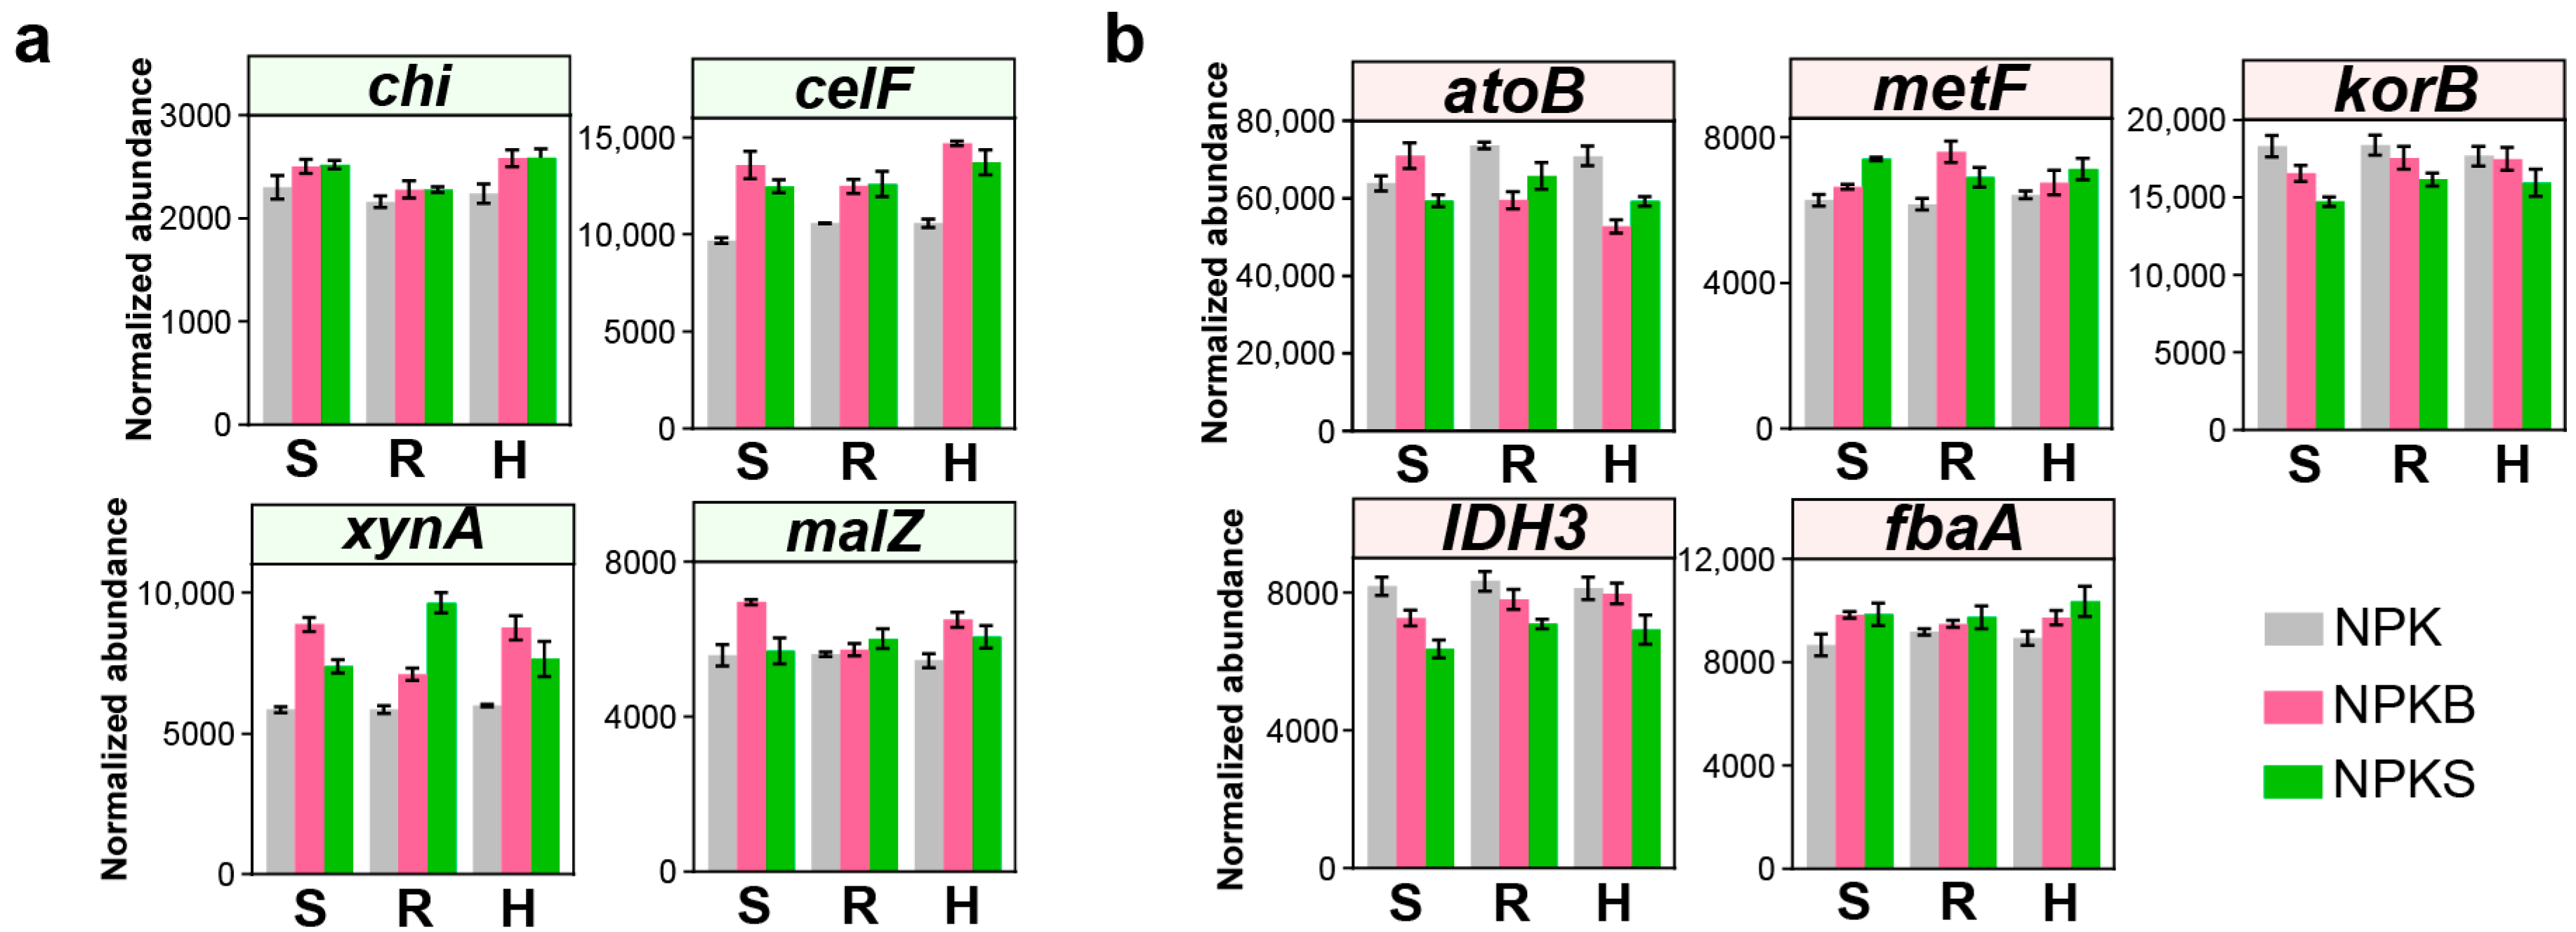
3.5. Alterations Among Genes Pertinent to C-Cycling Functions

A subset of 32 C-cycling genes was retrieved and functionally categorized into three groups: C fixation, C degradation, and methane metabolism (Table S1). Functional changes involving C-cycling genes between the three treatments were investigated by performing a PCoA (percentages of the total variation explained: PCoA1, 54.70%; PCoA2, 23.45%) (Figure 6). ANOSIM analysis indicated that NPKB and NPKS significantly altered the microbial C-cycling functional profiles (p ≤ 0.001). Moreover, the C-cycling gene profiles across the bulk, rhizosphere, and hyphosphere soils all showed significant variations (p < 0.05) under the three treatments.
According to the Wilcoxon test, straw and biochar return induced a distinct shift in C-cycling functional genes compared with NPK (Figure S1). Expression levels of most C degradation genes were upregulated in each soil compartment under NPKB and NPKS (Figure S1). NPKB and NPKS significantly increased the abundances of xynA (hemicellulose degradation) and celF (cellulose degradation) in each soil compartment (Figure 7a). Moreover, the abundance of C degradation genes except chi (chitin degradation) in rhizosphere and hyphosphere soils was always higher than that in bulk soil under NPKS (Figure 7a). With respect to C fixation processes, NPKS and NPKB significantly increased the abundances of metF (reductive acetyl-CoA pathway) and fbaA (Calvin cycle) in each soil compartment, while decreasing the abundances of IDH3 (reductive tricarboxylic acid cycle) and atoB (dicarboxylate-hydroxybutyrate cycle) compared with NPK (Figure 7b).

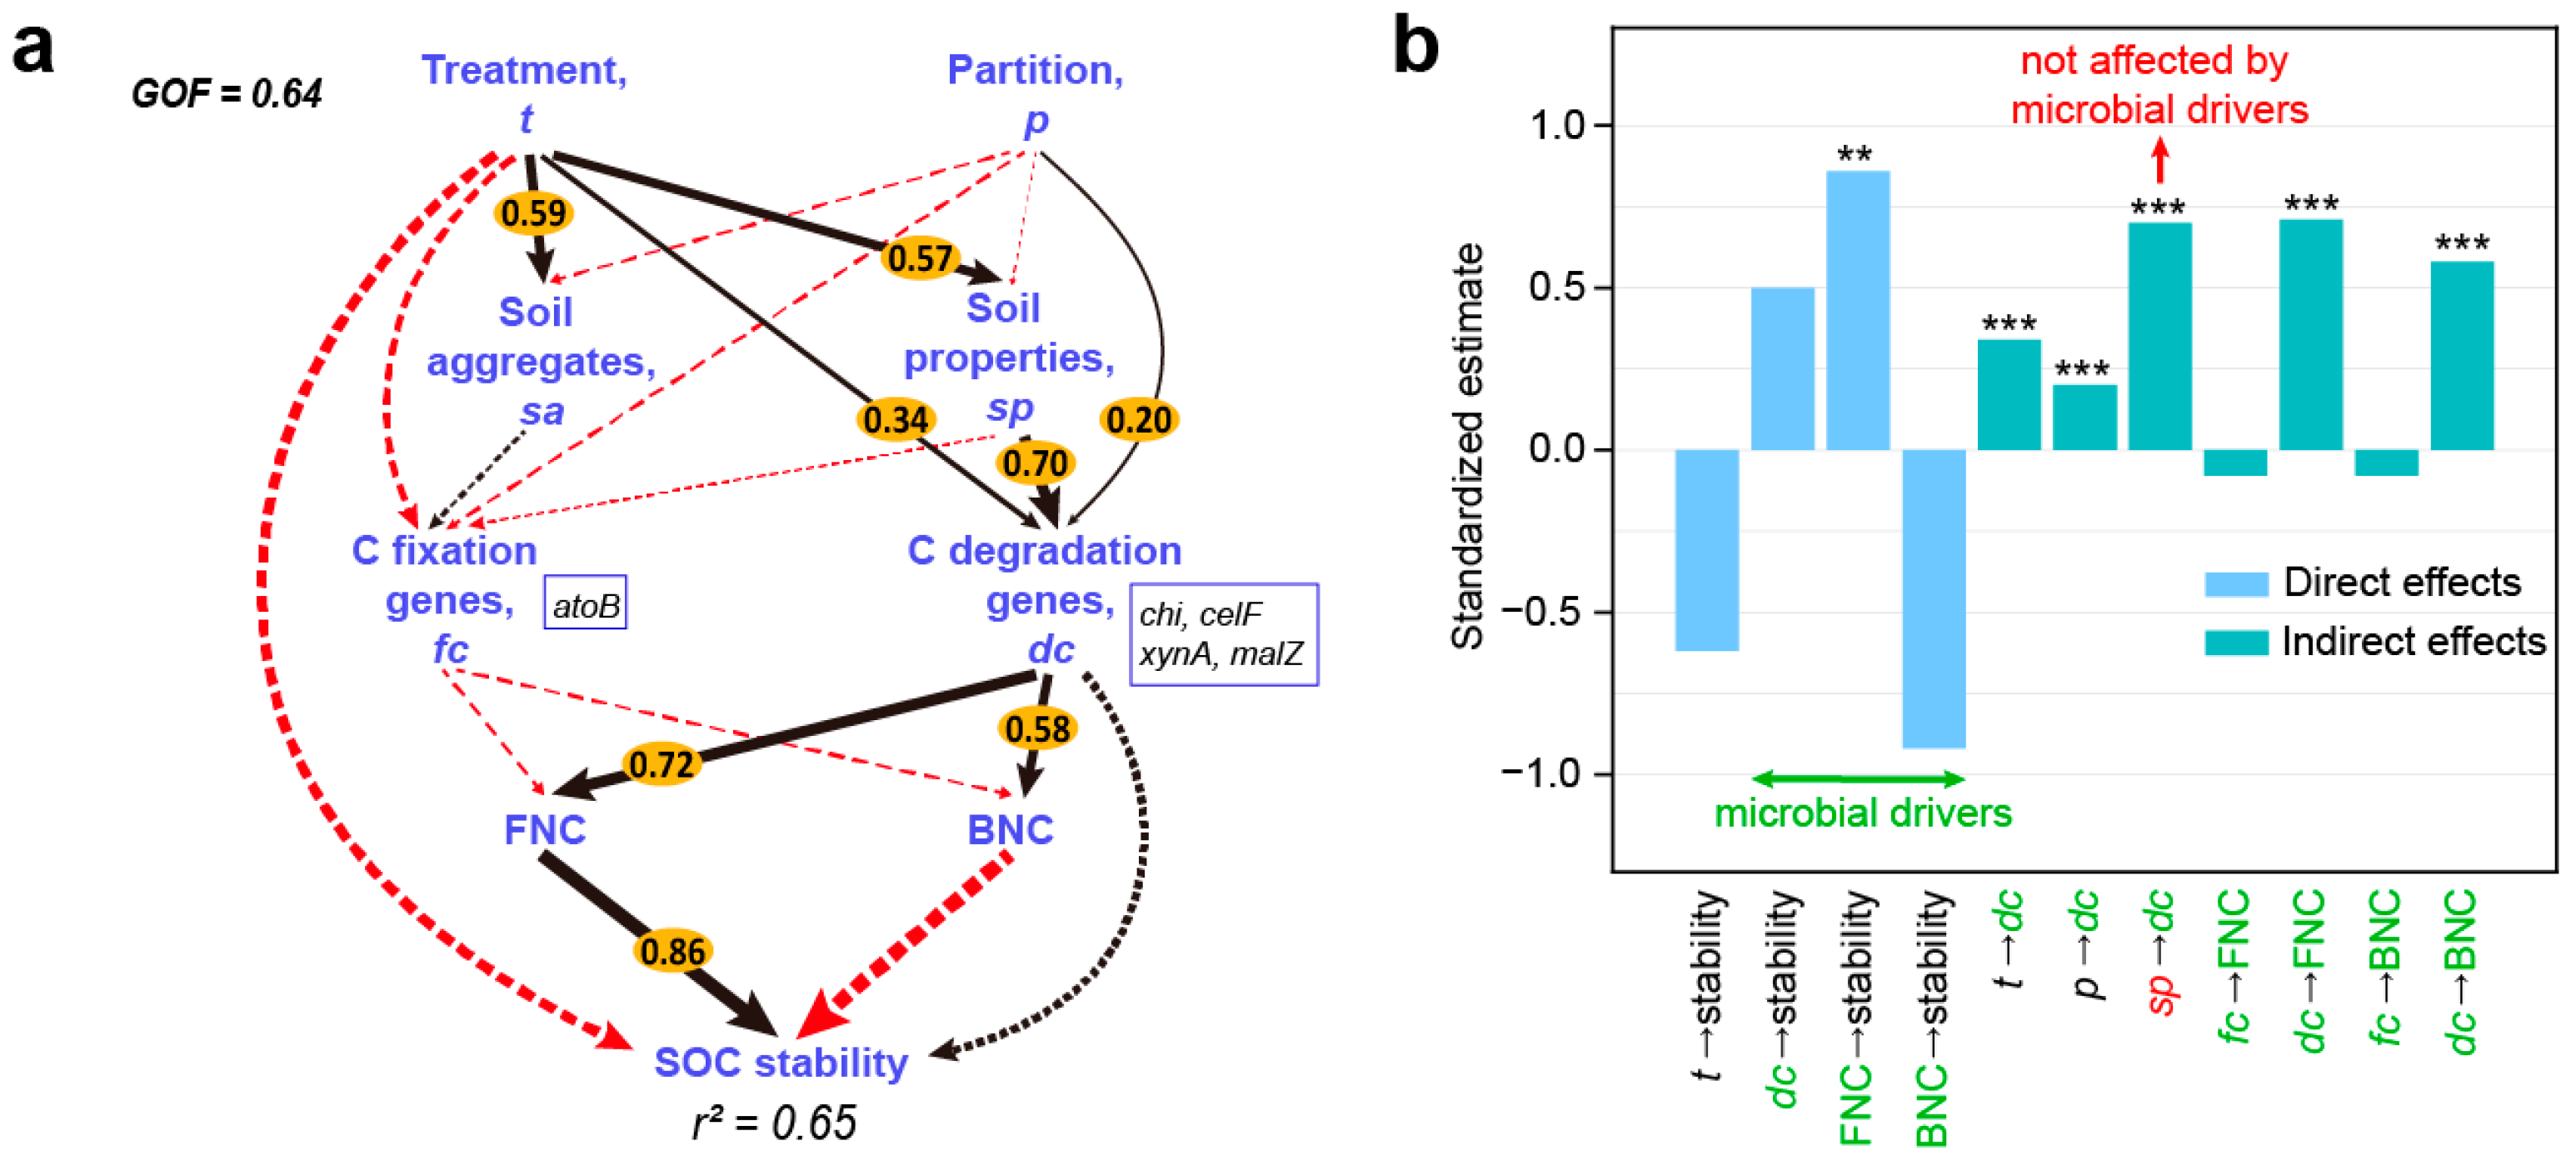
3.6. Factors Driving SOC Stability

The PLS-PM accounted for 65% of the overall variance in SOC stability (Figure 8a). The SOC stability was directly positively controlled by FNC (p < 0.05) and directly negatively controlled by BNC. In addition, the abundance of C degradation genes significantly and positively affected the contents of FNC and BNC, thereby indirectly affecting SOC stability, whereas the effect of C fixation genes was not significant. The abundance of C degradation genes was directly dependent on soil properties, treatments, and rhizosphere, among which soil properties had the greatest direct impact (Figure 8b). In general, SOC stability increased with the increase in FNC content. The C degradation genes caused the accumulation of FNC, indicating that SOC thermal stability was strongly associated with soil microbial C degradation.

4. Discussion

4.1. The Rhizosphere Sequestered More SOC and Was Significantly Affected by Biochar

Organic fertilizers exert a positive effect on SOC accumulation (Table 2). Exogenous C input and the mineralization of existing SOC are reported to change the capacity of the SOC pool [51]. Biochar and straw, as organic C sources, can directly and effectively increase the SOC concentration [52,53]. Additionally, they can act as organic binders, forming macroaggregates and trapping SOC, which stabilizes C and prevents rapid mineralization (Figure 2) [54,55]. The present results revealed that biochar induced greater accumulation of SOC than that of straw (Table 2), possibly owing to the high C content of biochar and its ability to absorb and retain C, as well as its resistance to decomposition [56]. Furthermore, the process of straw decomposition produces a large amount of labile C [54], leading to greater mineralization of straw-derived C than that of biochar-derived C [57].
Regardless of fertilization, the rhizosphere consistently retained higher contents of SOC (Table 2), further demonstrating the rhizosphere C sequestration potential. However, the PE in the rhizosphere and hyphosphere can contribute to SOC decomposition [26,27,34], and the PE in the hyphosphere exceeds that in the rhizosphere, resulting in greater SOC decomposition [58]. Therefore, significant rises in rhizosphere SOC were exclusively noted with biochar addition (Table 2). Biochar can promote a negative PE, and its porous surface can absorb and retain rhizosphere deposits [59]. Additionally, a higher proportion of organomineral microaggregates (<0.053 mm) in the rhizosphere was observed under biochar addition (Figure 2), which enhances the retention rate of root-derived C [59].

4.2. Organic Fertilizer Addition Induces Changes in FNC and BNC in Different Soil Compartments

The addition of biochar and straw preserved greater amounts of BNC and FNC in the soils (Figure 3b,d). Biochar and straw can directly provide diverse substrates that promote microbial growth [29,60], leading to the accumulation of microbial necromass through an entombing effect [20]. In addition, by improving soil properties, biochar and straw promote microbial metabolism and growth [14,61], resulting in greater microbial biomass. Consistent with a previous study [14], we observed that straw caused a greater increase in BNC, and that the FNC/BNC ratio was significantly lower than that under biochar addition (Figure 3b,e). Bacteria are more sensitive to changes in labile C and respond more strongly than fungi [62,63], and straw contains more labile C [64] than biochar does. Therefore, the C provided by straw is preferentially metabolized by bacteria, resulting in a higher BNC content than that observed with biochar addition (Figure 3b).
More importantly, compared with bulk soil, straw addition significantly decreased the MCP efficacy in the rhizosphere and hyphosphere (Figure 4), indicating that the relative increase in MNC was smaller than the relative increase in SOC. This was not caused by a single factor. Straw has a high carbon/nitrogen ratio, which can lead to nitrogen limitation during its degradation [65], intensifying nitrogen competition between the rhizosphere microorganisms and plants. In addition, plant nitrogen uptake relies on the hyphal pathway [66]. Therefore, to acquire more nitrogen nutrients, the next generation of rhizosphere and hyphosphere microorganisms will enhance the decomposition and re-utilization of necromass [11]. Compared to that in the rhizosphere, PE intensity in the hyphosphere is stronger [58], leading to greater decomposition of organic matter. Consequently, we observed that necromass C and SOC contents in the hyphosphere were lower than those in the rhizosphere and bulk soil due to straw application (Table 2; Figure 3a,c).

4.3. C Degradation Genes Drive SOC Thermal Stability via FNC

Straw addition caused significant changes in the SOC thermal stability in different soil compartments (Figure 5). Specifically, the labile C content in the rhizosphere and hyphosphere was significantly lower than that in bulk soil, indicating that the rhizosphere and hyphosphere are more prone to labile C decomposition following straw addition. This observation will be further explained in relation to factors influencing thermal stability.
The PLS-PM analysis indicated that FNC is a crucial factor in enhancing SOC stability (Figure 8). Previous studies have shown that FNC is less degradable than BNC and contributes substantially to the long-term stabilization and sequestration of SOC [67,68]. However, the factors driving microbial-derived organic C from the perspective of C-cycling genes have not been examined previously. We observed that FNC was significantly positively influenced by C degradation genes (Figure 8a), and the abundance of C degradation genes was directly affected by multiple factors. Straw and biochar addition significantly induced upregulation in the expression levels of most labile C degradation genes (Figure 8 and Figure S1). In addition, straw and biochar indirectly influenced the abundance of C degradation genes by affecting soil properties (Figure 8a). Soil C-cycling is largely driven by microbial nutrient dynamics [69]. Straw and biochar contain abundant organic compounds that function as substrates for microbial C and energy metabolism [29,60]; during their degradation, they can also release nutrients into the soil (Table 2) [69,70]. Consequently, such favorable conditions likely contributed to enhanced microbial proliferation and growth. In particular, the abundance of xynA (endo-1,4-beta-xylanase) and celF (endoglucanase) significantly increased in different soil compartments (Figure 7a), indicating that these enzymes were markedly upregulated due to straw and biochar input. Xylanase degrades xylan, and endoglucanase degrades cellulose and xyloglucan, which are the main polysaccharide components of plant and fungal cell walls [52]. Thus, organic fertilizer addition could have facilitated the microbial degradation of plant-derived macromolecules or fungal residues, which might provide available substrates for microbial ‘in vivo’ turnover processes [20], resulting in necromass C accumulation (Figure 3a,c). In addition, C degradation genes were significantly influenced in different soil compartments (Figure 8a,b), which was consistent with the PCoA results (Figure 6). Compared with those in bulk soil, the higher microbial biomass and activity in the rhizosphere and hyphosphere influence microbial diversity [17,56], which in turn affects the abundance of C degradation genes. We observed that the abundance of labile C degradation genes (malZ, xynA, and celF) in the rhizosphere and hyphosphere was higher than in bulk soil (Figure 7), indicating that the rhizosphere and hyphosphere have a higher capacity for degradation of labile C after straw addition. Thus, the increase in SOC stability in the rhizosphere and hyphosphere was attributable to the greater decomposition of labile C (Table 3). Overall, soil microorganisms are sensitive to environmental changes. Therefore, the addition of C sources influences microbial selection and utilization of C sources, thereby driving the turnover and cycling of organic matter, particularly in microbial hotspots such as the rhizosphere and hyphosphere.

5. Conclusions

In this study, we quantified the response of microbial necromass in bulk soil, the rhizosphere, and the hyphosphere to organic fertilizer input by performing a root box experiment and evaluated the importance of microbial necromass in different soil compartments for SOC sequestration, which establishes a theoretical basis for the precise regulation of carbon sinks in agricultural fields via straw and straw biochar amendments. Straw addition significantly reduced necromass C accumulation and MCP efficacy in the rhizosphere and hyphosphere, particularly in the latter. The SOC thermal stability in bulk soil was significantly lower than that in the rhizosphere and hyphosphere after straw addition. Furthermore, PLS-PM analysis revealed that FNC was the main factor enhancing SOC thermal stability, and the formation of FNC was strongly associated with C degradation genes. Overall, the present findings emphasize that organic fertilizer addition and different soil compartments alter the abundance of genes involved in microbial C degradation, which in turn affect necromass C sequestration and SOC thermal stability. However, the present pot experiment was conducted in a single rice cropping season, and the long-term effects of organic fertilizer input on necromass C and SOC sequestration in the rhizosphere and hyphosphere require further systematic validation in the future.

Supplementary Materials

The following supporting information can be downloaded at https://www.mdpi.com/article/10.3390/agronomy15061303/s1; Text S1: Separation and analyses of amino sugar derivatives; Text S2: Soil DNA extraction and metagenomic sequencing; Figure S1: The log2-fold changes of carbon-cycling functional genes under NPKB (a) and NPKS (b) compared to NPK treatment; Table S1: Information of microbial functional genes involved in the C-cycling processes identified in this study.

Author Contributions

H.J.: Data curation, formal analysis, investigation, writing- original draft, and writing-review & editing. D.W.: Validation, software, and writing-review & editing. J.C.: Validation, software, and writing-review & editing. H.L.: Methodology, resources, and writing-review & editing. C.Z.: Methodology, resources, and writing-review & editing. X.Z.: Methodology, resources, and writing-review & editing. J.W.: Conceptualization, methodology, and writing-review & editing. Q.R.: Conceptualization, data curation, funding acquisition, investigation, methodology, Supervision, and writing-review & editing. All authors have read and agreed to the published version of the manuscript.

Funding

This research was supported by the National Natural Science Foundation of China (Grant Number 32060728, and 32260808), the Special Key Grant Project of Technology Research and Development of Jiangxi Province (“Take-and-lead” Program) (Grant Number 20223BBF61016 and 20213AAF02026), and the Project of Jiangxi Selenium-Rich Agricultural Research Institute (Grant Number JXFX21-ZD06).

Data Availability Statement

The raw data supporting the conclusions of this article will be made available by the authors on request.

Acknowledgments

We thank all those who helped in the execution of the research and the writing of the manuscript.

Conflicts of Interest

The authors declare no conflicts of interest.

References

  1. Stockmann, U.; Adams, M.A.; Crawford, J.W.; Field, D.J.; Henakaarchchi, N.; Jenkins, M.; Minasny, B.; McBratney, A.B.; Courcelles, V.d.R.d.; Singh, K.; et al. The Knowns, Known Unknowns and Unknowns of Sequestration of Soil Organic Carbon. Agric. Ecosyst. Environ. 2013, 164, 80–99. [Google Scholar] [CrossRef]
  2. Georgiou, K.; Jackson, R.B.; Vindušková, O.; Abramoff, R.Z.; Ahlström, A.; Feng, W.; Harden, J.W.; Pellegrini, A.F.A.; Polley, H.W.; Soong, J.L.; et al. Global Stocks and Capacity of Mineral-Associated Soil Organic Carbon. Nat. Commun. 2022, 13, 3797. [Google Scholar] [CrossRef] [PubMed]
  3. Liu, Y.L.; Ge, T.D.; van Groenigen, K.J.; Yang, Y.H.; Wang, P.; Cheng, K.; Zhu, Z.K.; Wang, J.K.; Li, Y.; Guggenberger, G.; et al. Rice Paddy Soils Are a Quantitatively Important Carbon Store According to a Global Synthesis. Commun. Earth Environ. 2021, 2, 154. [Google Scholar] [CrossRef]
  4. Lal, R. Soil Carbon Sequestration in China through Agricultural Intensification, and Restoration of Degraded and Desertified Ecosystems. Land Degrad. Dev. 2010, 13, 469–478. [Google Scholar] [CrossRef]
  5. Leng, L.J.; Xu, X.W.; Wei, L.; Fan, L.L.; Huang, H.J.; Li, J.A.; Lu, Q.; Li, J.; Zhou, W.G. Biochar Stability Assessment by Incubation and Modelling: Methods, Drawbacks and Recommendations. Sci. Total Environ. 2019, 664, 11–23. [Google Scholar] [CrossRef]
  6. Wang, S.C.; Lu, C.A.; Huai, S.C.; Yan, Z.H.; Wang, J.Y.; Sun, J.Y.; Raza, S. Straw Burial Depth and Manure Application Affect the Straw-C and N Sequestration: Evidence from 13C & 15N-Tracing. Soil Tillage Res. 2021, 208, 104884. [Google Scholar] [CrossRef]
  7. Majumder, B.; Kuzyakov, Y. Effect of Fertilization on Decomposition of 14C Labelled Plant Residues and Their Incorporation into Soil Aggregates. Soil Tillage Res. 2010, 109, 94–102. [Google Scholar] [CrossRef]
  8. Melero, S.; López-Bellido, R.J.; López-Bellido, L.; Muñoz-Romero, V.; Moreno, F.; Murillo, J.M. Long-Term Effect of Tillage, Rotation and Nitrogen Fertiliser on Soil Quality in a Mediterranean Vertisol. Soil Tillage Res. 2011, 114, 97–107. [Google Scholar] [CrossRef]
  9. Gougoulias, C.; Joanna, M.C.; Liz, J.S. The Role of Soil Microbes in the Global Carbon Cycle: Tracking the Below-Ground Microbial Processing of Plant-Derived Carbon for Manipulating Carbon Dynamics in Agricultural Systems. J. Sci. Food Agric. 2014, 94, 2362–2371. [Google Scholar] [CrossRef]
  10. Cao, Y.F.; Ding, J.Z.; Li, J.; Xin, Z.M.; Ren, S.A.; Wang, T. Necromass-Derived Soil Organic Carbon and Its Drivers at the Global Scale. Soil Biol. Biochem. 2023, 181, 109025. [Google Scholar] [CrossRef]
  11. Liang, C.; Amelung, W.; Lehmann, J.; Kästner, M. Quantitative Assessment of Microbial Necromass Contribution to Soil Organic Matter. Glob. Change Biol. 2019, 25, 3578–3590. [Google Scholar] [CrossRef] [PubMed]
  12. Camenzind, T.; Mason-Jones, K.; Mansour, I.; Rillig, M.; Lehmann, J. Formation of Necromass-Derived Soil Organic Carbon Determined by Microbial Death Pathways. Nat. Geosci. 2023, 16, 115–122. [Google Scholar] [CrossRef]
  13. Yang, J.K.; Li, L.; Xu, Y.N.; Yu, Y.; Virk, A.L.; Li, F.M.; Yang, H.S.; Kan, Z.R. Effects of Straw Biochar on Microbial-Derived Carbon: A Global Meta-Analysis. J. Environ. Manag. 2024, 368, 122233. [Google Scholar] [CrossRef] [PubMed]
  14. Sun, Q.; Yang, X.; Bao, Z.R.; Gao, J.; Meng, J.; Han, X.R.; Lan, Y.; Liu, Z.Q.; Chen, W.F. Responses of Microbial Necromass Carbon and Microbial Community Structure to Straw- and Straw-Derived Biochar in Brown Earth Soil of Northeast China. Front. Microbiol. 2022, 13, 967746. [Google Scholar] [CrossRef]
  15. Chen, Z.M.; He, L.L.; Ma, J.C.; Ma, J.W.; Ye, J.; Yu, Q.G.; Zou, P.; Sun, W.C.; Lin, H.; Wang, F.; et al. Long-Term Successive Biochar Application Increases Plant Lignin and Microbial Necromass Accumulation but Decreases Their Contributions to Soil Organic Carbon in Rice–Wheat Cropping System. GCB Bioenergy 2024, 16, e13137. [Google Scholar] [CrossRef]
  16. Kuzyakov, Y.; Razavi, B.S. Razavi. Rhizosphere Size and Shape: Temporal Dynamics and Spatial Stationarity. Soil Biol. Biochem. 2019, 135, 343–360. [Google Scholar] [CrossRef]
  17. Shao, G.D.; Xu, Y.; Zhou, J.; Tian, P.; Ai, J.J.; Yang, Y.D.; Zamanian, K.; Zeng, Z.H.; Zang, H.D. Enhanced Soil Organic Carbon Stability in Rhizosphere through Manure Application. Soil Tillage Res. 2024, 244, 106223. [Google Scholar] [CrossRef]
  18. Venturi, V.; Keel, C. Signaling in the Rhizosphere. Trends Plant Sci. 2016, 21, 187–198. [Google Scholar] [CrossRef]
  19. Lange, M.; Azizi-Rad, M.; Dittmann, G.; Lange, D.F.; Orme, A.M.; Schroeter, S.A.; Simon, C.; Gleixner, G. Stability and Carbon Uptake of the Soil Microbial Community Is Determined by Differences between Rhizosphere and Bulk Soil. Soil Biol. Biochem. 2024, 189, 109280. [Google Scholar] [CrossRef]
  20. Liang, C.; Schimel, J.P.; Jastrow, J.D. The Importance of Anabolism in Microbial Control over Soil Carbon Storage. Nat. Microbiol. 2017, 2, 17105. [Google Scholar] [CrossRef]
  21. Angst, G.; Mueller, K.E.; Nierop, K.G.J.; Simpson, M.J. Nierop, and Myrna J. Simpson. Plant- or Microbial-Derived? A Review on the Molecular Composition of Stabilized Soil Organic Matter. Soil Biol. Biochem. 2021, 156, 108189. [Google Scholar] [CrossRef]
  22. Sokol, N.W.; Sanderman, J.; Bradford, M.A. Pathways of Mineral-Associated Soil Organic Matter Formation: Integrating the Role of Plant Carbon Source, Chemistry, and Point of Entry. Glob. Change Biol. 2019, 25, 12–24. [Google Scholar] [CrossRef] [PubMed]
  23. Luo, Y.; Xiao, M.L.; Yuan, H.Z.; Liang, C.; Zhu, Z.K.; Xu, J.M.; Kuzyakov, Y.; Wu, J.S.; Ge, T.D.; Tang, C.X. Rice Rhizodeposition Promotes the Build-up of Organic Carbon in Soil via Fungal Necromass. Soil Biol. Biochem. 2021, 160, 108345. [Google Scholar] [CrossRef]
  24. Jia, Y.F.; Liu, Z.G.; Zhou, L.; Liu, X.J.; Ma, K.P.; Feng, X.J. Soil Organic Carbon Sourcing Variance in the Rhizosphere vs. Non-Rhizosphere of Two Mycorrhizal Tree Species. Soil Biol. Biochem. 2023, 176, 108884. [Google Scholar] [CrossRef]
  25. Wang, Q.T.; Ding, J.X.; Zhang, Z.L.; Liang, C.; Lambers, H.; Zhu, B.; Wang, D.G.; Wang, J.P.; Zhang, P.P.; Li, N.; et al. Rhizosphere as a Hotspot for Microbial Necromass Deposition into the Soil Carbon Pool. J. Ecol. 2024, 113, 168–179. [Google Scholar] [CrossRef]
  26. Kuzyakov, Y. Priming Effects: Interactions between Living and Dead Organic Matter. Soil Biol. Biochem. 2010, 42, 1363–1371. [Google Scholar] [CrossRef]
  27. Kuzyakov, Y.; Friedel, J.K.; Stahr, K. Review of Mechanisms and Quantification of Priming Effects. Soil Biol. Biochem. 2000, 32, 1485–1498. [Google Scholar] [CrossRef]
  28. Zhu, X.M.; Zhang, Z.L.; Wang, Q.T.; Peñuelas, J.; Sardans, J.; Lambers, H.; Li, N.; Liu, Q.; Yin, H.J.; Liu, Z.F. More Soil Organic Carbon Is Sequestered through the Mycelium Pathway than through the Root Pathway under Nitrogen Enrichment in an Alpine Forest. Glob. Change Biol. 2022, 28, 4947–4961. [Google Scholar] [CrossRef]
  29. Lehmann, J.; Rillig, M.C.; Thies, J.; Masiello, C.A.; Hockaday, W.C.; Crowley, D. Biochar Effects on Soil Biota—A Review. Soil Biol. Biochem. 2011, 43, 1812–1836. [Google Scholar] [CrossRef]
  30. Andrade, G.; Mihara, K.L.; Linderman, R.G.; Bethlenfalvay, G.J. Bacteria from Rhizosphere and Hyphosphere Soils of Different Arbuscular-Mycorrhizal Fungi. Plant Soil. 1997, 192, 71–79. [Google Scholar] [CrossRef]
  31. Zhang, L.; Zhou, J.C.; George, T.S.; Limpens, E.; Feng, G. Arbuscular Mycorrhizal Fungi Conducting the Hyphosphere Bacterial Orchestra. Trends Plant Sci. 2022, 27, 402–411. [Google Scholar] [CrossRef]
  32. Fernández, C.W.; Langley, J.A.; Chapman, S.; McCormack, M.L.; Koide, R.T. The Decomposition of Ectomycorrhizal Fungal Necromass. Soil Biol. Biochem. 2016, 93, 38–49. [Google Scholar] [CrossRef]
  33. See, C.R.; Keller, A.B.; Hobbie, S.E.; Kennedy, P.G.; Weber, P.K.; Pett-Ridge, J. Hyphae Move Matter and Microbes to Mineral Microsites: Integrating the Hyphosphere into Conceptual Models of Soil Organic Matter Stabilization. Glob. Change Biol. 2022, 28, 2527–2540. [Google Scholar] [CrossRef] [PubMed]
  34. Gorka, S.; Dietrich, M.; Mayerhofer, W.; Gabriel, R.; Kaiser, C. Rapid Transfer of Plant Photosynthates to Soil Bacteria via Ectomycorrhizal Hyphae and Its Interaction with Nitrogen Availability. Front. Microbiol. 2019, 10, 168. [Google Scholar] [CrossRef]
  35. Buckeridge, K.M.; La Rosa, A.F.; Mason, K.E.; Whitaker, J.; McNamara, N.P.; Grant, H.K.; Ostle, N.J. Sticky Dead Microbes: Rapid Abiotic Retention of Microbial Necromass in Soil. Soil Biol. Biochem. 2020, 149, 107929. [Google Scholar] [CrossRef]
  36. Ding, X.L.; Liang, C.; Zhang, B.; Yuan, Y.R.; Han, X.Z. Higher Rates of Manure Application Lead to Greater Accumulation of Both Fungal and Bacterial Residues in Macroaggregates of a Clay Soil. Soil Biol. Biochem. 2015, 84, 137–146. [Google Scholar] [CrossRef]
  37. See, C.R.; Fernandez, C.W.; Conley, A.M.; DeLancey, L.C.; Heckman, K.A.; Kennedy, P.G.; Hobbie, S.E. Distinct Carbon Fractions Drive a Generalisable Two-Pool Model of Fungal Necromass Decomposition. Funct. Ecol. 2021, 35, 796–806. [Google Scholar] [CrossRef]
  38. Kögel-Knabner, I. The Macromolecular Organic Composition of Plant and Microbial Residues as Inputs to Soil Organic Matter. Soil Biol. Biochem. 2002, 34, 139–162. [Google Scholar] [CrossRef]
  39. Deveautour, C.; Chieppa, J.; Nielsen, U.N.; Boer, M.M.; Mitchell, C.; Horn, S.; Power, S.A.; Guillen, A.; Bennett, A.E.; Powell, J.R. Biogeography of arbuscular mycorrhizal fungal spore traits along an aridity gradient, and responses to experimental rainfall manipulation. Fungal Ecol. 2020, 46, 100899. [Google Scholar] [CrossRef]
  40. Li, Y.H.; Xiao, M.L.; Wei, L.; Liu, Q.; Zhu, Z.K.; Yuan, H.Z.; Wu, J.S.; Yuan, J.; Wu, X.H.; Kuzyakov, Y.; et al. Bacterial necromass determines the response of mineral-associated organic matter to elevated CO2. Biol. Fertil. Soils 2024, 60, 327–340. [Google Scholar] [CrossRef]
  41. Lavallee, J.M.; Soong, J.L.; Cotrufo, M.F. Conceptualizing soil organic matter into particulate and mineral-associated forms to address global change in the 21st century. Glob. Change Biol. 2020, 26, 261–273. [Google Scholar] [CrossRef] [PubMed]
  42. Peltre, C.; Fernández, J.M.; Craine, J.M.; Plante, A.F. Relationships between biological and thermal indices of soil organic matter stability differ with soil organic carbon level. Soil Sci. Soc. Am. J. 2013, 77, 2020–2028. [Google Scholar] [CrossRef]
  43. Gong, K.Y.; Yang, F.; Long, H.; Gu, J.; Zhang, G.L. Vertical variations of thermal stability of soil organic matter in black soils under different pedogenetic modes. Acta Pedol. Sin. 2024, 61, 662–673. [Google Scholar] [CrossRef]
  44. Capel, E.L.; de la Rosa Arranz, J.M.; González-Vila, F.J.; González-Perez, J.A.; Manning, D.A.C. Elucidation of different forms of organic carbon in marine sediments from the Atlantic coast of Spain using thermal analysis coupled to isotope-ratio and quadrupole mass spectrometry. Org. Geochem. 2006, 37, 1983–1994. [Google Scholar] [CrossRef]
  45. Plante, A.F.; Fernández, J.M.; Leifeld, J. Application of thermal analysis techniques in soil science. Geoderma 2009, 153, 1–10. [Google Scholar] [CrossRef]
  46. Six, J.; Elliott, E.T.; Paustian, K.; Doran, J.W. Aggregation and soil organic matter accumulation in cultivated and native grassland soils. Soil Sci. Soc. Am. J. 1998, 62, 1367–1377. [Google Scholar] [CrossRef]
  47. Zhang, X.D.; Amelung, W. Gas chromatographic determination of muramic acid, glucosamine, mannosamine, and galactosamine in soils. Soil Biol. Biochem. 1996, 28, 1201–1206. [Google Scholar] [CrossRef]
  48. Tang, Z.X.; Feng, J.N.; Chen, L.L.; Chen, Z.B.; Shao, X.D.; Xia, T.Y. Coupling amendment of microbial and compound fertilizers increases fungal necromass carbon and soil organic carbon by regulating microbial activity in flue-cured tobacco-planted field. Eur. J. Soil Biol. 2023, 117, 103518. [Google Scholar] [CrossRef]
  49. Wang, Q.T.; Zhang, Y.; Zhang, P.P.; Li, N.; Wang, R.H.; Zhang, X.J.; Yin, H.J. Nitrogen deposition induces a greater soil C sequestration in the rhizosphere than bulk soil in an alpine forest. Sci. Total Environ. 2023, 875, 162701. [Google Scholar] [CrossRef]
  50. Hu, X.J.; Gu, H.D.; Liu, J.J.; Wei, D.; Zhu, P.; Cui, X.A.; Zhou, B.K.; Chen, X.L.; Jin, J.; Liu, X.B.; et al. Metagenomics reveals divergent functional profiles of soil carbon and nitrogen cycling under long-term addition of chemical and organic fertilizers in the black soil region. Geoderma 2022, 418, 115846. [Google Scholar] [CrossRef]
  51. Kalu, S.; Seppänen, A.; Mganga, K.Z.; Sietiö, O.M.; Glaser, B.; Karhu, K. Biochar reduced the mineralization of native and added soil organic carbon: Evidence of negative priming and enhanced microbial carbon use efficiency. Biochar 2024, 6, 7. [Google Scholar] [CrossRef]
  52. Liu, C.; Lu, M.; Cui, J.; Li, B.; Fang, C.M. Effects of straw carbon input on carbon dynamics in agricultural soils: A meta-analysis. Glob. Change Biol. 2014, 20, 1366–1381. [Google Scholar] [CrossRef] [PubMed]
  53. Wang, J.Y.; Xiong, Z.Q.; Kuzyakov, Y. Biochar stability in soil: Meta-analysis of decomposition and priming effects. GCB Bioenergy 2016, 8, 512–523. [Google Scholar] [CrossRef]
  54. Liu, L.; Liu, D.M.; Ding, X.D.; Chen, M.M.; Zhang, S.R. Straw incorporation and nitrogen fertilization enhance soil carbon sequestration by altering soil aggregate and microbial community composition in saline-alkali soil. Plant Soil 2024, 498, 341–356. [Google Scholar] [CrossRef]
  55. Xu, P.D.; Wang, Q.; Duan, C.J.; Huang, G.Y.; Dong, K.H.; Wang, C.H. Biochar addition promotes soil organic carbon sequestration dominantly contributed by macro-aggregates in agricultural ecosystems of China. J. Environ. Manag. 2024, 359, 121042. [Google Scholar] [CrossRef]
  56. Zhang, Y.L.; Sun, C.X.; Wang, S.Q.; Xie, H.T.; Jiang, N.; Chen, Z.H.; Wei, K.; Bao, X.L.; Song, X.Y.; Bai, Z. Stover and biochar can improve soil microbial necromass carbon, and enzymatic transformation at the genetic level. GCB Bioenergy 2022, 14, 1082–1096. [Google Scholar] [CrossRef]
  57. Siedt, M.; Schäffer, A.; Smith, K.E.C.; Nabel, M.; Roß-Nickoll, M.; van Dongen, J.T. Comparing straw, compost, and biochar regarding their suitability as agricultural soil amendments to affect soil structure, nutrient leaching, microbial communities, and the fate of pesticides. Sci. Total Environ. 2021, 751, 141607. [Google Scholar] [CrossRef] [PubMed]
  58. Huang, J.S.; Liu, W.X.; Yang, S.; Yang, L.; Peng, Z.Y.; Deng, M.F.; Xu, S.; Zhang, B.B.; Ahirwal, J.; Liu, L.L. Plant carbon inputs through shoot, root, and mycorrhizal pathways affect soil organic carbon turnover differently. Soil Biol. Biochem. 2021, 160, 108322. [Google Scholar] [CrossRef]
  59. Dijkstra, F.A.; Zhu, B.; Cheng, W. Root effects on soil organic carbon: A double-edged sword. New Phytol. 2021, 230, 60–65. [Google Scholar] [CrossRef]
  60. Potthoff, M.; Dyckmans, J.; Flessa, H.; Beese, F.; Joergensen, R.G. Decomposition of maize residues after manipulation of colonization and its contribution to the soil microbial biomass. Biol. Fertil. Soils 2008, 44, 891–895. [Google Scholar] [CrossRef]
  61. Zhang, Y.L.; Xie, H.T.; Wang, F.P.; Sun, C.X.; Zhang, X.D. Effects of biochar incorporation on soil viable and necromass carbon in the Luvisol soil. Soil Use Manage 2021, 38, 318–330. [Google Scholar] [CrossRef]
  62. He, H.B.; Zhang, W.; Zhang, X.D.; Xie, H.T.; Zhuang, J. Temporal responses of soil microorganisms to substrate addition as indicated by amino sugar differentiation. Soil Biol. Biochem. 2011, 43, 1155–1161. [Google Scholar] [CrossRef]
  63. Paterson, E.; Osler, G.; Dawson, L.A.; Gebbing, T.; Sim, A.; Ord, B. Labile and recalcitrant plant fractions are utilised by distinct microbial communities in soil: Independent of the presence of roots and mycorrhizal fungi. Soil Biol. Biochem. 2008, 40, 1103–1113. [Google Scholar] [CrossRef]
  64. Cotrufo, M.F.; Wallenstein, M.D.; Boot, C.M.; Denef, K.; Paul, E. The Microbial Efficiency-Matrix Stabilization (MEMS) framework integrates plant litter decomposition with soil organic matter stabilization: Do labile plant inputs form stable soil organic matter? Glob. Change Biol. 2013, 19, 988–995. [Google Scholar] [CrossRef]
  65. Song, W.C.; Wang, J.; Hou, L. Effects of frequency and amount of stover mulching on soil nitrogen and the microbial functional guilds of the endosphere and rhizosphere. Front. Microbiol. 2022, 13, 976154. [Google Scholar] [CrossRef] [PubMed]
  66. Rozmoš, M.; Bukovská, P.; Hršelová, H.; Kotianová, M.; Dudáš, M.; Gančarčíková, K.; Jansa, J. Organic nitrogen utilisation by an arbuscular mycorrhizal fungus is mediated by specific soil bacteria and a protist. ISME J. 2022, 16, 676–685. [Google Scholar] [CrossRef]
  67. Hou, Z.N.; Wang, R.H.; Chang, S.; Zheng, Y.; Ma, T.T.; Xu, S.Q.; Zhang, X.J.; Shi, X.; Lu, J.; Luo, D.Q.; et al. The Contribution of Microbial Necromass to Soil Organic Carbon and Influencing Factors Along a Variation of Habitats in Alpine Ecosystems. Sci. Total Environ. 2024, 921, 171126. [Google Scholar] [CrossRef]
  68. Ni, X.; Liao, S.; Tan, S.; Peng, Y.; Wang, D.; Yue, K.; Wu, F.; Yang, Y. The vertical distribution and control of microbial necromass carbon in forest soils. Glob. Ecol. Biogeogr. 2020, 29, 1829–1839. [Google Scholar] [CrossRef]
  69. Zhang, C.; Zhao, X.; Liang, A.J.; Li, Y.Y.; Song, Q.Y.; Li, X.Y.; Li, D.P.; Hou, N. Insight into the soil aggregate-mediated restoration mechanism of degraded black soil via biochar addition: Emphasizing the driving role of core microbial communities and nutrient cycling. Environ. Res. 2023, 228, 115895. [Google Scholar] [CrossRef]
  70. Kozjek, K.; Manoharan, L.; Urich, T.; Ahrén, D.; Hedlund, K. Microbial gene activity in straw residue amendments reveals carbon sequestration mechanisms in agricultural soils. Soil Biol. Biochem. 2023, 179, 108994. [Google Scholar] [CrossRef]
Figure 1. Schematic diagram of the three compartments in the PVC root box. S, bulk soil; R, rhizosphere soil; H, hyphosphere soil.
Agronomy 15 01303 g001
Figure 2. Distribution of soil aggregates in each soil compartment under the different treatments. Three treatments were applied: NPK, chemical fertilizer alone; NPKB, chemical fertilizer plus rice straw biochar; NPKS, chemical fertilizer plus rice straw.
Agronomy 15 01303 g002
Figure 3. Concentrations of MNC in each soil compartment under the different treatments. Panels show bacterial necromass carbon (BNC) (a), fungal necromass carbon (FNC) (c), and the ratio of FNC/BNC (e). Effects of each treatment on BNC (b), FNC (d), and FNC/BNC (f) are shown. NPK, chemical fertilizer alone; NPKB, chemical fertilizer plus rice straw biochar; NPKS, chemical fertilizer plus rice straw. Error bars indicate the standard deviation. The dots represent the replication of each treatment. Different lowercase letters indicate a significant difference (p < 0.05) in the same soil compartment under different treatments. **, p < 0.05; ***, p < 0.01; #, p < 0.05 indicate a significant difference between NPKB and NPKS.
Agronomy 15 01303 g003
Figure 4. Bacterial (a) and fungal (b) microbial carbon pump (MCP) efficacy in response to organic fertilizer addition. S, R, and H indicate the bulk soil, rhizosphere soil, and hyphosphere soil, respectively. NPK, chemical fertilizer alone; NPKB, chemical fertilizer plus rice straw biochar; NPKS, chemical fertilizer plus rice straw. Error bars indicate the standard deviation. Different lowercase letters indicate a significant difference (p < 0.05) in different soil compartments under the same treatment. **, p < 0.05, indicates a significant difference in MCP efficacy between NPKS and NPKB in different soil compartments.
Agronomy 15 01303 g004
Figure 5. SOC thermal stability in each soil compartment under the different treatments. TG-T50 indicates the temperature at which half of the total SOC weight is lost (a). Exo1/(Exo2 + Exo3) indicates the ratio of the mass loss in the low-temperature section (Exo1, 200–400 °C) to mass losses in the high-temperature section (Exo2 + Exo3, 400–600 °C) of the SOC weight (b). S, R, and H indicate the bulk soil, rhizosphere soil, and hyphosphere soil, respectively. NPK, chemical fertilizer alone; NPKB, chemical fertilizer plus rice straw biochar; NPKS, chemical fertilizer plus rice straw. Error bars indicate the standard deviation. Different lowercase letters indicate a significant difference (p < 0.05) in different soil compartments under the same treatment. Different uppercase letters indicate a significant difference (p < 0.05) in the same soil compartment under different treatments.
Agronomy 15 01303 g005
Figure 6. Microbial functional profiles of genes involved in soil carbon-cycling identified by PCoA based on Bray–Curtis distances. Anosim was conducted to examine the differences in microbial functional profiles among the three treatments or among the three soil compartments under each treatment. S, R, and H indicate the bulk, rhizosphere, and hyphosphere soil, respectively. NPK, chemical fertilizer alone; NPKB, chemical fertilizer plus rice straw biochar; NPKS, chemical fertilizer plus rice straw.
Agronomy 15 01303 g006
Figure 7. Normalized abundances of C degradation (a) and C fixation genes (b) in the different soil compartments under the three treatments. S, R, and H indicate the bulk soil, rhizosphere soil, and hyphosphere soil, respectively. NPK, chemical fertilizer alone; NPKB, chemical fertilizer plus rice straw biochar; NPKS, chemical fertilizer plus rice straw. Error bars indicate the standard deviation.
Agronomy 15 01303 g007
Figure 8. PLS-PM showing the effect of straw and biochar application and the different soil compartments on SOC stability (a). The specific genes used to build the PLS-PM model are specified within the blue boxes associated with fc and dc. Information on these genes is provided in Table S1 of the Supporting Information. Solid black and red lines indicate significant positive and negative impacts (with standardized path coefficients rounded to two decimal points), respectively, while the dashed lines denote nonsignificant effects. The width of each solid arrow is directly correlated with the standardized path coefficients. The goodness-of-fit statistic (r2) for the model is displayed below the model. (b) Path coefficients specific to different taxa are presented as a bar chart. **, p < 0.05; ***, p < 0.01.
Agronomy 15 01303 g008
Table 1. Basic characteristics of the soil and organic fertilizer materials used in the experiment.
IndexSoilStrawBiochar
pH5.13\\
Total carbon (g kg−1)15.00303.00454.00
Total nitrogen (g kg−1)1.909.8012.90
Total phosphorus (g kg−1)\1.723.03
Total potassium (g kg−1)\11.4317.31
Available nitrogen (mg kg−1)164.50\\
Available phosphorus (mg kg−1)8.82\\
Available potassium (mg kg−1)339.73\\
Table 2. Soil properties in each rhizosphere compartment under the different treatments.
TreatmentsPartitionsSOC
(g kg−1)
TN
(g kg−1)
SOC/TNpHAN
(mg kg−1)
AP
(mg kg−1)
AK
(mg kg−1)
NPKS15.30 ± 0.30 aC1.83 ± 0.12
aB
8.09 ± 0.31
aB
5.33 ± 0.07 bA154.58 ± 3.59
aB
9.98 ± 0.62
aA
379.92 ± 12.13 aC
R15.60 ± 0.26 aC1.70 ± 0.00 aC8.08 ± 0.15 aA5.66 ± 0.16 aA133.58 ± 7.15
bA
8.55 ± 0.65
bB
213.14 ± 3.96
bB
H15.13 ± 0.40 aC1.77 ± 0.06 aA7.69 ± 0.41
aB
5.47 ± 0.20 abA156.22 ± 6.65
aB
9.55 ± 0.67 abA362.75 ± 13.06 aC
NPKBS21.73 ± 0.19 bA2.03 ± 0.06 aA8.62 ± 0.24 aA5.38 ± 0.08 bA164.92 ± 8.70
aB
9.62 ± 0.33 abA718.9 ± 45.99
aA
R23.35 ± 0.45 aA2.07 ± 0.06 aA8.65 ± 0.54 aA5.75 ± 0.03 aA145.48 ± 7.81
bA
8.92 ± 0.47
bB
576.09 ± 16.13 bA
H21.95 ± 0.05 bA2.07 ± 0.12 aA8.67 ± 0.64 aA5.43 ± 0.10 bA172.92 ± 3.08
aB
10.15 ± 0.43
aA
723.26 ± 16.31 aA
NPKSS17.30 ± 0.44 aB1.97 ± 0.06 a AB7.86 ± 0.27
aB
5.16 ± 0.08 bB200.88 ± 7.82
aA
10.58 ± 0.52
aA
553.01 ± 37.98 aB
R17.33 ± 0.21 aB1.90 ± 0.00
aB
8.18 ± 0.71 aA5.52 ± 0.14 aA146.18 ± 5.25
bA
10.65 ± 0.29
aA
562.37 ± 12.96 aA
H17.23 ± 0.12 aB1.90 ± 0.00 aA7.89 ± 0.29 aA5.23 ± 0.04 bA200.32 ± 4.50
aA
10.28 ± 0.56
aA
510.6 ± 37.67
aB
SOC, soil organic carbon; TN, soil total nitrogen; AN, soil available nitrogen; AP, soil available phosphorus; AK, soil available potassium; NPK, chemical fertilizer alone; NPKB, chemical fertilizer plus rice straw biochar; NPKS, chemical fertilizer plus rice straw. S, R, and H indicate the bulk, rhizosphere, and hyphosphere soil, respectively. Different lowercase letters following the values indicate a significant difference (p < 0.05) in different soil compartments under the same treatment. Different uppercase letters indicate a significant difference (p < 0.05) in the same compartment under different treatments.
Table 3. Thermal mass losses in different soil compartments under the different treatments.
TreatmentsPartitionsExo 1 (%)Exo 2 (%)Exo 3 (%)
NPKS43.53 ± 1.05 aB48.38 ± 0.74 aA8.09 ± 0.31 aB
R43.92 ± 0.70 aA48.00 ± 0.56 aA8.08 ± 0.15 aA
H44.79 ± 1.37 aA47.52 ± 1.01 aA7.69 ± 0.41 aB
NPKBS42.37 ± 0.74 aB49.01 ± 0.64 aA8.62 ± 0.24 aA
R43.00 ± 0.53 aA48.35 ± 1.05 aA8.65 ± 0.54 aA
H42.66 ± 0.72 aB48.67 ± 1.15 aA8.67 ± 0.64 aA
NPKSS46.81 ± 0.83 aA45.33 ± 1.06 bB7.86 ± 0.27 aB
R44.99 ± 1.06 bB46.82 ± 0.37 aB8.18 ± 0.71 aA
H45.19 ± 0.38 bA46.91 ± 0.17 aB7.89 ± 0.29 aA
The Exo1, 2, and 3 in the table indicate the relative weight loss (%) for the temperature ranges 200–400, 400–550, 550–600 °C, respectively. S, R, and H indicate the bulk, rhizosphere, and hyphosphere soil, respectively. NPK, chemical fertilizer alone; NPKB, chemical fertilizer with rice straw biochar; NPKS, chemical fertilizer with rice straw. Different lowercase letters following the values indicate a significant difference (p < 0.05) in different soil compartments under the same treatment. Different uppercase letters indicate a significant difference (p < 0.05) in the same compartment under different treatments.
Disclaimer/Publisher’s Note: The statements, opinions and data contained in all publications are solely those of the individual author(s) and contributor(s) and not of MDPI and/or the editor(s). MDPI and/or the editor(s) disclaim responsibility for any injury to people or property resulting from any ideas, methods, instructions or products referred to in the content.

