Article

Optimization of Irrigation Parameters of Peanut Under Mulched Drip Irrigation in Xinjiang Based on Yield and Water Use Efficiency

1
College of Water Conservancy Engineering, Tianjin Agricultural University, Tianjin 300392, China
2
Institute of Western Agriculture, The Chinese Academy of Agricultural Sciences, Changji 831100, China
3
Shijiazhuang Water Resources and Hydropower Survey, Design and Research Institute Co., Ltd., Shijiazhuang 050021, China
4
Institute of Crops, Xinjiang Academy of Agricultural Sciences, Urumqi 830091, China
5
College of Humanities, Tianjin Agricultural University, Tianjin 300392, China
*
Authors to whom correspondence should be addressed.
Agronomy 2025, 15(6), 1302; https://doi.org/10.3390/agronomy15061302
Submission received: 14 April 2025 / Revised: 19 May 2025 / Accepted: 23 May 2025 / Published: 26 May 2025
(This article belongs to the Section Water Use and Irrigation)

Abstract

To optimize water–nitrogen management for mulched drip-irrigated peanuts in Xinjiang, a three-season field experiment was conducted to assess the impacts of drip irrigation rates and water–nitrogen coupling on peanut growth, yield, quality, and water–nitrogen use efficiency. Two irrigation accounts (30 and 37.5 mm, denoted as W1 and W2), three nitrogen application levels (half nitrogen application and conventional nitrogen application, denoted as N1 and N2), and a control treatment (CK) without nitrogen application, and two drip discharge rates (3.0 and 6.0 L h−1, denoted as Q1 and Q2) were utilized for a total of five treatments per year, and the experiment was repeated three times. The results demonstrated that the irrigation and fertilization parameters of the W2N1Q2 treatment could significantly improve peanut growth, yield, quality, and water–nitrogen use efficiency, achieving optimal values for all measured indicators. Compared with the control (W2N0Q1), the main stem height increased by 9.59% and 13.13%, the aboveground biomass increased by 6.32% and 34.67%, the yield increased by 26.69% and 20.97% (p < 0.01), the water use efficiency increased by 27.08% and 16.33%, the nitrogen partial factor productivity values were 47.39 and 77.00 kg kg−1, the protein content increased by 3.99% and 4.63%, and the oil content increased by 1.68% and 8.53%, respectively. A PCA was performed using five key performance indicators (yield, protein content, oil content, water use efficiency, and nitrogen partial factor productivity) to evaluate different treatment combinations. The W2N1Q2 treatment obtained the highest composite score, indicating its overall superior performance among all treatments. Therefore, under the conditions of this experiment, the irrigation and nitrogen application parameters for achieving both a high yield and quality of peanuts under mulched drip irrigation in Xinjiang were determined to be W2N1Q2 treatment (irrigation account of 37.5 mm, nitrogen application of 118 kg ha−1, and drip discharge of 6.0 L h−1). This optimized combination brings three key advantages to water-scarce regions: (1) maximizing yield water use efficiency through precise irrigation scheduling; (2) balanced nutrient management to prevent nitrogen wastage; and (3) providing a key technological reference for agricultural production in Xinjiang and other similar ecological zones.

1. Introduction

Peanut (Arachis hypogaea L.) is a vital cash and oil crop in China, playing a crucial role in the national economy. The peanut industry serves as a key pillar in safeguarding national food and oil security [1]. In 2023, China‘s peanut planting area was 4.798 million hectares, with a total output of 19.23 million tons and an average yield of 4008.13 kg ha−1. Xinjiang ranks first in the country in terms of yield per unit area [2]. However, located in the arid northwest inland of China, Xinjiang is characterized by scarce precipitation and high evaporation rates, making it a typical irrigated agricultural region [3]. The increasing frequency of extreme weather events (e.g., heatwaves and declining precipitation) has intensified Xinjiang’s reliance on irrigation for agriculture, worsening water scarcity [4]. The integrated water and fertilizer technology under mulched drip irrigation has been widely adopted in Xinjiang due to its advantages of water and fertilizer efficiency, increased yield, and improved soil conditions. It has become one of the primary irrigation and fertilization methods in local agricultural production [5,6].
While agricultural productivity is constrained by environmental limitations, current high crop yields in Xinjiang still rely heavily on intensive inputs of irrigation, chemical fertilizers, and pesticides [7]. Mulched drip irrigation is a localized irrigation technology where the soil wetting uniformity under varying drip discharges significantly affects crop growth, yield, and water use efficiency [8]. Insufficient irrigation not only restricts the development of crop canopies and diminishes their photosynthetic capacity but also ultimately leads to yield reduction [9]. Through experimental observations of wetting zone formation under different emitter discharge rates, Sun Hao demonstrated that higher drip discharges in mulched drip-irrigated cotton fields form wider and shallower soil wetting zones, leading to more uniform root distribution under the plastic film [10]. Lower drip discharge rates resulted in narrower and deeper soil wetting zones, causing roots to concentrate in the central subsurface region beneath the film. This spatial pattern led to significant variations in cotton plant height and other growth indices between rows, ultimately impacting total photosynthate accumulation and biomass allocation between aboveground and root systems [11,12].
Optimal water–nitrogen coordination is vital for crop growth and physiological functioning [13]. The key to ensuring high yield and quality of crops lies in the scientific regulation of water and nitrogen supply. Soil water content dynamics directly regulate crop photosynthetic efficiency, where adequate moisture enhances leaf area index expansion rates and photosynthate accumulation, being key determinants of achieving higher crop yields [14]. However, excessive soil moisture can induce hypoxia stress in the root zone, impairing water and nutrient uptake [15]. This excessive soil moisture may also lead to nutrient dilution in grains, particularly reducing protein content [16]. Moreover, as a result of the excessive soil moisture, waterlogged conditions promote pest and disease incidence, causing crop damage during critical growth stages and ultimately compromising crop quality [17]. Appropriate nitrogen application enhances nitrogen translocation efficiency to sink organs by modulating growing degree-day accumulation and leaf expansion dynamics, thereby improving crop photosynthetic performance and ultimately increasing yield potential [18]. Optimal nitrogen application promotes biomass accumulation and improves nutrient partitioning, consequently enhancing crop yield [19]. Peanut protein content increases with the increase in nitrogen application rate, but excessive nitrogen fertilizer input will lead to excess soil nutrients, tall plants, delayed maturity, and prolongation of the growth period [20]. In turn, such consequences give rise to inefficient consumption of water and nutrients [21], cause the weakening of the nutrient absorption capacity of peanuts, and bring about a significant reduction in protein and oil contents [16]. Xing found that optimal nitrogen application substantially enhanced aboveground biomass and yield of tomatoes in greenhouse water–nitrogen interaction experiments [22]. Appropriate synergy between water and nitrogen supply can notably boost the photosynthetic efficiency of crops, facilitate the synthesis and accumulation of biomass, and, consequently, improve yield and quality. Therefore, it is extremely significant to establish an accurate water–nitrogen coupling management model in accordance with the fertilizer and water demand laws of crops to achieve high-efficiency and sustainable agricultural development. Principal component analysis is employed in this study due to its unique advantages in handling multivariate data. As a dimensionality-reduction technique, PCA transforms correlated variables (e.g., growth, yield, quality, water use efficiency, and nitrogen partial factor productivity) into a few uncorrelated principal components that retain maximum original information [23]. This method effectively resolves collinearity among variables and facilitates comprehensive evaluation by integrating diverse indicators. For example, PCA has been successfully applied to optimize water–nitrogen parameters in crops like oil sunflower, cherry, tomato, blueberry, and rice [23,24,25,26,27], demonstrating its utility in synthesizing complex agronomic datasets. In this context, PCA will help identify key factors influencing peanut performance under different combinations of irrigation account, nitrogen rate, and drip discharge, enabling the derivation of an optimal water–nitrogen management model that balances yield, quality, and resource efficiency.
In the field of agricultural science, current research on efficient water and nitrogen use in peanuts has focused on one-factor (irrigation account or nitrogen fertilizer application) or two-factor (coupled water and nitrogen) experimental designs to determine the optimal water and fertilizer management strategies during the peanut growth period [16,28,29]. Few studies have reported the combined effects of irrigation account, nitrogen fertilizer application rate, and drip discharge rate on peanut growth, yield, quality, and water–nitrogen use efficiency. The responses of peanut growth, yield, and water–nitrogen use efficiency to different combinations of irrigation account, nitrogen application rate, and drip discharge remain unclear. Therefore, to bridge this knowledge gap, the author aims to employ a combination of field experiments and theoretical analysis to investigate the impacts of these factors on peanut growth, yield, quality, and water–nitrogen utilization efficiency. We systematically analyzed the differences in peanut growth characteristics, yield components, water–nitrogen utilization efficiency, and quality indicators under different treatments. Furthermore, we employed principal component analysis to identify and select the optimal irrigation and fertilization parameters, which provide solid theoretical and technical support for the high-quality development of the peanut industry in the Xinjiang region.

2. Materials and Methods

2.1. Experimental Field

The field experiment was carried out during the peanut growing seasons of 2022–2024 at the Anningqu Comprehensive Experimental Site of the Xinjiang Academy of Agricultural Sciences (87°30′ E, 43°58′ N, elevation 590 m). The experimental field is located in Urumqi, Xinjiang Uygur Autonomous Region. It is located in the middle part of the northern foothills of Tianshan Mountain and the alluvial plain in the northern suburb of Urumqi City, with a gentle terrain, which is a typical area of the economic zone on the northern slopes of Tianshan Mountain. The average annual sunshine hours of the experimental field are 2700–2800 h, the effective cumulative temperature greater than 10 °C reaches 3000–3500 °C, and the frost-free period is 170–179 d. The average annual precipitation is 200 mm, the maximum evapotranspiration is 1750 mm, and the depth of groundwater is 7.5 m. The area is located in the arid and semi-arid desert climatic zone agricultural area. The pH value of the cultivated soil in the experimental area ranged from 7.8 to 8.0, and the physicochemical properties of the 0–60 cm soil depth are shown in Table 1 below. Figure 1 illustrates the reference evapotranspiration values and precipitation for the test period. The reference crop evapotranspiration (ETo) was calculated by the Penman-Monteith formula [30].

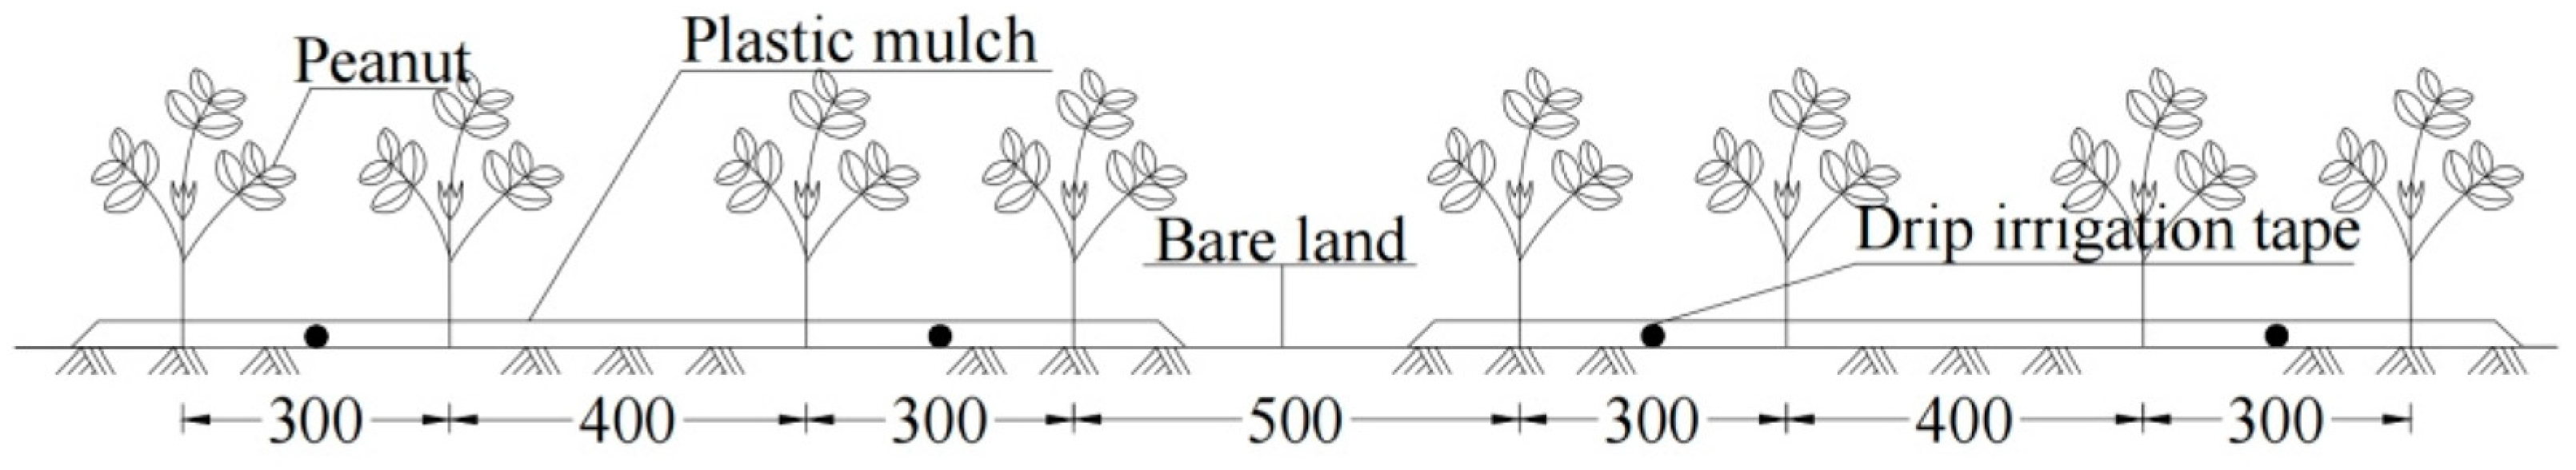
2.2. Peanut Cropping Patterns

The peanut variety HuaYu 9610 was similarly managed in a three-season experiment, with a planting mode of 1 film, 2 belts, and 4 rows of a wide and narrow row pattern (Figure 2). The width of the membrane was 1.25 m, and 4 rows of peanuts were planted in the membrane. The row spacing was 1000 (300 + 400 + 300) mm, and the hole spacing was 150 mm. The peanut row spacing between the two membranes was 60 cm, and the total width of the 4 rows of peanuts in a single membrane was 1.5 m. The sowing density was about 166,000 holes ha−1, and the area of the experimental area was about 1728 m2. Before sowing, 375 kg ha−1 of compound fertilizer was spread as a basal fertilizer in a single application, after which the ground was prepared. Seeds were planted 7 May 2022 (dry seeding and wet emergence) and harvested 27 September; 1 May 2023 (dry seeding and wet emergence) and harvested 30 September; and 4 May 2024 (dry seeding and wet emergence) and harvested 17 September. A follow-up fertilizer was applied using a Venturi fertilizer applicator with water dripping, and a nitrogen fertilizer was selected as the urea (Nitrogen content ≥ 46%) and a peanut special fertilizer. Chemical control, spraying, and other agronomic measures are the same as the high-yield farmland management mode. Irrigation was conducted using sub-film drip irrigation, a drip irrigation belt with a diameter of 16 mm, drip head spacing of 20 cm, a working pressure of 0.1 Mpa with a drip discharge of 3.0 L h−1, an irrigation water source for groundwater, and irrigation water by the water meter, measured separately.

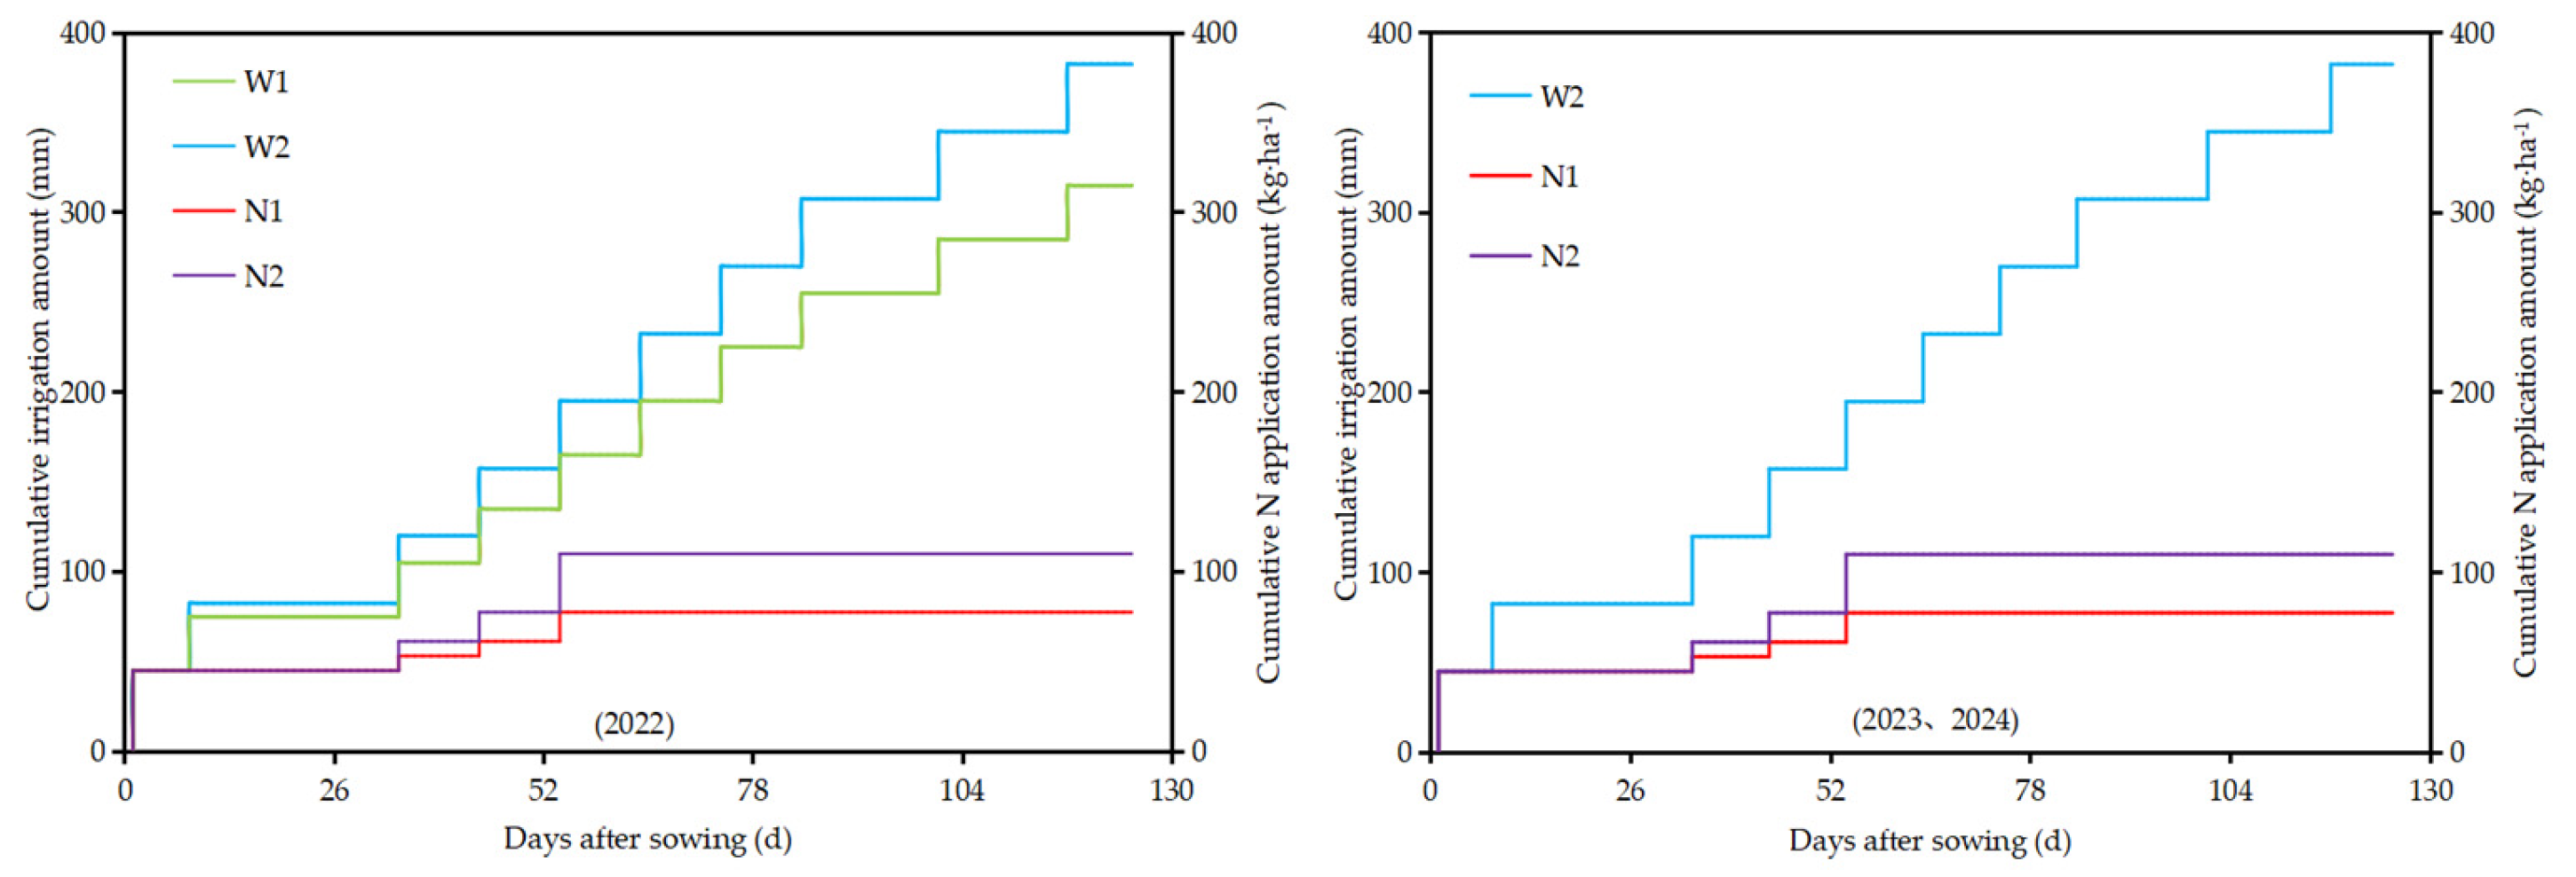
2.3. Experimental Design

According to the growth habit of peanuts, peanut fertility is divided into four fertility stages: the seedling stage, needle stage, podding stage, and fruiting stage. The field experiment was conducted with two factors: irrigation and nitrogen application, and the irrigation account was set at low and high irrigation accounts (denoted as W1 and W2, respectively) in 2022. Nitrogen fertilizer use during the reproductive period was set at two levels (N1 and N2, respectively). The two factors were completely combined, and a control treatment (CK) was set up without nitrogen application during the reproductive period. The irrigation account of W1 treatment was 7.5 mm lower than that of W2 treatment. Nitrogen fertilizers are selected as water-soluble fertilizers and are transported with water to the peanut roots through the drip irrigation belt spout. According to the field investigation, the irrigation account of W2 treatment in 2022 was determined to be 37.5 mm. During the growth period of conventional topdressing nitrogen treatment, 65 kg ha−1 nitrogen fertilizer was applied with irrigation, and the small drip discharge was 3.0 L h−1 (Q1). There was a total of 5 treatments (Table 2) and each treatment was replicated 3 times for a total of 15 plots. Based on the experimental results in 2022, the irrigation account of all treatments was adjusted to 37.5 mm in 2023 and 2024, and pure nitrogen (164 kg ha−1) was applied with irrigation during the growth period of conventional nitrogen topdressing treatment. The drip discharge was set at two levels (3.0 and 6.0 L h−1, denoted as Q1 and Q2, respectively). According to the local peanut production practice, dry sowing and wet emergence were used. To ensure smooth seedling emergence, 45 mm of emergence water was applied after sowing. The actual amounts of nitrogen applied by irrigation during the fertility period of 2022–2024 are shown in Figure 3 (nitrogen application was 77.5, 110.0, and 45.0 kg ha−1 for the N1, N2, and CK treatments for the whole reproductive cycle in 2022, and 118, 164, and 45 kg ha−1 for the N1, N2, and CK treatments in 2023 and 2024, respectively).

2.4. Measurement Items and Methods

2.4.1. Methods for Determining Soil Water Content

Soil moisture in the field during the reproductive period was monitored using the soil-drying method. It was measured in depths (0–20, 20–40, 40–60, 60–80, and 80–100 cm) before irrigation and after harvest. The planting characteristics of peanuts in wide and narrow rows as well as the deep percolation characteristics of drip tape were taken into account after irrigation. After irrigation, one sampling was taken at the critical fertility period, and four sampling points were selected for each treatment; the sampling points were 0 (in the membrane), 20 (in the inner row), 35 (under the drip tape), and 70 (between the membranes) cm directly below the center of the wide rows under the membranes, and the depth of monitoring was 0–60 cm in a depth of every 10 cm, and four samplings were carried out to determine the soil moisture. Before planting, before irrigation, and after harvesting, each treatment was selected as a sampling point directly below the drip tape, and the profile average soil water content [32] was calculated to represent the average soil water content of the peanut field.

2.4.2. Measurement and Methods of Plant Growth Indexes

Right from the 4-leaf stage, peanut main stem height was measured at 10-day intervals using a straightedge with 1 mm precision. At the same time, aboveground biomass was assessed at 10-day intervals by randomly picking out three typical plants per treatment. All plant components (leaves, stems, and roots) were immediately transferred to a forced-air oven at 105 °C for 30 min to deactivate enzymes, followed by drying at 75 °C until constant weight was achieved. Dry biomass measurements were conducted using an electronic balance with 0.01 g accuracy. The reliability of the results is ensured by assessing the variability of the data through statistical methods and eliminating outliers (extreme data that deviate significantly from the mean).

2.4.3. Yield Determination and Methods

Yield: plot yield was determined by harvesting 6.67 m2 of each treatment (three representative 6.67 m2 sample plots were selected for each treatment) at the pod-filling stage, picking the pods into mesh bags, and drying them naturally.

2.4.4. Calculation of Crop Water Consumption

According to the principle of water balance [33], the field water consumption of peanuts in each treatment was calculated as follows:
ET = P + M + G   -   R   -   SI + W
where ET is water consumption at the peanut stage, mm; P is precipitation, mm; “M” is irrigation water, mm; G is groundwater recharge, mm; R is surface runoff, mm; SI is deep percolation, mm. The measured data show that throughout the reproductive cycle, the number of effective precipitation greater than 10 mm is 0; take p = 0. In the experimental area of the groundwater depth of more than 7.5 m, the changes in the groundwater fraction of the experiment on the recharge effect are not obvious; take G = 0. Using a drip irrigation belt to irrigate the crop, the water only acts around the roots, so there is no runoff formed on the surface; take R = 0. In the experimental field, through the calculation of the water balance equation to determine the amount of irrigation, there is no deep seepage; take SI = 0.
W is the amount of reduction in the soil water storage capacity, mm:
W =   W i   -   W i + 1
where W i is the soil water storage in the planned wet depth at the beginning of the time period, mm; W i + 1 is the soil water storage in the planned wet depth at the end of the time period, mm).
To facilitate water balance calculations, water content was converted to soil water storage in mm, W :
W = 10   ×   θ   ×   γ   ×   h
where W is the soil water storage capacity, mm; “θ” is the soil mass water content within the planned wetted depth, %; γ is the soil volumetric mass, g cm−3; and h is the depth of the planned wetted depth, cm.

2.4.5. Calculation of Water Use Efficiency, Nitrogen Partial Factor Productivity

WUE = Y / ET
NPFP = Y / N
where WUE is water use efficiency, kg m−3; Y is yield, kg; ET is the total water consumption of the mulched drip irrigation peanut during the whole growth period, mm; NPFP is nitrogen partial factor productivity, kg kg−1; and N is the total amount of nitrogen applied during the whole life span of drip-irrigated peanut under the membrane, kg.

2.4.6. Quality

A number of mature peanut seed kernels of uniform size and undamaged were selected for each treatment for the determination of quality indexes, and each treatment was replicated three times. The protein content and oil content of peanuts were determined using a near-infrared rapid quality analyzer (NIRSTM DS2500 F, Hillerød, Denmark).

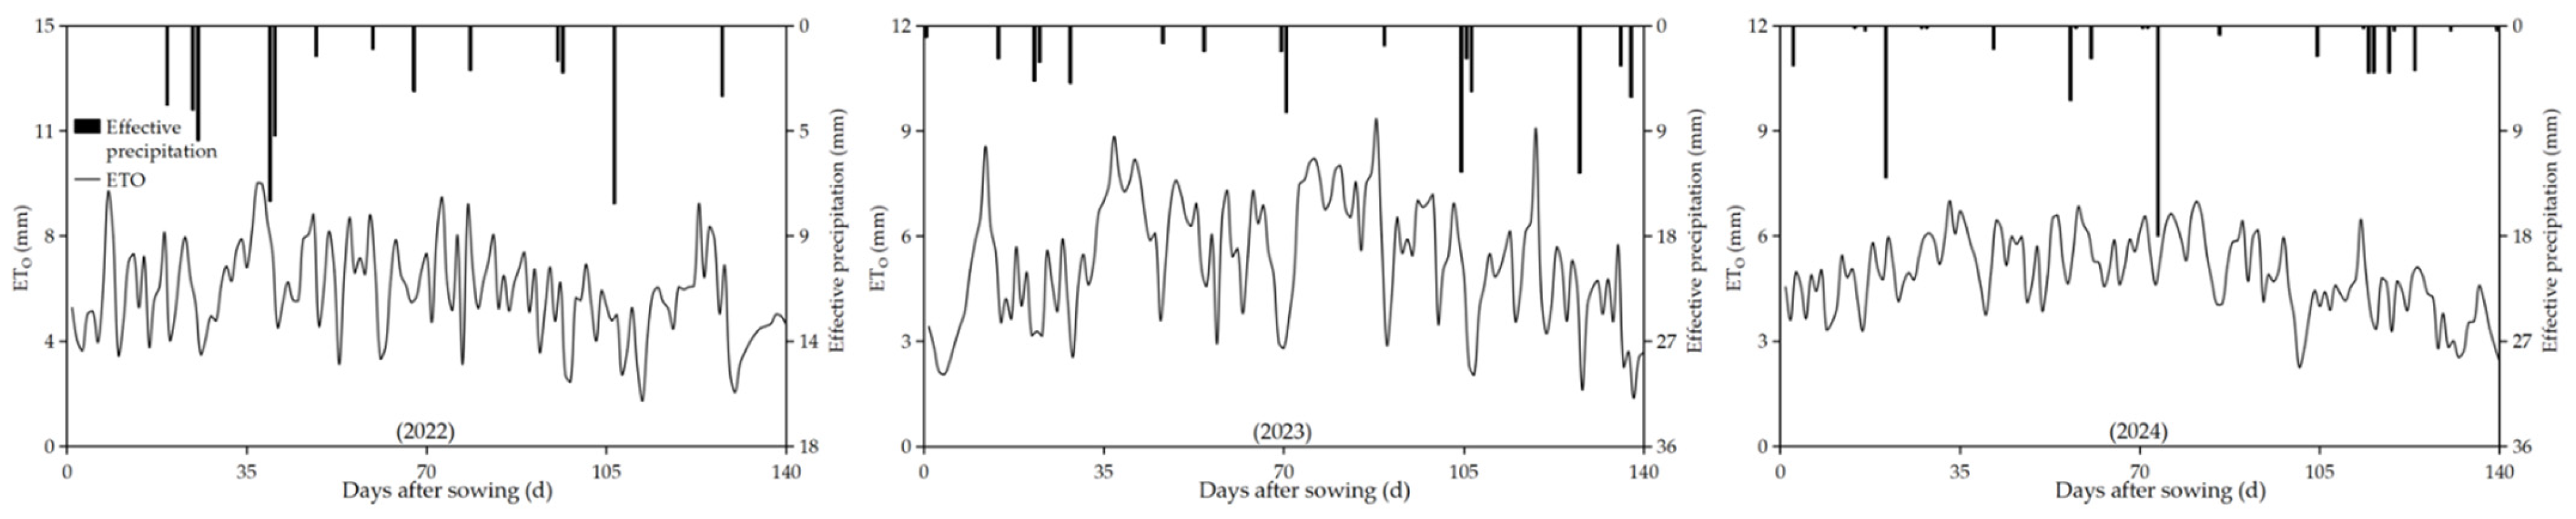
2.4.7. Meteorological Data

Some of the meteorological data, such as temperature, solar radiation, wind speed, relative humidity, and precipitation during the reproductive period of the peanuts, were provided by the China Meteorological Data Service Center (http://data.cma.cn/, accessed on 25 February 2025).

2.5. Principles of Principal Component Analysis (PCA)

Principal component analysis is a collective term for a class of techniques based on complex mathematical principles designed to transform a number of potentially correlated variables into a streamlined number of variables to reduce the dimensionality of the data and improve the efficiency of the analysis [34]. The process of analysis is as follows:
(a)
Sample parameter selection
X = X 11 X 12 X 21 X 22 X 1 p X 2 p     X n 1 X n 2 X np
where n is the sample size (measurements of peanut yield, water use efficiency, nitrogen partial factor productivity, protein, and oil content in this study), and p is the number of variables.
(b)
Standardization of sample parameters
To eliminate the quantitative differences between the evaluation indicators, the evaluation indicators after the homogenization process were standardized as follows:
X ij = X ij   -   X j ¯ S j ,   i = 1 , 2 , , n ;   j = 1 , 2 , , p
where X j ¯ = 1 n i = 1 n X ij , S j 2 = 1 n - 1 i = 1 n ( X ij -   X ¯ ) 2 , and n is the measurement of the sample size.
(c)
Calculation of the matrix of correlation coefficients for standardized evaluation indicators:
R = r 11 r 12 r 21 r 22 r 1 p r 2 p     r p 1 r p 2 r pp
where r ij is the correlation coefficient of the ith indicator with the jth indicator, r ij = r ji , r ij is calculated from the following equation:
r ij = k = 1 n X ki     -   X j ¯ X kj   -   X j ¯ k = 1 n ( X ki   -   X j ¯ ) 2 k = 1 n X kj   -   X j ¯ 2
(d)
Calculate the eigenvalues of the matrix R and the eigenvectors for each sample number:
λ E   -   R = 0
where λ is the eigenvalue, E is the unit matrix, R   is the correlation matrix. Sort the eigenvalues as   λ 1     λ 2     λ p     0 , and solve for the eigenvectors e i   ( i = 1 , 2 , ) :
j = 1 p e ij 2 = 1               for : e i = 1
where e ij is the j component of e i .
(e)
Calculation of contribution rates using eigenvalues (Gr) and cumulative contribution (ACr):
C r = λ i k = 1 p λ k   ( i = 1 , 2 , , p )
A C r k = 1 i λ k k = 1 p λ k   ( i = 1 , 2 , , p )
(f)
Mathematical modeling based on PCA is defined by the following equations:
Q 1 = S 11 X 1 + S 12 X 2 + + S 1 p X p Q 2 = S 21 X 1 + S 22 X 2 + +   S 2 p X p Q t =   S t 1 X 1 +   S t 2 X 2 + +   S tp X p
where   S 1 i , S 2 i , , S ti   ( i = 1 , 2 , , t ) are the eigenvector corresponding to the principal component, and X 1 , X 2 , , X p are a standardized value whose value are transformed according to the sample parameters.
(g)
Determine the evaluation process based on a comprehensive evaluation index (Q):
Q =   λ 1 Q 1 + λ 2 Q 2 + +   λ t Q t
where λ 1 , λ 2 , , λ t are the eigenvalues corresponding to the principal components, and   Q 1 , Q 2 , , Q t are the evaluation value of different irrigation and fertilization technical parameters. The degree of superiority of treatments is positively correlated with the overall evaluation index.

2.6. Data Processing

The data were organized and plotted using the Excel 2019 software, and the results were statistically analyzed using the SPSS 26.0 data analysis software, and means were compared between levels using the least significant difference (LSD) test at a 5% (a = 0.05) level of significance.

3. Results

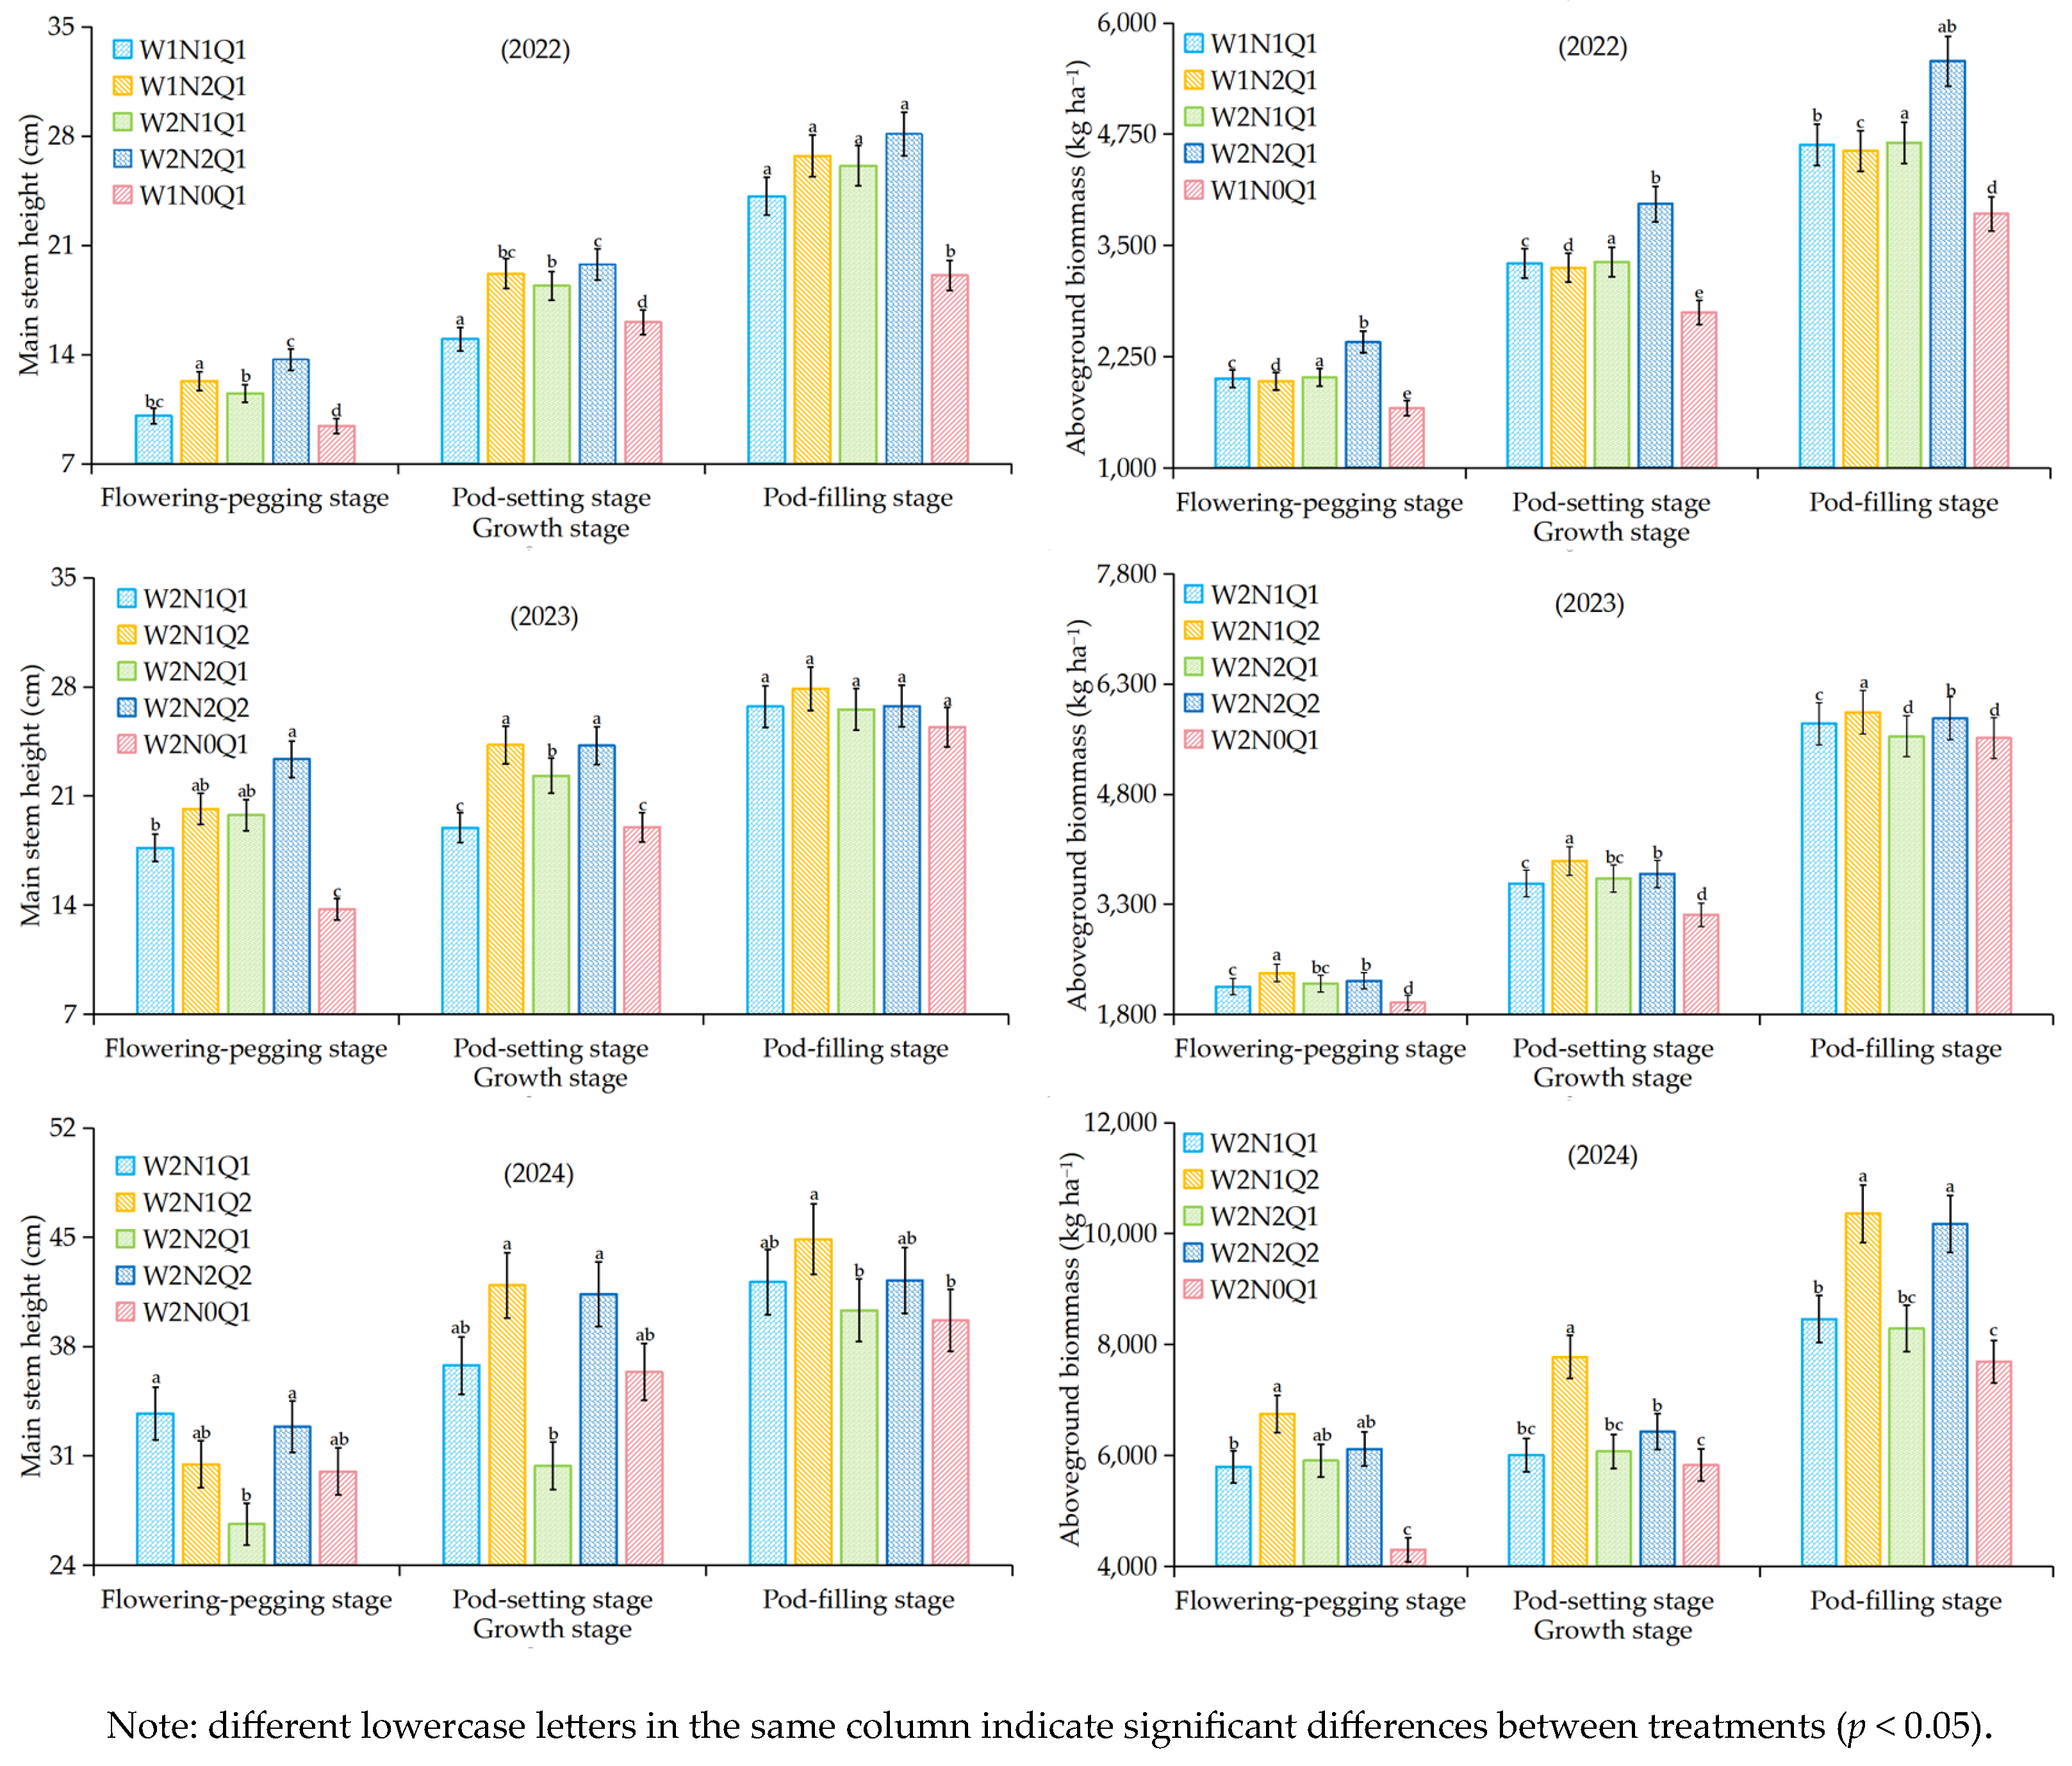
3.1. Effect of Irrigation and Fertilization Technical Parameters on Main Stem Height and Aboveground Biomass of Peanuts

The three-year study investigating irrigation and fertilization effects on peanut growth (Figure 4) revealed that nitrogen application treatments consistently produced significantly greater (p < 0.01) main stem height and aboveground biomass at the full-fruiting stage compared to the control (N0) across all growing seasons. Compared with the control treatment, full-fruiting main stem height increased by 26.53–47.51%, 4.44–9.59%, and 1.66–13.13%, respectively, and aboveground biomass increased by 18.31–44.45%, 0.41–6.32%, and 7.75–34.67%, respectively. In the 2022 growing season, both main stem height and aboveground biomass exhibited positive responses to increased irrigation water and nitrogen application rates. However, in the 2023–2024 growing seasons under consistent drip irrigation conditions, all growth parameters reached optimal levels at the N1 application rate (118 kg ha−1) but showed significant declines (p < 0.05) at the higher N2 rate (164 kg ha−1). The reason may be that N2 (110 kg ha−1) in 2022 and N1 (118 kg ha−1) in 2023 and 2024 did not exceed the nitrogen threshold required for normal growth of peanuts. Peanuts can fully absorb nitrogen from the soil to promote main stem growth and aboveground biomass accumulation, whereas the conventional nitrogen application (N2) in the later 2 years exceeded the optimum nitrogen requirement of peanuts, which acted as a hindrance to the growth and development of peanuts. Under consistent nitrogen application levels, all growth parameters showed positive correlations with increasing drip discharge rates. The Q2 discharge rate (6.0 L h−1) demonstrated significantly greater enhancement effects on both main stem height and aboveground biomass compared to Q1 (p < 0.05). The main stem height increased by 47.51%, 9.59%, and 13.13%, and the aboveground biomass increased by 44.45%, 6.32%, and 34.67%, respectively (p < 0.01).
The results of statistical analysis (Table 3) showed that irrigation account had a highly significant (p < 0.01) effect on peanut main stem height (except for the flowering-pegging stage), and nitrogen application had a highly significant (p < 0.01) effect on main stem height (2022; flowering-pegging stage and pod-setting stage in 2023 and 2024). Drip discharge had a highly significant (p < 0.01) effect on main stem height (2023 at the pod-setting stage) and a significant (p < 0.05) effect on main stem height (2023; 2024 at the flowering-pegging stage and the pod-setting stage). Water–nitrogen interaction had a highly significant (p < 0.01) effect on main stem height (pod-setting stage in 2022) and nitrogen application and drip discharge interaction had a significant (p < 0.05) effect on main stem height (pod-setting stage in 2023 and 2024). Irrigation, nitrogen application, drip discharge, water–nitrogen interaction, and nitrogen application and drip discharge interaction had highly significant (p < 0.01) effects on aboveground biomass.

3.2. Effect of Technical Parameters of Irrigation and Fertilization on Peanut Yield and Yield Component Indicators

The results of the experimental study on the effects of irrigation and fertilization parameters on peanut yield and yield components over the three growing seasons (Table 4) indicated that from 2022 to 2024, both the peanut yield and its yield components in the nitrogen application treatments were significantly higher (p < 0.01) than those in the control (N0) treatment. In 2022, compared with the control treatment, the pod yield augmented by 8.82–55.88%, the 100-pod weight rose by 5.61–33.27%, the 100-kernel weight increased by 14.32–35.67%, and the kernel rate went up by 1.25–7.96%. It was found that in 2022, the yield increased with the increase in both irrigation amount and nitrogen application rate, and the optimum values of the yield and yield components were obtained under the W2N2Q1 irrigation and fertilization parameters. There was a significant difference (p < 0.01) between the treatment with W2N2Q1 and the control treatment, with the yield rising by 55.88%, the 100-pod weight increasing by 33.27%, the 100-kernel weight going up by 35.67%, and the kernel rate augmenting by 7.96%, respectively.
However, the situation changed in the subsequent two-year experiment. It was observed that the yield and yield components peaked at the N1 nitrogen application rate and then exhibited a decreasing trend after increasing the nitrogen fertilizer input, which was contrary to the results in 2022. The reason might be that the conventional nitrogen (N2) application rate in 2022 was 110 kg ha−1, which did not reach the normal growth threshold of peanuts. In the following two years, the conventional nitrogen (N2) application rate was 164 kg ha−1, exceeding the normal growth requirement of peanuts, thus inhibiting the increase in peanut yield.
The experimental studies conducted in 2023 and 2024 revealed that for treatments with the same nitrogen application level, the yield and its components increased with the increase in the drip discharge rate. The peanut yield and composition indexes presented the highest improvement under the W2N1Q2 irrigation and fertilization parameters, which were significantly higher than those of the control treatment (p < 0.01). Compared with the control treatment, the W2N1Q2 treatment augmented the pod yield by 26.69% and 20.97% in 2023 and 2024, respectively, and the 100-pod weight by 7.32% and 10.64%, the 100-kernel weight by 15.64% and 16.20%, and the kernel rate by 3.43% and 5.15%, respectively.
The results of statistical analysis showed that the amount of irrigation water had a highly significant effect (p < 0.01) on yield, 100-pod weight, and 100-kernel weight and a significant effect (p < 0.05) on kernel rate. Nitrogen application had highly significant (p < 0.01) effects on yield, 100-pod weight (2022), 100-kernel weight, and kernel rate (2023 and 2024), and drip discharge had highly significant (p < 0.01) effects on yield, 100-kernel weight, and kernel rate. The interaction of nitrogen application and drip discharge had a significant effect (p < 0.05) only on kernel rate (2023 and 2024).

3.3. Effect of Irrigation and Fertilization Parameters on Peanut Quality

A three-year study on irrigation and fertilization effects on peanut quality (Table 5) revealed that in 2022, the W2 treatment decreased protein content by 6.44–7.34% while increasing oil content by 3.56–4.29% compared to the control (W1N0Q1), whereas the W1 treatment showed opposite trends, with protein increasing by 1.94–5.77% and oil decreasing by 0.18–12.68%. These variations likely resulted from two key mechanisms. First, an increase in water dilutes the kernel protein mass fraction. Second, excessive irrigation reduces soil water–fertilizer utilization efficiency and inhibits the biosynthesis of kernel amino acids, which are the fundamental building blocks of proteins. This, in turn, impairs the conversion of plasticized substances into proteins.
In subsequent years, nitrogen application treatments significantly surpassed the control (W2N0Q1) in both protein and oil content. Within fixed nitrogen levels, higher drip discharge rates elevated both protein and oil content, whereas increased nitrogen application at constant flow rates led to diminishing returns in terms of these two quality parameters. Notably, the W2N1Q2 treatment outperformed the control (p < 0.01) with protein content increases of 3.99% (2023) and 4.63% (2024) alongside oil content gains of 1.68% (2023) and 8.53% (2024).
The results of statistical analysis showed that the amount of irrigation water had a highly significant (p < 0.01) effect on the protein content and oil content of peanuts. Nitrogen application had a highly significant (p < 0.01) effect on protein content and oil content (2022). Drip discharge had a highly significant (p < 0.01) effect on protein content and oil content (2023) and a significant (p < 0.05) effect on oil content (2024). Water–nitrogen interaction had a highly significant (p < 0.01) effect on the protein content and oil content of peanuts. There was no significant (p > 0.05) effect of nitrogen application and drip discharge interaction on both protein content and oil content.

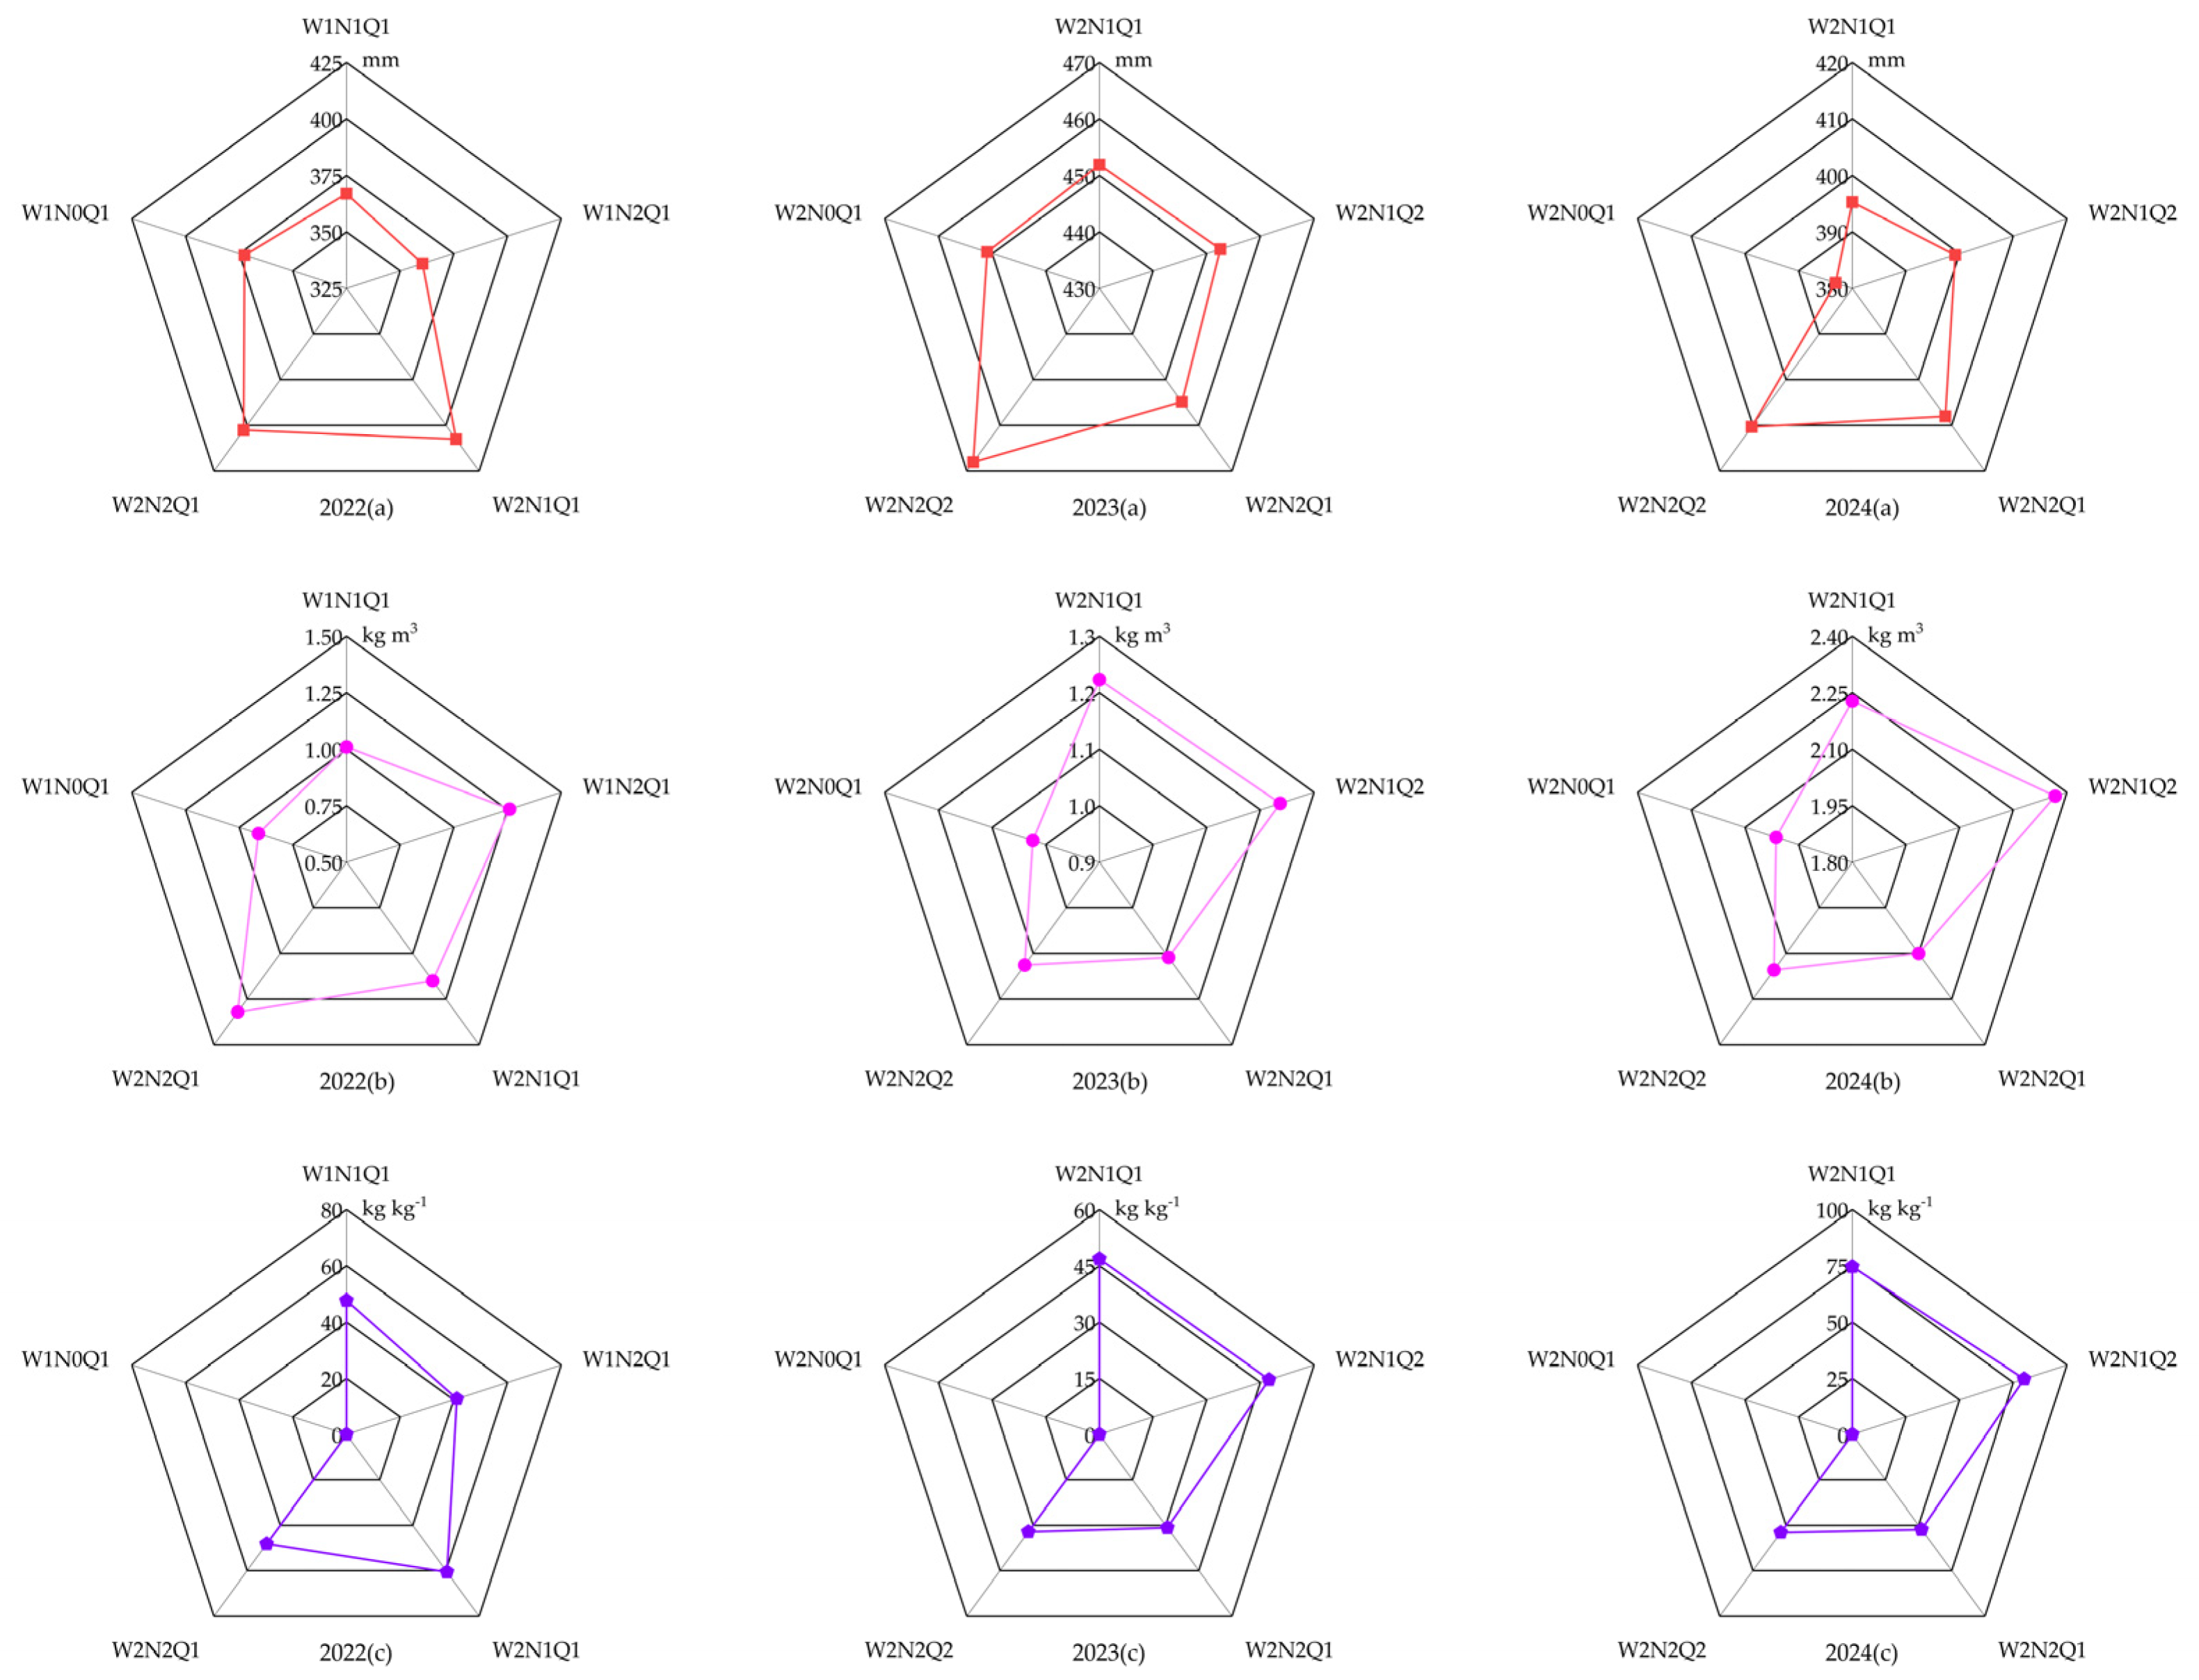
3.4. Effects of Irrigation and Fertilization Parameters on Water Consumption (a), Water Use Efficiency (b), and Nitrogen Partial Factor Productivity (c) of Peanuts

Analysis of three growing seasons’ data (Figure 5) demonstrated that irrigation account significantly affected (p < 0.05) evapotranspiration (ET) in peanut cultivation, serving as the primary determinant of ET variation. A positive correlation was observed between irrigation account and ET levels. Fertilization parameters showed comparatively less influence on water consumption characteristics. Under the W1 irrigation regime in 2022, both water consumption and nitrogen partial factor productivity (NPFP) during peanut growth stages showed slight but significant reductions with increasing nitrogen application rates when compared to the control (N0). Similarly, under the W2 irrigation regime, both water consumption and nitrogen partial factor productivity exhibited comparable trends. However, due to the higher irrigation account in W2 compared to W1, water consumption showed a corresponding increase. At a fixed irrigation account, water use efficiency (WUE) increased with higher nitrogen application rates. Experimental results from 2023 and 2024 demonstrated that both WUE and NPFP increased with greater drip discharge rates under constant nitrogen application. Conversely, under fixed drip discharge conditions, both WUE and NPFP decreased with increasing nitrogen application. In the experiment of three growing seasons, it was found that the water use efficiency of W2N2Q1 (2022) and W2N1Q2 (2023 and 2024) was the highest, and the WUE increased by 45.05%, 27.08%, and 16.33%, respectively. The NPFP was the highest in the W2N1Q1 (2022) and W2N1Q2 (2023 and 2024) treatments, which were 60.61, 47.39, and 77.00 kg kg−1, respectively.

3.5. Optimization of Irrigation and Fertilization Parameters Based on the Principal Component Analysis (PCA) Method

3.5.1. Principal Component Extraction

Five peanut-related indicators, including peanut yield, water use efficiency, nitrogen partial factor productivity, protein content, and oil content, were comprehensively analyzed by means of SPSS 26.0 analysis software. The matrices of eigenvalues and score correlation coefficients were calculated to determine the corresponding eigenvalues and score correlation coefficients (Table 6). It was found that, under different irrigation and nitrogen application technical parameters, for all the drip-irrigated peanuts under the membrane in the Xinjiang region during the years 2022–2024, two principal components were extracted. The cumulative contribution rates of these two components were 88.467%, 96.562%, and 97.916%, respectively, for different years within the study period.

3.5.2. Principal Component Scores and Rankings

Based on the standardized data, the score function expression Y can be obtained for the corresponding principal components for the years 2022–2024, respectively (Table 7). By taking the variance contribution ratio corresponding to each principal component as the weight, the comprehensive evaluation function F can be obtained. The results are presented according to the comprehensive evaluation scores (Table 8).
After conducting a comprehensive evaluation of the treatments from 2022 to 2024 using principal component analysis (PCA), it was discovered that the W2N2Q1 treatment achieved the highest comprehensive score in 2022. The results showed that the W2 irrigation account (37.5 mm) and N2 N application (actual N application 110 kg ha−1) had the best effect on peanut yield and were suitable for peanut cultivation in the local area of Xinjiang. Analysis of the 2023–2024 trials revealed that under a consistent W2 irrigation account (37.5 mm), the W2N1Q2 treatment demonstrated superior performance with the highest comprehensive evaluation score. Therefore, the irrigation and fertilization technology parameters crucial for attaining high-yield, high-quality, and high-efficiency peanut production under drip irrigation in Xinjiang were precisely those of the W2N1Q2 treatment. Therefore, the high yield, high quality, and high efficiency of drip irrigation peanuts in Xinjiang were achieved with the irrigation parameters of the W2 irrigation account (37.5 mm), the actual nitrogen application rate (110–118 kg ha−1), and the Q2 drip discharge rate (6.0 L h−1).

4. Discussion

4.1. Effects of Irrigation and Fertilization Technical Parameters on Peanut Growth Index

As fundamental growth regulators, soil water and nitrogen availability operate through complementary yet distinct mechanisms across crop phenological phases [35]. Reasonable water and nitrogen management can enhance the photosynthesis and nutrient absorption of crops and prevent crop yield reduction due to water shortage at different growth stages [36]. The study found that the main stem height of the same nitrogen treatment increased with the rise of drip discharge, and the main stem height of the same drip discharge treatment decreased as the nitrogen application rate increased. This is perhaps because the small drip discharge forms a narrow and deep wetting zone, while the large drip discharge forms a wide and shallow wetting zone. Moreover, the root mass of peanuts is mainly distributed in the 0–30 cm soil profile, which is the area most significantly affected by soil moisture distribution and fertilization changes [37]. Insufficient irrigation and inappropriate drip discharge will limit water infiltration, reduce the diffusion range, and affect the water absorption of peanut roots. At this time, the application of excessive nitrogen fertilizer will hinder the transfer of peanut biomass from the ground to the root system, resulting in a decrease in the root/shoot ratio and affecting the later growth [38]. In the 2022 experiment, the aboveground biomass under the W2 level was at a high level and increased as the nitrogen application rate rose. Appropriate irrigation and fertilization parameters can not only promote the growth of peanuts but also enhance the biomass accumulation of peanuts. Other studies also confirmed that the aboveground biomass of crops treated with nitrogen was higher than that of the no-nitrogen treatment [39]. This indicates that an insufficient supply of nitrogen fertilizer slows down the growth and development of the peanut and reduces the biomass allocation of the crop [40]. The aboveground biomass of the W2N1Q2 treatment was at the maximum value in the experiment, which was significantly higher than the other treatments. Shen showed through the study of water–nitrogen coupling in wheat that aboveground biomass increased as the irrigation account and fertilizer application increased within the range of suitable water and nitrogen supply [41]. Such an increase lays the foundation for a high yield but shows a gradual decline after exceeding the water–nitrogen threshold. These interactions highlight the critical role of soil moisture distribution patterns (determined by drip discharge) in regulating nitrogen utilization efficiency [42]. Narrow and deep wetted zones may limit nitrogen diffusion into the dense root depth, while wide and shallow wetted zones increase nutrient utilization but risk leaching if combined with excess nitrogen. The optimal treatment (W2N1Q2) aligns water availability, root distribution, and nitrogen uptake to ensure robust biomass allocation to vegetative and reproductive structures. This interaction underscores the need for integrated management of the irrigation account, N application, and drip head flow in agricultural production to optimize root–shoot coordination and maintain long-term yield potential.

4.2. Effect of Technical Parameters of Irrigation and Fertilization on Peanut Yield

Dynamic interactions between soil moisture, nitrogen supply, and drip discharge are the central mechanisms regulating peanut yield. In this study, we revealed the differential effects of different water and nitrogen combinations on yield components through a three-year field experiment. The study showed that reasonable water and nitrogen supply conditions boosted peanut yield, and the promotion effect was significantly better than that of a sole irrigation treatment. A similar study found that water–nitrogen synergism accelerated plant growth and development, resulting in yield improvement [22]. A higher irrigation account and drip discharge facilitated biomass accumulation and yield improvement in peanuts. Wang found that by using a crop model, there was a parabolic relationship between seed cotton yield and irrigation account [43]. The irrigation treatment, in which the irrigation account was 85% of the crop evapotranspiration in northern Xinjiang, was more conducive to cotton growth and yield improvement. With a consistent irrigation account, the peanut growth index and yield under the wide and shallow wet area formed by Q2 are significantly higher than those of the other treatments. This finding aligns with the conclusion of Zhang’s cotton experimental study [44]. The study indicated that the yield of large drip discharge is higher. In the 2022 experiment, it was found that with the same irrigation account and drip discharge, the peanut yield increased gradually with the input of nitrogen fertilizer (N2: 110 kg ha−1). However, in 2023 and 2024, it was found that at the conventional nitrogen application rate (N2: 164 kg ha−1), the peanut yield decreased, while at the halved nitrogen application rate (N1: 118 kg ha−1), the yield increased. These findings demonstrated that the nitrogen application threshold of peanuts in the experimental area ranged from 110 to 118 kg ha−1, and the reasonable irrigation and fertilization parameters contributed positively to the increase in peanut yield. In 2022, the conventional nitrogen application rate failed to reach the nitrogen requirement threshold of peanuts. However, in the subsequent two years, the increase in nitrogen fertilizer input exceeded an appropriate range, which was similar to the research results of Cheng [45] on potato yield via water and fertilizer regulation. The results of this study showed that compared with no nitrogen treatment, increasing drip discharge and applying nitrogen fertilizer could promote the increase in 100-pod weight and 100-kernel weight of peanuts. Half nitrogen application (N1) significantly enhanced the 100-pod weight, 100-kernel weight, and kernel rate of peanuts. However, in 2023 and 2024, the 100-pod weight and 100-kernel weight of the conventional topdressing nitrogen (N2) treatment were lower than those of the half-nitrogen application (N1) treatment. This aligned with the results of Xia [28], indicating that low nitrogen was beneficial to increasing the 100-pod weight and 100-kernel weight of peanuts. The primary rationale lies in peanut’s root nodule nitrogen fixation capability, which fulfills approximately 50% of the plant’s nitrogen requirements through symbiotic rhizobia activity [46]. When the nitrogen application rate exceeds an appropriate range, the growth balance of peanuts is disturbed. The nitrogen fixation of its own nodules is inhibited, photosynthesis is impaired, and the capacity for organic matter synthesis and transport is diminished. Resulting in the decline of its physiological characteristics and yield [47]. A comprehensive body of research has demonstrated that optimizing water–nitrogen synergistic management can significantly enhance the yield and quality of peanuts. Specifically, the W2N1Q2 treatment (an irrigation account of 37.5 mm, a nitrogen application rate of 110–118 kg ha−1, and a drip discharge of 6.0 L h−1) represents the optimal threshold range. On the contrary, when this threshold is exceeded, it will impair the nitrogen fixation function of nodules and inhibit yield formation. In conclusion, a single factor becomes the main yield-limiting factor when water or nitrogen is insufficient (N1 treatment in 2022). The synergistic optimization threshold: when the irrigation account (W2), nitrogen application (110–118 kg ha−1), and drip discharge (Q2) are reasonably matched, the mechanism optimizes the root distribution by regulating the structure of the wet zone, reducing fertilizer through the use of rhizomatous nitrogen fixation. The mechanism optimizes root distribution by regulating the structure of the wet zone, reduces fertilizer dependence by using root nodule nitrogen fixation, and maintains metabolic balance by the appropriate amount of nitrogen, which ultimately realizes the multiple objectives of “water conservation, nitrogen reduction, and yield increase” in peanut production in arid areas.

4.3. Effects of Irrigation and Fertilization Technical Parameters on Peanut Quality

Peanuts are abundant in high-quality proteins and oils, which serve as not only an important source of edible oil but also a crucial raw material for high-quality feed [48]. In the 2022 experiment, this study found that the protein content of the W2 treatment was lower than that of the W1 treatment. The reason may be that a high irrigation account can promote plant growth and yield formation but dilute the protein content in the fruits, while a low irrigation account has the opposite effect [49]. Peanuts under the W2 treatment exhibited significantly higher oil content than those under W1. Water deficiency-induced reduction in soil water potential within the rhizosphere decreased leaf stomatal conductance, disrupting the balance of energy production and consumption in the photosynthetic carbon cycle (with production declining more sharply than consumption). Concurrently, low drip discharge (Q1) was insufficient to rapidly establish a wide, shallow soil-wetting zone, thereby limiting water availability in the surface soil depth for root uptake [50]. Photosynthesis is restricted, thereby disrupting the carbon balance of the crop. This limitation in sugar synthesis and transport directly hinders the accumulation of oils and fats [51]. Protein content and oil content were found to be higher in the nitrogen application treatments than in the control treatment in the 2023 and 2024 trials. Moreover, they increased with the increase in the drip discharge rate at the same level of nitrogen application but decreased with the increase in nitrogen fertilizer input at the same drip discharge. This indicates that there is a strong correlation between the various indicators of peanuts under the joint action of water and nitrogen fertilizer and that the appropriate water and nitrogen inputs can promote the improvement of quality [52]. However, inappropriate input ratios can lead to changes in soil moisture availability during peanut growth and development depending on the amount of nitrogen applied. This change profoundly affects the protein content and oil content of peanuts as well as the composition of peanuts’ internal oil, which in turn affects the overall quality of peanuts [53]. The study showed that rational water and nitrogen synergistic management (W2N1Q2) could significantly enhance peanut protein and oil content. Among them, the W2 irrigation account with a large drip discharge rate (Q2) promoted oil and fat accumulation, while halved nitrogen application (N1) favored protein synthesis. However, excessive irrigation diluted protein content, and high nitrogen inputs inhibited oil formation, indicating that the water–nitrogen ratio had a significant regulatory effect on peanut quality.

4.4. Effect of Technical Parameters of Irrigation and Fertilization on Water and Nitrogen Use Efficiency in Peanut

Under the same irrigation account, there existed a slight discrepancy in water consumption, and the water consumption of the nitrogen treatment was generally higher than that of the nitrogen-free treatment. The underlying reason might be that nitrogen treatment significantly promotes crop growth, leading to a higher canopy coverage. Consequently, the proportion of water consumption attributed to crop transpiration within the overall farmland water usage is elevated [54]. It was found that the water use efficiency was lower in the no-nitrogen treatment, which is in line with the pattern found by Shangguan [55] and Yao [56] that nitrogen deficiency reduces water use efficiency, primarily because insufficient nitrogen fertilizer disrupts the balance between plant vegetative and reproductive growth. Restricted leaf expansion leads to a decrease in the proportion of photosynthetic products, which in turn leads to a decrease in water use efficiency [57]. The study found that both water use efficiency and nitrogen partial factor productivity were lower in the W2N2Q2 than in the W2N1Q2 treatment. It indicates that over-fertilization will inhibit the plant’s absorption and utilization of water, leading to a reduction in the efficiency of water and nutrient utilization. It also severely causes damage to the plant-growing environment, thus affecting the plant’s healthy growth and development [58]. In addition, we discovered that there is a very significant interaction between water and nitrogen fertilization [59]. In the final two years of the experiment, we observed that with consistent drip discharge, water use efficiency and nitrogen partial factor productivity gradually decreased as nitrogen application increased. This phenomenon may arise because crop uptake of soil nutrients and water are relatively independent physiological processes, yet soil moisture conditions profoundly influence nutrient uptake and utilization. Specifically, soil water distribution affects how efficiently crops absorb and utilize nutrients. At appropriate soil nutrient levels, balanced nutrition can effectively promote crop root system development, thereby enhancing crop water utilization efficiency [60]. This study demonstrated that reducing nitrogen application by half (N1) in 2023 and 2024 significantly enhanced water use efficiency by promoting robust crop growth and optimizing canopy structure. In contrast, excessive nitrogen fertilization (N2) disrupted the water–nitrogen balance, leading to a decrease in both water and nitrogen fertilizer use efficiencies. These results highlight the critical regulatory role of water–nitrogen interactions in governing water and nitrogen utilization efficiency in peanuts.

4.5. Experience in Optimizing Field Experiment Parameters Based on Principal Component Analysis

Principal component analysis is a multivariate statistical analysis method. Its main principle is to extract the main factors of multivariate data or variables [34]. It can efficiently identify the principal components of the data and reduce the dimensionality of the original complex dataset [61]. Numerous researchers have recommended using PCA to analyze experimental data when they are selecting the optimal parameter combinations for each domain [25,34,62,63]. Cui et al. found that yield-maintaining effective treatments could be selected by using PCA under conditions of limited water and fertilizer conservation in order to improve kiwifruit fruit quality and water and potassium use efficiency [64]. Chen et al. found that PCA was the best evaluation method for determining the quality of grapes by comparing various evaluation methods for yield and quality. PCA was then used continuously to determine the optimal irrigation amount and the application rates of organic and inorganic fertilizers for grape production by evaluating fruit quality indices and grape yield [65]. PCA has been successfully used in studies such as water and potassium management of kiwifruit and optimization of grape irrigation, which vividly demonstrates its effectiveness in achieving a balance between crop yield and resource utilization efficiency. For peanut crops, PCA can help to clarify the relationships between yield, quality, and water and nitrogen utilization efficiency so as to provide support for the development of precision agriculture.
The combined results of the study and the PCA analysis showed that W2N1Q2 exhibited the highest peanut yield and irrigation water and nitrogen utilization efficiencies and maintained a relatively high quality throughout the two-year study period. The W2N1Q2 treatment (irrigation account W2: 37.5 mm; halved nitrogen reduction: N1; drip discharge Q2: 6.0 L h−1) scored first place in the two-year experiment. Consequently, the W2N1Q2 treatment is recommended as an optimal technical parameter for irrigation and fertilization to provide technical references for the sustainable development of agriculture in Xinjiang. Although the experiment was conducted in a specific area and did not involve economic cost analysis, the design of the experiment was strictly aligned with actual local agricultural production, and all technical parameters were optimized based on the principle of maximizing cost-effectiveness in the field. Although the results of this study need to be validated on a larger scale, they provide a key technical reference for agricultural production in similar ecological zones. A full lifecycle cost analysis model can be introduced to quantify the economic feasibility of different water and fertilizer options and further improve the value assessment system of technology application.

5. Conclusions

(1) Nitrogen treatment significantly increased peanut main stem height and aboveground biomass compared to the control (p < 0.01). The W2 irrigation account notably promoted growth, with the W2N1Q2 treatment showing significantly better growth indices than the control: main stem height and aboveground biomass increased by 9.6–13.1% and 6.3–34.7%, respectively (p < 0.01).
(2) The irrigation and fertilization parameters of high yield and quality were the W2N1Q2 treatment. Compared with the control treatment (W2N0Q1), the yield increased by 26.69% and 20.97% (p < 0.01), the water use efficiency increased by 27.08% and 16.33%, and the nitrogen partial factor productivity values were 47.39 and 77.00 kg kg−1. The protein content increased by 3.99% and 4.63%, and the oil content increased by 1.68% and 8.53%, respectively.
(3) Peanut yield, water and nitrogen use efficiency, protein content, and oil content were comprehensively evaluated by principal component analysis. Under the experimental conditions, the W2N1Q2 treatment (irrigation account of 37.5 mm, nitrogen application of 118 kg ha−1, and drip discharge of 6.0 L h−1) can be used as a stable and efficient irrigation and fertilization technical parameter for peanuts under mulched drip irrigation in Xinjiang. Future research will incorporate a lifecycle cost analysis model to evaluate the economic viability of different water–fertilizer management strategies, optimize the technical assessment framework, and support sustainable agricultural development in arid regions.

Author Contributions

Conceptualization, Y.Z.; data curation, Y.Z., S.L., Z.S., H.L., J.C. and J.D.; formal analysis, Y.Z., H.L., J.C. and J.D.; funding acquisition, Q.L. and X.S.; investigation, Y.Z., W.C., Y.G., H.L., J.C. and J.D.; methodology, Y.Z., S.L., W.C., Y.G., J.C., J.D. and X.Z.; project administration, Q.L. and X.S.; software, W.C., Y.G. and H.L.; supervision, S.L., Z.S., Q.L., X.S. and X.Z.; validation, W.C.; visualization, Y.G.; writing—original draft preparation, Y.Z., S.L., Z.S. and X.Z.; writing—review and editing, Y.Z., S.L., Z.S., X.S. and X.Z. All authors have read and agreed to the published version of the manuscript.

Funding

This work was supported by the National Natural Science Foundation of China (52179052) and the National Key Research and Development Program of China (2023YFD1900802-01).

Data Availability Statement

The data that support the findings of this study are available from the corresponding authors (S.L. and X.Z.).

Conflicts of Interest

Author Weimin Cui was employed by the company Shijiazhuang Water Resources and Hydropower Survey, Design and Research Institute Co., Ltd. The remaining authors declare that the research was conducted in the absence of any commercial or financial relationships that could be construed as a potential conflict of interest.

References

  1. Shen, X.; Zhang, X.; Yao, B.; Li, Q.; Xue, Z.; Dong, J.; Yi, R. Effects of climate change on the suitable sowing dates for peanut under mulched drip irrigation in Xinjiang. Trans. Chin. Soc. Agric. Eng. 2023, 39, 107–115. [Google Scholar] [CrossRef]
  2. Wang, L.; Zhu, J.; Wang, R.; Hi, B.; Sang, Y.; Jiao, H. Research Progress in Breeding for Early Mutarity and Gene Mapping for Yield Traits of Peanut in China. J. Nucl. Agric. Sci. 2025, 39, 1178–1188. [Google Scholar]
  3. Geng, Q.; Zhao, Y.; Sun, S.; He, X.; Wang, D.; Wu, D.; Tian, Z. Spatio-temporal changes and its driving forces of irrigation water requirements for cotton in Xinjiang, China. Agric. Water Manag. 2023, 280, 108218. [Google Scholar] [CrossRef]
  4. Zhou, B.; Yang, L.; Chen, X.; Ye, S.; Peng, Y.; Liang, C. Effect of magnetic water irrigation on the improvement of salinized soil and cotton growth in Xinjiang. Agric. Water Manag. 2021, 248, 106784. [Google Scholar] [CrossRef]
  5. Ning, S.; Shi, J.; Zuo, Q.; Wang, S.; Ben-Gal, A. Generalization of the root length density distribution of cotton under film mulched drip irrigation. Field Crops Res. 2015, 177, 125–136. [Google Scholar] [CrossRef]
  6. Dai, J.; Dong, H. Intensive cotton farming technologies in China: Achievements, challenges and countermeasures. Field Crops Res. 2014, 155, 99–110. [Google Scholar] [CrossRef]
  7. Noya, I.; González-García, S.; Bacenetti, J.; Fiala, M.; Moreira, M.T. Environmental impacts of the cultivation-phase associated with agricultural crops for feed production. J. Clean. Prod. 2018, 172, 3721–3733. [Google Scholar] [CrossRef]
  8. Li, D.; Li, M.; Zhou, X.; Shen, X.; Zhao, Y. Influence of soil banding moisture uniformity on growth and water use efficiency of drip irrigated cotton under mulch. Trans. Chin. Soc. Agric. Eng. 2018, 34, 130–137. [Google Scholar] [CrossRef]
  9. Chalise, D.P.; Snider, J.L.; Hand, L.C.; Roberts, P.; Vellidis, G.; Ermanis, A.; Collins, G.D.; Lacerda, L.N.; Cohen, Y.; Pokhrel, A.; et al. Cultivar, irrigation management, and mepiquat chloride strategy: Effects on cotton growth, maturity, yield, and fiber quality. Field Crops Res. 2022, 286, 108633. [Google Scholar] [CrossRef]
  10. Sun, H.; Li, M.; Li, J.; Han, Q.; Feng, J.; Jia, Y. Influence of dripper discharge on cotton root distribution and water consumption under pot cultivation. J. Drain. Irrig. Mach. Eng. 2014, 32, 906–913. [Google Scholar] [CrossRef]
  11. El-Hafedh, A.V.O.M.; Daghari, H.; Maalej, M. Analysis of several discharge rate–spacing–duration combinations in drip irrigation system. Agric. Water Manag. 2001, 52, 33–52. [Google Scholar] [CrossRef]
  12. Li, D.; Li, M.; Liu, D.; Lv, M.; Jia, Y. Effects of soil wetting pattern on the soil water-thermal environment and cotton root water consumption under mulched drip irrigation. Chin. J. Appl. Ecol. 2015, 26, 2437–2444. [Google Scholar] [CrossRef]
  13. Xing, Y.; Zhang, F.; Zhang, Y.; Li, J.; Qiang, S.; Li, Z.; Gao, M. Irrigation and fertilization coupling of drip irrigation under plastic film promotes tomato’s nutrient uptake and growth. Trans. Chin. Soc. Agric. Eng. 2014, 30, 70–80. [Google Scholar] [CrossRef]
  14. Wang, X.; Xiang, Y.; Guo, J.; Tang, Z.; Zhao, S.; Wang, H.; Li, Z.; Zhang, F. Coupling effect analysis of drip irrigation and mixed slow-release nitrogen fertilizer on yield and physiological characteristics of winter wheat in Guanzhong area. Field Crops Res. 2023, 302, 109103. [Google Scholar] [CrossRef]
  15. Lei, H.; Jin, C.; Pan, H.; Xiao, Z.; Sun, K. Integrative Effects of Irrigation and Aeration on Root Morphology, Yield and Quality of Pepper. Trans. Chin. Soc. Agric. Mach. 2022, 53, 344–352. [Google Scholar] [CrossRef]
  16. Xia, G.; Luo, X.; Nie, X.; Zheng, J.; Chi, D. Effects of water deficit in different growth stages coupling with nitrogen application rates on photosynthetic traits and quality of peanuts. Trans. Chin. Soc. Agric. Eng. 2022, 38, 67–75. [Google Scholar] [CrossRef]
  17. Zhou, J.; Li, C.; Zhang, B.; Zhou, Q. Land use change of newly increased cultivated land at typical county under different geomorphic types in the Loess Plateau. Trans. Chin. Soc. Agric. Eng. 2023, 39, 254–260. [Google Scholar] [CrossRef]
  18. Chang, T.; Gu, X.; Cai, W.; Lu, S.; Zhen, X.; Li, W.; Cui, K. Effects of suitable fertilizer-N application rate and planting density on increasing yield, water and nitrogen use efficiency of winter wheat. Trans. Chin. Soc. Agric. Eng. 2023, 39, 56–68. [Google Scholar] [CrossRef]
  19. Dai, Y.; Fan, J.; Liao, Z.; Zhang, C.; Yu, J.; Feng, H.; Zhang, F.; Li, Z. Supplemental irrigation and modified plant density improved photosynthesis, grain yield and water productivity of winter wheat under ridge-furrow mulching. Agric. Water Manag. 2022, 274, 107985. [Google Scholar] [CrossRef]
  20. Li, Z.; Song, M.; Feng, H. Dynamic characteristics of leaf area index and plant height of winter wheat influenced by irrigation and nitrogen coupling and their relationships with yield. Trans. Chin. Soc. Agric. Eng. 2017, 33, 195–202. [Google Scholar] [CrossRef]
  21. Abdelghany, A.E.; Dou, Z.; Alashram, M.G.; Eltohamy, K.M.; Elrys, A.S.; Liu, X.; Wu, Y.; Cheng, M.; Fan, J.; Zhang, F. The joint application of biochar and nitrogen enhances fruit yield, quality and water-nitrogen productivity of water-stressed greenhouse tomato under drip fertigation. Agric. Water Manag. 2023, 290, 108605. [Google Scholar] [CrossRef]
  22. Xing, Y.; Zhang, F.; Zhang, Y.; Li, J.; Qiang, S.; Wu, L. Effect of Irrigation and Fertilizer Coupling on Greenhouse Tomato Yield, Quality, Water and Nitrogen Utilization Under Fertigation. Sci. Agric. Sin. 2015, 48, 713–726. [Google Scholar] [CrossRef]
  23. Wang, F.; Du, T.; Qiu, R. Deficit irrigation scheduling of greenhouse tomato based on quality principle component analysis. Trans. Chin. Soc. Agric. Eng. 2011, 27, 75–80. [Google Scholar] [CrossRef]
  24. He, R.; Tong, C.; Wang, J.; Qin, Z.; Zhen, Z.; Guo, S.; Wang, H.; Li, X. Effects of Water and Nitrogen Regulation on Growth, Water-fertilizer Use Efficiency and Soil Water-salt Distribution in Sunflower. J. Irrig. Drain. 2023, 42, 73–81. [Google Scholar] [CrossRef]
  25. Wu, P.; Jia, C.; Fan, S.; Sun, Y. Principal component analysis and fuzzy comprehensive evaluation of fruit quality in cultivars of cherry. Trans. Chin. Soc. Agric. Eng. 2018, 34, 291–300. [Google Scholar] [CrossRef]
  26. Wu, F.; Zhang, R.; Yin, Z.; Wang, H. Comprehensive quality evaluation of highbush blueberry cultivars based on principal component analysis. Trans. Chin. Soc. Agric. Eng. 2022, 38, 262–269. [Google Scholar] [CrossRef]
  27. Ma, L.; Wan, Q.; Wang, Z.; Jiang, X. Comparative study on yield and organ multi-factor responses of rice under different tillage modes. Trans. Chin. Soc. Agric. Eng. 2020, 36, 119–128. [Google Scholar] [CrossRef]
  28. Xia, G.; Wang, R.; Huang, X.; Nie, X.; Zheng, J.; Chi, D. Effects of Nitrogen Application Rates on CO2 Sequestration and Emissions, and Yield in Peanut Field under Regulated Deficit Irrigation. Trans. Chin. Soc. Agric. Mach. 2022, 53, 349–358. [Google Scholar]
  29. Ding, H.; Zhang, Z.; Dai, L.; Yang, J.; Ci, D.; Qin, F.; Qin, W.; Wan, S. Effects of Water and Nitrogen Interaction on Peanut Root Growth and Yield. Sci. Agric. Sin. 2015, 48, 872–881. [Google Scholar] [CrossRef]
  30. Allen, G.R.; Pereira, S.L.; Raes, D.; Smith, M. Crop Evapotranspiration-Guidelines for Computing Crop Water Requirements-FAO Irrigation and drainage paper 56. FAO Rome 1998, 300, D05109. [Google Scholar]
  31. Dong, J.; Xue, Z.; Shen, X.; Yi, R.; Chen, J.; Li, Q.; Hou, X.; Miao, H. Effects of Different Water and Nitrogen Supply Modes on Peanut Growth and Water and Nitrogen Use Efficiency under Mulched Drip Irrigation in Xinjiang. Plants 2023, 12, 3368. [Google Scholar] [CrossRef] [PubMed]
  32. Shen, X.; Sun, J.; Zhang, J.; Song, N.; Liu, X.; Yang, L. Study on Calculation Method of Soi Moisture Content under Drip Irrigation. J. Soil Water Conserv. 2011, 25, 241–244+253. [Google Scholar] [CrossRef]
  33. Srivastava, R.K.; Panda, R.K.; Chakraborty, A.; Halder, D. Enhancing grain yield, biomass and nitrogen use efficiency of maize by varying sowing dates and nitrogen rate under rainfed and irrigated conditions. Field Crops Res. 2018, 221, 339–349. [Google Scholar] [CrossRef]
  34. Wang, X.; Guo, T.; Wang, Y.; Xing, Y.; Wang, Y.; He, X. Exploring the optimization of water and fertilizer management practices for potato production in the sandy loam soils of Northwest China based on PCA. Agric. Water Manag. 2020, 237, 106180. [Google Scholar] [CrossRef]
  35. Zhang, J.; Wang, Q.; Xia, G.; Wu, Q.; Chi, D. Continuous regulated deficit irrigation enhances peanut water use efficiency and drought resistance. Agric. Water Manag. 2021, 255, 106997. [Google Scholar] [CrossRef]
  36. Fu, Y.; Cui, Z.; Yao, J.; Ji, F.; Lu, W.; He, Z.; Gao, Z.; Wang, S. Effects of water and nitrogen coupling on photosynthetic characteristics and yield of winter wheat in film hole irrigation fields. Desalination Water Treat. 2022, 268, 273–284. [Google Scholar] [CrossRef]
  37. Guo, X.; Zhao, D.; Hu, J.; Wang, D.; Wang, J.; Shakeel, M. The Effects of Water and Fertilizer Coupling on Plant and Soil Nitrogen Characteristics and Fruit Growth of Rabbiteye Blueberry Plants in a Semi-Arid Region in China. Phyton-Int. J. Exp. Bot. 2022, 92, 209–223. [Google Scholar] [CrossRef]
  38. Zhang, X.; Wang, Y.; Chen, J.; Chen, A.; Wang, L.; Guo, X.; Niu, Y.; Zhang, X.; Chen, L.; Gao, Q. Effects of Soil Water and Nitrogen on Plant Growth, Root Morphology and Spatial Distribution of Maize at the Seedling Stage. Sci. Agric. Sin. 2019, 52, 34–44. [Google Scholar] [CrossRef]
  39. Mahdi, G.; Seyed, M.M.; Mohammad, B.; Mehdi, H.; Gerrit, H. Interaction of water and nitrogen on maize grown for silage. Agric. Water Manag. 2008, 96, 809–821. [Google Scholar] [CrossRef]
  40. Montemurro, F.; Maiorana, M.; Ferri, D.; Convertini, G. Nitrogen indicators, uptake and utilization efficiency in a maize and barley rotation cropped at different levels and sources of N fertilization. Field Crops Res. 2006, 99, 114–124. [Google Scholar] [CrossRef]
  41. Shen, X.; Liu, J.; Liu, L.; Zeleke, K.; Yi, R.; Zhang, X.; Gao, Y.; Liang, Y. Effects of irrigation and nitrogen topdressing on water and nitrogen use efficiency for winter wheat with micro-sprinkling hose irrigation in North China. Agric. Water Manag. 2024, 302, 109005. [Google Scholar] [CrossRef]
  42. Lu, J.; Geng, C.; Cui, X.; Li, M.; Chen, S.; Hu, T. Response of drip fertigated wheat-maize rotation system on grain yield, water productivity and economic benefits using different water and nitrogen amounts. Agric. Water Manag. 2021, 258, 107220. [Google Scholar] [CrossRef]
  43. Wang, J.; Li, J.; Guan, H. Modeling response of cotton yield and water productivity to irrigation amount under mulched drip irrigation in North Xinjiang. Trans. Chin. Soc. Agric. Eng. 2016, 32, 62–68. [Google Scholar] [CrossRef]
  44. Zhang, Y.; Zhang, F.; Fan, J.; Hou, X.; Wang, H.; Liu, X.; He, P.; Xue, Z. Effects of drip irrigation technical parameters on cotton growth, soil moisture and salinity in Southern Xinjiang. Trans. Chin. Soc. Agric. Eng. 2020, 36, 107–117. [Google Scholar] [CrossRef]
  45. Cheng, M.; Wang, H.; Zhang, F.; Wang, X.; Liao, Z.; Zhang, S.; Yang, Q.; Fan, J. Effects of irrigation and fertilization regimes on tuber yield, water-nutrient uptake and productivity of potato under drip fertigation in sandy regions of northern China. Agric. Water Manag. 2023, 287, 108459. [Google Scholar] [CrossRef]
  46. Yang, Q.; Li, L.; Zhang, X.; Miao, Y.; Sheng, K.; Zhang, B.; Wang, Y. Effect of nitrogen application on yield, quality and light temperature physiological characteristics of summer peanut. Chin. J. Eco-Agric. 2024, 32, 627–639. [Google Scholar] [CrossRef]
  47. Xia, G.; Wang, Y.; Hu, J.; Wang, S.; Zhang, Y.; Wu, Q.; Chi, D. Effects of Supplemental Irrigation on Water and Nitrogen Use, Yield, and Kernel Quality of Peanut under Nitrogen-Supplied Conditions. Agric. Water Manag. 2021, 243, 106518. [Google Scholar] [CrossRef]
  48. Arya, S.S.; Salve, A.R.; Chauhan, S. Peanuts as functional food: A review. J. Food Sci. Technol. 2016, 53, 31–41. [Google Scholar] [CrossRef]
  49. Gong, X.; Li, X.; Qiu, R.; Bo, G.; Ping, Y.; Xin, Q.; Ge, J. Ventilation and irrigation management strategy for tomato cultivated in greenhouses. Agric. Water Manag. 2022, 273, 107908. [Google Scholar] [CrossRef]
  50. Zhang, Y.; Feng, S.; Wang, F.; Feng, R.; Nie, W. Effects of drip discharge flux and soil wetted percentage on drip irrigated potato growth with film mulch. Agric. Water Manag. 2022, 272, 107847. [Google Scholar] [CrossRef]
  51. Campos, H.; Trejo, C.; Peña-Valdivia, C.B.; García-Nava, R.; Conde-Martínez, F.V.; Cruz-Ortega, M.R. Stomatal and non-stomatal limitations of bell pepper (Capsicum annuum L.) plants under water stress and re-watering: Delayed restoration of photosynthesis during recovery. Environ. Exp. Bot. 2014, 98, 56–64. [Google Scholar] [CrossRef]
  52. Wu, W.; Wang, Y.; Wang, L.; Xu, H.; Zörb, C.; Geilfus, C.-M.; Xue, C.; Sun, Z.; Ma, W. Booting stage is the key timing for split nitrogen application in improving grain yield and quality of wheat—A global meta-analysis. Field Crops Res. 2022, 287, 108665. [Google Scholar] [CrossRef]
  53. Dwivedi, S.L.; Nigam, S.N.; Rao, R.C.N.; Singh, U.; Rao, K.V.S. Effect of drought on oil, fatty acids and protein contents of groundnut (Arachis hypogaea L.) seeds. Field Crops Res. 1996, 48, 125–133. [Google Scholar] [CrossRef]
  54. Li, Z.; Song, M.; Feng, H. Effects of irrigation and nitrogen application on water consumption and yield of winter wheat in different precipitation years. Trans. Chin. Soc. Agric. Eng. 2018, 34, 160–167. [Google Scholar] [CrossRef]
  55. Shangguan, Z.; Shao, M.; Dyckmans, J. Effects of Nitrogen Nutrition and Water Deficit on Net Photosynthetic Rate and Chlorophyll Fluorescence in Winter Wheat. J. Plant Physiol. 2000, 156, S0176–S1617. [Google Scholar] [CrossRef]
  56. Yao, H.; Zhang, Y.; Yi, X.; Hu, Y.; Luo, H.; Gou, L.; Zhang, W. Plant density alters nitrogen partitioning among photosynthetic components, leaf photosynthetic capacity and photosynthetic nitrogen use efficiency in field-grown cotton. Field Crops Res. 2015, 184, 39–49. [Google Scholar] [CrossRef]
  57. Wang, X.; Shi, Y.; Guo, Z.; Zhang, Y.; Yu, Z. Water use and soil nitrate nitrogen changes under supplemental irrigation with nitrogen application rate in wheat field. Field Crops Res. 2015, 183, 117–125. [Google Scholar] [CrossRef]
  58. Gatti, M.; Schippa, M.; Garavani, A.; Squeri, C.; Frioni, T.; Dosso, P.; Poni, S. High potential of variable rate fertilization combined with a controlled released nitrogen form at affecting cv. Barbera vines behavior. Eur. J. Agron. 2020, 112, 125949. [Google Scholar] [CrossRef]
  59. Ierna, A.; Pandino, G.; Lombardo, S.; Mauromicale, G. Tuber yield, water and fertilizer productivity in early potato as affected by a combination of irrigation and fertilization. Agric. Water Manag. 2011, 101, 35–41. [Google Scholar] [CrossRef]
  60. Darwish, T.M.; Atallah, T.W.; Hajhasan, S.; Haidar, A. Nitrogen and water use efficiency of fertigated processing potato. Agric. Water Manag. 2006, 85, 95–104. [Google Scholar] [CrossRef]
  61. de Mello, C.S.; Van Dijk, J.P.; Voorhuijzen, M.; Kok, E.J.; Arisi, A.C. Tuber proteome comparison of five potato varieties by principal component analysis. J. Sci. Food Agric. 2016, 96, 3928–3936. [Google Scholar] [CrossRef]
  62. He, X.; Yang, P.; Ren, S.; Cheng, M.; Zhang, Y.; Jiang, G. Evaluation of Regulated Deficit Irrigation Performance with Saline Water Based on Principal Component Analysis. Trans. Chin. Soc. Agric. Mach. 2014, 45, 162–167+132. [Google Scholar] [CrossRef]
  63. Wen, S.; Cui, N.; Wang, Y.; Gong, D.; Xing, L.; Wu, Z.; Zhang, Y.; Zhao, L.; Fan, J.; Wang, Z. Optimizing deficit drip irrigation to improve yield, quality, and water productivity of apple in Loess Plateau of China. Agric. Water Manag. 2024, 296, 108798. [Google Scholar] [CrossRef]
  64. Cui, N.; Wang, M.; Zou, Q.; Wang, Z.; Jiang, S.; Chen, X.; Zha, Y.; Xiang, L.; Zhao, L. Water-potassium coupling at different growth stages improved kiwifruit (Actinidia spp.) quality and water/potassium productivity without yield loss in the humid areas of South China. Agric. Water Manag. 2023, 289, 108552. [Google Scholar] [CrossRef]
  65. Chen, R.; Chang, H.; Wang, Z.; Lin, H. Determining organic-inorganic fertilizer application threshold to maximize the yield and quality of drip-irrigated grapes in an extremely arid area of Xinjiang, China. Agric. Water Manag. 2023, 276, 108070. [Google Scholar] [CrossRef]
Figure 1. Crop evapotranspiration ETo and effective precipitation P during peanut fertility within 2022–2024.
Agronomy 15 01302 g001
Figure 2. Peanut cultivation pattern.
Agronomy 15 01302 g002
Figure 3. Irrigation and fertilization time, cumulative irrigation amount, and cumulative nitrogen application amount during peanut growth period from 2022 to 2024.
Agronomy 15 01302 g003
Figure 4. Effect of technical parameters of irrigation and fertilization on main stem height and aboveground biomass of peanuts.
Agronomy 15 01302 g004
Figure 5. Effects of irrigation and fertilization parameters on water consumption (a), water use efficiency (b), and nitrogen partial factor productivity (c) of peanuts.
Agronomy 15 01302 g005
Table 1. Physical and chemical properties of soil [31].
DepthsAvailable PhosphorusAvailable PotassiumAlkaline Hydrolysis Organic MatterSoil Bulk
Nitrogen Density
(mg kg−1)(mg kg−1)(mg kg−1)(g kg−1)(g kg−1)
0–2023.77199.0642.9814.861.35
20–4022.17169.3332.0414.281.43
40–6022.86114.4643.419.731.44
Table 2. Sub-membrane drip irrigation and fertilization programs during peanut reproductive period.
YearTreatmentDrip Irrigation
Account
Irrigation
Cycles
(d)
Amount of
Nitrogen
Topdressing
Discharge(mm)
(L h−1)Seedling
Water
Seedling
Stage
Flower-Pegging
Stage
Pod-Setting
Stage
Pod-Filling
Stage
Seedling
Stage
Flower-Pegging
Stage
Pod-Setding
Stage
Pod-Filling
Stage
Growth
Period
2022W1N1Q13.045-303030-77100.5
W1N2Q13.045-303030-77101
W2N1Q13.045-37.537.537.5-77100.5
W2N2Q13.045-37.537.537.5-77101
W1N0Q13.045-303030-77100
2023W2N1Q13.045-37.537.537.5-77100.5
W2N1Q26.045-37.537.537.5-77100.5
W2N2Q13.045-37.537.537.5-77101
W2N2Q26.045-37.537.537.5-77101
W2N0Q13.045-37.537.537.5-77100
2024W2N1Q13.045-37.537.537.5-77100.5
W2N1Q26.045-37.537.537.5-77100.5
W2N2Q13.045-37.537.537.5-77101
W2N2Q26.045-37.537.537.5-77101
W2N0Q13.045-37.537.537.5-77100
Note: W: irrigation account, mm; N: nitrogen application, kg ha−1; Q: drip discharge rate, L h−1 as follows.
Table 3. Significance analysis of technical parameters of irrigation and fertilization on growth indicators of peanuts.
YearFactorMain Stem Height Aboveground Biomass
Flowering-Pod-Pod-Flowering-Pod-Pod-
Pegging
Stage
Setting
Stage
Filling
Stage
Pegging
Stage
Setting
Stage
Filling
Stage
Wns**********
2022N************
W × Nns**ns******
N****ns******
2023Q**ns******
N × Qns*ns******
N****ns******
2024Q**ns******
N × Qns*ns******
Note: * is the level of significance (p < 0.05); ** is the level of extreme significance (p < 0.01); and ns is non-significant.
Table 4. Effect of technical parameters of irrigation and fertilization on yield and yield components of peanuts.
YearTreatmentPod Yield100-Pod Weight100-Kernel WeightKernel Rate
(kg ha−1)(g)(g)(%)
W1N1Q13698.15 c165.26 c80.40 b66.43 bc
W1N2Q14522.74 b179.42 b81.40 b68.29 abc
2022W2N1Q14697.65 ab180.81 b85.29 b69.13 ab
W2N2Q15297.35 a208.54 a95.42 a70.83 a
W1N0Q13398.30 c156.48 c70.33 c65.61 c
W*******
N******ns
W × Nnsnsnsns
W2N1Q15528.28 a227.23 a94.88 a70.91 b
W2N1Q25597.53 a230.07 a96.93 a72.38 a
2023W2N2Q15044.43 c226.74 a97.08 a70.89 b
W2N2Q25266.05 b227.58 a92.66 a72.25 a
W2N0Q14418.18 d214.37 b83.82 b69.98 c
N**ns****
Q**ns****
N × Qnsnsns**
W2N1Q18668.80 ab234.24 ab88.22 bc72.28 a
W2N1Q29095.38 a237.18 a98.29 a72.89 a
2024W2N2Q18584.60 b234.40 ab85.92 c69.79 b
W2N2Q28738.84 ab234.61 ab94.41 ab72.50 a
W2N0Q17518.83 c227.63 b84.59 c69.32 b
N**ns****
Q**ns****
N × Qnsnsns**
Note: different lowercase letters in the same column indicate significant differences between treatments (p < 0.05); * is the level of significance (p < 0.05); ** is the level of extreme significance (p < 0.01); and ns is non-significant.
Table 5. Effect of irrigation and fertilization parameters on the quality of peanuts.
YearTreatmentProtein
Content
(%)
Oil
Content
(%)
YearTreatmentProtein
Content
(%)
Oil
Content
(%)
YearTreatmentProtein
Content
(%)
Oil
Content (%)
W1N1Q128.40 a38.30 b W2N1Q130.82 b50.16 c W2N1Q130.65 c49.52 b
W1N2Q127.37 b43.78 a W2N1Q231.78 a51.51 b W2N1Q231.00 b50.12 a
2022W2N1Q125.12 c45.74 a2023W2N2Q130.73 b50.63 c2024W2N2Q130.55 c48.50 c
W2N2Q124.88 c45.42 a W2N2Q231.55 a53.42 a W2N2Q231.44 a50.29 a
W1N0Q126.85 b43.86 a W2N0Q130.53 b49.53 d W2N0Q130.84 b48.16 c
W**** Nns** N****
N*** Q**** Q****
W × Nns** N × Qns** N × Q****
Note: different lowercase letters in the same column indicate significant differences between treatments (p < 0.05); * is the level of significance (p < 0.05); ** is the level of extreme significance (p < 0.01); and ns is non-significant.
Table 6. Eigenvalues, contributions, and cumulative contributions determined by principal component analysis method.
YearComponentEigenvalueContribution
Rate
Cumulative
Contribution Rate
(%)(%)
13.78963.15263.152
21.51925.31588.467
202230.61210.20298.669
40.0801.331100.000
5−5.833 × 10⁻¹⁷−9.721 × 10−16100.000
13.78175.61575.615
21.04720.94796.562
202330.1673.34299.904
40.0050.096100
51.26 × 10−162.52 × 10−15100
13.68373.66773.667
21.21224.24997.916
202430.0681.35199.267
40.0370.733100.000
54.139 × 10−178.279 × 10−16100.000
Table 7. Score function expressions for principal components and composite evaluation function expressions.
YearFunction Expressions
2022Y221 = −0.384 × X1 + 0.208 × X2 + 0.293 × X3 + 0.318 × X4 + 0.112 × X5
Y222 = 0.187 × X1 + 0.160 × X2 + 0.036 × X3 − 0.121 × X4 − 0.453 × X5
F = 0.63152/0.88467 × Y221 + 0.25315/0.88467 × Y222
2023Y231 = 0.336 × X1 + 0.385 × X2 + 0.386×X3 − 0.076 × X4 − 0.234 × X5
Y232 = −0.046 × X1 − 0.136 × X2 − 0.137 × X3 + 0.510 × X4 + 0.670 × X5
F = 0.75615/0.96562 × Y231 + 0.20947/0.96562 × Y232
2024Y241 = 0.291 × X1 + 0.310 × X2 + 0.336 × X3 − 0.179×X4 + 0.119 × X5
Y242 = −0.028 × X1 − 0.087 × X2 − 0.173 × X3 + 0.754×X4 + 0.387 × X5
F = 0.73667/97.916 × Y241 + 0.24249/0.97916 × Y242
Note: F is the overall evaluation score; Y221, Y222, Y231, Y232, Y241, and Y242 are the main component scores; X1: yield; X2: water use efficiency; X3: nitrogen partial factor productivity; X4: protein content; and X5: oil content.
Table 8. Composite score evaluation of peanut indicators.
YearTreatmentScoreRankingsYearTreatmentScoreRankingsYearTreatmentScoreRankings
W1N1Q1−0.394 W2N1Q10.642 W2N1Q10.313
W1N2Q10.472 W2N1Q20.711 W2N1Q20.821
2022W2N1Q10.2432023W2N2Q1−0.1142024W2N2Q1−0.244
W2N2Q10.821 W2N2Q20.063 W2N2Q20.352
W1N0Q1−1.135 W2N0Q1−1.315 W2N0Q1−1.255
Disclaimer/Publisher’s Note: The statements, opinions and data contained in all publications are solely those of the individual author(s) and contributor(s) and not of MDPI and/or the editor(s). MDPI and/or the editor(s) disclaim responsibility for any injury to people or property resulting from any ideas, methods, instructions or products referred to in the content.

