Article

Temperature Modulates Nutrient Metabolism and Antioxidative Fluctuations in Riptortus pedestris

1
College of Plant Protection, Jilin Agricultural University, Changchun 130118, China
2
Key Laboratory of Soybean Disease and Pest Control, Ministry of Agriculture and Rural Affairs, Changchun 130118, China
*
Author to whom correspondence should be addressed.
Agronomy 2025, 15(6), 1300; https://doi.org/10.3390/agronomy15061300
Submission received: 4 April 2025 / Revised: 17 May 2025 / Accepted: 24 May 2025 / Published: 26 May 2025
(This article belongs to the Section Pest and Disease Management)

Simple Summary

Riptortus pedestris is one of the most serious pests affecting soybean quality and yield. In this study, we used measurements of body weight, CO2 emissions, nutrient substances, nutrient metabolic enzymes, and antioxidative enzymes to reveal the metabolic changes in R. pedestris within the temperature range of 24–44 °C. We found that ambient temperatures affected metabolic changes in R. pedestris. CO2 emissions and body weight showed gender-specific trends, with peak emissions observed at 36 °C for females and at 44 °C for males. The carbohydrate content increased with rising temperature, peaking at 44 °C, while glycogen and fat contents showed fluctuating trends. The protein content rose with temperature, reaching the highest value at 44 °C. Antioxidative enzymes, including superoxide dismutase, catalase, and malondialdehyde, first increased and then decreased with temperature, while peroxidase and the total antioxidative capacity initially decreased and then increased with temperature. These findings highlight the profound influence of temperature on metabolic changes in R. pedestris, emphasizing the critical role that temperature plays in shaping its physiological processes.

Abstract

Temperature plays a crucial role in influencing insect metabolism. In this study, we measured the body weight, CO2 emissions, nutrient substances, nutrient metabolic enzymes, and antioxidative enzymes in Riptortus pedestris within the range of 24–44 °C. The results show that CO2 emissions significantly varied between sexes and temperatures, peaking at 36 °C for females and 44 °C for males. The body weights were the lowest at 40 °C, with notable differences observed between genders. Total carbohydrate and protein contents were the highest at 44 °C, while glycogen and fat contents peaked at 36 °C and 40 °C for females and males, respectively. Enzyme activities varied, with glyceraldehyde-3-phosphate dehydrogenase and glycerol-3-phosphate dehydrogenase activities peaking at 28–32 °C, and citrate synthase activity fluctuated between 24 °C and 40 °C. Lactate dehydrogenase activity reached the highest level at 36 °C in females and at 32 °C in males and then decreased at 44 °C. 3-Hydroxyacyl-CoA dehydrogenase activity peaked at 44 °C in females and at 36 °C in males. Within the range of 24 °C to 44 °C, the ratio of HOAD to GAPDH indicated a shift from carbohydrate to lipid metabolism at higher temperatures, particularly at 44 °C. Superoxide dismutase peaked at 24 °C in females and at 44 °C in males. Catalase reached its maximum concentration between 32 °C and 40 °C. Malondialdehyde peaked between 32 °C and 36 °C. The total antioxidative capacity was the highest at temperatures between 24 °C and 36 °C. Peroxidase activity was the highest at temperatures ranging from 24 °C to 44 °C. Our observations suggest that temperature profoundly impacts the energy metabolism, enzyme activities, and physiological traits of R. pedestris.

1. Introduction

Insects are frequently confronted with adverse environmental conditions and adapt by regulating their physiological activities and behaviors to survive in unfavorable situations [1,2]. Among the many factors influencing insect metabolism—such as temperature, external oxygen supply, activity level, food availability and quality, body weight, gender, developmental stage, and exposure to physical and chemical stress—temperature plays a particularly critical role [3,4,5,6]. Elevated temperatures significantly impact insect physiology, development, and population dynamics. Being ectothermic organisms, insects depend on external thermal conditions to maintain their bodily functions [7]. Prolonged exposure to temperatures beyond their optimal thermal range can result in reduced survival rates, impaired reproductive capacity, and shortened lifespans [8,9,10]. However, insects have evolved a variety of physiological and behavioral strategies to adapt to high temperatures, such as adjusting the types of nutrients utilized, changing the metabolic rate, and regulating their antioxidative systems (superoxide dismutase, peroxidase, catalase, total antioxidative capacity, and malonic aldehyde) to cope with the oxidative stress induced by heat [11]. These adaptive mechanisms are especially relevant as climate change drives more frequent and intense heat events, posing growing challenges to insect populations. Understanding how high temperatures influence insect biology, particularly within the broader context of their metabolic responses, is essential for effective pest control and the conservation of beneficial insect species [7]. Effective pest management requires accounting for the dynamic changes in temperature and their long-term effects on insect populations.
With global warming, the threat of the soybean stink bug, R. pedestris, has intensified in soybean-growing regions, including in China, Japan, Korea, and Malaysia [12,13,14,15]. The occurrence of R. pedestris across major soybean-growing regions in China is closely linked to temperature [15]. In July and August, daily maximum temperatures typically range from 32 to 40 °C, with peaks reaching up to 42 °C [16]. As the climate continues to warm, its impact on soybean yield and quality will worsen. Both nymphs and adults feed on soybean pods using their piercing–sucking mouthparts, resulting in deformed, weak, or stunted pods, which leads to significant reductions in yield and quality, thus causing considerable economic losses [17,18]. Existing research has mainly concentrated on the biological and ecological characteristics of R. pedestris, with a focus on how temperature affects its growth, reproduction, and population dynamics. Under constant high temperatures, the developmental period of R. pedestris from egg to adult is accelerated, with the total duration shortening as the temperature increases [19,20]. However, constant extreme temperatures (above 36 °C or below 16 °C) hinder development and reproduction, often leading to incomplete life cycles and reduced fecundity. For example, at 31 °C, the total duration of the immature stage is approximately 24.4 days, and the greatest reproduction occurs at approximately 24–25 °C, with optimal fecundity rates. In contrast, fluctuating temperature regimes within a suitable thermal range (e.g., 24 ± 6 °C) positively affect the life history traits of R. pedestris compared with constant temperature conditions. Fluctuating temperatures extend female longevity and oviposition periods, resulting in higher reproductive success [21]. For instance, the pre-adult survival rate and net reproductive rate (R0) peak under such conditions, with fecundity being significantly higher compared with that at constant temperatures.
However, little research has been conducted on the physiological responses of R. pedestris to high-temperature stress. In the present study, we aimed to investigate the changes in body weight, CO2 emissions, nutrient substances, nutrient metabolic enzymes, and antioxidative enzymes in R. pedestris in relation to temperature. Our findings may serve as a theoretical foundation for exploring the physiological adaptations of R. pedestris to high temperatures. Understanding these physiological responses is crucial for predicting population trends, explaining the mechanism of pest infestation, and developing pest management strategies.

2. Materials and Methods

2.1. Insect Rearing and Treatment

Adult R. pedestris were collected from Chengde City, Hebei Province, China (40°58′00″ N, 118°4′20″ E), and reared on soybean (var. Jinong 38) plants. Prior to the initiation of this temperature-dependent experiment, approximately five generations of R. pedestris were reared under carefully controlled conditions, as thoroughly described in previous studies [17,19]. Cultures of R. pedestris and soybean plants were grown at 24 ± 1 °C with 80 ± 5% RH and a photoperiod of 16 h:8 h (light/dark). Three-day-old adult R. pedestris were used for the experiments. R. pedestris underwent temperature treatments at 16, 20, 24, 28, 32, 36, and 40 °C for 24 h with feeding in an artificial climate incubator (GXZ–380B; Jiangnan Instrument Factory, Ningbo, China). The insects underwent treatment at 44 °C for 3 h in an artificial climate incubator.

2.2. Weights of R. pedestris

We measured the weight of the centrifuge tube (W1), and then placed the temperature-treated individual into the centrifuge tube and measured the weight again (W2). The experiment was repeated ten times. The weight (W) was calculated using the following formula:
W = W 1 W 2
where W1 is the weight of the centrifuge tube, g; W2 is the weight of the centrifuge tube and the individual, g; and W is the weight of the individual, g.

2.3. Emissions of CO2 in R. pedestris

The method used to measure the CO2 emissions of R. pedestris in this study is similar to that described in previous studies [22,23]. CO2 emission measurements were performed at different temperatures using a closed plastic chamber. Each R. pedestris individual was placed into a 500 mL plastic centrifuge tube with holes (2 cm in diameter). The CO2 detector (B1010; Shenzhen Wost Technology Co., Ltd., Shenzhen, China) was inserted through the hole and remained above the plastic chamber (Figure S1). When it was detected that a CO2 concentration of 400 ppm had been reached in the chamber, the chamber was securely sealed with parafilm to ensure the same conditions for each R. pedestris individual. The measuring range of the CO2 detector was 0 to 2000 ppm (parts per million; volumetric). All individuals underwent temperature treatments while still viable as well as in a stationary state to record the CO2 concentration. The raw CO2 concentrations were measured using the CO2 detector for 1 h at all temperatures. All experiments were conducted in an artificial climate incubator to accurately control the temperature and humidity. After performing the CO2 concentration test, the weight of the tested R. pedestris was accurately recorded using an electronic balance. For each temperature-treatment group, five male and five female individuals of R. pedestris were used.
The CO2 emissions comprised the volumetric concentration of CO2 in the plastic chamber. The formula is as follows [24]:
Δ C O 2 = C O 2 ( t 2 ) C O 2 ( t 1 )
where ΔCO2 is the volumetric concentration of CO2, ppm; CO2(t1) is the CO2 concentration at the beginning, ppm; and CO2(t2) is the CO2 concentration at the end of the experiment, ppm.

2.4. Measurement of the Content of Energy Substances

2.4.1. Sample Preparation

After the temperature treatment, we froze the insects to death with liquid nitrogen. The individuals were ground as soon as possible at 4 °C to ensure their preservation. A precise amount of 0.1 g was weighed and placed into a test tube as a replicate. Five R. pedestris individuals were used as one replicate, with three replicates prepared for each temperature treatment.

2.4.2. Measurement of the Total Carbohydrate Content

The total carbohydrate content was examined using commercially available kits (Nanjing Jiancheng Bioengineering Institute, Nanjing, China). We added 1.5 mL of distilled water and 1 mL of Reagent 1 to the test tube, followed by mixing. The tube was heated in a boiling water bath for 30 min. After cooling to room temperature, 1 mL of Reagent 2 was added, and the solution was diluted to a total volume of 10 mL. The mixture was centrifuged at 8000 rpm and 4 °C for 10 min, and the supernatant was collected for testing. The supernatant (μL) and Reagent 3 (μL) were mixed in a 1:1 ratio, heated in a boiling water bath for 10 min, and cooled, and 200 μL of the mixture was measured at a wavelength of 540 nm to determine the absorbance (OD value) of the sample.

2.4.3. Measurement of the Glycogen Content

The glycogen content was examined using commercially available kits (Nanjing Jiancheng Bioengineering Institute, Nanjing, China). We added 0.75 mL of an extraction solution to the tube and mixed it. The tube was then heated in a 95 °C water bath for 20 min. After cooling to room temperature, the solution was mixed and diluted to a total volume of 5 mL. The mixture was centrifuged at 8000 rpm and 4 °C for 10 min, and 200 μL of the supernatant was measured at a wavelength of 620 nm to determine the absorbance (OD value) of the sample.

2.4.4. Measurement of the Fat Content

Ten bugs were selected from each treatment group. Their initial weights were recorded, and then they were dried in an incubator at 60 °C for 48 h to obtain a new weight (M1). The specimens were then ground into a homogenate using a chloroform and methanol extract solution (volume ratio of chloroform to methanol = 2:1). After centrifugation, the supernatant was collected. The chloroform and methanol extract solution was added to the precipitate again, followed by a second round of centrifugation to collect the supernatant. The remaining precipitate was dried again at 60 °C for 24 h before being weighed (M2). The experiment was repeated three times. The fat content (M) was calculated using the following formula [25]:
M = M 1 M 2
where M1 is the weight before degreasing, g; M2 is the weight after degreasing, g; and M is the fat content, g.

2.4.5. Measurement of the Protein Content

The protein content was examined using commercially available kits (Nanjing Jiancheng Bioengineering Institute, Nanjing, China). We added 0.9 mL of PBS (phosphate-buffered saline) solution to the tube and mixed it thoroughly. The tube was centrifuged at 2500 rpm for 10 min, and the supernatant was collected. The supernatant (μL) was mixed with saline solution (μL) at a ratio of 1:19. The absorbance (OD value) of the mixture was measured at a wavelength of 562 nm.

2.5. Measurement of the Activities of Enzymes Related to Energy Metabolism

The activities of GAPDH (glyceraldehyde-3-phosphate dehydrogenase) [26], GDH (glycerol-3-phosphate dehydrogenase) [27,28], HOAD (3-hydroxyacyl-CoA dehydrogenase) [26,29], CS (citrate synthase) [26,27], and LDH (lactate dehydrogenase) [28,30] were examined using commercially available kits (Shanghai Jianglai Biological Technology Co., Ltd., Shanghai, China). GAPDH, GDH, HOAD, CS, and LDH activities were measured using the double-antibody sandwich method (ELISA). After the temperature treatment, we froze the insects to death with liquid nitrogen. The individuals were ground as soon as possible at 4 °C to ensure the preservation of their enzymes. Five R. pedestris individuals were used to prepare 0.1 g of each sample. Then, 0.1 g of each sample and 0.9 mL of phosphate-buffered saline (PBS, pH = 7.4) were placed in a centrifuge tube in a volume of 1.5 mL. This was repeated three times. The samples were centrifuged at 5000 rpm for 10 min at 4 °C. In brief, a 50 μL sample was added to a 96-pore ELISA plate. Then, 100 μL of horseradish peroxidase (HRP) was incubated at 37 °C for 1 h. After washing with washing buffer, chromogens A and B (50 μL) were placed on the microplate and incubated at 37 °C for 15 min. Lastly, a 50 μL stop solution was applied. The mixture was immediately measured at 450 nm using a microplate reader (HBS-1096C; Nanjing Detie Biological Technology Co., Ltd., Jiangsu, China).

2.6. Measurement of the Activities of Antioxidative Enzymes

The activities of superoxide dismutase (SOD), catalase (CAT), peroxidase (POD), malondialdehyde (MDA), and the total antioxidative capacity (T-AOC) were examined using commercially available kits (Shanghai Biyuntian Biological Technology Co., Ltd., Shanghai, China). After the temperature treatment, we froze the insects to death with liquid nitrogen. The individuals were ground as soon as possible at 4 °C to ensure the preservation of their enzymes. Precisely 0.1 g of sample was weighed and placed into a centrifuge tube. Then, 0.9 mL of PBS was added, mixed well, and centrifuged at 8000 rpm for 10 min. The supernatant was used as the sample. The absorbance (OD value) of the reaction system was measured at 560 nm.

2.7. Statistical Analysis

Statistical analyses were performed in SPSS 26.0 (IBM Inc., Chicago, IL, USA). All data are expressed as the mean ± SE (standard error). A one-way ANOVA was used to compare the effect of temperature on the nutrient substances and nutrient metabolic enzyme activities in R. pedestris. Differences between means were tested using the Tukey honest significant difference (HSD) test. Differences between female and male adults at the same temperature were determined using the t-test (p < 0.05).

3. Results

3.1. The Effects of Temperature on the Weight of R. pedestris

Temperature significantly affects the weight of R. pedestris (♀: F = 4.50, p = 0.003; ♂: F = 8.22, p = 0.001) (Figure 1). Meanwhile, a two-factor analysis was conducted on weight based on temperature and gender, revealing that gender was the main influencing factor (Table S1). With an increase in temperature, the weights of the female and male adults generally showed a tendency to decrease and then increase. The highest weight was recorded at 24 °C, with an average of 0.06 for both the female and male adults. The lowest weight was recorded at 40 °C, with an average of 0.05 for both the female and male adults. There were significant differences (p < 0.05) in weight between the male and female adults at 32 °C (p = 0.017), 36 °C (p = 0.002), and 40 °C (p = 0.045), but the other treatments showed no significant differences.

3.2. Effect of Temperature on CO2 Emissions in R. pedestris

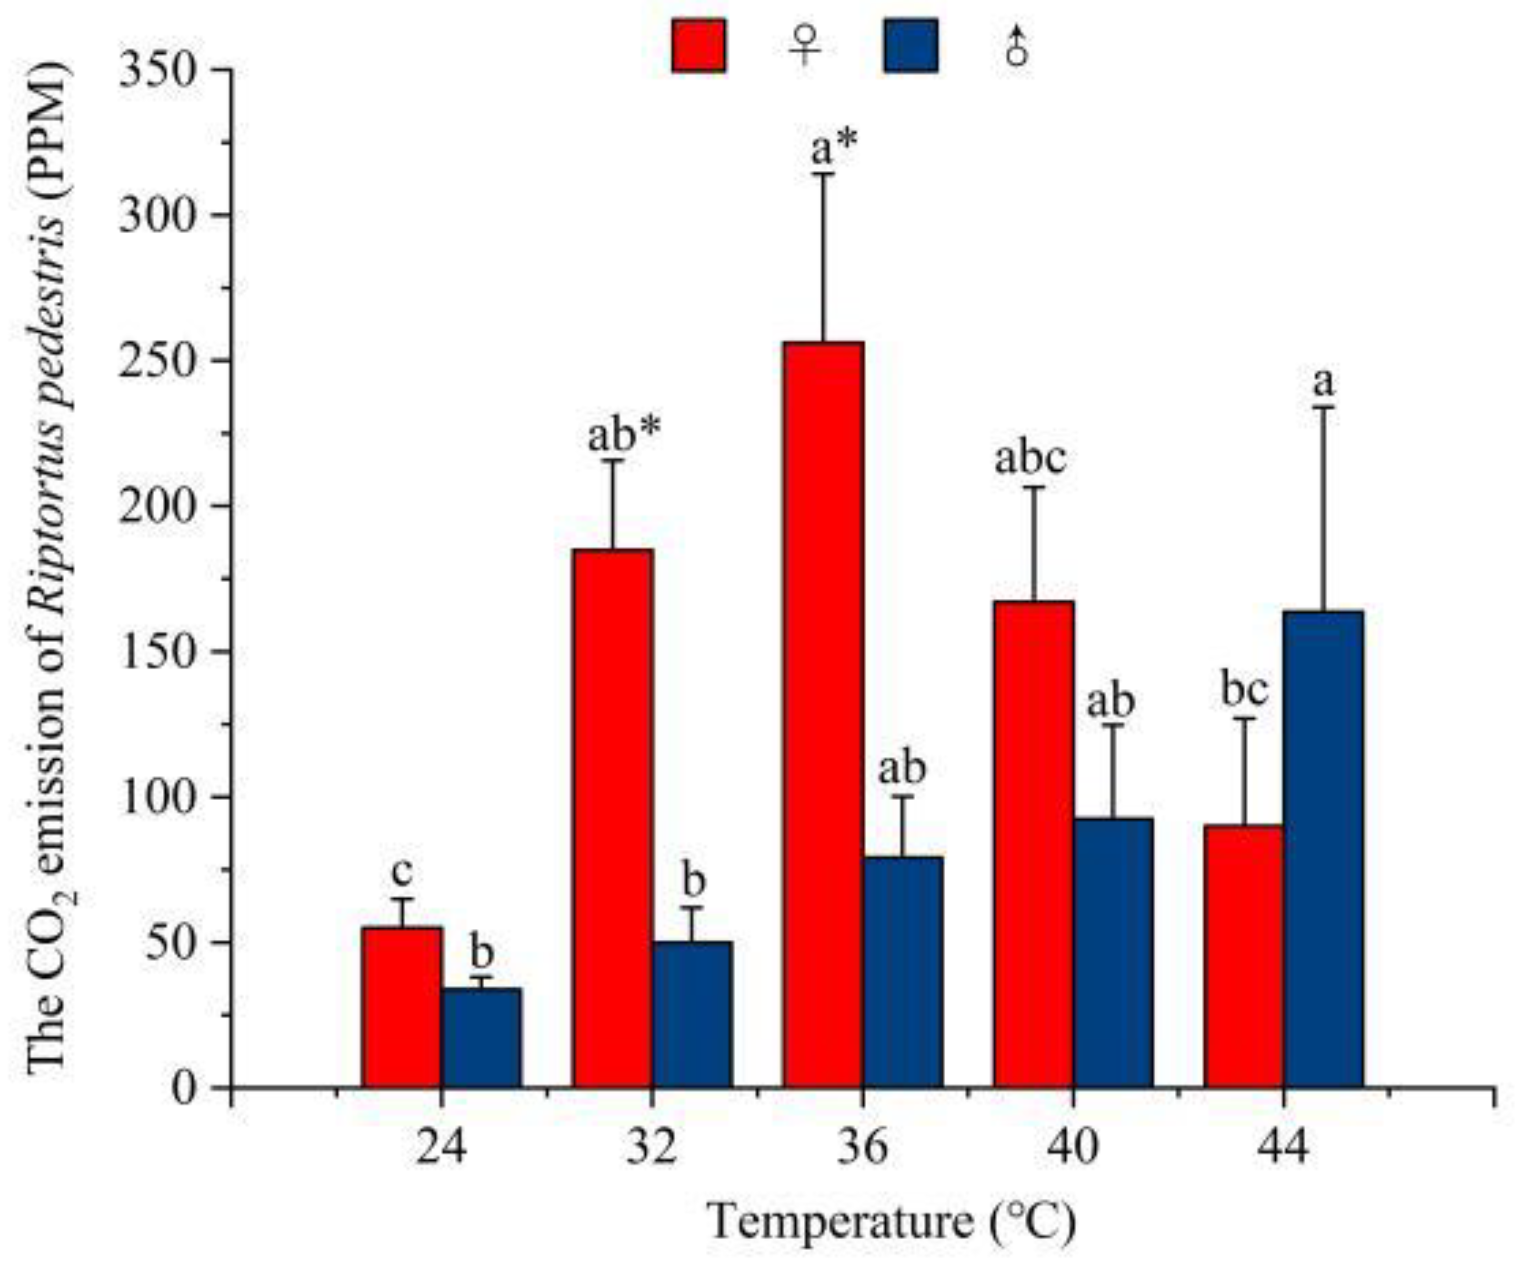
Temperature significantly affects the CO2 emissions of R. pedestris (♀: F = 4.52, p = 0.006; ♂: F = 2.61, p = 0.057) (Figure 2). A two-factor analysis revealed that temperature, gender, and the interaction between gender and temperature all had a significant impact on CO2 emissions (Table S2). With increasing temperature, the CO2 emissions of female adults generally showed a tendency to increase and then decrease, while those of male adults showed a tendency to increase gradually. The CO2 emissions of female adults ranged from 55.00 to 256.173 ppm and those of male adults ranged from 33.89 to 163.60 ppm. In female adults, the peak of CO2 emissions was recorded at 36 °C (namely, 256.17 ppm), and the lowest was recorded at 24 °C, with a value of 55.00 ppm. In male adults, the peak of CO2 emissions was recorded at 44 °C (namely, 163.60 ppm), and the lowest was recorded at 24 °C, with a value of 33.89 ppm. There were significant differences (p < 0.05) in CO2 emissions between male and female adults at 32 °C (p = 0.003) and 36 °C (p = 0.017), but no significant differences were observed in the other treatments except at 44 °C, where female adults had higher CO2 emissions than male adults under other temperature treatments.

3.3. The Effect of Temperature on the Nutrient Substance Content

3.3.1. The Effect of Temperature on the Total Carbohydrate Content

Temperature had a significant impact on the content of total carbohydrates in R. pedestris (♀: F = 202.05; p < 0.001; ♂: F = 373.15; p < 0.001) (Figure 3). A two-factor analysis revealed that temperature, gender, and the interaction between gender and temperature all had a significant impact on the total carbohydrate content (Table S3). With an increase in temperature, the total carbohydrate content of R. pedestris showed a fluctuating trend. Among them, the total carbohydrate content of both female and male adults was the highest at 44 °C; namely, 381.10 mg/g and 349.04 mg/g, respectively. This shows that temperature has a significant effect on the total carbohydrate content. There was a significant difference between female and male adults in all treatments (p < 0.001).

3.3.2. The Effect of Temperature on the Glycogen Content

Temperature had a significant impact on the content of glycogen in R. pedestris (♀: F = 514.30; p < 0.001; ♂: F = 43.38; p < 0.001) (Figure 4). A two-factor analysis revealed that temperature, gender, and the interaction between gender and temperature all had a significant impact on the glycogen content (Table S3). With an increase in temperature, the glycogen content of R. pedestris first increased and then decreased. Among the treatments, the glycogen content of female adults was the highest at 36 °C at 20.85 μg/mg; the glycogen content of male adults reached the highest level at 40 °C at 13.42 μg/mg. There was a significant difference between female and male adults at 32 °C (p < 0.001) and 36 °C (p < 0.001) but no significant difference under other treatments.

3.3.3. The Effect of Temperature on the Fat Content

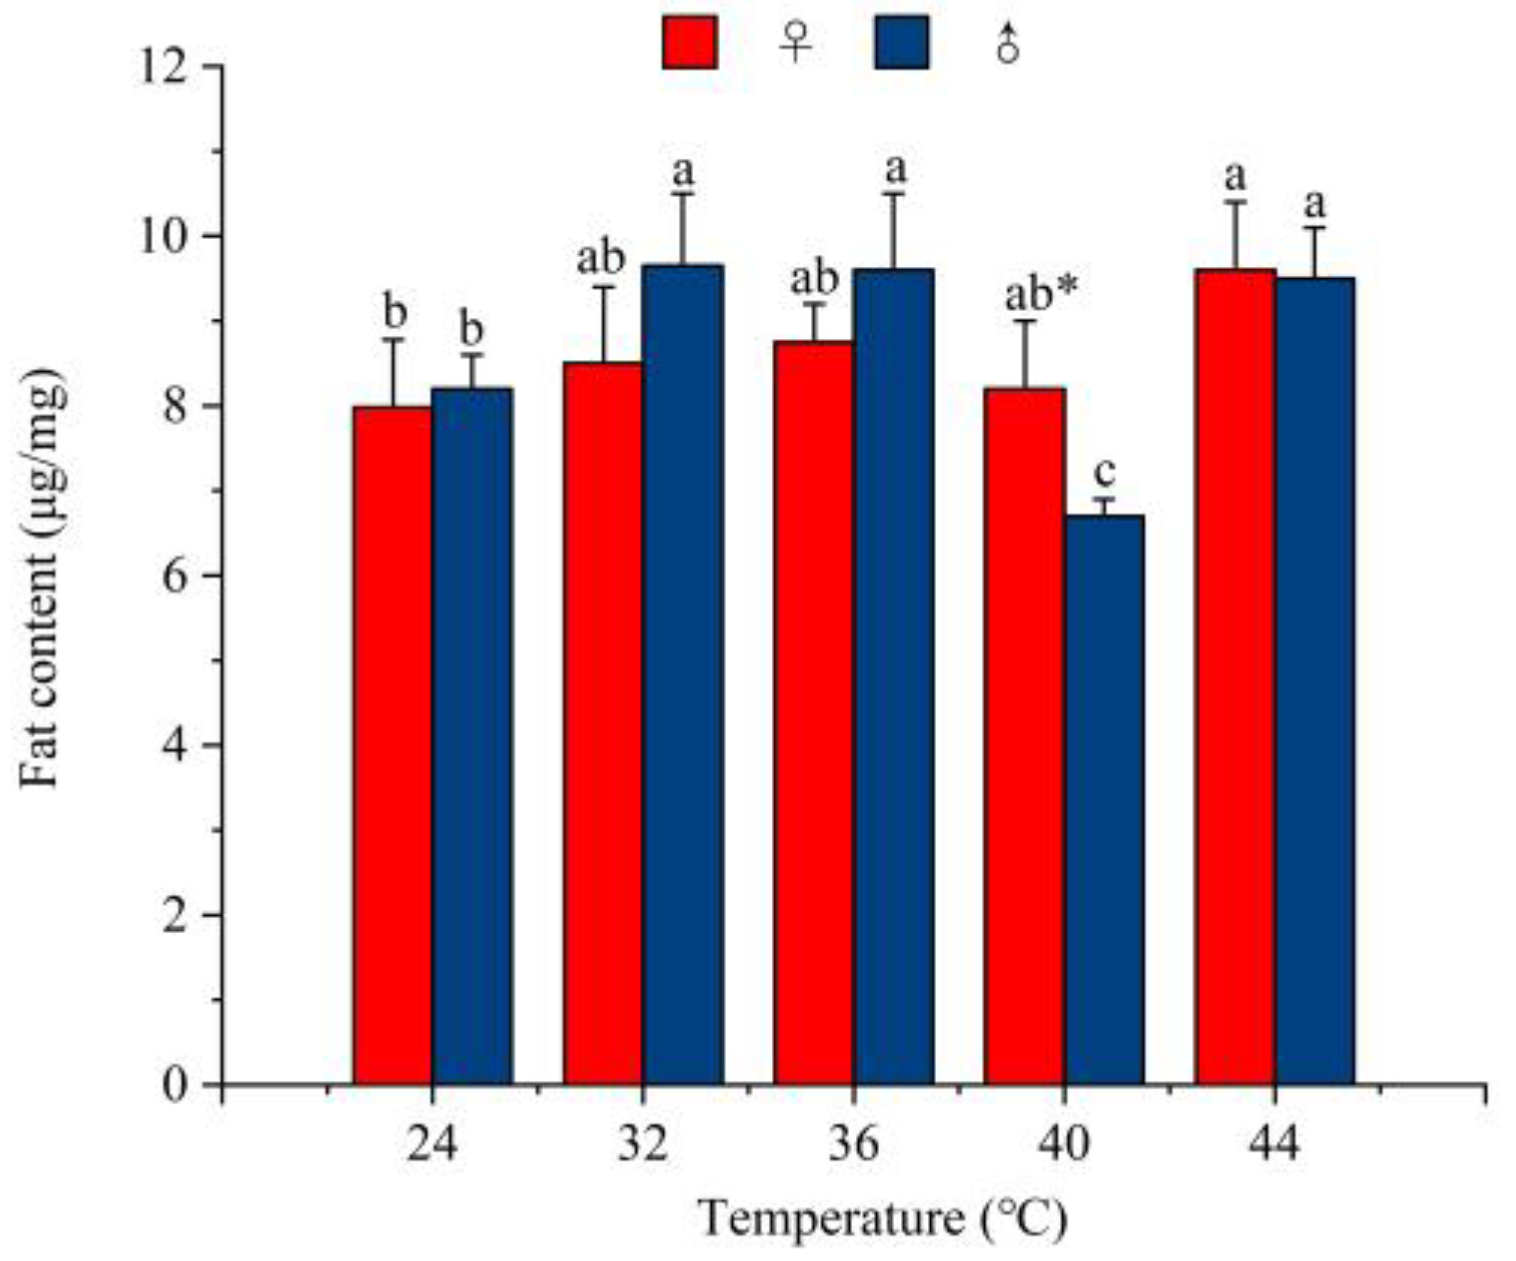
Temperature had a significant impact on the content of fat in R. pedestris (♀: F = 2.01; p = 0.168; ♂: F = 11.82; p = 0.001) (Figure 5). A two-factor analysis revealed that temperature was the main factor influencing the fat content (Table S3). With increasing temperature, the fat content of R. pedestris first increased, then decreased, and then increased again. Among them, the fat content of female adults was the highest at 44 °C at 9.60 μg/mg; the fat content of male insects reached the highest level at 32 °C at 9.65 μg/mg. There was a significant difference between the female and male adults at 40 °C (p = 0.034), but there were no significant difference under the other treatments.

3.3.4. The Effect of Temperature on the Protein Content

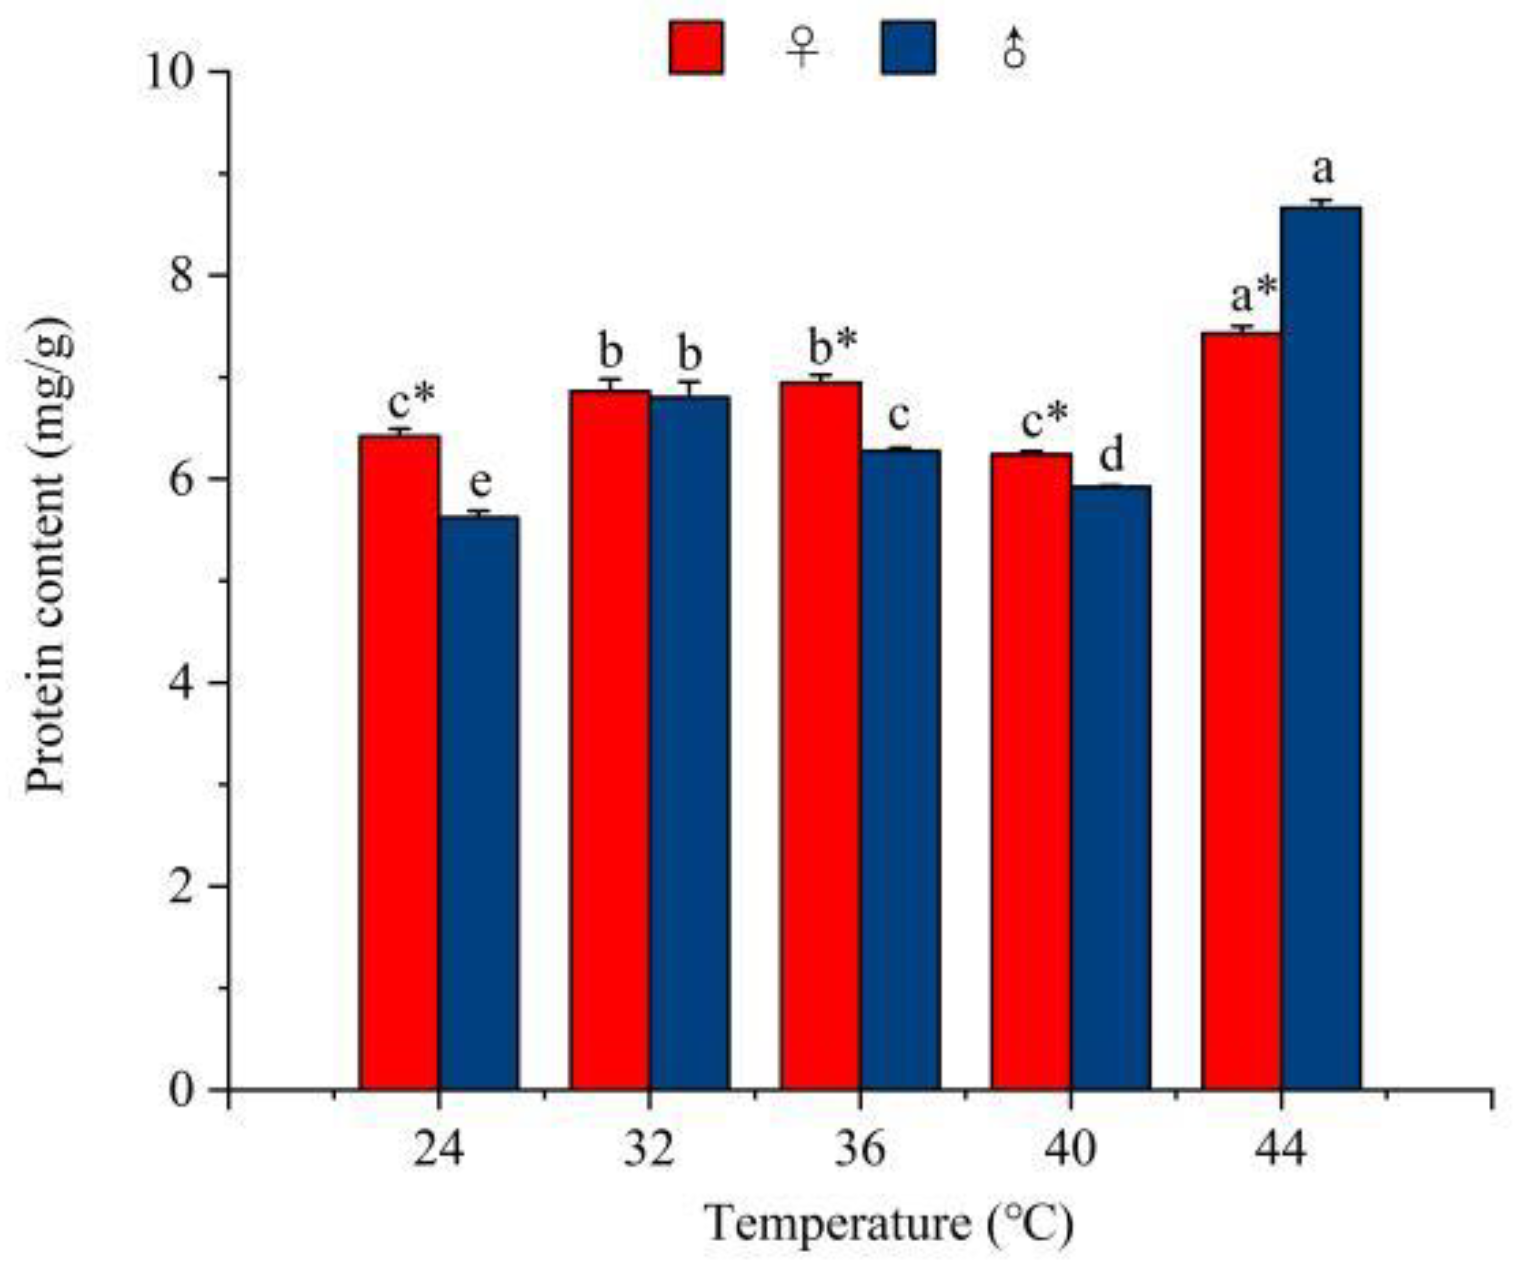
Temperature had a significant impact on the content of protein in R. pedestris (♀: F = 49.53; p < 0.001; ♂: F = 210.22; p < 0.001) (Figure 6). A two-factor analysis revealed that temperature was the main factor influencing the protein content (Table S3). With increasing temperature, the protein content of R. pedestris increased gradually. The protein content was the highest at 44 °C, with values of 0.46 mg/g and 0.53 mg/g seen in females and males, respectively. There were significant differences (p < 0.01) between the sexes in all the treatment groups except at 32 °C (p = 0.775).

3.4. The Effect of Temperature on the Activity of Nutrient Metabolic Enzymes

3.4.1. The Effect of Temperature on the Activity of Glycolytic Enzymes

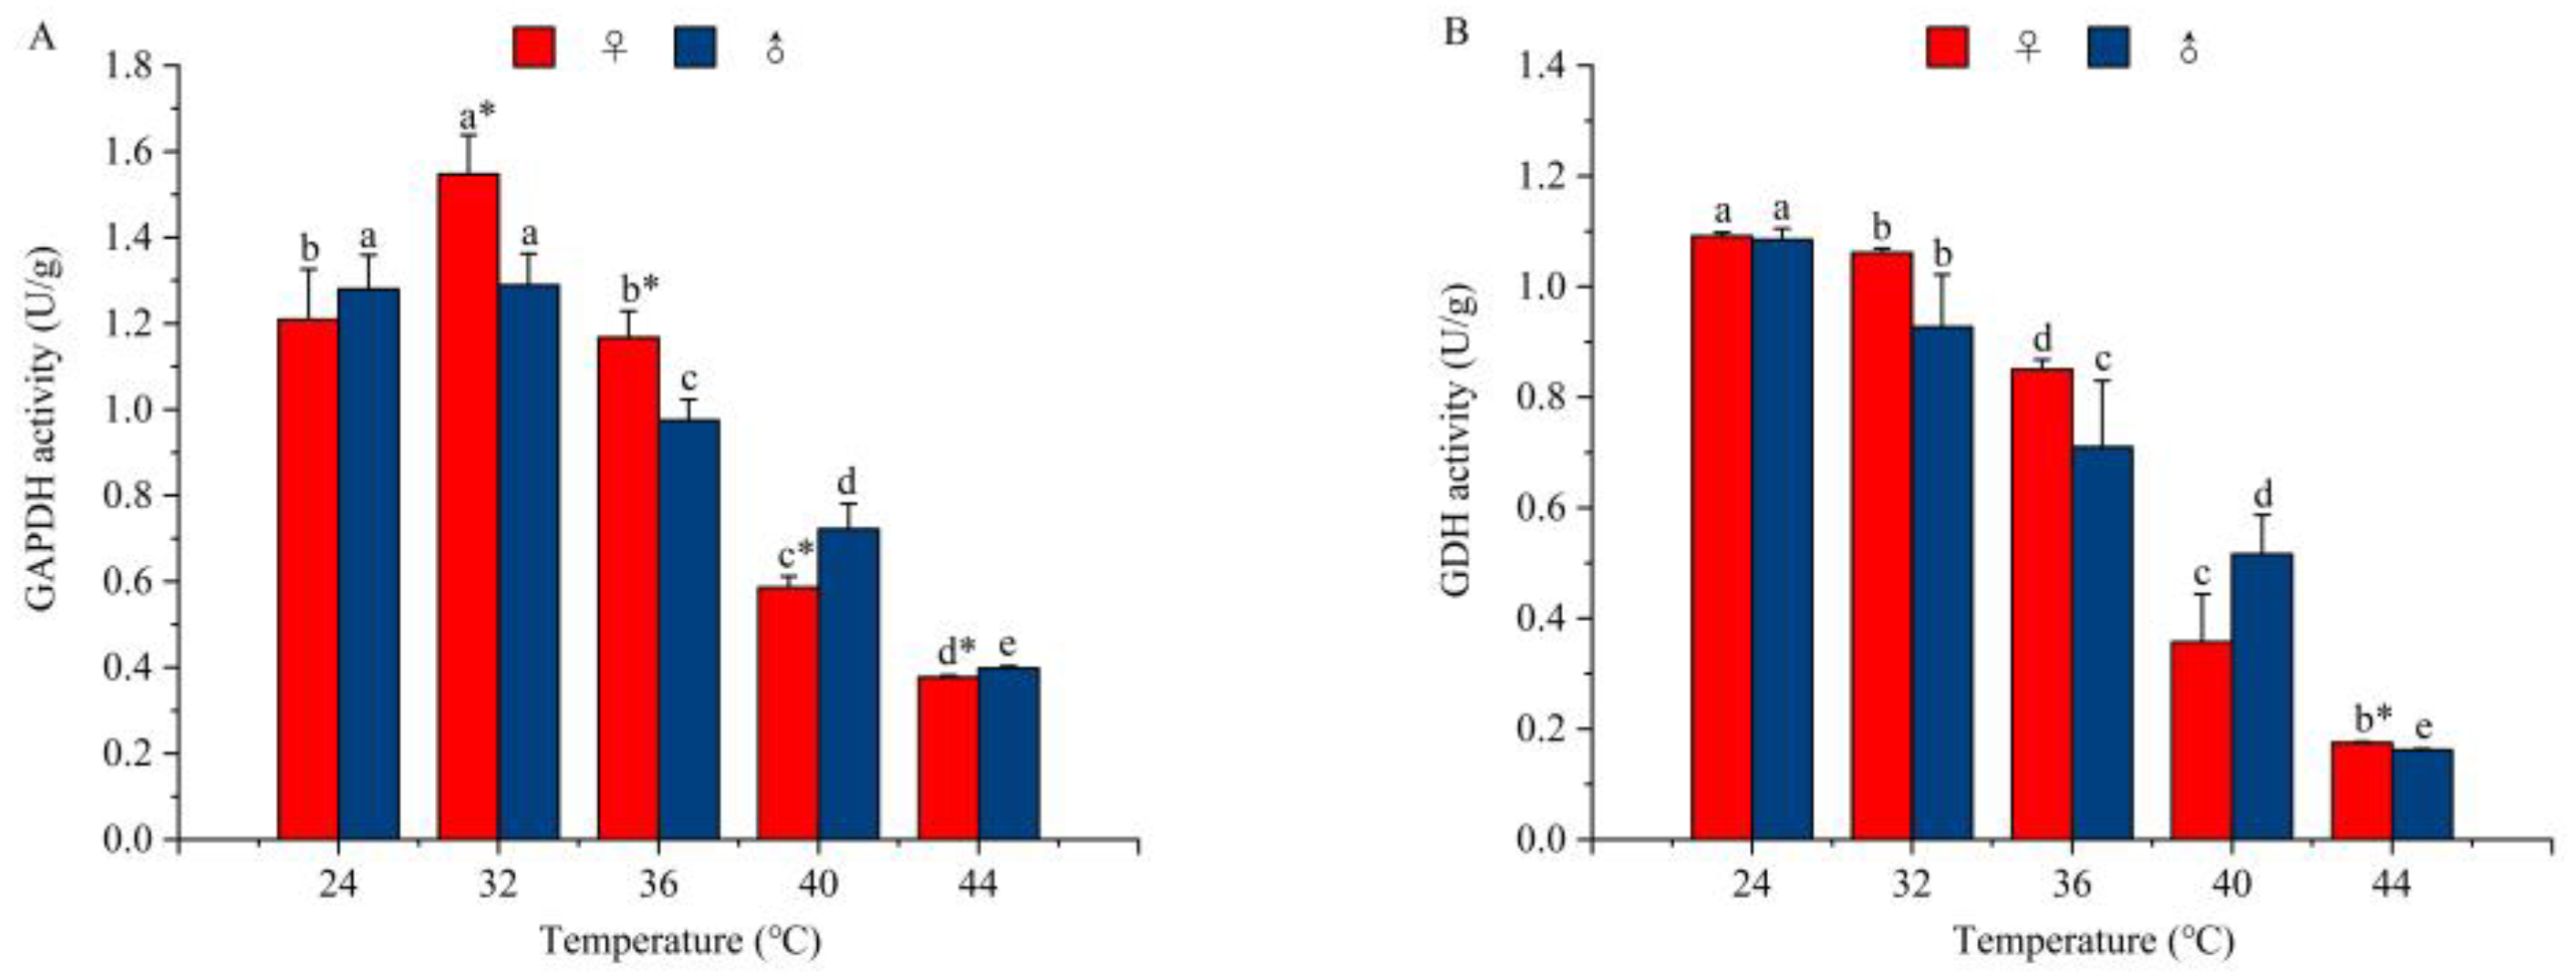
Temperature had a significant impact on the activity levels of a carbohydrate metabolizing enzyme, GADPH, in R. pedestris (♀: F = 131.57, p < 0.001; ♂: F = 125.07, p < 0.001) (Figure 7A). A two-factor analysis revealed that temperature was the main factor influencing GADPH activity (Table S4). The activity of GAPDH in both female and male adults increased at 32 °C and decreased at 44 °C. The GAPDH activity peaked at 32 °C, with values of 1.55 U/g in female adults and 1.29 U/g in male adults being seen. The lowest values were 0.38 U/g in female adults and 0.40 U/g in male adults at 44 °C. Except for the treatment conducted at 24 °C (p = 0.43), GAPDH activities showed significant differences between female and male adults (p < 0.05).
Temperature had a significant impact on the activity levels of another carbohydrate metabolizing enzyme, GDH, in R. pedestris (♀: F = 328.27, p < 0.001; ♂: F = 67.85, p < 0.001) (Figure 7B). A two-factor analysis revealed that temperature was the main factor influencing GDH activity (Table S4). An increase in GDH activity was noted at 28 °C, followed by a decrease at 40 °C, again with significant statistical differences. GDH activity peaked at 28 °C, with values of 1.22 U/g in female adults and 1.10 U/g in male adults being seen, and the lowest activity was recorded at 44 °C; namely, 0.18 U/g in female adults and 0.16 U/g in male adults.

3.4.2. The Effect of Temperature on the Activity of Tricarboxylic Acid Cycle (TCA) Enzymes

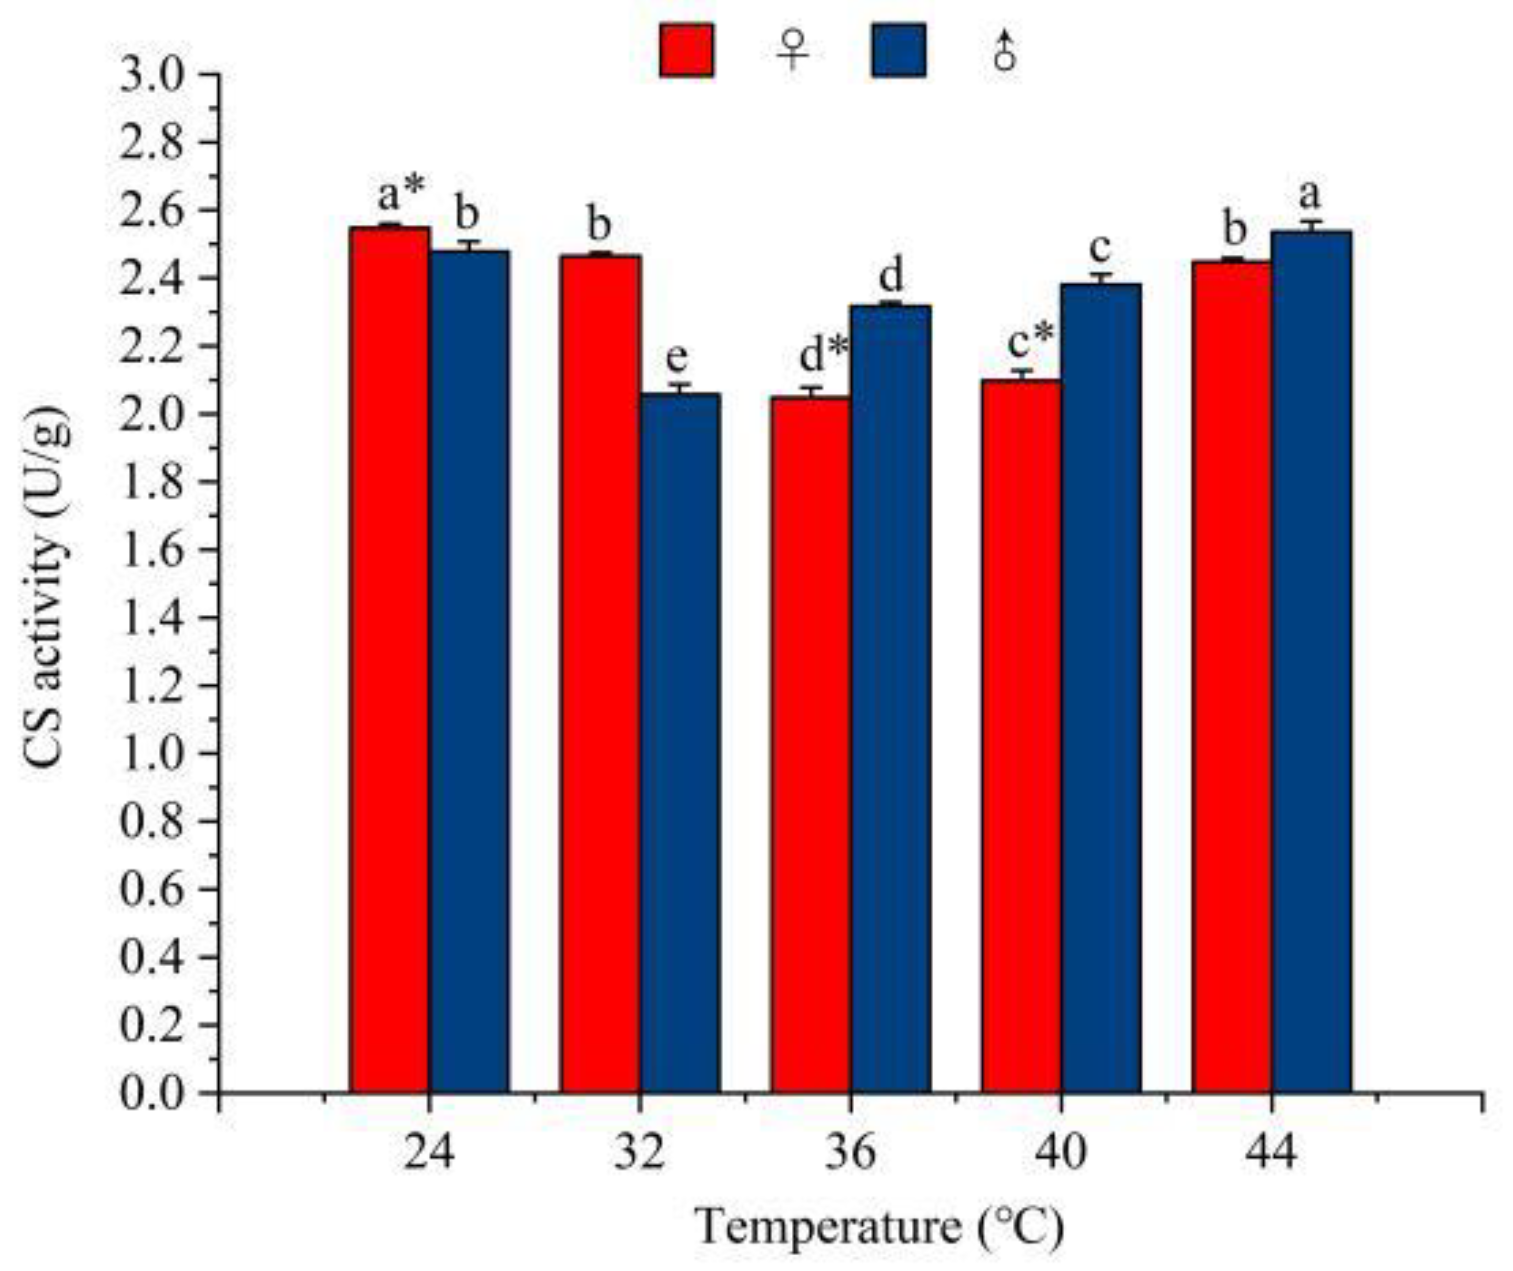
The increase in temperature significantly affected the activity of metabolic enzymes in the tricarboxylic acid cycle (TCA) pathway (♀: F = 1094.77, p < 0.001; ♂: F = 145.62, p < 0.001) (Figure 8). A two-factor analysis revealed that temperature was the main factor influencing CS activity (Table S4). The CS activities of R. pedestris adults decreased at 32 °C and increased at 40 °C. The CS activity peaked at 24 °C, being 2.55 U/g in female adults, and it peaked at 44 °C in male adults, showing a value of 2.48 U/g. The lowest activity recorded in female adults was 2.05 U/g at 36 °C, and in male adults, it was 2.06 U/g at 32 °C. At 24 °C (p < 0.001), 36 °C (p < 0.001), and 40 °C (p < 0.001), CS activities showed significant differences between female and male adults (p < 0.001). At 44 °C (p < 0.001), CS activities showed significant differences between the female and male adults (p < 0.001).

3.4.3. The Effect of Temperature on the Activity of Gluconeogenic Enzymes

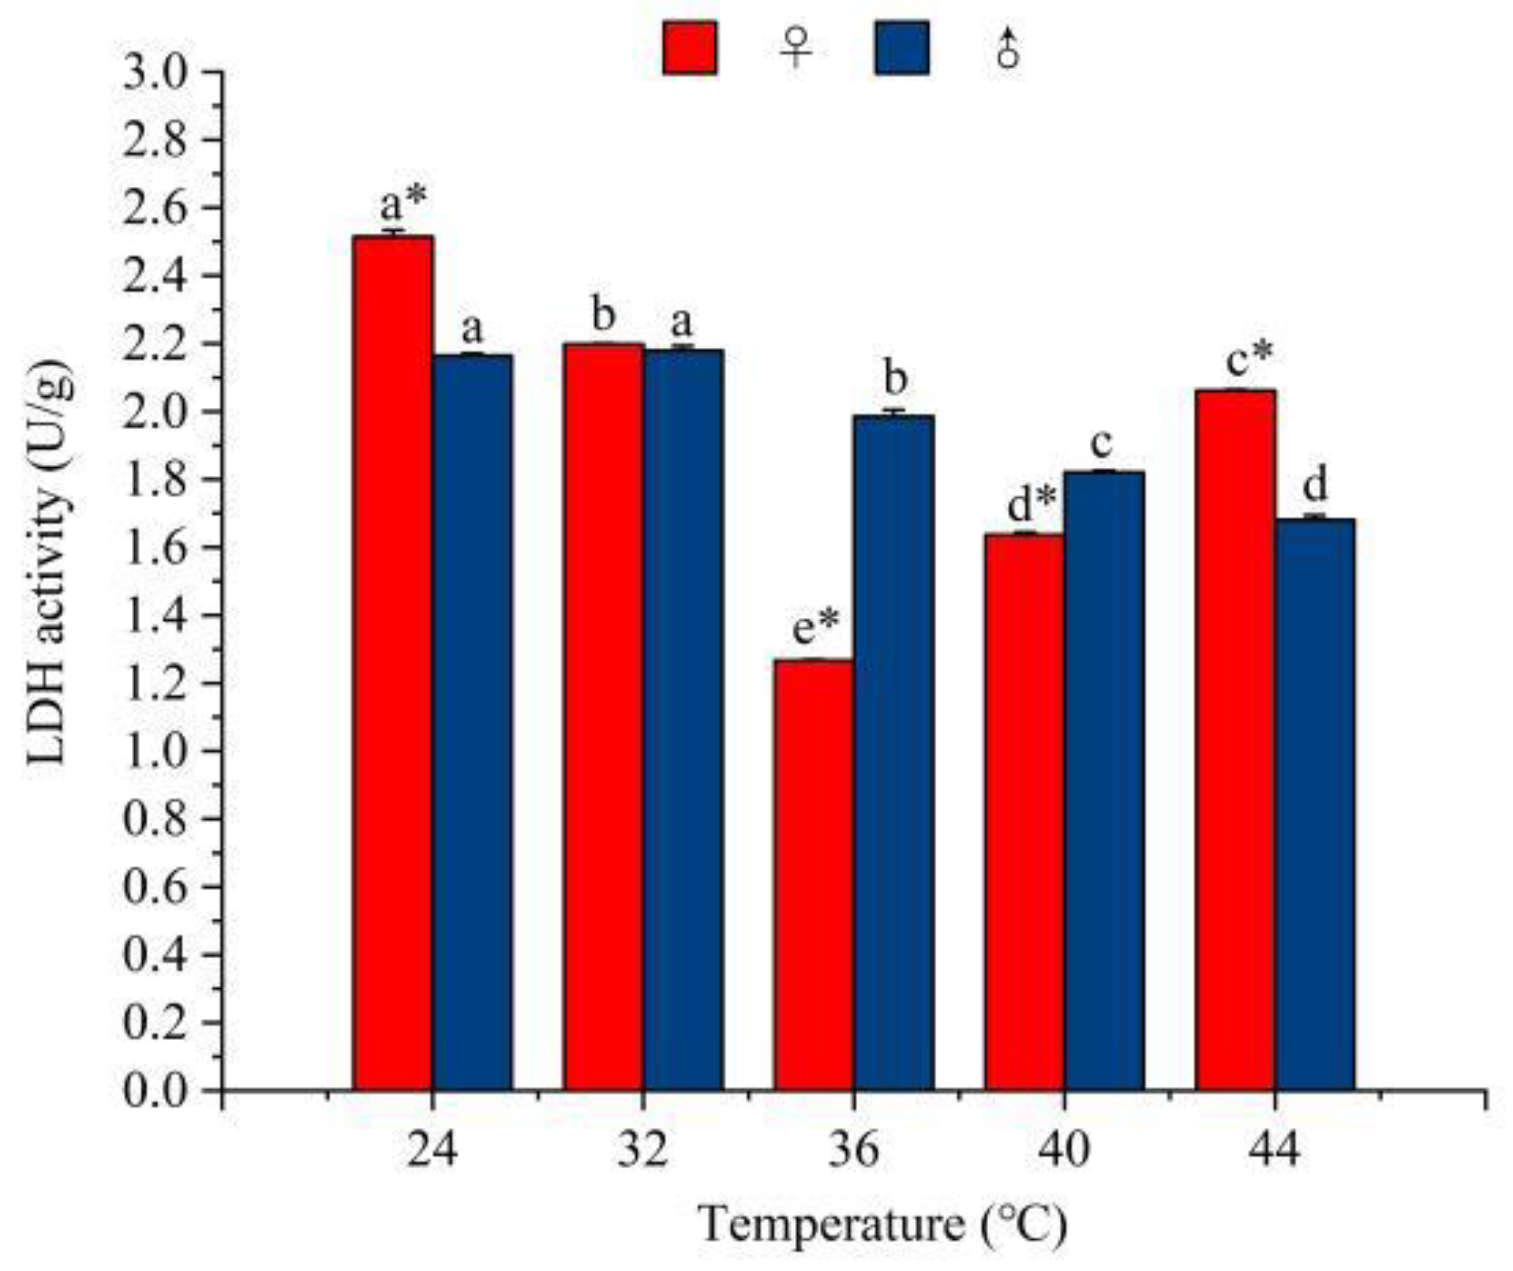
The increase in temperature significantly impacted the activity of gluconeogenic enzymes (♀: F = 8687.28, p < 0.001; ♂: F = 889.73, p < 0.001) (Figure 9). A two-factor analysis revealed that temperature was the main factor influencing LDH activity (Table S4). The LDH activities of female adults increased at 36 °C and decreased at 44 °C, while the LDH activities of male adults decreased. The highest recorded activities of LDH were 2.52 U/g at 24 °C in the female adults and 2.18 U/g at 32 °C in the male adults. The lowest activity recorded in the female adults was 1.27 U/g at 36 °C, and in the male adults, it was 1.68 U/g at 44 °C. Except at 32 °C (p = 0.07), LDH activities showed significant differences between female and male adults at all the other temperatures tested (p < 0.05).

3.4.4. The Effect of Temperature on the Activity of Lipometabolism Enzymes

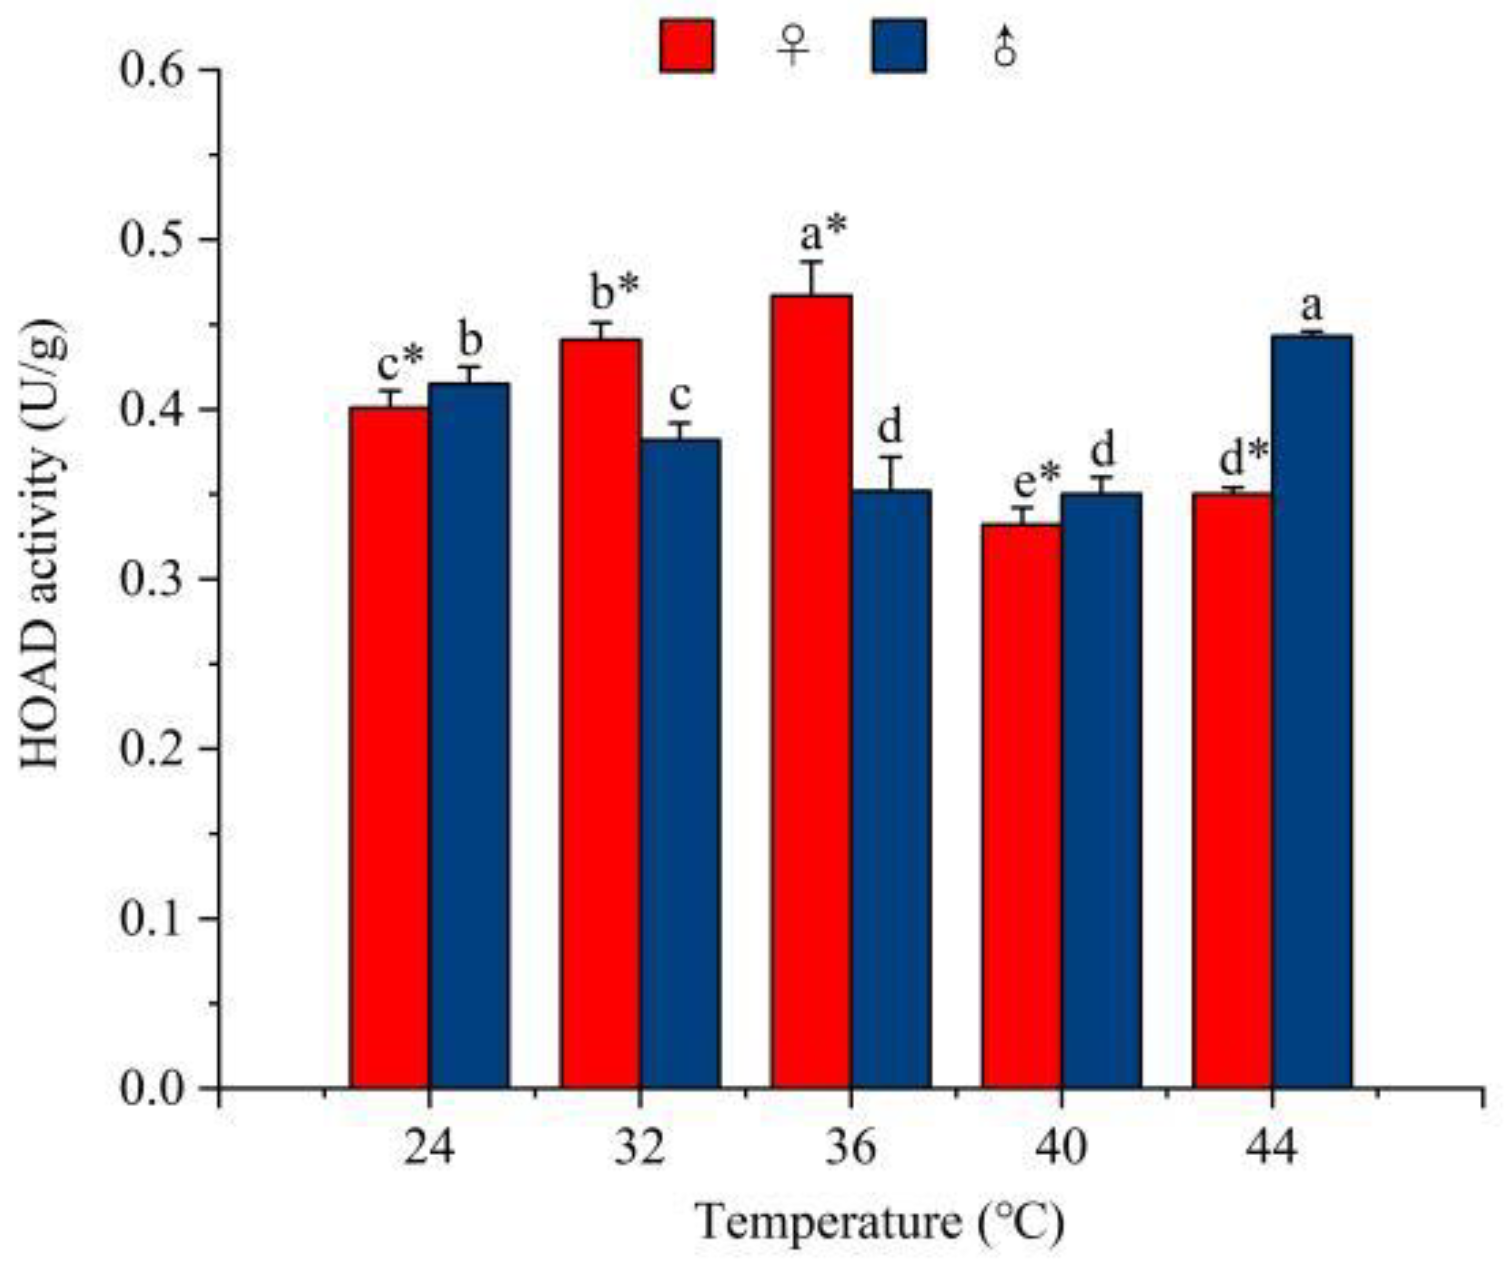
Temperature significantly affected the activities of an enzyme related to lipometabolism (HOAD) in R. pedestris (♀: F = 733.82, p < 0.001; ♂: F = 1083.85, p < 0.001) (Figure 10). A two-factor analysis revealed that temperature was the main factor influencing HOAD activity (Table S4). However, the change trend in male adults’ and female adults’ HOAD activity was inconsistent. The HOAD activities of R. pedestris adults increased at 36 °C and then decreased at 44 °C. HOAD activity in female adults was the highest (0.44 U/g) at 44 °C and the lowest (0.33 U/g) at 40 °C. CS activity in male adults was the highest (0.47 U/g) at 36 °C and the lowest (0.35 U/g0 at 40 °C. From 24 °C to 44 °C, HOAD activities showed significant differences between the female and male adults (p < 0.05).

3.4.5. The Ratio of GAPDH to HOAD Activity in R. pedestris

The activities of the enzymes GAPDH and HOAD were also measured to determine the type of respiratory metabolism energy substance utilization (Table 1). A ratio close to 1.0 suggests that both lipids and carbohydrates are utilized; a ratio less than 1.0 indicates a primary reliance on lipids; and a ratio greater than 1.0 signifies a preference for carbohydrates. Across the temperature range of 24 °C to 44 °C, the activity ratio of GAPDH to HOAD varied from 1.08 to 3.51 in female adults and from 0.90 to 3.37 in male adults of R. pedestris. These ratios suggest that carbohydrates are predominantly used as the energy source for respiration from 24 °C to 40 °C. However, at 44 °C, the ratio was close to 1.0 but less than 1.0. The ratio suggests that adults show a balanced utilization of both carbohydrate and lipid sources, and that lipids are more important than carbohydrates. In the temperature range from 24 °C to 44 °C, this ratio in R. pedestris showed an increase at 32 °C, which indicates that carbohydrate metabolism had increased. Then, the ratio decreased at 44 °C, which indicates that carbohydrate metabolism had decreased and gradually shifted to lipid metabolism.

3.5. The Effect of Temperature on the Activity of Antioxidative Enzymes

3.5.1. The Effect of Temperature on the Activity of Superoxide Dismutase Enzymes

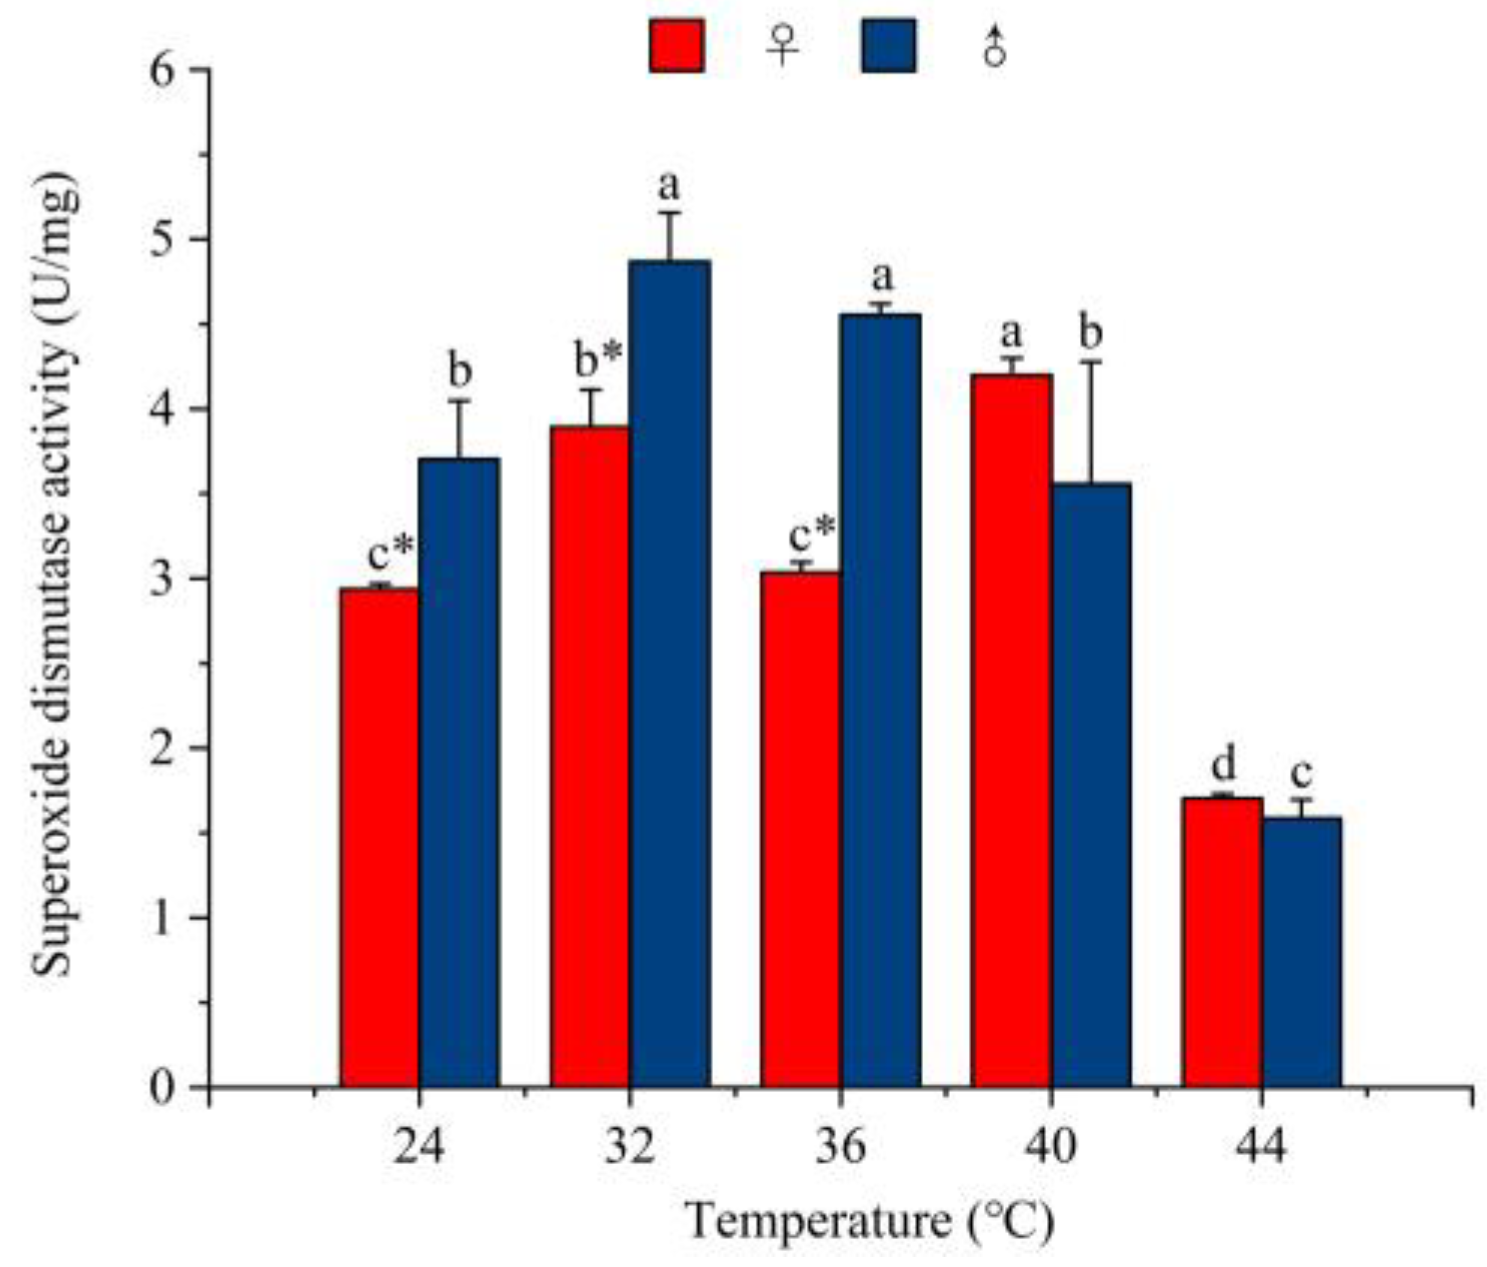
Temperature had a significant impact on the activity levels of the superoxide dismutase enzymes (♀: F = 256.72; p < 0.001; ♂: F = 48.08; p < 0.001) (Figure 11). A two-factor analysis revealed found that temperature was the main factor influencing SOD activity (Table S5). With increasing temperature, SOD activity first increased and then decreased, increased again, and finally decreased. The highest SOD activity in females occurred at 40 °C (4.20 ± 0.10 U/mg), while in males, the highest activity was seen at 32 °C (4.87 ± 0.29 U/mg). There was a significant difference between females and males at 24 °C (p = 0.018), 32 °C (p = 0.001), and 36 °C (p < 0.001).

3.5.2. The Effect of Temperature on the Activity of Peroxidase Enzymes

Temperature had a significant impact on the activity levels of peroxidase enzymes (♀: F = 32.77; p < 0.001; ♂: F = 45.30; p < 0.001) (Figure 12). A two-factor analysis revealed that temperature was the main factor influencing POD activity (Table S5). With increasing temperature, POD activity first decreased and then increased. POD activity at 24 °C and 44 °C was significantly higher than in the range of 32–42 °C. The POD activity in females peaked at 24 °C (4.33 ± 0.08 U/mg), while in males, it peaked at 44 °C (4.58 ± 0.06 U/mg). Significant differences were observed between males and females at 32 °C (p = 0.009), 36 °C (p < 0.001), 40 °C (p = 0.002), and 44 °C (p < 0.001).

3.5.3. The Effect of Temperature on the Activity of Catalase Enzymes

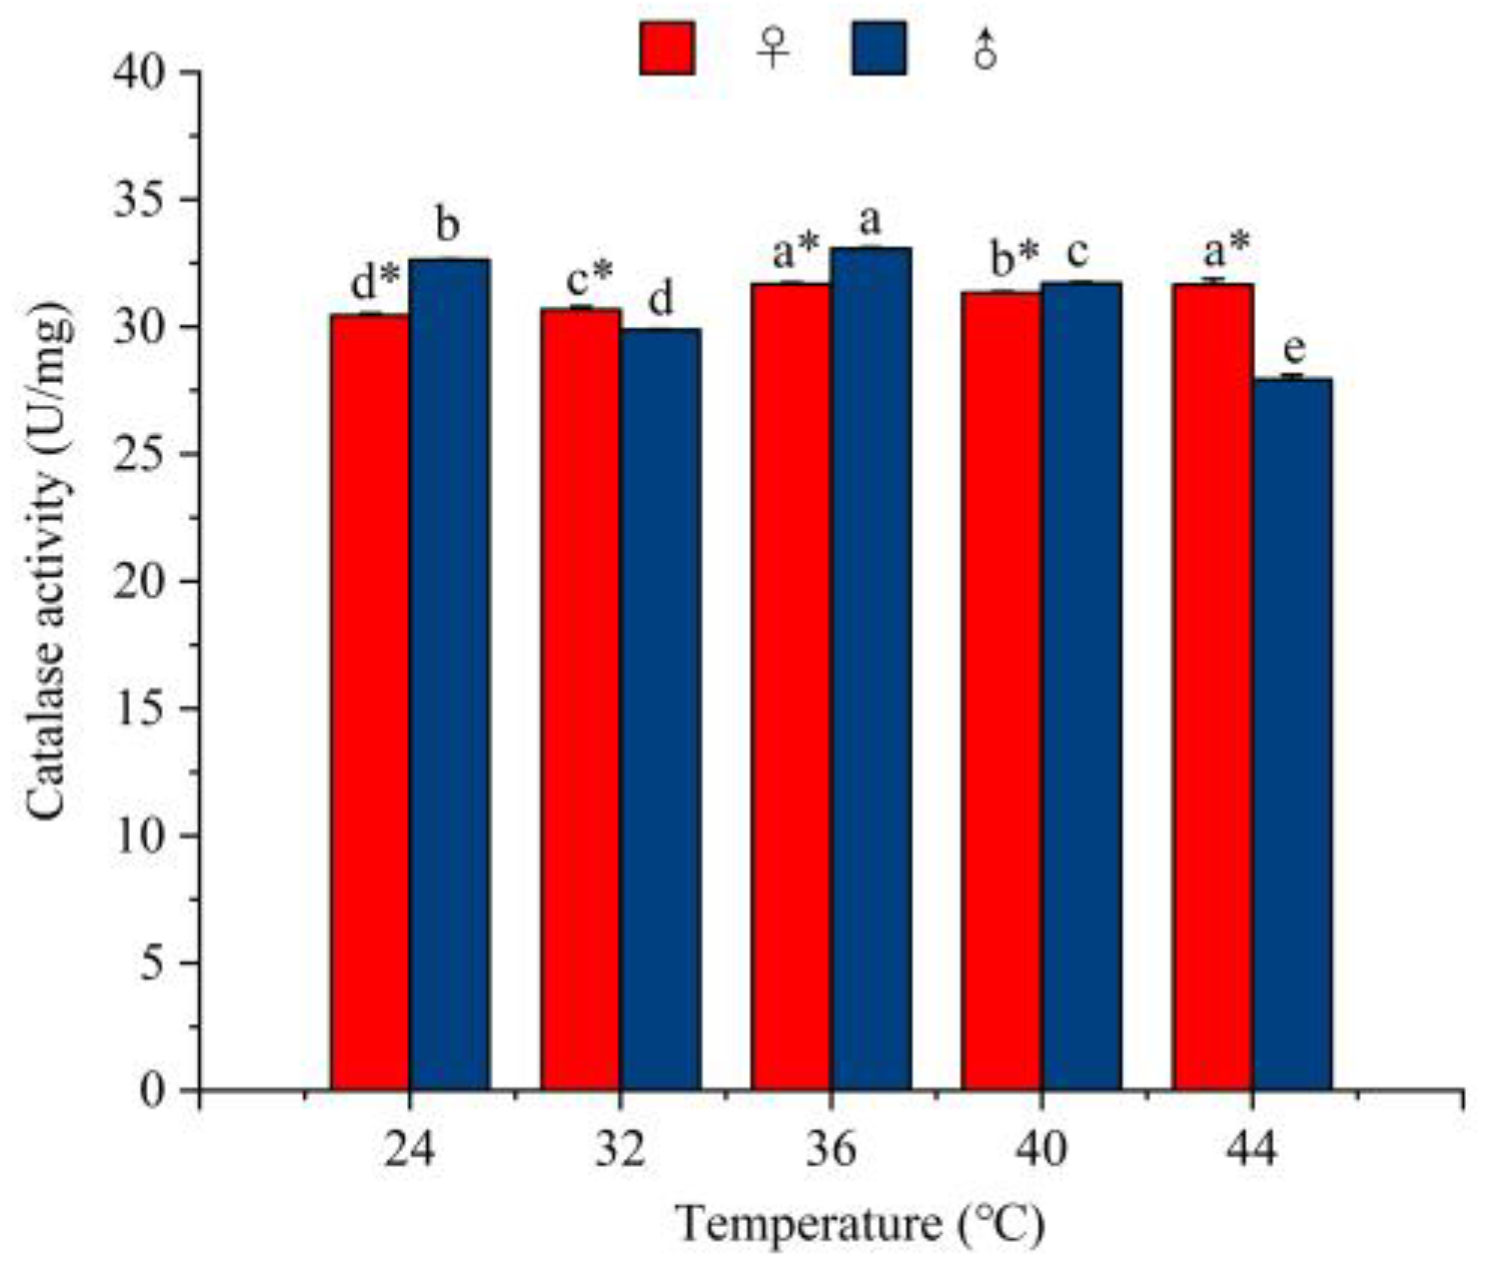
Temperature had a significant impact on the activity levels of catalase enzymes (♀: F = 156.07; p < 0.001; ♂: F = 1452.25; p < 0.001) (Figure 13). A two-factor analysis revealed that temperature was the main factor influencing CAT activity (Table S5). With increasing temperature, CAT activity first increased and then decreased. Peak CAT activity in females occurred at 42 °C (32.81 ± 0.05 U/mg), while in males, it occurred at 36 °C (33.06 ± 0.05 U/mg). Significant differences were observed between males and females at 24 °C (p < 0.001), 32 °C (p < 0.001), 36 °C (p < 0.001), 40 °C (p = 0.001), and 44 °C (p < 0.001).

3.5.4. The Effect of Temperature on the Total Antioxidative Enzyme Capacity

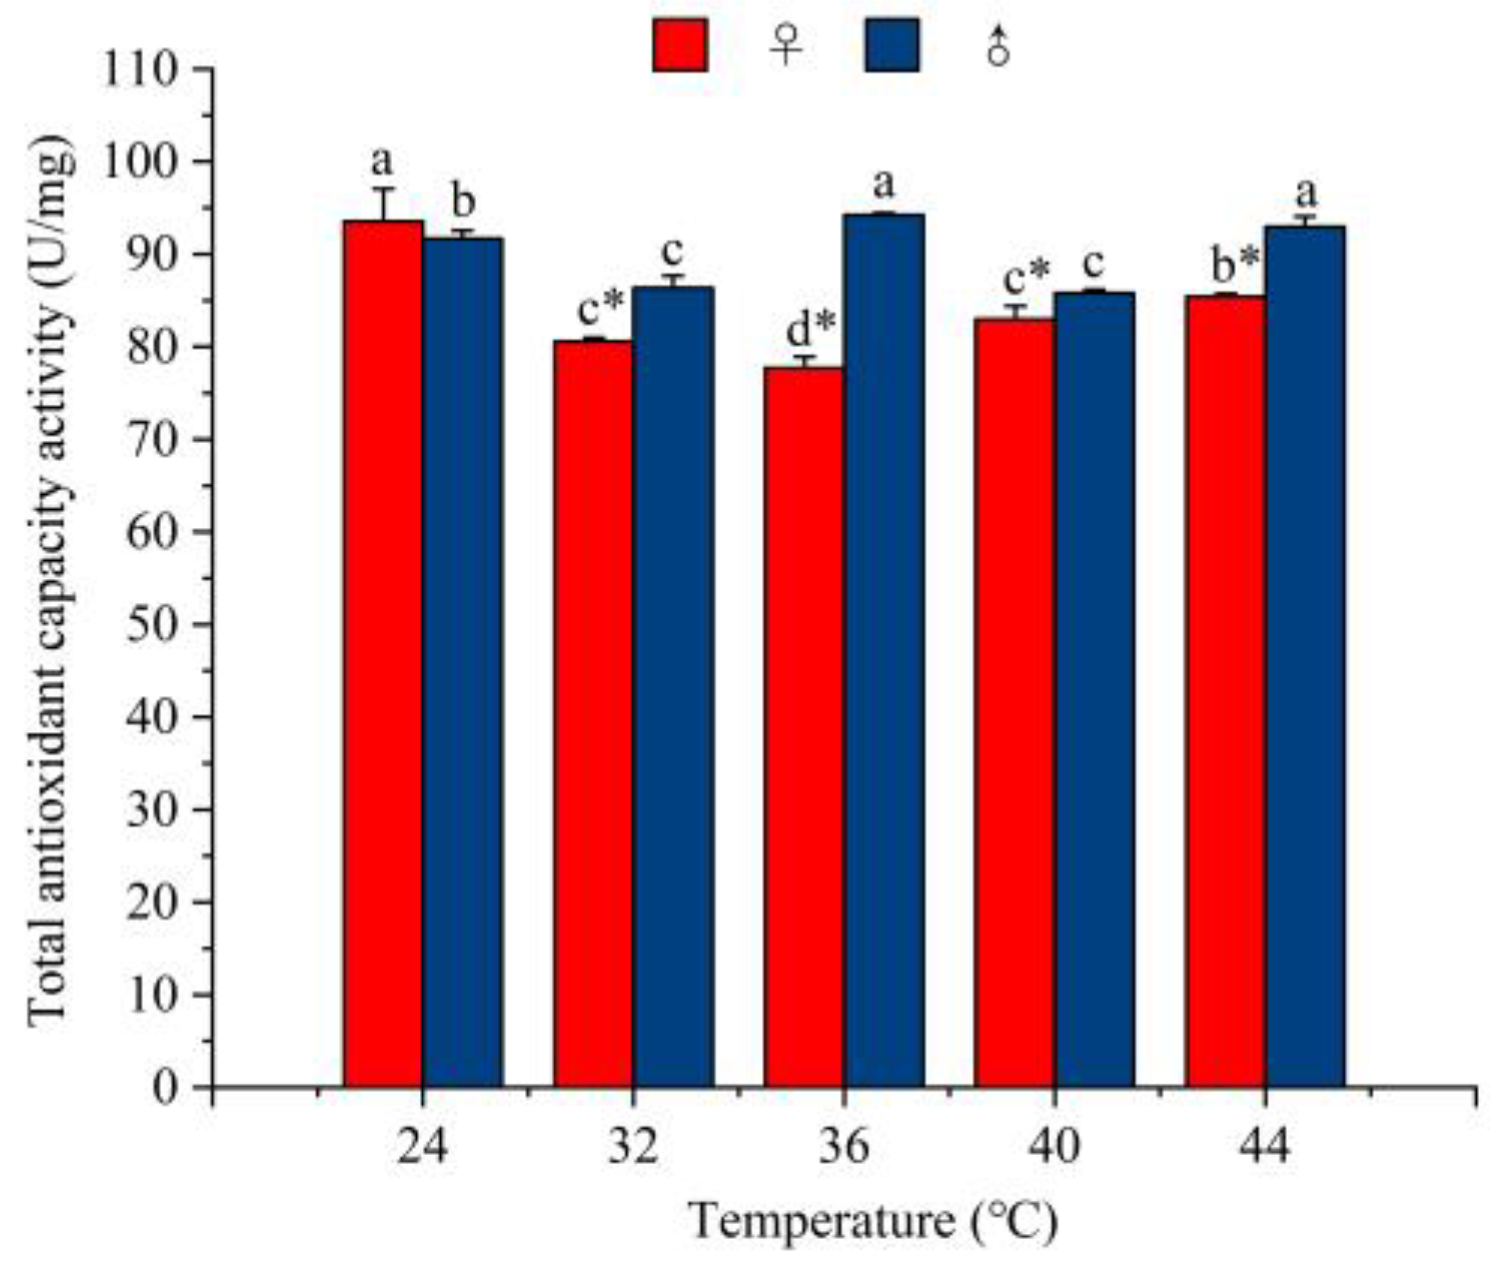
Temperature had a significant impact on the total antioxidative enzyme capacity (♀: F = 53.39; p < 0.001; ♂: F = 80.74; p < 0.001) (Figure 14). A two-factor analysis revealed that temperature was the main factor influencing T-AOC activity (Table S5). As the temperature increased, the T-AOC activity in females first decreased and then increased, while the T-AOC activity in males gradually increased. The highest T-AOC activity in females occurred at 24 °C (93.55 ± 3.50 U/mg), while in males, it occurred at 36 °C (94.22 ± 0.21 U/mg). Significant differences were observed between males and females at 32 °C (p = 0.008), 36 °C (p < 0.001), 40 °C (p = 0.009), and 44 °C (p < 0.001).

3.5.5. The Effect of Temperature on the Activity of Malondialdehyde Enzymes

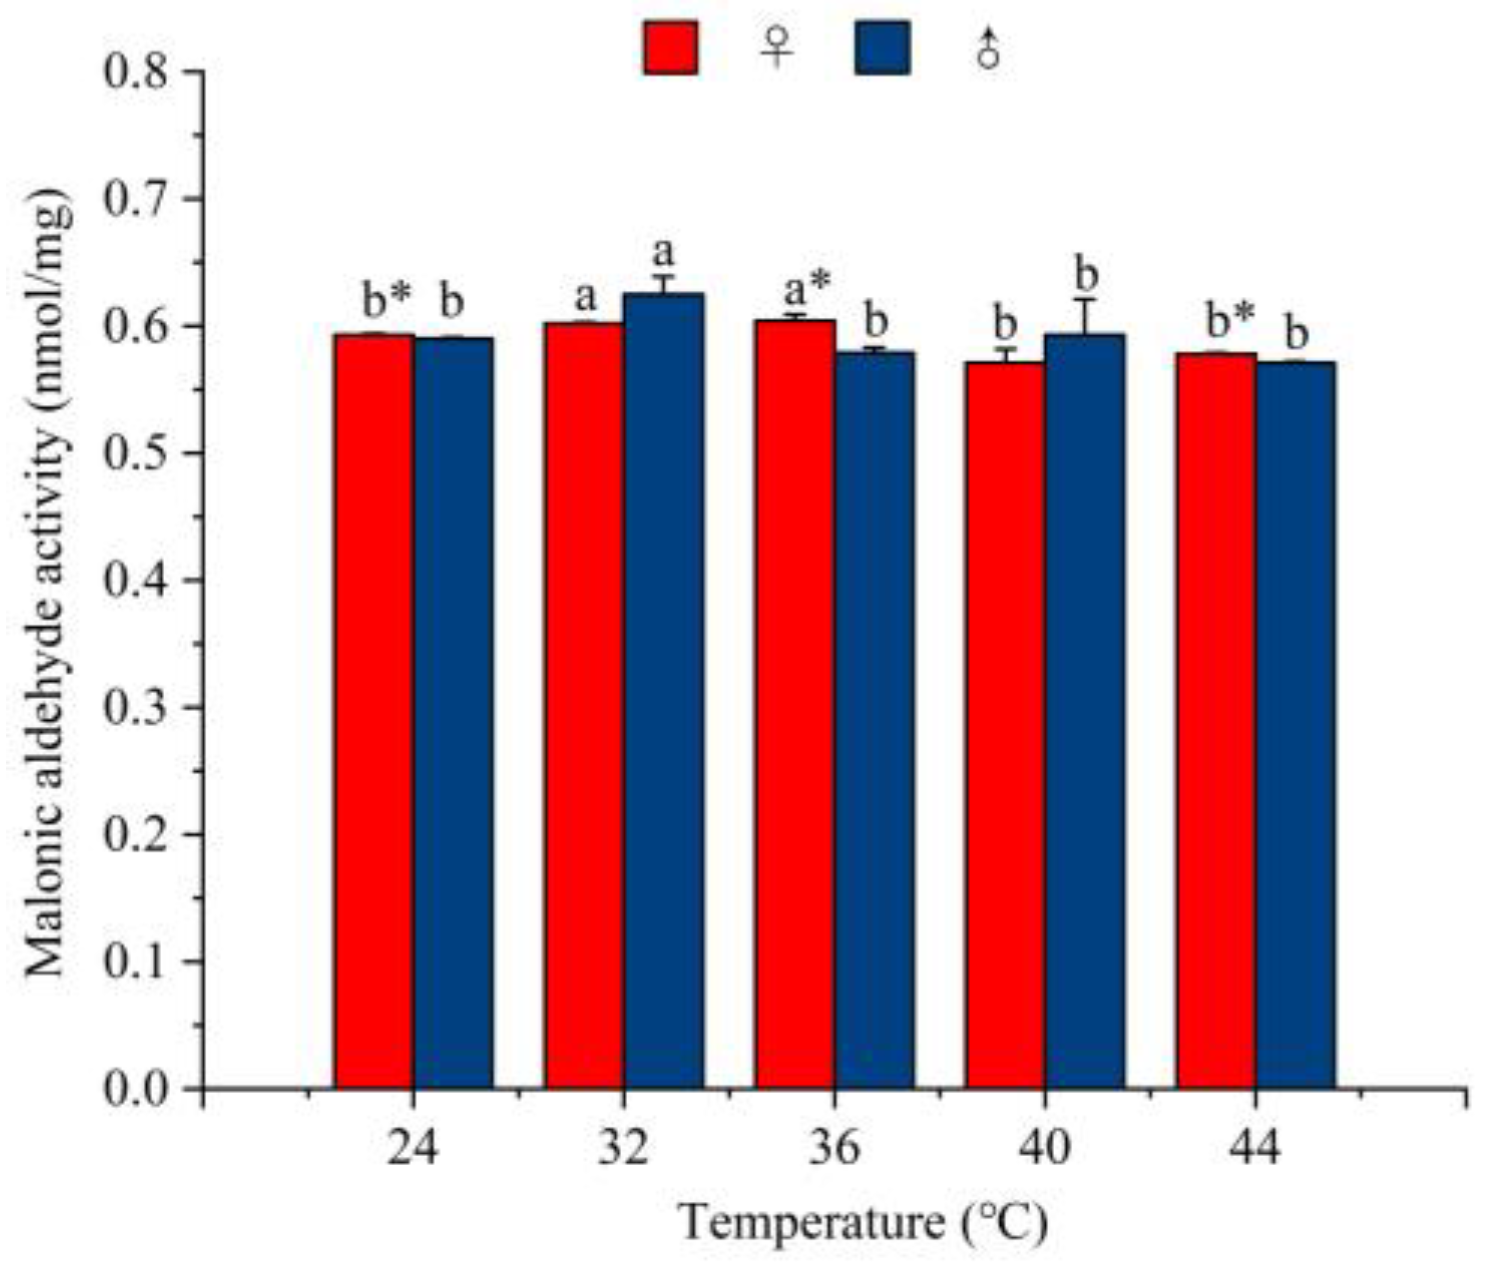
Temperature had a significant impact on the activity levels of malondialdehyde enzymes (♀: F = 24.56; p < 0.001; ♂: F = 4.75; p = 0.006) (Figure 15). A two-factor analysis revealed that temperature was the main factor influencing MDA activity (Table S5). With increasing temperature, MDA activity first increased and then decreased. The highest MDA activity in females occurred at 36 °C (0.60 ± 0.005 nmol/mg), while in males, it occurred at 32 °C (0.63 ± 0.014 nmol/mg). Significant differences were observed between males and females at 24 °C (p < 0.001), 36 °C (p < 0.001), and 44 °C (p < 0.001).

4. Discussion

This study examined changes in body weight, CO2 emissions, nutrients, nutrient metabolism enzymes, and antioxidative enzymes in R. pedestris under hungry conditions at seven different temperatures. The ability of R. pedestris to adjust its body weight, CO2 emissions, nutrient substances, nutrient metabolic enzymes, and antioxidative enzymes collectively illustrates its resilience to thermal variations. Higher temperatures accelerated its utilization of energy substances and the activity of key enzymes in metabolic processes, leading to increased metabolic rates while enhancing the activity of antioxidative enzymes to counteract the oxidative stress induced by elevated temperatures. This suggests that, like many insects, R. pedestris has developed various mechanisms, including behavioral and physiological adaptations, in response to high temperatures [31].
In CO2 release studies, closed systems, open systems, and flow-through systems are used to measure CO2 emissions and O2 [32]. Three methods are used for measurement. Among these, closed systems are not suitable for long-term measurements but are appropriate for rapid measurement experiments, and the data are easy to calculate directly [33]. Open systems are suitable for long-term testing experiments, but they rarely appear in research reports due to factors such as airflow and computational complexity. At present, flow-through systems are widely used in respiratory measurement experiments because they combine the advantages of closed systems and open systems. However, flow-through systems cannot provide continuous measurements in insects [34,35]. Thus, to observe long-term changes in R. pedestris, we chose a closed system. CO2 emissions tended to first increase and then decrease with increasing temperature in females. However, CO2 emissions increased with increasing temperature in males. Many researchers have found that insects can also adapt to environmental changes by regulating CO2 emissions [36].
Our results revealed that the fat content varied significantly with temperature, peaking at 44 °C for females and 32 °C for males, underscoring the importance of fat storage and utilization in coping with high temperatures. Insects rely on lipids and carbohydrates as essential metabolic reserves, especially when adapting to changes in environmental temperature. Lipids act as long-term energy stores [37], while carbohydrates like glycogen and trehalose serve a more immediate role, providing quick energy reserves to help the insect cope with stress [38,39]. High temperatures significantly impact lipid and carbohydrate metabolism, making them central to energy production and utilization. When carbohydrate metabolism becomes less efficient or energy costs increase, fat serves as the primary alternative energy source. Similarly, the carbohydrate content fluctuated with temperature. The total carbohydrate contents increased with rising temperatures, peaking at 44 °C, while the glycogen contents peaked at 36 °C before declining. These findings suggest that R. pedestris adjusts carbohydrate storage and utilization to meet increased metabolic demands under high-temperature conditions, illustrating its ability to adapt to high temperatures.
Furthermore, high temperatures significantly affect the metabolic pathways of lipids and carbohydrates in R. pedestris, driving shifts in energy use. Under high-temperature stress, lipid oxidation accelerates and glycogen consumption increases, shifting the energy balance toward rapid glucose release. High temperatures significantly impact Hyphantria cunea, as lipid consumption peaks during the early stages of diapause [37]. These metabolic changes are regulated by key enzymes involved in glycolysis, gluconeogenesis, and fatty acid metabolism, as well as by the upregulation of genes encoding heat shock proteins (HSPs). High temperatures trigger significant metabolic changes in insects, such as altered gene expression in Mythimna loreyi, which affects fatty acid biosynthesis and carbohydrate metabolism, and the increased expression of heat shock proteins (HSPs) in Bombyx mori protects cells from damage [40,41]. Additionally, heat exposure boosts trehalose accumulation in Glyphodes pyloalis, enhancing their survival under stress [42]. However, prolonged exposure to high temperatures can lead to the depletion of glycogen and lipid reserves, severely impacting energy stores and reducing reproductive success. These findings underline the delicate balance between lipid and carbohydrate metabolism and their regulation by specific genes in response to heat stress.
Most of the pathways associated with energy metabolism include glycolysis, the TCA, fatty acid β-oxidation, glycerol metabolism, lipid metabolism, and so on. The activities of five enzymes can be used to indicate the capacity of the main energy-producing pathways associated with these enzymes. GAPDH and GDH, as enzymes of carbohydrate metabolism, participate in the glycolysis pathway by catalyzing and reducing nicotinamide adenine dinucleotide (NAD+), and their activities can represent the activity of the glycolysis pathway [43,44,45]. CS is involved in the TCA, in which carbohydrates, lipids, and amino acids in the body are thoroughly oxidized for energy, and its enzyme activity is one of those that regulate the functioning of this cycle [46]. LDH is involved in pyruvate catalysis and catalyzes the conversion of lactate to pyruvate, which is an enzyme in anaerobic glycolysis, and its activity reflects insects’ capacity for anaerobic metabolism [44,47]. HOAD is involved in fatty acid oxidation and catalyzes the third step in the beta-oxidation of fatty acids. Thus, the activity of HOAD is responsive to the level of metabolism of insect fat [43,44,45]. High temperatures can disrupt metabolic processes by affecting enzyme activities. For instance, elevated temperatures can enhance glycolysis by increasing GAPDH activity, which accelerates the conversion of glucose to pyruvate. However, prolonged heat exposure may reduce GDH activity, impairing carbohydrate metabolism and limiting energy production [44]. High temperatures can also influence the TCA by modulating CS activity, potentially increasing the oxidation of carbohydrates, lipids, and amino acids under stress. In anaerobic conditions, heat stress can boost LDH activity, promoting anaerobic metabolism. Additionally, heat exposure can intensify fatty acid β-oxidation by increasing HOAD activity, which supports higher energy demands. The key carbohydrate pathway enzymes GAPDH and GDH initially increase with rising temperatures and then decrease, reflecting carbohydrate metabolism changes. The protein pathway enzyme CS shows fluctuating activity trends, indicating shifts in protein metabolism. The lipid pathway enzyme HOAD peaks at intermediate temperatures and then declines, highlighting changes in lipid utilization. When the temperature rose and R. pedestris was subjected to high-temperature environmental stress, the metabolic rate of energy substances in R. pedestris increased, its life activity was vigorous, and its ability to utilize carbohydrates and lipids was gradually strengthened. However, when the temperature exceeded a certain range, the corresponding enzyme activities were reduced, the metabolic rate of energy substances slowed down, and the life activity was weakened.
In addition, the ratio of enzyme activities involved in fatty acid metabolism and glycolysis can indicate the balance of energy sources used for energy production [48]. For example, a ratio of GAPDH to HOAD activity of greater than 1.0 indicates a preference for carbohydrate metabolism, whereas a ratio of less than 1 indicates a reliance on lipid metabolism. A ratio close to 1 indicates a balanced use of both carbohydrate and lipid sources [44,45]. In Calliphora erythrocephala (Diptera) and Mythimma separata (Lepidoptera), the primary metabolic resource is carbohydrates [32]. However, in Gomphocerus sibiricus (Orthoptera), while the ratio may indicate carbohydrate consumption, females exhibit both carbohydrate and lipid utilization under high-temperature conditions [43]. In these studies, insects usually use carbohydrates as a source of energy. However, when insects are challenged, they use lipids as an energy source to respond to environmental challenges. Changes in energy metabolism under heat stress not only affect insect survival but may also be directly linked to adjustments in reproductive strategies [19,45]. Studies have shown that under high-temperature conditions, insects tend to mobilize lipids as the primary energy source, reducing carbohydrate metabolism, while protein metabolism is more involved in cellular repair and the synthesis of heat shock proteins as part of the stress response [49]. Due to their reproductive roles, females may rely more heavily on lipid reserves under heat stress to support ovarian development and yolk formation.
Changes in antioxidative enzyme activity is one of the key physiological responses to temperature variations. Under high-temperature stress, insects experience oxidative damage, which trigger oxidative stress responses [11]. To mitigate and eliminate intracellular reactive oxygen species (ROS), insects possess antioxidative defense mechanisms to prevent damage to lipids, proteins, and DNA [11]. The antioxidative enzymes in insects, including superoxide dismutase (SOD), catalase (CAT), and peroxidase (POD), help eliminate excess ROS within cells [50]. In R. pedestris, POD activity increases from 24 °C to 36 °C and then decreases from 36 °C to 44 °C. SOD activity increases from 24 °C to 40 °C and then decreases from 40 °C to 44 °C. CAT activity consistently decreases from 24 °C to 44 °C. SOD activity in Ophraella communa significantly decreased at 44 °C [11]. While insects respond to oxidative stress caused by elevated temperatures by increasing SOD activity, extremely high temperatures and oxidative damage may lead to a decline in SOD activity, inhibiting the insect’s antioxidative capacity. At lower temperatures, the ROS produced in insects do not yet fully activate the antioxidative system; however, as the high-temperature stress intensifies, the accumulation of hydrogen peroxide stimulates the synthesis of POD to protect cells from oxidative damage. However, under extremely high temperatures, despite the increase in POD activity to cope with oxidative damage, the insect’s physiological functions are still impaired [50]. As the high-temperature stress intensifies, the insect’s antioxidative enzyme system begins to be enhanced. Although CAT activity shows no significant change, the antioxidative system gradually adapts to the excess ROS, stabilizing CAT activity and maintaining a certain level of stability in the antioxidative system. However, in Propylaea japonica, CAT activity increases under high-temperature conditions [51]. T-AOC and MDA are important indicators for measuring lipid peroxidation and antioxidative capacity in insects, revealing the balance between oxidative damage and antioxidative ability under high-temperature stress. MDA is a product of lipid peroxidation and reflects the extent of oxidative damage to cell membranes and other cellular macromolecules. In R. pedestris, the T-AOC increases from 24 °C to 36 °C and then decreases from 36 °C to 44 °C. MDA activity decreases from 24 °C to 44 °C. Under high-temperature stress, insects experience severe oxidative damage, which exceeds the capacity of their antioxidative defense and repair systems [52]. The T-AOC activity in insects increases with the activity of antioxidative enzymes (such as SOD, CAT, and POD), helping to eliminate excess ROS in the body and reducing oxidative damage. However, under extremely high temperatures, insects cannot effectively cope with the heat stress, increasing the risk of oxidative damage. Our research shows that there are significant differences in energy metabolism between male and female insects. Between female and male adults, we found that male adults’ CO2 emissions and body weight show gender-specific trends. In contrast, female adults are more sensitive to temperature changes. This would suggest that the hemolymph CO2 buffering capacity of males is greater than that of females or that males do not maintain their open-phase volumes close to the maximum. This suggests that there are other factors that allow male R. pedestris to adapt to higher temperatures than females [53,54]. The weight of R. pedestris reflects energy trade-offs during thermal adaptation. Both genders experienced weight loss at high temperatures, with the lowest recorded at 40 °C. This decrease aligns with a metabolic shift to lipid utilization and increased energy costs to maintain physiological functions. Gender-specific differences highlight the role of reproductive and metabolic strategies. Females that are larger in size showed greater weight fluctuations due to reproductive energy demands, prioritizing reproduction over energy storage even under extreme conditions. Significant weight differences were observed between genders at 32 °C, 36 °C, and 40 °C, emphasizing the impact of temperature on their metabolic responses. With the intensification of global warming, the temperature variations that insects face are expected to become more extreme, possibly widening the gender-based differences in their adaptive capacities [55]. Rising global temperatures will force insects to endure higher temperatures, increasing the strain on both male and female insects regarding their energy metabolism and reproduction, especially for species already vulnerable to temperature shifts [56,57]. Future research should consider using open or flow-through systems to study respiratory metabolism in R. pedestris [58,59]. In addition, we will further investigate the effects of high temperatures on insect metabolic pathways and genes, providing a more comprehensive explanation of how insects adapt to heat from an omics perspective. This research will help to clarify the underlying mechanisms of temperature adaptation in insects.
Male and female insects often exhibit notable differences in their responses to heat stress, which can significantly affect individual survival and population dynamics [19,49]. This sex-based difference may reflect divergent energy metabolism strategies between males and females. During the reproductive period, females typically require more energy to support egg development and oviposition, which may result in a higher basal metabolic rate and, consequently, greater CO2 emissions under relatively moderate temperatures [36]. Additionally, differences in the system structure or hormone levels between sexes may influence the metabolic rate. In Bemisia tabaci and Apolygus lucorum, males generally show higher expression levels of the HSP40 gene compared with females, potentially granting them better tolerance to elevated temperatures [60,61]. This disparity may stem from the higher sensitivity of female reproductive systems to thermal damage, potentially limiting their reproductive output and, consequently, slowing population growth.
The metabolic adaptability of R. pedestris to temperature provides valuable insights for pest management strategies. Understanding its thermal thresholds and energy utilization patterns is crucial for controlling its population growth. Interventions at moderate temperatures dominated by carbohydrate metabolism or the development of inhibitors targeting lipid and carbohydrate metabolism could enhance pest control efficiency. Additionally, they provide a foundation for forecasting the ability of R. pedestris to adapt to climate change, as temperature-driven changes in its development and reproduction affect soybean yield and quality. In conclusion, the ability of R. pedestris to adjust its energy metabolism under heat stress—particularly through enhanced lipid and carbohydrate metabolism—indicates its adaptability to warmer climates. These adjustments might help the pest survive under elevated temperatures, posing challenges for pest control in the context of climate change. These findings highlight the importance of integrating metabolic insights into pest management strategies to address the impact of climate change on pests.

5. Conclusions

In conclusion, temperature plays a crucial role in regulating the energy metabolism of R. pedestris, whereby high temperatures were found to significantly impact their body weight, CO2 emissions, nutrient substances, nutrient metabolic enzymes, and antioxidative enzymes. The nutrient content fluctuated with increasing temperature, and the carbohydrate content reached its peak at 44 °C. Enzyme activities fluctuated with thermal conditions, indicating a shift from carbohydrate to lipid metabolism at higher temperatures. Antioxidative enzyme activity can eliminate free radicals and reduce oxidative damage, demonstrating some ability to repair oxidative damage. These findings highlight the profound effects of temperature on the physiological responses of R. pedestris.

Supplementary Materials

The following supporting information can be downloaded at: https://www.mdpi.com/article/10.3390/agronomy15061300/s1, Figure S1: Schematic diagram of the experimental apparatus. Table S1: Statistical analysis of the effects of temperature and sex on the weight of Riptortus pedestris. Table S2: Statistical analysis of the effects of temperature and sex on CO2 emissions in Riptortus pedestris. Table S3: Statistical analysis of the effects of temperature and sex on the nutrient substance content in Riptortus pedestris. Table S4: Statistical analysis of the effects of temperature and sex on nutrient metabolic enzymes in Riptortus pedestris. Table S5: Statistical analysis of the effects of temperature and sex on antioxidative enzymes in Riptortus pedestris.

Author Contributions

Conceptualization, Y.G.; methodology, Y.G.; investigation, X.L., Y.N., X.C. and Y.C.; data curation, X.L., Y.N. and S.C.; writing—original draft preparation, X.L., Y.G., Y.N., S.C., X.C. and Y.C.; writing—review and editing, X.L., S.S. and Y.G.; funding acquisition, S.S. and Y.G. All authors have read and agreed to the published version of the manuscript.

Funding

This work was financially supported by the Earmarked Fund for the China Agriculture Research System (Grant No. CARS04) and the College Students’ Innovative Entrepreneurial Training Plan Program of Jilin Province (Grant No. S202410193156).

Data Availability Statement

All data are contained within this article or Supplementary Materials.

Acknowledgments

We would like to express our gratitude to Long Wang for helping us to manage the plants in the greenhouse.

Conflicts of Interest

The authors declare no conflicts of interest.

References

  1. Chloé, L. Recent advances in insect thermoregulation. J. Exp. Biol. 2023, 226, jeb245751. [Google Scholar] [CrossRef]
  2. Heinrich, E.; Bradley, T. Temperature-dependent variation in gas exchange patterns and spiracular control in Rhodnius prolixus. J. Exp. Biol. 2014, 217, 2752–2760. [Google Scholar] [CrossRef]
  3. Cairns, S.C. Growth energetics in relation to temperature of the larvae of Rhopaea verreauxi (Coleoptera: Scarabaeidae). Oecologia 1982, 54, 32–40. [Google Scholar] [CrossRef] [PubMed]
  4. Greenlee, K.J.; Harrison, J.F. Development of respiratory function in the American locust Schistocerca americana. II. Within-instar effects. J. Exp. Biol. 2004, 207, 509–517. [Google Scholar] [CrossRef]
  5. Rostgaard, S.; Jacobsen, D. Respiration rate of stream insects measured in situ along a large altitude range. Hydrobiologia 2005, 549, 79–98. [Google Scholar] [CrossRef]
  6. Vogt, J.; Appel, A. Metabolic costs of spontaneous movement in the red imported fire ant, Solenopsis invicta (Hymenoptera: Formicidae). Sociobiology 2000, 35, 89–98. [Google Scholar] [CrossRef]
  7. Zhu, L.; Wang, L.; Ma, C.S. Sporadic short temperature events cannot be neglected in predicting impacts of climate change on small insects. J. Insect Physiol. 2019, 112, 48–56. [Google Scholar] [CrossRef]
  8. Zhou, J.; Luo, W.; Song, S.; Wang, Z.; Zhu, X.; Gao, S.; He, W.; Xu, J. The impact of high-temperature stress on the growth and development of Tuta absoluta (Meyrick). Insects 2024, 15, 423. [Google Scholar] [CrossRef]
  9. Cui, X.H.; Wan, F.H.; Xie, M.; Liu, T.X. Effects of heat shock on survival and reproduction of two whitefly species, Trialeurodes vaporariorum and Bemisia tabaci biotype B. J. Insect Sci. 2018, 8, 24. [Google Scholar] [CrossRef]
  10. Yu, C.; Zhao, R.; Zhou, W.; Pan, Y.; Tian, H.; Yin, Z.; Chen, W. Fruit fly in a challenging environment: Impact of shortterm temperature stress on the survival, development, reproduction, and trehalose metabolism of Bactrocera dorsalis (Diptera: Tephritidae). Insects 2022, 13, 753. [Google Scholar] [CrossRef]
  11. Chen, H.; Solangi, G.S.; Guo, J.; Wan, F.H.; Zhou, Z.S. Antioxidant responses of ragweed leaf beetle Ophraella communa (Coleoptera: Chrysomelidae) exposed to thermal stress. Front. Physiol. 2018, 9, 808. [Google Scholar] [CrossRef] [PubMed]
  12. Fu, S.; Chen, X.; Wang, K.; Chen, J.; Zhou, J.; Yi, W.; Lyu, M.; Ye, Z.; Bu, W. Shared phylogeographic patterns and environmental responses of co-distributed soybean pests: Insights from comparative phylogeographic studies of Riptortus pedestris and Riptortus linearis in the subtropics of East Asia. Mol. Phylogenet. Evol. 2024, 195, 108055. [Google Scholar] [CrossRef] [PubMed]
  13. Zhang, H.; Wang, Y.; Wang, Z.; Ding, W.; Xu, K.; Li, L.; Wang, Y.; Li, J.; Yang, M.; Liu, X.; et al. Modelling the current and future potential distribution of the bean bug Riptortus pedestris with increasingly serious damage to soybean. Pest Manag. Sci. 2022, 78, 4340–4352. [Google Scholar] [CrossRef]
  14. Gao, Y.; Chen, L.; Hu, Y.L.; Tian, X.Y.; Wang, Y.Y.; Wang, Z.J.; Zhao, Y.J.; Li, J.B.; Shi, S.S. Laboratory evaluation of leguminous plants for the development and reproduction of the bean bug Riptortus pedestris (Hemiptera: Alydidae). Entomol. Sci. 2022, 25, e12525. [Google Scholar] [CrossRef]
  15. Li, K.; Zhang, X.X.; Guo, J.Q.; Penn, H.; Wu, T.T.; Li, L.; Jiang, H.; Chang, L.D.; Wu, C.X.; Han, T.F. Feeding of Riptortus pedestris on soybean plants, the primary cause of soybean staygreen syndrome in the Huang-Huai-Hai river basin. Crop. J. 2019, 7, 360–367. [Google Scholar] [CrossRef]
  16. Ji, P.; Yuan, X.; Ma, F.; Xu, Q.B. Drivers of long-term changes in summer compound hot extremes in China: Climate change, urbanization, and vegetation greening. Atmos. Res. 2024, 310, 107632. [Google Scholar] [CrossRef]
  17. Li, W.; Gao, Y.; Hu, Y.; Chen, J.; Zhang, J.; Shi, S. Field cage assessment of feeding damage by Riptortus pedestris on soybeans in China. Insects 2021, 12, 255. [Google Scholar] [CrossRef] [PubMed]
  18. Shan, S.Q.; Huang, Y.; Guo, C.Y.; Hu, B.; Zhang, H.H.; Li, Y.J.; Chen, J.P.; Wei, Z.Y.; Sun, Z.T. A salivary secretory protein from Riptortus pedestris facilitates pest infestation and soybean staygreen syndrome. Mol. Plant Pathol. 2023, 24, 560–569. [Google Scholar] [CrossRef]
  19. Tian, X.Y.; Gao, Y.; Ali, M.Y.; Li, X.H.; Hu, Y.L.; Li, W.B.; Wang, Z.J.; Shi, S.S.; Zhang, J.P. Impact of temperature on age-stage, two-sex life table analysis of a Chinese population of bean bug, Riptortus pedestris (Hemiptera: Alydidae). Agriculture 2022, 12, 1505. [Google Scholar] [CrossRef]
  20. Ahn, J.; Choi, K. Effects of temperature on the development, fecundity, and life table parameters of Riptortus pedestris (Hemiptera: Alydidae). Appl. Entomol. Zool. 2019, 54, 63–74. [Google Scholar] [CrossRef]
  21. Ahn, J.; Choi, K. Population parameters and growth of Riptortus pedestris (Fabricius) (Hemiptera: Alydidae) under fluctuating temperature. Insects 2022, 13, 113. [Google Scholar] [CrossRef] [PubMed]
  22. Du, B.; Ding, D.; Ma, C.; Guo, W.; Kang, L. Locust density shapes energy metabolism and oxidative stress resulting in divergence of flight traits. Proc. Natl. Acad. Sci. USA 2022, 119, e2115753118. [Google Scholar] [CrossRef] [PubMed]
  23. Lighton, J.R.B.; Halsey, L.G. Flow-through respirometry applied to chamber systems: Pros and cons, hints and tips. Comp. Biochem. Physiol. A. Mol. Integr. Physiol. 2011, 158, 265–275. [Google Scholar] [CrossRef]
  24. Kibar, H. CO2 respiration rates of einkorn wheat at different temperature and moisture contents. Turk. J. Agric. For. 2021, 45, 179–190. [Google Scholar] [CrossRef]
  25. Colinet, H.; Vernon, P.; Hance, T. Does thermal-related plasticity in size and fat reserves influence supercooling abilities and cold-tolerance in Aphidius colemani (Hymenoptera: Aphidiinae) mummies? J. Therm. Biol. 2007, 32, 374–382. [Google Scholar] [CrossRef]
  26. Fu, Y.; Wu, T.; Yu, H.; Xu, J.; Zhang, J.Z.; Fu, D.Y.; Ye, H. The transcription of flight energy metabolism enzymes declined with aging while enzyme activity increased in the long-distance migratory moth, Spodoptera frugiperda. Insects 2022, 13, 936. [Google Scholar] [CrossRef]
  27. Gunn, A.; Gatehouse, A.G. The development of enzymes involved in flight muscle metabolism in Spodoptera exempta and Mythimna separata. Comp. Biochem. Physiol. 1988, 91, 315–324. [Google Scholar] [CrossRef]
  28. Zebe, E.C.; McShan, W.H. Lactic and alpha-glycerophosphate dehydrogenases in insects. J. Gen. Physiol. 1957, 40, 779–790. [Google Scholar] [CrossRef]
  29. O’Brien, D.M.; Suarez, R.K. Fuel use in hawkmoth (Amphion floridensis) flight muscle: Enzyme activities and flux rates. J. Exp. Zool. 2001, 290, 108–114. [Google Scholar] [CrossRef]
  30. Schimpf, N.G.; Matthews, P.G.D.; White, C.R. Cockroaches that exchange respiratory gases discontinuously survive food and water restriction. Evolution 2012, 66, 597–604. [Google Scholar] [CrossRef]
  31. Stavrianakis, G.; Sentas, E.; Zafeirelli, S.; Tscheulin, T.; Kizos, T. Utilizing Olive Fly Ecology Towards Sustainable Pest Management. Biology 2025, 14, 125. [Google Scholar] [CrossRef] [PubMed]
  32. Beenakkers, A.M. Carbohydrate and fat as a fuel for insect flight: A comparative study. J. Insect Physiol. 1969, 15, 353–361. [Google Scholar] [CrossRef] [PubMed]
  33. Steffensen, J.F. Some errors in respirometry of aquatic breathers: How to avoid and correct for them. Fish Physiol. Biochem. 1989, 6, 49–59. [Google Scholar] [CrossRef]
  34. Malte, C.L.; Nørgaard, S.; Wang, T. Closed system respirometry may underestimate tissue gas exchange and bias the respiratory exchange ratio (RER). Comp. Biochem. Physiol. A 2016, 192, 17–27. [Google Scholar] [CrossRef]
  35. Lighton, J.R.B.; Ottesen, E.A. To DGC or not to DGC: Oxygen guarding in the termite Zootermopsis nevadensis (Isoptera: Termopsidae). J. Exp. Biol. 2005, 208, 4671–4678. [Google Scholar] [CrossRef] [PubMed]
  36. Slăma, K. A new look at discontinuous respiration in pupae of Hyalophora cecropia (Lepidoptera: Saturniidae): Haemocoelic pressure, extracardiac pulsations and O2 consumption. Eur. J. Endocrinol. 2010, 107, 487–507. [Google Scholar] [CrossRef]
  37. Zhao, L.; Wang, X.; Liu, Z.; Torson, A.S. Energy consumption and cold hardiness of diapausing fall webworm pupae. Insects 2022, 13, 853. [Google Scholar] [CrossRef]
  38. Storey, K.B.; Storey, J.M. Insect cold hardiness: Metabolic, gene, and protein adaptation. Can. J. Zool. 2012, 90, 456–475. [Google Scholar] [CrossRef]
  39. Storey, K.B.; Storey, J.M. Metabolic rate depression in animals: Transcriptional and translational controls. Biol. Rev. Camb. Philos. Soc. 2007, 79, 207–233. [Google Scholar] [CrossRef]
  40. Duan, Y.; Chen, Q.; Bilal, M.; Wu, Y.; Gong, Z.; Wu, R.; Miao, J. Comparative transcriptome analysis reveals different responses in three developmental stages of Mythimna loreyi to cold stress. Insects 2024, 15, 554. [Google Scholar] [CrossRef]
  41. Liu, Z.; Li, C.; Yang, W.; Wu, Q.; Xiao, W.; Zhu, Y.; Wei, Q.; Dong, Z.; Zhang, G.; Lu, C.; et al. The Bombyx mori singed gene is involved in the high-temperature resistance of silkworms. Insects 2024, 15, 264. [Google Scholar] [CrossRef] [PubMed]
  42. Sinclair, B.J.; Amanda, J.B.; Tom, T.; Joseph, L.T.; David, J.H. Metabolic rate does not decrease with starvation in Gryllus bimaculatus when changing fuel use is taken into account. Physiol. Entomol. 2011, 36, 84–89. [Google Scholar] [CrossRef]
  43. Wilmsen, S.M.; Dzialowski, E. Substrate use and temperature effects in flight muscle mitochondria from an endothermic insect, the hawkmoth Manduca sexta. Comp. Biochem. Phys. A 2023, 281, 111439. [Google Scholar] [CrossRef]
  44. Kim, K.N.; Sin, U.C.; Yun, C.N.; Song, H.S.; Huang, Z.J.; Huang, Q.Y.; Lei, C.L. Influence of green light illumination on several enzymes involved in energy metabolism in the oriental armyworm, Mythimna separata (Lepidoptera: Noctuidae). J. Asia-Pac. Entomol. 2019, 22, 487–492. [Google Scholar] [CrossRef]
  45. Zera, A.J.; Sall, J.; Otto, K. Biochemical aspects of flight and flightlessness in Gryllus: Flight fuels, enzyme activities and electrophoretic profiles of flight muscles from flight-capable and flightless morphs. J. Insect Physiol. 1999, 45, 275–285. [Google Scholar] [CrossRef]
  46. Madern, D. Molecular evolution within the L-malate and L-Lactate dehydrogenase super-family. J. Mol. Evol. 2002, 54, 825–840. [Google Scholar] [CrossRef]
  47. Yuan, F.; DiClemente, D. Hybrid voltage-controlled oscillator with low phase noise and large frequency tuning range. Analog. Integr. Circ. Signal Process. 2015, 82, 471–478. [Google Scholar] [CrossRef]
  48. Basson, C.H.; Terblanche, J.S. Metabolic responses of Glossina pallidipes (Diptera Glossinidae) puparia exposed to oxygen and temperature variation implications for population dynamics and subterranean life. J. Insect Physiol. 2010, 56, 1789–1797. [Google Scholar] [CrossRef]
  49. Geister, T.L.; Lorenz, M.W.; Meyering-Vos, M.; Hoffmann, K.H.; Fischer, K. Effects of temperature on reproductive output, egg provisioning, juvenile hormone and vitellogenin titres in the butterfly Bicyclus anynana. J. Insect Physiol. 2008, 54, 1253–1260. [Google Scholar] [CrossRef]
  50. Lu, Y.; Bai, Q.; Zheng, X. Expression and enzyme activity of catalase in Chilo suppressalis (Lepidoptera: Crambidae) is responsive to environmental stresses. J. Econ. Entomol. 2017, 110, 1803–1812. [Google Scholar] [CrossRef]
  51. Zhang, S.; Fu, W.; Li, N.; Zhang, F.; Liu, T.X. Antioxidant responses of Propylaea japonica (Coleoptera: Coccinellidae) exposed to high temperature stress. J. Insect Physiol. 2015, 73, 47–52. [Google Scholar] [CrossRef] [PubMed]
  52. Zhang, W.; Chang, X.Q.; Hoffmann, A.; Zhang, S.; Ma, C.S. Impact of hot events at different developmental stages of a moth: The closer to adult stage, the less reproductive output. Sci. Rep. 2015, 5, 10436. [Google Scholar] [CrossRef]
  53. Lighton, J.R.B.; Joos, B. Discontinuous gas exchange in a tracheate arthropod, the pseudoscorpion Garypus californicus: Occurrence, characteristics and temperature dependence. J. Insect Sci. 2002, 2, 23. [Google Scholar] [CrossRef]
  54. Duncan, F.D.; Byrne, M.J. Discontinuous gas exchange in dung beetles: Patterns and ecological implications. Oecologia 2000, 122, 452–458. [Google Scholar] [CrossRef] [PubMed]
  55. Hu, J.; Medison, R.G.; Zhang, S.; Ma, P.; Shi, C. Impacts of non-lethal high-temperature stress on the development and reproductive organs of Bradysia odoriphaga. Insects 2022, 13, 74. [Google Scholar] [CrossRef] [PubMed]
  56. Harvey, J.A.; Heinen, R.; Gols, R.; Thakur, M.P. Climate change-mediated temperature extremes and insects: From outbreaks to breakdowns. Glob. Change Biol. 2020, 26, 6685–6701. [Google Scholar] [CrossRef]
  57. Zeng, B.; Lian, Y.; Jia, J.; Liu, Y.; Wang, A.; Yang, H.; Li, J.; Yang, S.; Peng, S.; Zhou, S. Multigenerational effects of short-term high temperature on the development and reproduction of the Zeugodacus cucurbitae (Coquillett, 1899). Agriculture 2022, 12, 954. [Google Scholar] [CrossRef]
  58. Lighton, J.R.B.; Fielden, L.J. Gas exchange in wind spiders (Arachnida, Solphugidae): Independent evolution of convergent control strategies in solphugids and insects. J. Insect Physiol. 1996, 42, 347–357. [Google Scholar] [CrossRef]
  59. Matthews, P.G.D.; White, C.R. Discontinuous gas exchange, water loss, and metabolism in Protaetia cretica (Cetoniinae, Scarabaeidae). Physiol. Biochem. Zool. 2012, 85, 174–182. [Google Scholar] [CrossRef]
  60. Sun, Y.; Zhao, J.; Sheng, Y.; Xiao, Y.F.; Zhang, Y.J.; Bai, L.X.; Tan, Y.; Xiao, L.B.; Xu, G.C. Identification of heat shock cognate protein 70 gene (Alhsc70) of Apolygus lucorum and its expression in response to different temperature and pesticide stresses. Insect Sci. 2016, 23, 37–49. [Google Scholar] [CrossRef]
  61. Gruntenko, N.E.; Bownes, M.; Terashima, J.; Sukhanova, M.Z.; Raushenbach, I.Y. Heat stress affects oogenesis differently in wild-type Drosophila virilis and a mutant with altered juvenile hormone and 20-hydroxyecdysone levels. Insect Mol. Biol. 2003, 12, 393–404. [Google Scholar] [CrossRef] [PubMed]
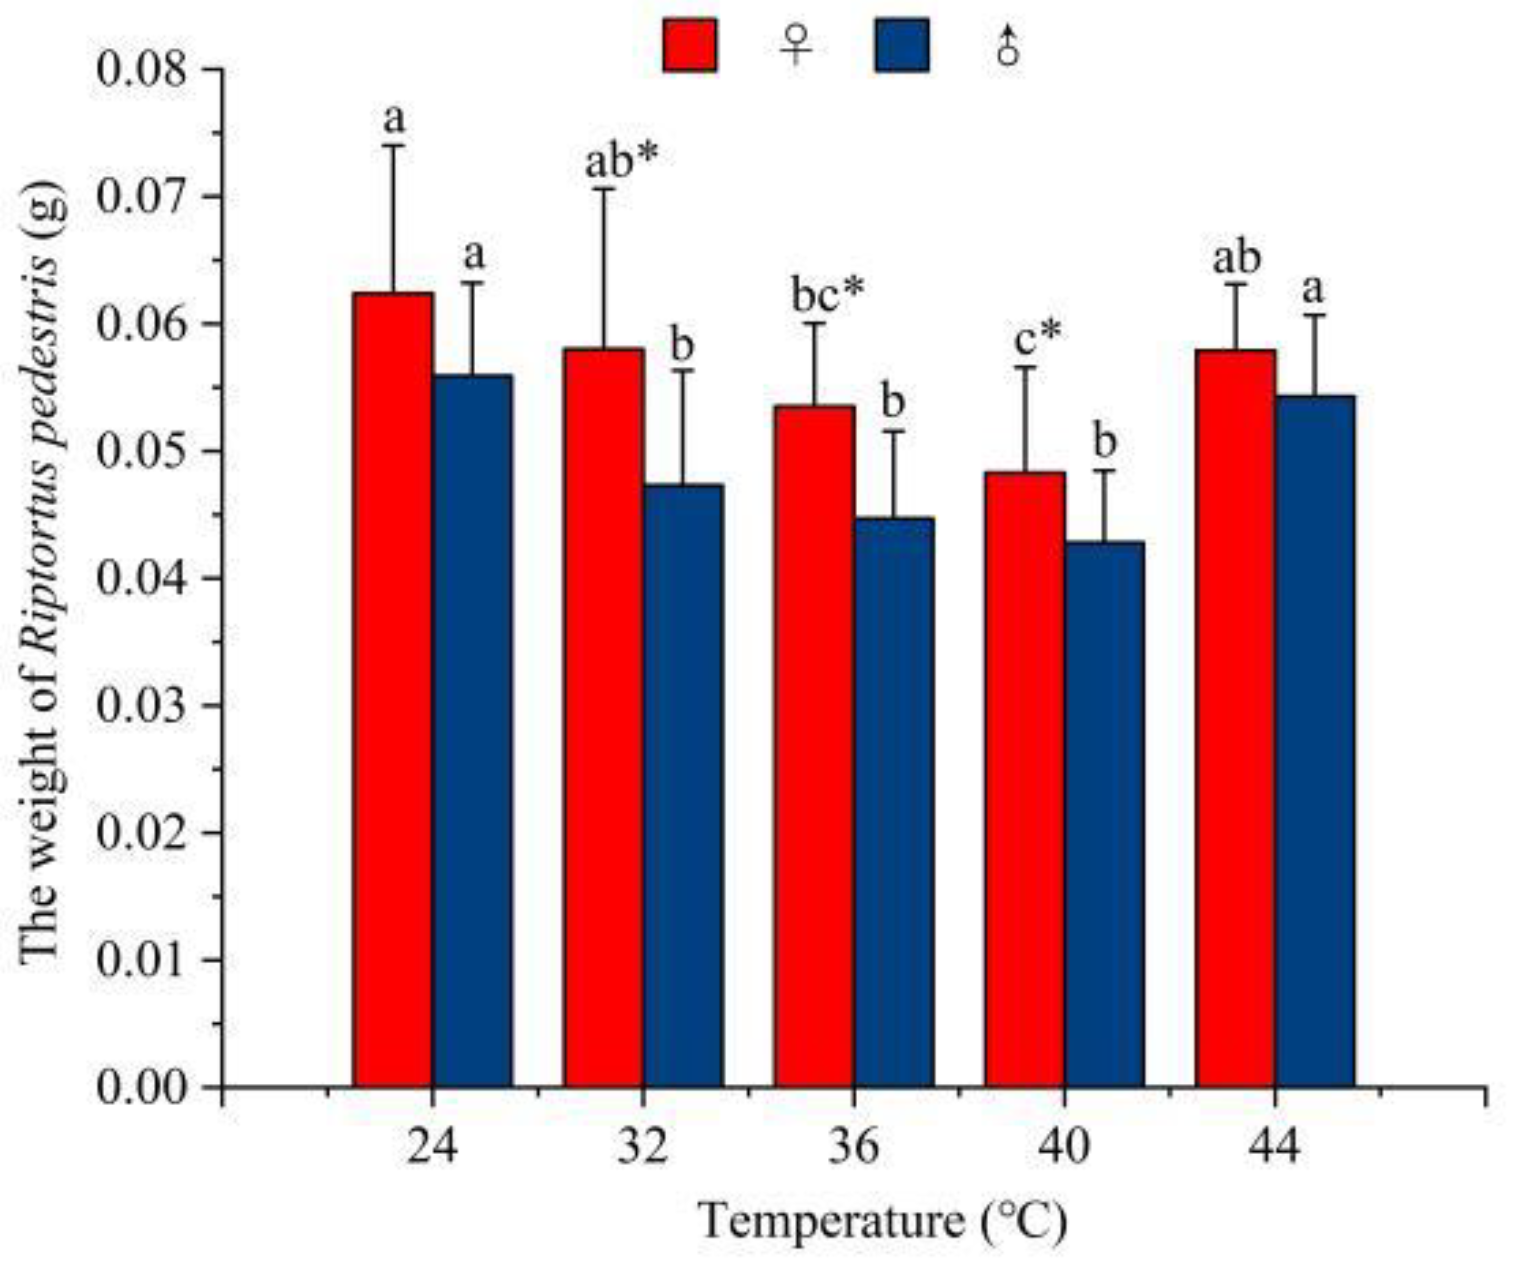
Figure 1. The effects of temperature on the weight of R. pedestris. According to the one-way ANOVA and the HSD test, different letters in the same row represent a significant difference (p < 0.05). All data are presented as the mean ± SE. * Significant differences at the 0.05 level between males and females.
Agronomy 15 01300 g001
Figure 2. The effects of temperature on the volumetric CO2 concentration emitted by R. pedestris in a plastic chamber. Different letters in the same row represent a significant difference (p < 0.05). All data are presented as the mean ± SE. * Significant differences at the 0.05 level between males and females.
Agronomy 15 01300 g002
Figure 3. The effects of temperature on the content of total carbohydrates in R. pedestris. Different letters in the same row represent a significant difference (p < 0.05). All data are presented as the mean ± SE. * Significant differences at the 0.05 level between males and females.
Agronomy 15 01300 g003
Figure 4. The effects of temperature on the content of glycogen in R. pedestris. Different letters in the same row represent a significant difference (p < 0.05). All data are presented as the mean ± SE. * Significant differences at the 0.05 level between males and females.
Agronomy 15 01300 g004
Figure 5. The effects of temperature on the content of fat in R. pedestris. Different letters in the same row represent a significant difference (p < 0.05). All data are presented as the mean ± SE. * Significant differences at the 0.05 level between males and females.
Agronomy 15 01300 g005
Figure 6. The effects of temperature on the content of protein in R. pedestris. Different letters in the same row represent a significant difference (p < 0.05). All data are presented as the mean ± SE. * Significant differences at the 0.05 level between males and females.
Agronomy 15 01300 g006
Figure 7. The effects of temperature on the activity of glyceraldehyde-3-phosphate dehydrogenase (GAPDH) and glycerol-3-phosphate dehydrogenase in R. pedestris. (A) GAPDH activity in R. pedestris; (B) GDH activity in R. pedestris. GAPDH: glyceraldehyde-3-phosphate dehydrogenase; GDH: glycerol-3-phosphate dehydrogenase. Different letters in the same row represent a significant difference (p < 0.05). All data are presented as the mean ± SE. * Significant differences at the 0.05 level between males and females.
Agronomy 15 01300 g007
Figure 8. The effects of temperature on the activity of citrate synthase in R. pedestris. CS: citrate synthase. Different letters in the same row represent a significant difference (p < 0.05). All data are presented as the mean ± SE. * Significant differences at the 0.05 level between males and females.
Agronomy 15 01300 g008
Figure 9. The effects of temperature on the activity of lactate dehydrogenase in R. pedestris. LDH: lactate dehydrogenase. Different letters in the same row represent a significant difference (p < 0.05). All data are presented as the mean ± SE. * Significant differences at the 0.05 level between males and females.
Agronomy 15 01300 g009
Figure 10. The effects of temperature on the activity of 3-hydroxyacyl-CoA dehydrogenase in R. pedestris. HOAD: 3-hydroxyacyl-CoA dehydrogenase. Different letters in the same row represent a significant difference (p < 0.05). All data are presented as the mean ± SE. * Significant differences at the 0.05 level between males and females.
Agronomy 15 01300 g010
Figure 11. The effects of temperature on the activity of superoxide dismutase in R. pedestris. Different letters in the same row represent a significant difference (p < 0.05). All data are presented as the mean ± SE. * Significant differences at the 0.05 level between males and females.
Agronomy 15 01300 g011
Figure 12. The effects of temperature on the activity of peroxidase in R. pedestris. Different letters in the same row represent a significant difference (p < 0.05). All data are presented as the mean ± SE. * Significant differences at the 0.05 level between males and females.
Agronomy 15 01300 g012
Figure 13. The effects of temperature on the activity of catalase in R. pedestris. Different letters in the same row represent a significant difference (p < 0.05). All data are presented as the mean ± SE. * Significant differences at the 0.05 level between males and females.
Agronomy 15 01300 g013
Figure 14. The effects of temperature on the total antioxidative capacity in R. pedestris. Different letters in the same row represent a significant difference (p < 0.05). All data are presented as the mean ± SE. * Significant differences at the 0.05 level between males and females.
Agronomy 15 01300 g014
Figure 15. The effects of temperature on the activity of malondialdehyde in R. pedestris. Different letters in the same row represent a significant difference (p < 0.05). All data are presented as the mean ± SE. * Significant differences at the 0.05 level between males and females.
Agronomy 15 01300 g015
Table 1. The activity ratio of GAPDH:HOAD in R. pedestris at different temperatures.
SexTemperature (°C)
2432364044
3.013.512.501.771.08
3.083.372.772.060.90
Disclaimer/Publisher’s Note: The statements, opinions and data contained in all publications are solely those of the individual author(s) and contributor(s) and not of MDPI and/or the editor(s). MDPI and/or the editor(s) disclaim responsibility for any injury to people or property resulting from any ideas, methods, instructions or products referred to in the content.