Article

Mitigating Soil Phosphorus Leaching Risk and Improving Pear Production Through Planting and Mowing Ryegrass Mode

1
Zhejiang Provincial Key Laboratory of Agricultural Resources and Environment, College of Environmental and Resource Sciences, Zhejiang University, Hangzhou 310058, China
2
School of Public Affairs, Zhejiang University, Hangzhou 310058, China
*
Authors to whom correspondence should be addressed.
Agronomy 2025, 15(6), 1296; https://doi.org/10.3390/agronomy15061296
Submission received: 17 April 2025 / Revised: 20 May 2025 / Accepted: 24 May 2025 / Published: 26 May 2025
(This article belongs to the Section Grassland and Pasture Science)

Abstract

:
Excessive phosphorus (P) fertilization has led to high soil P accumulation in pear orchards across China, increasing the risk of P loss while limiting economic returns. Orchard grassing has been proposed as a strategy to optimize soil P content and reduce P loss; however, its limited economic benefits have hindered widespread adoption. To address this, we developed a novel planting and mowing ryegrass (MF) system, integrating P loss mitigation with improved economic returns. A two-year field experiment was conducted in the Yangtze River Basin to assess the effects of this system on soil P fractions, P loss risk, and pear production. The results showed that soil available nitrogen (N), available potassium (K), and total P content were significantly lower in the MF treatment compared to natural grassing (NG) at different growth stages. Moreover, the MF treatment increased pear yield by 14.7–16.7% and reduced titratable acidity by 23.5–47.1%, with these improvements primarily driven by changes in phosphorus-related indicators (NaOH-Pi, NaHCO3-Pi, and intermediate P) across different years. Additionally, the reduction in NaHCO3-Pi in the MF treatment contributed to a decline in P leaching risk indicators, including Olsen-P and CaCl2-P. These findings highlight the potential of the MF system as a sustainable orchard management strategy, effectively optimizing soil P dynamics, mitigating P leaching risks, and enhancing pear yield and quality under high P conditions.

1. Introduction

Phosphorus (P) stands as a pivotal nutrient for plant growth and crop production [1,2]. However, the excessive application of P fertilizers to boost crop yields can inadvertently lead to water eutrophication through P leaching or surface runoff, a common issue in China [3,4]. Studies by Fu et al. [5] indicate that P fertilizer inputs in pear orchards often exceed recommended levels by 4–5 times. Therefore, it becomes imperative to find methods that maintain fruit production while mitigating the risk of P leaching for sustainable agricultural development.
In soils, P exists in three main forms: labile P, intermediate P, and recalcitrant P [6,7]. Labile P is readily available for plant uptake, whereas intermediate P can be converted into labile P, and recalcitrant P is less accessible to plants [8]. Orchard grass is an effective strategy to optimize soil P supply and availability. Orchard grass can reduce soil P adsorption and provides P in readily available forms for soil microorganisms and plants, thereby supporting crop yields [9,10,11,12]. For instance, Gao et al. [9] found that the application of alfalfa increased soil labile P fractions (NaHCO3-Pi and NaOH-Pi) in rice agroecosystems. Wang et al. [2] demonstrated that the long-term substitution of chemical fertilizers with Chinese milk vetch improved P availability and enhanced late rice yields. However, the effect of orchard grass on fruit yield remains variable. Srivastava et al. [13] observed that planting chickpea and soybean in citrus orchards increased citrus yield by more than 5%, while Bai et al. [14] reported that intercropping white clover and duckweed in apple orchards significantly reduced single fruit weight and overall yield. These discrepancies highlight the need for optimization in orchard grass management to ensure both orchard yield and economic viability.
Furthermore, increasing soil P content in fruit orchards with high soil P levels has the potential to elevate the risk of soil P losses when returning grass to the field. Heckrath et al. [15] and Hesketh and Brookes [16] identified a change-point in the relationships between Olsen-P and CaCl2-P, used as a leaching index. When Olsen-P exceeds critical levels, P in the solid phase of soil particles is more likely to enter the liquid phase, thereby escalating the risk of P loss [17]. Wang et al. [2] discovered that the risk value of P environmental pollution was 31.9 mg kg−1 (Olsen-P), and the long-term substitution of chemical fertilizer with Chinese milk vetch reduced the P loss risk in double rice systems. Optimizing soil P levels to achieve high crop yield while mitigating P losses becomes crucial for sustainable P management in agriculture [18].
To reduce the risk of soil P losses and increase the economic benefits of pear, we propose a novel orchard management practice, namely, planting and mowing ryegrass in pear orchards. Compared with traditional natural grass, ryegrass exhibits vigorous growth and a strong capacity for P uptake, enabling more effective P absorption and immobilization, thereby mitigating the risk of P leaching. Moreover, ryegrass roots predominantly occupy the top 15 cm of soil, whereas more than 70% of pear tree roots are found below 20 cm, which minimizes nutrient competition between them [19]. By planting ryegrass during the dormancy period of pear trees and mowing it before the expansion period in the following year, this practice maximizes the temporal separation of nutrient demand between ryegrass and pear trees, thereby minimizing nutrient competition and supporting healthy tree growth. Additionally, instead of returning the ryegrass to the field, it is sold as livestock feed, providing extra income. However, the impact of planting and mowing ryegrass on soil P leaching risk, plant growth, and crop production remains unclear. Therefore, a two-year field experiment was conducted in a pear production system to (i) investigate the effect of this practice on plant growth and crop production at different growth stages, and (ii) analyze its influence on P leaching risk.

2. Materials and Methods

2.1. Study Area and Experimental Design

The study site was situated in Luniao County, Zhejiang Province, China (119°44′ E, 30°27′ N), characterized by a subtropical monsoon climate. This region is renowned for its extensive pear cultivation, spanning over 600 hectares. The predominant pear variety cultivated here is “Cuiguan”, representing a significant variety in the pear districts of the Yangtze River Basin. The soil at the study site is classified as yellow–brown soil, corresponding to Ultisols according to the USDA Soil Taxonomy.
To assess the impact of planting and mowing ryegrass as livestock feed on soil phosphorus (P) leaching risk and pear production, two treatments were established: traditional orchard grass mode—natural grass (NG), and novel orchard management mode—planting and mowing ryegrass as livestock feed (MF). Each treatment comprised three replicates, following a randomized block design. Each replicate covered an area of 72 square meters and included six 22-year-old pear trees. In the MF treatment, ryegrass was planted in November within the orchards and subsequently mowed three times the following year (in March, April, and May). The mowed ryegrass was then removed from the orchards and sold as feed for livestock. Conversely, the NG treatment allowed all weeds to grow, and these were mowed and left on the orchard ground concurrently with the MF treatment. Fertilizer inputs for both treatments were identical and aligned with local farmer fertilization practices. This included applying 658.5 kg ha−1 of nitrogen (N), 595.5 kg ha−1 of phosphorus (P2O5), and 386.4 kg ha−1 of potassium (K2O). The total fertilizer was applied in three stages, with organic fertilizer applied in October, and chemical fertilizer applied in March, May, and August. Urea (46% N) was used as N fertilizer, diammonium phosphate (46% P2O5) was used as P fertilizer, and potassium sulfate (50% K2O) was used as K fertilizer. The N, P, and K fertilizer ratios at different growth stages were 50%:33%:25% (March), 25%:34%:50% (May), and 25%:33%:25% (August).

2.2. Soil Sampling and Analysis

Soil samples were systematically collected at two distinct depths, 0–20 cm and 20–40 cm, during various stages of the year: February (before the mowing stage), March (after the mowing stage, the first time ryegrass was mowed), May (the expansion stage), and July (the harvest stage) in both 2022 and 2023. Each replication involved the collection and amalgamation of soil samples from four different plots. The collected soil samples were air-dried for the subsequent analysis of soil properties, phosphorus (P) fractions, and P leaching risk indicators.
To determine soil properties such as pH, soil organic carbon (SOC), alkali-hydrolyzed nitrogen (AN), total phosphate (TP), available phosphate (Olsen-P), and available potassium (AK), we adhered to standard methods outlined in Bao [20]. Soil P fractions were determined using modified methods established by Hedley et al. [21] and Sui et al. [22]. The P fractions were sequentially extracted using H2O, 0.5 M NaHCO3, 0.1 M NaOH, 1 M HCl, concentrated HCl, and H2SO4-H2O2. The P concentration in the extracts was measured using a spectrophotometer (UV-1780; Shimadzu Corporation, Kyoto, Japan). Soil CaCl2-P was measured using a 0.01 mol L−1 CaCl2 extraction method, and analysis was conducted using the molybdenum blue method at 700 nm as described by Hua et al. [17].

2.3. Plant Sampling and Pear Production Indicator Analysis

From April to June, we sampled eight leaves from each tree to determine phosphorus concentration. Simultaneously, we measured the Soil Plant Analysis Development (SPAD) value using a chlorophyll meter. Additionally, we monitored the length and thickness of eight new shoots per tree using a tape measure in April, May, and June. In July, fruit samples were collected by selecting eight pears from each tree, representing the east, south, west, and north sides of the canopy. In the laboratory, we analyzed the yield and quality indicators of all fruits. Pear yield was calculated by multiplying the average weight per fruit by the number of fruits per tree. To determine titratable acid (AC), soluble solids (SS), Vitamin C (VC), and soluble sugar (SSu), we followed the methodology described by Fu et al. [23].

2.4. Statistical Analysis

To determine the critical Olsen-P for P environment risk, we establish the relationship between Olsen-P and CaCl2-P using the two-segment linear model [2,17]. The calculation of the model was as follows:
Y1 = M1x + N1, X < X0.
Y2 = M2x + N2, X ≥ X0
where M1, N1, M2, and N2 represent the parameters of the equations, respectively, and X0 represents the critical level of Olsen-P.
Duncan’s multiple range test was used to identify differences among different treatments at p < 0.05 confidence interval using the IBM SPSS statistics 20. Principal component analysis (PCA) was used to identify the factors influencing soil P leaching risk indicators (AP and CaCl2-P) in Canoco version 5.0. In addition, correlation analysis and the random forest method using R version 4.0 were employed to determine the relationships between P fractions, soil properties, yield, and pear quality, with the ‘ggplot’ and ‘randomForest’ package, respectively.

3. Results

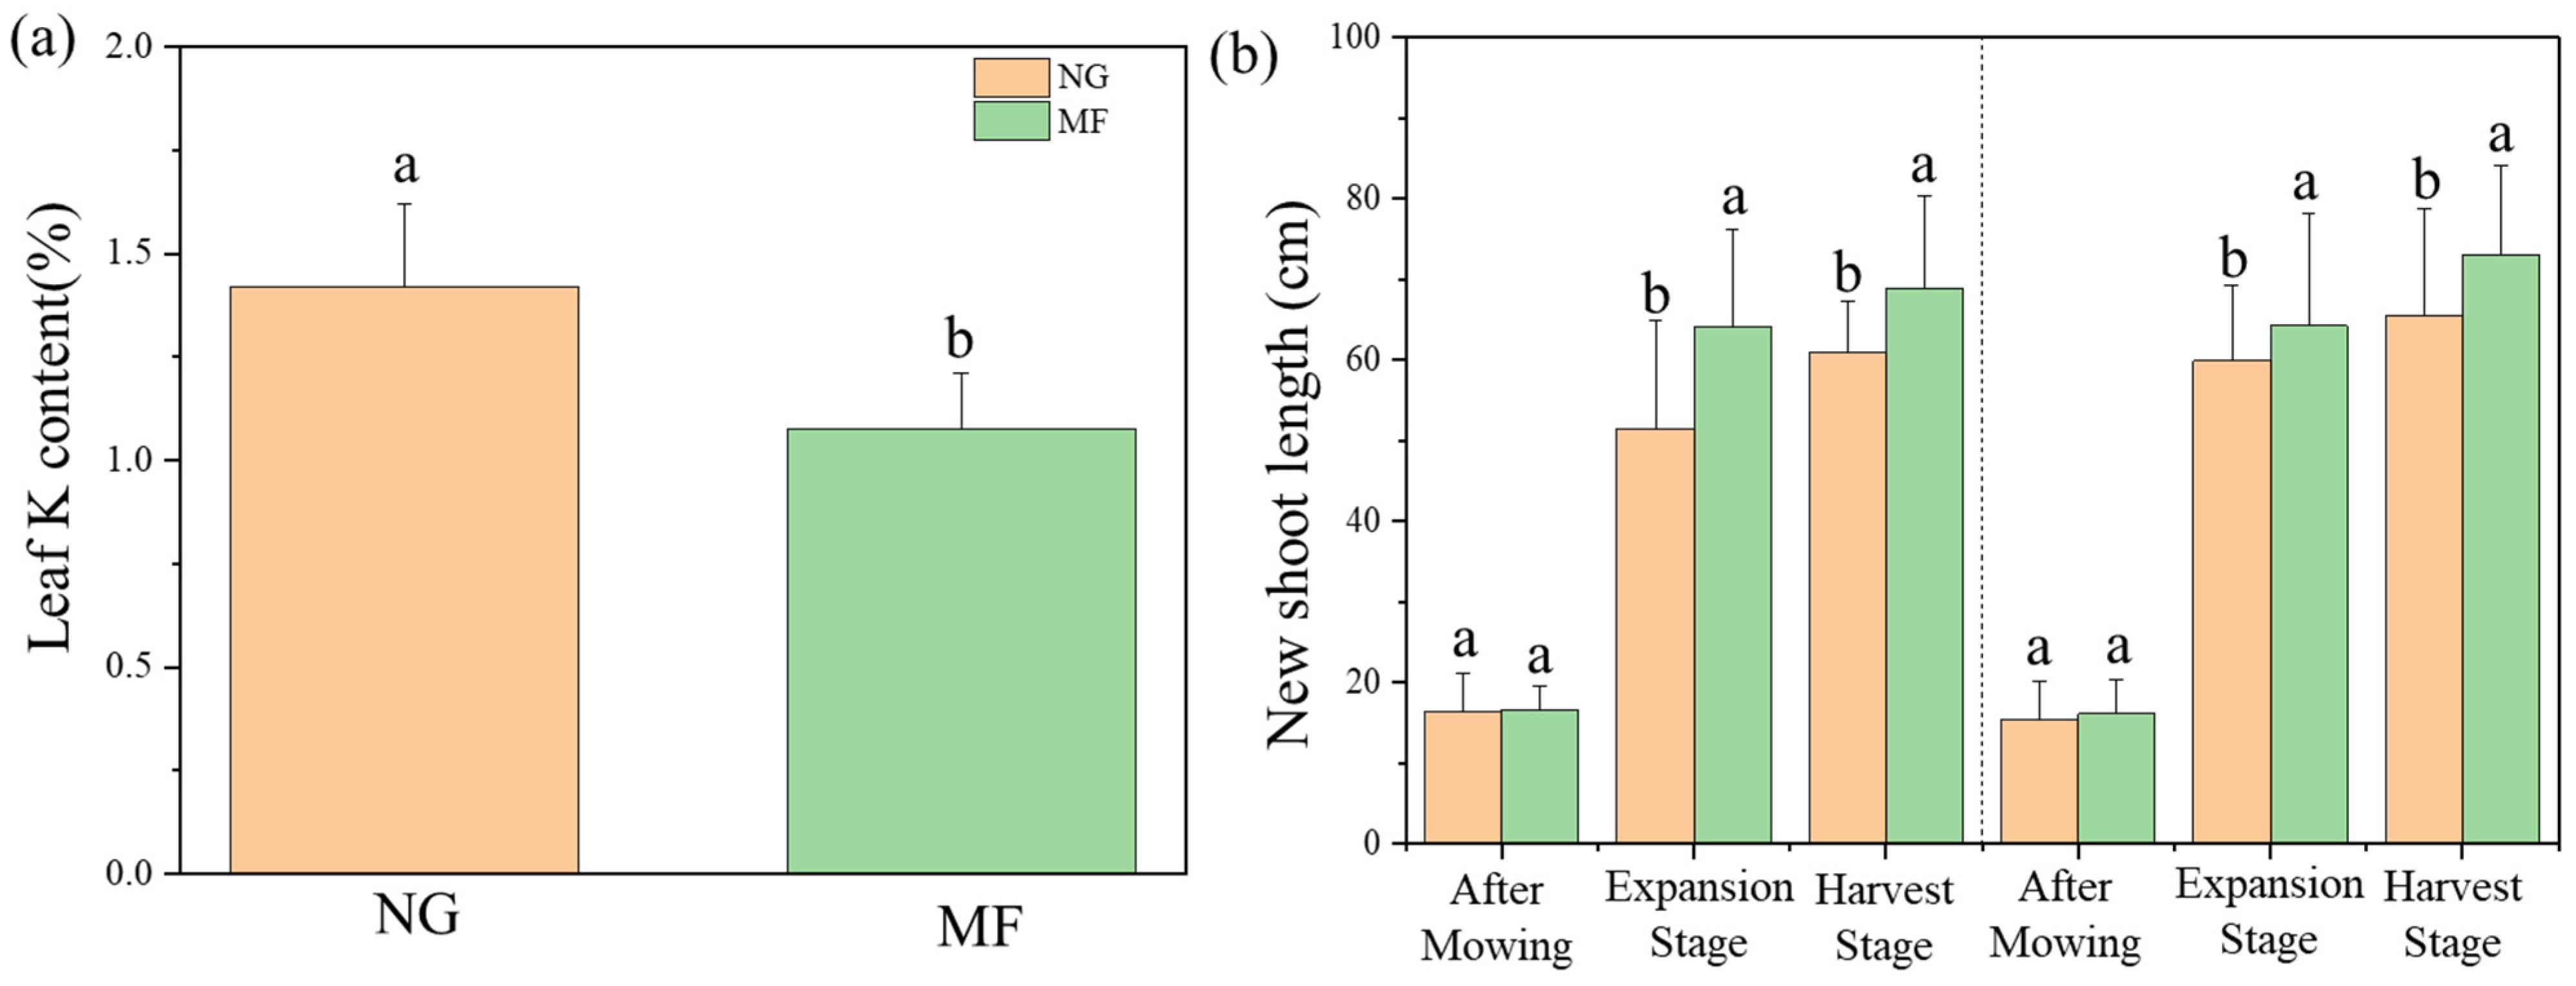
3.1. Pear Growth and Production of Different Treatment

Compared with NG, the MF treatment demonstrated significant improvements in yield. Under extreme climatic conditions in 2022, the yield increased from 6.58 t ha−1 to 7.55 t ha−1. Under normal conditions in 2023, the yield rose from 18.58 t ha−1 to 21.49 t ha−1. This resulted in a total benefit increase of 13.5% and 15.6% for the respective years (Table 1). Regarding pear quality, notable changes were observed in the content of titratable acids. In 2022, there was a significant decrease of 23.5%, and in 2023, the decrease was even more pronounced at 47.1% (Table 1).

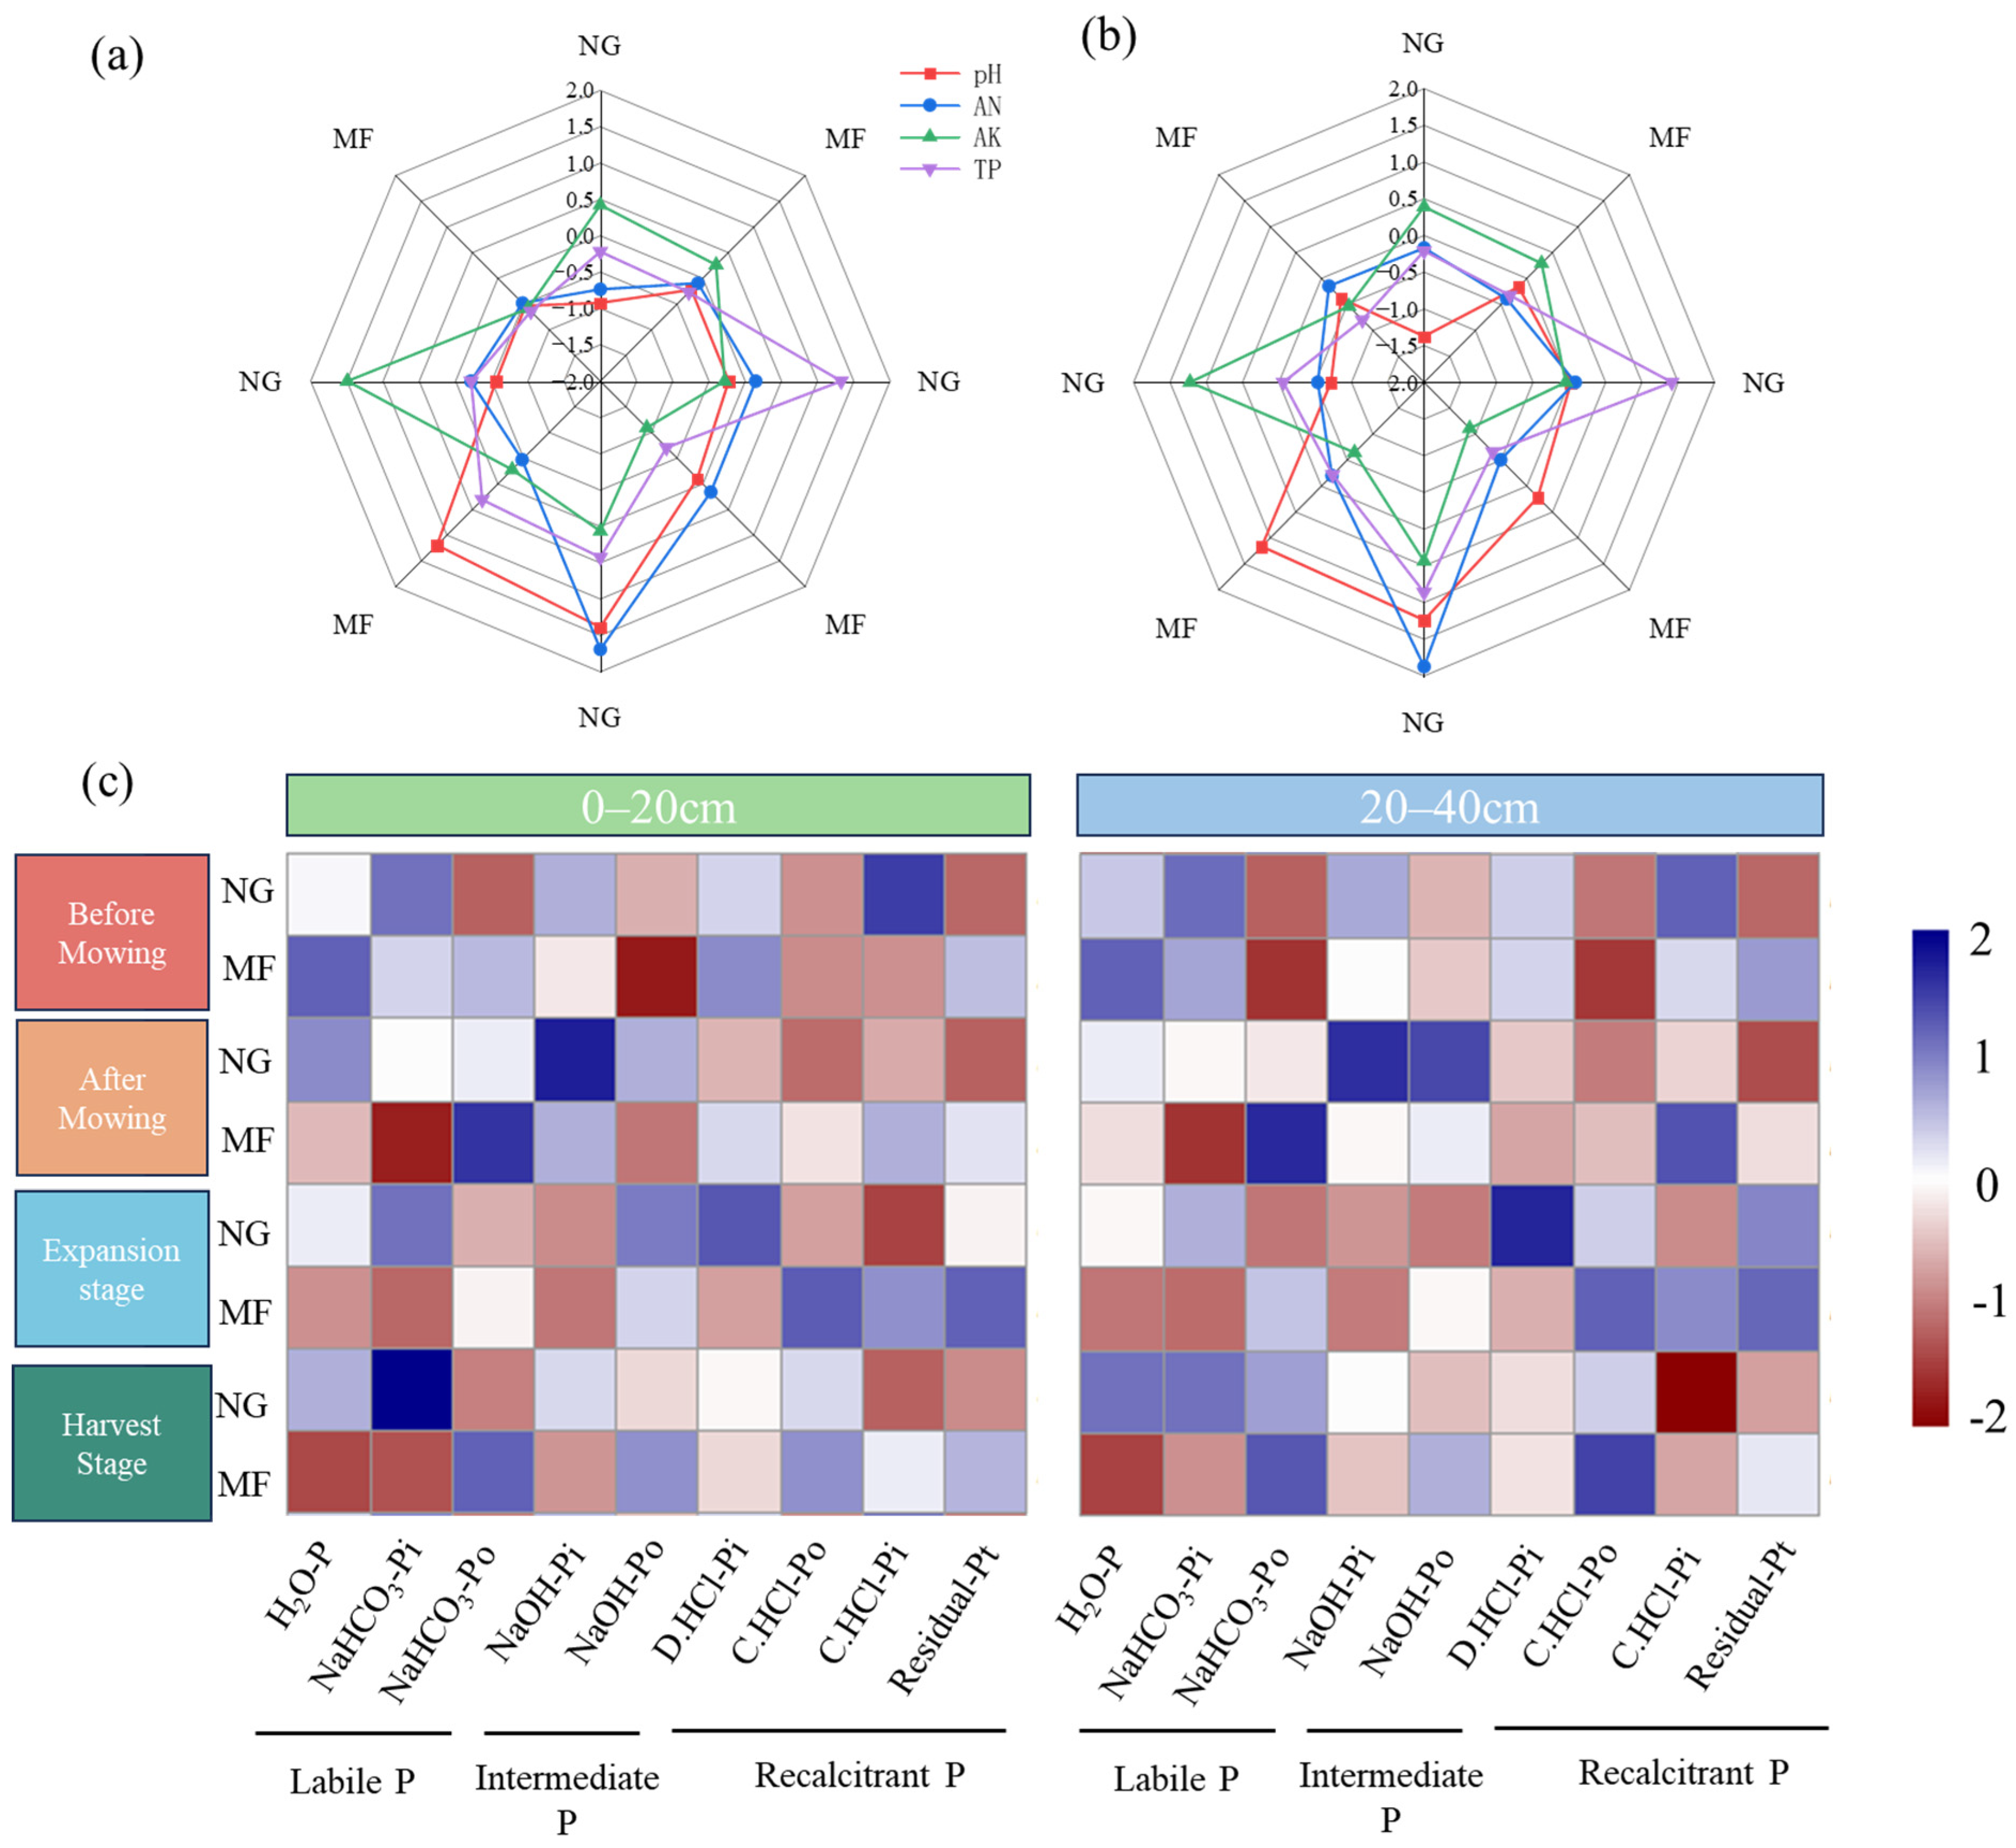
3.2. Soil Properties and Growth Indicator Change of Different Treatment

There was no significant difference in the effects of each treatment on soil organic carbon (SOC) content in the topsoil and subsoil (Table 2). However, treatment, growth period, and their interaction had significant effects on ammonium nitrogen (AN), available potassium (AK), and total phosphorus (TP) content in both topsoil and subsoil (p < 0.05). Compared to the before mowing stage, AK content in both topsoil and subsoil under the NG treatment significantly decreased at the after mowing stage (Figure 1a,b). The AN content of NG treatment at the after mowing, expansion stage, and harvest stage was significantly lower compared to the before mowing stage (Figure 1a,b). For soil phosphorus (P) fractions, the MF treatment primarily significantly reduced the contents of H2O-P, NaHCO3-Pi, and NaOH-Pi in both topsoil and subsoil (Figure 1c).
Different treatments had no significant effect on the N and P contents of pear leaves, but significantly reduced the K content (Table S1; Figure 2a). Additionally, the interaction of treatment, year, and growth period significantly influenced shoot growth (Table S1). At the expansion and harvest stages, the new shoot length in the MF treatment was significantly higher than that in the NG treatment (Figure 2b).

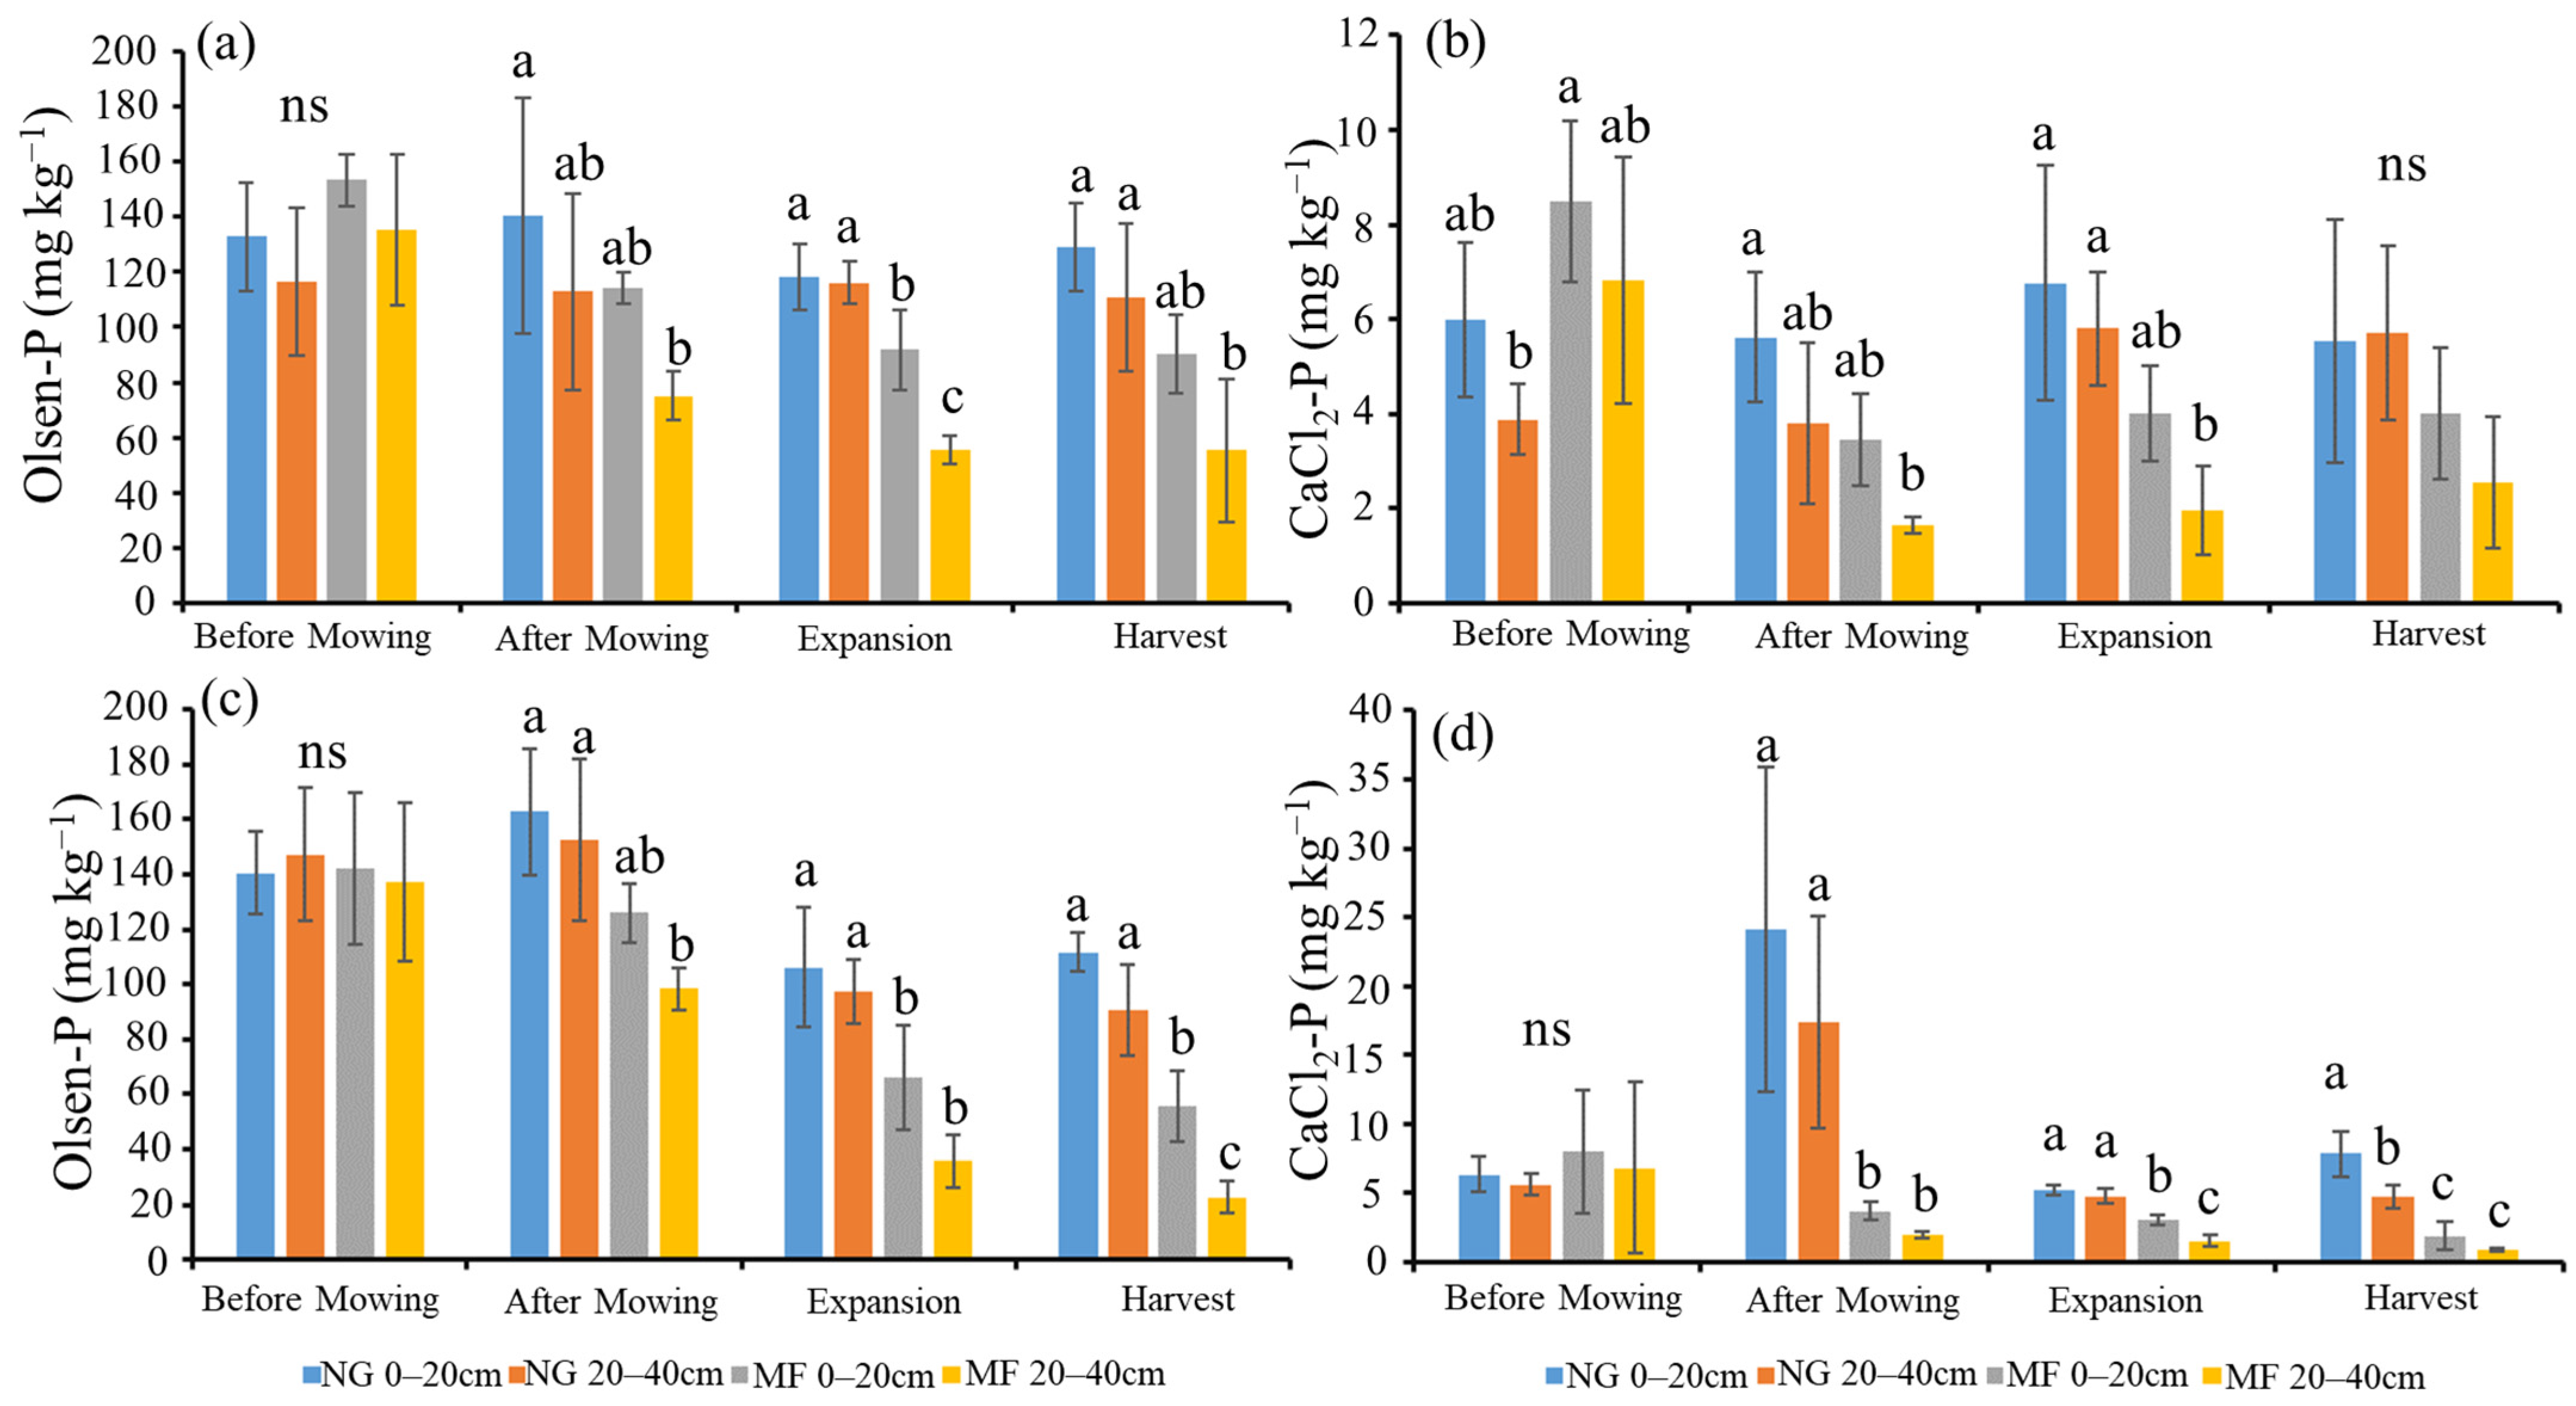
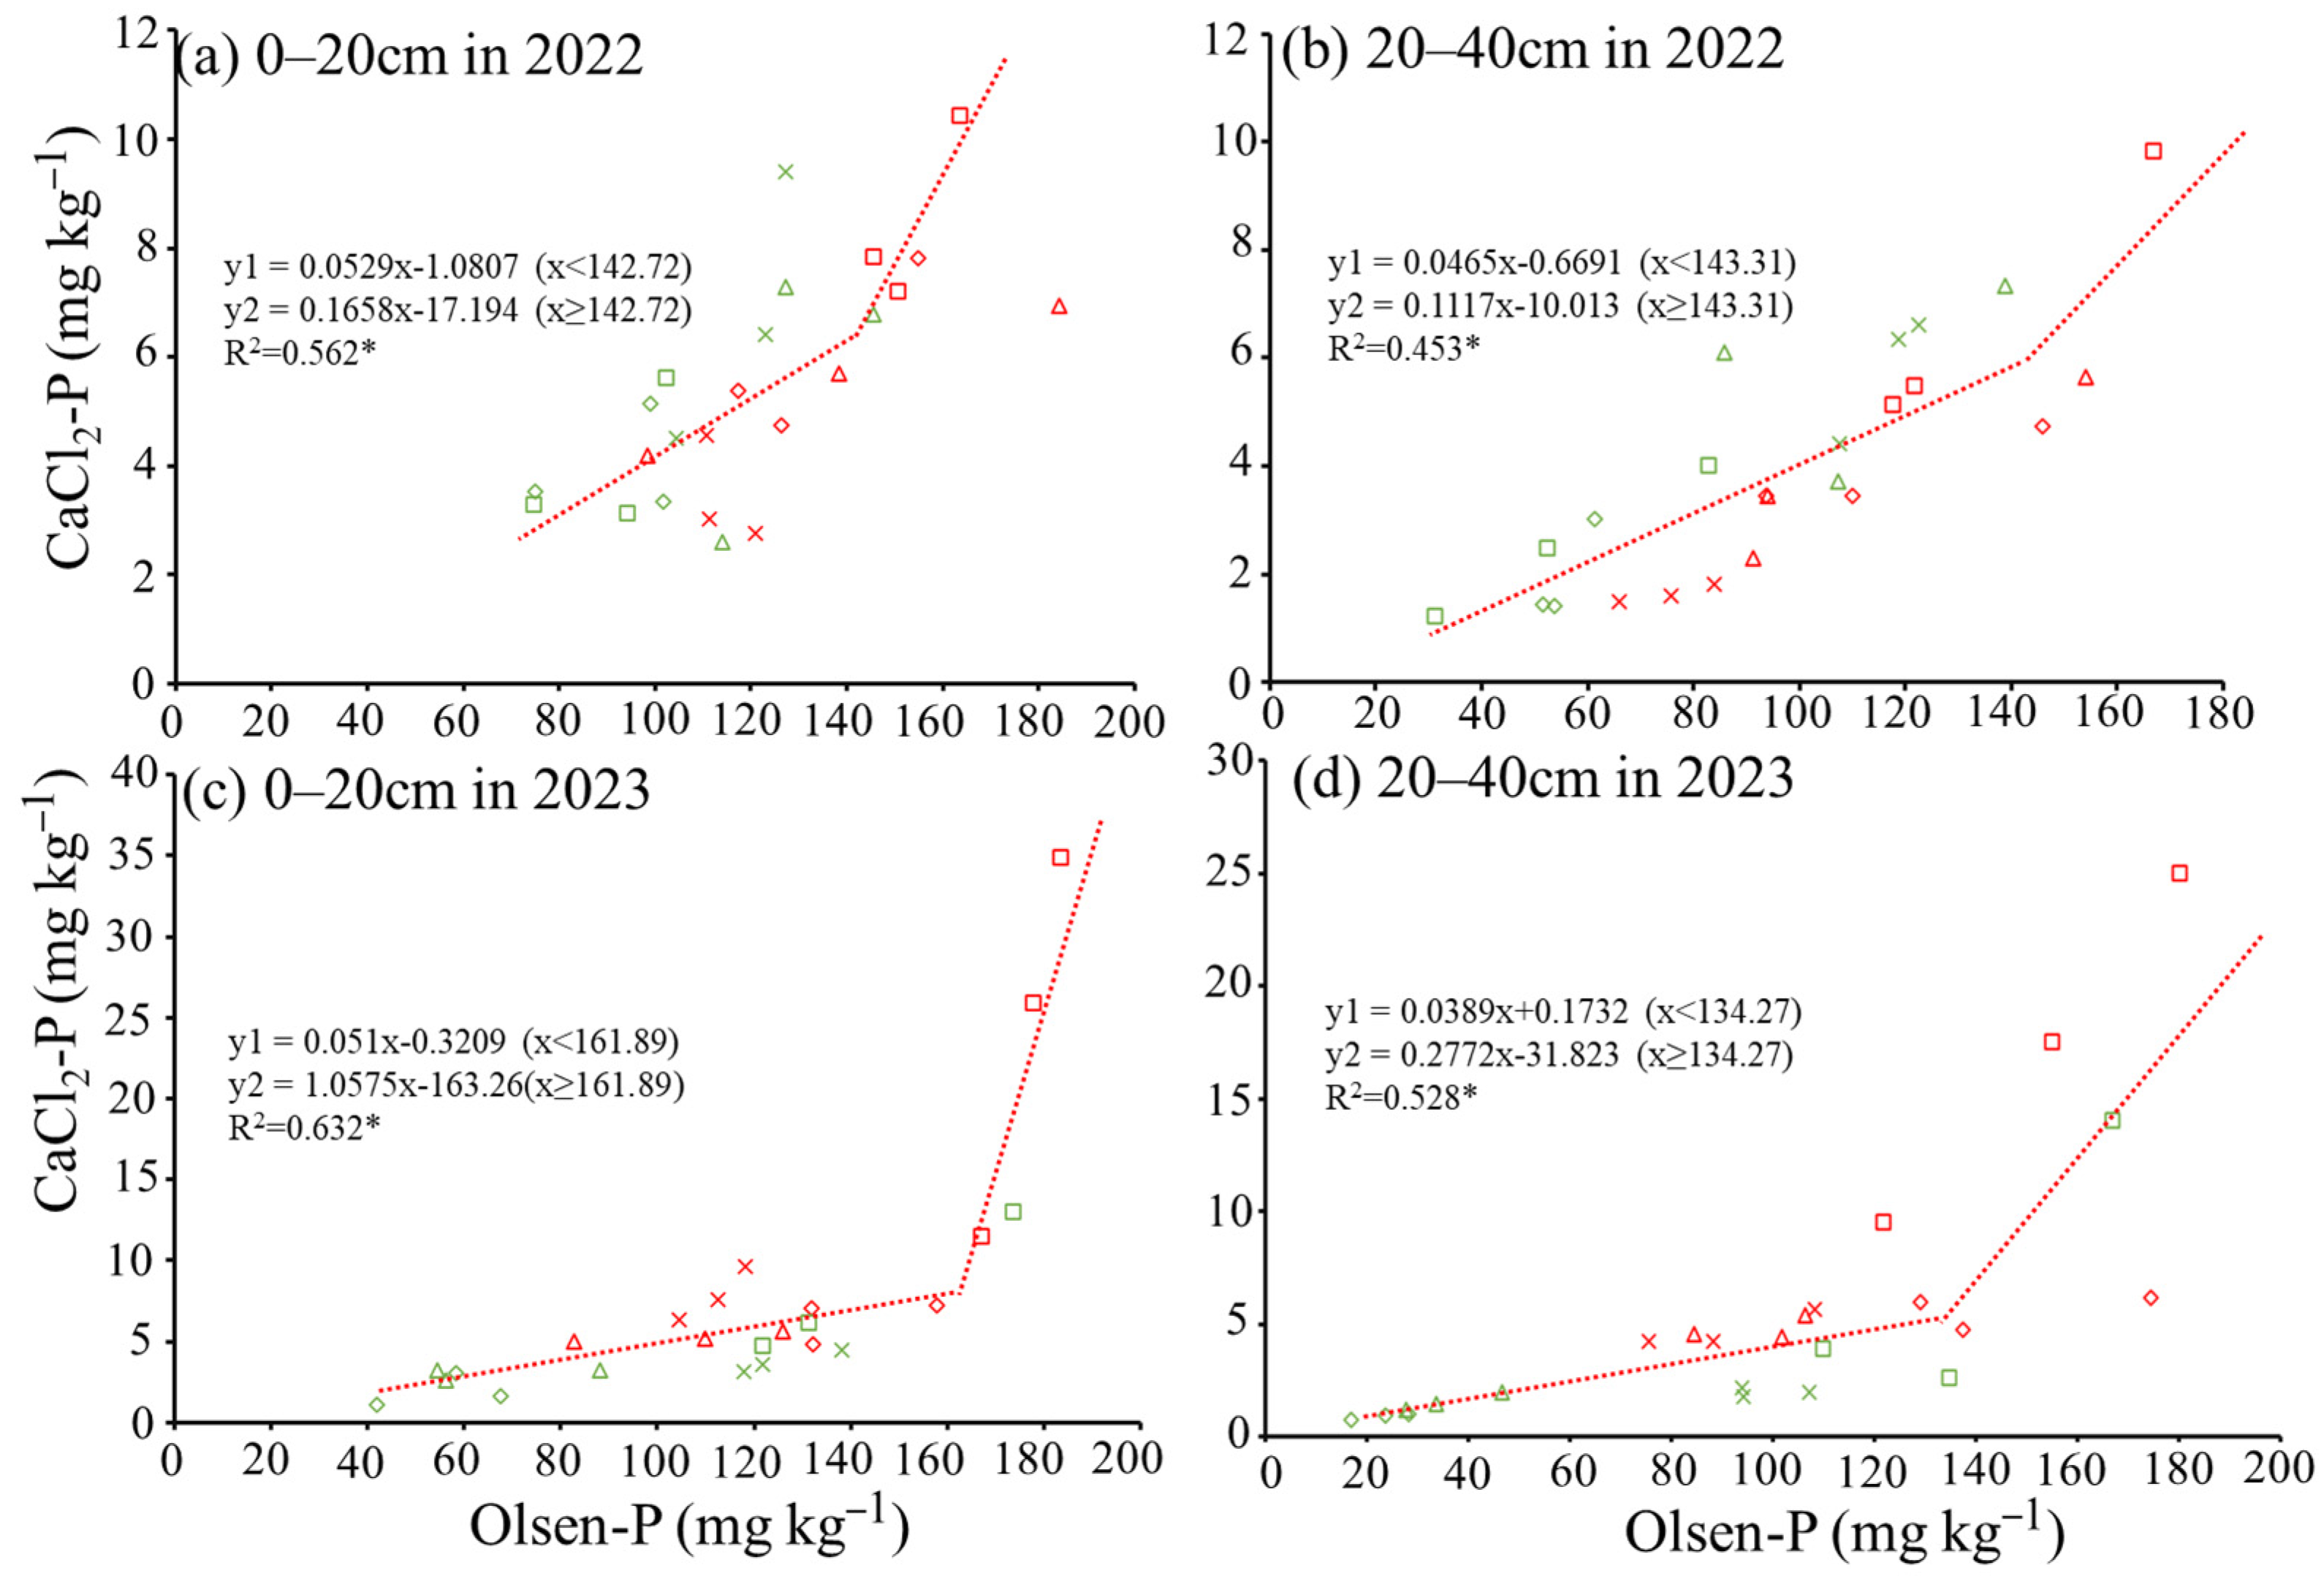
3.3. Soil P Leaching Risk of Different Treatments

As depicted in Figure 3, the Olsen-P contents of the MF treatment exhibited a decreasing trend at different soil depths after ryegrass mowing. Additionally, significant decreases in Olsen-P were observed during the expansion stage and harvest stage in both 2022 and 2023.
Regarding CaCl2-P, no significant differences were observed among the different treatments at the before mowing stage in both 2022 and 2023. However, the CaCl2-P contents in the MF treatment at different depths decreased during other stages compared to the NG treatment. Particularly in 2023, the CaCl2-P contents of the 0–20 cm and 20–40 cm soil depths in the MF treatment were significantly lower than those in the NG treatment after ryegrass mowing.
RDA revealed the effects of soil properties on CaCl2-P and Olsen-P (Figure 4). The first two PCA axes explained 78.45% and 85.50% of the data variance at 0–20 cm and 20–40 cm depths, respectively. Across different depths, NaHCO3-Pi, H2O-P, C.HCl-Pi, and SOC were all found to correlate with Olsen-P and CaCl2-P (Figure 4). Additionally, NaHCO3-Pi emerged as the most significant factor correlated with P leaching indicators, explaining 36.7% and 46.0% of the total variability, respectively (Figure 4; Table S2).

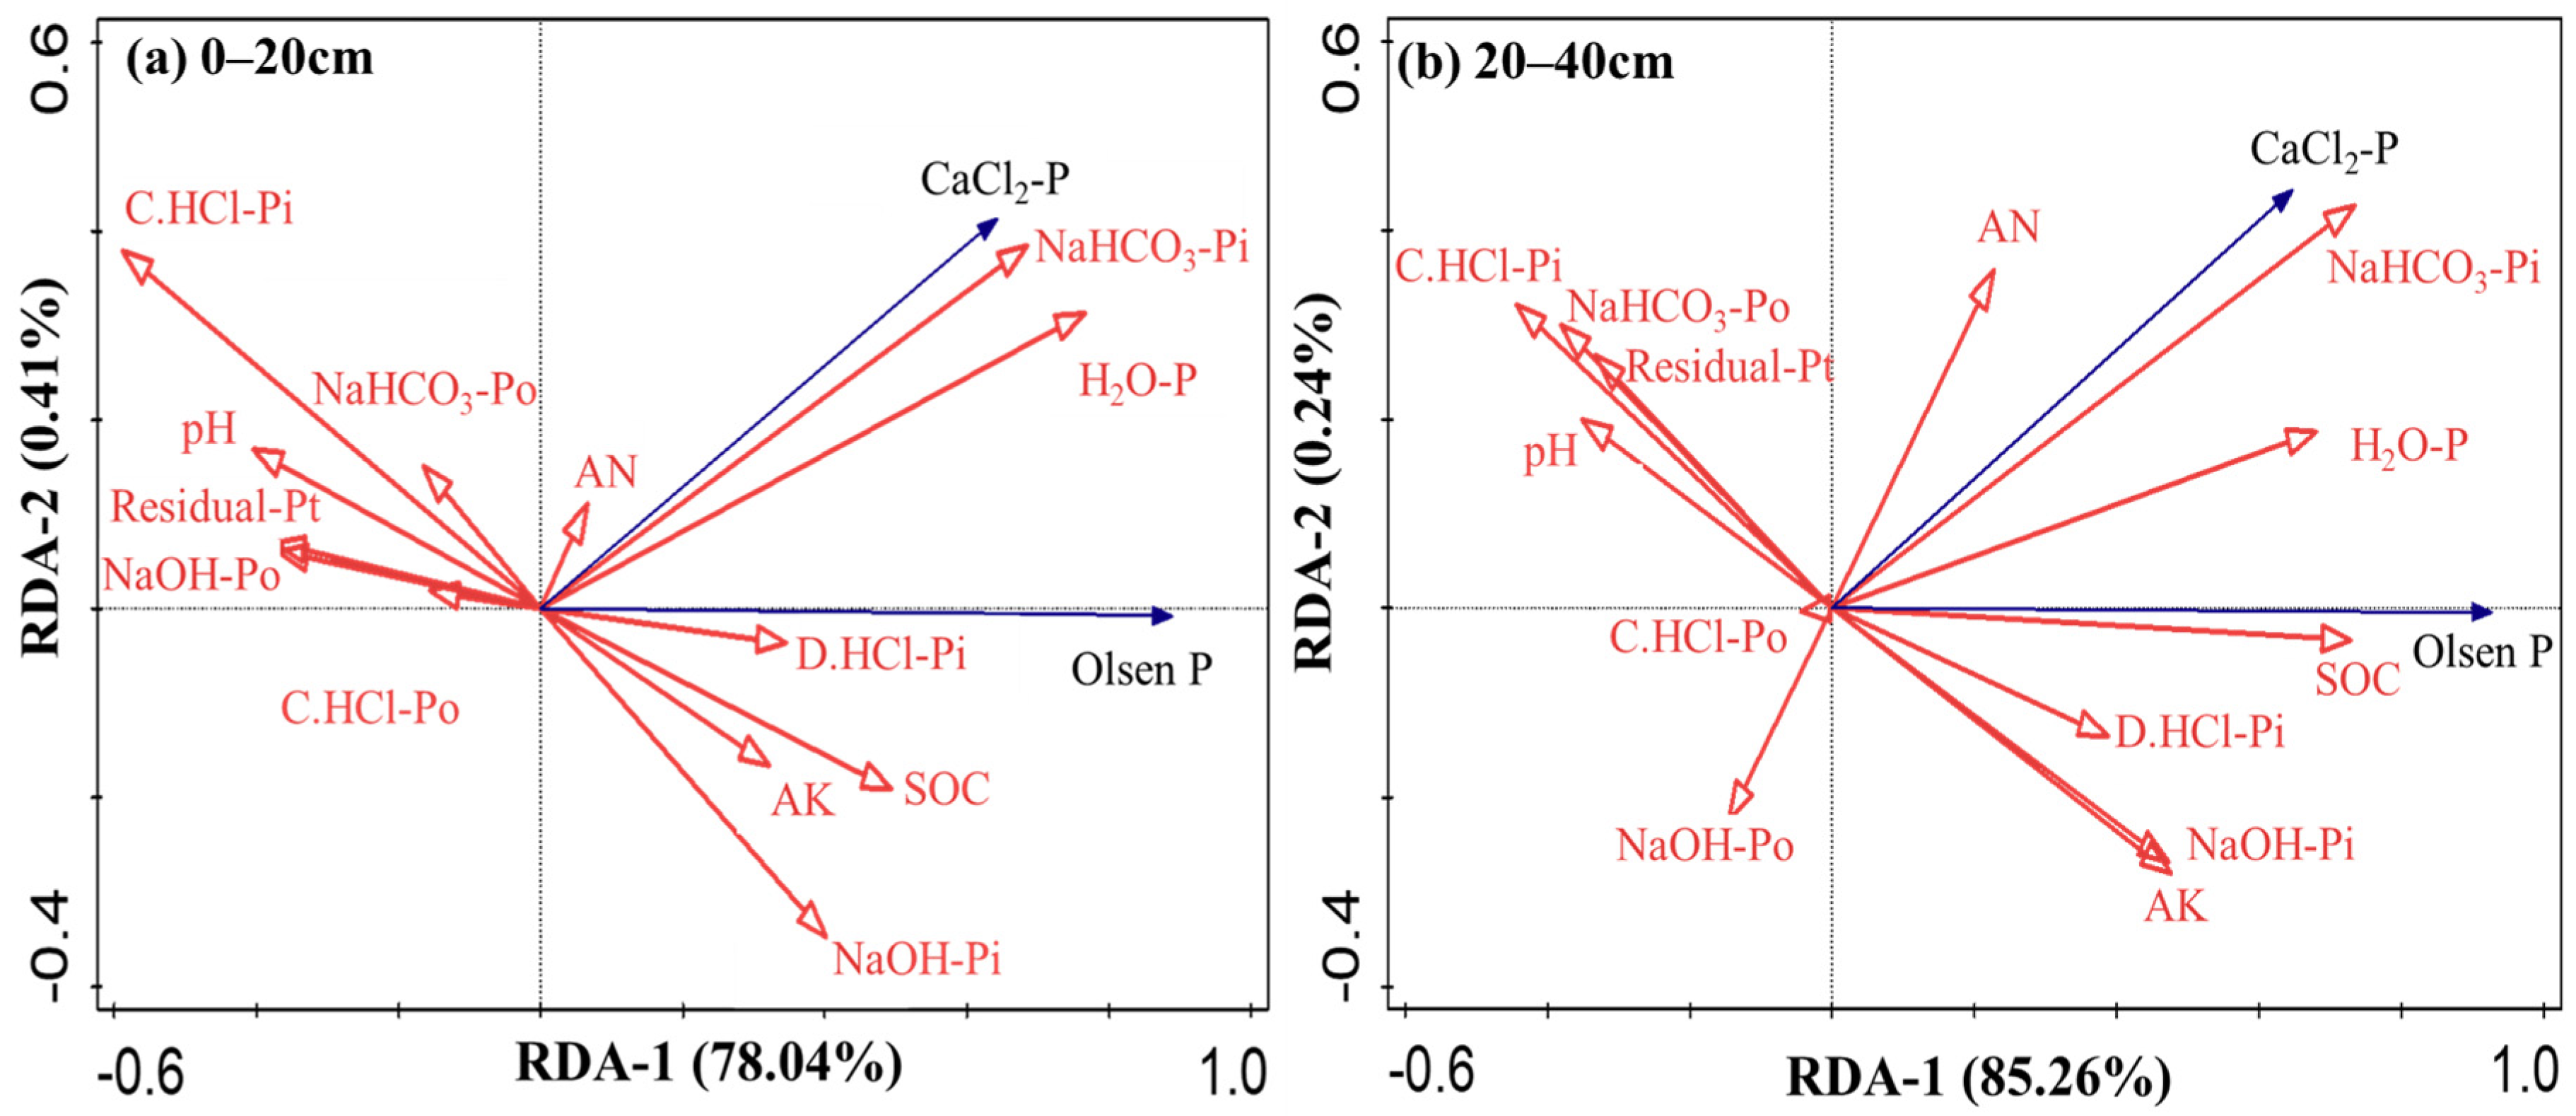
3.4. Relationship Between Soil Properties, P Leaching Risk Indicators, and Pear Production at Different Depths

In terms of the relationship between soil properties and crop yield, it was observed that soil AK at both 0–20 cm and 20–40 cm depths had a negative correlation with yield in 2022. Additionally, NaHCO3-Pi and NaHCO3-Po in the 0–20 cm depth, and AP in the 20–40 cm depth, had a significant effect on AC in 2022 (Figure 5a,b). In 2023, H2O-Pi, NaHCO3-Pi, NaOH-Pi, D.HCl-Pi, labile P, and intermediate P showed a strongly negative effect on yield and a positive effect on AC at both soil depths (Figure 5c,d). Furthermore, soil P leaching risk indicators (Olsen-P and CaCl2-P) also positively affected AC at both depths in 2023 (Figure 5c,d).
The results from the random forest models revealed that relevant indicators in 2023 exhibited a higher percentage of explained variance for yield and AC, with 42.35% and 34.05% at 0–20 cm depth, and 78.92% and 68.12% at 20–40 cm depth, respectively (Table 3). In 2022, AK was identified as the primary factor influencing yield, whereas NaHCO3-Pi and intermediate P emerged as the main factors impacting pear yield in 2023 (Table 3). Regarding AC, intermediate P, NaHCO3-Pi, and NaOH-Po were identified as significant factors in 2022, while NaHCO3-Pi and labile P played crucial roles in 2023 (Table 3).

4. Discussion

4.1. Effect of Planting and Mowing Ryegrass on Soil Nutrition and P Fraction

Compared with natural grass, the planting and mowing ryegrass treatments significantly reduced soil AN and AK contents (Table 2; Figure 1), indicating that the high biomass production of ryegrass requires substantial nutrient uptake from the soil to support its growth. Unlike the conventional practice of incorporating or mulching ryegrass to enhance SOC levels [24], our results suggest that the mowing treatment did not significantly alter SOC content (Table 2). This outcome may be attributed to the removal of aboveground biomass for livestock feed, which reduces the input of plant-derived carbon to the soil. Nonetheless, the relatively well-developed root system of ryegrass likely continues to contribute belowground carbon inputs, thereby helping to maintain SOC levels and preventing a significant decline.
Phosphorus exists in various fractions in the soil, and changes in these fractions can significantly affect phosphorus uptake and utilization efficiency [9]. The labile P pool, represented by NaHCO3-Pi and H2O-Pi fractions, is readily available for plant absorption [25]. In our study, a significant reduction in NaHCO3-Pi and H2O-Pi contents was observed in the MF treatment compared to the NG treatment in 2023 (Figure 1). This reduction can be attributed to the higher biomass and greater phosphorus uptake by ryegrass in the MF treatment. The intermediate P pools, NaOH-Pi, and NaOH-Po fractions are not immediately available to plants but can be transformed into labile P [26]. Interestingly, our results showed a decrease in NaOH-Pi contents, especially during the expansion stages, in the MF treatment. This could be due to the frequent mowing of ryegrass, which resulted in the removal of a significant amount of phosphorus from the system. This finding differs from previous studies that reported an increase in NaOH-Pi content with green manure application [9]. HCl-Pi is an important source of phosphorus utilized by plants, and its availability can be influenced by root characteristics and microbial activity [27]. In our study, we observed a decrease in HCl-Pi content in the MF treatment (Figure 1), suggesting that the plants in this treatment may have regulated their root characteristics and microbial activity to enhance phosphorus uptake. Regarding organic phosphorus, no significant difference was observed between the MF and NG treatments. This is consistent with previous studies that showed that labile organic P (NaHCO3-Po) mineralization is more prominent in low-phosphorus input systems [9,28]. Additionally, the NaOH-Po fraction was not significantly affected by the application of orchard grass, which aligns with the findings of Gao et al. [9]. To improve soil phosphorus availability and optimize phosphorus fertilizer rates, future research should consider the transformation between different phosphorus fractions, including Pi and Po fractions. This will provide a more comprehensive understanding of phosphorus dynamics in the soil and the impact on crop production.

4.2. Effect of Different Treatment on Soil P Leaching Risk

Over the past century, the application of P fertilizer has significantly boosted aboveground plant production in farmland [29]. However, farmers often apply excessive amounts of P fertilizer to ensure high yields, particularly in China, leading to elevated levels of available phosphorus in the soil [30]. This practice results in phosphorus accumulation in the soil, leading to resource wastage and environmental risks [31,32]. Many studies have indicated that the relationship between soil CaCl2-P and Olsen-P can serve as an indicator for assessing soil phosphorus loss [33]. Wang et al. [2] demonstrated that when Olsen-P exceeds a critical value, CaCl2-P linearly increases, which aligns with our findings (Figure 6). In our study, the risk of phosphorus environmental pollution increased when Olsen-P content exceeded the ranges of 142.7–161.9 mg kg−1 and 134.2–143.3 mg kg−1 at the 0–20 cm and 20–40 cm depths, respectively. These values were higher than the results reported by Wang et al. [2] (31.9 mg kg−1) and Bai et al. [33] (39.9–90.2 mg kg−1). The critical level of Olsen-P may vary due to differences in soil types and properties [34]. Our research found that NaHCO3-Pi was the most important factor influencing phosphorus behavior, underscoring the importance of NaHCO3-Pi in optimizing soil P leaching risk. Additionally, SOC emerged as a key factor influencing phosphorus loss, consistent with the findings of Wang et al. [2]. Furthermore, most of the Olsen-P values in the MF treatment were lower than the critical level compared to the NG treatment, indicating that planting and mowing ryegrass can reduce the risk of phosphorus loss (Figure 6). The reduction in soil Olsen-P content in the MF treatment may be attributed to the nutrient uptake by ryegrass during its growth process [35].

4.3. Crop Production Changes with Planting and Mowing Ryegrass

Orchard grass has been widely recognized as an effective method to enhance soil health, promote plant growth, and improve fruit yield and quality [36,37,38]. However, the specific impact of planting and mowing ryegrass on crop production is relatively understudied. In the case of pear trees, their nutrient characteristics are complex due to continuous nutrient absorption, storage, and recycling. Leaf nutrition is often used as an indicator to evaluate tree nutritional status, yield, and quality [39]. To determine whether planting and mowing ryegrass have a negative effect on crop production, we measured various indicators of plant growth at key stages, such as leaf SPAD, leaf P content, and new shoot length and thickness. Our results showed no significant differences in most plant growth indicators between the MF and NG treatments at various stages (Table S3). Regarding pear yield and quality, we found that planting and mowing ryegrass can improve pear yield while reducing acidity (AC) in both years, which aligns with the findings of our previously published article [23]. Although the difference in soil soluble sugar content was not statistically significant, the planting and mowing ryegrass system exhibited a tendency toward lower concentrations compared to natural grass (Table 1). This may be attributed to reduced rhizodeposition resulting from repeated cutting, limited litter return, and potentially enhanced microbial uptake of labile carbon substrates following mowing disturbances. Despite the significant absorption and removal of soil nutrients by ryegrass, planting and mowing cover crops did not negatively impact pear growth or production. This phenomenon may be attributed to the high soil nutrient content resulting from substantial fertilizer input in Chinese agricultural production [40].
In our study, we demonstrated that soil AK had a strongly negative effect on yield in 2022, indicating that excessively high AK levels can adversely affect crop production (Figure 5). Additionally, NaHCO3-Pi and labile P were identified as the two most influential factors on yield and AC in 2023 (Figure 5; Table 2). NaHCO3-Pi and labile P are important forms of phosphorus that can be directly absorbed by plants [26]. Gao et al. [9] also found a significant correlation between NaHCO3-Pi, NaOH-Pi, and grain yield. Furthermore, our results demonstrated that high levels of NaHCO3-Pi and labile P are not conducive to pear production (Table 2). Therefore, optimizing fertilizer usage, particularly phosphorus fertilizer rates, is crucial for maximizing the yield potential of planting and mowing ryegrass.

5. Conclusions

This study demonstrates that planting and mowing ryegrass can effectively enhance pear yield while reducing titratable acidity and mitigating soil P leaching risk. The observed benefits were primarily associated with reductions in key P fractions, including NaHCO3-Pi, labile P, and intermediate P, particularly in the 0–40 cm soil layer. The MF treatment also led to lower Olsen-P and CaCl2-P concentrations at most growth stages, indicating a decreased risk of P loss. These findings suggest that integrating planting and mowing ryegrass into orchard management practices may offer a sustainable approach to improving fruit production and reducing the risk of P loss. Future research should focus on optimizing implementation strategies and elucidating the underlying microbial mechanisms driving these effects.

Supplementary Materials

The following supporting information can be downloaded at https://www.mdpi.com/article/10.3390/agronomy15061296/s1: Table S1: Effects of year, fertilization treatment, growth period, and their interactions on leaf nutrient content and pear tree growth. Table S2: Environmental explanation of the changes in soil bacterial community by RDA analysis. SOM, soil organic matter; TP, total phosphate; AN, alkali-hydrolysable N; AP, available phosphate; AK, available potassium. Table S3: The leaf P content, SPAD, new shoot length, and new shoot thickness of the NG and MF treatments in 2022 and 2023. N.S. means no data.

Author Contributions

H.F.: Conceptualization, Formal analysis, Writing—original draft. Q.M.: Formal analysis, Writing—review and editing. H.C.: Formal analysis, Writing—review and editing. L.W.: Formal analysis, Writing—review and editing. Y.Y.: Formal analysis. All authors have read and agreed to the published version of the manuscript.

Funding

This research was financed by the University-enterprise cooperation project of Luniao county, China (2020330004002089); Zhejiang Provincial Natural Science Foundation of China (LZ23C150002); Zhejiang Key Research and Development Program (2022C02018, 2023C02016); and Xiangshan County Science and Technology Plan Project (2024C1009).

Data Availability Statement

Data will be made available on request.

Conflicts of Interest

The authors declare that they have no known competing financial interests or personal relationships that could have appeared to influence the work reported in this paper.

References

  1. Wang, M.; Ma, L.; Strokal, M.; Chu, Y.; Kroeze, C. Exploring nutrient management options to increase nitrogen and phosphorus use efficiencies in food production of China. Agric. Syst. 2018, 163, 58–72. [Google Scholar] [CrossRef]
  2. Wang, H.; Tang, S.; Han, S.; Li, M.; Cheng, W.L.; Bu, R.Y.; Cao, W.D.; Wu, J. Effects of long-term substitution of chemical fertilizer with Chinese milk vetch on soil phosphorus availability and leaching risk in the double rice systems of Eastern China. Field Crops Res. 2023, 302, 109047. [Google Scholar] [CrossRef]
  3. Tao, L.; Wen, X.C.; Li, H.; Huang, C.Q.; Jiang, Y.J.; Liu, D.; Sun, B. Influence of manure fertilization on soil phosphorous retention and clay mineral transfractionation: Evidence from a 16-year long-term fertilization experiment. Appl. Clay Sci. 2021, 204, 106021. [Google Scholar] [CrossRef]
  4. Yang, X.Y.; Chen, X.W.; Yang, X.T. Effect of organic matter on phosphorus adsorption and desorption in a black soil from Northeast China. Soil Till. Res. 2019, 187, 85–91. [Google Scholar] [CrossRef]
  5. Fu, H.R.; Ma, Z.B.; Wang, X.J.; Chen, K.J.; Han, K.F.; Ma, Q.X.; Wu, L.H. Sustainable strategies related to soil fertility, economic benefit, and environmental impact on pear orchards at the farmer scale in the Yangtze River Basin, China. Environ. Sci. Pollut. Res. 2022, 30, 17316–17326. [Google Scholar] [CrossRef]
  6. Chen, H.; Chen, M.L.; Lia, D.J.; Mao, Q.G.; Zhang, W.; Mo, J.M. Responses of soil phosphorus availability to nitrogen addition in a legume and a non-legume plantation. Geoderma 2018, 322, 12–18. [Google Scholar] [CrossRef]
  7. Mahmood, M.; Tian, Y.; Ma, Q.; Hui, X.; Elrys, A.S.; Ahmed, W.; Mahmood, S.; Wang, Z. Changes in phosphorus fractions in response to long-term nitrogen fertilization in loess plateau of China. Field Crops Res. 2021, 270, 108207. [Google Scholar] [CrossRef]
  8. Niederberger, J.; Kohler, M.; Bauhus, J. Distribution of phosphorus fractions with different plant availability in German forest soils and their relationship with common soil properties and foliar P contents. Soil 2019, 5, 189–204. [Google Scholar] [CrossRef]
  9. Gao, X.; Shi, D.; Lv, A.; Wang, S.; Yuan, S.; Zhou, P.; An, Y. Increase phosphorus availability from the use of alfalfa (Medicago sativa L) green manure in rice (Oryza sativa L.) agroecosystem. Sci. Rep. 2016, 6, 36981. [Google Scholar] [CrossRef]
  10. Haynes, R.; Mokolobate, M. Amelioration of Al toxicity and P deficiency in acid soils by additions of organic residues: A critical review of the phenomenon and the mechanisms involved. Nutr. Cycl. Agroecosyst. 2001, 59, 47–63. [Google Scholar] [CrossRef]
  11. Requejo, M.I.; Eichler-Löbermann, B. Organic and inorganic phosphorus fractions in soil as affected by long-term application of organic amendments. Nutr. Cycl. Agroecosyst. 2014, 100, 245–255. [Google Scholar] [CrossRef]
  12. Azeez, J.O.; Van Averbeke, W. Effect of manure types and period of incubation on phosphorus-sorption indices of a weathered tropical soil. Commun. Soil Sci. Plant Anal. 2011, 42, 2200–2218. [Google Scholar] [CrossRef]
  13. Srivastava, A.K.; Huchche, A.D.; Ram, L.; Singh, S. Yield prediction in intercropped versus monocropped citrus orchards. Sci. Hortic. 2007, 114, 67–70. [Google Scholar] [CrossRef]
  14. Bai, G.S.; Zheng, S.L.; Zou, C.Y.; Du, S.N. Influence of Interplant Herbage on Soil Moisture and Apple Tree Growth in Dry Plateau of Eastern Gansu. Acta Agrestia Sin. 2018, 26, 173–183. [Google Scholar]
  15. Heckrath, G.; Brookes, P.C.; Poulton, P.R.; Goulding, K.W.T. Phosphorus leaching from soils containing different phosphorus concentrations in the Broadbalk experiment. J. Environ. Qual. 1995, 24, 904–910. [Google Scholar] [CrossRef]
  16. Hesketh, N.; Brookes, P.C. Development of an indicator for risk of phosphorus leaching. J. Environ. Qual. 2000, 29, 105–110. [Google Scholar] [CrossRef]
  17. Hua, K.K.; Zhang, W.J.; Guo, Z.B.; Wang, D.Z.; Oenema, O. Evaluating crop response and environmental impact of the accumulation of phosphorus due to longterm manuring of vertisol soil in northern China. Agric. Ecosyst. Environ. 2016, 219, 101–110. [Google Scholar] [CrossRef]
  18. Li, H.; Huang, G.; Meng, Q.; Ma, L.; Yuan, L.; Wang, F.; Zhang, W.; Cui, Z.; Shen, J.; Chen, X.; et al. Integrated soil and plant phosphorus management for crop and environment in China. A review. Plant Soil 2011, 349, 157–167. [Google Scholar] [CrossRef]
  19. Zhang, Q. A preliminary observation on the vertical distribution of the roots of pear trees. J. Tarim Agric. Univ. 1997, 1, 54–556. [Google Scholar]
  20. Bao, S.D. Soil and Agricultural Chemistry Analysis; Agriculture Publication: Beijing, China, 2000; pp. 355–356. [Google Scholar]
  21. Hedley, M.J.; Stewart, J.W.B.; Chauhan, B.S. Changes in inorganic and organic soil phosphorus fractions induced by cultivation practices and by laboratory incubations. Soil Sci. Soc. Am. J. 1982, 46, 970–976. [Google Scholar] [CrossRef]
  22. Sui, Y.; Thompson, M.L.; Shang, C. Fractionation of soil phosphorus in a Mollisol amended with biosolids. Soil Sci. Soc. Am. J. 1999, 63, 1174–1180. [Google Scholar] [CrossRef]
  23. Fu, H.R.; Chen, H.; Ma, Q.X.; Han, K.G.; Wu, S.F.; Wu, L.H. Effect of planting and mowing cover crops as livestock feed on soil quality and pear production. Front. Plant Sci. 2023, 13, 1105308. [Google Scholar] [CrossRef] [PubMed]
  24. Jensen, J.L.; Eriksen, J.; Thomsen, I.K.; Munkholm, L.J.; Christensen, B.T. Cereal straw incorporation and ryegrass cover crops: The path to equilibrium in soil carbon storage is short. Eur. J. Soil Sci. 2022, 73, e13173. [Google Scholar] [CrossRef]
  25. Schmidt, J.P.; Buol, S.W.; Kamprath, E.J. Soil phosphorus dynamics during seventeen years of continuous cultivation: Fractionation analyses. Soil Sci. Soc. Am. J. 1996, 60, 1168–1172. [Google Scholar] [CrossRef]
  26. Cross, A.F.; Schlesinger, W.H. A literature review and evaluation of the Hedley fractionation: Applications to the biogeochemical cycle of soil phosphorus in natural ecosystems. Geoderma 1995, 64, 197–214. [Google Scholar] [CrossRef]
  27. Shen, J.B.; Yuan, L.X.; Zhang, J.L.; Li, H.G.; Bai, Z.H.; Chen, X.P.; Zhang, W.F.; Zhang, F.S. Phosphorus dynamics: From soil to plant. Plant Physiol. 2011, 156, 997–1005. [Google Scholar] [CrossRef]
  28. Joan, R.; Blanco-Moreno, J.M.; Sans Francesc, X. Phosphorus mobilization in lowP arable soils may involve soil organic C depletion. Soil Biol. Biochem. 2017, 113, 250–259. [Google Scholar]
  29. Hou, E.; Luo, Y.; Kuang, Y.; Chen, C.R.; Lu, X.K.; Jiang, L.F.; Luo, X.Z.; Wen, D.Z. Global meta-analysis shows pervasive phosphorus limitation of aboveground plant production in natural terrestrial ecosystems. Nat. Commun. 2020, 11, 637. [Google Scholar] [CrossRef]
  30. Khan, A.; Jin, X.; Yang, X.; Guo, S.; Zhang, S. Phosphorus Fractions Affected by Land Use Changes in Soil Profile on the Loess Soil. J. Soil Sci. Plant Nutr. 2021, 21, 722–732. [Google Scholar] [CrossRef]
  31. Srivastava, R.; Basu, S.; Kumar, R. Phosphorus starvation response dynamics and management in plants for sustainable agriculture. J. Plant Biochem. Biotechnol. 2021, 30, 829–847. [Google Scholar] [CrossRef]
  32. Kokulan, V.; Ige, D.; Akinremi, O.O. Agri-environmental implications of N- and P-based manure application to perennial and annual cropping systems. Nutr. Cycl. Agroecosyst. 2022, 122, 205–218. [Google Scholar] [CrossRef]
  33. Bai, Z.H.; Li, H.G.; Yang, X.Y.; Zhou, B.K.; Shi, X.J.; Wang, B.R.; Li, D.C.; Shen, J.B.; Chen, Q.; Qin, W.; et al. The critical soil P levels for crop yield, soil fertility and environmental safety in different soil types. Plant Soil 2013, 372, 27–37. [Google Scholar] [CrossRef]
  34. Johnston, A.E.; Poulton, P.R.; White, R.P. Plant-available soil phosphorus. Part two: He response of arable crops to Olsen O on a sandy clay loam and a silty clay loam. Soil Use Manag. 2012, 29, 12–21. [Google Scholar] [CrossRef]
  35. Fu, H.R.; Chen, H.; Ma, Q.X.; Chen, B.; Wang, F.Y.; Wu, L.H. Planting and mowing cover crops as livestock feed to synergistically optimize soil properties, economic profit, and environmental burden on pear orchards in the Yangtze River Basin. J. Sci. Food Agric. 2023, 103, 6680–6688. [Google Scholar] [CrossRef]
  36. Fang, L.F.; Shi, X.J.; Zhang, Y.; Yang, Y.H.; Zhang, X.L.; Wang, X.Z. The effects of ground cover management on fruit yield and quality: A meta-analysis. Arch. Agron. Soil Sci. 2021, 40, 1937607. [Google Scholar] [CrossRef]
  37. Garcia, L.; Celette, F.; Gary, C.; Ripoche, A.; Hector, V.G.; Metay, A. Management of service crops for the provision of ecosystem services in vineyards: A review. Agric. Ecosyst. Environ. 2018, 251, 158–170. [Google Scholar] [CrossRef]
  38. Wei, H.; Xiang, Y.Z.; Liu, Y.; Zhang, J.E. Effects of sod cultivation on soil nutrients in orchards across China: A meta-analysis. Soil Tillage Res. 2017, 169, 16–24. [Google Scholar] [CrossRef]
  39. Fu, H.R.; Ma, Q.X.; Ma, Z.B.; Hu, Y.Z.; Liu, F.; Chen, K.J. Quantifying key internal and external yield-limiting factors for Chinese pear in smallholder dominant areas. HortScience 2021, 56, 1395–1401. [Google Scholar] [CrossRef]
  40. Chen, X.; Yan, X.; Wang, M.; Cai, Y.; Weng, X.; Su, D.; Guo, J.; Wang, W.; Hou, Y.; Ye, D.; et al. Long-term excessive phosphorus fertilization alters soil phosphorus fractions in the acidic soil of pomelo orchards. Soil Res. 2022, 215, 105214. [Google Scholar] [CrossRef]
Figure 1. The concentrates of soil properties at 0–20 cm (a) and 20–40 cm (b) and P fractions (c) of NG and MF treatments under different growth stages.
Agronomy 15 01296 g001
Figure 2. Leaf potassium (K) content (a) and new shoot growth (b) under different treatments at different stages. Different letters indicate significant differences (p < 0.05).
Agronomy 15 01296 g002
Figure 3. The Olsen-P and CaCl2-P contents of NG and MF treatment under different growth stages in 2022 (a,b) and 2023 (c,d). NG, natural grass; MF, planting and mowing ryegrass. Different letters indicate significant differences (p < 0.05); ns, no significant difference.
Agronomy 15 01296 g003
Figure 4. The relationship between soil properties and P leaching risk indicators (Olsen-P and CaCl2-P) in 0–20 cm (a) and 20–40 cm (b) depths.
Agronomy 15 01296 g004
Figure 5. The relationship between soil P fraction, soil properties, and crop production at different soil depths in 2022 (a,b) and 2023 (c,d). AC, titratable acid; SS, soluble solids; VC, Vitamin C; SSu, soluble sugar. * and ** represent the significance at the 0.05 and 0.01 level, respectively.
Agronomy 15 01296 g005
Figure 6. The critical levels of the soil Olsen-P for and CaCl2-P of different depths in 2022 (a,b) and 2023 (c,d). * indicates significant correlation.
Agronomy 15 01296 g006
Table 1. The soluble solids, titratable acid, VC, and soluble sugars of the NG and MF treatments in 2022 and 2023. Rows of the same year with different letters indicate significant differences (p < 0.05).
YearTreatmentYield
(t ha−1)
Benefit
(Thousand CNY ha−1)
Soluble Solids
(%)
Titratable Acids (%)VC
(mg/100 g)
Soluble Sugars (%)
2022NG6.58 ± 1.16 b61.33 ± 1.86 b11.45 ± 0.63 a0.17 ± 0.05 a5.19 ± 1.44 a16.90 ± 3.17 a
MF7.55 ± 0.56 a69.62 ± 0.89 a12.00 ± 1.13 a0.13 ± 0.02 b4.47 ± 1.21 a16.50 ± 2.43 a
2023NG18.58 ± 2.52 b253.11 ± 4.04 b10.01 ± 0.46 a0.17 ± 0.11 a2.29 ± 0.50 b9.28 ± 2.14 a
MF21.49 ± 23.08 a292.65 ± 49.08 a10.80 ± 0.70 a0.09 ± 0.01 b2.77 ± 0.58 a8.90 ± 2.59 a
Table 2. Effects of treatment, year, growth period, and their interactions on soil properties in different soil layers. The numbers in the table represent significance, and those less than 0.05 are significant. Significant differences are marked in bold.
DepthIndicatorspHSOCANAKTPOlsen-PCaCl2-P
0–20 cmTreatment (T)0.280.680.060.000.050.000.00
Year (Y)0.070.490.620.530.410.190.93
Growth Period (G)0.000.000.010.000.070.000.00
T × Y0.000.200.920.390.880.180.24
T × G0.190.570.000.000.000.000.00
Y × G0.000.270.520.010.720.040.01
T × Y × G0.190.990.620.210.570.990.88
20–40 cmTreatment (T)0.010.130.000.000.000.000.00
Year (Y)0.080.070.070.660.180.100.01
Growth Period (G)0.000.000.000.010.040.030.00
T × Y0.170.020.000.320.650.020.00
T × G0.040.250.000.040.030.000.00
Y × G0.190.800.680.010.740.010.00
T × Y × G0.500.800.050.150.380.040.00
Table 3. The percentage of the explained variance (Varex) and top three importance (percentage of increase in mean square error, %IncMSE) of variables to the change in yield and AC using the random forest models in 2022 and 2023.
YearDepthRankYieldAC
Variable%IncMseVarex
(%)
Variable%IncMseVarex
(%)
20220–20 cm1AK6.6315.8Intermediate P6.7217.2
2Residual-Pt5.32NaOH-Pi5.07
3Intermediate P4.75Residual-Pt3.77
20–40 cm1AK6.3316.73NaOH-Pi7.089.24
2C.HCl-Po5.44NaOH-Po3.56
3NaOH-Po4.50AK3.52
20230–20 cm1NaHCO3-Pi9.7742.35Labile P9.5878.92
2Labile P8.09NaHCO3-Pi9.95
3NaOH-Pi7.22NaOH-Pi8.52
20–40 cm1Labile P8.5834.05Labile P10.1168.12
2NaHCO3-Pi7.88NaHCO3-Pi10.40
3Intermediate P6.24Intermediate P8.64
Disclaimer/Publisher’s Note: The statements, opinions and data contained in all publications are solely those of the individual author(s) and contributor(s) and not of MDPI and/or the editor(s). MDPI and/or the editor(s) disclaim responsibility for any injury to people or property resulting from any ideas, methods, instructions or products referred to in the content.

