Article

Carbon Input and Crop Residue Placement Determine the Carbon Sequestration Efficiency of Soil Management Techniques

1
Department of Agricultural, Food and Forest Science, University of Palermo, 90100 Palermo, Italy
2
Department of Economics, Business and Statistics, University of Palermo, 90100 Palermo, Italy
*
Author to whom correspondence should be addressed.
Agronomy 2025, 15(6), 1293; https://doi.org/10.3390/agronomy15061293 (registering DOI)
Submission received: 23 April 2025 / Revised: 21 May 2025 / Accepted: 22 May 2025 / Published: 25 May 2025
(This article belongs to the Section Soil and Plant Nutrition)

Abstract

:
This paper aimed to study soil organic carbon (SOC) sequestration under no-tillage (NT) and full inversion tillage (FIT) soil management systems as influenced by crop residue placement. A five-year piece of research was carried out in western Sicily, Italy, on an Opuntia ficus-indica orchard (C-CAM soil) located in a semi-arid Mediterranean climate. Barley was sown annually in the orchard inter-rows at 180 kg ha−1. FIT and NT were compared in interaction with two barley residue managements: (i) removed (rem) and (ii) retained in the field (ret), laid in a split-plot design, with soil management as the main plot and residue management as the sub-plot. The main plot was arranged on two inter-rows, 108 m long and 5 m wide each, replicated three times. SOC (%) and carbon natural abundance (δ13C‰) were determined by using an EA-IRMS. The highest biomass turnover was achieved by FITret (0.85%) vs. NTret (0.46%). The distribution of SOC showed higher values for NT in the top 10 cm soil layer (6.3 g kg−1 in NTret vs. 5.0 g kg−1 in FITret) but lower carbon content in deeper layers. At a depth of 30 cm, FITret maintained 4.4 g kg−1 of SOC, while NTret reached only 3.7 g kg−1, confirming that tillage facilitates the transport and stabilization of carbon in deeper layers. Our results also suggested that when crop residues are left on the soil surface instead of being incorporated into the soil, this may limit the effectiveness of carbon sequestration. Under the experimental tested conditions, which include low susceptibility to erosion processes, the FIT system proved to be an optimal strategy to enhance SOC sequestration and improve the sustainability of agricultural systems in a semi-arid Mediterranean environment.

1. Introduction

The issue of enhancing organic carbon sequestration in agricultural soils and its potential in achieving some mitigation of atmospheric carbon dioxide has long been debated, often with contrasting and inconclusive results [1,2].
However, regardless of the climate debate, there is a general consensus that soil organic carbon (SOC) stocks need to be restored, enhanced, and improved [3] and that the most concrete option to at least stabilize current carbon stocks in agricultural soils is through appropriate recommended management practices (RMPs) as part of a broader sustainable land management (SLM) strategy [4]. Several cultivation practices are thought to be beneficial for increasing soil carbon accumulation, such as cover cropping, manuring, crop rotation, mulching, or incorporation of crop residues [5,6,7]. These RMPs also bring parallel benefits on soil quality, including, among others, erosion control, productivity, soil water retention, and general resilience to degradation processes of the agricultural soil systems. However, highly variable results can be expected from site to site [8] also because of different soil management techniques adopted [9,10] and the related degree of disturbance effect that can ultimately strongly influence the net carbon balance of agricultural soils [11].
In the Mediterranean environments, the SOC stock of soils managed under conservation agriculture criteria such as no-tillage (NT) or reduced tillage (RT) often exceeds that of conventionally tilled soils (CT) or Full Inversion Tillage (FIT) [12,13,14,15,16], allowing an increase in SOC stock up to approximately 0.3–0.4 Mg C ha−1 yr−1 [17]. Additionally, FIT is alleged to increase CO2 emissions per unit biomass [18] and soil organic carbon losses due to increased soil erosion and runoff.
As NT farming has gained an important place among the most RMPs worldwide [4], it is therefore essential to fully establish the potential of NT for SOC accumulation and the factors that may be responsible for the effectiveness of this process [6,19]. The possible factors which may influence the relative C sequestration under different soil management systems are the pedo-climatic characteristics and the considered sampling depth and crop characteristics, including the magnitude of crop residues such as straw, roots, root exudates, shoots, pruning residues, etc. [20], and their management [21].
Crop residue management has a pivotal role in determining the fate of C balance in the soil, especially in semi-arid environments, and it is generally recognized that C sequestration potential can be increased if crop residues are incorporated in the soil system and/or left in the system [1,22]. On the one hand, in the case of the incorporation of crop residues into the soil through tillage, it should be considered that tillage increases the soil’s susceptibility to degradation and accelerates the mineralization of soil organic matter (SOM) [15]. On the other hand, it has been suggested that, under NT, SOC stock could increase only when it promotes higher annual crop residue production because of a higher crop production in comparison to inversion tillage and this is more likely to occur in semi-arid environments under NT only where higher soil water content and higher crop yields than FIT can be expected [23]. In other words, NT would perform better than FIT under dry climates and vice versa. Lower or equal C storage under NT could, in some cases, be partly attributed to lower crop yields and C inputs due to the lack of residue incorporation [24].
In Mediterranean agroecosystems based on durum wheat cultivation, straw return to the soil is essential to quickly reach and then maintain a stable SOC level, and therefore, this should be encouraged as an RMP with multiple benefits [4,23].
The incorporation of crop residues may, in fact, reduce biodegradation, increasing the C stabilization of fresh residues in comparison with shallow tillage and determining a significantly greater Humification index than under NT [24,25].
Mixing crop residues into the soil with soil inversion (FIT) enhances residue contact with the soil mineral particles and microorganisms and can result in their faster decomposition in comparison to residues left on the soil surface [24], so that more organic matter is converted into a stable pool. As residues are incorporated by tillage, SOM oxidation and the decomposition and breakdown of aggregates increase [26].
Inversion tillage (FIT) also results in a more distributed SOC in the whole tilled depth [20], and on the contrary, under NT, the reduced soil-crop residue interface limits the volume of soil for downward movement of residue derived-C [12] leading to stratification of SOM in the soil profile [10,27] and probably to a more rapid C saturation of the top soil layer [21].
However, numerous meta-analyses and research carried out on SOC sequestration in different areas and under contrasting tillage practices have shown high variable results and that in many cases the difference in SOC stock between NT and CT or FIT was very small or zero and often omit a specific description of residue management and fate, inducing wrong interpretations of the carbon input/residues placement/SOC sequestration relationship [1,20,21,27] and references therein.
This paper aims to demonstrate how the comparative analysis of SOC sequestration in NT and FIT is often influenced by biases due to the underestimation of both the importance of residue placement and the effective quantities buried in the soil.
The hypothesis tested is that the limited input and the consequent placement of carbon into the soil that can be obtained with the application of NT management practices is directly responsible for the lower level of organic carbon sequestered and/or maintained in the soil compared to FIT soil management practices.

2. Materials and Methods

2.1. Site Description

The study was carried out in Montevago, western Sicily, Italy (37°39′ N, 12°58′ E, 300 m a.s.l.), on a 25-year-old 2.3 ha rainfed prickly-pear (Opuntia ficus-indica Mill.) commercial orchard, 3 × 5 m apart. The area is semi-arid with a typical Mediterranean climate, classified as Csa under the Köppen-Geiger climate classification: most of the average annual precipitation (570 mm) falls between October and February; monthly average temperatures range from a minimum of 9.7 °C (January) to a maximum of 25.6 °C (August). The soil of the study area is a Typic Rhodoxeralf [28] (Table 1).

2.2. Experimental Set-Up

Since the Prickly-pear orchard plantation and up to 2017, the orchard was regularly subjected to clean cultivation, consisting of several disk harrow tillage interventions per year at a depth of 30 cm, to control weeds and incorporate pruning residues consisting of about 1.8 Mg fresh weight ha−1 yr−1 cladodes. Afterward, instead of cladode incorporation, barley cultivation was introduced and grown annually between Prickly-pear orchard rows.
In detail, starting from 2018, and for five consecutive years, barley (Hordeum vulgare L.) was seeded yearly in the 5 m wide Prickly-pear orchard inter-rows at 180 kg ha−1, using a seeding machine (Vitigreen—Gaspardo, Morsano, Italy) and yearly pre-sowing fertilized with 60 kg ha−1 of Urea. Barley grains were regularly harvested for commercial purposes with a combine, leaving behind the waste straw in the field. Two soil management systems were compared: FIT, consisting of 30 cm depth disk plowing + 10 cm depth light tillage, and NT, in interaction with two barley residue (straw) managements: (i) removed from the field (rem) and (ii) retained in the field (ret). The experimental design was a split-plot, with soil management as the main plot and barley residue management as the sub-plot. The main plot was arranged on 2 inter-rows, 108 m long and 5 m wide each, replicated three times.

2.3. Soil Sampling and Analysis

In September 2023, at the end of the experimental period, a total of 108 soil samples (4 land uses ∗ 3 sampling points ∗ 3 soil depths) according to a split-plot design with 3 replications were collected at 10, 20, and 30 cm soil depth using a cylinder (10 cm Ø). The samples were dried and sieved at 2 mm for the determination of SOC (%) and carbon natural abundance (δ13C‰) by using an EA-IRMS (elemental analyzer isotope ratio mass spectrometer—NA1500 Carlo Erba, Milan, Italy).
The reference material used for analysis was IA-R001 (Iso-Analytical Limited wheat flour standard, δ13C Vienna Pee Dee Belemnite (V-PDB) = −26.43‰). IA-R001 is traceable to IAEA-CH-6 (International Atomic and Energy Agency, cane sugar, δ13C V-PDB = −10.43‰). IA-R001, IA-R005 (Iso-Analytical Limited beet sugar standard, δ13C V-PDB = −26.03‰) and IA-R006 (Iso-Analytical Limited cane sugar standard, δ13C V-PDB = −11.64‰) were used as quality control for the analysis. The C isotope results were expressed in delta (δ) notation and δ13C values were reported in parts per thousand (‰) relative to the V-PDB standard.
The natural abundance of δ13C was used to determine the ratio of C in SOC that was derived from the new barley crop (δ13C = −27.1‰ and SOC = 47.4%) introduced in the orchard and how much C remained from the previously adopted Prickly-pear’s (CAM plant) pruning residue incorporation (δ13C = −14.0‰ and SOC = 31.4%) in the soil. A mixing equation [29] was applied as follows:
New   carbon   derived   Ncd = δ 13 C n e w δ 13 C o l d δ 13 C b a r l e y δ 13 C o l d
and
Old   Carbon   derived   Ocd = 1 Ncd
where Ncd is the fraction of C derived from barley, δ13Cnew is the isotope ratio of the soil sample, δ13Cbarley is the isotope ratio of the cereal species, and δ13Cold is the SOC isotopic ratio of the previously incorporated Prickly-pear’s pruning residues. Turnover of biomass (mean residence time in years, MRT) was determined as a reciprocal of the rate constant (k) of first-order decay (Equation (3)), according to [30,31].
k = l n 1 N c d ysd  
where ysd (years since disturbance) is the duration of the new management (years).
The soil δ13C, biomass weight, and MRT (the average time the element resides in the carbon pool at steady state) were used to estimate the biomass turnover (Bt) of crop residues in the different soil management and soil layers (see Equation (7)).
The amount of accumulated C, after the introduction of C3 vegetation (barley), corresponds to the portion of Ncd from SOCbulk, as follows:
S O C b a r l e y = N c d S O C b u l k
SOCstock (Mg ha−1) was calculated as
SOCstock = SOCcontent * BD * d/10
where SOC is carbon content (g kg−1), BD is bulk density (Mg m−3) [31], and d is depth thickness (m).

2.4. Carbon Input

In 2023, at harvest time, the dry weight of barley’s residue biomass (straw and stubble) was measured on 12 sample points, 1 m2 each (3 replications for 4 treatments). To evaluate barley biomass placement along the soil profile as influenced by the applied management system, in the same soil cores used for isotopic analyses, barley residues were manually separated from the soil sample, partitioned in straw, stubble, and root fractions, and weighted.
Moreover, to estimate barley’ residue biomass fate over time, the C input (CI) was calculated according to a two-step procedure by the following equation:
C I = C b a r l e y n = 1 M R T 1     e k M R T n
where Cbarley is the carbon content in barley biomass (g kg−1) [barley biomass (g) * C content (g kg−1)]; MRT is the mean residence time calculated using the δ13C isotopic signature shift in SOM after barley cultivation under different soil managements. To calculate the C input derived from biomass, a first-order decay model was used.
Linking Equations (4) and (6), we obtained Equation (7), taking into consideration that not all biomass contributes to C input but only a portion (biomass turnover (Bt)):
S O C N c d = C b a r l e y n = 1 M R T 1     e k M R T n B t
where Bt was derived by re-arranging Equation (7), as follows:
B t = S O C N c d C b a r l e y n = 1 M R T 1     e k M R T n

2.5. Soil Respiration

Potential SOC mineralization was determined at the end of the experimental period by using a short-term (28 days) incubation test. Ten grams of soil samples taken from the previously mentioned soil cores were moistened up to 50% of their water-holding capacity, incubated for five days at room temperature, and thereafter incubated in an air-tight glass bottle at 25 °C in the dark. The emitted CO2 accumulated in the headspace of the bottles was quantified using a gas-chromatograph (Trace GC, Thermo Electron, Thermo Fisher Scientific, Waltham, MA, USA).
The amount of total C mineralized was calculated by the linear interpolation of two neighbouring measured rates and the numerical integration over time as reported in the following equation:
C O 2 C = 1 n r i + r i + 1   d 2 + + r n + r n + 1   d 2
where i is the date of the first measurement of the CO2-C rate, n is the date of the last measurement of the CO2-C rate, r is the CO2-C rate expressed as mg CO2-C kg−1 dry soil, and d is the number of days between the two consecutive CO2 rate measurements (3, 4, 4, 7, 4, 7, and 7 days corresponding to the days after the incubation start of 3, 7, 11, 18, 22, 29, and 36, respectively) [32]. The C mineralization rate was expressed as mg C g−1 day−1 and was fitted to the following first-order decay function:
M i n e r a l i z e d   C = C 0   e k t
where C0 is the readily mineralizable C at time zero (the intercept value), k is the decay rate constant, and t is time.

2.6. Statistical Analysis

Analysis of variances according to the experimental layout was carried out after checking normality and homogeneity (Kolmogorov–Smirnov and Levene’s test, respectively). Differences among means (Tukey’s test at p ≤ 0.05) were carried out using SPSS 18.0 software (IBM Corp. Released 2021, Armonk, NY, USA). A linear model analysis was used to assess the relationship between mineralization coefficient and biomass contribution to SOC.

3. Results and Discussion

3.1. Residue Biomass Input into the Soil

The partitioning of annual biomass of barley’s residues in stubble and straw (kg m−2 dry weight) and the corresponding total annual values of biomass measured at three depths of the soil cores are reported in Table 2. Roots’ contribution to biomass input was not considered due to the presumably small differences among the different treatments. The total available biomass ranged from a minimum of 3.0 (NTrem) to a maximum of 7.08 Mg ha−1 (FITret). The four treatments clearly showed different residue biomass inputs into the soil. In the rem treatments, as expected, straw removal strongly influenced both the residual biomass remaining in the orchard and that incorporated into the soil, corresponding to stubble contribution. The highest value of residue biomass incorporated into the soil was found in the two uppermost soil layers under FITret treatment, corresponding to about 95% of the total (0–30 cm), whereas a negligible amount of biomass was found in the deepest layer, regardless of the treatment. The lowest values were registered for all soil depths in the NT soil management systems, regardless of the straw utilization (ret or rem), corresponding to approximately half compared to FITrem and one seventh compared to FITret.
The ratio between effective incorporated biomass and available biomass was higher under FIT (on an average percentage basis equal to 63.5%), ranging from a max of 0.77 and a min of 0.12 for FITret and NTret, respectively.
These results demonstrate that straw retention is crucial when aiming to increase biomass input into the soil and that better results to this end are obtained under FIT rather than under NT and by this way resulting in higher C stocks. However, it is also recognized that although large quantities of biomass are incorporated into soil, SOC does not necessarily increase. It is therefore essential to examine the impact of crop residue biomass on soil organic carbon (SOC) and its distribution at different depths.

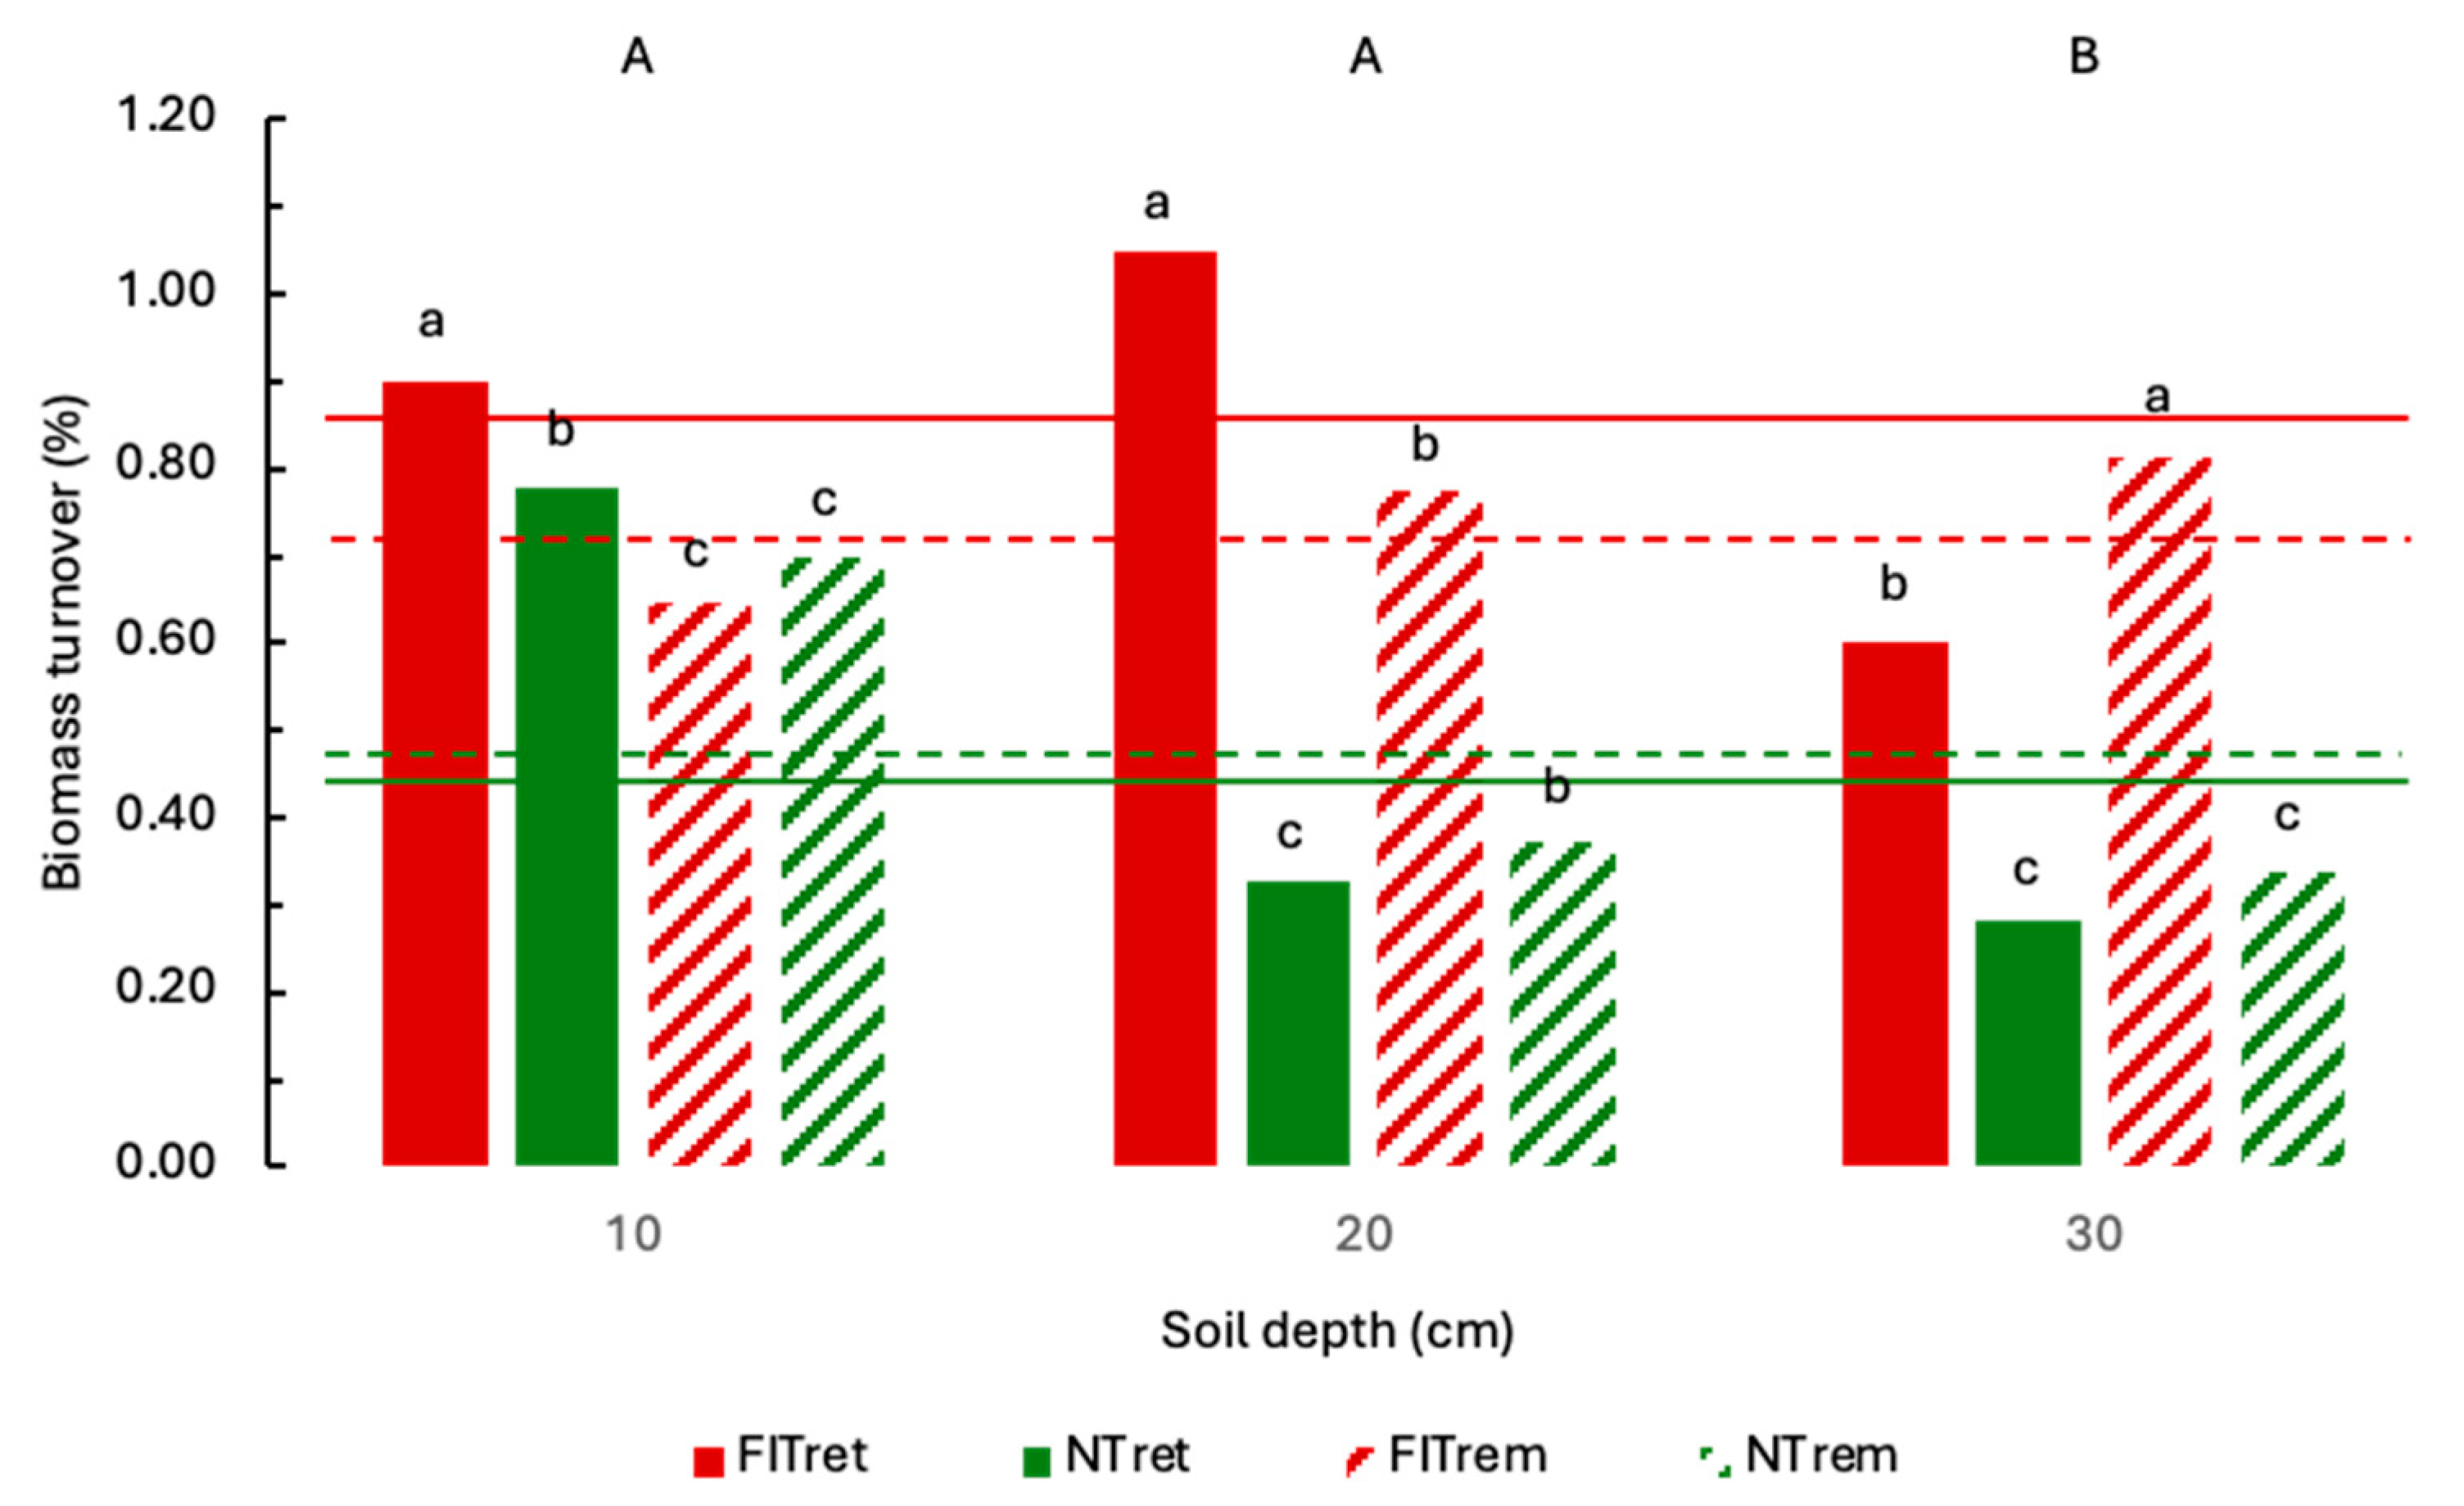
3.2. Biomass Turnover

It is well known that the initial biomass amount does not directly correspond to the final SOC. The biomass turnover, the rate of biomass that is annually transformed into SOC, can be useful in studying carbon sequestration budgeting and dynamics.
The highest biomass turnover value (1.05%) was observed with FITret at 20 cm soil depth, equal to about 3.9 times the lowest one, obtained with NTret at 30 cm (Figure 1). On average, biomass turnover was 70% greater with FIT compared to NT (0.8% and 0.47%, respectively). Significantly higher values of biomass turnover were found for FITret at 10 and 20 cm of soil depth, whereas the highest value at 30 cm was observed under FITrem. At all depths, biomass turnover under NT was consistently lower than that with FITret, particularly at 20 and 30 cm, where the differences between FITret and NTrem were equal to 3.6 and 2.2 times, at 20 and 30 cm, respectively. As a whole, the higher biomass turnover observed in FIT systems suggests that the incorporation of residues by FIT leads to a higher biomass turnover (Figure 1). This confirms previous findings indicating that tillage practices can significantly influence the crop residue decomposition process by increasing straw-soil contact, compared to surface decomposition through NT [32].

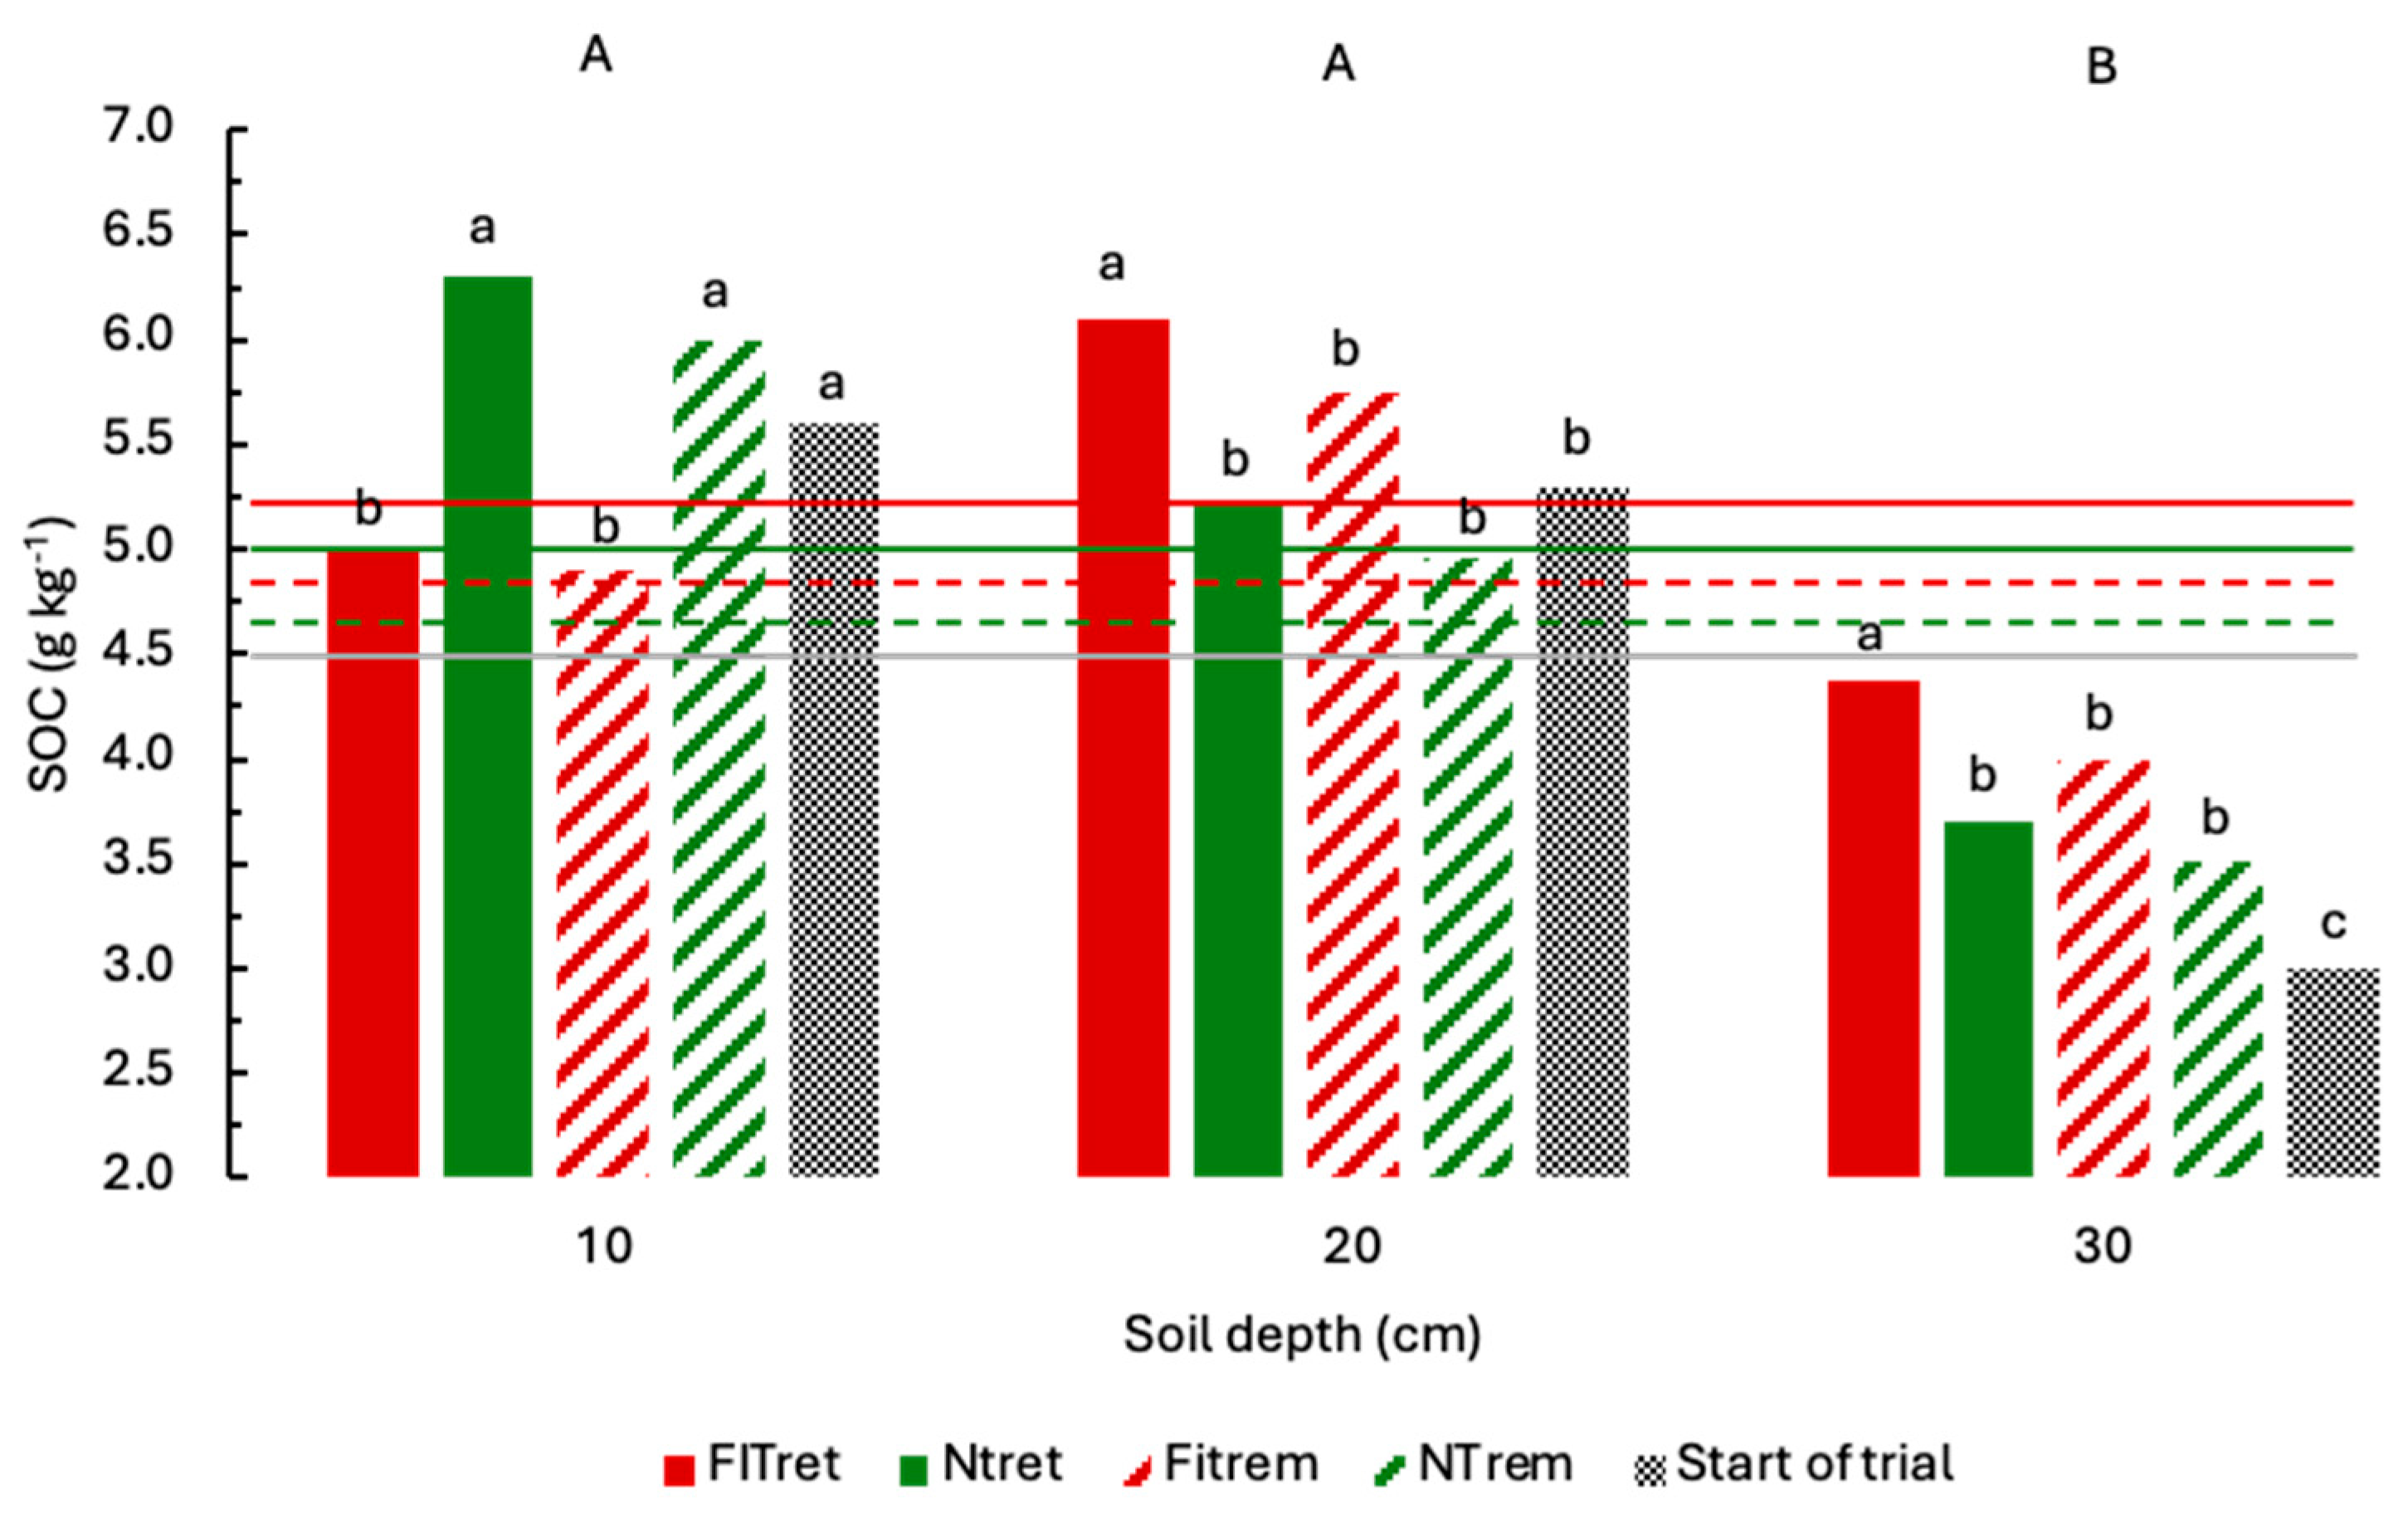
3.3. Soil Organic Carbon (SOC) Placement

Statistical analysis on soil organic carbon, at the end of the experimental period (2018–2023), showed significant differences both in the distribution of organic carbon along soil depth (D) and in the interaction of D with soil management (D*M), while management (M) alone did not have a significant effect (Table 3).
At a depth of 10 cm, FITret and FITrem treatments recorded similar average SOC values, around 5 g kg−1, lower than NT treatments (6.3 and 6.0 g kg−1 for NTret and NTrem, respectively) (Figure 2). However, as the depth increased to 20 cm and 30 cm, FITret consistently outperformed all other treatments in maintaining SOC levels that resulted in a 20% increase with respect to NTrem, at both depths. These results suggest the superior capacity of FIT compared to NT to allocate and stabilize carbon in the deeper soil layers and confirm the assumption that reduced or no tillage may have more effects on SOC in the upper soil layers than in the deeper ones [14,21,27]. At the greatest depth (30 cm), all treatments showed significantly higher amounts of SOC in comparison to the initial values present at the beginning of the trial. In detail, a 32, 19, 25, and 14% improvement was obtained under FITret, NTret, FITrem, and NTrem, respectively, indicating the generalized positive effect on SOC exerted in a C-depleted soil by the introduction of barley’s cultivation, regardless of the applied soil and residue management. This result is consistent with the observation reported by Haddaway et al. [20] that, even with a small input of SOC into the soil profile, the lower the initial SOC level, the greater the increase in SOC.

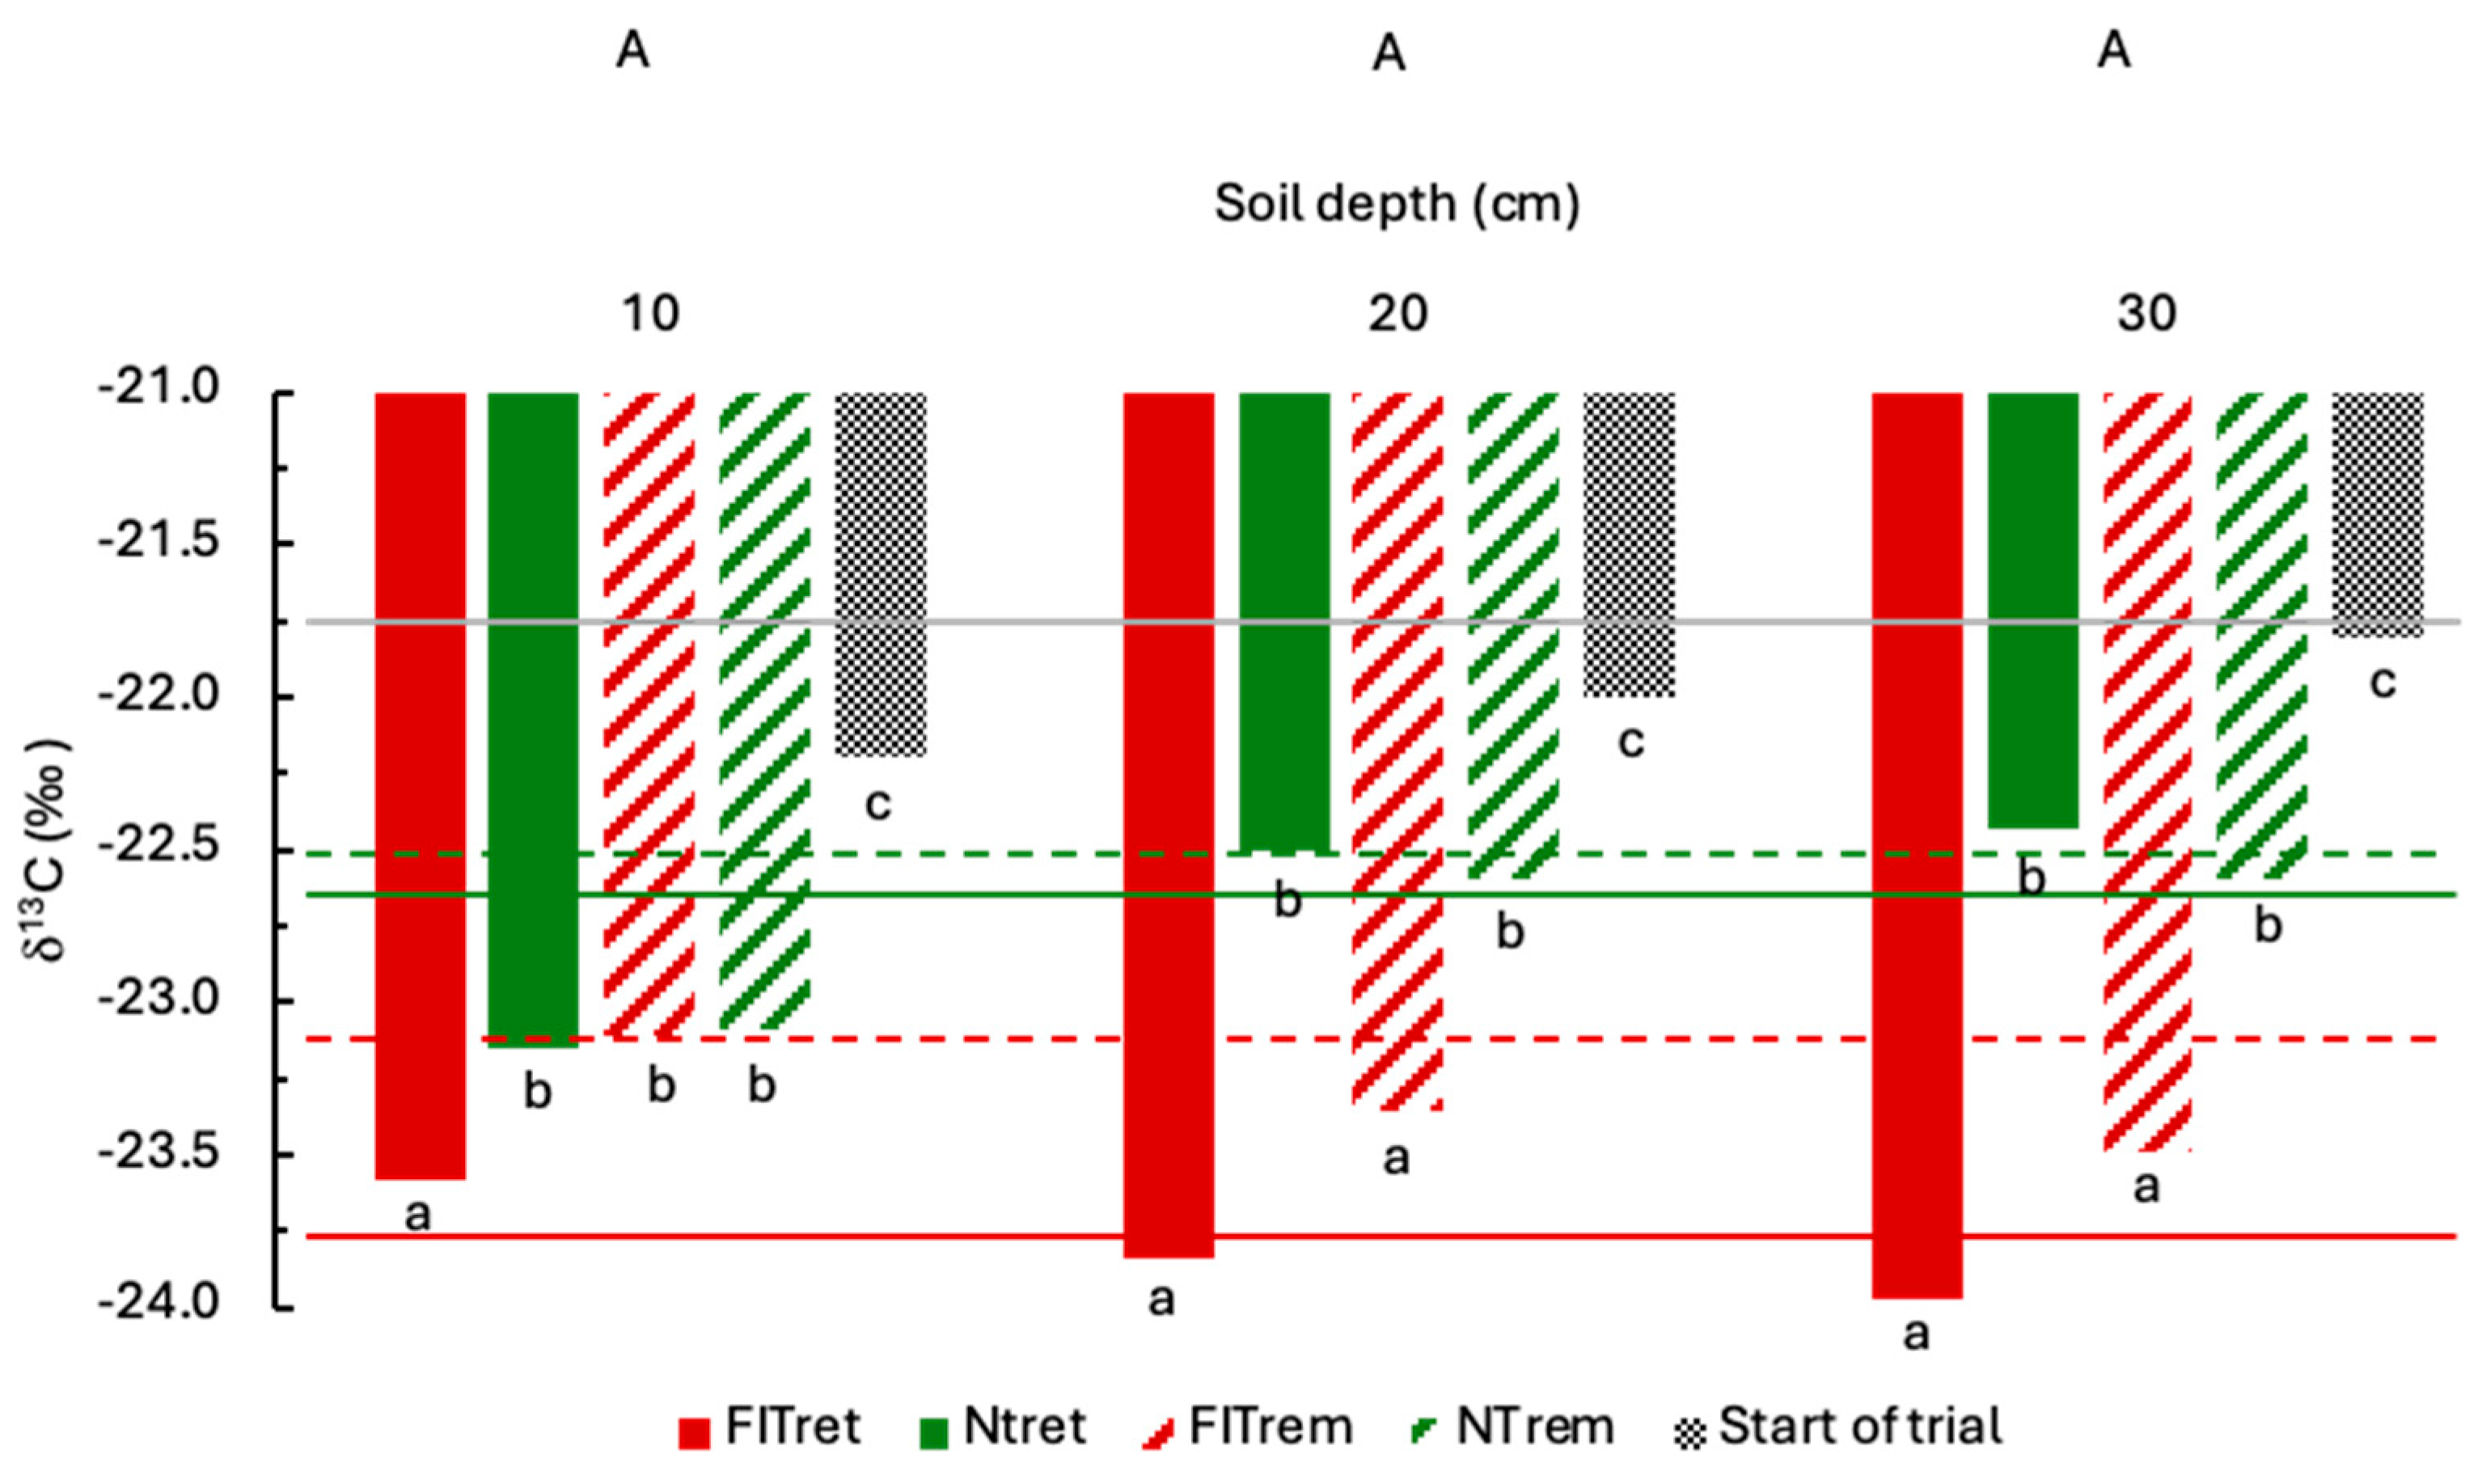
3.4. Carbon Isotopic Signature (δ13C)

The assessment of the stable isotope C (δ13C) concentration over time is a powerful tool to understand the SOC dynamics according to different crop residue management systems. Carbon isotopic signature can be useful to determine changes in SOC stocks when C3–C or CAM-C vegetation (as in our case) is followed or accompanied by vegetation with different isotopic signatures.
The variation in δ13C values along the soil profile revealed key insights into the origin and stabilization of soil carbon. The ANOVA results for δ13C values (Table 4) indicated that both depth (D) and soil management (M) significantly influenced δ13C, as well as their interaction.
Overall, at all depths, all treatments showed significant differences with respect to the initial δ13C values (Figure 3) as a result of the introduction of 5 yr barley cultivation (δ13C = −27.1‰). The highest δ13C difference (+11.1%) compared to the initial value was observed at 30 cm depth under FITret. At a depth of 10 cm, the significantly lowest δ13C value was observed under FITret in comparison to all other treatments, which showed similar values to one another (−23.1‰), indicating a difference of about 2%. Moreover, with increasing depth, FIT showed a tendency toward a further decrease in δ13C values, particularly under FITret and FITrem, ranging on average from −23.9 to −23.4‰, respectively. This trend clearly indicates the progressive effect of barley contribution to δ13C over the previous Opuntia effect and confirms that greater incorporation of recent barley-derived carbon occurred in FIT systems. In contrast, NT treatments showed less pronounced changes along the soil profile, with δ13C values ranging between −22.5 and −23.0‰, suggesting limited residue incorporation and SOC stabilization. Overall, these results are consistent with the above-reported (Figure 2) superior ability of FIT compared to NT to allocate and stabilize barley-derived carbon in deeper soil layers.

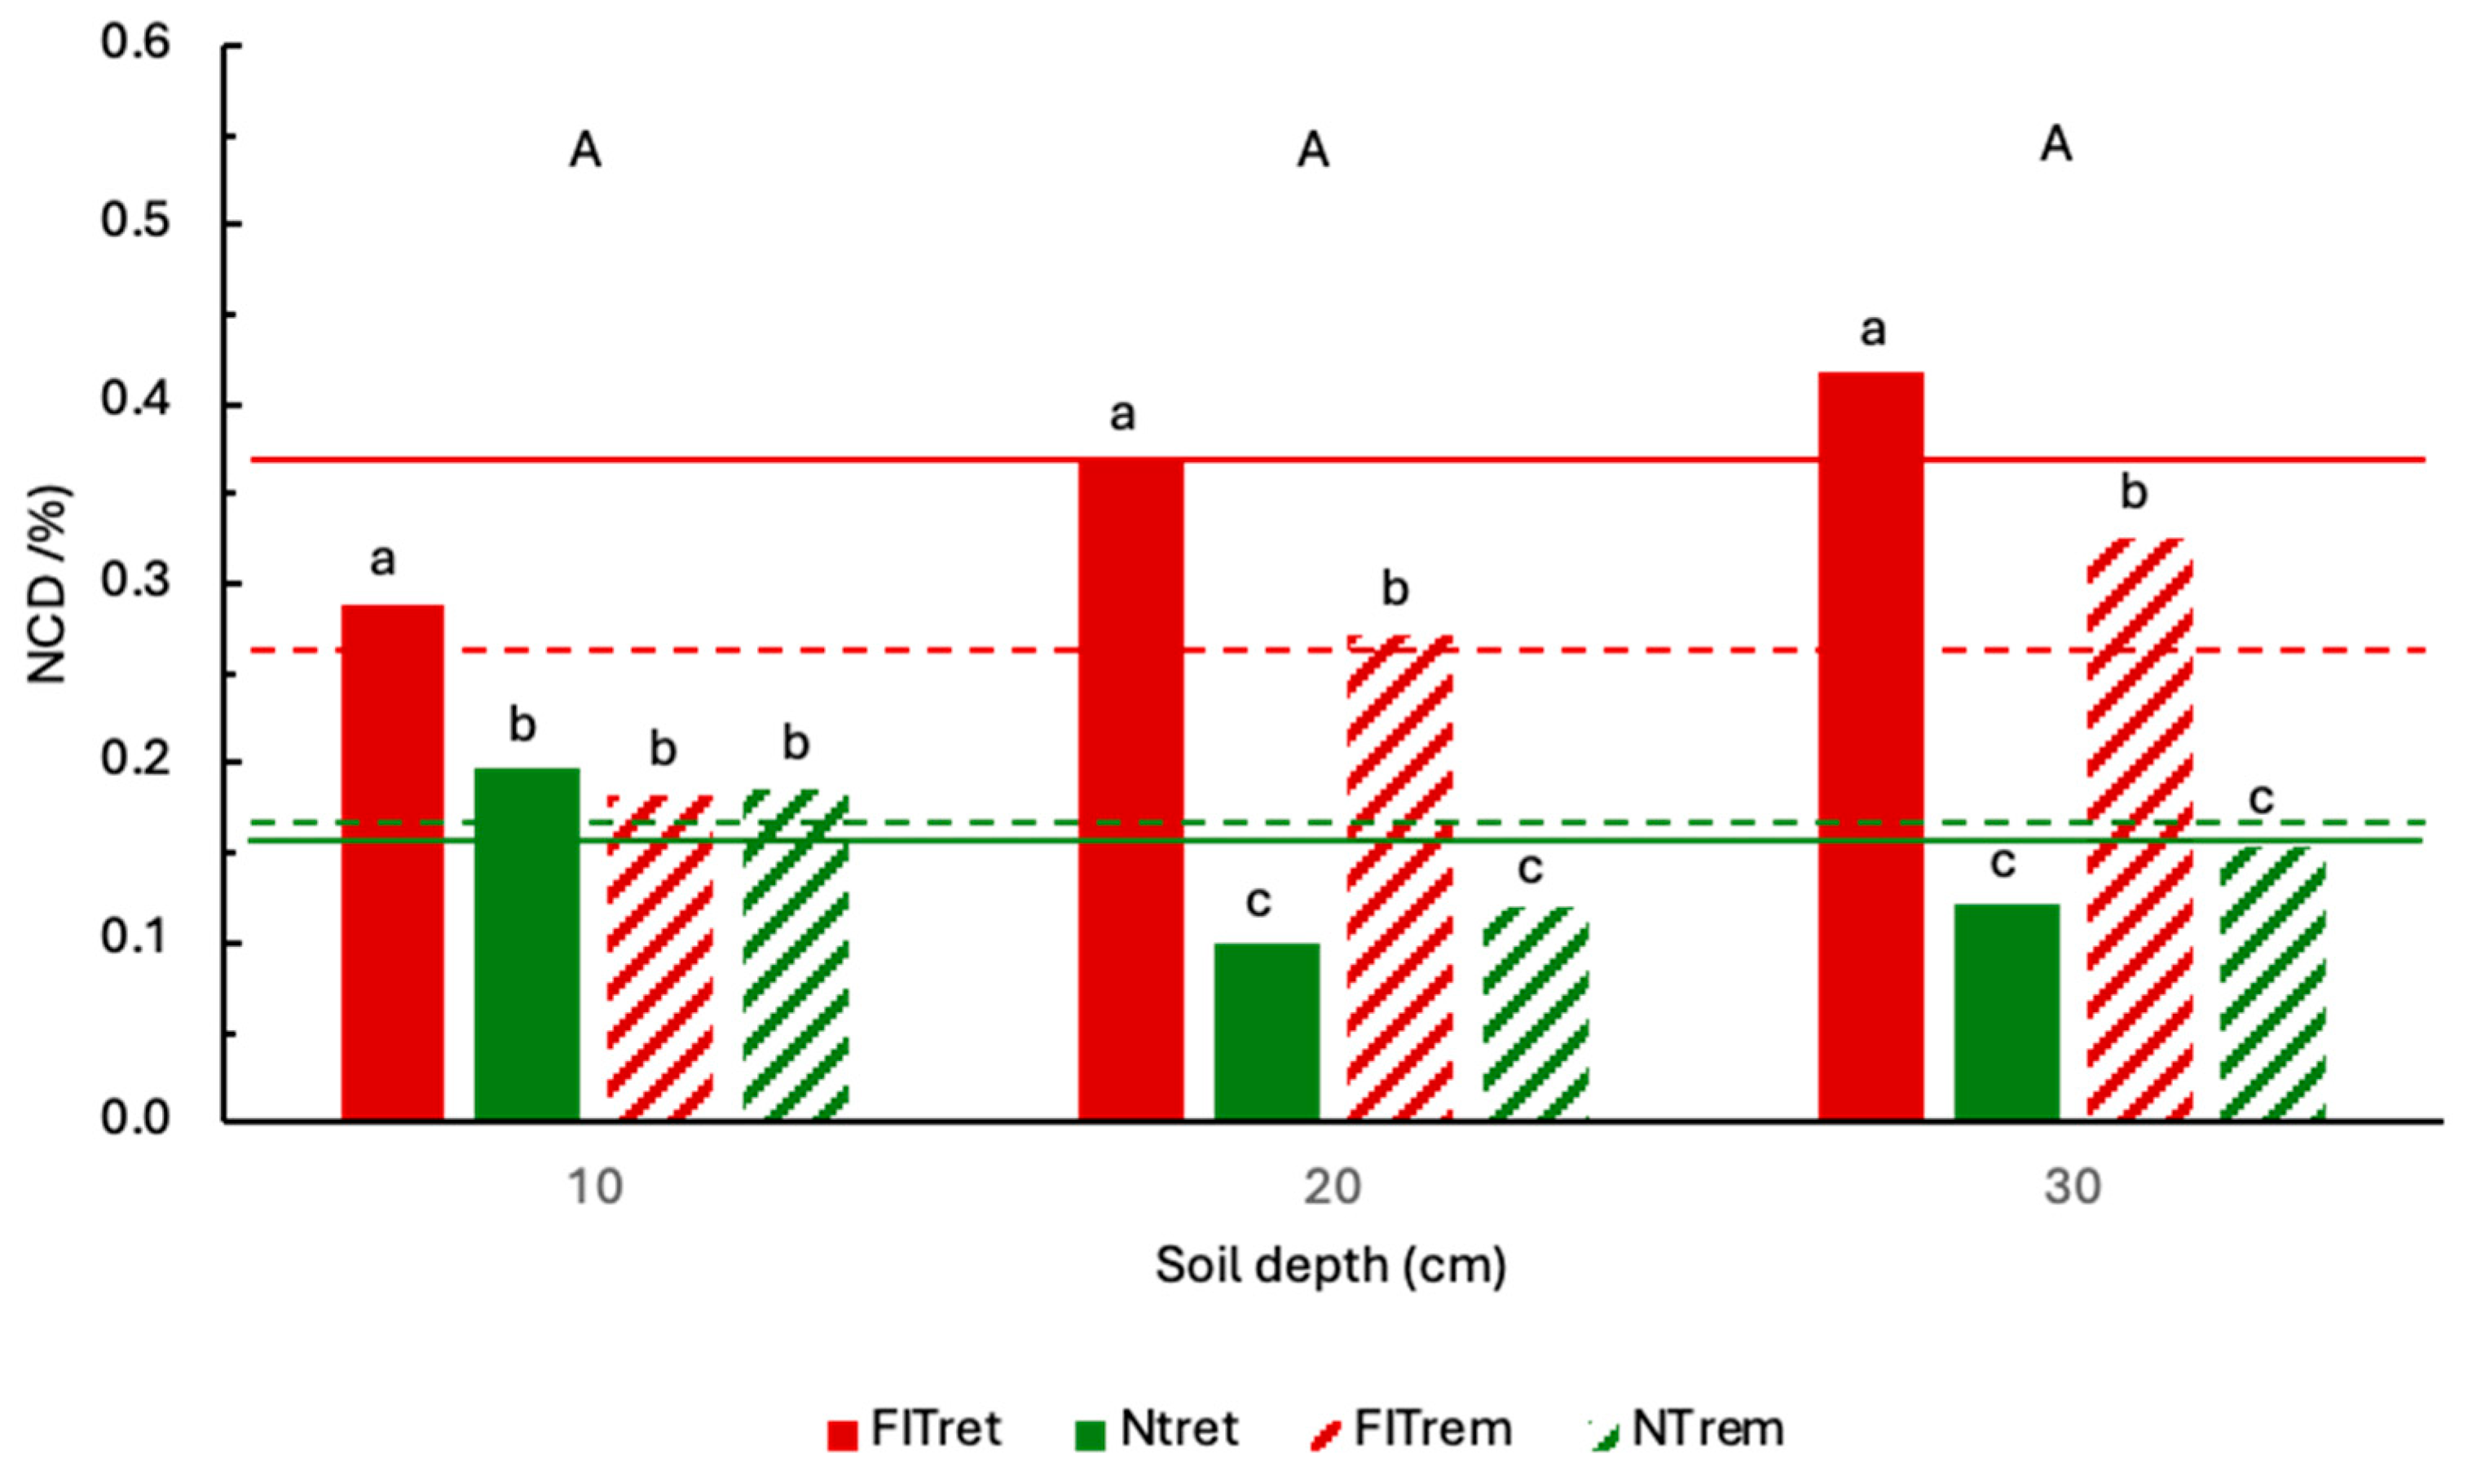
3.5. New Carbon Derived (NCD)

New carbon derived (NCD), calculated according to Equation (1) previously reported, represents the percentage of SOC as contributed at the end of the trial by the introduction of the new crop (barley) in the interrows of the C-CAM soil. This percentage of NCD averaged 0.36% and 0.13% under FIT and NT, respectively. In detail, NCD was significantly higher with FITret at all depths, being equal to 0.29, 0.37, and 0.42% at 10, 20, and 30 cm depth, respectively. Especially at depths greater than 10 cm, NT showed the lowest NCD among all treatments, on average 0.14% (Figure 4). These results showed that the percentage of carbon resulting from barley cultivation was significantly and positively influenced by both soil and residue management, i.e., tillage and residue incorporation. In contrast, with NT soil management, the NCD value (0.14%) remained generally lower than that of FITrem (on average 0.26%), being roughly half compared to FITret (0.36%). This suggests that, in our conditions, barley cultivation, by appropriate soil management and residue handling, can significantly contribute to enhancing total soil carbon content within a five-year period. Overall, this finding confirms the crucial role of adequate maintenance of crop residue [27] and, on the other hand, that removal of residues can adversely affect SOC dynamics as well as several other relevant soil aspects [22].

3.6. Carbon Incorporation Efficiency

Carbon incorporation efficiency (CIE) was calculated as the percentage of the contribution to C input relative to the incorporated biomass. Figure 5 reports the values of incorporated biomass and its contribution to C input, both in terms of g kg−1 soil and the carbon incorporation efficiency (CIE%). The incorporated biomass was highly variable, ranging from a min of 0.78 (NT) to a max of 4.95 g kg−1 soil (FITret). Consequently, FIT management also resulted in a five-fold higher contribution to C input than NT (on average 0.123 vs. 0.0025 g kg−1 soil). This is likely due to the enhanced soil mixing in FIT treatments, which facilitates carbon sequestration in the 0–30 cm layers. On average, carbon incorporation efficiency (CIE%) was 8.7 times higher under FIT treatments than under NTs. CIE was highest with FITret (4.67) and lowest with NTret (0.29), with a great difference, about 5-fold, also between FITret and FITrem (0.91), further confirming both that, on the one hand, tillage plays a pivotal role in redistributing biomass across the soil profile and, on the other hand, that crop residue replenishment is essential to enhance carbon sequestration [9,22,27] (Figure 5).
Although with NTret, residues are retained in the system, their incorporation is limited compared to FIT treatments. Similarly, it has been reported in a meta-analysis study regarding the Mediterranean area [13] that conversion from tillage to NT resulted in significant topsoil SOC enrichment but did not increase the total SOC stock in the whole soil profile. On the other hand, our findings suggest both that NT, while reducing soil disturbance, does not promote biomass integration into deeper soil layers, thus limiting stable carbon accumulation, and that removing crop residues negatively impacts the amount of carbon incorporated in both soil management systems [22]. Additionally, other analyses carried out in different Chinese environments have evidenced a significant positive response of SOCstock to NT farming only when crop residues are returned [27].
Figure 6 illustrates, in detail, how the contribution of biomass (barley) to carbon input (Equation (9)) varies along the soil profile, depending on the management of soil and plant residues. This confirms the above-reported considerations regarding the superior average effect of FIT compared to NT, particularly with the reintegration of plant residues.
It has been reported that NT generally increases SOC content in the top-soil layer relative to FIT [21,22] and even that NT generally sequesters more SOC compared with CT under different pedoclimatic and experimental conditions [8,12,13,16,33]. On the contrary, we found, in line with other research results [21,27], that the potential of NT to sequester SOC for the entire soil profile is rather inconsistent, mainly due to the greater near-surface accumulation of SOC in NT than in CT. In fact, we found a significantly higher carbon input under FITret at all depths, compared to NT, which showed a decreasing trend along the profile. These results underline the positive effect on C sequestration exerted by the incorporation and placement of crop residues as reported by de Oliveira et al. [33], which found a significant effect of NT only with residue retention.

3.7. The Impact of Biomass Input on Soil Organic Carbon Mineralization

The correlation between biomass contribution to SOC (g kg−1) and the mineralization coefficient (k) was examined at 10, 20, and 30 cm depths. At the deepest depth (30 cm), the limited quantity of residues did not show any clear relationship, whereas a significant correlation was found at both 10 and 20 cm even if with a different angular coefficient (Figure 7). Therefore, the shallower the soil layer and the greater the contribution of biomass to SOC, the higher the mineralization index.
As expected, these data suggest more microbial activity and a higher conversion of organic matter into CO2 in the topsoil (10 cm) than at 20 cm depth, where k decreased noticeably.
Figure 8 compares, in detail, the mineralization coefficient (k) at various depths, as affected by the treatment. The results clearly confirm that in the top layer (0–10 cm), k values are higher than in the deeper layers. These data underscore that crop residues under FITret are exposed to the rapid decomposition of organic matter in the upper soil layer, likely due to a more intense microbial activity and favourable environmental conditions for the mineralization process [22,32]. These findings, on the other hand, also indicate a generalized greater carbon retention at deeper soil levels where the mineralization process occurs less intensely, allowing for more significant long-term stability of SOC [15].

3.8. SOC Turnover

Soil C sequestration can be increased, in addition to increasing C supply, both by reducing C turnover and by increasing its residence time in soils. The turnover of soil organic carbon (SOC%) is determined by the ratio between the decomposition rate and the total fraction of organic matter present in the soil. Inversion tillage seems to improve residue humification due to better decomposition conditions, more favourable than on the soil surface [34] Moreover, the incorporation of crop residues more deeply into the soil (between 0 and 30 cm) can increase the stabilization of the residue C input against light incorporation by increasing the soil active microbial component [32]. In fact, residue incorporation is recognized to promote soil aggregation and SOC preservation [24]. In our experimental conditions, SOC turnover significantly increased with soil depth for both FITrem and FITret treatments, reaching a maximum of 0.31% under FITrem at 30 cm depth, significantly higher than all other treatments, with differences of about 94, 63, and 35% compared to NTret, Ntrem and FITret, respectively (Figure 9).
In contrast, NTs showed significantly greater SOC turnover values in the uppermost soil layer than in the deepest one, showing a slight decreasing trend but with no significant differences between NTret and NTrem. Overall, when comparing FIT to NT, the different trend we observed is likely due to both the different amount of C input between FIT and NT, as also affected by residue management (ret/rem), and the reduced soil disturbance under NT, making it less susceptible to oxidation and mineralisation of organic matter. The high C retention with depth occurring under tillage is most likely due to the increased stabilization of newly added C as humic fractions and physically protected SOM that, in turn, may offset the detrimental effects of tillage due to aggregate disruption [35].
These two opposing effects of residue incorporation (i.e., C input increase vs. the stimulation of decomposition) may in part counteract each other and are largely responsible, together with other multiple factors, for the high variability in soil organic C storage that can be found in the literature [8,27,36,37]. Hence, the net overall effect of tillage on soil C stocks may remain moderate and be regulated by crop systems that determine the quantity and quality of crop residues (as carbon input into the soil) and by soil conditions that determine the decomposition process of the incorporated crop residues.

4. Conclusions

The results of this field study confirm that crop residue management significantly affects the quantity and distribution of soil organic carbon (SOC) along the soil profile.
Full-inversion tillage (FIT) was shown to be more effective in incorporating crop residues than no-till management (NT) and had a direct positive impact on SOC stabilization and sequestration, as revealed by the δ13C signature. The incorporation of barley residue led to a higher carbon input into the soil and improved turnover efficiency in FIT management compared to NT systems.
In conclusion, although NT management is often promoted as a strategy for soil conservation and CO2 emission reduction, our results suggest that the related lower integration of residues within the soil profile may limit the effectiveness of carbon sequestration under the tested experimental conditions. In semi-arid environments, NT systems could result in a larger proportion of organic matter being oxidized because being left on the surface rather than stabilized through humification which negatively affects the long-term organic matter balance.
Ultimately, the fate of SOC levels in the soil, determined by the contrasting balance between organic materials returned to the soil and the C lost by microbial respiration or other physical processes, confirm doubts on NT soil carbon sequestration comparative ability that may be greatly reduced, negated, or even reversed when the whole profile is considered.
Although it is well established that soil inversion tillage entails disadvantages such as increased soil erosion and higher energy consumption, among others, our results suggest that a tillage system that combines residue incorporation with moderate ploughing could serve as a recommended management practice to enhance soil carbon sequestration without compromising the agricultural system’s sustainability. Furthermore, considering that returning straw to the soil is essential to quickly reach and then maintain a stable SOC level, incineration, indiscriminate removal, and alternative uses of crop residues, such as for industrial and energy applications, should be carefully evaluated before being adopted.
However, additional research is still needed to clarify the role of other factors, e.g., nitrogen fertilization and residue quality, involved in the soil tillage management effect on C sequestration. This information is essential for a correct estimation of the effective soil C sequestration capacity offered by the different soil management options, including NT and FIT, as well as for the identification, site by site, of the most suitable areas for their application.

Author Contributions

Conceptualization, L.G. and M.S.; Methodology, L.G. and M.S.; Software, L.G. and E.B.; Validation, M.S., E.B., and L.G.; Formal Analysis, L.G. and E.B.; Investigation, M.S. and L.G.; Resources, M.S., L.G., and E.B.; Data Curation, M.S. and L.G.; Writing—Original Draft Preparation, M.S. and L.G.; Writing—Review and Editing, M.S., E.B., and L.G.; Visualization, E.B.; Supervision, L.G. All authors have read and agreed to the published version of the manuscript.

Funding

This research received no external funding.

Data Availability Statement

The data presented in this study are available on request from the authors.

Conflicts of Interest

The authors declare no conflicts of interest.

References

  1. World Resources Institute. Creating a Sustainable Food Future: Final Report; Searchinger, T., Waite, R., Beringer, T., Eds.; WRI: Washington, DC, USA, 2019; ISBN 978-1-56973-963-1. [Google Scholar]
  2. Moinet, G.Y.K.; Hijbeek, R.; van Vuuren, D.P.; Giller, K.E. Carbon for Soils, Not Soils for Carbon. Glob. Change Biol. 2023, 29, 2384–2398. [Google Scholar] [CrossRef] [PubMed]
  3. Bossio, D.A.; Cook-Patton, S.C.; Ellis, P.W.; Fargione, J.; Sanderman, J.; Smith, P.; Wood, S.; Zomer, R.J.; von Unger, M.; Emmer, I.M.; et al. The Role of Soil Carbon in Natural Climate Solutions. Nat. Sustain. 2020, 3, 391–398. [Google Scholar] [CrossRef]
  4. Francaviglia, R.; Di Bene, C.; Farina, R.; Salvati, L.; Vicente-Vicente, J.L. Assessing “4 per 1000” soil organic carbon storage rates under Mediterranean climate: A comprehensive data analysis. Mitig. Adapt. Strateg. Glob. Change 2019, 24, 795–818. [Google Scholar] [CrossRef]
  5. Poulton, P.; Johnston, J.; Macdonald, A.; White, R.; Powlson, D. Major Limitations to Achieving “4 per 1000” Increases in Soil Organic Carbon Stock in Temperate Regions: Evidence from Long-Term Experiments at Rothamsted Research, United Kingdom. Glob. Change Biol. 2018, 24, 2563–2584. [Google Scholar] [CrossRef] [PubMed]
  6. Chenu, C.; Angers, D.A.; Barré, P.; Derrien, D.; Arrouays, D.; Balesdent, J. Increasing Organic Stocks in Agricultural Soils: Knowledge Gaps and Potential Innovations. Soil Tillage Res. 2019, 188, 41–52. [Google Scholar] [CrossRef]
  7. Bruni, E.; Lugato, E.; Chenu, C.; Guenet, B. European Croplands under Climate Change: Carbon Input Changes Required to Increase Projected Soil Organic Carbon Stocks. Sci. Total Environ. 2024, 954, 176525. [Google Scholar] [CrossRef]
  8. Liang, B.C.; VandenBygaart, A.J.; MacDonald, J.D.; Cerkowniak, D.; McConkey, B.G.; Desjardins, R.L.; Angers, D.A. Revisiting No-till’s Impact on Soil Organic Carbon Storage in Canada. Soil Tillage Res. 2020, 198, 104529. [Google Scholar] [CrossRef]
  9. Novara, A.; Minacapilli, M.; Santoro, A.; Rodrigo-Comino, J.; Carrubba, A.; Sarno, M.; Venezia, G.; Gristina, L. Real cover crops contribution to soil organic carbon sequestration in sloping vineyard. Sci. Total Environ. 2019, 652, 300–306. [Google Scholar] [CrossRef]
  10. Meurer, K.H.E.; Haddaway, N.R.; Bolinder, M.A.; Kätterer, T. Tillage Intensity Affects Total SOC Stocks in Boreo-Temperate Regions Only in the Topsoil—A Systematic Review Using an ESM Approach. Earth Sci. Rev. 2018, 177, 613–622. [Google Scholar] [CrossRef]
  11. Ding, W.; Zvomuya, F.; Cao, M.; Wu, Y.; Liu, Z.; He, H. Ground Cover Management Improves Orchard Soil Moisture Content: A Global Meta-Analysis. J. Hydrol. 2024, 633, 130710. [Google Scholar] [CrossRef]
  12. Mazzoncini, M.; Antichi, D.; Di Bene, C.; Risaliti, R.; Petri, M.; Bonari, E. Soil Carbon and Nitrogen Changes after 28 Years of No-Tillage Management under Mediterranean Conditions. Eur. J. Agron. 2016, 77, 156–165. [Google Scholar] [CrossRef]
  13. Francaviglia, R.; Di Bene, C.; Farina, R.; Salvati, L. Soil Organic Carbon Sequestration and Tillage Systems in the Mediterranean Basin: A Data Mining Approach. Nutr. Cycl. Agroecosyst. 2017, 107, 125–137. [Google Scholar] [CrossRef]
  14. Badagliacca, G.; Benítez, E.; Amato, G.; Badalucco, L.; Giambalvo, D.; Laudicina, V.A.; Ruisi, P. Long-Term Effects of Contrasting Tillage on Soil Organic Carbon, Nitrous Oxide and Ammonia Emissions in a Mediterranean Vertisol under Different Crop Sequences. Sci. Total Environ. 2018, 619–620, 18–27. [Google Scholar] [CrossRef] [PubMed]
  15. López-Bellido, L.; López-Bellido, R.; Fernández-García, P.; Muñoz-Romero, V.; Lopez-Bellido, F.J. Carbon Storage in a Rainfed Mediterranean Vertisol: Effects of Tillage and Crop Rotation in a Long-Term Experiment. Eur. J. Soil Sci. 2020, 71, 472–483. [Google Scholar] [CrossRef]
  16. Valkama, E.; Kunypiyaeva, G.; Zhapayev, R.; Karabayev, M.; Zhusupbekov, E.; Perego, A.; Schillaci, C.; Sacco, D.; Moretti, B.; Grignani, C.; et al. Can Conservation Agriculture Increase Soil Carbon Sequestration? A Modelling Approach. Geoderma 2020, 369, 114298. [Google Scholar] [CrossRef]
  17. Aguilera, E.; Lassaletta, L.; Gattinger, A.; Gimeno, B.S. Agriculture, Ecosystems and Environment Managing Soil Carbon for Climate Change Mitigation and Adaptation in Mediterranean Cropping Systems: A Meta-Analysis. Agric. Ecosyst. Environ. 2013, 168, 25–36. [Google Scholar] [CrossRef]
  18. Fuentes-Ponce, M.; Gutiérrez-Díaz, J.; Flores-Macías, A.; González-Ortega, E.; Ponce-Mendoza, A.; Rodríguez-Sánchez, L.M.; Novotny, I.; Moreno-Espíndola, I.P. Direct and indirect greenhouse gas emissions under conventional, organic, and conservation agriculture. Agric. Ecosyst. Environ. 2022, 340, 108148. [Google Scholar] [CrossRef]
  19. Novara, A.; Sarno, M.; Gristina, L. No till Soil Organic Carbon Sequestration Could Be Overestimated When Slope Effect Is Not Considered. Sci. Total Environ. 2021, 757, 143758. [Google Scholar] [CrossRef]
  20. Haddaway, N.R.; Hedlund, K.; Jackson, L.E.; Kätterer, T.; Lugato, E.; Thomsen, I.K.; Jørgensen, H.B.; Isberg, P.E. How Does Tillage Intensity Affect Soil Organic Carbon? A Systematic Review. Environ. Evid. 2017, 6, 30. [Google Scholar] [CrossRef]
  21. Xiao, L.; Zhou, S.; Zhao, R.; Greenwood, P.; Kuhn, N.J. Evaluating Soil Organic Carbon Stock Changes Induced by No-Tillage Based on Fixed Depth and Equivalent Soil Mass Approaches. Agric. Ecosyst. Environ. 2020, 300, 106982. [Google Scholar] [CrossRef]
  22. Wang, H.; Wang, S.; Yu, Q.; Zhang, Y.; Wang, R.; Li, J.; Wang, X. No Tillage Increases Soil Organic Carbon Storage and Decreases Carbon Dioxide Emission in the Crop Residue-Returned Farming System. J. Environ. Manag. 2020, 261, 110261. [Google Scholar] [CrossRef] [PubMed]
  23. Gristina, L.; Keesstra, S.; Novara, A. No-till Durum Wheat Yield Success Probability in Semi Arid Climate: A Methodological Framework. Soil Tillage Res. 2018, 181, 29–36. [Google Scholar] [CrossRef]
  24. Almagro, M.; Garcia-Franco, N.; Martínez-Mena, M. The Potential of Reducing Tillage Frequency and Incorporating Plant Residues as a Strategy for Climate Change Mitigation in Semiarid Mediterranean Agroecosystems. Agric. Ecosyst. Environ. 2017, 246, 210–220. [Google Scholar] [CrossRef]
  25. Basile-Doelsch, I.; Balesdent, J.; Pellerin, S. Reviews and Syntheses: The Mechanisms Underlying Carbon Storage in Soil. Biogeosci. Discuss. 2020, 17, 5223–5242. [Google Scholar] [CrossRef]
  26. Novara, A.; Poma, I.; Sarno, M.; Venezia, G.; Gristina, L. Long-Term Durum Wheat-Based Cropping Systems Result in the Rapid Saturation of Soil Carbon in the Mediterranean Semi-Arid Environment. Land. Degrad. Dev. 2016, 27, 612–619. [Google Scholar] [CrossRef]
  27. Du, Z.; Angers, D.A.; Ren, T.; Zhang, Q.; Li, G. The Effect of No-till on Organic C Storage in Chinese Soils Should Not Be Overemphasized: A Meta-Analysis. Agric. Ecosyst. Environ. 2017, 236, 1–11. [Google Scholar] [CrossRef]
  28. Baillie, I.C. Soil Survey Staff 1999, Soil Taxonomy. Soil Use Manag. 2001, 17, 57–60. [Google Scholar] [CrossRef]
  29. Gearing, J.N. The Study of Diet and Trophic Relationships Through Natural Abundance 13C; Paul, E., Coleman, D.C., Fry, B., Melillo, J., Eds.; Academic Press: New York, NY, USA; Elsevier: Amsterdam, The Netherlands, 1991; ISBN 9780121797317. [Google Scholar]
  30. Balesdent, J.; Mariotti, A.; Boutton, T.W.; Yamasaki, S. Measurement of soil organic matter turnover using 13C natural abundance. In Mass Spectrometry of Soils; Boutton, T.W., Shin-ichi, Y., Eds.; Marcel Dekker, Inc.: New York, NY, USA, 1996; pp. 83–111. ISBN 0-8247-9699-3. [Google Scholar]
  31. Blake, G.R. Methods of soil analysis. Bulk Density. Am. Soc. Agron. 1965, 9, 374–390. [Google Scholar]
  32. Novara, A.; Catania, V.; Tolone, M.; Gristina, L.; Laudicina, V.A.; Quatrini, P. Cover Crop Impact on Soil Organic Carbon, Nitrogen Dynamics and Microbial Diversity in a Mediterranean Semiarid Vineyard. Sustainability 2020, 12, 3256. [Google Scholar] [CrossRef]
  33. de Oliveira Ferreira, A.; de Moraes Sá, J.C.; Lal, R.; Barth, G.; Inagaki, T.M.; Gonçalves, D.P.; Briedis, C.; Tomaz, A.R.; da Silva, W.R. Why No-till System Sequesters More Carbon and Is More Resilient and Productive with Contrasting Fertilization Regimes in a Highly Weathered Soil? Soil Tillage Res. 2024, 244, 106179. [Google Scholar] [CrossRef]
  34. Shamshitov, A.; Kadžienė, G.; Pini, F.; Supronienė, S. The Role of Tillage Practices in Wheat Straw Decomposition and Shaping the Associated Microbial Communities in Endocalcaric–Epigleyic Cambisol Soil. Biol. Fertil. Soils 2024, 61, 211–231. [Google Scholar] [CrossRef]
  35. Singh, S.; Nouri, A.; Singh, S.; Anapalli, S.; Lee, J.; Arelli, P.; Jagadamma, S. Soil organic carbon and aggregation in response to thirty-nine years of tillage management in the southeastern US. Soil Tillage Res. 2020, 197, 104523. [Google Scholar] [CrossRef]
  36. Bolinder, M.A.; Crotty, F.; Elsen, A.; Frac, M.; Kismányoky, T.; Lipiec, J.; Tits, M.; Tóth, Z.; Kätterer, T. The effect of crop residues, cover crops, manures and nitrogen fertilization on soil organic carbon changes in agroecosystems: A synthesis of reviews. Mitig. Adapt. Strateg. Glob. Change 2020, 25, 929–952. [Google Scholar] [CrossRef]
  37. Alexandra Smychkovich, Samantha Glaze-Corcoran, Ashley Keiser, Masoud Hashemi, Assessing the root and shoot composition, decomposition, carbon contribution and nitrogen mineralization trends of single species and mixed cover crops. Field Crops Res. 2025, 327, 109902. [CrossRef]
Figure 1. Biomass turnover in the four soil tillage and residues management at three soil depths at the end of the experimental period. Horizontal lines represent the average value in the 0–30 cm soil layer. Capital letters indicate statistical differences among soil depths and lowercase letters represent statistical differences among treatments (p ≤ 0.05).
Agronomy 15 01293 g001
Figure 2. Soil organic carbon (SOC) placement as affected by the soil tillage and residue management at three soil depths at the end of the experimental period. Horizontal lines represent the average SOC value in the 0–30 cm soil layer. Grey bars and lines are SOC values at the trial start. Capital letters indicate statistical differences among soil depths and lowercase letters represent statistical differences among treatments (p ≤ 0.05).
Agronomy 15 01293 g002
Figure 3. δ13C in the four soil tillage and residue management at three soil depths at the end of the experimental period. Horizontal lines represent the average δ13C value in the 0–30 cm soil layer. Grey bars and lines are δ13C values at the trial start. Capital letters indicate statistical differences among soil depths, and lowercase letters represent statistical differences among treatments (p ≤ 0.05).
Agronomy 15 01293 g003
Figure 4. New carbon derived (NCD) in the four soil tillage and residue management at three soil depths at the end of the experimental period. Horizontal lines represent the average NCD value in the 0–30 cm soil layer. Capital letters indicate statistical differences among soil depths and lowercase letters represent statistical differences among treatments (p ≤ 0.05).
Agronomy 15 01293 g004
Figure 5. Biomass contribution (0–30 cm soil depth) to C input and incorporated biomass in relation to the four applied treatments at the end of the experimental period. Carbon Incorporation Efficiency (CIE %) is calculated as the ratio between biomass contribution to C input and the incorporated biomass.
Agronomy 15 01293 g005
Figure 6. Biomass contribution to carbon input in the four soil tillage and residue management at three depths at the end of the experimental period. Horizontal lines represent the average biomass contribution to the carbon input value in the 0–30 cm soil layer. Capital letters indicate statistical differences among soil depths and lowercase letters represent statistical differences among treatments (p ≤ 0.05).
Agronomy 15 01293 g006
Figure 7. Relationship between mineralization coefficient (k) and biomass contribution to SOC at three depths at the end of the experimental period.
Agronomy 15 01293 g007
Figure 8. Mineralization coefficient (k) in the four soil tillage and residue management at three depths at the end of the experimental period. Horizontal lines represent the average K value in the 0–30 cm soil layer. Capital letters indicate statistical differences among soil depths and lowercase letters represent statistical differences among treatments (p ≤ 0.05).
Agronomy 15 01293 g008
Figure 9. SOC turnover was recorded at the end of the experimental period at three different soil depths according to the different soil and crop residue management. Horizontal lines represent the average SOC turnover value in the 0–30 cm soil layer. Capital letters indicate statistical differences among soil depths and lowercase letters represent statistical differences among treatments (p ≤ 0.05).
Agronomy 15 01293 g009
Table 1. Main characteristics of the soil profile of the study site according to the USDA.
Horizon 1Depth (cm)Clay (%)Sand (%)Silt (%)
Ap10–5018.749.931.3
Ap2
Bt50–8024.843.631.6
1 Ap: soil horizon that has been disturbed by human activity, such as mixing of the upper soil by ploughing in agricultural landscapes; Bt: horizon that contains an illuvial layer.
Table 2. Annual above-ground biomass and partitioning of available barley residues dry weight (kg m−2 yr−1) and its biomass measured at three soil depths according to the different soil and residue management systems adopted in the experimental period (2018–2023). Different capital/lowercase letters denote significant differences at p ≤ 0.05 (HSD Tukey’s test), among tillage managements or among soil depths, respectively.
FITretFITremNTretNTrem
Biomass components Available Biomass dry wt. (kg m−2 yr−1)
Stubble0.3300.3300.3000.300
Straw0.378--0.378--
Total 0.708 A0.330 B0.678 A0.300 B
Soil depth (cm)Incorporated Biomass dry wt. (kg m−2 yr−1)
100.218 b0.063 a0.037 a0.035 a
200.300 a0.075 a0.023 b0.024 b
300.026 b0.026 b0.018 c0.017 c
Total (0–30 cm layer)0.544 A0.164 B0.078 C0.076 C
Incorporated biomass/Available biomass0.770.500.120.22
Table 3. Analysis of variance (ANOVA) on soil organic carbon (SOC) content at the end of the experimental period (2018–2023) as influenced by management system and depth of soil sampling.
SSdfMSFp
Depth (D)0.92720.46366.142<0.001
Management (M)0.03930.0131.8570.075
D * M0.24460.0405.714<0.001
Residuals0.255360.007
The asterisk (*) indicates the interaction between the factors D (depth) and M (management).
Table 4. Analysis of variance (ANOVA) on δ13C at the end of the experimental period (2018–2023) as influenced by the management system and depth of soil sampling.
SSdfMSFp
Depth (D)12.2426.1165.003<0.001
Management (M)4.89131.63017.537<0.001
D * M10.4561.74118.720<0.001
Residuals3.356360.093
The asterisk (*) indicates the interaction between the factors D (depth) and M (management).
Disclaimer/Publisher’s Note: The statements, opinions and data contained in all publications are solely those of the individual author(s) and contributor(s) and not of MDPI and/or the editor(s). MDPI and/or the editor(s) disclaim responsibility for any injury to people or property resulting from any ideas, methods, instructions or products referred to in the content.

