Article

Relationships Between Midday Stem Water Potential and Soil Water Content in Grapevines and Peach and Pear Trees

by
José Manuel Mirás-Avalos
1,2,* and
Emily Silva Araujo
1
1
Departamento de Sistemas Agrícolas, Forestales y Medio Ambiente, Centro de Investigación y Tecnología Agroalimentaria de Aragón (CITA), Avda. Montañana 930, 50059 Zaragoza, Spain
2
Misión Biológica de Galicia del Consejo Superior de Investigaciones Científicas (MBG-CSIC), Sede Santiago de Compostela, Avda. de Vigo s/n, 15705 Santiago de Compostela, Spain
*
Author to whom correspondence should be addressed.
Agronomy 2025, 15(5), 1257; https://doi.org/10.3390/agronomy15051257
Submission received: 4 April 2025 / Revised: 14 May 2025 / Accepted: 20 May 2025 / Published: 21 May 2025

Abstract

:
Monitoring the water status of fruit orchards is required to optimize crop water management and determine irrigation scheduling. For this purpose, capacitance probes are commonly used to measure soil water content (θs). However, when these probes are not calibrated, the estimates of θs are, therefore, unreliable. Our objective was to relate the measurements of capacitance probes, without a site-specific calibration, with a reliable indicator of the water status (stem water potential at solar noon (Ψstem)) of rain-fed grapevines grown under contrasting soil management strategies (tillage and spontaneous vegetation) and of irrigated peach and pear trees. During the 2023 growing season, θs was monitored in a peach and a pear orchard and in a vineyard in northeast Spain using capacitance sensors at three depths: 0.15, 0.30, and 0.45 m. Correlation coefficients ranged from 0.75 to 0.87 in peach trees, from 0.53 to 0.56 in pear trees, and from 0.56 to 0.90 in grapevines, depending on soil depth. These relationships were significant for both peach trees and grapevines but not for pear trees. Under the conditions of this study, uncalibrated capacitance measurements of θs could be useful to assess grapevine and peach tree water status in real time but were limited for pear trees.

1. Introduction

The agricultural sector is impelled toward a more efficient use of water to face challenges such as the increasing world population and the competing needs of civil and industrial sectors [1]. Moreover, the projected increase in temperatures and varying rainfall patterns, with more heavy rainfall and drought events [2], leading to up to 30% reductions in annual rainfall amounts in certain regions, such as the Mediterranean, put additional pressure on agricultural water management [3]. Fruit tree orchards, due to their perennial character, are especially sensitive to these changes, which impact crop yields, fruit quality, and non-marketed ecosystem services [4].
Depending on the timing of occurrence and intensity of water stress, tree vegetative growth, phenology, yield, and fruit composition can be altered [5,6]. Usually, mild water stress leads to a positive yield response and to the enhancement of fruit composition, although severe water stress has a negative effect [6,7,8,9]. The water status of woody crops can be modulated with irrigation but also with the establishment and maintenance of a green cover [10]. Due to the aforementioned limitations in water availability, deficit irrigation strategies implying a continuous reduction in water inputs over the growing season would be beneficial as long as yield and fruit quality are maintained [11], as reported for peach trees [12,13], pear trees [7,14], and grapevines [15]. In the case of green covers, which are increasingly being established in fruit orchards and vineyards due to regulation modifications [16], appropriate management should be followed to avoid excessive competition for water, while profiting from the wide range of environmental benefits that these covers provide [17,18]. Therefore, it is crucial to assess tree and vine water status throughout the year to rapidly detect any water stress and manage irrigation or green covers correctly over the growing season. Thus, reliable indicators of tree and vine water status are required.
Among these indicators, plant-based sensors are preferred over soil moisture- or atmospheric-based measures or models because plants integrate soil water availability and atmospheric water demand [19]. Among the broad range of indicators to assess plant water status, stem water potential (Ψstem) stands out as a sensitive measure, especially for woody crops [20,21,22,23]. The main advantages of Ψstem compared to other modalities of leaf water potential are its lower sensitivity to environmental conditions at the time of sampling, its higher capacity for discrimination between watering treatments, and its ability to indicate early water deficits [22,24]. However, its measurement is time-consuming and cannot be automated, thus it is temporally discrete and destructive, limiting its use in commercial plantations [25].
In contrast, soil moisture sensors are increasingly being used in commercial exploitations because they provide near real-time data on either soil water content (θs) or soil water tension, providing a reliable criterion for water management in agriculture [26]. However, in orchards and vineyards, these sensors present several drawbacks related to soil heterogeneity, the frequent passing of heavy machinery for soil-related interventions (tillage, mowing, etc.) that can damage the sensors, as well as different soil water motion patterns resulting from the adoption of deficit irrigation, minimum tillage, or the use of cover crops [27,28]. Consequently, several probes need to be deployed, making the management of the information difficult [29]. In addition, soil moisture thresholds for determining whether a fruit tree or a grapevine is suffering from water stress and to what extent are lacking [30,31,32]. Accuracy and correct placement affect the reliability of soil moisture sensors for providing tree water status estimations [33,34]. Therefore, relating soil moisture readings with measurements of a robust tree and vine water status indicator, such as Ψstem, is necessary to establish thresholds for efficiently managing irrigation and other agricultural practices.
Measurements of θs and Ψstem have been related in fruit trees and grapevines to obtain thresholds for efficient water management [31,32,35,36,37]. However, these reports provided contrasting results, highlighting the limitations of soil moisture sensors for extrapolating tree and vine water status, suggesting that further research accounting for local conditions is needed. In this context, the aim of the current study was to relate θs records obtained with capacitance sensors without a specific calibration, as employed by farmers, with a robust indicator of the water status of peach and pear trees and grapevines under Mediterranean conditions. We hypothesized that these measurements are significantly correlated with Ψstem readings and thus can be used to monitor in quasi-real time the water status of fruit trees and vines. The outcomes of this study may serve as a basis for managing regulated deficit irrigation and green covers in these agricultural systems.

2. Materials and Methods

2.1. Description of the Study Sites and Experimental Treatments

This study was carried out during the 2023 growing season in three separate orchards including different woody crops (peach, pear, and grapevines) and located in northeast Spain. Data on some characteristics of each orchard are reported in Table 1.
Further information regarding each orchard is the following:
  • Peach orchard: located in Binaced (Huesca, Spain). It was planted with Prunus persica L. cv. “Catherine”. The orchard is drip irrigated (an emitter with a flow rate of 2 L h−1 per 0.5 m of dripline). The soil is sandy clay loam, with a basic pH and a medium organic matter content (Table 2). The climate is Mediterranean with a continental influence. In the current study, two treatments were considered: (i) irrigation according to farmer’s criteria (Farmer), and (ii) irrigation following a soil water balance (SWB), as described in Allen et al. [38], and using crop coefficients adapted to the region [12]. Weather data were collected from the nearest station (Alfántega, 13 km away from the orchard), since farmers in this area based their irrigation scheduling on the data from this station. The coefficient of uniformity of the drip system was fixed at 95%, and the effective rainfall from the previous week was subtracted.
  • Pear orchard: located in Binaced (Huesca, Spain). It was planted with Pyrus communis L. cv. “Williams”. The orchard is drip irrigated (an emitter with a flow rate of 2 L h−1 per 0.5 m of dripline). The soil is clay loam, with a basic pH and a medium organic matter content (Table 2). The climate and treatments were the same as those from the previous orchard.
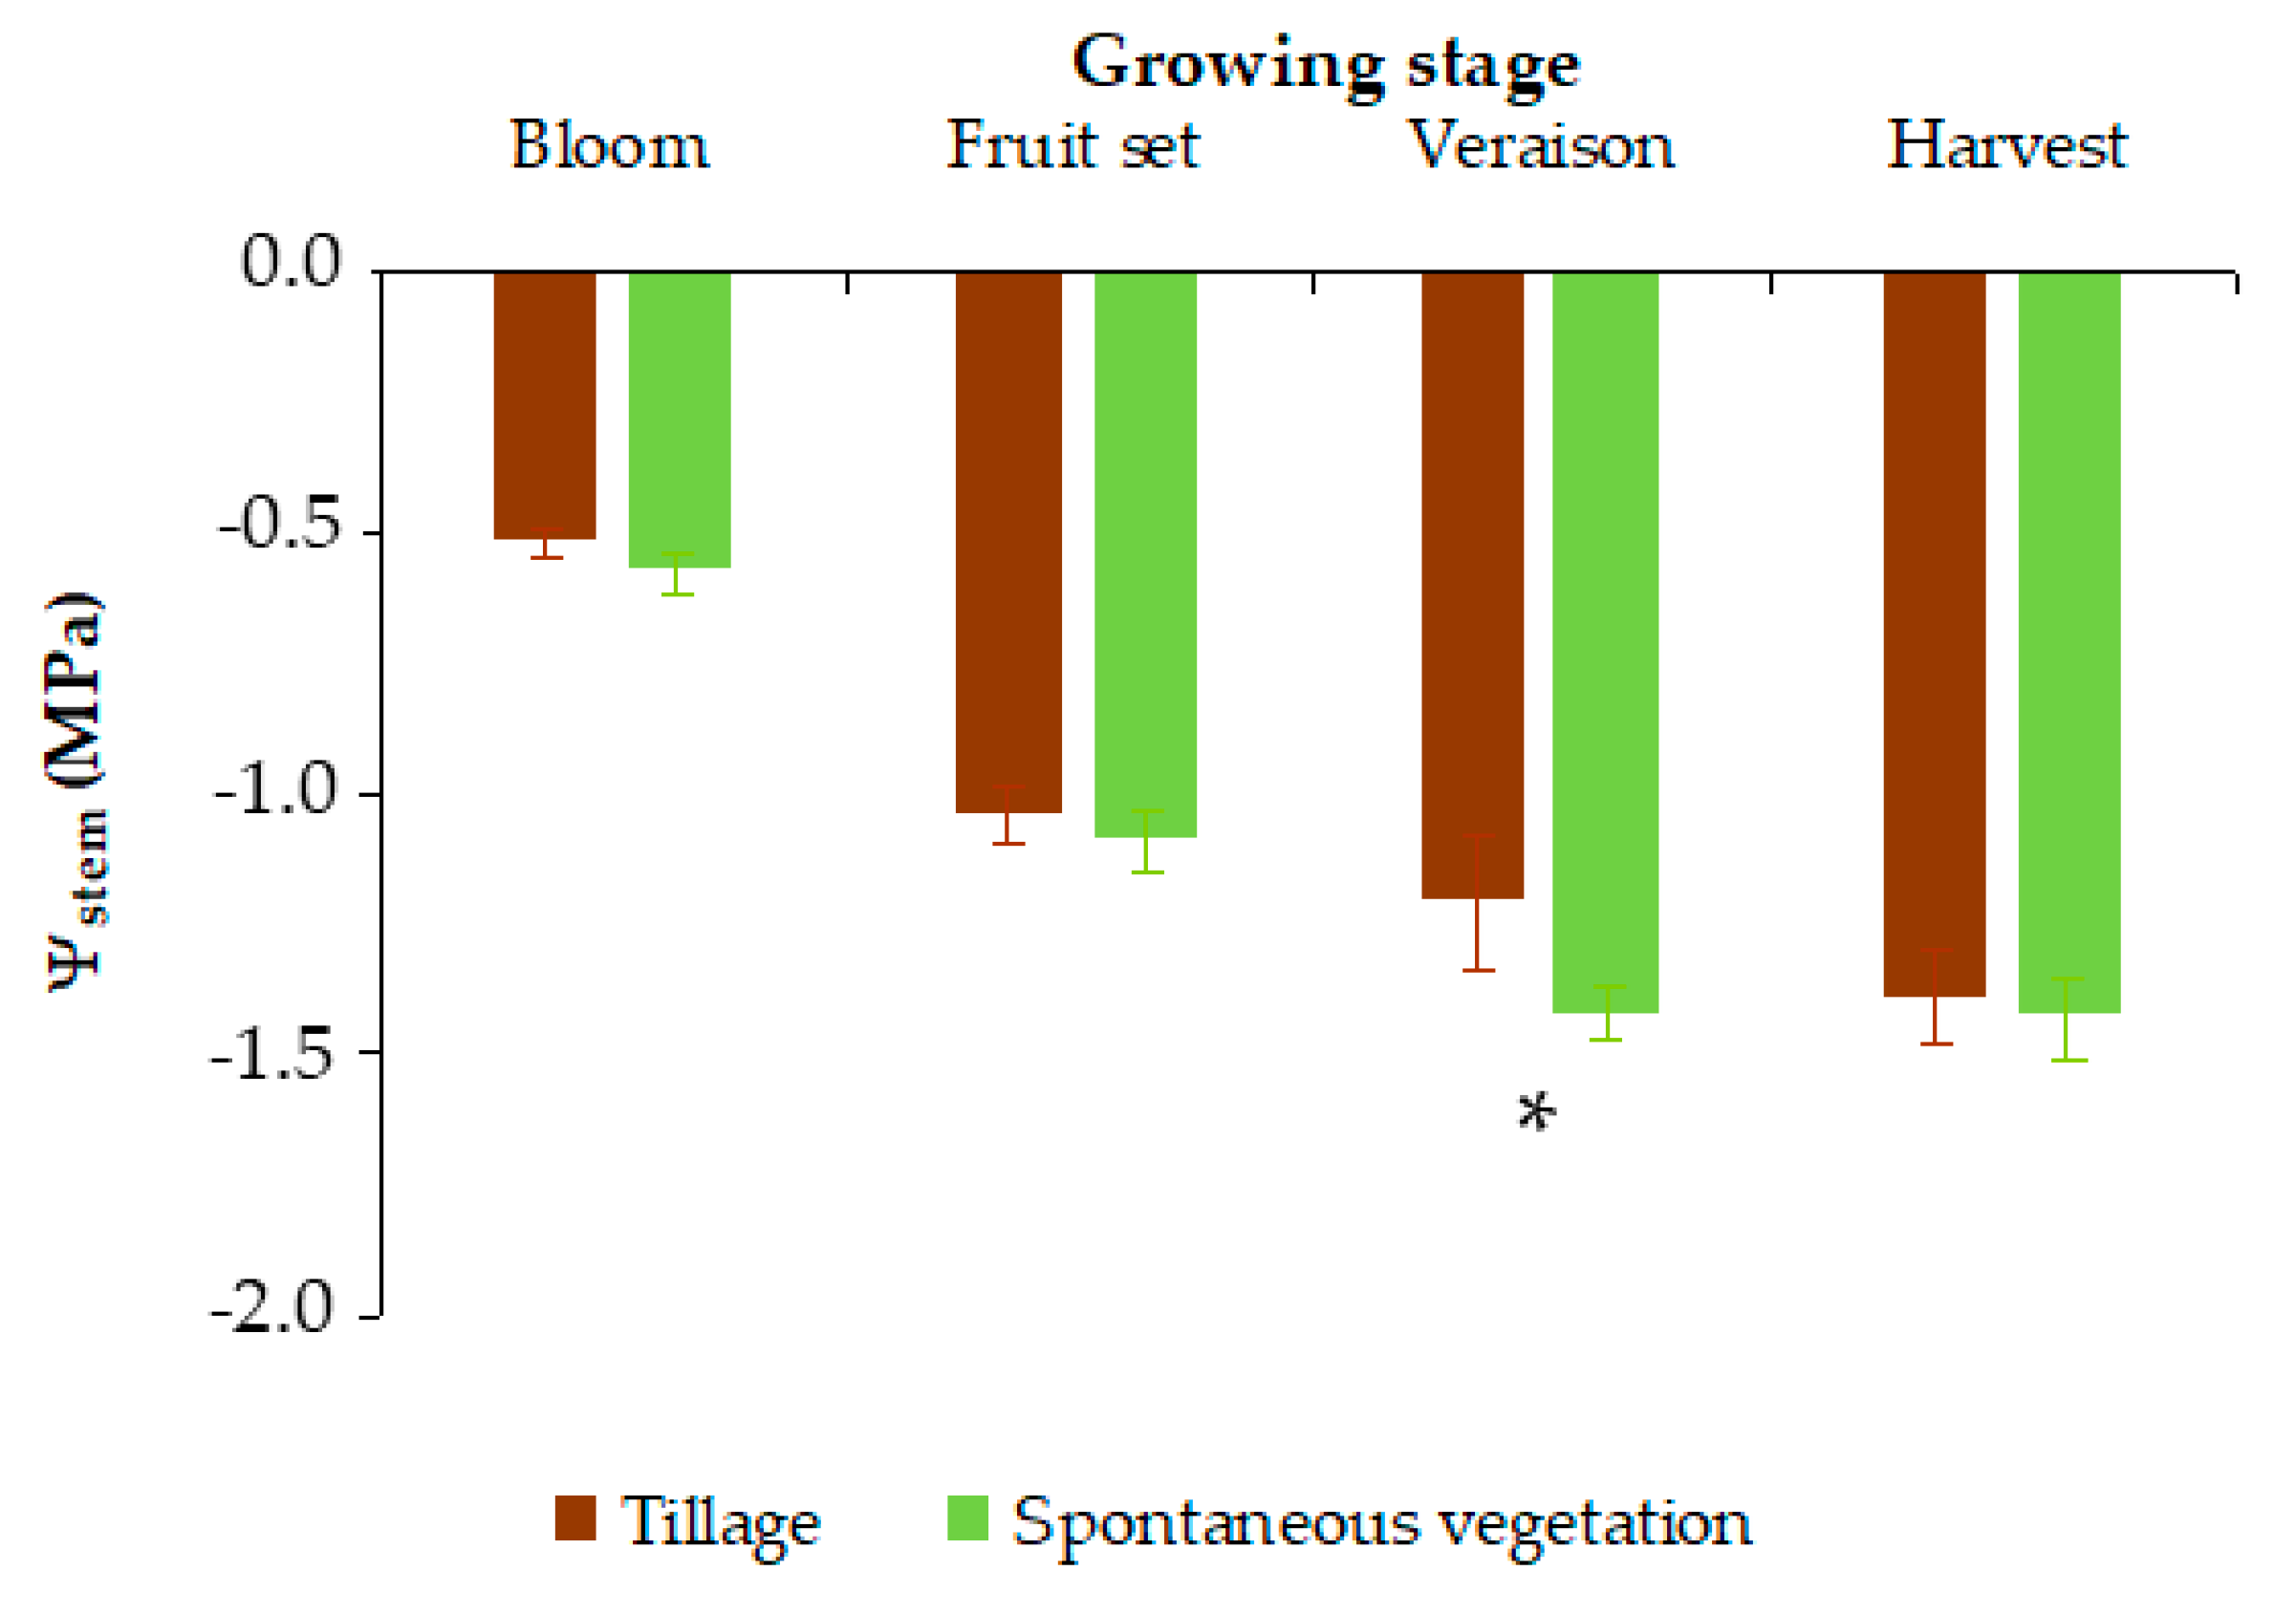
  • Vineyard: located in Salas Bajas (Huesca, Spain). It was planted with Vitis vinifera L. cv. “Riesling” on 1103 Paulsen rootstock. The vineyard is rainfed, the vines are vertically trellised on a single cordon system, and the rows are oriented in the east–west direction. Vegetation in the inter-rows was avoided for five years after plantation, while spontaneous vegetation was allowed to grow in the inter-rows from 2017 onward (two or three mowing passes each season; plant residues remain on site). A non-grassed strip under the vines (approximately 20 cm at both sides of the vine trunk) was maintained using herbicides. The soil is sandy loam, with a basic pH and a medium organic matter content (Table 2). The climate is Mediterranean with a mountainous influence. Weather data were collected from a station located 500 m away from the vineyard. In this study, two treatments were considered: (i) a shallow tillage (10–15 cm deep) performed on 8 inter-rows using a cultivator after a rainy period at the beginning of June 2023, and (ii) green cover (resident vegetation including Amaranthus albus, Diplotaxis erucoides, Euphorbia segetalis, Medicago rigidula, Silene muscipula, and Vicia pseudocracca, among others), namely, spontaneous vegetation, was allowed to grow in the inter-row until it reached 15 cm in height, when it was mowed (twice during the growing season of 2023); no plants were allowed to grow under the vines using herbicides.

2.2. Weather Conditions and Irrigation over the Study Period

In the Alfántega weather station (assigned to the peach and pear orchards), the mean temperature over the study period (May to August 2023) was 23 °C, the rainfall amounted to 156 mm (96% of which fell in May and June), and the ETo was 619 mm. The maximum temperature reached 42.9 °C in July (Table 3).
In the case of the vineyard, the mean temperature over the study period was 22.7 °C, the rainfall amounted to 221 mm (90.5% of which fell in May and June), and the ETo was 746 mm. The maximum temperature reached 40.4 °C in July (Table 3).
From May to August 2023, irrigation applied by the farmer was 1333 and 1576 m3 ha−1 for peach and pear trees, respectively. In the case of the SWB treatment, irrigation doses amounted to 1022 and 1216 m3 ha−1 for peach and pear trees, respectively. Therefore, the SWB treatment saved 23% of water with respect to the farmer’s treatment.

2.3. Soil Water Content and Midday Stem Water Potential Measurements

Soil water content (θs) was measured at three depths (0.15 m, 0.30 m, and 0.45 m) using capacitance sensors (TEROS10, Meter Group Inc., Pullman, WA, USA) in the row (at 0.30 m from the peach tree, pear tree, or grapevine trunk). Excavations in the studied orchards and vineyard revealed that most of the root system was concentrated between 0.30 and 0.50 m deep, thus the sensors covered the soil explored by the roots. The sensors were connected to dataloggers (ZL6 Pro, Meter Group Inc., Pullman, WA, USA) that recorded data at 15 min intervals. One group of sensors was installed in the SWB treatment of the peach and pear orchards, whereas two groups of sensors were installed per soil management strategy in the vineyard.
From early May to late August in the case of the peach and pear orchards, and from early June to early September in the case of the vineyard, monthly measurements of midday stem water potential (Ψstem), a sensitive indicator of water status in woody crops [21,22,24], were performed. For this purpose, one healthy adult leaf per tree (close to the trunk; 6 trees per treatment) or vine (from the middle third of the shoot; 9 vines per treatment) was taken. Before the measurements, the leaves were enclosed in zip bags covered with aluminum foil for at least one hour (grapevines) or two hours (peach and pear trees). Readings were performed with a pressure chamber (Pump-Up, PMS Instruments Company, Albany, OR, USA) following the recommendations of Levin [39]. The Ψstem of trees and grapevines surrounding the capacitance sensors were used for correlating data on θs and tree water status.

2.4. Statistical Analysis

Normality and homoscedasticity of the data were assessed using the Shapiro–Wilk and Bartlett tests, respectively. The effect of either irrigation or soil management on Ψstem was assessed through one-way ANOVA. The relationships between θs and Ψstem were determined through linear and nonlinear regression. Correlation tests were used to assess the significance of these relationships. Partial correlations were computed using weather variables (maximum temperature and ETo) as moderators. Statistical analyses were conducted in the R environment, version 4.3.3 [40].

3. Results

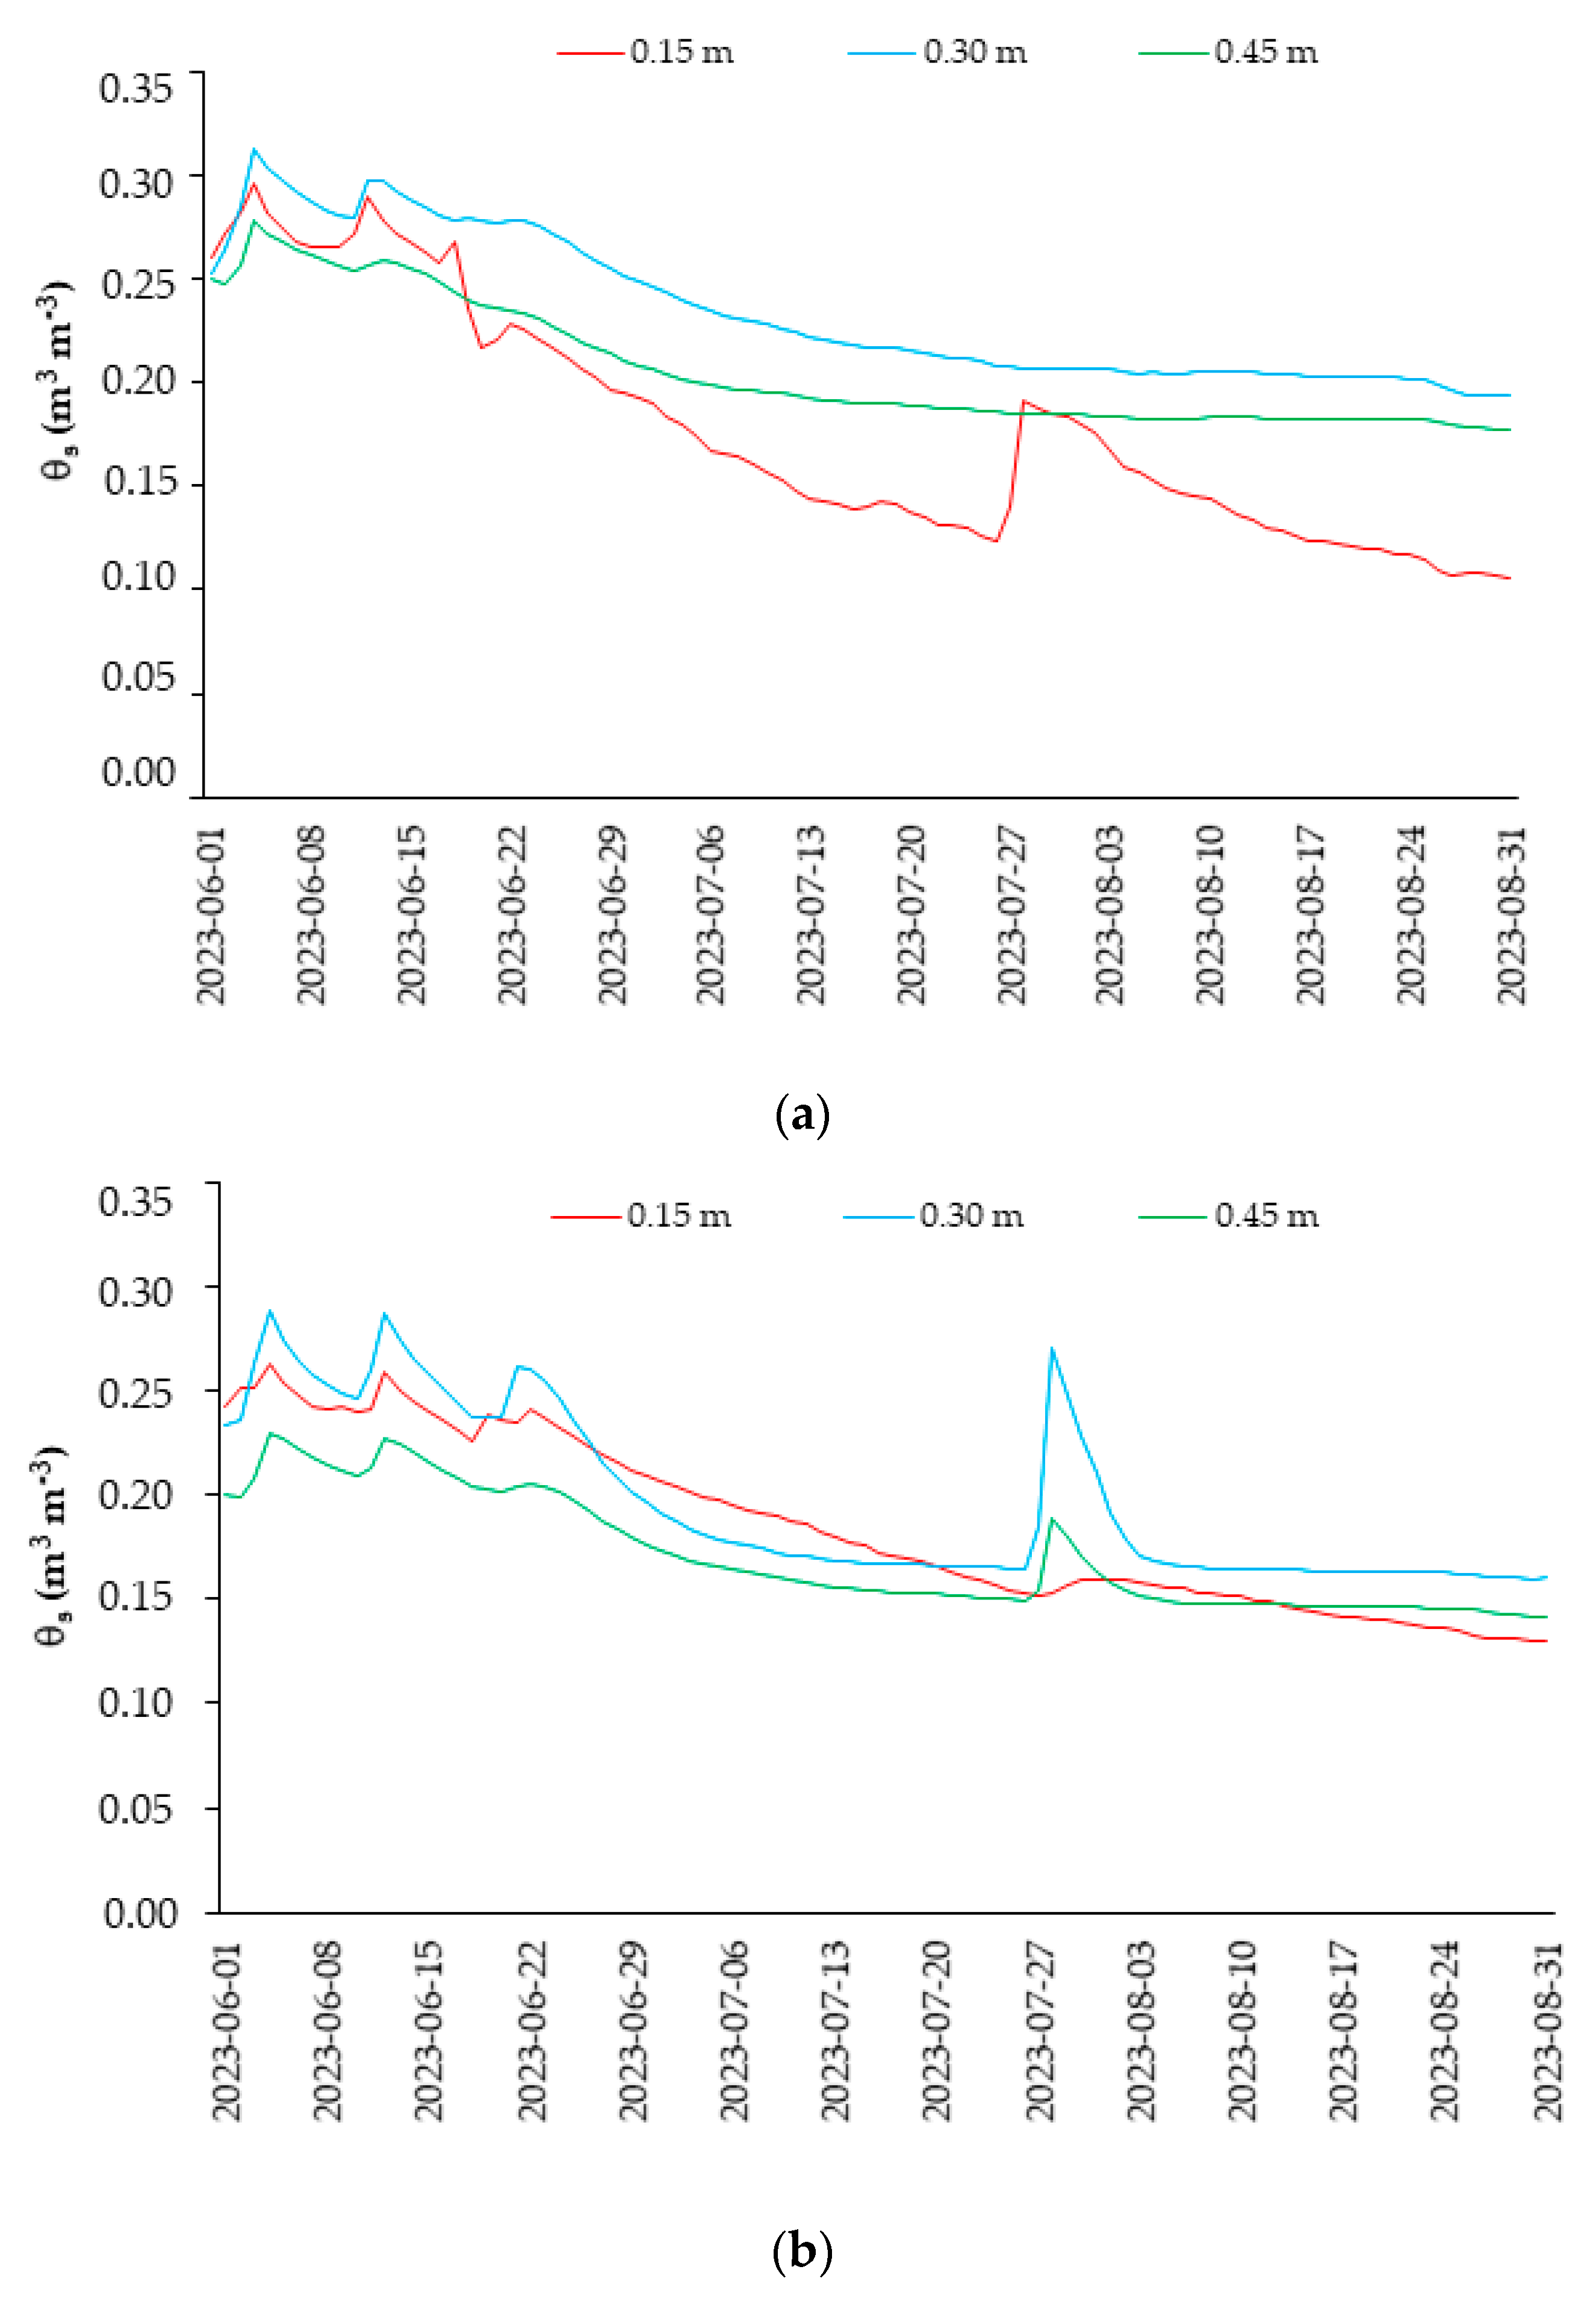
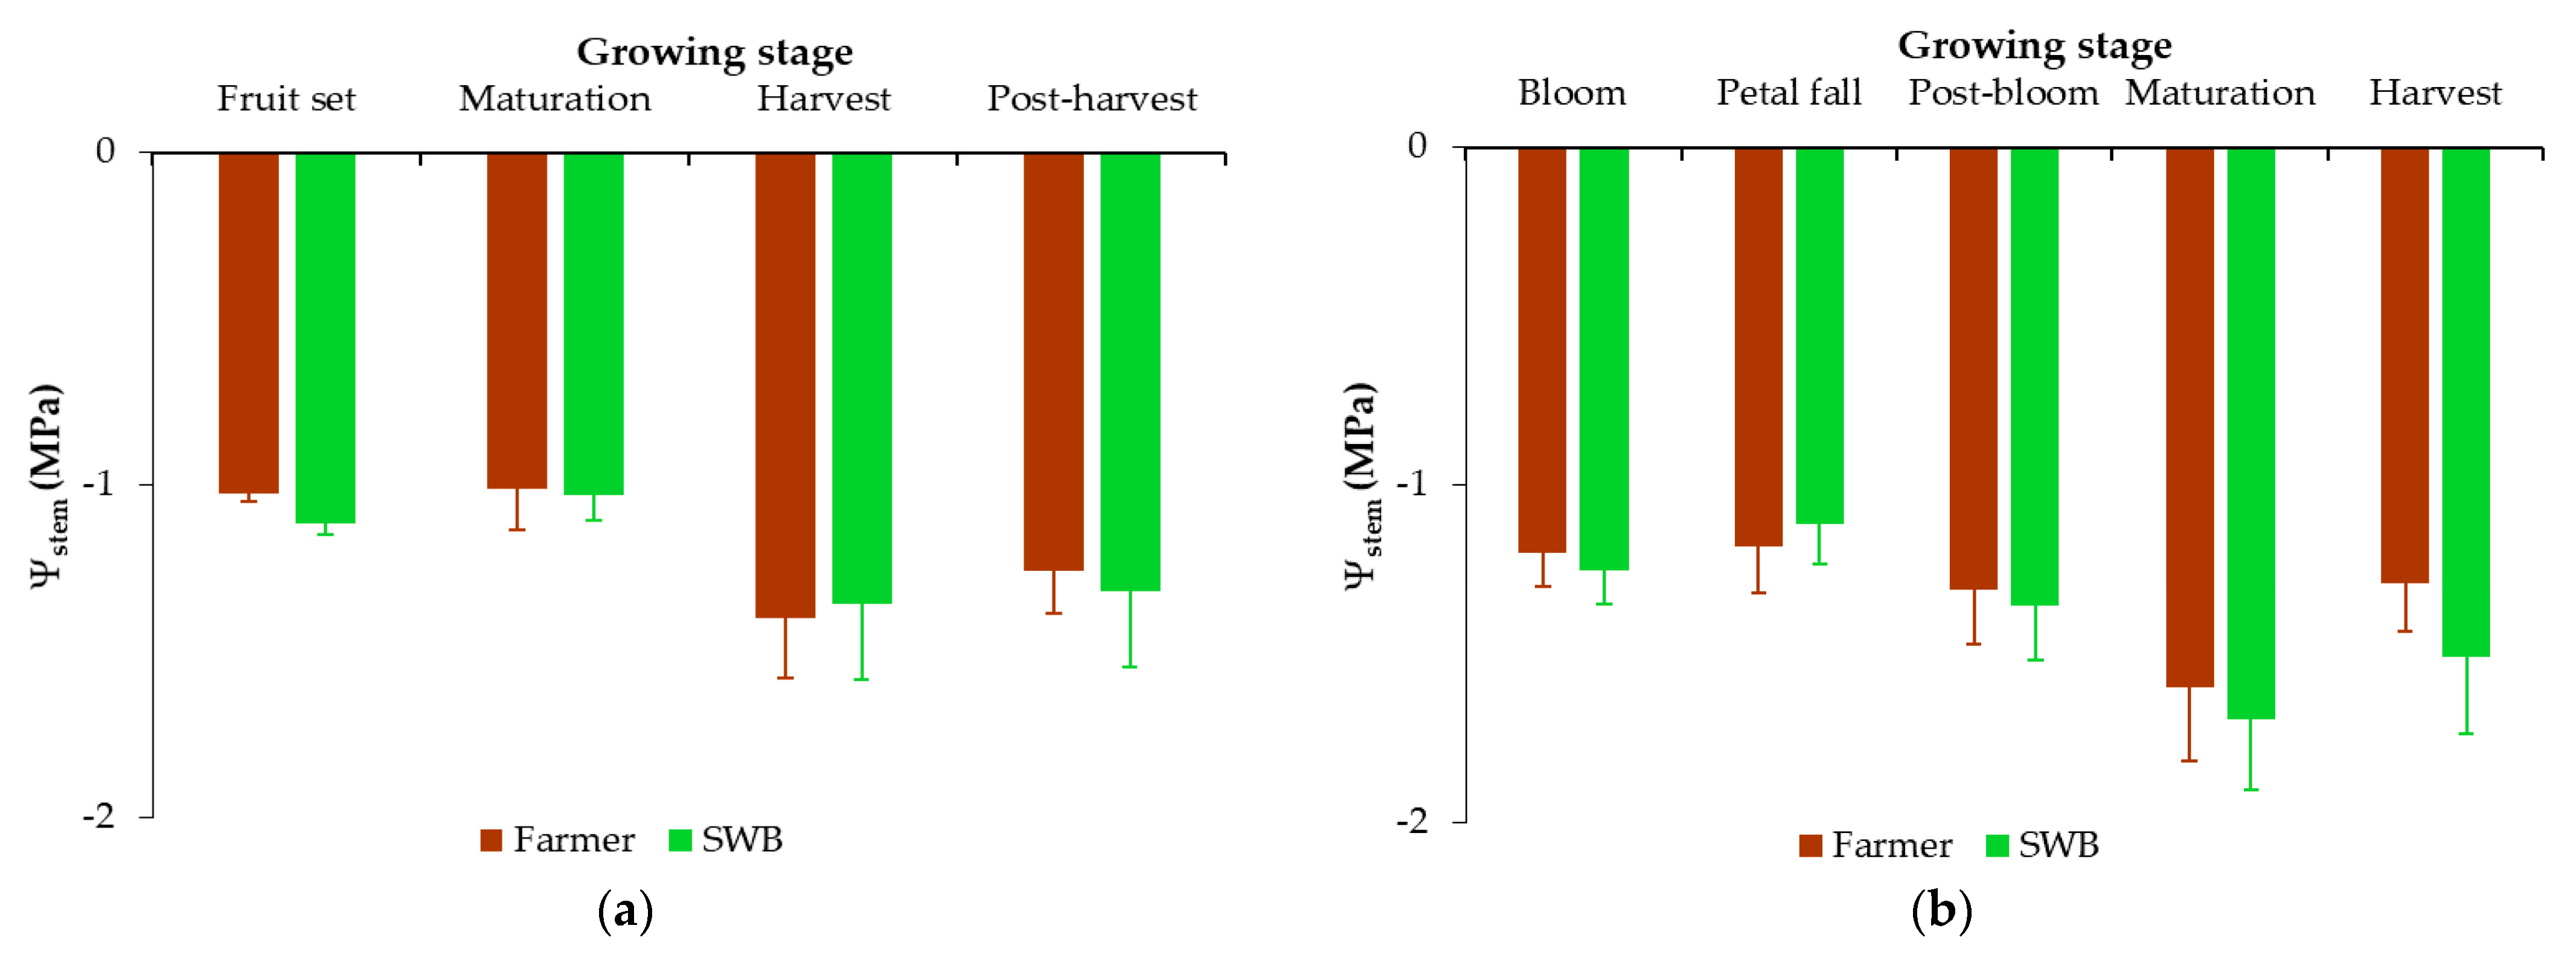
3.1. Evolution of Soil Water Content and Midday Stem Water Potential over the Growing Season

Capacitance sensors allowed for assessing the variations in θs caused by the rainfall and irrigation events in the three studied plantations. In the case of pear trees, θs decreased more rapidly at a 0.15 m depth than at a 0.45 m depth, at which the range of variation is low, between 0.13 m3 m−3 and 0.17 m3 m−3 (Figure 1). From 25 June to 3 August, θs at 15 cm decreased to values lower than 0.07 m3 m−3. In the peach orchard (Figure 2), θs behaved similarly, but there was a 15-day period after harvest in which no irrigation was applied (from 16 July to 1 August). At 0.15 and 0.30 m depths, θs decreased more rapidly than at a 0.45 m depth. Overall, for the three depths, capacitance sensors provided θs minimum and maximum values of 0.05 m3 m−3 and 0.16 m3 m−3, respectively (Figure 2).
Finally, in the case of the rain-fed vineyard, θs tended to decrease over the growing season in both treatments (Figure 3). Under tillage, θs decreased more at 0.15 m than for the rest of the depths; however, under spontaneous vegetation, the rate of decrease was similar at all depths. Overall, for the three depths, capacitance sensors provided θs minimum and maximum values of 0.11 m3 m−3 and 0.31 m3 m−3, respectively, under the tillage treatment, and values of 0.13 m3 m−3 and 0.29 m3 m−3, respectively, under spontaneous vegetation (Figure 3).
The Ψstem values reflected the evolution of θs over the growing season, being less negative at the beginning and more negative by the end of the season. The Ψstem values in the peach orchard ranged from −0.8 MPa to −1.7 MPa, whereas in the pear orchard, they varied between −0.9 MPa and −2.0 MPa. In the peach and pear orchards, Ψstem values did not differ between the Farmer and SWB treatments for any measurement date (Figure 4).
In the case of the vineyard, Ψstem values ranged from −0.5 MPa to −1.6 MPa, and they were significantly more negative under spontaneous vegetation than under tillage at veraison, with no significant differences between treatments on the rest of the measurement dates (Figure 5).
As a summary, Table 4 shows the average values of θs and Ψstem over the growing season for each experimental site. Soil water contents were lower in the peach and pear orchards than in the vineyard, likely due to the abundant rainfall that occurred in early June on the vineyard. Plant water status, as measured with Ψstem, reflected this issue with less negative values in the vineyard than in the peach and pear orchards, although differences in the physiology of these species should be considered for interpreting these data.

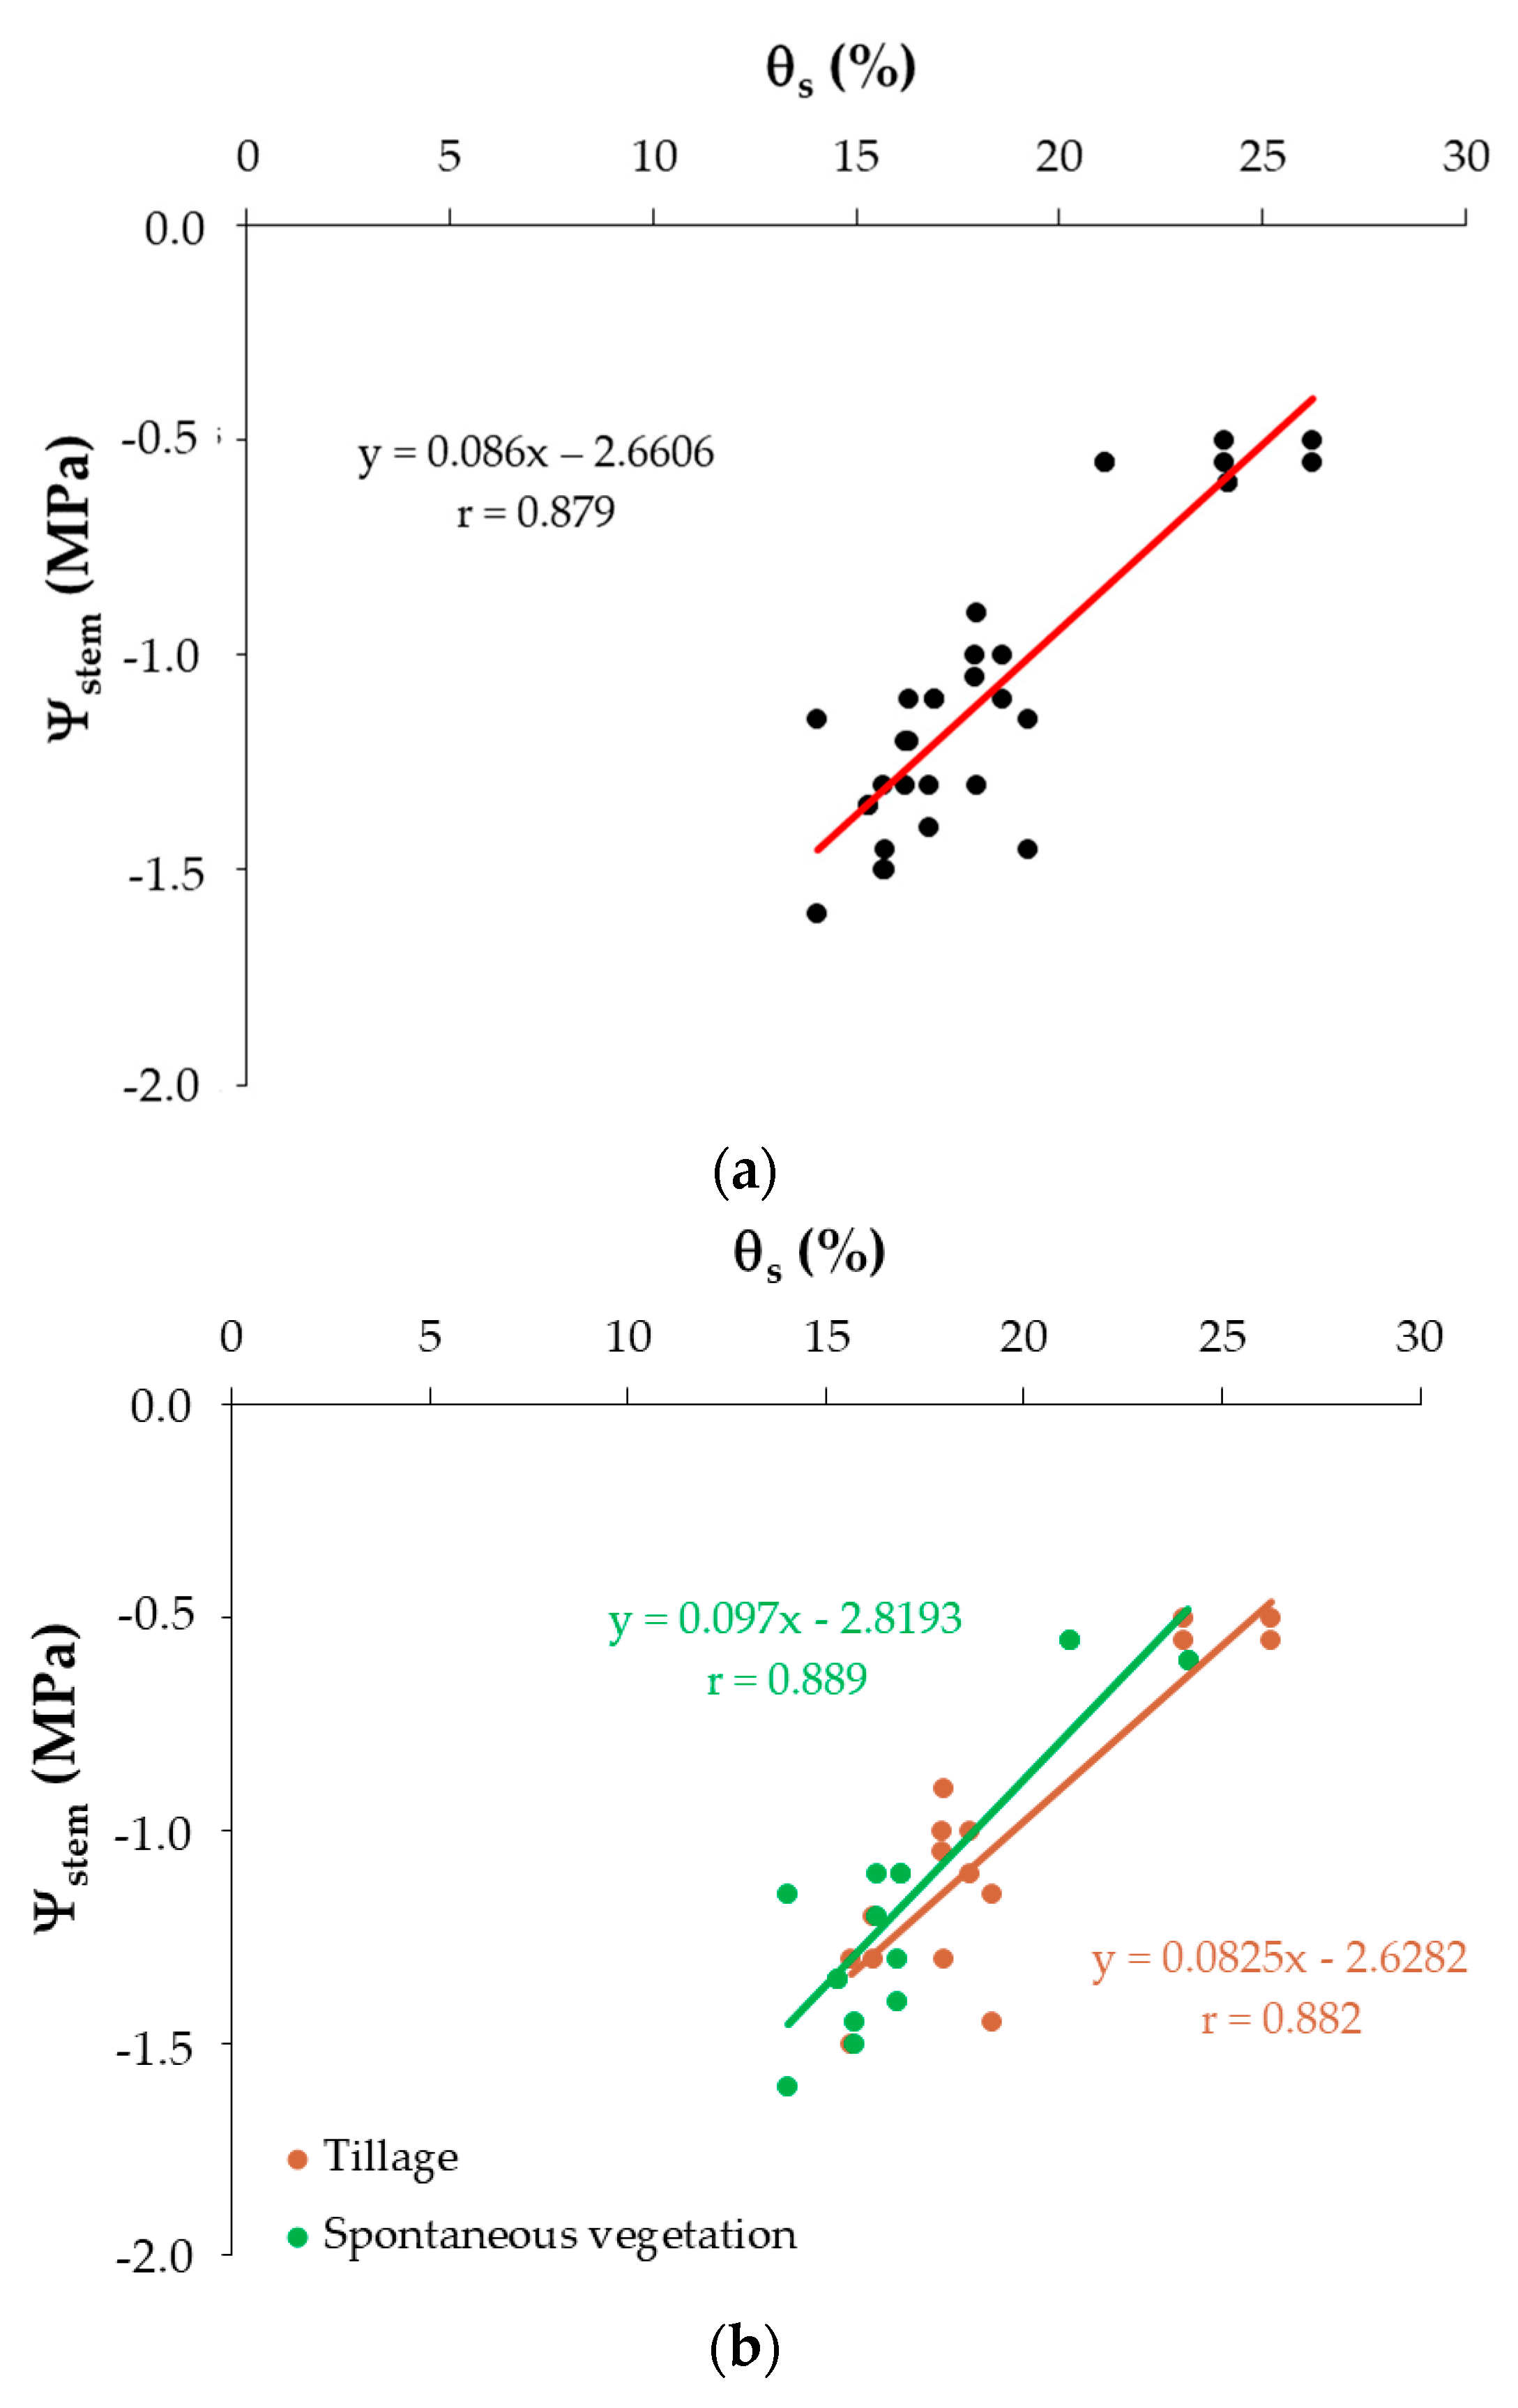
3.2. Relationships Between Soil Water Content and Plant Water Status

Significant correlations between Ψstem measurements and θs were detected in the peach orchard, although the strength of these correlations varied with depth, and Pearson’s r correlation coefficients ranged from 0.75 to 0.87 (Table 5). In the case of the grapevines, when gathering Ψstem measured in both treatments (tillage and spontaneous vegetation), Pearson’s r correlation coefficients were highly significant at all depths (Table 5), especially at 0.45 m (r = 0.90) and when averaging θs for all depths (r = 0.88). In contrast, no significant correlation between Ψstem values and the θs registered by the sensors deployed in the pear orchard was observed at any depth (Table 5); however, the correlations were marginally significant, namely, p-values were between 0.1 and 0.05.
The use of nonlinear regression did not enhance the significance of the equations except for two data pairs in pear trees: Ψstem vs. θs 0.15 m (Ψstem = 0.055 θs2 − 1.438 θs − 7.74; regression coefficient = 0.715; p-value = 0.012) and Ψstem vs. θs 0.15–0.45 m (Ψstem = 0.32 θs2 − 9.12 θs − 63.34; regression coefficient = 0.623; p-value = 0.032).
When considering the maximum temperature and daily ETo as moderator variables, the significance of the relationships displayed in Table 5 did not vary for any of the orchards, suggesting that these weather variables had little influence on the relationships found in the current study.
In the case of the vineyard, when separating data from each treatment, the correlation between θs and Ψstem was significant for all depths, but the slopes of the regression equations differed slightly between treatments. As an illustrative example, Figure 6 shows the relationships between θs averaged for all depths and Ψstem in the studied vineyard, either combining data from the two treatments or estimating them separately for each treatment. The slopes and intercepts of the regressions shown in Figure 6b did not differ between soil management treatments; thus, combining data for both treatments led to a more robust equation (Table 5), which could be used for water management purposes in this vineyard.

4. Discussion

The results from the current study showed that uncalibrated capacitance sensors allowed for determining plant water status in an irrigated peach orchard and a rain-fed vineyard, while their records were less reliable in the pear orchard, as correlations between θs and Ψstem were weaker and marginally significant. As the soil in the pear orchard is sandy clay loam, no significant effect on the performance of the sensors was expected [34], and the lack of significant correlations between θs and Ψstem observed in this study occurred likely due to the small volume of soil explored by the sensors or the accuracy of the installation. This lack of correlation is mainly caused by the high spatial variability of soil properties and by the three-dimensional gradients of soil water originating from drip irrigation [36].
The relationships between θs and Ψstem detected in the current work were obtained through linear regression and their strength, in terms of the correlation coefficient, depended on the orchard. Using nonlinear regression techniques only improved the adjustments in the case of the pear orchard at the shallowest depth and the average of the three depths. Previous studies already reported significant correlations between θs records and Ψstem readings for peach trees, pear trees, and grapevines. For instance, a five-year study conducted on a highly calcareous, clay-loam soil in southeast Spain revealed significant correlations (r = 0.75 on average) between both indicators [41]; however, these authors reported third-order regression equations, which could not be fitted to the data of the current study; despite this, the correlation coefficients found in the current work were similar to those reported by Abrisqueta et al. [41]. Therefore, using the equations from the current study could facilitate calculations for small stakeholders. In addition, a recent study conducted on pear trees reported that soil water content explained 46% of the variation in Ψstem (r = 0.68) in a high-density orchard with two cultivars in the Northwest of the United States of America [42]; these correlations were stronger than those detected in the current study, but the equations were not presented, so its applicability in operational contexts is limited, unlike those from the current study. In the case of grapevines, previous studies reported highly significant correlations between θs and Ψstem, with coefficients comparable to those observed in the current work. For instance, Williams and Trout [31] reported a quadratic equation with a regression coefficient of 0.9, over a one-year study on the “Thompson Seedless” cultivar in the San Joaquin Valley (California, USA), while linear regressions were observed in “Chardonnay” with a correlation coefficient of 0.63 in the Napa Valley (California, USA) [30]. In contrast, no relationship was found in a “Tempranillo” vineyard located in east Spain [36], while weak correlations were detected in an “Albariño” vineyard in northwest Spain [37]. These contrasting results among studies can be due to local conditions (soil properties, planting density, and rooting depth, amongst others), the type of sensors used (neutron probes, time domain reflectometry, or capacitance), and installation procedures (including the depth to which the sensors are installed). The equations derived from this study increased the range of environmental conditions covered by this type of study.
In addition, the current study provided interesting findings for optimizing water management in woody crops. Regarding irrigation management, under the conditions of this study, adopting a soil water balance (using crop coefficients adapted to the region) and modulating irrigation events using the capacitance sensor readings allowed for saving 23% of the water applied when compared with the farmer’s usual practices. In the case of peach trees, Ψstem values did not go below the thresholds for moderate or severe water stress (−1.5 and −1.8 MPa, respectively) reported for the “Catherine” cultivar [13], suggesting that even further reductions in water applications could be adopted. In contrast, in pear trees, Ψstem values were close to the threshold of moderate water stress, and in mid-July, they reached the level of severe water stress [7]. This suggests that the water amount applied in this plot was already optimized using the soil water balance, there is no margin for water savings, or this margin was too small. Therefore, the results obtained in the current study are promising because they suggest that a single set of sensors, if correctly installed in a representative spot within the orchard, can provide reliable information on tree water status that can be used for scheduling irrigation or managing green covers. However, these results should be confirmed with further research, as they refer to a single year of measurements
Regarding soil management in the studied vineyard, spontaneous vegetation did not cause excessive water stress in grapevines in the current work, since no significant differences were detected in Ψstem for the two soil management strategies considered. On the one hand, this can be explained by the non-grassed strip that was maintained under the vines, where it is likely that most of the vine root system is located. On the other hand, since the green cover was established for five years in the studied vineyard, it may have induced the death of vine roots in the upper layers and the development of a deeper root system [43,44], and grapevines could uptake water from soil layers to which grass roots do not reach [17]. In the current study, most of the vine root system was concentrated between 0.3 and 0.5 m depth; thus, the installed sensors were able to reflect vine water status, as vine roots were exploring deeper soil layers than the roots of the spontaneous vegetation. In the current study, Ψstem readings were significantly correlated to θs records, being the strongest correlations when θs data were collected at a 0.45 m depth, suggesting that most of the water uptaken by the vines comes from this soil layer. Furthermore, according to the relationship found in the current study when gathering data from the two treatments and all depths, at 50% of soil available water (approximately 0.18 m3 m−3), Ψstem would be −1.07 MPa and grapevines would suffer from moderate water stress [9]. Therefore, this equation could be useful for optimizing green cover management in this vineyard, but it must be tested in other situations (vineyards, regions) to assess its general applicability. Therefore, further research is required to confirm the results of this study and validate the equations proposed, as well as adapt this approach to other woody crops.
Despite these relevant outcomes, the current study has some limitations that confine the scope of the findings obtained. First, the data refer to a single season and year-to-year variations in weather, and the vegetative growth development of trees and vines may alter the equations obtained in this work. Second, soil water content measurements were restricted to a depth of 0.45 m, which can be considered shallow for woody perennials, especially under rain-fed conditions. In the current work, most of the root system of the three species considered was concentrated within this depth, but over time, the root system will develop deeper, likely modifying the relationships between θs and Ψstem produced in the current work. Finally, the use of uncalibrated sensors impeded us from determining the magnitude of the errors in measuring θs associated with this lack of calibration. In order to assess the reliability of the θs measurements reported in the current work, capacitance probes should be calibrated, and a comparison of calibrated against uncalibrated values should be undertaken. Nevertheless, the results from the current study suggest that managing orchard and vineyard practices (irrigation and green covers) in an operational context can be guided by these uncalibrated sensors.

5. Conclusions

The main objective of this work was met, as this study detected significant (p-value < 0.05) relationships between θs and Ψstem for peach trees and grapevines (r > 0.75) that may be used for optimizing the management of irrigation and green covers in the studied plots. In contrast, no significant relationships between θs and Ψstem were detected for pear trees. The main novelty of this work was the direct correlation of θs obtained with capacitance sensors and Ψstem measurements, which has been rarely reported in the literature. However, the relationships found in this study were different from those reported in previous works, suggesting that the choice of both depth and location to install the sensors are of utmost importance to obtain reliable estimations of tree and vine water status. Further research is needed to expand these findings, which may serve as a basis for developing tools that allow for the efficient use of water in fruit tree orchards and vineyards, taking advantage of the advancements in soil and water sensor technologies.

Author Contributions

Conceptualization, J.M.M.-A.; methodology, J.M.M.-A.; validation, J.M.M.-A. and E.S.A.; formal analysis, J.M.M.-A. and E.S.A.; investigation, J.M.M.-A.; resources, J.M.M.-A.; data curation, J.M.M.-A. and E.S.A.; writing—original draft preparation, J.M.M.-A. and E.S.A.; writing—review and editing, J.M.M.-A. and E.S.A.; visualization, J.M.M.-A.; supervision, J.M.M.-A.; project administration, J.M.M.-A.; funding acquisition, J.M.M.-A. All authors have read and agreed to the published version of the manuscript.

Funding

This study forms part of the AGROALNEXT programme and was supported by MCIN with funding from European Union NextGenerationEU (PRTR-C17.I1). Partial funding was obtained through a research contract signed between CITA and MBG-CSIC.

Data Availability Statement

The dataset is available on request from the authors.

Acknowledgments

The authors thank the staff of Bodegas Viñas del Vero and Sociedad Cooperativa San Marcos Binacetense for allowing us to carry out this work in their plantations.

Conflicts of Interest

The authors declare no conflicts of interest. The funders had no role in the design of the study; in the collection, analyses, or interpretation of data; in the writing of the manuscript; or in the decision to publish the results.

Abbreviations

The following abbreviations are used in this manuscript:
θsSoil water content
ΨstemMidday stem water potential
EToReference evapotranspiration
TmeanMean air temperature
TmaxMaximum air temperature
TminMinimum air temperature
RHRelative humidity
SWBSoil water balance

References

  1. Vadez, V.; Pilloni, R.; Grondin, A.; Hajjarpoor, A.; Belhouchette, H.; Brouziyne, Y.; Chehbouni, G.; Kharrou, M.H.; Zitouna-Chebbi, R.; Mekki, I.; et al. Water use efficiency across scales: From genes to landscapes. J. Exp. Bot. 2023, 74, 4770–4788. [Google Scholar] [CrossRef] [PubMed]
  2. IPCC. Climate Change 2021. The Physical Science Basis. Summary for Policymakers; Intergovernmental Panel on Climate Change: Geneva, Switzerland, 2021; p. 40. [Google Scholar]
  3. Masia, S.; Trabucco, A.; Spano, D.; Zinder, R.L.; Sušnik, J.; Marras, S. A modeling platform for climate change impact on local and regional crop water requirements. Agric. Water Manag. 2021, 255, 107005. [Google Scholar] [CrossRef]
  4. Vercambre, G.; Mirás-Avalos, J.M.; Juillion, P.; Moradzadeh, M.; Plenet, D.; Valsesia, P.; Memah, M.M.; Launay, M.; Lesniak, V.; Cheviron, B.; et al. Analyzing the impacts of climate change on ecosystem services provided by apple orchards in Southeast France using a process-based model. J. Environ. Manag. 2024, 370, 122470. [Google Scholar] [CrossRef]
  5. Ruiz-Sanchez, M.C.; Domingo, R.; Castel, J.R. Review. Deficit irrigation in fruit trees and vines in Spain. Span. J. Agric. Res. 2010, 8, 5–20. [Google Scholar] [CrossRef]
  6. Mirás-Avalos, J.M.; Araujo, E.S. Optimization of vineyard water management: Challenges, strategies, and perspectives. Water 2021, 13, 746. [Google Scholar] [CrossRef]
  7. Marsal, J.; Mata, M.; Arbonés, A.; Rufat, J.; Girona, J. Regulated deficit irrigation and rectification of irrigation scheduling in young pear trees: An evaluation based on vegetative and productive response. Eur. J. Agron. 2002, 17, 111–122. [Google Scholar] [CrossRef]
  8. Gelly, M.; Recasens, I.; Mata, M.; Arbones, A.; Rufat, J.; Girona, J.; Marsal, J. Effects of water deficit during stage II of peach fruit development and postharvest on fruit quality and ethylene production. J. Hortic. Sci. Biotechnol. 2003, 78, 324–330. [Google Scholar] [CrossRef]
  9. van Leeuwen, C.; Trégoat, O.; Choné, X.; Bois, B.; Pernet, D.; Gaudillère, J.P. Vine water status is a key factor in grapevine ripening and vintage quality for red Bordeaux wine. How can it be assessed for vineyard management purposes? J. Int. Sci. Vigne Vin 2009, 43, 121–134. [Google Scholar] [CrossRef]
  10. Medrano, H.; Tomás, M.; Martorell, S.; Escalona, J.M.; Pou, A.; Fuentes, S.; Flexas, J.; Bota, J. Improving water use efficiency of vineyards in semi-arid regions. A review. Agron. Sustain. Dev. 2015, 35, 499–517. [Google Scholar] [CrossRef]
  11. Fereres, E.; Soriano, M.A. Deficit irrigation for reducing agricultural water use. J. Exp. Bot. 2007, 58, 147–159. [Google Scholar] [CrossRef]
  12. Girona, J.; Mata, M.; Arbonés, A.; Alegre, S.; Rufat, J.; Marsal, J. Peach tree response to single and combined regulated deficit irrigation regimes under shallow soils. J. Amer. Soc. Hort. Sci. 2003, 128, 432–440. [Google Scholar] [CrossRef]
  13. Mirás-Avalos, J.M.; Pérez-Sarmiento, F.; Alcobendas, R.; Alarcón, J.J.; Mounzer, O.; Nicolás, E. Using midday stem water potential for scheduling deficit irrigation in mid-late maturing peach trees under Mediterranean conditions. Irrig. Sci. 2016, 34, 161–173. [Google Scholar] [CrossRef]
  14. Blanco, V.; Kalcsits, L. Long-term validation of continuous measurements of trunk water potential and trunk diameter indicate different diurnal patterns for pear under water limitations. Agric. Water Manag. 2023, 281, 108257. [Google Scholar] [CrossRef]
  15. Girona, J.; Mata, M.; del Campo, J.; Arbonés, A.; Bartra, E.; Marsal, J. The use of midday leaf water potential for scheduling deficit irrigation in vineyards. Irrig. Sci. 2006, 24, 115–127. [Google Scholar] [CrossRef]
  16. Montanarella, L.; Panagos, P. The relevance of sustainable soil management within the European Green Deal. Land Use Pol. 2021, 100, 104950. [Google Scholar] [CrossRef]
  17. Celette, F.; Gaudin, R.; Gary, C. Spatial and temporal changes to the water regime of a Mediterranean vineyard due to the adoption of cover cropping. Eur. J. Agron. 2008, 29, 153–162. [Google Scholar] [CrossRef]
  18. Abad, J.; Hermoso de Mendoza, I.; Marín, D.; Orcaray, L.; Santesteban, L.G. Cover crops in viticulture. A systematic review (1): Implications on soil characteristics and biodiversity in vineyard. OENO One 2021, 55, 295–312. [Google Scholar] [CrossRef]
  19. Fernández, J.E. Plant-based methods for irrigation scheduling of woody crops. Horticulturae 2017, 3, 35. [Google Scholar] [CrossRef]
  20. Naor, A. Relations between leaf and stem water potentials and stomatal conductance in three field-grown woody species. J. Hortic. Sci. Biotechnol. 1998, 73, 431–436. [Google Scholar] [CrossRef]
  21. Shackel, K. A plant-based approach to deficit irrigation in trees and vines. HortScience 2011, 46, 173–177. [Google Scholar] [CrossRef]
  22. Santesteban, L.G.; Miranda, C.; Marín, D.; Sesma, B.; Intrigliolo, D.S.; Mirás-Avalos, J.M.; Escalona, J.M.; Montoro, A.; de Herralde, F.; Baeza, P.; et al. Discrimination ability of leaf and stem water potential at different times of the day through a meta-analysis in grapevine (Vitis vinifera L.). Agric. Water Manag. 2019, 221, 202–210. [Google Scholar] [CrossRef]
  23. Suter, B.; Triolo, R.; Pernet, D.; Dai, Z.; Van Leeuwen, C. Modeling stem water potential by separating the effects of soil water availability and climatic conditions on water status in grapevine (Vitis vinifera L.). Front. Plant Sci. 2019, 10, 1485. [Google Scholar] [CrossRef] [PubMed]
  24. Choné, X.; Van Leeuwen, C.; Dubourdieu, D.; Gaudillère, J.P. Stem water potential is a sensitive indicator of grapevine water status. Ann. Bot. 2001, 87, 477–483. [Google Scholar] [CrossRef]
  25. Conesa, M.R.; Conejero, W.; Vera, J.; Ramírez-Cuesta, J.M.; Ruiz-Sánchez, M.C. Terrestrial and remote indexes to assess moderate deficit irrigation in early-maturing nectarine trees. Agronomy 2019, 9, 630. [Google Scholar] [CrossRef]
  26. Zinkernagel, J.; Maestre-Valero, J.F.; Seresti, S.Y.; Intrigliolo, D.S. New technologies and practical approaches to improve irrigation management of open field vegetable crops. Agric. Water Manag. 2020, 242, 106404. [Google Scholar] [CrossRef]
  27. Rienth, M.; Scholasch, T. State-of-the-art of tools and methods to assess vine water status. OENO One 2019, 53, 619–637. [Google Scholar] [CrossRef]
  28. Vanella, D.; Ramírez-Cuesta, J.M.; Sacco, A.; Longo-Minnolo, G.; Cirelli, G.L.; Consoli, S. Electrical resistivity imaging for monitoring soil water motion patterns under different drip irrigation scenarios. Irrig. Sci. 2021, 39, 145–157. [Google Scholar] [CrossRef]
  29. Raffelli, G.; Previati, M.; Canone, D.; Gisolo, D.; Bevilacqua, I.; Capello, G.; Biddoccu, M.; Cavallo, E.; Deiano, R.; Cassiani, G.; et al. Local- and plot-scale measurements of soil moisture: Time and spatially resolved field techniques in plain, hill and mountain sites. Water 2017, 9, 706. [Google Scholar] [CrossRef]
  30. Williams, L.E.; Araujo, F.J. Correlations among predawn leaf, midday leaf, and midday stem water potential and their correlations with other measures of soil and plant water status in Vitis vinifera. J. Am. Soc. Hortic. Sci. 2002, 127, 448–454. [Google Scholar] [CrossRef]
  31. Williams, L.E.; Trout, T.J. Relationships among vine and soil based measures of water status in a Thompson Seedless vineyard in response to high frequency drip irrigation. Am. J. Enol. Vitic. 2005, 56, 357–366. [Google Scholar] [CrossRef]
  32. Martínez-Gimeno, M.A.; Jiménez-Bello, M.A.; Lidón, A.; Manzano, J.; Badal, E.; Pérez-Pérez, J.G.; Bonet, L.; Intrigliolo, D.S.; Esteban, A. Mandarin irrigation scheduling by means of frequency domain reflectometry soil moisture monitoring. Agric. Water Manag. 2020, 235, 106151. [Google Scholar] [CrossRef]
  33. Soulis, K.X.; Elmaloglou, S.; Dercas, N. Investigating the effects of soil moisture sensors positioning and accuracy on soil moisture-based drip irrigation scheduling systems. Agric. Water Manag. 2015, 148, 258–268. [Google Scholar] [CrossRef]
  34. Ferrarezi, R.S.; Nogueira, T.A.R.; Zepeda, S.G.C. Performance of soil moisture sensors in Florida sandy soils. Water 2020, 12, 358. [Google Scholar] [CrossRef]
  35. Goldhamer, D.A.; Fereres, E.; Mata, M.; Girona, J.; Cohen, M. Sensitivity of continuous and discrete plant and soil water status monitoring in peach trees subjected to deficit irrigation. J. Amer. Soc. Hort. Sci. 1999, 124, 437–444. [Google Scholar] [CrossRef]
  36. Intrigliolo, D.S.; Castel, J.R. Vine and soil-based measures of water status in a Tempranillo vineyard. Vitis 2006, 45, 157–163. [Google Scholar] [CrossRef]
  37. Martínez, E.M.; Rey, B.J.; Fandiño, M.; Cancela, J.J. Impact of water stress and nutrition on Vitis vinifera cv. ‘Albariño’: Soil-plant water relationships, cumulative effects and productivity. Span. J. Agric. Res. 2016, 14, e1202. [Google Scholar] [CrossRef]
  38. Allen, R.G.; Pereira, L.S.; Raes, D.; Smith, M. Crop Evapotranspiration–Guidelines for Computing Crop Water Requirements; Irrigation and Drainage Nº 56; FAO: Rome, Italy, 1998; p. 300. [Google Scholar]
  39. Levin, A.D. Re-evaluating pressure chamber methods of water status determination in field-grown grapevine (Vitis spp.). Agric. Water Manag. 2019, 221, 422–429. [Google Scholar] [CrossRef]
  40. R Core Team. R: A Language and Environment for Statistical Computing; R Foundation for Statistical Computing: Vienna, Austria, 2023; Available online: https://www.R-project.org/ (accessed on 14 October 2024).
  41. Abrisqueta, I.; Conejero, W.; Valdés-Vela, M.; Vera, J.; Ortuño, M.F.; Ruiz-Sánchez, M.C. Stem water potential estimation of drip-irrigated early-maturing peach trees under Mediterranean conditions. Comput. Electron. Agric. 2015, 114, 7–13. [Google Scholar] [CrossRef]
  42. Blanco, V.; Willsea, N.; Campbell, T.; Howe, O.; Kalcsits, L. Combining thermal imaging and soil water content sensors to assess tree water status in pear trees. Front. Plant Sci. 2023, 14, 1197437. [Google Scholar] [CrossRef]
  43. Morlat, R.; Jacquet, A. Grapevine root system and soil characteristics in a vineyard maintained long-term with or without interrow sward. Am. J. Enol. Vitic. 2003, 54, 1–7. [Google Scholar] [CrossRef]
  44. Monteiro, A.; Lopes, C.M. Influence of cover crop on water use and performance of vineyard in Mediterranean Portugal. Agric. Ecosyst. Environ. 2007, 121, 336–342. [Google Scholar] [CrossRef]
Figure 1. Dynamics of soil water content (θs) at three depths (0.15, 0.30, and 0.45 m) in an irrigated pear tree orchard located in Binaced (Huesca, Spain).
Agronomy 15 01257 g001
Figure 2. Dynamics of soil water content (θs) at three depths (0.15, 0.30, and 0.45 m) in an irrigated peach tree orchard located in Binaced (Huesca, Spain).
Agronomy 15 01257 g002
Figure 3. Dynamics of soil water content (θs) at three depths (0.15, 0.30, and 0.45 m) in a rain-fed vineyard located in Salas Bajas (Huesca, Spain): (a) tillage; (b) spontaneous vegetation.
Agronomy 15 01257 g003
Figure 4. Midday stem water potential (Ψstem) at different stages over the growing season in an irrigated: (a) peach orchard; (b) pear orchard, located in Binaced (Huesca, Spain). Error bars represent the standard deviation of measurements (6 trees per treatment and date). Farmer refers to the usual irrigation practice performed by the farmers, while SWB stands for soil water balance.
Agronomy 15 01257 g004
Figure 5. Midday stem water potential (Ψstem) at different stages over the growing season in a rain-fed vineyard under two soil management treatments (tillage and spontaneous vegetation) and located in Salas Bajas (Huesca, Spain). Error bars represent the standard deviation of measurements (9 vines per treatment and date). The asterisk indicates significant differences between treatments on a given date.
Agronomy 15 01257 g005
Figure 6. Linear regressions between soil water content (θs) averaged for the 0.15 m to 0.45 m depths and midday stem water potential (Ψstem) of grapevines in a rain-fed vineyard located in Salas Bajas (Huesca, Spain): (a) combining all data; (b) separating data according to soil management treatment. The equations and correlation coefficients (r) are presented.
Agronomy 15 01257 g006
Table 1. Main characteristics of the studied sites.
CharacteristicPeach OrchardPear OrchardVineyard
MunicipalityBinacedBinacedSalas Bajas
Geographical coordinates41°49′26.17″ N
0°13′23.72″ E
41°49′59.8″ N
0°12′7.86″ E
42°5′33.5″ N
0°5′8.9″ E
Elevation (m)290269440
Surface (ha)2.140.981.88
Year of plantation201820142013
Plant spacings (m)5 × 34 × 22.8 × 0.9
Plant density (trees ha−1)66712503968
IrrigationYesYesNo
Average mean temperature (°C)14.514.514.3
Annual rainfall (mm)398398462
Annual ETo (mm)113011301205
Table 2. Characteristics of the soil in the studied orchards (0–40 cm depth). OM = organic matter; FC = field capacity; PWP = permanent wilting point.
OrchardSandSiltClayOMFCPWPAvailable WaterpH
%--
Peach51.427.321.31.7024.316.08.38.47
Pear31.031.038.01.5528.621.37.48.42
Vineyard62.923.213.91.9722.312.39.98.04
Table 3. Monthly temperatures, relative humidity, rainfall, and reference evapotranspiration (ETo) in the studied orchards during the period from May to August 2023. Tmax, Tmin, Tmean = maximum, minimum, and mean daily temperatures, respectively; RH = mean relative humidity.
MonthTmaxTminTmeanRHRainfallETo
°C%mm
“Alfántega” weather station (peach and pear orchards)
May30.14.417.765.458.6140.9
June38.411.522.575.991.2138.8
July42.912.526.066.55.1169.1
August40.810.125.754.81.0170.3
“Salas Bajas” weather station (vineyard)
May28.44.517.434.870.4162.3
June35.611.221.648.0129.8156.7
July40.412.525.838.718.0209.3
August39.610.726.229.63.0217.9
Table 4. Average values of soil water content (θs) at each measured depth and midday stem water potential (Ψstem) over the 2023 growing season in the three sites studied.
Orchardθs (m3 m−3)Ψstem (MPa)
0.15 m0.30 m0.45 m
Peach0.090.090.10−1.21
Pear0.130.140.15−1.39
Vineyard0.180.200.20−1.08
Table 5. Regression equations and Pearson’s r correlation coefficients for the data pairs of midday stem water potential (Ψstem) and soil water content (θs) at different depths in the studied peach and pear orchards and vineyard. The p-value for each data pair is also shown, as well as the number of data (n).
Data PairsnRegression EquationPearson’s r Coefficientp-Value
Peach
Ψstem vs. θs 0.15 m8Ψstem = 0.109 θs − 2.4060.8660.0034
Ψstem vs. θs 0.30 m8Ψstem = 0.122 θs − 2.5780.8150.0084
Ψstem vs. θs 0.45 m8Ψstem = 0.112 θs − 2.6190.7540.0186
Ψstem vs. θs 0.15–0.45 m8Ψstem = 0.119 θs − 2.5840.8340.0062
Pear
Ψstem vs. θs 0.15 m10Ψstem = 0.066 θs − 2.2000.5510.057
Ψstem vs. θs 0.30 m10Ψstem = 0.197 θs − 4.2180.5310.066
Ψstem vs. θs 0.45 m10Ψstem = 0.606 θs − 10.3250.5610.053
Ψstem vs. θs 0.15–0.45 m10Ψstem = 0.141 θs − 3.3380.5580.054
Grapevine
Ψstem vs. θs 0.15 m32Ψstem = 0.055 θs − 2.0030.777<0.0001
Ψstem vs. θs 0.30 m32Ψstem = 0.037 θs − 1.7650.5550.0006
Ψstem vs. θs 0.45 m32Ψstem = 0.121 θs − 3.4410.904<0.0001
Ψstem vs. θs 0.15–0.45 m32Ψstem = 0.086 θs − 2.6610.765<0.0001
Disclaimer/Publisher’s Note: The statements, opinions and data contained in all publications are solely those of the individual author(s) and contributor(s) and not of MDPI and/or the editor(s). MDPI and/or the editor(s) disclaim responsibility for any injury to people or property resulting from any ideas, methods, instructions or products referred to in the content.

