Article

Optimizing Water and Nitrogen Application to Furrow-Irrigated Summer Corn Using the AquaCrop Model

1
School of Water Conservancy, North China University of Water Resources and Electric Power, Zhengzhou 450046, China
2
Collaborative Innovation Center for the Efficient Utilization of Water Resources, Zhengzhou 450046, China
*
Author to whom correspondence should be addressed.
Agronomy 2025, 15(5), 1229; https://doi.org/10.3390/agronomy15051229
Submission received: 11 April 2025 / Revised: 6 May 2025 / Accepted: 13 May 2025 / Published: 18 May 2025
(This article belongs to the Section Water Use and Irrigation)

Abstract

Summer maize is an important grain crop in the North China Plain, but the problem of irrational application of water and fertilizer is becoming increasingly serious. Optimizing water and nitrogen management not only improves yield but also reduces water and fertilizer waste and environmental pollution. The Aquacrop model was calibrated and validated using a two-year summer maize field trial, and 16 different water and nitrogen scenarios were simulated and analyzed. In particular, the field trials were divided into 10 water–nitrogen treatments. The results showed that (1) the model has good applicability to the growth process of summer maize in the North China Plain. (2) Excessive water and nitrogen application would reduce yield by 5.6–33.7%, nitrogen bias productivity by 8.1–32.5%, and water use efficiency by 6.4–84.6%. (3) The optimal irrigation and nitrogen application program for furrow-irrigated summer maize is an irrigation quota of 360 mm in conjunction with nitrogen application of 240 kg/ha. This study provides a theoretical basis for a water-saving, fertilizer-saving, high-yield water and fertilizer management system for summer maize in the North China Plain.

1. Introduction

The North China Plain is a major grain-producing region in China and is critical to national food security [1]. Summer corn grown here accounts for 28% of the country’s grain production [2]. Furrow irrigation, the predominant method used for summer maize in this region, combines ridge planting with targeted water delivery to the crop root zone [3]. Compared with conventional surface irrigation, furrow irrigation significantly helps regulate soil temperature and improve aeration [4], thereby creating a more favorable environment for crop growth [5]. However, with intensified agricultural development, the overuse of chemical fertilizers and inefficient irrigation practices under furrow irrigation have become more prevalent, negatively impacting farmland ecosystems, soil fertility, and crop quality [6]. Over-fertilization and over-irrigation are degrading arable land conditions and constraining crop growth and development [7]. As a result, optimizing irrigation systems and nitrogen management to enhance water and nitrogen use efficiency has become a key focus of current crop research [8]. Therefore, identifying optimal irrigation and nitrogen application strategies for summer maize in the study area is essential to ensure regional food security and mitigate conflicts arising from water and fertilizer misuse.
Determining optimal crop water and nitrogen application rates is often achieved through field experiments or theoretical calculations. However, these methods are time-consuming, labor-intensive, and produce results with limited generalizability, making large-scale application difficult [9]. Since the 1970s, to improve crop-related research, researchers have developed comprehensive mathematical models for agriculture, such as the AquaCrop model [10], WOFOST model [11], and CropSyst model [12]. However, each model has distinct features. For instance, the WOFOST model simulates yield formation primarily through solar-driven photosynthesis [13], while the CropSyst model tends to underestimate crop biomass during calibration [14]. In contrast, the AquaCrop model, developed by the Food and Agriculture Organization (FAO), is characterized by a limited number of parameters, user-friendly design, and high simulation accuracy [15]; it can effectively simulate various crop types, irrigation strategies, growth cycles, yields, and other key agronomic indicators [16]. Additionally, AquaCrop simulates crop growth and yield formation primarily based on soil moisture dynamics [17], making it particularly suitable for studying interactions between soil water, fertilizer, and yield. It is now widely used in agricultural management research.
Numerous studies have evaluated and confirmed the applicability and simulation accuracy of the AquaCrop model. In 2024, Jia et al. [18] applied the AquaCrop model to simulate aboveground biomass, yield, and volumetric soil water content of maize in western Yunnan. The model accurately reproduced maize yield under varying planting densities across wet, normal, and dry years, identifying 78,000 plants/ha as the optimal density in that region. In 2024, Nie et al. [19] calibrated and validated the AquaCrop model using summer maize data from Shaanxi, achieving a relative error of only 1.85% between simulated and observed yields. They also determined the optimal single irrigation volume for furrow irrigation under typical hydrological conditions. In 2022, Bar [20] calibrated and validated the AquaCrop model using local maize data from southern Telangana, concluding that optimal yields during drought could be achieved with 50 mm of irrigation, resulting in an average water productivity of 10.65 kg/ha. These findings demonstrate that AquaCrop can achieve high simulation accuracy when calibrated with local field data. In summary, the AquaCrop model, when localized, is a highly effective tool for simulating crop growth and determining optimal irrigation and nitrogen application strategies under various scenarios [21]. However, most applications focus on maize under border irrigation, despite the distinct soil infiltration characteristics among irrigation methods, which can influence model simulation accuracy [19], Therefore, using the AquaCrop model to predict furrow-irrigated summer maize yields and assessing its ability to maintain high accuracy under furrow irrigation remains a key research question. Therefore, calibration and validation of AquaCrop using field data under furrow irrigation conditions may provide valuable insights for future research in this area.
In view of this, this study focused on the North China Plain and calibrated the AquaCrop model using field data from 2023 to 2024. The localized model was then applied to simulate the growth and development and yield formation of furrow-irrigated summer maize under different water and N application scenarios. The accuracy of the model in simulating furrow-irrigated summer maize was then assessed by analyzing yield, N factor productivity, and irrigation water use efficiency. This study further explores the effects of different water and nitrogen gradients on crop growth and determines the optimal irrigation and nitrogen input strategies to maximize yield while balancing nitrogen use efficiency and water productivity. The results of this study can provide scientific guidance for the efficient cultivation of furrow-irrigated summer maize in the North China Plain, as well as a reference for the simulation of furrow-irrigated crops by the AquaCrop model.

2. Materials and Methods

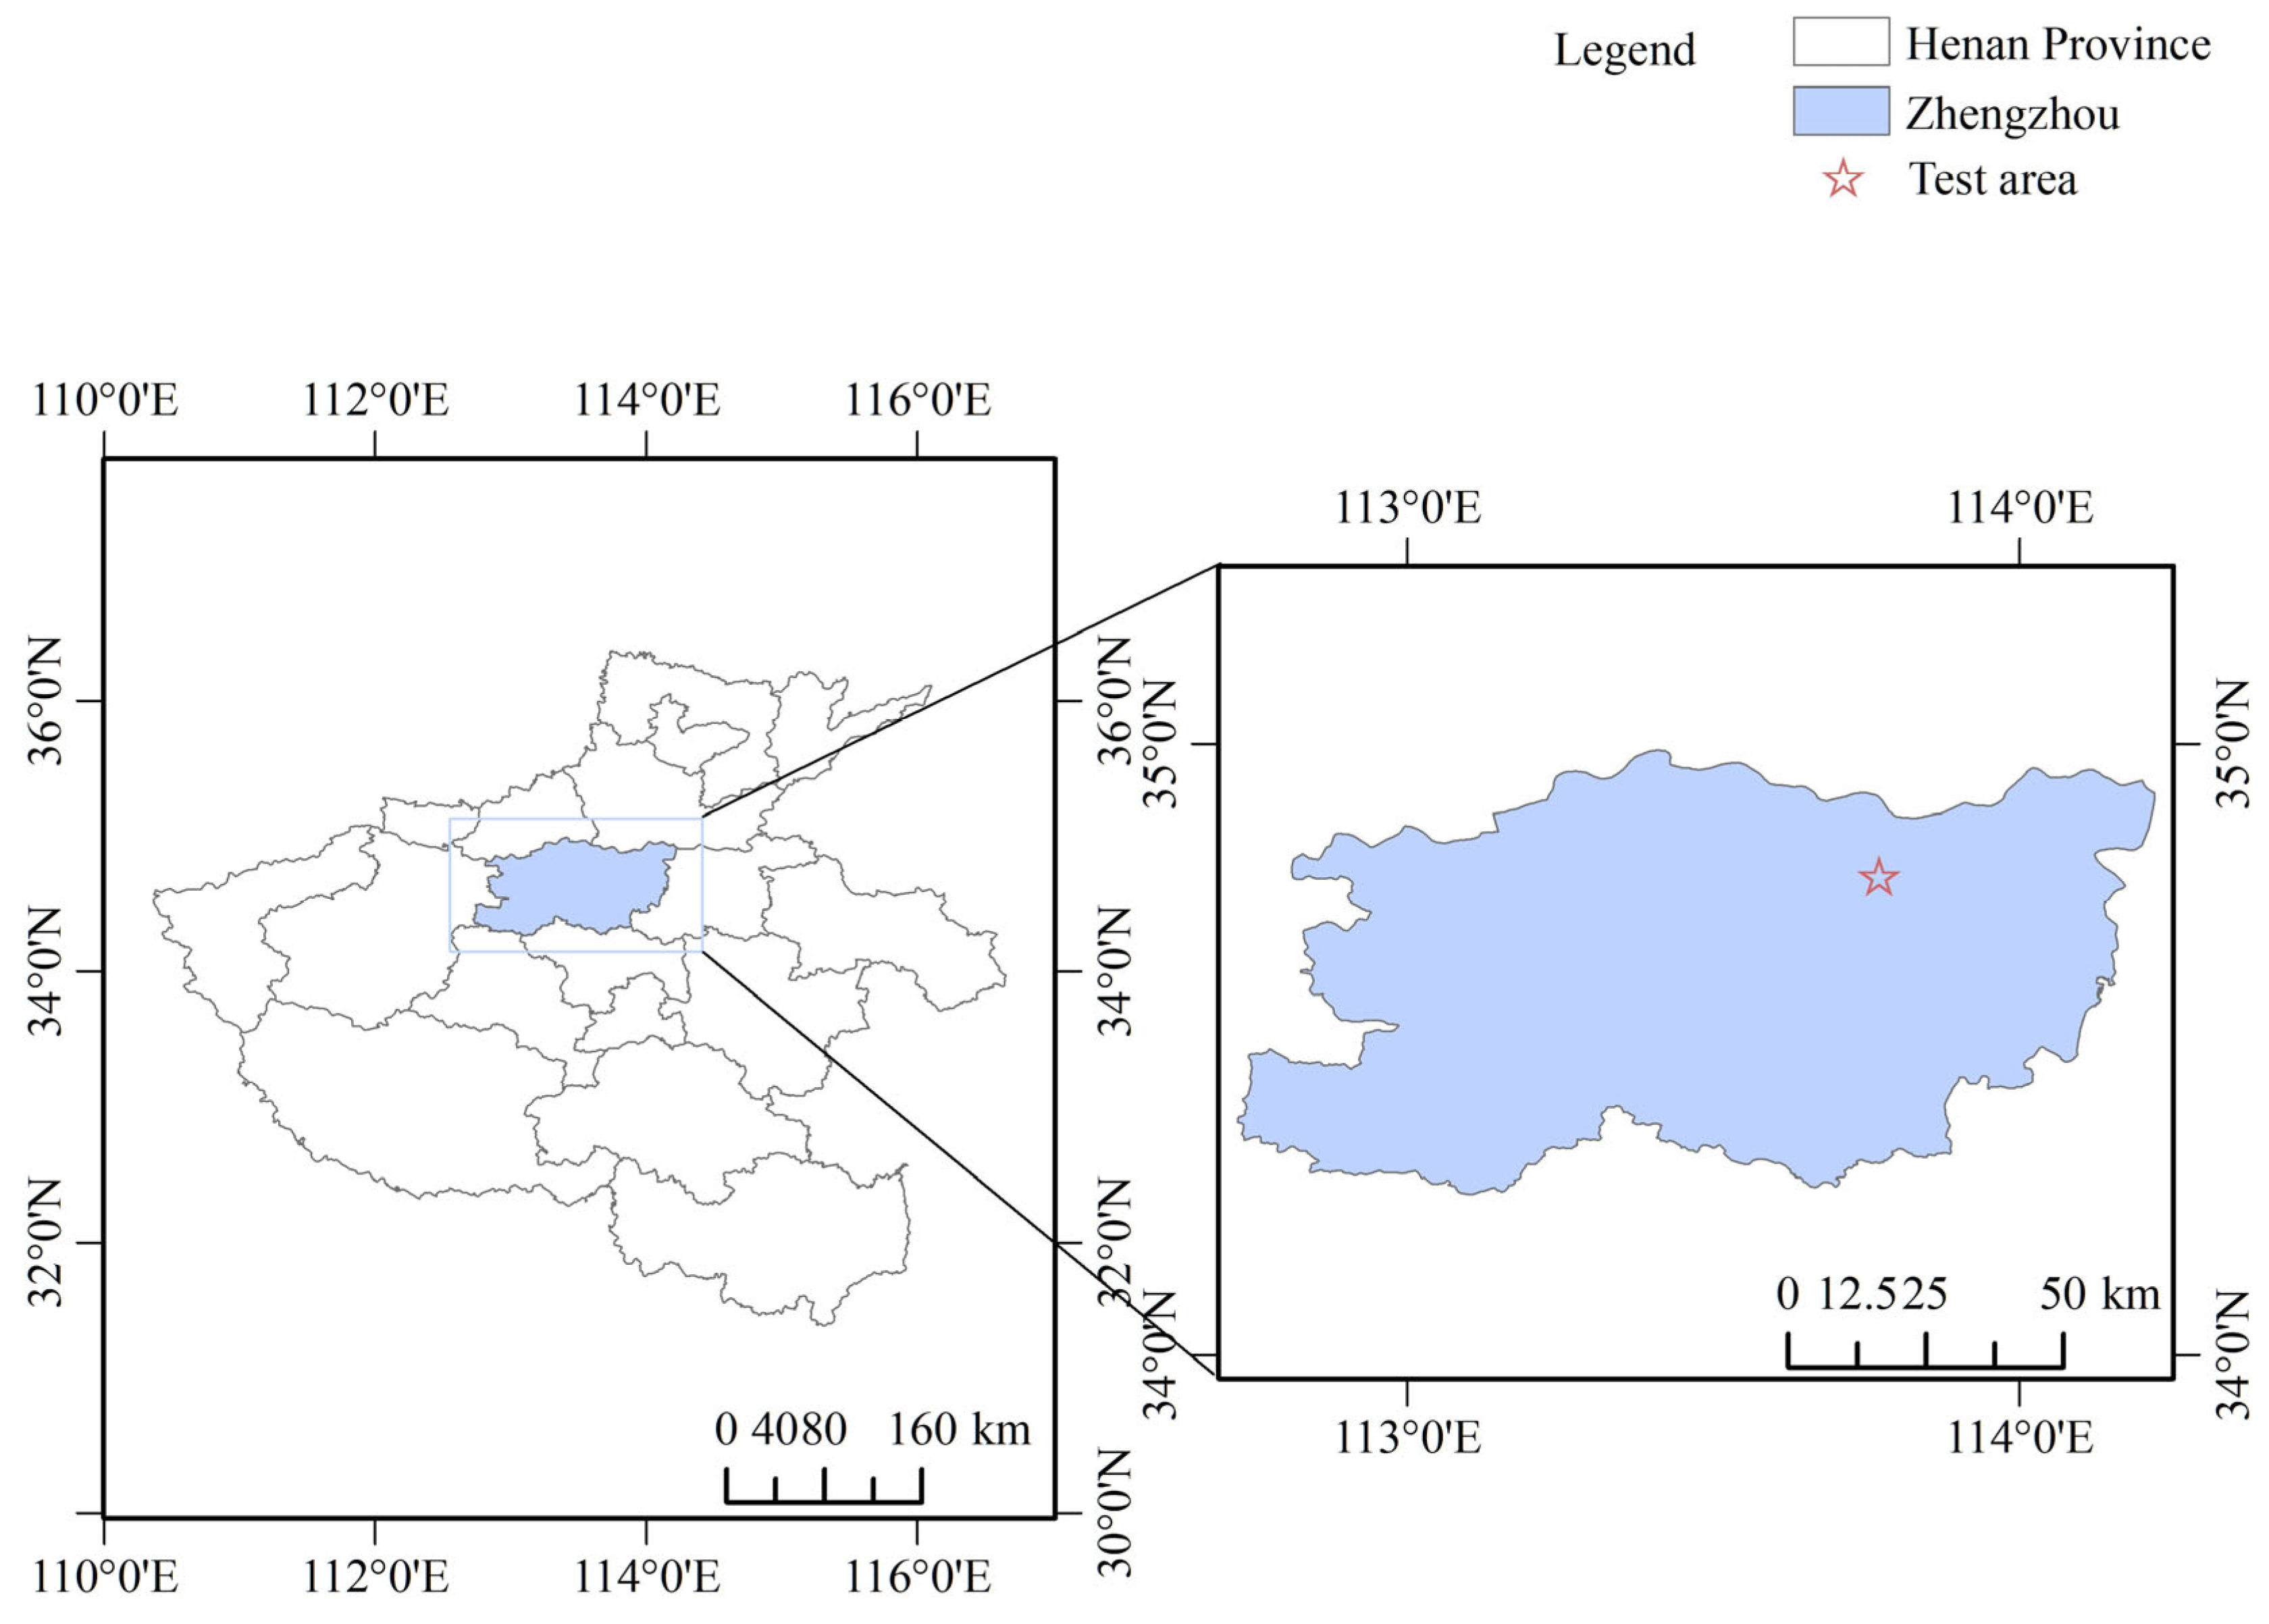
2.1. Location and Overview of the Test Area

The experiment was carried out from 2023 to 2024 at the Laboratory of Efficient Water Use in Agriculture, North China University of Water Resources and Hydropower (34°52′ N, 113°48′ E; elevation: 110 m). The location of the test area is detailed in Figure 1. The experimental site is situated in the Yuzhong region of the North China Plain, which is characterized by a temperate continental monsoon climate with four distinct seasons. Summers are hot and rainy, with approximately 70% of annual precipitation occurring between June and September, while spring and winter are relatively dry.
The region receives an average of 6.57 h of sunshine per day, has a frost-free period of approximately 220 days, an annual mean temperature ranging from 14.3 °C to 14.8 °C, and average annual precipitation between 586 and 669 mm. The cropping system in the study area follows a long-term summer maize–winter wheat rotation. The texture of the 0–80 cm soil layer in the experimental field is silty clay loam, while the texture of the 80–100 cm soil layer is clay loam. Soil physical properties are summarized in Table 1, and meteorological data covering the entire growing seasons of summer maize in 2023 and 2024 are presented in Figure 2 and Figure 3.

2.2. Experimental Design

The experiment followed a split-plot design, with irrigation volume as the main plot factor and nitrogen application as the subplot factor. Each plot was 5 m long and 2 m wide, with an area of 10 m2 and a 3 m protected row between each plot. Furrow irrigation was employed, with irrigation furrows having a trapezoidal cross-section.
Moisture-controlled irrigation was adopted, aiming to maintain soil volumetric water content during the reproductive stage of summer maize at no less than 65%, 75%, or 85% of field capacity. When soil moisture in the target layer dropped below the specified threshold, irrigation was applied based on a fixed quota of 40 mm, determined in consideration of interannual rainfall variability. In 2023, irrigation treatments included four (W1), five (W2), and six (W3) applications, while, in 2024, the treatments were three (W1), four (W2), and five (W3) applications.
Three nitrogen application rates were established: 120 kg/ha (N1), 220 kg/ha (N2), and 320 kg/ha (N3). A basal fertilizer equivalent to 60 kg/ha of total nitrogen was applied using Stanley’s ternary compound fertilizer (15% N, 15% P, 15% K), incorporated into the soil prior to sowing. The remaining nitrogen was used as topdressing and equally split into two applications: one during the jointing stage and the other during the grain-filling stage. Urea (46% N) served as the topdressing fertilizer. The maize variety used was Zheng Dan 958 (A high-yielding variety prevalent in the region with a multi-year average yield of 8774 kg/ha in the test area). The specific water and nitrogen application schemes are detailed in Table 2.
Summer maize was sown on 1 June in both 2023 and 2024, at a density of 80,000 plants/ha, and harvested on September 10 each year. All other management practices followed local conventional standards.

2.3. Research Methodology

2.3.1. AquaCrop Model Principles, Parameters, and Validation

The AquaCrop model, a widely used crop simulation tool developed by the FAO, is capable of simulating crop growth and yield formation across diverse regions of the world by incorporating the effects of multiple interacting factors, including weather, soil, crop characteristics, and management practices [22]. The model operates on a daily time step and consists of four core sub-modules: the meteorological module, which includes precipitation, reference evapotranspiration (ET0), atmospheric CO2 concentration, and maximum and minimum air temperatures; the soil module, which manages soil water balance and infiltration processes; the crop module, which simulates crop development, growth, senescence, and yield formation; the management module, which accounts for irrigation practices and field management strategies [23].
To distinguish between productive and unproductive water use, AquaCrop separates total evapotranspiration (ET) into soil evaporation (E) and crop transpiration (Tr). The final yield is calculated based on the relationship between aboveground biomass (B) and the harvest index (HI) [24]:
Y = B × H I
B = W P × T r
where Y is crop yield, kg/ha; HI is the harvest index; B is cumulative above-ground biomass, kg/ha; WP is water productivity, kg/m3; Tr is crop transpiration, mm. To evaluate the impact of nutrient stress on crop growth, the model incorporates four fertility stress parameters: canopy expansion coefficient, maximum canopy cover, canopy wilting stress coefficient, and biomass water productivity. These parameters reflect reductions in maximum canopy cover, canopy expansion rate, average canopy cover, and normalized water productivity during parameter calibration. The calibrated values for these nutrient stress parameters are presented in Table 3.
The AquaCrop model provides default parameter settings for maize growth. However, due to regional differences in climate, soil properties, and cropping practices, these default parameters are not universally applicable. Therefore, calibration and validation of the model parameters are necessary to improve the accuracy of maize growth and yield simulations [25]. According to the AquaCrop modeling manual, parameters are classified into conservative and non-conservative categories [26]. Conservative parameters are standard values recommended by the model and generally do not require adjustment. In contrast, non-conservative parameters must be calibrated based on site-specific conditions within the value ranges provided in the manual. Following the approach of Xing et al. [27], a sensitivity analysis was first conducted on summer maize parameters using the Extended Fourier Amplitude Sensitivity Test (eFAST) method. Subsequently, referring to the calibration sequence proposed by Vanuytrecht et al. [28], key parameters related to canopy cover, biomass, and yield were calibrated stepwise using a trial-and-error approach [29]. Selected calibration parameters used in the model are presented in Table 4.
In this study, the coefficient of determination (R2), root mean square error (RMSE), and model efficiency coefficient (EF) were selected as indicators to evaluate the accuracy of the model [30].
R M S E = i = 1 n S i M i 2 n
E F = 1 i = 1 n S i M i 2 i = 1 n M i M 2
where n is the number of measured values; Mi and Si (i = 1, 2, …, n) represent the measured and simulated values, respectively; and M is the average of the measured values. RMSE reflects the magnitude of the deviation between the simulated and measured values; the closer the RMSE is to 0, the higher the accuracy of the model. EF evaluates the relative magnitude of residuals and the degree of fit between simulated and measured values. Both R2 and EF values closer to 1 indicate better model performance.

2.3.2. Measurement and Calculation of Indicators

(1)
Canopy Cover
Canopy cover (CC) refers to the percentage of soil surface area covered by the green crop canopy and is a key indicator used to characterize crop growth, yield potential, and temporal dynamics in field conditions. In this study, CC data were collected at various growth stages of maize and used to calibrate and validate model parameters. At each reproductive stage, three representative plants were selected, the leaf area index (LAI) was measured using a leaf area meter (LY-PLA Series Leaf Area Meter), and, when estimation was needed, the LAI was calculated using the following method, and, then, the canopy cover (CC) was calculated as follows [30]:
L A I = 0.75 ρ j = 1 m i = 1 n L i j · W i j m
C C = 1.005 1 e 0.6 L A I 1.2
where ρ is the planting density (plants/ha); Lij and Wij are the maximum length and width of leaves (mm), respectively; n is the number of leaves per maize plant; and m is the number of sampled maize plants.
(2)
Aboveground Biomass and Yield
After maize entered the tasseling stage, aboveground biomass (B) was measured every 15–25 days. In each plot, three representative plants reflecting average crop growth were selected. The aboveground parts were separated from the roots, dried at 105 °C for 0.5 h to deactivate enzymes, and then oven-dried at 75 °C until constant weight. The dry weight was then multiplied by the planting density to calculate aboveground biomass. At physiological maturity, 20 representative plants were selected per plot. The cobs were harvested, air-dried, manually threshed, and oven-dried at 75 °C to a constant weight to determine the final grain yield.
(3)
Soil Moisture Content
Soil water content (SWC) was measured using a TRIME-TDR probe (IMKO, Ettlingen, Germany). The principle is that high-frequency electromagnetic pulse along the transmission line in the soil propagation speed depends on the soil dielectric constant, and the dielectric constant is mainly governed by the soil moisture content, according to the electromagnetic wave propagation frequency in the medium to calculate the soil dielectric constant, so as to utilize the empirical relationship between the soil dielectric constant and the soil volumetric water content to calculate the soil water content. Measurements were taken from 0 to 100 cm depth at 20 cm intervals. At each growth stage, soil samples were also collected using a soil auger in five layers within the 1 m soil profile to calibrate the TRIME-TDR readings. Data collection began from the tasseling stage.
(4)
Crop water consumption
Crop water consumption was calculated using the water balance equation, calculated as follows [30]:
E T C = I + P + U R + W 0 W 1
where ETC is crop water consumption, mm; I is irrigation water, mm; P is Effective rainfall, mm; U is groundwater recharge, mm; R is surface runoff, mm; W0 and W1 are soil water storage at the beginning and end of the time period, respectively, in mm.
No surface runoff was formed in the two-year field test, so R = 0. Groundwater depth was greater than 5 m, so U = 0. The equation can be simplified as follows [30]:
E T C = I + P + W 0 W 1
(5)
Water use efficiency and irrigation water use efficiency
WUE is an indicator used to measure the amount of dry matter produced by a crop while consuming a unit mass of water, and IWUE is the ratio of the amount of water actually utilized by the crop to the amount of water irrigated. Calculation of these two metrics is used to determine the impact of irrigation water on crop yield in order to explore and determine a rational irrigation schedule. The calculation formula is as follows [30]:
W U E = Y E T C
I W U E = G G 0 I · 1000
where WUE is water use efficiency, kg/m3; Y is yield, kg/ha; IWUE is irrigation water use efficiency, kg/m3; G is yield under irrigated conditions, kg/ha; G0 is rainfed yield, kg/ha; and I is the amount of irrigation during the reproductive period, mm.
(6)
Net irrigation water requirement
Net irrigation water requirement is the amount of additional water that must be supplied by irrigation to meet crop growth requirements, which is the difference between the total crop water requirement and effective precipitation [31]. The net irrigation water requirement is calculated as follows [30]:
I R = E T c P e
E T c = K c E T 0
P e = α P 0
where IR is the net irrigation water demand (mm); ETc is the crop water demand (mm); Pe is the effective precipitation (mm); Kc is the crop coefficient; ET0 is the reference crop water demand (mm); P0 is the total precipitation (mm); α is the effective utilization coefficient. The value of α is determined based on the total precipitation (P0) as follows: when P0 ≤ 5 mm, α = 0; when 5 mm ≤ P0 ≤ 50 mm, α = 0.9; when P0 ≥ 50 mm, α = 0.75.
The cumulative effective precipitation from multiple precipitation events during the reproductive stage is considered as the effective precipitation for that stage. Similarly, the effective precipitation from multiple events during the fertility stage is accumulated to determine the effective precipitation for that stage [32].
Studies have shown that, in the absence of experimental data, the crop coefficient (Kc) can be adjusted based on the standard crop coefficients recommended by the FAO using empirical correction formulas [33]. Under FAO-recommended standard conditions (i.e., semi-humid climate with a minimum relative humidity of approximately 45% and wind speed around 2 m/s), the crop coefficient for each growth stage of maize can be estimated using the following formula:
K c m i d = K c m i d t a b + 0.04 u 2 2 0.004 R H m i n 45 h 3 0.3
where Kcmid(tab) is the crop coefficient for the mid-season stage recommended by FAO-56 under standard conditions; u2 is the mean daily wind speed at 2 m height during the growth period (m/s); RHmin is the average daily minimum relative humidity during the growth period (%); h is the average maize canopy height during the mid-season growth stage (m).
(7)
Fertilizer Bias Productivity
Fertilizer bias productivity refers to the ratio of crop yield achieved under a specific fertilizer application to the amount of fertilizer applied. It serves as a crucial indicator reflecting the combined effects of local soil nutrient levels and fertilizer application efficiency. Fertilizer bias productivity is calculated using the following formula [30]:
P F P N = Y / F
where PFPN refers to the fertilizer bias productivity in kg/kg; Y is the yield of the crop with a specific fertilizer application, in this case, summer maize, expressed in kg/ha; F represents the amount of pure nutrients applied from a particular fertilizer (such as N, P2O5, K2O, etc.), with this study focusing on nitrogen fertilizer, expressed in kg/ha based on the nitrogen content.
The term fertilizer bias productivity in this study specifically refers to nitrogen fertilizer bias productivity (PFPN).
(8)
Data statistics and processing
The experimental data were processed and visualized using Excel 2016 and Origin 2022. Statistical analysis was performed using one-way ANOVA followed by LSD multiple comparison tests for significance (α = 0.05), with the data analyzed using SPSS 27.0.1 software.

2.3.3. Water–Nitrogen Simulation Program Setup

To investigate the irrigation demands in the corn-growing areas of the North China Plain, meteorological data from Zhengzhou City, Henan Province, spanning from 1961 to 2024, were collected and analyzed. The average net irrigation water requirement was then calculated [34]. Based on the local conditions, a simulation of water and nitrogen application scenarios was developed. Irrigation stages were divided into the nodulation, tasseling, and irrigation stages, with irrigation quotas set at four levels: 300 mm, 360 mm, 420 mm, and 480 mm. Each irrigation quota was divided into three portions to be applied during the nodulation, tasseling, and irrigation stages of summer maize. Nitrogen fertilizer (46% N) was used as the primary fertilizer, with four application rates set at 180 kg/ha, 200 kg/ha, 220 kg/ha, and 240 kg/ha. A total of 16 water and nitrogen simulation scenarios were generated, as shown in Table 5.

2.4. Data Sources

The meteorological data used in this study were sourced from the China Meteorological Science Data Sharing Service Network, covering 64 years of daily meteorological data from 1961 to 2024. The reference crop water requirement (ET0) was calculated using the ET0 Calculator tool provided by the FAO [30], which facilitated the establishment of a meteorological database. CO2 concentration data, obtained from the National Ecological Data Center Resource Sharing Service Platform, were utilized. These data comprised the global monthly atmospheric CO2 concentration dataset based on CMIP6 historical and future scenarios. Soil data, including parameters such as soil depth and soil moisture, were also collected from the study area. The AquaCrop model was calibrated using field trial data from 2023 and validated with field trial data from 2024.

3. Results

3.1. AquaCrop Model Calibration and Validation

Using the 2024 field experiment data, three key parameters—canopy cover (CC), above-ground biomass (B), and soil water content (SWC)—were selected to validate the rate-determined AquaCrop model and evaluate its applicability to the local area. The validation results for these parameters under different irrigation and nitrogen application treatments are presented in Figure 4, Figure 5 and Figure 6.

3.1.1. Canopy Cover (CC) Validation

The dynamic simulation results of summer maize canopy coverage are shown in Figure 4. The measured values of canopy coverage are closely aligned with the simulated values, exhibiting a high degree of consistency and a similar trend of change. During the seedling to jointing period, as corn growth progressed, the leaf area index (LAI) increased rapidly, and canopy cover followed suit. By the time the maize reached the tassel stage, the leaves had nearly fully expanded, and growth ceased, resulting in the maximum canopy cover. This maximum was maintained for a period before the leaves began to yellow, senesce, and shed, until the leaves were shed in large numbers, causing both the LAI and canopy cover to decrease sharply.
From Figure 4, the R2, RMSE, and EF average values for canopy cover across all treatments were 0.985, 4.5%, and 0.971, respectively. The range of variation for each treatment was as follows: R2 (0.97–0.99), RMSE (2.3–10%), and EF (0.9–0.99). R2 was highest only in the W3N1 treatment and lowest in the CK treatment. RMSE was highest in the W1N3 treatment and lowest in W3N1. EF was highest only in W3N1 and lowest in W1N3. In the simulation results, the maximum canopy cover reached 95% in the W2N2 treatment, while it was 65% in the CK treatment, indicating a 46.2% increase in W2N2 compared to CK. Excluding CK, the maximum canopy cover in W1N3 reached a minimum of 80%, which was 15.8% lower than W2N2.
Among the three water treatments, the maximum canopy cover peaked at 92% under the medium water treatment, which was 6.1% and 4.5% higher than the low and high water treatments, respectively. Among the three nitrogen application treatments, the maximum canopy cover was highest (93.7%) under the medium nitrogen treatment, which was 9.3% and 7.3% higher than the low and high nitrogen treatments, respectively.

3.1.2. Biomass (B) Validation

The dynamic simulation of the aboveground biomass of summer maize is shown in Figure 5. The simulated values closely followed the measured values, with both showing a similar trend. The aboveground biomass of all treatments increased rapidly from the nodulation stage (20–30 days), reaching its maximum at maturity (80–90 days). However, the model tended to predict higher biomass values in the later stages of maize growth compared to the measured values.
As shown in Figure 4, the R2, RMSE, and EF average values for biomass across all treatments were 0.985, 1000 kg/ha, and 0.959, respectively. These values varied across treatments within the following ranges: R2 (0.96–0.99), RMSE (400–1700 kg/ha), and EF (0.92–0.99). Both R2 and EF were highest in the W1N1 treatment and lowest in the CK treatment, while RMSE was highest in W2N2 and lowest in W1N1. In the simulation results, the maximum aboveground biomass was 21,004 kg/ha in the W2N2 treatment, and the minimum was 8660 kg/ha in the CK treatment, showing a 124.5% increase in W2N2 compared to CK. Excluding CK, the minimum aboveground biomass was 13,050 kg/ha in W3N1, which was 37.9% lower than W2N2.
Among the three water treatments, the maximum aboveground biomass was 19,286 kg/ha under the medium water treatment, which was 31.9% and 24.5% higher than the low and high water treatments, respectively.

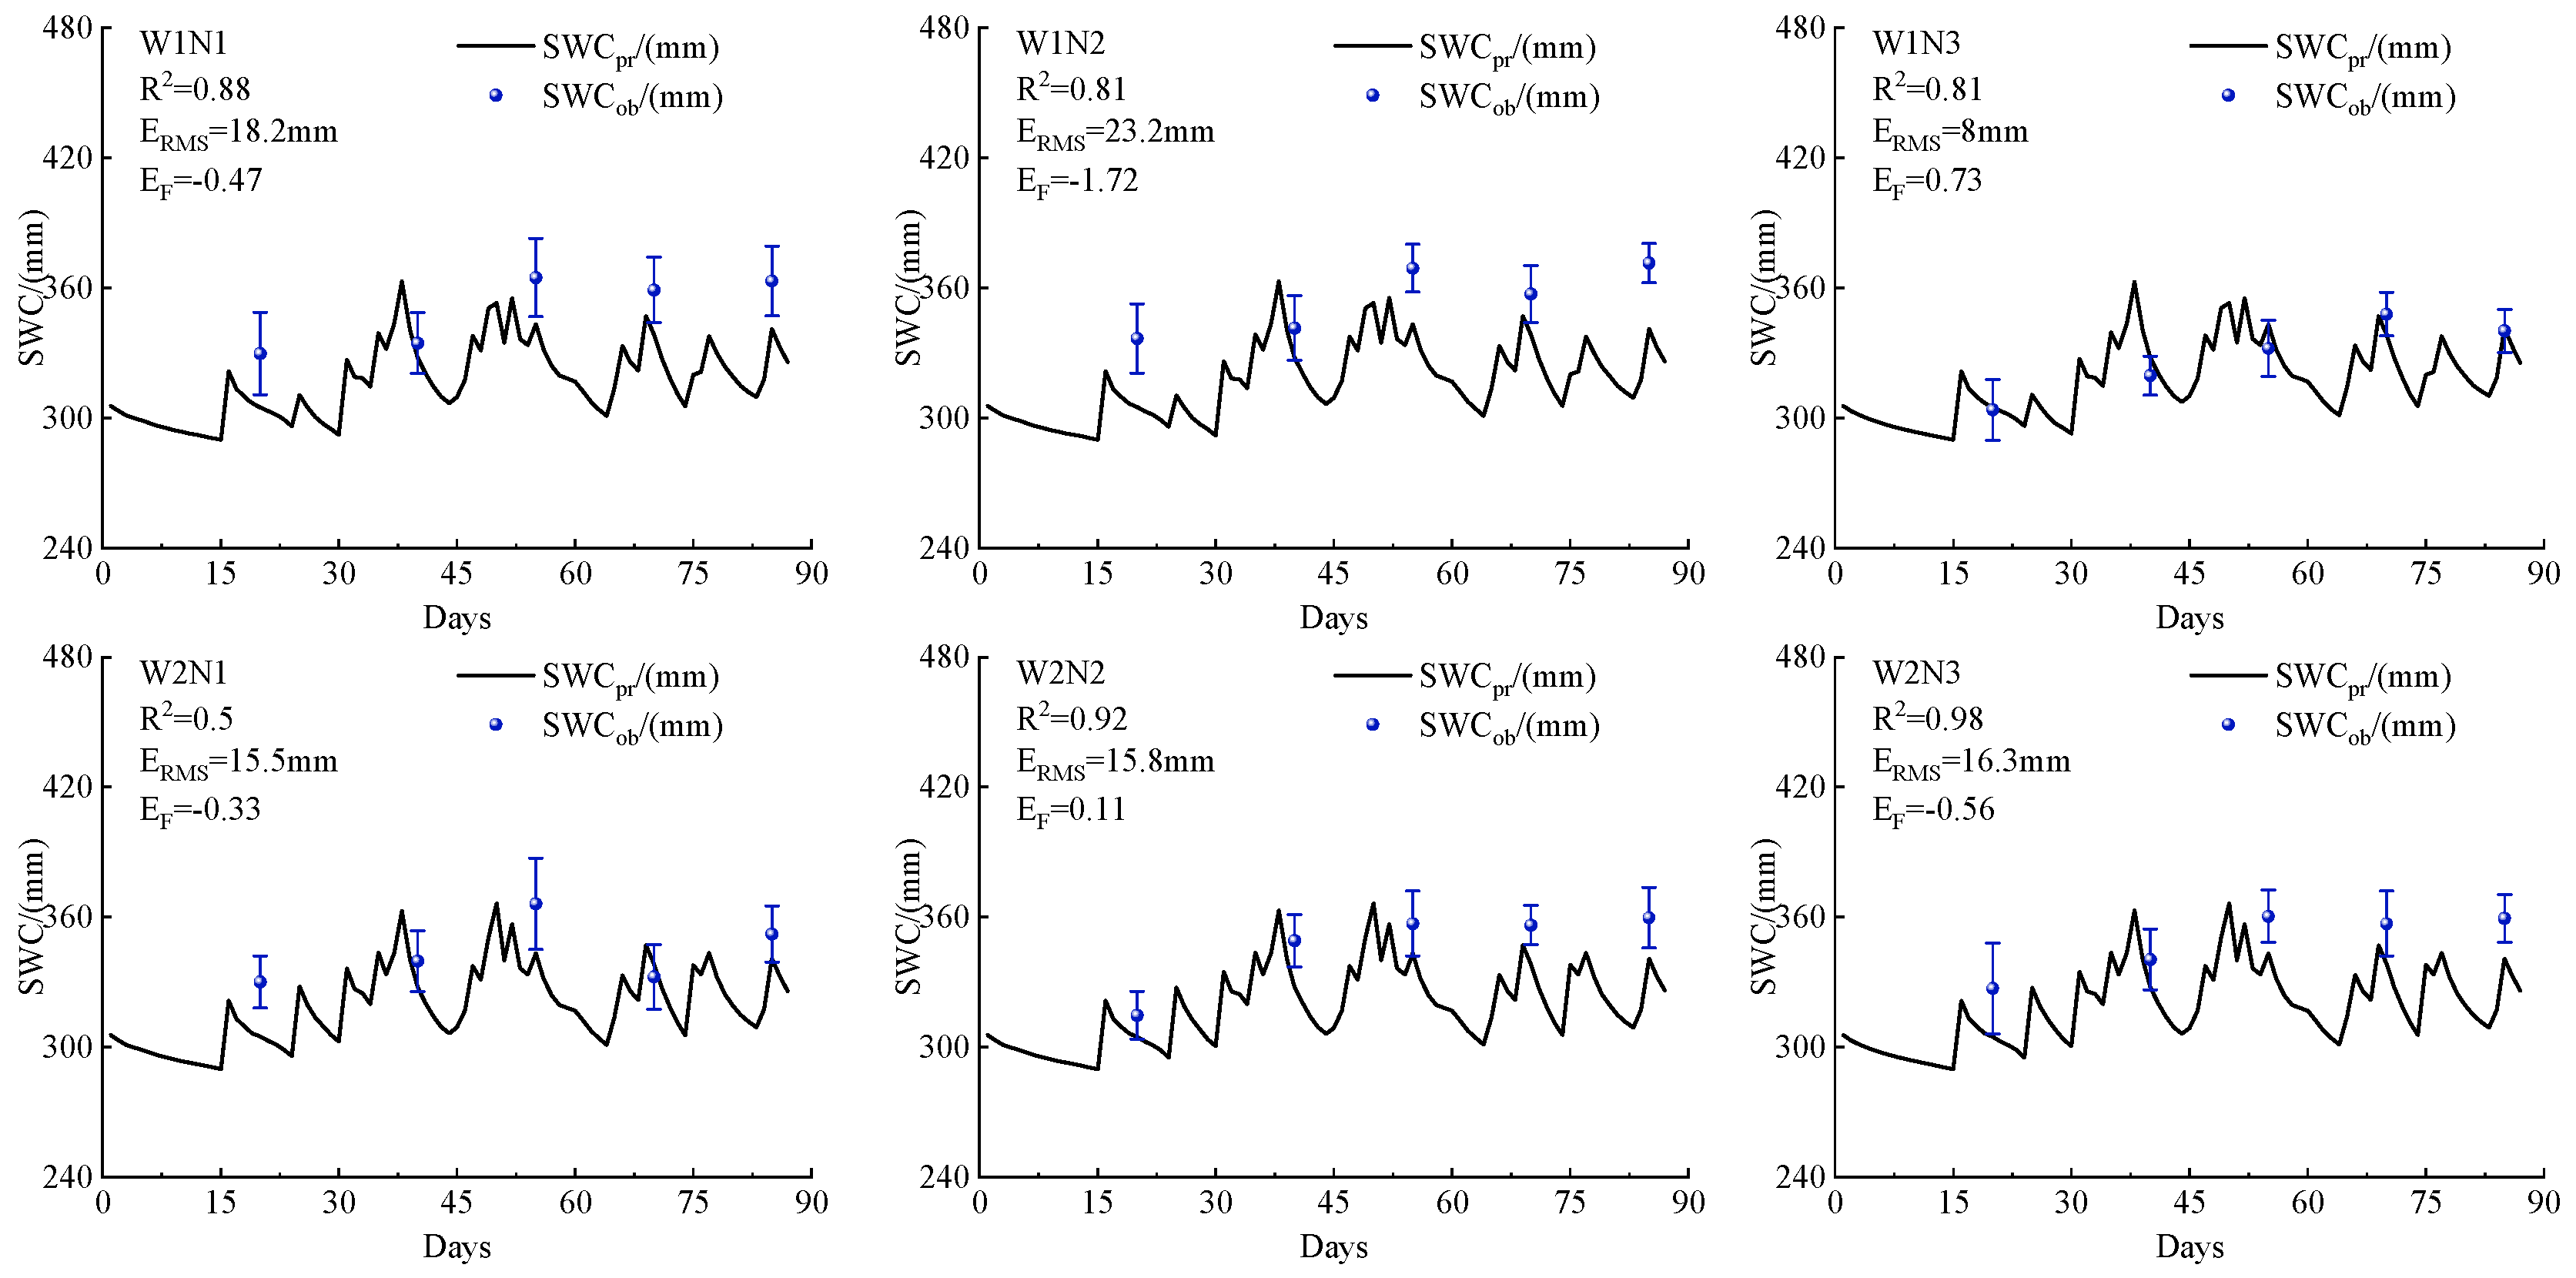
3.1.3. Soil Water Content (SWC) Validation

The dynamic simulation results of soil water content in summer maize are shown in Figure 6. Except for the CK treatment, the measured values were generally higher than the simulated values. The R2, RMSE, and EF average values for soil water content across all treatments were 0.833, 17.47 mm, and −0.843, respectively. These results indicate that the model’s fit to soil water content was significantly lower than that for biomass and canopy cover, reflecting poorer accuracy. However, from the soil water content curve, it can be observed that the simulated values showed a rapid increase following precipitation or irrigation events.
In the simulation results, the maximum soil water content was 320.02 mm in the W3N1 treatment, while the minimum was 315.43 mm in the CK treatment, representing a 1.4% increase in W2N2 compared to CK. Excluding CK, the soil water content reached a minimum of 316.71 mm in W1N2, which was a 1.1% decrease compared to W2N2. Among the three water treatments, the soil water content peaked at 319.91 mm under the high water treatment, which was 0.5% and 0.3% higher than the low and medium water treatments, respectively. Among the three nitrogen application treatments, the maximum soil water content was 318.52 mm under the low fertilizer treatment, with no significant difference when compared to the low and high water treatments.

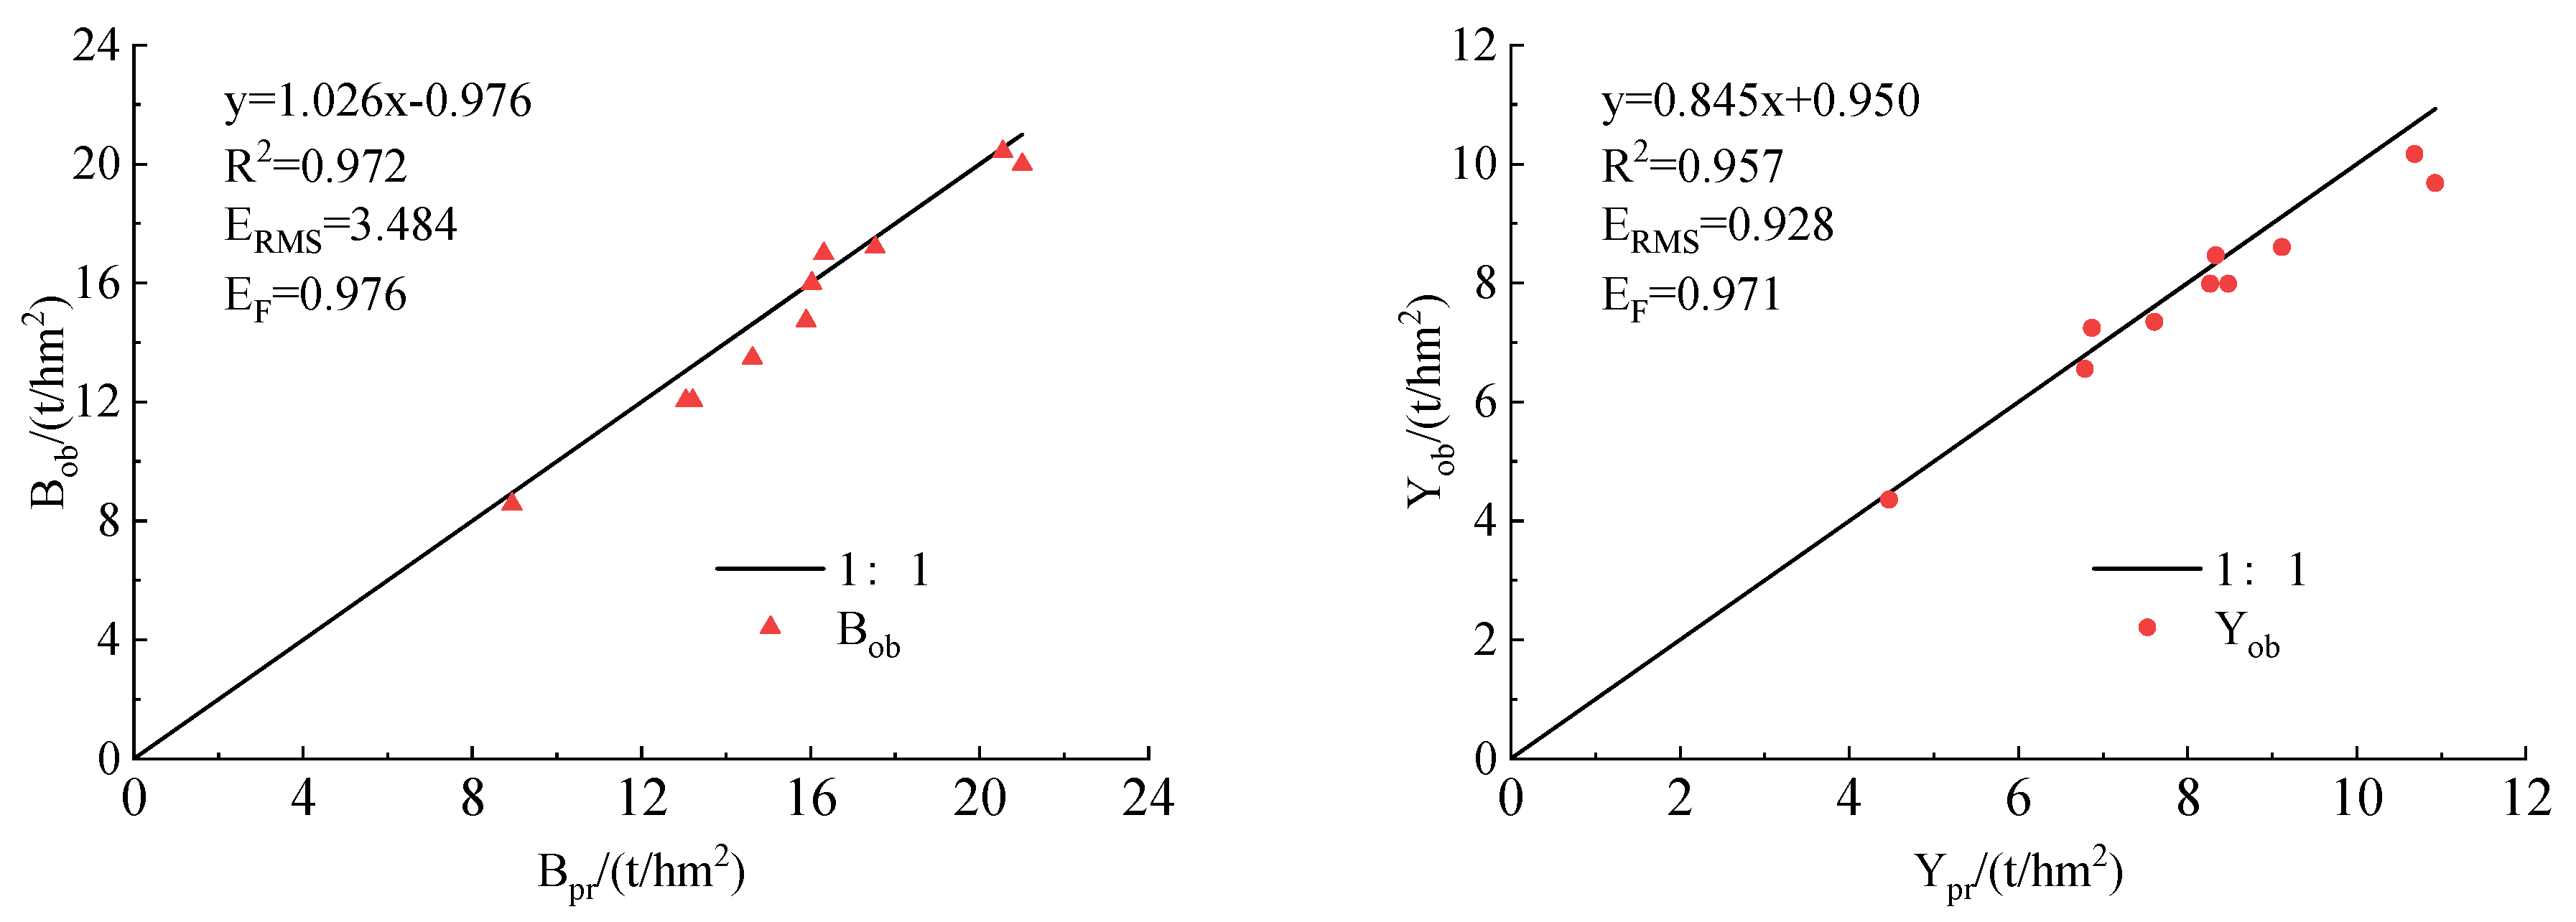
3.1.4. Final Biomass and Yield Validation

The results of the model validation for final biomass and yield are shown in Figure 7. The R2, RMSE, and EF values for yield across all treatments were 0.957, 928 kg/ha, and 0.971, respectively, while the corresponding values for final biomass were 0.972, 3484 kg/ha, and 0.976. The relative errors for the treatments are presented in Table 6. The minimum relative error for yield was 1.56%, corresponding to treatment W1N2, and the maximum was 12.89%, corresponding to treatment W2N2. The average relative error across all treatments was 4.99%. For final biomass, the minimum relative error was 0.23%, corresponding to treatment W1N2, while the maximum was 9.65%, corresponding to treatment W1N3. The average relative error for final biomass was 5.09%.
These results suggest that the AquaCrop model was able to effectively simulate the yield and final biomass of summer maize under various water and nitrogen treatments, with the R2, RMSE, and EF values all falling within acceptable ranges. Additionally, the data indicated that the measured values for both yield and final biomass during the validation phase were generally smaller than the simulated values.
The results indicated that the AquaCrop model demonstrated strong accuracy and applicability during both the calibration and validation processes for simulating canopy growth, biomass accumulation, and final yield of maize under different irrigation conditions in the study area. This suggests that the model can provide a valuable reference and guidance for agricultural production in the region. However, the analysis also identified several limitations and potential areas for improvement.
One of the main challenges was the model’s insufficient accuracy in predicting soil moisture content. The discrepancy observed in this study may stem from the complexity of the soil moisture infiltration mechanism in furrow irrigation. Another limitation was the inconsistency between the measured leaf area index (LAI) and the model’s predictions. This could be due to discrepancies between the model’s assumptions about average leaf size and leaf number and the actual conditions in the field. Furthermore, the model did not account for additional factors, such as pest and disease pressure, fertilizer availability, and the specific sowing date for maize CC measurements, which was not explicitly reported in the experiment. These factors may have influenced the model’s predictions.
To enhance the predictive ability of the AquaCrop model, it is crucial to address these constraints and integrate them into the model’s calibration during practical applications. This would allow for more accurate simulations that reflect the complexities of real-world conditions.

3.2. Simulation of Different Water–Nitrogen Scenarios

The 16 water and nitrogen scenarios were simulated using the calibrated AquaCrop model, with a focus on three key metrics: yield, nitrogen bias productivity, and irrigation water use efficiency. These metrics were chosen to assess the impact of different irrigation and nitrogen application treatments on maize performance.
The results were analyzed for the significance of differences among the scenarios using IBM SPSS. Table 7 presents the statistical analysis of the results, highlighting the variations in yield, nitrogen bias productivity, and irrigation water use efficiency across the different water and nitrogen treatment combinations. The analysis allows for a clear understanding of how varying irrigation and nitrogen levels influence these important performance indicators, offering insights into optimizing water and fertilizer usage for improved maize production in the study area.

3.2.1. Effect of Water–Nitrogen Application on Yield

As shown in Table 8, the results illustrate the following trends regarding the relationship between nitrogen application, irrigation rates, and maize yield:
Nitrogen Application:
The highest yield was achieved at 240 kg/ha of nitrogen, with average increases of 19.3%, 8.7%, and 4.1% compared to 180 kg/ha, 200 kg/ha, and 220 kg/ha, respectively. This indicates a clear trend of increasing maize yield with higher nitrogen application.
For the irrigation quota of 300 mm, the highest yield was observed with 220 kg/ha of nitrogen, which increased by 9.1%, 6.4%, and 2.2% compared to 180 kg/ha, 200 kg/ha, and 240 kg/ha. This shows that, while increasing nitrogen typically boosts yield, excessive nitrogen application (such as 240 kg/ha) can have a negative effect, reducing yield.
Irrigation Rate:
Yields were highest at an irrigation rate of 360 mm, with average increases of 12.3%, 8.1%, and 12.6% compared to 300 mm, 420 mm, and 480 mm. This suggests that a moderate irrigation rate can positively influence maize yield, particularly in regions where water availability and crop water demand are balanced.
Yield decreased at irrigation rates above 360 mm, indicating that excessive irrigation can have a detrimental effect, likely due to waterlogging or other negative impacts on plant growth.
Water–Nitrogen Program P8:
The highest yield was reached at water–nitrogen program P8, with a value of 11,241 kg/ha, which was 33.7% higher than the minimum yield of 8409 kg/ha at program P13. This program achieved an optimal balance of water and nitrogen inputs.
Even though P8 and P7 had the same irrigation quota, P8 yielded 5.6% more than P7. Similarly, for programs P8 and P12, which had the same nitrogen application, P8 produced 9.5% more yield. This emphasizes that optimal combinations of water and nitrogen application are key to maximizing yield.
Excessive water and nitrogen application (e.g., P4, P16) led to reduced yields, suggesting that over-fertilization or over-irrigation can disrupt the balance required for optimal maize growth and yield.
In conclusion, the results show that moderate irrigation and balanced nitrogen application are crucial for optimizing maize yield. Excessive nitrogen or water inputs, however, can have negative impacts by disturbing the delicate balance required for optimal growth. The study highlights the importance of fine-tuning both irrigation and fertilization practices to improve maize productivity in this region.

3.2.2. Effect of Water–Nitrogen Application on PFPN and IWUE

As shown in Table 8, the results demonstrate the following key trends regarding fertilizer productivity, irrigation efficiency, and the relationship between water and nitrogen application:
Fertilizer Productivity (PFPN):
The highest PFPN was observed at 180 kg/ha of nitrogen, showing an average increase of 3.0%, 8.0%, and 12.9% compared to 200 kg/ha, 220 kg/ha, and 240 kg/ha, respectively. This indicates that increasing nitrogen fertilizer application leads to a decrease in fertilizer productivity. This result suggests that the benefit of fertilizer input diminishes with higher nitrogen application, possibly due to nutrient imbalances or other environmental factors.
Irrigation Quota:
The highest PFPN was achieved at an irrigation quota of 360 mm, with an average increase of 11.9%, 8.1%, and 12.7% compared to 300 mm, 420 mm, and 480 mm, respectively. This shows that moderate irrigation (360 mm) can enhance the efficiency of nitrogen fertilizer application.
PFPN decreased with irrigation quotas above 360 mm, indicating that excessive irrigation can negatively impact the fertilizer efficiency and reduce the benefit of additional fertilizer input.
Water–Nitrogen Program P6:
PFPN reached a maximum value of 52.41 at P6, which is 32.5% higher than the minimum value of 39.54 at P4. This suggests that optimal combinations of water and nitrogen inputs lead to better nitrogen fertilizer productivity.
Irrigation Water Use Efficiency (IWUE):
Irrigation Quota:
IWUE was highest at 300 mm of irrigation, showing a decreasing trend as the irrigation quota increased. This indicates that moderate irrigation provides better irrigation benefits and improves IWUE.
When the irrigation quota increased from 360 mm to 420 mm, IWUE decreased by 6.4% and 20.7%, respectively, highlighting that excessive irrigation can negatively affect water use efficiency. The persistence of high soil moisture can affect root respiration and increase the risk of disease, ultimately harming crop growth.
Nitrogen Application:
IWUE increased with higher nitrogen application, with values of 23.48, 25.26, 26.48, and 27.07 kg/m3 at 180, 200, 220, and 240 kg/ha, respectively. This trend indicates that, as nitrogen application increases, the crop’s demand for soil moisture also increases. The water–nitrogen coupling effect helps the crop utilize more water, enhancing biomass production and IWUE.
Optimal Combination:
The maximum IWUE was observed at an irrigation quota of 300 mm with 220 kg/ha of nitrogen, which increased by 2.2% compared to 240 kg/ha, suggesting that excessive nitrogen application can hinder water absorption and utilization by the crop, leading to reduced crop yield and lower IWUE.
Water–Nitrogen Program P6:
IWUE reached its maximum value of 32.33 at P6, which was 84.6% higher than the minimum value of 17.51 at P13, emphasizing the importance of optimal water–nitrogen combinations for maximizing water use efficiency.
Summary of Key Findings:
Moderate irrigation (around 360 mm) and lower nitrogen application (such as 180 kg/ha) maximize both fertilizer productivity (PFPN) and water use efficiency (IWUE), while excessive nitrogen or water inputs tend to reduce these efficiencies.
Optimal water–nitrogen coupling plays a critical role in maximizing crop yield, fertilizer productivity, and water use efficiency, while excessive irrigation or fertilizer application can have detrimental effects, reducing the overall benefits of these resources.
These findings highlight the need for balanced irrigation and nitrogen management to optimize maize productivity and resource use efficiency.

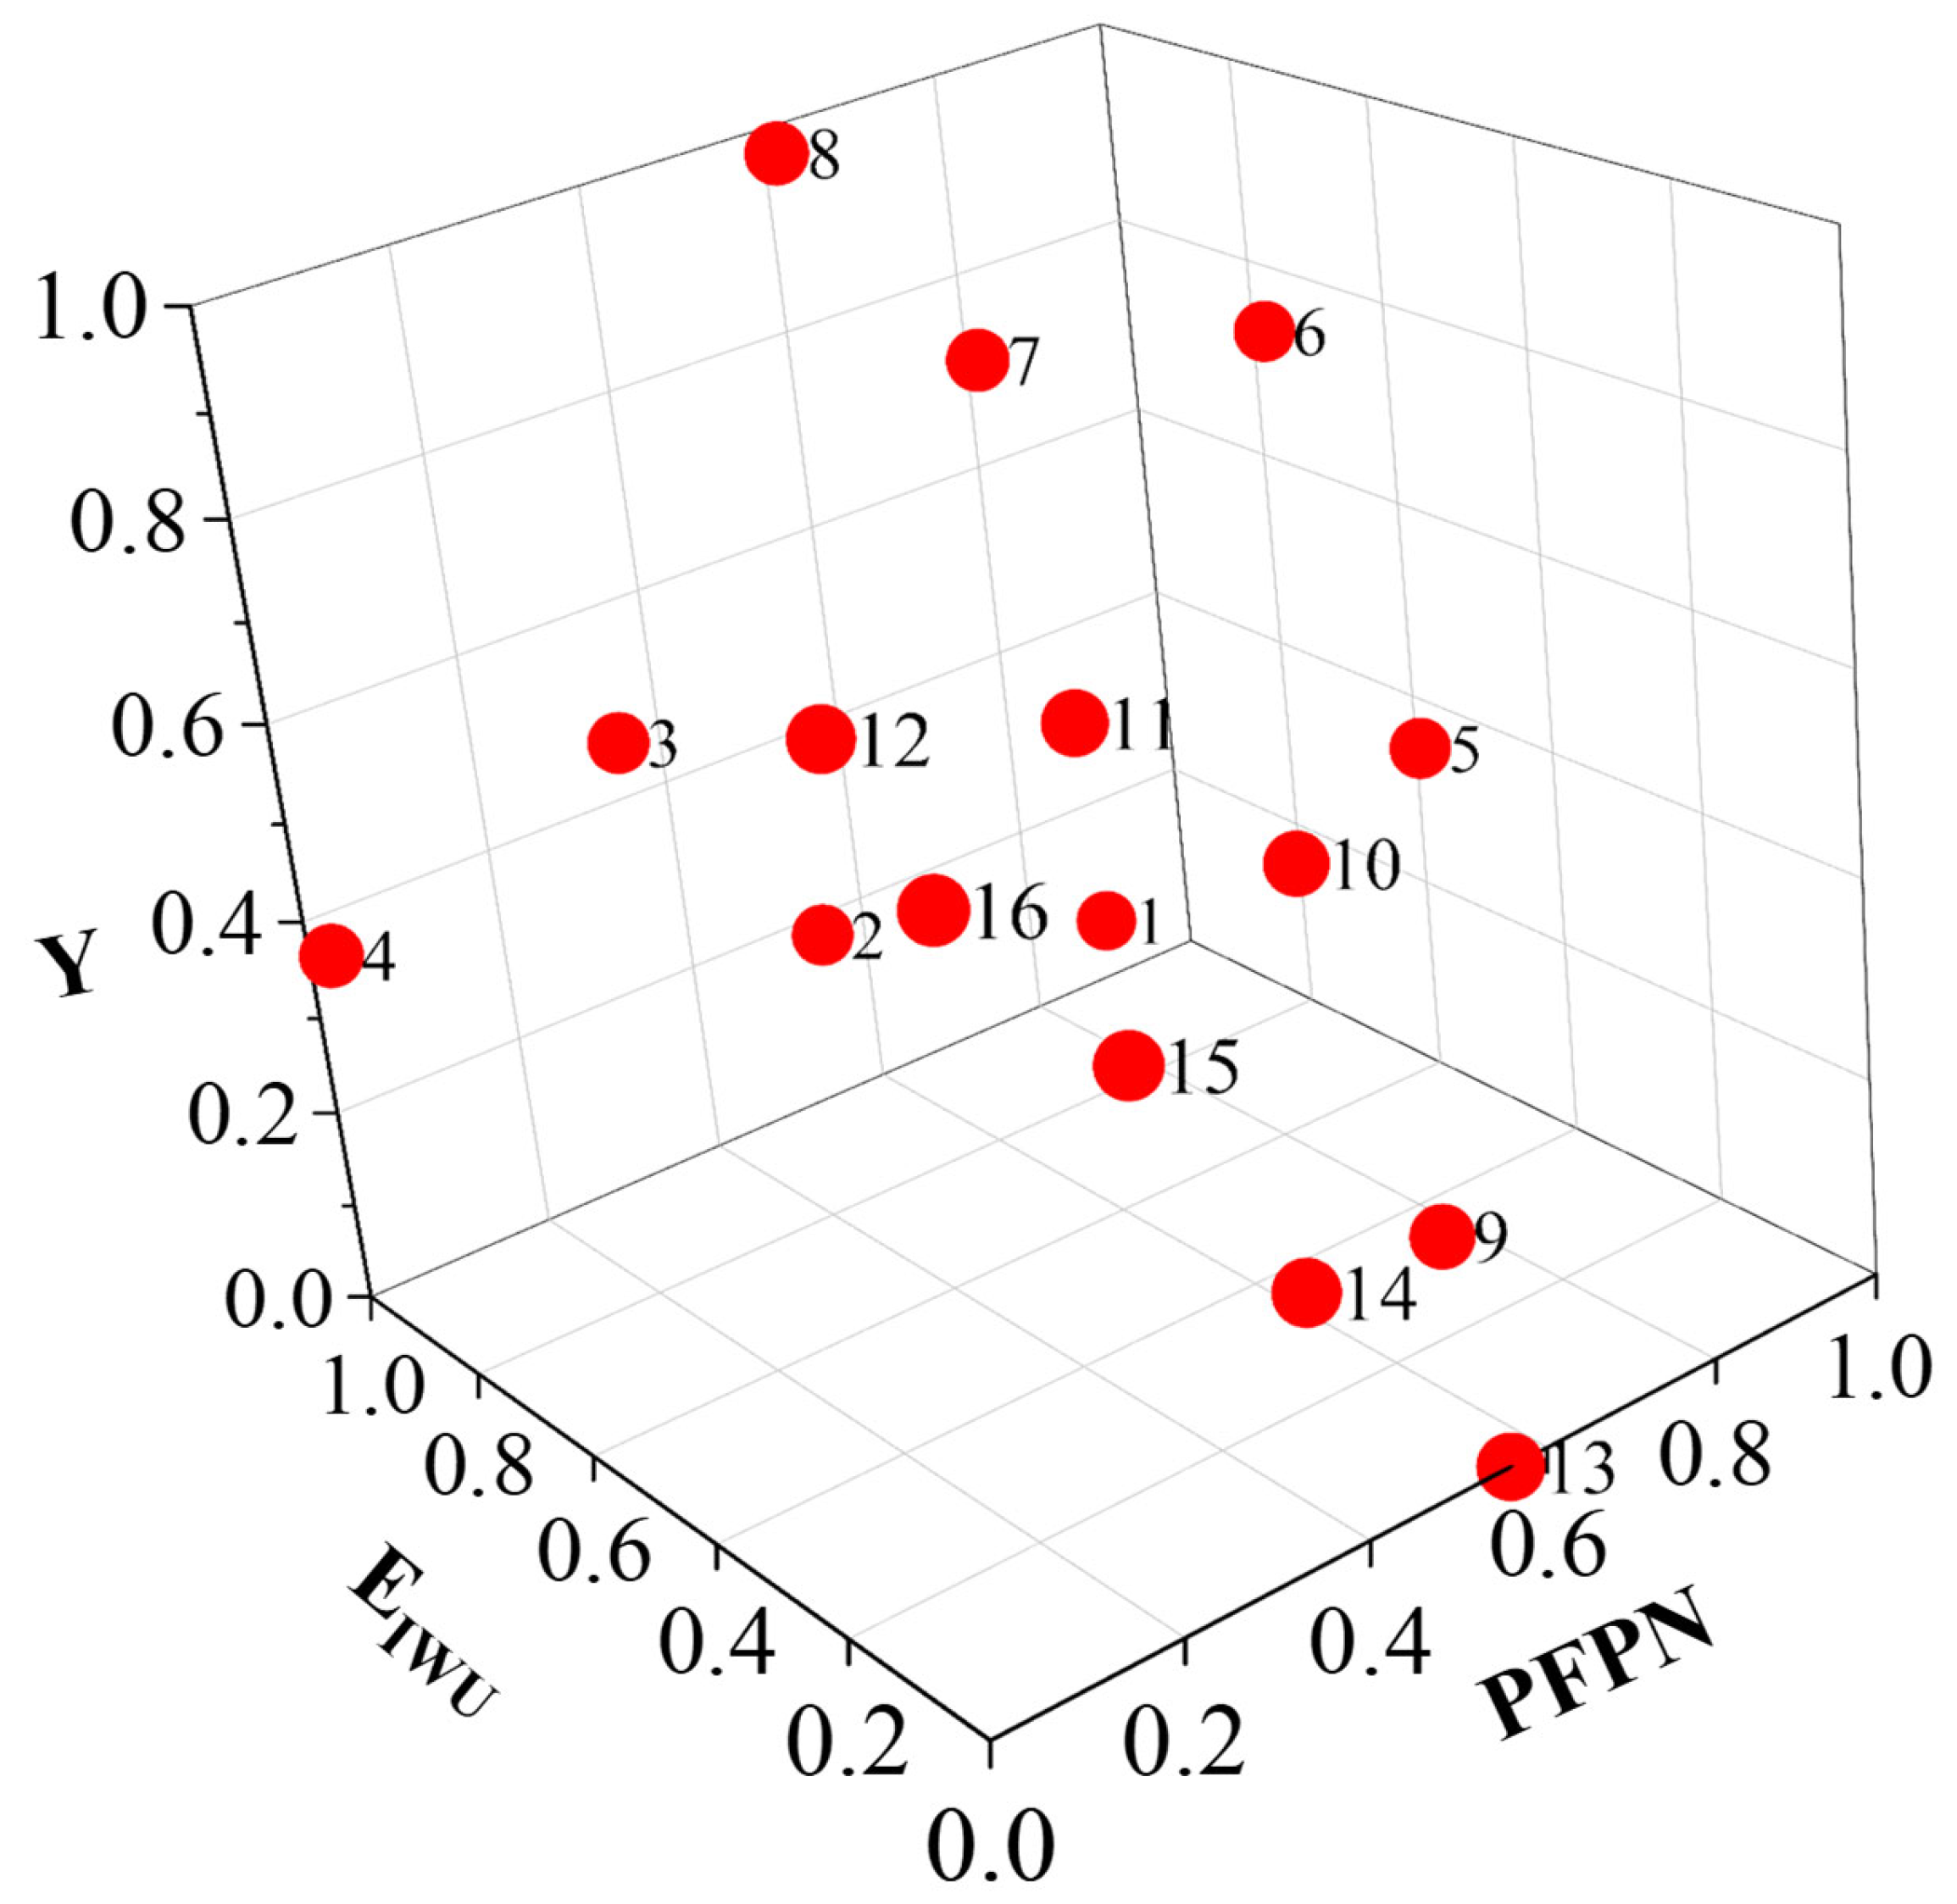
3.3. Water–Nitrogen Program Preferences

Based on years of experience in the experimental site, the screening conditions for high crop yield were set as follows: Y ≥ 70% Ymax. The screening conditions for nitrogen fertilizer bias productivity were set as follows: PFPN ≥ 60% PFPNmax. The screening conditions for water-use efficiency were set as follows: IWUE ≥ 70% IWUEmax.
As shown in Table 8, P3 achieves the highest IWUE, but its yield and PFPN are lower, failing to meet the screening criteria. P6 meets the screening requirements for yield and PFPN, but its IWUE is lower and does not meet the screening criteria. P6, P7, and P8 had the same irrigation quota, with nitrogen application increasing sequentially from 200 to 240 kg/ha. According to the screening criteria, the yield and PFPN of all three scenarios met the requirements. However, P6’s IWUE was lower, failing to meet the screening criteria. In contrast, P7 and P8 saved 20 mm and 40 mm of irrigation water, respectively, equivalent to 200–400 m3 per hectare, demonstrating significant water-saving potential. As shown in Figure 8, P7 and P8 were selected as the optimal water and fertilizer solutions after normalizing and visualizing the simulation results for summer maize yield, PFPN, and IWUE.
Compared to P7, the PFPN of P8 was lower, showing a reduction of 13.04%. However, P8 exhibited higher yield and IWUE, with increases of 26.58% and 14.29%, respectively. This suggests that a moderate increase in nitrogen application does not significantly decrease the PFPN of summer maize. Instead, it leads to substantial increases in both yield and IWUE, achieving the goal of resource conservation and yield stabilization. Therefore, P8 represents the optimal water and fertilizer management strategy.

4. Discussion

4.1. Evaluation of Model Applicability

The model slightly overestimated the canopy cover (CC) of summer maize under the W3 treatment during the early reproductive stage, with a greater overestimation in the middle of the reproductive stage. However, the model exhibited relatively higher accuracy in simulating the treatments during the late reproductive stage. Chen [35] showed that the model overestimated corn canopy cover (CC) under low water treatment, with simulated values higher than the measured ones and lower simulation accuracy. Simulation accuracy worsened further when water stress occurred. This discrepancy may be attributed to differences in irrigation methods. In this study, furrow irrigation was used, and soil moisture movement was more complex in furrow irrigation compared to border irrigation. After rainfall or irrigation, the amount of water available for uptake in the soil decreased over time, resulting in CC simulation of the model similar to the low-water treatment in Chen’s study. It may also be due to the fact that the CC values used to calibrate the model were calculated by empirical formulas using measured LAI values, resulting in biased simulation results. Tang [33] found that the AquaCrop model exhibited higher simulation accuracy during the middle and late stages of maize development, which aligns with the results of this experiment.
For the aboveground biomass accumulation of summer maize, the simulated values in the early fertility stage closely matched the measured values. However, in the late fertility stage, there was a noticeable deviation, with the model slightly overestimating the aboveground biomass. The overestimation increased with the severity of water stress, leading to a higher simulation error. These findings were consistent with those of Li’s [36] study on Hu maize.
The model was not accurate enough in predicting soil water content. This discrepancy contrasts with the results of other studies. For example, Wu’s [37] research showed that AquaCrop’s RMSD for soil moisture during the growing periods of summer maize and winter wheat were 0.06 and 0.05, respectively. Zhang’s study on sesame revealed that the model’s R2 for predicting soil water content ranged from 0.731 to 0.791, and the EF ranged from 0.676 to 0.749, indicating that AquaCrop could simulate soil moisture changes under different irrigation regimes with reasonable accuracy [38]. This is due to the fact that soil moisture infiltration processes in furrow irrigation methods are very different from those in border irrigation, which differs from bed irrigation, making it challenging for the model to simulate the movement of soil moisture accurately and calculate real-time moisture content for each soil layer [39]. It may also be caused by the unevenness of the field surface, as there may be localized accumulation of water on the soil surface after rainfall, and the unevenness of the field surface will lead to a change in the location of the infiltration of the accumulated water, which will lead to a bias in the measured soil moisture content, resulting in an excessive gap between the model simulated values and the measured values. The model slightly underestimated soil water content at mid-fertility during the validation stage and showed a slight underestimation at the end of fertility. This discrepancy may be attributed to rainfall during the summer maize irrigation and ripening stages in 2024, which resulted in higher measured soil water content. Despite this, the model accurately reflected the overall trend of soil water content, consistent with Chang’s simulation results [40]. Chen’s [35] study found that simulated soil water content values in the later fertility stages were slightly higher than the measured values. This discrepancy was likely due to the fact that his soil water content measurements were taken a few days after irrigation or precipitation, causing a mismatch with the model’s simulated peaks and resulting in errors.
In the validation phase, the model slightly overestimated the final biomass of summer maize. Abedinpour [41] used AquaCrop simulations to study maize growth under various water and nitrogen combinations in semi-arid regions. The results showed that the simulated final biomass values in both the simulation and validation phases were slightly higher, a finding that differs slightly from this study, likely due to inter-annual variability. In the validation stage, the relative errors between measured and simulated yields ranged from 1.56% to 12.89%, with an average relative error of 4.99%. This error was slightly larger than the simulated values, but the trend was in good agreement with the final biomass.
In conclusion, AquaCrop can serve as a valuable tool for guiding irrigation and management decisions in summer maize fields of the North China Plain.

4.2. Water–Nitrogen Program Modeling and Treatment Analysis

The simulation of water and nitrogen scenarios using the calibrated model in this study showed that, under the same irrigation quota, an appropriate increase in nitrogen application can enhance crop yield, PFPN, and IWUE. However, Zhang et al. [42] demonstrated that excessive nitrogen application causes seedling burning, which inhibits crop growth and reduces both yield and PFPN, thus lowering IWUE. Similarly, Gao et al. [43] demonstrated that, under the same nitrogen application level, appropriately increasing irrigation volume enhances the crop’s water uptake efficiency, accelerates nitrogen fertilizer uptake, and promotes water–nitrogen interactions, thereby increasing crop yield, PFPN, and IWUE. However, KISEKKAI et al. [44] demonstrated that excessive irrigation, while alleviating water stress limitations on yield, reduces water productivity (WP) and consequently lowers IWUE. Zhao et al. [45] demonstrated that increasing nitrogen supply significantly reduced the cumulative temperature required for maize to enter the rapid nitrogen accumulation phase and reach the maximum growth rate. This prolonged the duration of the rapid growth phase and increased both the maximum and average growth rates during this period. Yang [46] found that, under the same irrigation conditions, dry matter accumulation in summer maize initially increased with increasing nitrogen application but then decreased. Zhang [47] showed that moderate irrigation had a greater impact on PFPN, increasing it by 16.8%. However, the effect of irrigation was limited when rainfall was high, and the increase in summer maize yield and PFPN due to enhanced irrigation became more pronounced as annual rainfall decreased. These findings are consistent with the results of the present study.

4.3. Selection of Water and Nitrogen Application Scheme

In this study, normalization of the simulation results for various water and nitrogen scenarios was used to identify the optimal irrigation rate and nitrogen application. The P7 and P8 scenarios provided the best overall performance across all conditions, which aligns with the two-year field trial results that showed the highest yield and IWUE at W2N2. Zhang [47] reported that maize yield and IWUE increased by 68.1% and 54.8%, respectively, with a nitrogen fertilizer application rate of 215 kg/ha. However, this result differs from the present study because Zhang et al. applied straw return treatment, which likely reduced the effective N fertilizer rate by 20 kg/ha, equivalent to an application rate of 235 kg/ha, aligning more closely with the current study’s findings. These findings are consistent with the results of the present study. Chen’s [38] study found that, when annual rainfall is 377.5 mm, the optimal irrigation amount for summer maize is 45 mm, resulting in an irrigation quota of 362.5 mm, with the optimal nitrogen application rate being 240 kg/ha. Ning et al. [48] demonstrated that the maximum maize grain yield and 95% of IWUE could be achieved with nitrogen application rates between 186–257 kg/ha and water consumption between 374 and 388 mm, under an average annual rainfall of 583 mm. Lu et al. [49] reported that 95–100% of the maximum maize kernel yield could be obtained when nitrogen application was between 187 and 250 kg/ha and water consumption between 358 and 400 mm. These findings are in line with the results of the present study. Therefore, applying 120 mm of water at the nodulation, staminate, and grouting stages (total irrigation quota of 360 mm), coupled with the application of 240 kg/ha of nitrogen, resulted in higher yields, PFPN, and IWUE. This combination was identified as the optimal water and nitrogen application program for summer maize under furrow irrigation.

5. Conclusions

In this study, the localized modified AquaCrop model was used to conduct an in-depth analysis of yield, nitrogen bias productivity, and water use efficiency for summer maize under furrow irrigation in the North China Plain region. The following main results were obtained:
(1)
Model Performance: This study indicates that the model can effectively simulate the growth and development of summer maize under furrow irrigation after calibration, demonstrating high accuracy. It is suitable for studying yield, nitrogen fertilizer bias productivity, and water use efficiency for summer maize under furrow irrigation in the North China Plain.
(2)
Impact of irrigation and fertilization: Irrigation and fertilization are critical for maize growth and yield. Adequate irrigation ensures that the crop receives sufficient water, reduces drought-induced water stress, and increases nitrogen bioproductivity, increasing yields by 8.1–12.6%. Appropriate fertilization ensures adequate nutrient availability to the crop and improves soil water use while increasing water use efficiency, increasing yields by 4.1–19.3%. However, over-irrigation leads to excess soil water, disrupting nutrient and water uptake and reducing irrigation water use efficiency by 6.4–20.7%. Similarly, over-application of nitrogen fertilizer causes seedling burning, which leads to yield reduction and decreases nitrogen productivity by 8.1–12.7%.
(3)
Optimal Water and Nitrogen Application Scheme: Based on the calibrated AquaCrop model, 16 water and nitrogen application schemes for summer maize were simulated. The results of the simulations were analyzed, and an optimal water and nitrogen application scheme for furrow-irrigated summer maize was determined based on screening criteria and actual production conditions. That is, 360 mm of irrigation water and 240 kg/mm2 of nitrogen fertilizer application.
(4)
Model Limitations: While the AquaCrop model effectively simulates the growth and development of maize under furrow irrigation, it exhibits low accuracy in simulating soil water content. Therefore, future research will focus on strengthening field experiments and optimizing the model to more accurately and effectively simulate soil water content and water transport.

Author Contributions

Writing—original draft preparation, Y.Z.; conceptualization, writing—review and editing, S.W.; review and editing., A.W.: data curation. All authors have read and agreed to the published version of the manuscript.

Funding

This work was financially supported by the General Project of the National Natural Science Foundation of China, No. 52079051, the Key Scientific Research Project of Henan Province Colleges and Universities, Nos. 22A570004 and 23A570006, the Program for Innovative Research Team (in Science and Technology) in the University of Henan Province (24IRTSTHN012).

Data Availability Statement

The data presented in this study are available upon request from the corresponding author. Due to confidentiality of experimental data, the data are not publicly available.

Conflicts of Interest

The authors declare that they have no known competing financial interests or personal relationships that could have appeared to influence the work reported in this paper.

References

  1. Qin, W.L.; Zhang, J.; Xiao, G.M.; Cui, S.Q.; Ye, J.X.; Zhi, J.F.; Zhang, L.F.; Xie, N.; Feng, W.; Liu, Z.Y.; et al. Effects of partial replacement of chemical fertilizer nitrogen by green manure on soil physical properties. J. Grassl. 2025, 34, 27–45. [Google Scholar]
  2. Kang, A.-L.; Meng, F.-Q.; Li, H.; Wang, L.G.; Wu, S.X.; Zhang, X.; Wu, W.L.; Li, H.B.; Hu, Z.J. Effects of drip irrigation fertilization on yield and water and nitrogen use efficiency of winter wheat-summer maize crops in North China. Soil Bull. 2020, 51, 958–968. [Google Scholar]
  3. Qiang, M. Optimization of water and nitrogen application system for winter wheat under wide-row furrow irrigation. Agric. Technol. 2024, 44, 58–60. [Google Scholar]
  4. Wang, S.S.; Meng, P.T.; Liu, D.X.; Shi, S.; Wang, X. Experimental study on the effects of water wetting front transport and irrigation quality in broad-row furrow irrigation. Water Sav. Irrig. 2015, 10, 1–4+8. [Google Scholar]
  5. Wang, S.S.; Yao, Y.Q.; Huang, Y.D.; Yang, C.Y.; Yang, J.Y.; Zhang, H. Evaluation of irrigation and fertilization quality of winter wheat under broad-row furrow irrigation. China Agric. Sci. Technol. Guide 2023, 25, 145–157. [Google Scholar]
  6. Shi, X.R.; Xu, Q.; Hu, K.L.; Li, S.E. Influence of irrigation frequency on nitrogen loss and water and nitrogen utilization efficiency of oasis spring maize field. J. Agric. Eng. 2018, 34, 118–126. [Google Scholar]
  7. An, L.; Song, B.; Zou, J.; Cheng, Y.; Luo, D.Y.; Cui, R.; Wang, Y.L.; Sa, W.; Luo, Z. Exploration of the current situation of maize production and technical ways of yield improvement in Guizhou Province. China Agric. Sci. Technol. 2025. [Google Scholar] [CrossRef]
  8. Zhao, R.F.; Chen, X.P.; Zhang, F.L. Nitrogen cycling and balance in winter wheat-summer maize rotation in North China. Soil Sci. 2009, 46, 684–697. [Google Scholar]
  9. Ech-chatir, L.; Er-Raki, S.; Rodriguez, J.C.; Meddich, A.; Chehbouni, A. Optimizing sowing date, fertilization, and irrigation strategies for winter wheat in Tensift Al Haouz (Morocco) using the DSSAT-CERES-wheat model. Agric. Water Manag. 2025, 312, 109443. [Google Scholar] [CrossRef]
  10. Casella, P.; De Rosa, L.; Salluzzo, A.; De Gisi, S. Combining GIS and FAO′s crop water productivity model for the estimation of water footprinting in a temporary river catchment. Sustain. Prod. Consum. 2019, 17, 254–268. [Google Scholar] [CrossRef]
  11. Van Diepen, C.V.; Wolf, J.V.; Van Keulen, H.; Rappoldt, C. WOFOST: A simulation model of crop production. Soil Use Manag. 1989, 5, 16–24. [Google Scholar] [CrossRef]
  12. Suárez-Rey, E.M.; Romero-Gámez, M.; Giménez, C.; Thompson, R.B.; Gallardo, M. Predicting yield, growth and water-nitrogen dynamics and determining nitrogen fertilizer requirements of fertilized leafy vegetables in a Mediterranean climate using EU-Rot_N and CropSyst models. Agric. Syst. 2016, 149, 150–164. [Google Scholar] [CrossRef]
  13. ten Den, T.; Ravensbergen, A.P.; van de Wiel, I.; de Wit, A.; van Evert, F.K.; van Ittersum, M.K.; Reidsma, P. Simulating water-limited potato yield across the Netherlands with (SWAP-) WOFOST: Experiments, model improvement and evaluation. Agric. Water Manag. 2024, 302, 109011. [Google Scholar] [CrossRef]
  14. Abi Saab, M.T.; Todorovic, M.; Albrizio, R. Comparison of AquaCrop and CropSyst models for simulating barley growth and yield under different water and nitrogen regimes. Does calibration year affect the performance of crop growth models? Agric. Water Manag. 2015, 147, 21–33. [Google Scholar] [CrossRef]
  15. Araya, A.; Habtu, S.; Hadgu, K.M.; Kebede, A.; Dejene, T. AquaCrop modeling of proposed water deficit irrigated barley biomass and yield tests. Agric. Water Manag. 2010, 97, 1838–1846. [Google Scholar] [CrossRef]
  16. Zhu, X.F.; Li, Y.Z.; Pan, Y.Z. Progress in research and application of AquaCrop crop modeling. Chin. Agron. Bull. 2014, 30, 270–278. [Google Scholar]
  17. Yang, G.; Lei, J.; Kong, C.X.; He, X.L.; Li, P.F. Effects of mineralization of drip irrigation water source under membrane on cotton growth and AquaCrop simulation. J. Agric. Eng. 2022, 38, 83–92. [Google Scholar]
  18. Jia, H.S.; Shi, Y.L.; Zi, X.M.; Liao, M.S.; Yang, K. Optimal planting density of maize in western Yunnan based on the AquaCrop model. J. Yunnan Agric. Univ. (Nat. Sci.) 2024, 39, 171–180. [Google Scholar]
  19. Nie, W.B.; Ma, Y.P.; Feng, Z.J.; Li, G. Optimization of furrow irrigation scheme for summer maize based on combination of AquaCrop and WinSRFR. J. Agric. Eng. 2024, 40, 51–61. [Google Scholar]
  20. Umesh, B.; Reddy, K.S.; Polisgowdar, B.S.; Maruthi, V.; Satishkumar, U.; Ayyanagoudar, M.S.; Veeresh, H. Assessment of climate change impact on maize (Zea mays L.) through aquacrop model in semi-arid alfisol of southern Telangana. Agric. Water Manag. 2022, 274, 107950. [Google Scholar] [CrossRef]
  21. Dai, J.L.; Li, R.P.; Li, C.C.; Lu, Y.Z.; Zou, C.J. Simulation of the effects of different water and fertilizer treatments on maize growth by AquaCrop model in Hetao Irrigation Area. J. Soil Water Conserv. 2021, 35, 312–319. [Google Scholar]
  22. Oulaid, B.; Milne, A.E.; Waine, T.; El Alami, R.; Rafiqi, M.; Corstanje, R. Stepwise model parametrisation using satellite imagery and hemispherical photography. Tuning AquaCrop sensitive parameters for improved winter wheat yield predictions in semi-arid regions. Field Crops Res. 2024, 309, 109327. [Google Scholar] [CrossRef]
  23. Steduto, P.; Hsiao, T.C.; Raes, D.; Fereres, E. AquaCrop-The FAO Crop Model to Simulate Yield Response to Water. I. Concepts and Underlying Principles. Agron. J. 2009, 101, 426–437. [Google Scholar] [CrossRef]
  24. da Costa, S.A.T.; de Souza, L.S.B.; de Assunção Montenegro, A.A.; de Souza, C.A.A.; de Morais, J.E.F.; de Carvalho Lopes, D.; da Silva, T.G.F. Calibration and validation of the AquaCrop model for forage cactus production systems under different management interventions in the semi-arid region of Brazil. Phys. Chem. Earth Parts A/B/C 2024, 136, 103716. [Google Scholar] [CrossRef]
  25. Zhang, C.; Kong, J.; Tang, M.; Lin, W.; Ding, D.; Feng, H. Improvement of maize growth and development simulation by temperature compensation effect under plastic film cover in AquaCrop model. J. Crops 2023, 11, 1559–1568. [Google Scholar] [CrossRef]
  26. Feng, D.; Li, G.; Wang, D.; Wulazibieke, M.; Cai, M.; Kang, J.; Xu, H. Evaluation of the performance of AquaCrop model under drip irrigation with plastic film cover for maize in Northeast China. Agric. Water Manag. 2022, 261, 107372. [Google Scholar] [CrossRef]
  27. Xing, H.M.; Xiang, S.Y.; Xu, X.G.; Chen, Y.J.; Feng, H.K.; Yang, G.J.; Chen, Z.X. Global sensitivity analysis of AquaCrop crop model parameters based on EFAST method. Chin. Agric. Sci. 2017, 50, 64–76. [Google Scholar]
  28. Vanuytrecht, E.; Raes, D.; Willems, P. Global sensitivity analysis of yield outputs of water productivity models. Environ. Model. Softw. 2014, 51, 323–332. [Google Scholar] [CrossRef]
  29. Li, Y.; Li, N.; Javed, T.; Pulatov, A.S.; Yang, Q. Cotton yield response to climate change and sowing period adaptation simulated by AquaCrop model. Ind. Crops Prod. 2024, 212, 118319. [Google Scholar] [CrossRef]
  30. Tang, B.W.; Meng, F.X.; Meng, B.; Wang, J.; Fan, Y.M. Simulation of maize yield and water use efficiency based on AquaCrop model. South North Water Divers. Water Conserv. Sci. Technol. (Chin. Engl.) 2024, 22, 1224–1238. [Google Scholar]
  31. Xuan, Z.; Zhang, X.; Dang, H. Study on the preferred irrigation system for winter wheat in Hebei Plain based on AquaCrop model. J. Irrig. Drain. [CrossRef]
  32. Li, W.F. Research on Agricultural Water Demand Consistency Analysis and Forecasting in Jianghan Plain. Master’s Thesis, Wuhan University, Wuhan, China, 2019. [Google Scholar]
  33. Zhou, Q.L.; Liu, Z.M.; Yu, H.; Ma, Q.; Liang, W.; Jiang, Y.; Zhang, J.Q.; Ma, Y.P. Water balance characteristics of Changwu County, Liaoning Province based on remotely sensed evapotranspiration data. J. Appl. Ecol. 2025. [Google Scholar] [CrossRef]
  34. Zhang, J.P.; Wang, W.; Cui, Y.F. Analysis of spatial and temporal variability of typical meteorological elements in the Yellow River Basin [J/OL]. China Rural. Water Conserv. Hydropower 2025, 1–17. Available online: http://kns.cnki.net/kcms/detail/42.1419.tv.20250306.1753.044.html (accessed on 6 May 2025).
  35. Chaofei, C. Research on Winter Wheat-Summer Corn Irrigation Nitrogen Application System in Guanzhong Region Based on AquaCrop Model. Master’s Thesis, College of Water Resources and Architectural Engineering, Northwest A&F University, Xianyang, China, 2019. [Google Scholar]
  36. Li, Y.; Niu, J.Y.; Guo, L.Z.; Gao, Z.N.; Sun, X.H. Application and validation of AquaCrop model in simulation of biomass and yield of Northwest huisache. Chin. J. Ecol. Agric. 2014, 22, 93–103. [Google Scholar] [CrossRef]
  37. Wu, Y.J. Research on Crop Irrigation Water Demand Based on AquaCrop Model. Master’s Thesis, Guilin University of Technology, Guilin, China, 2024. [Google Scholar]
  38. Zhang, M.; Tian, J.C. Simulation and applicability of AquaCrop model for silage corn growth in saline and alkaline land under different irrigation quotas. Water Sav. Irrig. 2024, 11, 10–17. [Google Scholar]
  39. Xue, H.L. Research and Numerical Simulation of Soil Water Transport in Wide-Row Furrow Irrigation. Master’s Thesis, North China University of Water Resources and Electric Power, Zhengzhou, China, 2018. [Google Scholar]
  40. Chang, M.; Zhou, Q.Y.; Yin, L.P. Effects of different irrigation methods and irrigation quotas on the growth of summer maize and adaptation of AquaCrop model. J. Irrig. Drain. 2023, 42, 32–39. [Google Scholar]
  41. Abedinpour, M.; Sarangi, A.; Rajput, T.B.S.; Singh, M.; Pathak, H.; Ahmad, T. Performance evaluation of AquaCrop model for maize crop in a semi-arid environment. Agric. Water Manag. 2012, 110, 55–66. [Google Scholar] [CrossRef]
  42. Zhang, P.; Liu, J.; Wang, M.; Zhang, H.; Yang, N.; Ma, J.; Cai, H. Effects of irrigation and fertilization with biochar on the growth, yield, and water/nitrogen use of maize on the Guanzhong Plain, China. Agric. Water Manag. 2024, 295, 108786. [Google Scholar] [CrossRef]
  43. Gao, J.; Zhang, Y.; Xu, C.; Wang, P.; Huang, S.; Lv, Y. Enhancing spatial and temporal coordination of soil water and root growth to improve maize (Zea mays L.) yield. Agric. Water Manag. 2024, 294, 108728. [Google Scholar] [CrossRef]
  44. Kisekka, I.; Schlegel, A.; Ma, L.; Gowda, P.H.; Prasad, P.V.V. Optimizing preplant irrigation for maize under limited water in the High Plains. Agric. Water Manag. 2017, 187, 154–163. [Google Scholar] [CrossRef]
  45. Yang, T.; Zhao, J.; Hong, M.; Ma, M. Appropriate water and nitrogen supply regulates the dynamics of nitrogen translocation and thereby enhancing the accumulation of nitrogen in maize grains. Agric. Water Manag. 2024, 306, 109160. [Google Scholar] [CrossRef]
  46. Yang, T.; Zhao, J.; Hong, M.; Ma, M.; Ma, S.; Yuan, Y. Optimizing water and nitrogen supply can regulate the dynamics of dry matter accumulation in maize, thereby promoting dry matter accumulation and increasing yield. Field Crops Res. 2025, 326, 109837. [Google Scholar] [CrossRef]
  47. Zhang, L.; Meng, F.; Zhang, X.; Gao, Q.; Yan, L. Optimum management strategy for improving maize water productivity and partial factor productivity for nitrogen in China: A meta-analysis. Agric. Water Manag. 2024, 303, 109043. [Google Scholar] [CrossRef]
  48. Ning, D.; Chen, H.; Qin, A.; Gao, Y.; Zhang, J.; Duan, A.; Liu, Z. Optimizing irrigation and N fertigation regimes achieved high yield and water productivity and low N leaching in a maize field in the North China Plain. Agric. Water Manag. 2024, 301, 108945. [Google Scholar] [CrossRef]
  49. Lu, J.; Hu, T.; Zhang, B.; Wang, L.; Yang, S.; Fan, J.; Zhang, F. Nitrogen fertilizer management effects on soil nitrate leaching, grain yield and economic benefit of summer maize in Northwest China. Agric. Water Manag. 2021, 247, 106739. [Google Scholar] [CrossRef]
Figure 1. Location of the test area.
Agronomy 15 01229 g001
Figure 2. Meteorological data for the growing season of summer maize in 2023.
Agronomy 15 01229 g002
Figure 3. Meteorological data for the growing season of summer maize in 2024.
Agronomy 15 01229 g003
Figure 4. Canopy cover validation results for 2024. (Note: CCpr refers to measured values of canopy cover and CCob refers to observed values of canopy cover).
Agronomy 15 01229 g004
Figure 5. Biomass validation results for 2024. (Note: Biopr refers to the predicted value of biomass and Bioob refers to the observed value of biomass).
Agronomy 15 01229 g005
Figure 6. 2024 soil water content validation results. (Note: SWCpr refers to the predicted value of soil water content and SWCob refers to the observed value of soil water content).
Agronomy 15 01229 g006aAgronomy 15 01229 g006b
Figure 7. Final biomass and yield validation results for 2024.
Agronomy 15 01229 g007
Figure 8. Normalized summer maize yield, nitrogen bias productivity, and water use efficiency for different water and nitrogen scenarios.
Agronomy 15 01229 g008
Table 1. Physical and chemical properties of soil at 0–100 mm depth in the test area.
Soil Depth
(mm)
Soil Particle Size Mass Fraction
(%)
Physical Parameter
(%)
Chemical Parameter
(mg/kg)
SandSiltClayWilting FactorField Water Holding CapacitySaturated Water ContentOrganic MatterTotal NitrogenEffective PotassiumEffective Phosphorus
0–200.170.640.1920.433.336.518,951.0576.0115.612.1
20–400.110.650.2420.935.539
40–600.090.650.2619.735.440
60–800.080.650.2721.135.639
80–1000.050.610.3421.435.738
Table 2. Field trial water and nitrogen application program.
YearProcessTiming of Fertilizer Application and Amount of Nitrogen Applied (kg/ha)Frequency and Quota of IrrigationIrrigation Quota
(mm)
Base Fertilizer (Before Sowing)Jointing Stage Grouting PeriodNumber of Times of IrrigationFlooding Quota
(mm)
2023W1N1603030440160
W1N260604
W1N31301304
W2N130305200
W2N260605
W2N31301305
W3N130306240
W3N260606
W3N31301306
CK00000
2024W1N16030303120
W1N260603
W1N31301303
W2N130304160
W2N260604
W2N31301304
W3N130305200
W3N260605
W3N31301305
CK00000
Table 3. Fertilizer stress parameters and their calibration values.
Nitrogen ApplicationParameter Calibration ValuesParameter Calibration Results
Relative Biomass
(%)
Maximum Canopy Cover Under Fertilizer Stress
(%)
Degree of Canopy AttenuationReduction in Maximum Canopy Cover
(%)
Reduced Canopy Growth Coefficient
(%)
Average Crown Reduction
(%)
Reduced Standardized Water Productivity
(%)
N1
(120 kg/ha)
8183.9small1130.334
N2
(220 kg/ha)
9394.5small410.1828
N3
(320 kg/ha)
8687.2small820.2134
Table 4. Selected parameters of the AquaCrop model.
ParametersNotationCalibration Value
Initial canopy cover (%)CC00.40
Maximum canopy cover (%)CCX95
Maximum Effective Root Depth (m)ZX2.3
Canopy growth coefficient (%·d−1)CGC20.7
Canopy Decay Coefficient (%·°C−1·d−1)CDC0.0088
Crop transpiration coefficient(%)Kcb1.10
Effective temperature required from sowing to emergence
(°C)/GDD
Teme98
Effective temperature build-up from sowing to flowering
(°C)/GDD
Tfl1015
Effective cumulative temperature required from sowing to the onset of senescence
(°C)/GDD
Tsen1373
Effective temperature required from sowing to maturity
(°C)/GDD
Tmat1650
Effective temperature accumulation during flowering
(°C)/GDD
TL-flo227
base temperature (°C)Tbase10
upper temperature (°C)Tupper40
Crop water productivity (g·m−2)WP33.7
Reference harvest index (%)HI50
Soil Moisture Depletion Thresholds for Canopy Expansion—Upper Thresholds
(%ofTAW)
Pexpupper0.72
Soil Moisture Depletion Thresholds for Canopy Expansion—Lower Thresholds
(%ofTAW)
Pexplower0.14
Table 5. Water–nitrogen modeling scenarios.
Water and Fertilizer ProgramTiming of Fertilizer Application and Amount of Nitrogen Applied
(kg/ha)
Irrigation Schedules and Irrigation Quotas
(mm)
Irrigation Quota
(mm)
Base Fertilizer (Before Sowing)Jointing StageGrouting PeriodJointing StageStaminateGrouting Period
P1606060100100100300
P2607070100100100300
P3608080100100100300
P4609090100100100300
P5606060120120120360
P6607070120120120360
P7608080120120120360
P8609090120120120360
P9606060140140140420
P10607070140140140420
P11608080140140140420
P12609090140140140420
P13606060160160160480
P14607070160160160480
P15608080160160160480
P16609090160160160480
Table 6. Relative errors of final biomass and yield of summer maize in different treatments in 2024.
ProcessFinal Biomass (kg/ha)Yield (kg/ha)
Observed ValuePredicted ValueRelative Error
(%)
Observed ValuePredicted ValueRelative Error
(%)
W1N113,47714,6268.53734876063.51
W1N215,98916,0250.23846583331.56
W1N312,04713,2099.65724468695.18
W2N116,98016,3083.96798784806.17
W2N219,98521,0055.10967910,92712.89
W2N320,41920,5470.6310,16810,6845.07
W3N112,03913,0508.40655467863.54
W3N214,72615,8997.97798682673.52
W3N317,19417,5301.95860391165.96
CK856289414.43436144702.50
average value15,14215,7145.09784081544.99
Table 7. Simulation results of yield, nitrogen bias productivity, and water use efficiency for water–nitrogen scenario.
Program NumberIrrigation Quota
(mm)
Nitrogen Application
(kg/ha)
Y
(kg/ha)
PFPNIWUE
P13001808896 Bb49.42 Ba29.64 Ab
P23002009122 Bab45.61 Ba30.39 Ab
P33002209703 Ba44.10 Bab32.33 Ab
P43002409490 Ba39.54 Bb31.62 Aa
P53601809410 Ab52.28 Aa26.13 Ab
P636020010,481 Aab52.41 Aa29.10 Ab
P736022010,642 Aa48.37 Aab29.55 Ab
P836024011,241 Aa46.84 Ab31.21 Aa
P94201808676 ABb48.20 ABa20.65 Bb
P104202009607 ABab48.04 ABa22.86 Bb
P1142022010,095 ABa45.89 ABab24.03 Bb
P1242024010,268 ABa42.78 ABb24.44 Ba
P134801808409 Bb46.72 Ba17.51 Cb
P144802008981 Bab44.91 Ba18.70 Cb
P154802209611 Ba43.69 Bab20.01 Cb
P1648024010,090 Ba42.04 Bb21.01 Ca
irrigation quota*****
nitrogen application*****
irrigation quota×nitrogen application****
Note: Different lowercase letters indicate significant differences (p < 0.05) in summer maize parameters among different fertilization treatment levels within the same irrigation treatment level; different uppercase letters indicate significant differences (p < 0.05) in summer maize parameters among different irrigation treatment levels within the same fertilization treatment level. The symbols * and ** indicate the level of significance (p < 0.05) and (p < 0.01), respectively.
Table 8. Normalized summer maize yield, N bias productivity, and water use efficiency for different water and nitrogen scenarios.
ProgrammaticNormalizeProgrammaticNormalize
YPFPNIWUEYPFPNIWUE
P10.170.770.62P90.090.670.17
P20.250.470.69P100.420.660.38
P30.460.350.87P110.600.490.49
P40.3800.81P120.660.250.53
P50.350.990.78P1300.560
P60.7310.80P140.200.420.11
P70.790.690.84P150.420.320.24
P810.601P160.590.190.33
Disclaimer/Publisher’s Note: The statements, opinions and data contained in all publications are solely those of the individual author(s) and contributor(s) and not of MDPI and/or the editor(s). MDPI and/or the editor(s) disclaim responsibility for any injury to people or property resulting from any ideas, methods, instructions or products referred to in the content.

