Article

Optimization of Subsurface Drainage Parameters in Saline–Alkali Soils to Improve Salt Leaching Efficiency in Farmland in Southern Xinjiang

1
College of Hydraulic and Civil Engineering, Xinjiang Agricultural University, Urumqi 830052, China
2
Xinjiang Changji Fanghui Hydropower Design Co., Ltd., Changji 831100, China
*
Author to whom correspondence should be addressed.
Agronomy 2025, 15(5), 1222; https://doi.org/10.3390/agronomy15051222
Submission received: 10 April 2025 / Revised: 14 May 2025 / Accepted: 15 May 2025 / Published: 17 May 2025
(This article belongs to the Section Water Use and Irrigation)

Abstract

:
In arid regions, soil salinization and inefficient water use are major challenges to sustainable agricultural development. Optimizing subsurface drainage system layouts is critical for improving saline soil reclamation efficiency. This study conducted field experiments from 2023 to 2024 to evaluate the effects of varying subsurface drainage configurations—specifically, burial depths (1.0–1.5 m) and pipe spacings (20–40 m)—on drainage and salt removal efficiency in silty loam soils of southern Xinjiang, aiming to develop an optimized scheme balancing water conservation and desalination. Five treatments (A1–A5) were established to measure evaporation, drainage, and salt discharge during both spring and winter irrigation. These variables were analyzed using a water balance model and multifactorial ANOVA to quantify the interactive effects of drainage depth and spacing. The results indicated that treatment A5 (1.5 m depth, 20 m spacing) outperformed all the others in terms of both the drainage-to-irrigation ratio (Rd/i) and the drainage salt efficiency coefficient (DSEC), with a two-year average Rd/i of 32.35% across two spring and two winter irrigation events, and a mean DSEC of 3.28 kg·m−3. The 1.5 m burial depth significantly improved salt leaching efficiency by increasing the salt control volume and reducing capillary rise. The main effect of burial depth on both Rd/i and DSEC was highly significant (p < 0.01), whereas the effect of spacing was not statistically significant (p > 0.05). Although the limited experimental duration and the use of a single soil type may affect the generalizability of the findings, the recommended configuration (1.5 m burial depth, 20 m spacing) shows strong potential for broader application in silty loam regions of southern Xinjiang and provides technical support for subsurface drainage projects aimed at reclaiming saline soils in arid regions.

1. Introduction

Water is essential for sustaining life, supporting agriculture, and maintaining ecological balance [1]. However, the growing impacts of climate change, population growth, and increasing industrial demands are putting significant pressure on global water resources. Efficient water use is now a critical priority, especially in arid and semi-arid regions, where water scarcity worsens both environmental and agricultural challenges [2]. This issue is particularly severe in southern Xinjiang, where limited water availability, high evaporation rates, and inefficient irrigation practices have resulted in severe soil salinization [3]. Soil salinization not only hinders agricultural productivity and reduces arable land but also threatens food security directly [4]. Therefore, addressing soil salinization in Xinjiang is crucial for sustainable agricultural development [5]. Subsurface drainage technology is widely used to combat soil salinization and has proven highly effective [6]. By using underground drainage pipes, this technique effectively regulates moisture and controls salt buildup, making it a key strategy for mitigating salinization in Xinjiang’s saline–alkali lands [7]. Compared to traditional surface drainage methods, subsurface drainage provides continuous drainage without disturbing the surface soil structure, effectively reducing waterlogging and salinization while improving water use efficiency [8]. Its efficiency and long-term benefits make it a crucial solution for tackling soil salinization and managing water resources [9]. To optimize the performance of subsurface drainage systems, it is essential to investigate the efficiency of salt and water removal under different pipe layout conditions. Such studies can optimize system design, improve water use efficiency, mitigate soil salinization, and promote sustainable agricultural development [10,11].
Numerous studies have investigated the efficiency of subsurface drainage systems to date. Field experiments by Qian [12] in the Yanqi Basin of Xinjiang showed that subsurface drainage efficiency is significantly influenced by pipe spacing and burial depth. Smaller spacing and moderate burial depth were found to significantly improve drainage performance. Yang [13] demonstrated that pipe corrugation significantly affects drainage efficiency. Zhang [14] analyzed the effect of groundwater depth on soil salinity dynamics and found that an optimal groundwater table depth can promote soil desalinization and improve drainage efficiency. A groundwater depth between 1.8 and 2.2 m enhances drainage performance and reduces salt accumulation. Wang [15] emphasized the critical role of a dual-layer geotextile combined with a gravel filter in improving salt removal efficiency and anti-clogging performance. Tian [16] studied the effects of different burial depths and soil types on subsurface pipe drainage efficiency. The results indicated that greater burial depths increase drainage efficiency. An optimal burial depth can enhance water and salt transport, thereby improving drainage system performance. Ma [17] used physical model testing and numerical simulation to explore the drainage efficiency of closely spaced, shallow-buried pipes, finding that this configuration significantly improves drainage performance. Qin [18] showed that a well-designed filter layer structure enhances the efficiency of subsurface drainage systems under drip irrigation conditions.
Although numerous studies have examined factors affecting subsurface drainage efficiency, such as burial depth and pipe spacing, the influence of evaporation has been relatively underexplored. In arid regions, evaporation significantly influences drainage efficiency and should not be overlooked [19]. Higher evaporation rates in spring and summer can reduce water inflow into the drainage system, thereby diminishing drainage and salt leaching performance—an issue often underexplored in current studies. Determining an optimal leaching quota during leaching is crucial for improving drainage efficiency and optimizing water resource utilization. While some studies suggest that evaporation reduces leaching effectiveness, most experiments have not systematically examined seasonal variations in evaporation intensity or provided quantitative analyses of the proportion of evaporation in the water balance [20,21]. In response, this study highlights the importance of incorporating evaporation factors into drainage system design and dynamically adjusting leaching quotas. By evaluating drainage and salt removal efficiencies under various layout schemes, this study proposes optimized configurations to enhance water use efficiency, providing both theoretical insights and practical guidance for irrigation and drainage management in arid agricultural regions.

2. Materials and Methods

2.1. Research Area

The experimental site is located in a representative agricultural area of the Yanqi Basin in southern Xinjiang (42°26′ N, 86°55′ E; Figure 1), at an elevation of 1006.1 m above sea level. The area has a north–south topographic gradient and belongs to a temperate continental arid climate zone, characterized by high solar radiation, low precipitation, and significant microclimatic variability. The dominant soil type is saline silty loam, characterized by high salinity and a distinctive texture profile, typical of agricultural soils in arid southern Xinjiang. The average annual temperature is 8.7 °C, with extremes ranging from 37.2 °C to −30 °C. The frost-free period averages 195 days annually. The area receives an average annual precipitation of 47.9 mm and experiences evaporation of 2279.1 mm annually. The annual sunshine duration averages 3060.3 h, the maximum depth of frozen soil is 1.37 m, and the region experiences intense solar radiation due to a high solar incidence angle [22]. The site has remained fallow for many years. Groundwater level variations were recorded during the experiment (Figure 2). The highest groundwater level occurred during the leaching period, reaching 0.09 m above ground, whereas the lowest was recorded one day prior to winter irrigation leaching, at 2.32 m below ground. The surface soil layer (0–20 cm) had an average salt content exceeding 20 g·kg−1, classifying it as saline soil. The soil types and physical properties of the region are summarized in Table 1. The region’s typical temperate arid climate and irrigation conditions provide favorable conditions for studying the effects of subsurface drainage on salt removal. Given the site’s representative agricultural production model, the experimental results are expected to be highly applicable in practice.

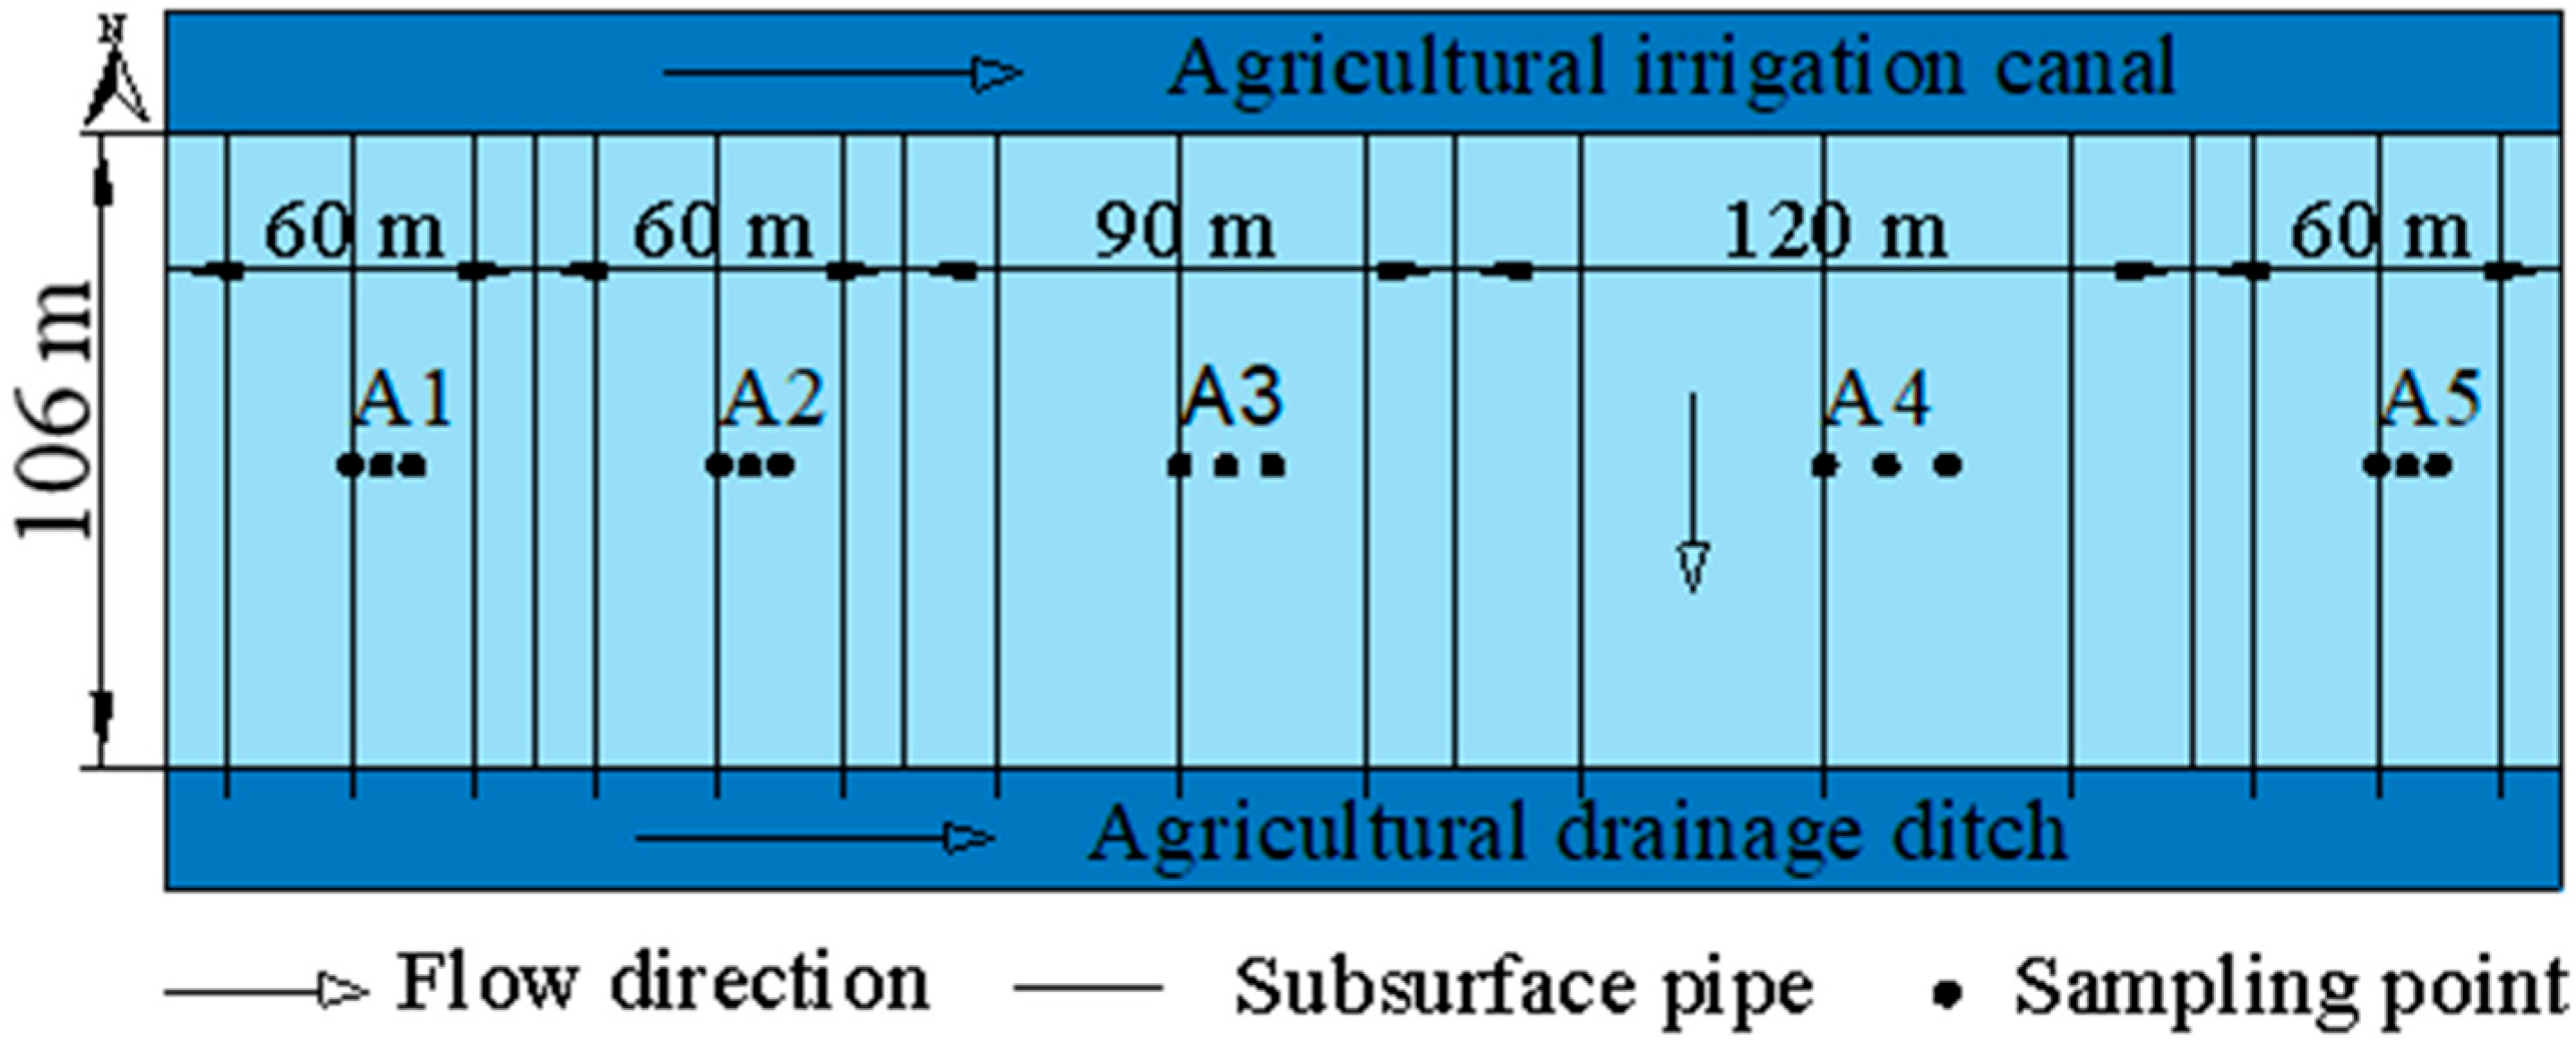
2.2. Experimental Design

The experimental site consisted of five treatment groups, each containing three subsurface drainage pipes. The central pipe in each group was used for data collection, and the two side pipes served as protective buffers. The subsurface drainage pipes were directly connected to agricultural ditches. Each treatment used drainage pipes 110 m long, with a ridge width of 4 m and a plot width of 106 m. The pipe spacing is illustrated in Figure 3. The subsurface drainage pipes were single-wall corrugated PVC pipes (DN/OD-90, Xinjiang Tianye Water-Saving Irrigation Co., Ltd., Shihezi, China), with a diameter of 90 mm, ring stiffness of 2.5 kN·m−2, permeable area of 53 cm2·m−1, and a slope of 0.1% to ensure smooth water flow. The subsurface drainage system was installed in April 2023. Before construction, the site was laser-leveled. Layout lines were marked based on the design plan, trenches were excavated to the specified depth, and nonwoven-fabric-wrapped pipes were laid along the slope. The trenches were backfilled and compacted in layers. The pipes discharged directly into field drainage channels.
Existing studies on subsurface drainage and salt removal [23,24,25] generally recommend an optimal pipe spacing of 20–40 m and a burial depth of 1.0–1.5 m. Within this range, multiple combinations of spacing and depth are theoretically feasible. However, due to budgetary constraints, a uniform spacing design was adopted. This design aimed to provide clearer guidance for decision-making by policymakers and agricultural practitioners. The experimental scheme is presented in detail in Table 2. To ensure consistent leaching quotas across all treatments, earthen ridges were built between plots before each leaching event to prevent water mixing. Leaching was conducted using border irrigation. Four leaching events were conducted on 23 May and 16 September 2023, and 30 April and 27 October 2024. Leaching quotas were calculated based on flow rate and irrigation time, resulting in volumes of 3282.00, 4766.10, 3242.70, and 3750.00 m3·ha−1. Surface water was used as the leaching source, with an electrical conductivity of 0.336 dS·m−1.

2.3. Data Collection and Analysis

2.3.1. Water Sample Processing

Accurate measurement of subsurface drainage flow is a critical indicator for evaluating drainage performance, optimizing system design, and guiding management decisions. Continuous monitoring of drainage flow was performed on the central subsurface pipe in each treatment group throughout the drainage period to analyze drainage capacity in detail. Monitoring began at the start of drainage and continued until completion, with a frequency of 2 to 4 times per day (increased during the early phase). Drainage volume was measured using a graduated cylinder and a stopwatch to record flow rate. Drainage water samples were collected in sampling bottles. The electrical conductivity (EC) of subsurface drainage water was measured with a conductivity meter (DDS-307A, Shanghai INESA Scientific Instrument Co., Ltd., Shanghai, China). A 50 mL water sample was oven-dried at 105 °C to a constant weight to determine salinity (C, g·L−1). Based on 40 sets of simultaneously measured EC and salinity data, a C–EC calibration curve (Equation (1)) was developed, enabling the conversion of EC measurements into corresponding salinity values.
C = 0.6282EC − 0.0311 (R2 − 0.99),
The cumulative drainage volume (Q, m3) was calculated from the time series data of drainage flow using Simpson’s integration method. The cumulative salt discharge (S, kg) was determined by integrating the corresponding temporal variation in salinity over time.
Q = t 1 t 2 q t d t ,
S = t 1 t 2 C ( t ) · q t d t ,

2.3.2. Soil Measurements

Soil bulk density was measured by collecting undisturbed samples at various depths using a cutting ring after excavating soil profiles. The undisturbed samples were analyzed in the laboratory to determine field capacity and saturated moisture content. A laser particle size analyzer (Malvern Mastersizer 2000, Malvern Instruments Ltd., Worcestershire, UK) was used to quantify the proportions of clay, silt, and sand. Meteorological data—including air temperature, humidity, wind speed, solar radiation, and precipitation—were collected during the experimental period using an automatic weather station (RS-QXZM, Shandong Jianda Renke Electronic Technology Co., Ltd., Jinan, China).

2.3.3. Theoretical Analysis

In this study, the analysis period extends from the initiation of leaching to the end of subsurface drainage. Total water input is represented by the leaching quota, while water output includes the cumulative drainage volume from subsurface pipes and evaporation losses [26,27]. Although some water may have been discharged through surface ditches—since the subsurface pipes were aligned with the original open ditch system—the test plots were relatively wide (106 m), and the drainage efficiency of surface ditches was significantly lower than that of the subsurface system. Therefore, lateral water losses via surface ditches were considered negligible. Based on these assumptions, a basic water balance equation was established and expressed as follows:
ΔV = I − E − Q
where I is the total water input during leaching (m3); ΔV is the change in soil water storage (m3); E is the evaporation loss (m3); and Q is the cumulative drainage volume from the subsurface pipes (m3).
Due to the arid climate and low precipitation in southern Xinjiang, evaporation losses are substantial and must be considered in the water balance analysis. This study defines the observation period as the complete process, starting from the initiation of the leaching phase and ending with the termination of the subsurface drainage system, covering the entire operational cycle of all treatment groups. As the drainage duration varies among treatments, evaporation was calculated individually for each treatment. The evaporation volume was computed using the following formula:
E = i = 1 n AK S · ET i 1000 ,
K S = θ θ wp θ fc θ wp ,
E denotes the amount of soil water evaporated from the start of leaching to the end of subsurface drainage, while Ks represents the evaporation coefficient for bare soil. In this study, the soil surface was bare, and the soil remained moist for two days after surface water disappeared following the start of leaching. Based on the evaporation characteristics typical of arid regions, Ks was approximated as 1.0 during this initial period [28,29] (When the soil surface is flooded, evaporation is treated as open water evaporation, with the rate equal to ET0 and Ks set to 1). Once surface water recedes, the soil gradually transitions to a drying phase. During this phase, Ks can be determined using Equation (6). In this equation, θ is the soil moisture content, θwp is the wilting point, and θfc is the field capacity. ETi represents the daily reference evapotranspiration on day i (mm/day). Daily reference evapotranspiration was estimated using the FAO Penman–Monteith equation.
In subsurface drainage engineering, the drainage-to-irrigation ratio (Rd/i)—defined as the ratio of drainage volume to irrigation input—is a key quantitative indicator used to evaluate the efficiency of various subsurface pipe layout configurations. During the leaching process, ongoing evaporation reduces the actual amount of water that infiltrates the soil compared to the volume specified in the irrigation design. To ensure accurate evaluation, evaporation losses must be excluded from the calculation. The equation for calculating the drainage-to-irrigation ratio is given as follows:
R d / i = Q I E × 100 % ,
The ratio of total salt discharged through subsurface drainage to the leaching quota serves as an indicator of salt removal efficiency, known as the drainage salt efficiency coefficient (DSEC). The equation for calculating the DSEC is given as follows:
DSEC = S I ,
In the equation, DSEC represents the salt removed through subsurface drainage per unit volume of leaching water (kg·m−3), and S represents the total cumulative salt discharged through the drainage system (kg).
In this paper, t-tests were conducted using SPSS 26 software to evaluate subsurface drainage, salt discharge, the Rd/i, and the DSEC under varying culvert deployment conditions, to determine whether the observed differences were statistically significant.

3. Results

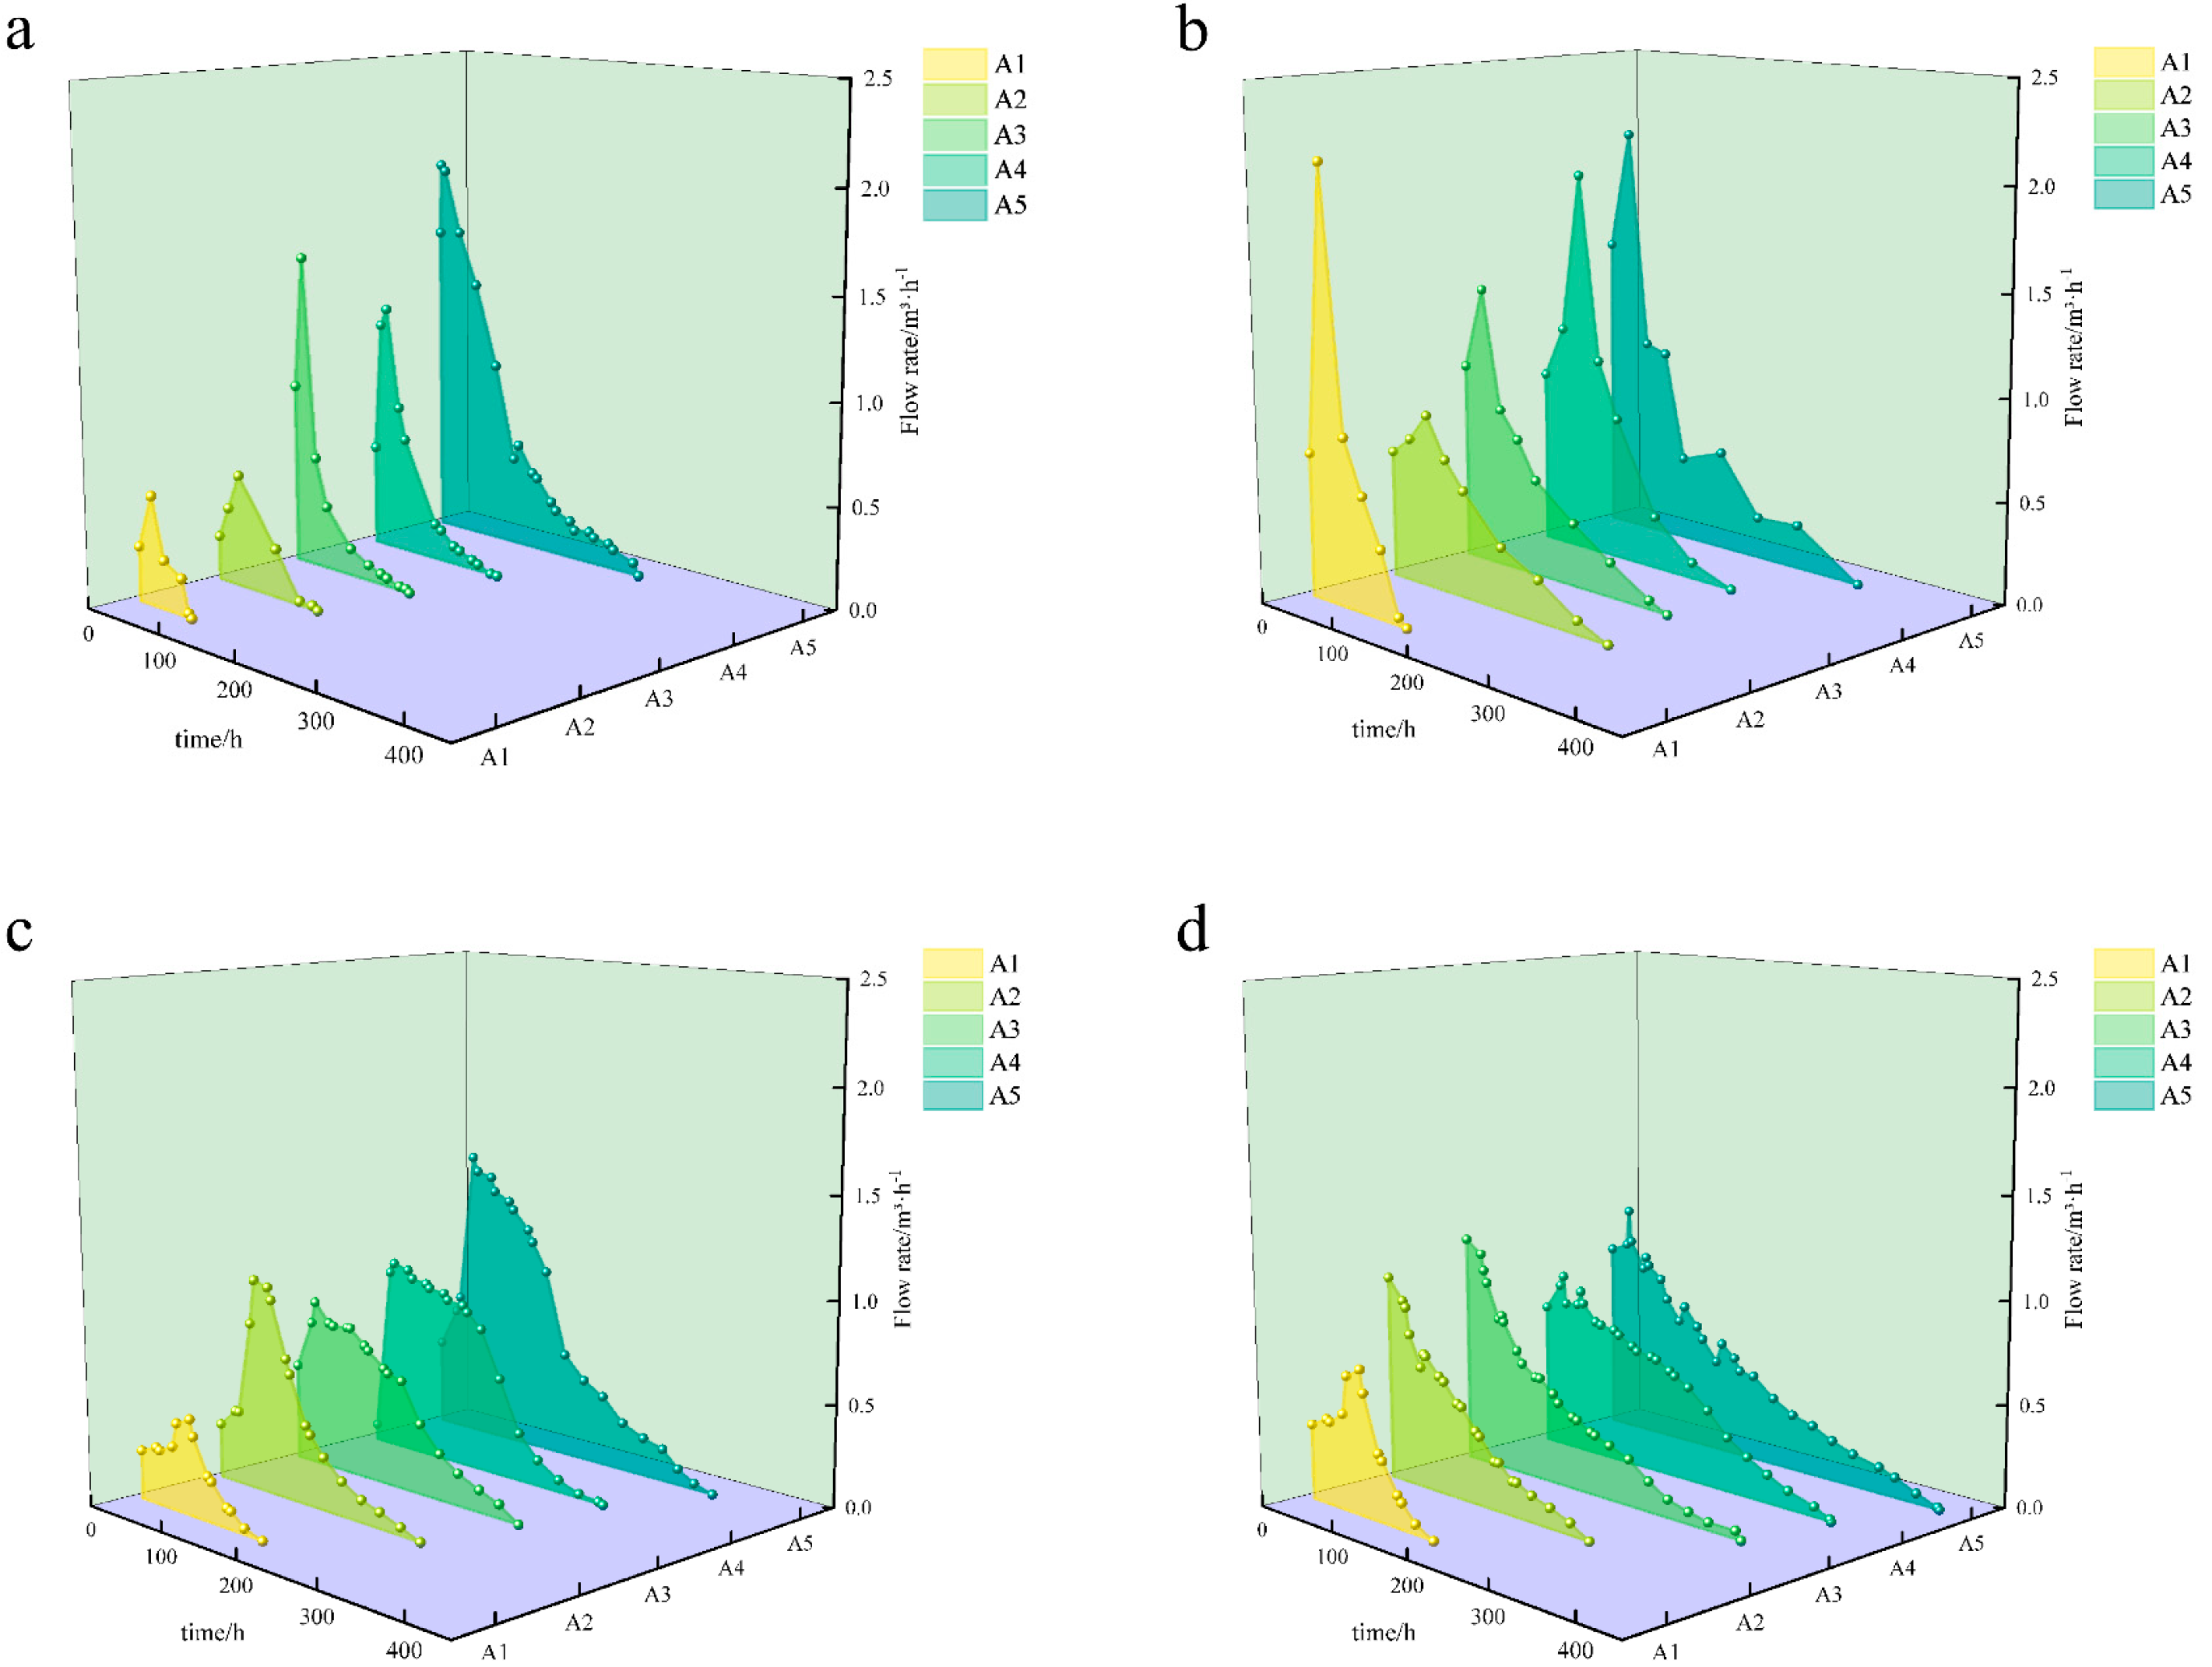
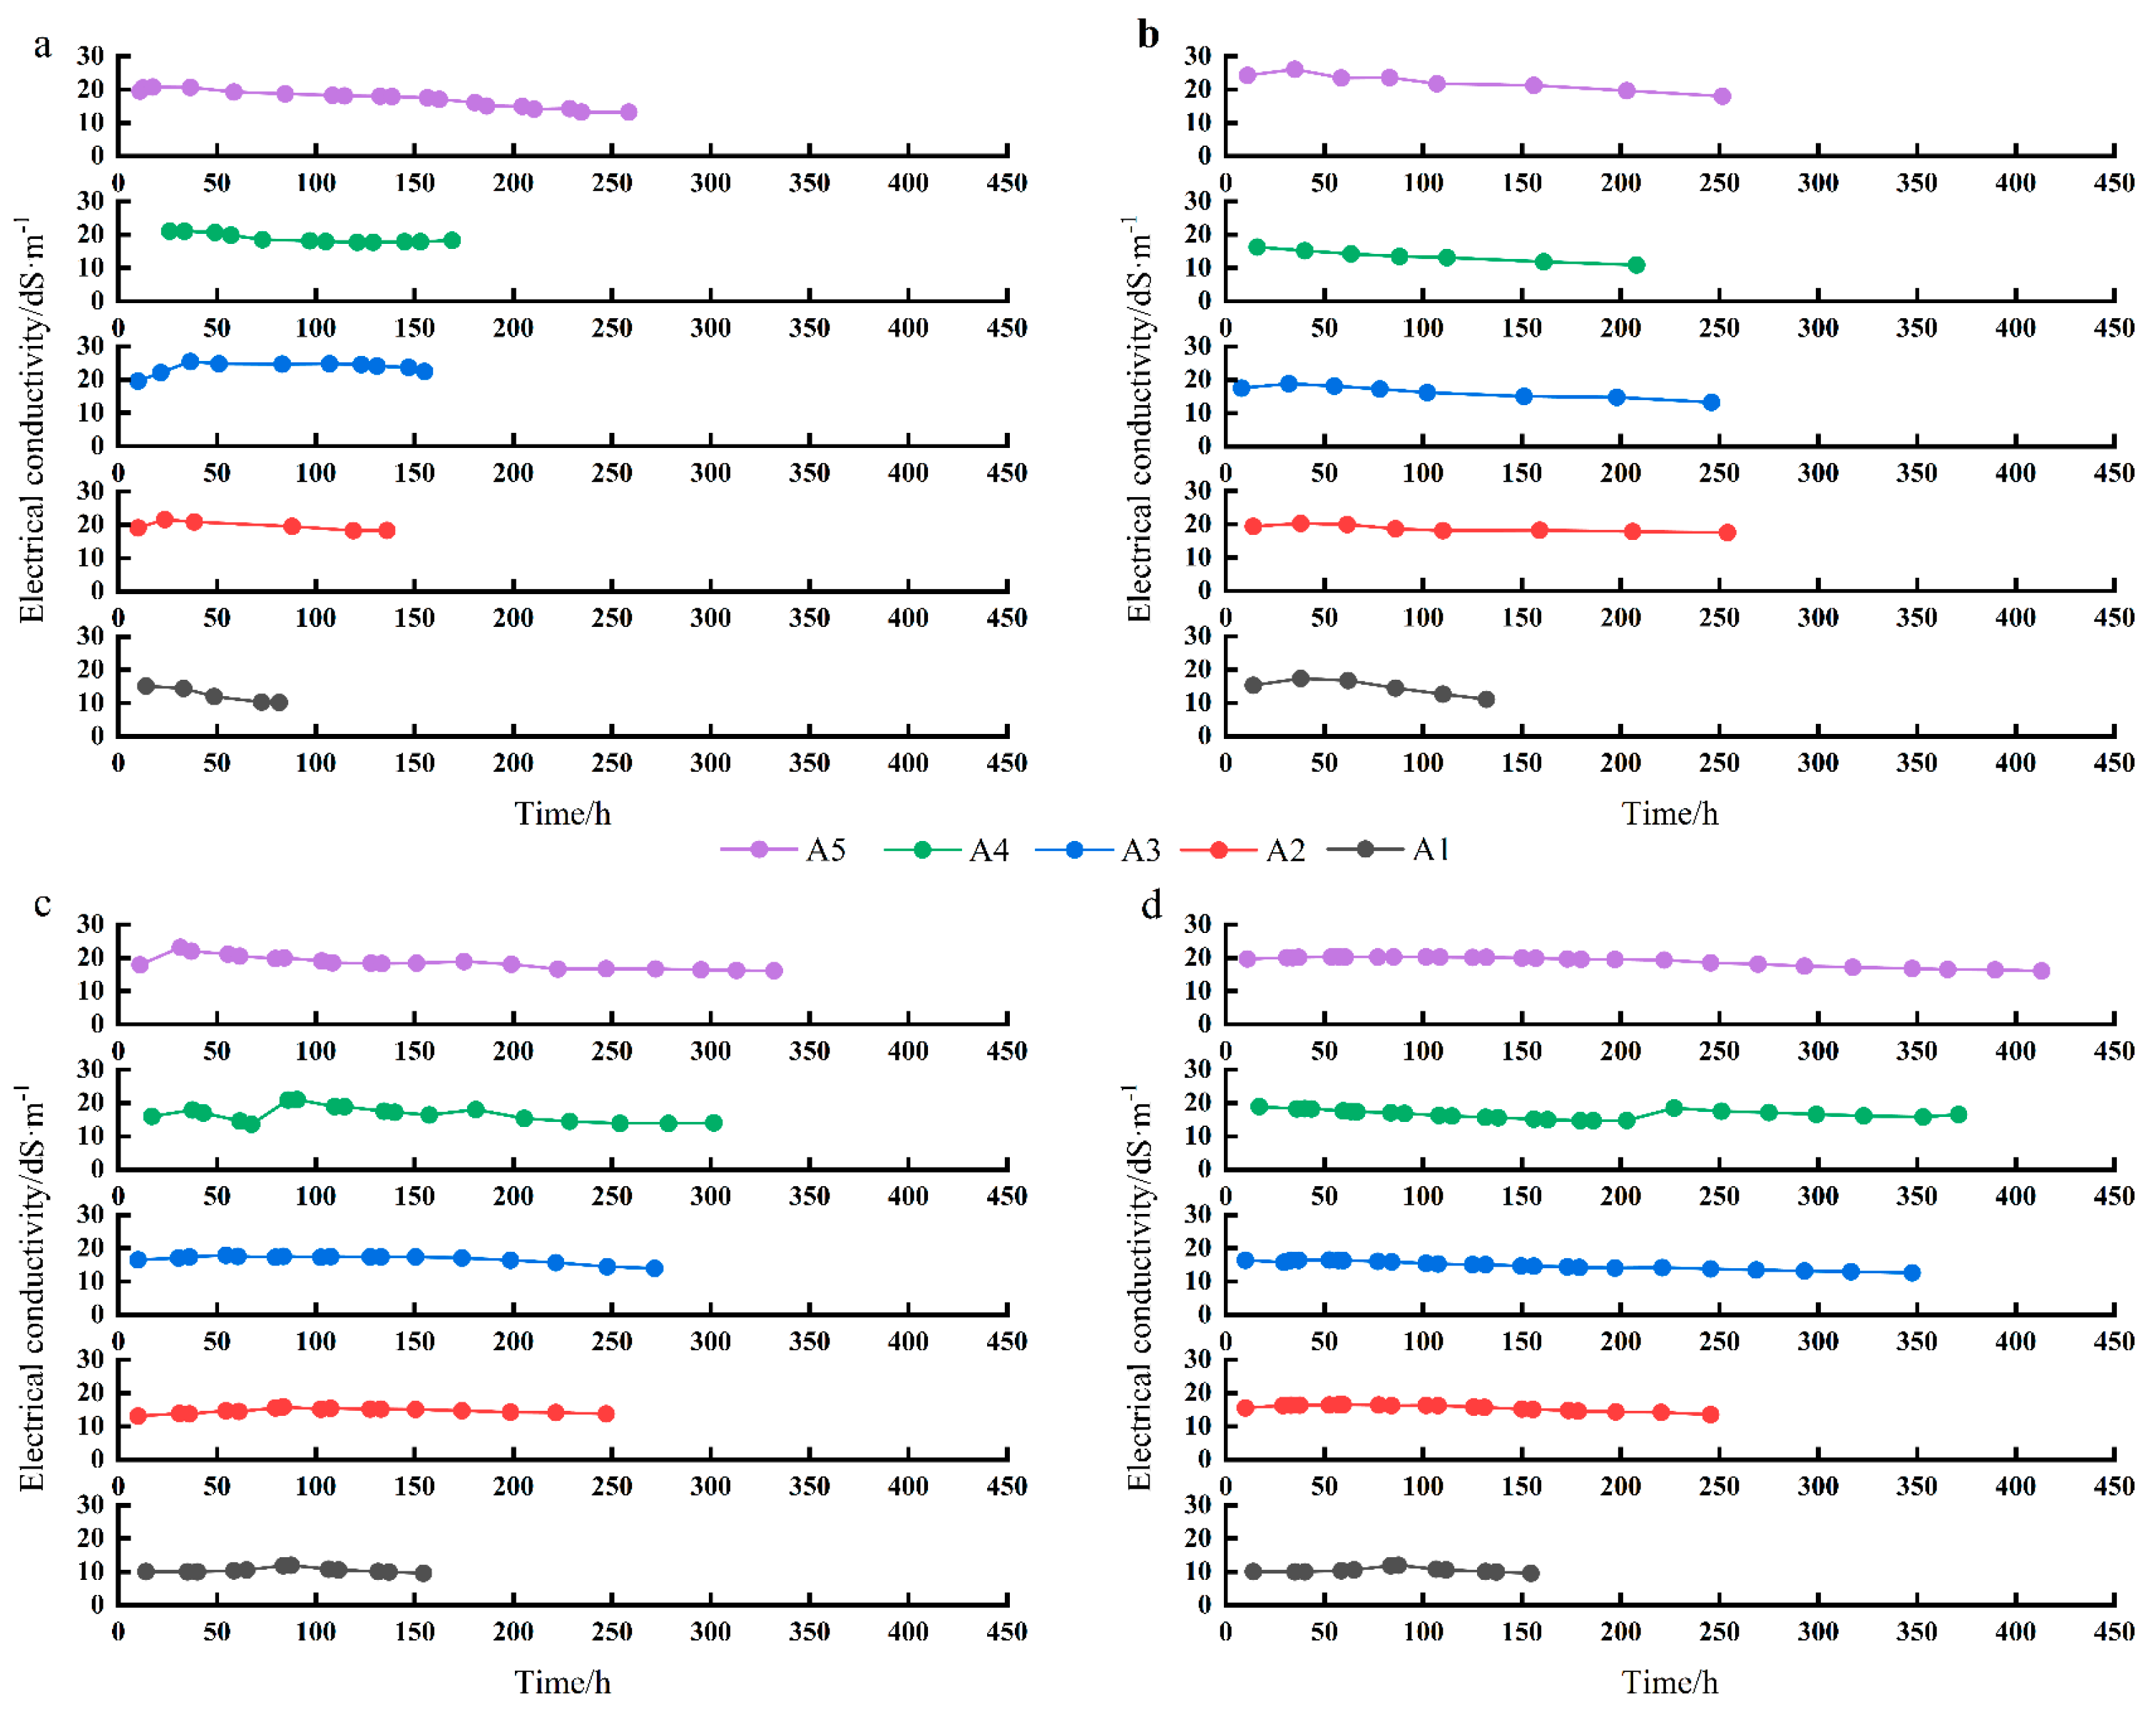
3.1. Variations in Drainage Flow and Electrical Conductivity

Four leaching experiments were conducted in 2023 and 2024, with temporal variations in drainage flow rate and electrical conductivity illustrated in Figure 4 and Figure 5, respectively. Under varying treatment conditions, peak drainage flow rates ranged from 0.34 to 2.12 m3·h−1, with drainage durations lasting from 85.5 to 413 h. However, all the treatments exhibited similar drainage dynamics, characterized by an initial increase followed by a gradual decrease. The increase in drainage flow was rapid, while the subsequent decline occurred more gradually. This pattern may be attributed to preferential flow through macropores, enabling a large volume of leaching water to rapidly recharge the groundwater, causing a swift rise in the water table and peak drainage flow. As drainage continued, the groundwater level gradually declined, leading to a slower decrease in drainage flow until cessation. As shown in Figure 5, the electrical conductivity (EC) of drainage water exhibited a slight initial increase under all the treatments, followed by a gradual decline throughout the drainage process. During spring irrigation in 2023, the average EC of drainage water ranged from 12.40 to 23.62 dS·m−1, while winter irrigation values ranged from 13.60 to 22.29 dS·m−1. In 2024, average EC values ranged from 9.57 to 23.20 dS·m−1 during spring irrigation, and from 9.57 to 20.34 dS·m−1 during winter irrigation.

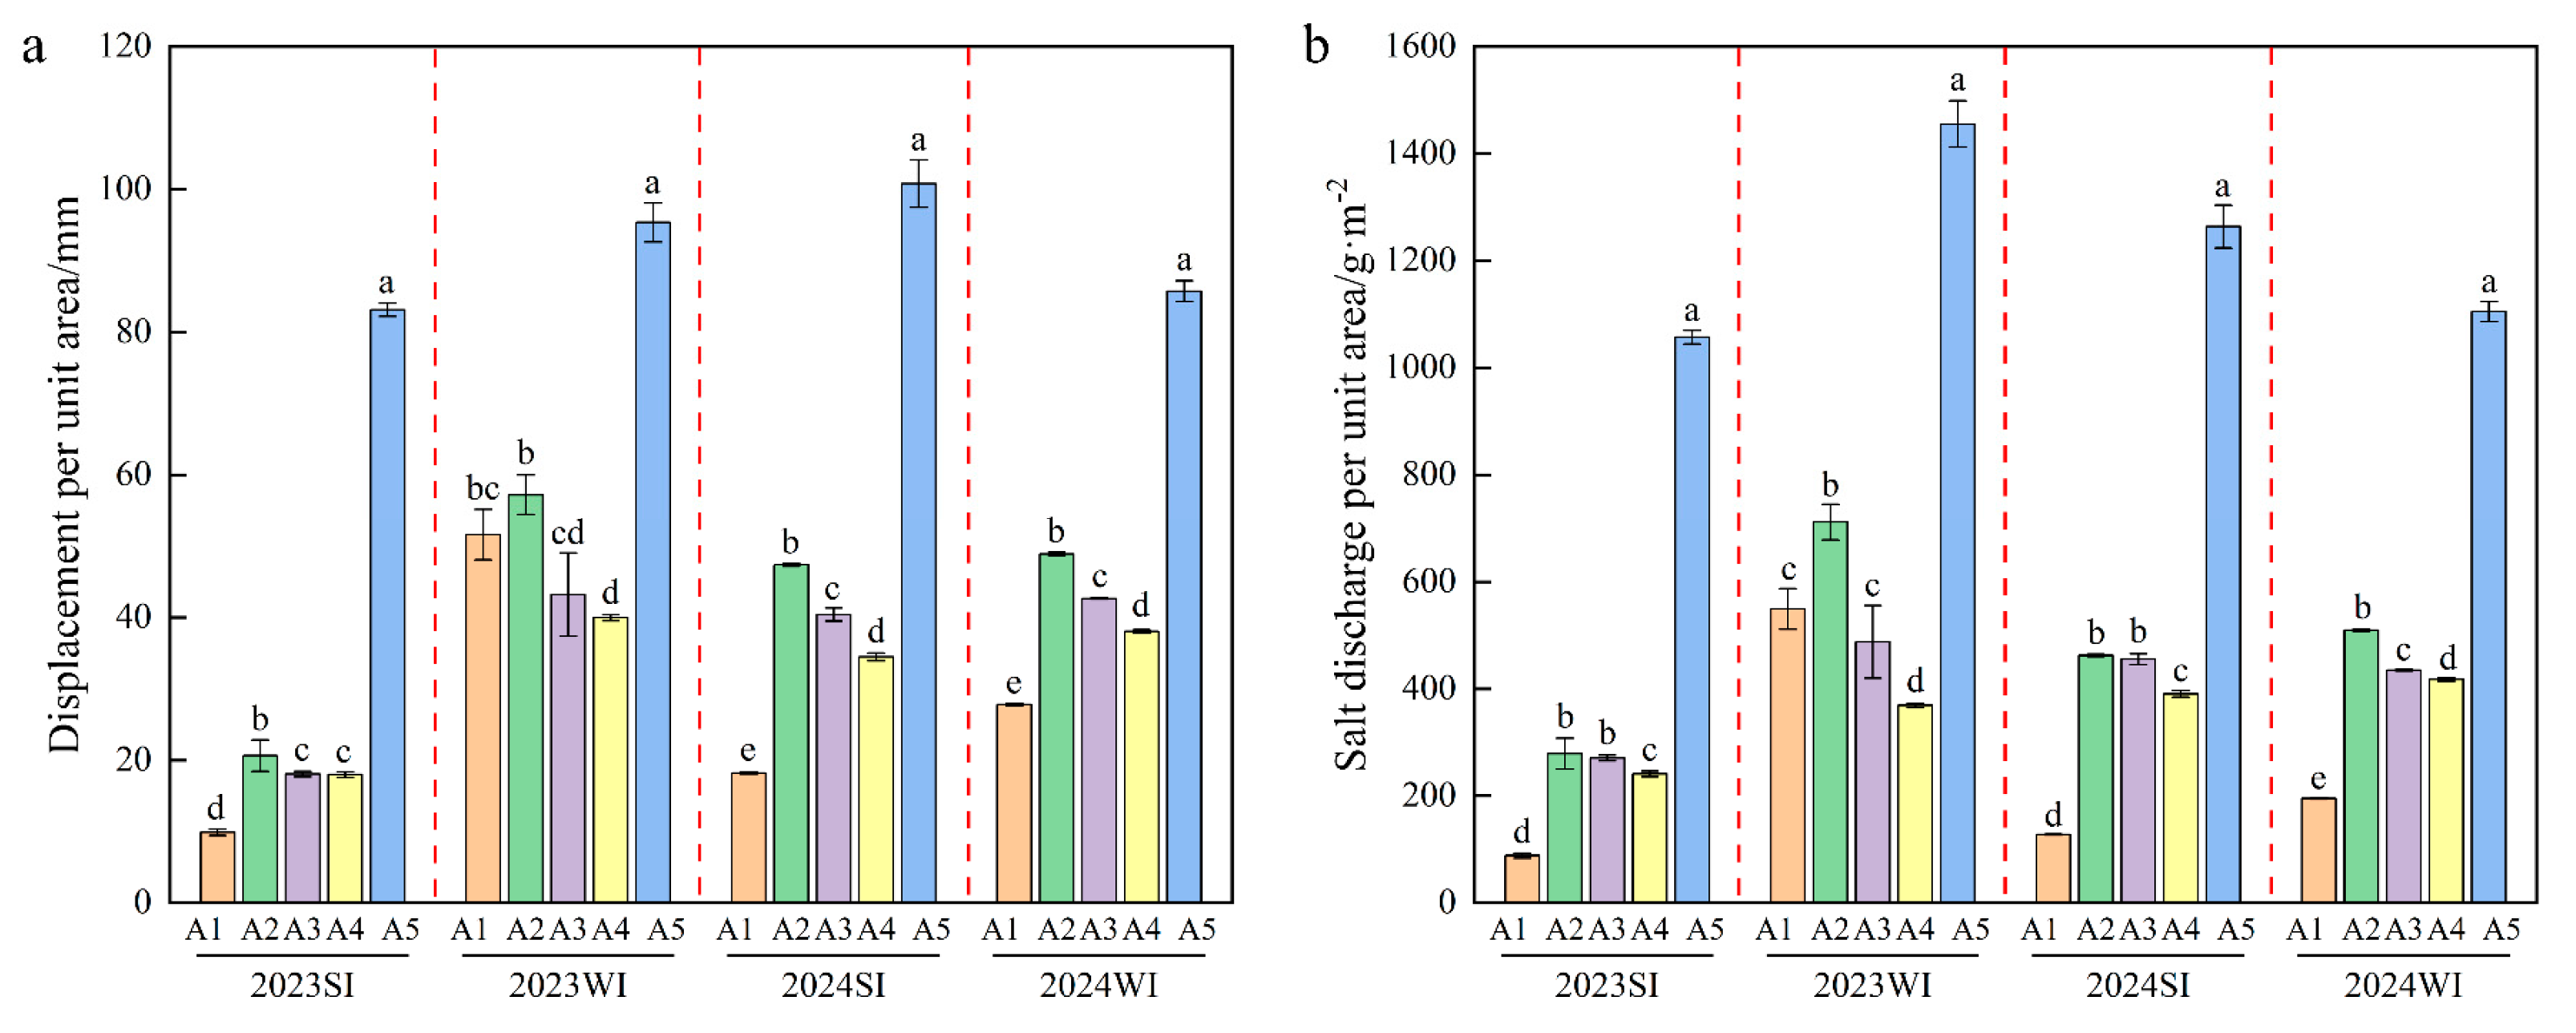
3.2. Variations in Drainage Volume and Salt Discharge

As shown in Figure 6a, during the spring irrigation leaching in 2023, treatment A5 had 740.44% and 302.71% higher unit-area drainage volumes than A1 and A2, respectively, under the same lateral spacing but different burial depths. Under the same burial depth but varying lateral spacings, treatment A2 showed 14.35% and 14.86% greater unit-area drainage than A3 and A4, respectively. In the winter irrigation leaching of 2023, treatment A5 had 84.75% and 66.72% higher unit-area drainage volumes than A1 and A2, respectively. With the same burial depth and different lateral spacings, treatment A2 yielded 32.32% and 43.08% more unit-area drainage than A3 and A4, respectively. In spring 2024, treatment A5 showed 453.74% and 112.66% greater unit-area drainage than A1 and A2, respectively. At the same burial depth but with different lateral spacings, treatment A2 exceeded A3 and A4 by 17.24% and 37.40%, respectively. During the winter leaching of 2024, treatment A5 had 208.64% and 75.74% more unit-area drainage than A1 and A2, respectively. At the same burial depth with different spacing, treatment A2 produced 14.63% and 28.52% more drainage than A3 and A4, respectively.
As shown in Figure 6b, during spring 2023 irrigation leaching, treatment A5 showed a 1101.26% and 279.00% higher unit-area salt discharge compared to A1 and A2, respectively, under identical lateral spacing but different burial depths. With the same burial depth but different lateral spacings, treatment A2 had 3.04% and 15.74% higher unit-area salt discharge than A3 and A4, respectively. In winter 2023 leaching, treatment A5 showed 165.04% and 104.50% higher unit-area salt discharge than A1 and A2, respectively. At the same burial depth but with different lateral spacing, treatment A2 exceeded A3 and A4 by 45.91% and 92.83% in unit-area salt discharge. In spring 2024, treatment A5 had 889.27% and 173.26% greater unit-area salt discharge than A1 and A2, respectively. At the same burial depth but with different spacings, treatment A2 produced 1.51% and 18.38% more salt discharge than A3 and A4, respectively. In winter 2024 irrigation leaching, treatment A5 showed 466.79% and 117.00% higher unit-area salt discharge compared to A1 and A2, respectively. At equal burial depth but different lateral spacings, treatment A2 yielded 17.13% and 22.00% more unit-area salt discharge than A3 and A4, respectively.

3.3. Variations in Drainage-to-Irrigation Ratio and Salt Discharge Efficiency Coefficient

Detailed drainage-to-irrigation ratios for treatments A1 to A5 during the four leaching events in 2023 and 2024 are summarized in Table 3. In terms of burial depth, treatment A5 (buried at 1.5 m) showed a relatively high drainage-to-irrigation ratio, reaching 48.42% in spring 2024. This indicates that increasing the burial depth can improve drainage efficiency. In contrast, treatment A1 (buried at 1.0 m) exhibited a lower ratio, possibly because the shallower depth allowed some infiltrated water to remain below the drainage pipes, reducing drainage capacity. Regarding lateral spacing, treatments A3 and A4 exhibited slightly lower drainage-to-irrigation ratios than other configurations. This may be due to wider spacing reducing the drainage pipes’ water collection capacity, resulting in soil water retention and decreased overall drainage performance. Conversely, treatment A2 showed a higher drainage-to-irrigation ratio, suggesting that narrower spacing (20 m) enhances water convergence and improves drainage efficiency.
During the spring and winter irrigation periods in 2023 and 2024, treatment A5 (with a burial depth of 1.5 m and lateral spacing of 20 m) recorded the highest drainage-to-irrigation ratios: 34.16%, 22.48%, 48.42%, and 24.35%, respectively.
As shown in Figure 7, DSEC was negatively correlated with drain spacing and positively correlated with burial depth, with consistent trends observed in both 2023 and 2024 experiments. Treatment A5 had the highest average DSEC of 3.28 kg·m−3, which was 6.07, 2.76, 3.12, and 3.64 times higher than those of treatments A1, A2, A3, and A4, respectively.
The multifactor ANOVA and post hoc comparisons (Table 4 and Table 5) revealed that burial depth had a highly significant effect on both Rd/i and DSEC (F = 17.219, p = 0.001 for Rd/i; F = 72.768, p = 0.001 for DSEC), whereas drain spacing showed no statistically significant effect (p > 0.05). Specifically, the 1.5 m burial depth (A5) significantly enhanced drainage efficiency (mean Rd/i differences: −25.167 and −19.282 vs. A1 and A2, respectively; p < 0.01) and salt leaching capacity (mean DSEC differences: −2.697 and −1.997 kg·m−3; p < 0.01). These results confirm the superior performance of treatment A5 (1.5 m depth, 20 m spacing), with an average Rd/i of 32.35% and DSEC of 3.28 kg·m−3. Therefore, a drainage configuration of 20 m spacing and 1.5 m burial depth is recommended for this region to enhance subsurface drainage and salt removal, making it suitable for broader application.

3.4. Changes in Water Allocation During the Leaching Process

Figure 8 shows the proportional relationships among soil water storage, evaporation, and drainage volume from the beginning of leaching to the end of subsurface drainage. Soil water storage was calculated using Equation (4), and the proportions of each component relative to the leaching quota were used to reduce errors resulting from quota variations. The results indicated that, after subsurface drainage ended, most of the remaining water was retained in the soil. Specifically, during the 2023 spring irrigation, soil water storage averaged 74.55% of the leaching quota, compared to 78.62% in winter. In 2024, the values were 61.62% in spring and 81.78% in winter. Soil water retention was generally higher in winter than in spring, mainly due to lower pre-winter soil moisture and a deeper groundwater table, which allowed greater water storage in the soil profile. Evaporation followed a consistent trend: higher in spring and lower in winter. In 2023, evaporation accounted for 16.33% of the water budget in spring, compared to 9.32% in winter. In 2024, the proportion increased to 23.31% in spring and decreased to 5.36% in winter. Higher temperatures and longer daylight hours during spring irrigation contributed to greater evaporation, whereas lower temperatures and shorter daylight in winter significantly reduced evaporative losses. Notably, evaporation further declined during the 2024 winter irrigation, likely due to colder and more humid climatic conditions that year. Excessive evaporation during leaching may lead to water loss and reduced salt leaching efficiency. Therefore, winter leaching is more effective in minimizing water loss and improving salt removal efficiency.

4. Discussion

4.1. Effects of Subsurface Drainage Layout on Unit-Area Drainage and Salt Removal

Under the A2 (20 m), A3 (30 m), and A4 (40 m) treatments, drainage volume per unit area decreased as the subsurface drainage spacing increased. This trend is primarily due to wider spacing, reducing the number of drainage pipes per unit area, thereby increasing the control area of each pipe. As a result, lateral flow paths become longer, which reduces drainage efficiency in some regions. In addition, increased spacing lowers the hydraulic gradient of lateral seepage, further weakening overall drainage capacity per unit area [30]. Conversely, under the A1 (1.0 m), A2 (1.2 m), and A5 (1.5 m) treatments, drainage volume per unit area increased with greater burial depth. This is likely because deeper drains intercept a greater soil water volume, and the larger vertical hydraulic gradient enhances water movement into the pipes. Under shallow groundwater conditions, deeper drains are particularly effective at lowering the water table, thereby enhancing drainage performance [31]. Regarding salt removal, salt discharge per unit area decreased with increasing drainage spacing [32]. This occurs because wider spacing increases the control area per pipe, reducing the efficiency of water and salt collection. Moreover, a reduced seepage gradient weakens control over groundwater levels, thus diminishing salt leaching efficiency. In contrast, salt discharge per unit area increased with greater burial depth, likely due to the larger soil volume influenced by deeper pipes, which facilitates the leaching and drainage of more deep-layer salts [33]. A greater burial depth also lowers the groundwater table more effectively, reducing capillary rise. This reduces salt accumulation and upward movement, ultimately enhancing salt removal efficiency per unit area.

4.2. Effects of Subsurface Drainage Layout on the Drainage-to-Irrigation Ratio and Salt Removal Efficiency Coefficient

This study found that both drain depth and spacing significantly influence drainage performance. The A5 treatment (1.5 m depth, 20 m spacing) exhibited the highest Rd/i, with values of 34.16% and 22.48% during the 2023 spring and winter irrigations, and 48.42% and 24.35% in 2024, respectively. In addition, Rd/i is also affected by factors such as soil texture and groundwater depth. The study area consists of silt loam soil with moderate permeability, where typical Rd/i values range between 0.2 and 0.4. The performance of the A5 treatment falls within this typical range [34]. Further analysis showed that the Rd/i under A5 was consistently lower during winter irrigation than in spring. This may be due to higher groundwater levels in spring, which reduce soil porosity and increase drainage efficiency. Relevant studies and engineering practices indicate that Rd/i values for subsurface drainage in saline–alkali lands in Xinjiang generally range from 0.2 to 0.35, which aligns with the performance of the A5 treatment [35]. Although evaporation was considered in the calculation of Rd/i, this ratio alone does not directly reflect the salt removal capacity of subsurface drainage. Therefore, the DSEC was introduced as an indicator of salt removal performance. The results showed that DSEC was negatively correlated with drain spacing and positively correlated with drain depth. The A5 treatment consistently recorded the highest DSEC after each irrigation, demonstrating superior salt removal performance. Considering both Rd/i and DSEC, a subsurface drainage layout with 20 m spacing and 1.5 m depth is recommended for this region. However, drainage layout parameters are also influenced by soil properties and environmental factors, indicating the need for further research to optimize design strategies under different soil conditions.

4.3. Effects of Leaching Season on Soil Water Allocation and Optimization Strategies

The results of this study indicate that the leaching season has a significant impact on soil water distribution. During winter irrigation, the proportion of soil water storage was markedly higher than during spring irrigation, averaging 78.62% in 2023 and increasing to 81.78% in 2024, compared to just 74.55% and 61.62% under spring irrigation in 2023 and 2024, respectively. This can be attributed to lower initial soil moisture and deeper groundwater levels in winter, which allow more water to infiltrate and be retained within the soil profile [36]. Moreover, evaporation loss during winter irrigation was substantially lower than during spring. In 2024, evaporation accounted for only 5.36% during winter irrigation, compared to 23.31% in spring, highlighting the benefits of winter irrigation in reducing evaporative losses and enhancing water use efficiency. These findings are consistent with previous research. For example, Chen [37] reported that irrigation during colder seasons reduces evaporation and improves water use efficiency. Similarly, Zhu [38] found that the thermodynamic properties of winter soil restrict water evaporation, further reducing moisture loss.
Based on the above findings, season-specific management strategies are recommended for leaching practices. During spring irrigation, high evaporation rates warrant a moderate reduction in the leaching quota to minimize water loss. Moreover, irrigation strategies should be further optimized, such as through the use of subsurface drip irrigation beneath plastic mulch, which can significantly reduce evaporation losses. In contrast, winter irrigation—which promotes higher water use efficiency—justifies a higher leaching quota to improve soil moisture retention and enhance salt leaching, thereby supporting optimal soil conditions for spring crop growth.

4.4. Research Horizons

In southern Xinjiang, China, secondary salinization is mainly driven by arid climatic conditions, high evaporation rates, inefficient irrigation practices, rising groundwater levels, and inadequate drainage [39]. Similar soil salinization problems are also prevalent in many arid and semi-arid regions around the world, primarily due to comparable natural conditions and human activities [40]. For example, regions such as Luxor in Egypt [41], the Jezreel Valley in Israel [42], the Murray–Darling Basin in Australia [43], northwestern India (including Punjab and Rajasthan) [44], California’s Central Valley in the United States [45], and parts of Uzbekistan and Kazakhstan in Central Asia are all at high risk of severe soil salinization [46]. Considering the environmental similarities between these regions and the study area, the subsurface drainage optimization strategy proposed here offers significant potential for application and broader adoption in these regions.
This study also has several limitations. For instance, the relatively short experimental period may not fully reflect the long-term dynamic behavior of subsurface drainage systems. Moreover, the study was conducted under specific soil and climatic conditions, which may limit the applicability of the findings to regions with different environmental settings. Additionally, certain complex processes—such as lateral seepage from drainage ditches—were simplified in the water balance calculations, potentially introducing a degree of uncertainty. Therefore, future studies should extend the observation period and incorporate a wider range of environmental variables to improve water balance modeling and enhance the reliability and applicability of the results. As discussed, differentiated leaching quotas should be applied for spring and winter irrigation. Identifying optimal quotas under diverse conditions will be a key focus of future research, aiming to develop more precise and region-specific recommendations for subsurface drainage design. In addition, the study area is characterized by very low average annual precipitation of 47.9 mm and huge evaporation of 2279.1 mm annually, a shallow groundwater depth (around 1.5 m), shown in Figure 2, so secondary salinization due to capillary water rise is imminent. This study on the rate of salinization due to capillary rise will serve as the foundation for our future research, which seeks to elucidate the underlying relationships among surface soil salt accumulation, atmospheric temperature, and groundwater table depth.
This study focused on evaluating the technical efficiency of various subsurface drainage configurations in saline–alkali soils but did not include an economic assessment of the design alternatives. Although the configuration with a burial depth of 1.5 m and spacing of 20 m demonstrated the best performance in salt leaching and drainage efficiency, it may also entail higher installation and maintenance costs. Therefore, the economic feasibility of the technically optimal configuration remains uncertain. Future research should include a comprehensive cost–benefit analysis of subsurface drainage systems, accounting for both short-term implementation costs and long-term benefits, such as increased crop yields, improved soil health, and reduced salinization. Such an evaluation would help determine the practical applicability of the recommended parameters in large-scale agricultural systems, particularly in arid regions with limited resources.

5. Conclusions

Based on a two-year field study, drainage and salt removal efficiencies under different subsurface drainage configurations were evaluated using the Rd/i and the DSEC to identify optimal drainage design parameters for silty loam soils in southern Xinjiang. The results showed that the A5 treatment (1.5 m burial depth, 20 m spacing) achieved significantly higher Rd/i values than other treatments in both 2023 and 2024—ranging from 34.16% to 48.42% during spring irrigation and from 22.48% to 24.35% in winter—indicating superior drainage performance. The average DSEC over the four irrigation events was 3.28 kg·m−3—the highest among all treatments—confirming the superior salt transport and removal capacity of A5.
In the silty loam soils of southern Xinjiang, subsurface drainage systems with a pipe diameter of 90 mm, spacing of 20 m, and burial depth of 1.5 m demonstrated high drainage and salt removal efficiency, thereby creating favorable conditions for crop growth. During winter irrigation, a higher leaching quota is recommended due to lower evaporation and deeper groundwater levels, ensuring sufficient soil moisture storage. In contrast, during spring irrigation, the leaching quota should be moderately reduced to minimize unnecessary evaporative losses. Despite some limitations, this study provides valuable insights into irrigation and drainage management in arid regions globally and recommends seasonally optimized irrigation strategies.

Author Contributions

Writing—original draft preparation, H.G.; design of the experiment, H.G. and G.W.; data curation, Z.S. and P.X.; investigation, X.L.; and review and editing, L.M. All authors have read and agreed to the published version of the manuscript.

Funding

This research was funded by the “National Key Research and Development Program, grant number 2021YFD1900804”; “Research and Innovation Project for Graduate Students of Xinjiang Agricultural University, grant number XJAUGR12024017”; “2023 Basic Scientific Research Business Fee Project for Universities, grant number XJEDU2023Z006”.

Data Availability Statement

The original contributions presented in this study are included in the article material; further inquiries can be directed to the corresponding authors.

Acknowledgments

We appreciate and thank the anonymous reviewers for their helpful comments that led to an overall improvement of the manuscript. We also thank the Journal Editor Board for their help and patience throughout the review process.

Conflicts of Interest

Author Xia Li was employed by the company Xinjiang Changji Fanghui hydropower design Co., Ltd. The remaining authors declare that the research was conducted in the absence of any commercial or financial relationships that could be construed as a potential conflict of interest.

Abbreviations

The following abbreviations are used in this manuscript:
ECElectric conductivity
Rd/iThe ratio of drainage to irrigation
DSECDrainage salt efficiency coefficient

References

  1. Zou, M.Z.; Kang, S.Z.; Niu, J. Water-suitable reclamation can mitigate the amplified agricultural water stress driven by climate change in arid inland basin. J. Hydrol. 2024, 640, 131736. [Google Scholar] [CrossRef]
  2. Deng, X.P.; Shan, L.; Zhang, H. Improving agricultural water use efficiency in arid and semiarid areas of China. Agric. Water Manag. 2005, 80, 23–40. [Google Scholar] [CrossRef]
  3. Chen, W.P.; Hou, Z.N.; Wu, L.S. Evaluating salinity distribution in soil irrigated with saline water in arid regions of northwest China. (Special Issue: Salinity management in China). Agric. Water Manag. 2010, 97, 2001–2008. [Google Scholar] [CrossRef]
  4. Wang, H.; Zhu, Q.Q.; Pan, Y.Z. Effect of subsurface drainpipe parameters on soil water and salt distribution in a localized arid zone: A field-scale study. Agronomy 2025, 15, 678. [Google Scholar] [CrossRef]
  5. Ning, S.R.; Zhou, B.B.; Shi, J.C. Soil water/salt balance and water productivity of typical irrigation schedules for cotton under film mulched drip irrigation in northern Xinjiang. Agric. Water Manag. 2021, 245, 106651. [Google Scholar] [CrossRef]
  6. Li, D.W.; Yang, Y.H.; Zhao, Y.L. Optimizing cotton yield and soil salinity management: Integrating brackish water leaching and freshwater drip irrigation with subsurface drainage. Field Crops Res. 2024, 314, 109454. [Google Scholar] [CrossRef]
  7. Han, D.N.; Chen, C.; Wang, F. Effects of subsurface pipe drainage spacing on soil salinity movement in Jiangsu coastal reclamation area. Sustainability 2023, 15, 13932. [Google Scholar] [CrossRef]
  8. Addab, H.; Bailey, R.T. Simulating the effect of subsurface tile drainage on watershed salinity using SWAT. Agric. Water Manag. 2022, 262, 107431. [Google Scholar] [CrossRef]
  9. Lauren, E.B. Evaluation of macroscopic porosity-permeability relationships in heterogeneous mineral dissolution and precipitation scenarios. Water Resour. Res. 2017, 53, 10217–10230. [Google Scholar]
  10. Zied, H.A.; Salem, B. Subsurface drainage system performance, soil salinization risk, and shallow groundwater dynamic under irrigation practice in an arid land. Arab. J. Sci. Eng. 2019, 44, 467–477. [Google Scholar]
  11. Yuan, T.; LI, N.; Wang, S.L. Simulation study on performance of nitrogen loss of an improved subsurface drainage system for one-time drainage using HYDRUS-2D. Agric. Water Manag. 2021, 246, 106698. [Google Scholar]
  12. Qian, Y.Z.; Zhu, Y.; Huang, J.S. Key parameters for the optimal layout of subsurface drainage pipe in arid areas. Trans. Chin. Soc. Agric. Eng. 2021, 37, 117–126. (In Chinese) [Google Scholar]
  13. Yang, H.Y.; Guo, C.Y.; Wu, J.W. Effective radius of corrugated drainage pipes wrapped with a thin geotextile envelope. J. Irrig. Drain. Eng. 2024, 150, 04024023. [Google Scholar] [CrossRef]
  14. Zhang, Z.X.; Liu, S.T.; Li, Q. Study on the annual dynamic pattern of soil salinity and the depth of groundwater suitable for salt control in open irrigation and dark drainage areas. J. Irrig. Drain. Eng. 2025, 1–10. (In Chinese) [Google Scholar] [CrossRef]
  15. Wang, X.; Zhang, Y.H.; Fan, L.Q. Salt drainage efficiency and anti-clogging effects of subsurface pipes wrapped with geotextiles. Water 2024, 16, 1392. [Google Scholar] [CrossRef]
  16. Tian, F.; Miao, Q.F.; Shi, H.B. Simulating water and salt migration through soils with a clay layer and subsurface pipe drainage system at different depths using the DRAINMOD-S model. Agronomy 2023, 14, 17. [Google Scholar] [CrossRef]
  17. Ma, J.Y. Research on Water-Salt Migrating Characteristics Under the Subsurface Pipe Drainage of Shallow-Tight Type in Yinbei. Master’s Thesis, Ningxia University, Ningxia, China, 2020. (In Chinese). [Google Scholar]
  18. Qin, W.B.; Li, M.S.; Li, Y.F. Proposed gravel filters for pipe-drain to improve the efficacy ofthe drainage system under drip irrigation. J. Irrig. Drain. Eng. 2017, 36, 80–85. (In Chinese) [Google Scholar]
  19. Heng, T.; He, X.L.; Yang, L.L. Mechanism of Saline–Alkali land improvement using subsurface pipe and vertical well drainage measures and its response to agricultural soil ecosystem. Environ. Pollut. 2022, 293, 118583. [Google Scholar] [CrossRef] [PubMed]
  20. Askri, B.; Khodmi, S.; Bouhlila, R. Impact of subsurface drainage system on waterlogged and saline soils in a Saharan palm grove. Catena 2022, 212, 106070. [Google Scholar] [CrossRef]
  21. Minhas, P.S.; Ramos, T.B.; Bengal, A. Coping with salinity in irrigated agriculture: Crop evapotranspiration and water management issues. Agric. Water Manag. 2020, 227, 105832. [Google Scholar] [CrossRef]
  22. Guo, H.; Ma, Y.J.; Wang, G.N. The impact of different configurations of subsurface drainage pipes on soil water and salt dynamics and the efficacy of salt leaching through drainage during the spring-to-autumn irrigation season in southern Xinjiang. J. Agric. Resour. Environ. 2024, 41, 1422–1432. (In Chinese) [Google Scholar]
  23. Wang, Y.H.; Li, S.E.; Cui, Y.K. Effect of drip irrigation on soil water balance and water use efficiency of maize in northwest China. Water 2021, 13, 217. [Google Scholar] [CrossRef]
  24. Li, X.W.; Zuo, Q.; Shi, J.C. Evaluation of salt discharge by subsurface pipes in the cotton field with film mulched drip irrigation in Xinjiang, China I. Calibration to models and parameters. J. Hydraul. Eng. 2016, 47, 537–544. (In Chinese) [Google Scholar]
  25. Qian, Y.Z.; Zhu, Y.; Ye, M. Experiment and numerical simulation for designing layout parameters of subsurface drainage pipes in arid agricultural areas. Agric. Water Manag. 2021, 243, 106455. [Google Scholar] [CrossRef]
  26. Dingre, S.K.; Gorantiwar, S.D. Determination of the water requirement and crop coefficient values of sugarcane by field water balance method in semiarid region. Agric. Water Manag. 2020, 23, 106042. [Google Scholar] [CrossRef]
  27. Kolars, K.; Jia, X.H.; Steele, D.D. A soil water balance model for subsurface water management. Appl. Eng. Agric. 2019, 35, 633–646. [Google Scholar] [CrossRef]
  28. Zhang, X.J.; Wang, Z.M.; Guo, W.Z. Influences of different treatments on soil evaporation after irrigation. Bull. Soil Water Conserv. 2014, 34, 74–78. (In Chinese) [Google Scholar]
  29. Xu, Z.Q.; Chen, S.; Nachshon, U. Modeling evaporation dynamics from soils with major chlorides and high salinity. J. Hydrol. 2025, 655, 132943. [Google Scholar] [CrossRef]
  30. Yang, Y.; Li, D.; Huang, W.; Zhou, X.; Li, Z.; Dong, X.; Wang, X. Effects of Subsurface Drainage on Soil Salinity and Groundwater Table in Drip Irrigated Cotton Fields in Oasis Regions of Tarim Basin. Agriculture 2022, 12, 2167. [Google Scholar] [CrossRef]
  31. Guo, C.Y.; Yao, C.Z.; Wu, J.W. Field and numerical experiments of subsurface drainage systems in saline and low-permeability interlayered fields in arid regions. Agric. Water Manag. 2024, 300, 108898. [Google Scholar] [CrossRef]
  32. Zhang, L.; Jiao, P.J.; Dong, Q.G. Effects of spacing and depth of subsurface drain on water and salt transport in the field. J. Irrig. Drain. 2023, 42, 92–101. (In Chinese) [Google Scholar]
  33. Feng, X.G.; Zhang, Z.Y.; Wan, C.Y. Effects of saline water irrigation on soil salinity and yield of summer maize (Zea mays L.) in subsurface drainage system. Agric. Water Manag. 2017, 19, 205–213. [Google Scholar] [CrossRef]
  34. Hu, S.J.; Zhao, C.Y.; Zhu, H. Hydrosalinity balance and critical ratio of drainage to irrigation (RDI) for salt balance in Weigan River irrigation district of the Tarim basin (China). Environ. Earth Sci. 2017, 76, 242. [Google Scholar] [CrossRef]
  35. Wang, D.D.; Zhao, C.Y.; Zheng, J.Q. Evolution of soil salinity and the critical ratio of drainage to irrigation (CRDI) in the Weigan Oasis in the Tarim Basin. CATENA 2021, 201, 105210. [Google Scholar] [CrossRef]
  36. Li, L.; Liu, H.; He, X.; Lin, E.; Yang, G. Winter Irrigation Effects on Soil Moisture, Temperature and Salinity, and on Cotton Growth in Salinized Fields in Northern Xinjiang, China. Sustainability 2020, 12, 7573. [Google Scholar] [CrossRef]
  37. Chen, J.W.; Chen, F.H.; Zhang, J.W. Humidity variability in the arid northwest China during LIA derived from different proxy records. Acta Geogr. Sin. 2008, 63, 23–33. (In Chinese) [Google Scholar]
  38. Zhu, X.F.; Zhao, A.Z.; Li, Y.Z. Impact of irrigation on climate. Acta Ecol. Sin. 2014, 34, 4816–4828. (In Chinese) [Google Scholar]
  39. Xu, Z.Q.; Wallach, R.; Mao, X.M. Understanding evaporation from salinized soils in Xinjiang: Impact of sodium adsorption ratio, salt type, and concentrations. Soil Sci. Soc. Am. J. 2025, 89, e20796. [Google Scholar] [CrossRef]
  40. Hou, X.; Xiang, Y.; Fan, J. Spatial distribution and variability of soil salinity in film-mulched cotton fields under various drip irrigation regimes in southern Xinjiang of China. Soil Tillage Res. 2022, 223, 105470. [Google Scholar] [CrossRef]
  41. Said, I.; Salman, S.A.; Elnazer, A.A. Salinization of groundwater during 20 years of agricultural irrigation, Luxor, Egypt. Environ. Geochem. Health 2022, 44, 3821–3835. [Google Scholar] [CrossRef]
  42. Banin, A.; Fish, A. Secondary desertification due to salinization of intensively irrigated lands: The Israeli experience. Environ. Monit. Assess. 1995, 37, 17–37. [Google Scholar] [CrossRef] [PubMed]
  43. Foster, S.; Pulido-Bosch, A.; Vallejos, Á.; Molina, L.; Llop, A.; MacDonald, A.M. Impact of irrigated agriculture on groundwater-recharge salinity: A major sustainability concern in semi-arid regions. Hydrogeol. J. 2018, 26, 2781–2791. [Google Scholar] [CrossRef]
  44. Stavi, I.; Thevs, N.; Priori, S. Soil salinity and sodicity in drylands: A review of causes, effects, monitoring, and restoration measures. Front. Environ. Sci. 2021, 9, 712831. [Google Scholar] [CrossRef]
  45. Nachshon, U. Cropland soil salinization and associated hydrology: Trends, processes and examples. Water 2018, 10, 1030. [Google Scholar] [CrossRef]
  46. Shokri, N.; Hassani, A.; Sahimi, M. Multi-Scale Soil Salinization Dynamics from Global to Pore Scale: A Review. Rev. Geophys. 2024, 62, 80. [Google Scholar] [CrossRef]
Figure 1. Study area diagram.
Agronomy 15 01222 g001
Figure 2. Groundwater level during drenching in the test area.
Agronomy 15 01222 g002
Figure 3. Test area subsurface drain layout.
Agronomy 15 01222 g003
Figure 4. Variation in drainage flow between treatments during drenching of a subsurface drainage project. (a) Represents spring irrigation in 2023, (b) represents winter irrigation in 2023, (c) represents spring irrigation in 2024, and (d) represents winter irrigation in 2024. The data were collected from the central drainage pipes of each treatment to minimize boundary effects on drainage flow. Time zero on the x-axis was defined as the onset of leaching for each treatment, facilitating the direct comparison of drainage flow variations across treatments.
Agronomy 15 01222 g004
Figure 5. Variation in conductivity of drainage water between treatments during drenching of a subsurface drainage project. (a) Represents spring irrigation in 2023, (b) represents winter irrigation in 2023, (c) represents spring irrigation in 2024, and (d) represents winter irrigation in 2024. The data in the figure were collected from the central subsurface drainage pipes of each treatment group, with time zero corresponding to the start of leaching for each treatment.
Agronomy 15 01222 g005
Figure 6. (a) Variation in unit-area drainage volume (mm) under different treatments (A1–A5) during spring irrigation (SI) and winter irrigation (WI) in 2023 and 2024. (b) Variation in unit-area salt discharge (kg·m−2) under different treatments (A1–A5) during spring irrigation (SI) and winter irrigation (WI) in 2023 and 2024. Data were collected from the central drainage pipes of each treatment group to eliminate the influence of boundary effects. Different lowercase letters (a, b, c, d, and e) within the same group indicate statistically significant differences based on ANOVA (p < 0.05).
Agronomy 15 01222 g006
Figure 7. Variation in the DSEC under different pipe spacing and burial depth conditions. Panel (a) shows the changes in DSEC with varying drain spacing at a constant burial depth of 1.2 m, while panel (b) shows the changes in DSEC with varying burial depths at a fixed drain spacing of 20 m.
Agronomy 15 01222 g007
Figure 8. Proportional changes in soil water storage, drainage, and evaporation under different leaching quotas. SI and WI represent spring and winter irrigation, respectively.
Agronomy 15 01222 g008
Table 1. Soil physical properties in the dark tube test area.
Soil Depth/cmParticle Composition Volume Fraction/%Bulk Density/(g·cm−3)
SandSiltClay
0~1012.3565.2122.441.52
10~209.0472.4118.551.65
20~4016.2266.0317.751.60
40~6014.2767.2018.531.42
60~8023.2561.7115.041.50
80~10026.8259.4113.771.60
100~12028.6456.0915.271.58
120~14040.9747.3811.651.53
140~16040.2648.4911.261.57
Table 2. Test plan.
Table 2. Test plan.
ParameterA1A2A3A4A5
Interval/m2020304020
Burial depth/m1.01.21.21.21.5
Pipe diameter/mm9090909090
Area/m263606360954012,7206360
Table 3. Discharge and irrigation ratios for different treatments.
R d / i Spring Irrigation (2023)/%Winter Irrigation (2023)/%Spring Irrigation (2024)/%Winter Irrigation (2024)/%
A13.3411.786.457.17
A27.2513.1218.1613.75
A36.4810.0216.1912.07
A46.669.2614.8210.77
A534.1622.4848.4224.35
Table 4. Variance of Ratio of Drainage to Irrigation and Drainage Salt Efficiency Coefficient.
ItemdfFp
R d / i Depth217.2190.001 **
Spacing20.1900.829
DSECDepth272.7680.001 **
Spacing21.0150.386
** represents highly significant difference, (p < 0.01).
Table 5. Post-hoc Multiple Comparisons of Ratio of Drainage to Irrigation and Drainage Salt Efficiency Coefficient.
ItemMean ValueStandard Errortp
Depth R d / i 100–120−5.8854.487−1.3120.209
100–150−25.1674.487−5.6090.000 **
120–150−19.2824.487−4.2980.001 **
DSEC100–120−0.7000.232−3.0160.009 **
100–150−2.6970.232−11.6240.000 **
120–150−1.9970.232−8.6080.000 **
Spacing R d / i 2000–30001.8804.4870.4190.681
2000–40002.6924.4870.6000.557
3000–40000.8134.4870.1810.859
DSEC2000–30000.1820.2320.7860.444
2000–40000.3300.2321.4220.175
3000–40000.1480.2320.6360.535
** represents highly significant difference, (p < 0.01).
Disclaimer/Publisher’s Note: The statements, opinions and data contained in all publications are solely those of the individual author(s) and contributor(s) and not of MDPI and/or the editor(s). MDPI and/or the editor(s) disclaim responsibility for any injury to people or property resulting from any ideas, methods, instructions or products referred to in the content.

