Abstract
Unmanned aerial vehicles (UAVs) offer significant advantages in agricultural pest control. The present study investigated the influence of rotor-induced wind fields from multirotor UAVs (six-rotor T30, eight-rotor T40, eight-rotor T50, and four-rotor T60) on pesticide droplet deposition and control efficacy in cotton fields. The results revealed that UAVs with stronger wind fields (e.g., T60) significantly improved droplet deposition in the middle and lower canopy layers, with penetration rates of 54.09–56.04% which were notably higher than the penetration rate observed for the T30 (45.83–44.76%). UAVs exhibited a pesticide utilization efficiency of 75.47–77.86% indicating a 32.2% improvement over the boom sprayers, which achieved a utilization efficiency of 58.88%. While the boom sprayers initially showed a better pest control efficacy, the efficacy gap narrowed after 7 days, with T40 achieving 91.55%, comparable to the efficacy of boom sprayers (93.36%). Following a second spraying, UAVs achieved defoliation rates exceeding 93% and boll opening rates exceeding 90%, similar to that of boom sprayers. This study underscores the critical role of wind field intensity in influencing the spraying performance, with UAVs featuring stronger wind fields exhibiting superior droplet penetration and distribution uniformity. These findings provide valuable scientific insights for optimizing UAV spraying in cotton fields.
1. Introduction
In recent years, the low-altitude and low-dose pesticide spraying technology employed by plant protection unmanned aerial vehicles (UAVs) has gained significant attention and has undergone comprehensive development. By the end of 2024, the number of UAVs in China reached 251,000, covering a control area of 40.05 billion hectares. UAVs have effectively addressed the bottleneck problem of mechanized crop protection operations in paddy fields, hilly and mountainous areas, and areas with tall crops, making a substantial contribution in advancing the modernization of crop protection in China [1]. With the advancement of efficient agriculture and the development of smart agriculture, the mechanization and intelligence levels of plant protection work have been further enhanced [2,3], and China has taken a leading position globally in terms of the number, operating area, and technological development of UAVs [4,5]. Among various types of UAVs, multirotor UAVs have become a dominant model in the Chinese market due to their characteristics such as light weight, operational flexibility, and stable flight [6]. Recent studies have demonstrated that multirotor UAVs with optimized operational parameters (flight height 1–3 m, speed 3–4 m/s) can achieve 148 ± 8 drops/cm2 deposition density while reducing off-target drift by 28% compared to conventional methods [7]. In contrast to traditional fixed wing aircrafts, which mainly rely on the natural settling of droplets to reach the target area when spraying pesticides, multirotor UAVs typically operate at low altitude and low flight speed during pesticide spraying. This design helps to utilize the “wind delivery” effect created by the rotor airflow in enhancing the droplets, thereby improving the penetration and uniformity of the droplets towards the targeted area [8]. Experimental evidence from rice fields shows UAV sprayers increase chemical penetration by 35–40% in lower leaf layers compared to manual sprayers, with deposition uniformity exceeding 85% under optimal rotor configurations [9]. The rotor airflow plays a crucial role in determining the motion of pesticide droplets in space, influencing both the deposition of droplets on the target surface and their potential for droplet drift. Moreover, the interaction between the rotor rotation of the UAV and the surrounding air not only provides necessary lift but also generates a rotor-induced wind field that wraps around the UAV and its spraying apparatus [8,10]. This rotor-induced wind field directs the spraying droplets downwards, “hitting” them towards the target area of the crop canopy. When they interact with the crop stems and leaves, they form a cone-shaped vortex which influences their deposition and distribution within the target area [8].
The distribution pattern of droplet deposition during pesticide spraying by UAVs is not only related to the operational parameters of the UAV but also significantly correlated with its rotor wind field, which play a critical role in this process [11,12]. Martin et al. further evaluated four UAV platforms with payloads ranging from 5 to 20 L, revealing that increasing payloads up to 15 L expanded the effective swath width by 20%, whereas higher payloads (20 L) exhibited diminishing returns, suggesting a critical balance between payload capacity and operational efficiency [13]. From the perspective of pesticide spraying effectiveness, rotor airflow is essentially an important parameter that constrains the flight parameters of UAVs and determines the pesticide spraying effect in the field operation system of UAVs. This aspect has fundamental significance in advancing the research of UAV field operation systems [14]. Notably, propeller spin rate and UAV weight variations (0–10 kg payload) can alter airstream speed by 300–400%, significantly affecting deposition uniformity in coniferous canopies [15]. Eun et al. demonstrated that there are significant differences in the airflow by the rotor of UAVs reaching the crop canopy, and the corresponding parameters such as wind speed, wind direction, and wind field width have different effects on the operational efficiency [8].
Li et al. investigated the effects of wind speed and wind field extent generated by plant protection UAVs at different flight speeds on pollen deposition quantity and deposition coverage. The study revealed that flight speed had a significant effect on the wind field, with pollen deposition coverage being correlated with the horizontal wind field while the deposition amount was correlated with the vertical wind field [16]. Tang et al. further demonstrated that the downwash wind field velocity of an octocopter UAV not only affects the droplet deposition area but also influences the uniformity of droplet deposition distribution [17]. Guo et al. focused on the downwash airflow characteristics of quadrotor agricultural unmanned aerial vehicles (UAVs) during dual-aircraft collaborative operations. Through numerical simulation and experimental verification, they revealed the influence law of the distance between the two aircraft on the coupled downwash airflow and proposed the key parameters for optimizing collaborative operations [18]. Additionally, Liu et al. showed that the overall shape of the downwash airflow gradually changes from a “four-point shape” to a “square shape” and eventually forms an “elliptical shape”. The velocity distribution in the central area means that the airflow is vertically downward directly beneath the fuselage. The velocity first increases and then decreases, and the high-speed area is concentrated beneath each rotor. The airflow on the two sides of the area shows a horn-shaped distribution of “contracting first and then expanding”. The area with low wind speed expands faster, while the area with high wind speed merges below the rotor and extends downward, forming a continuous area [19,20]. Chojnacki et al. verified the effects of nozzle type, drone rotor airflow, and the spacing between trees on the deposition distribution of fog droplets in cherry tree canopies. The research results revealed that the rotor airflow from agricultural drones increased the amount of droplet deposition in the middle and lower layers of the tree canopy [21]. These studies indicated that the rotor wind field not only increases the settling velocity and size of droplets but also improves the droplet deposition and distribution uniformity of spray droplets near the ground [17].
Additionally, Daniel et al. investigated how UAV operational parameters (e.g., flight height, ground speed) affect spray pattern uniformity and droplet distribution. The study explicitly discusses the role of rotor downwash airflow in shaping spray width and deposition characteristics. For example, the authors note that the downwash airflow can expand the effective spray swath while also influencing droplet drift dynamics. Experimental results using two UAV models (DJI MG-1 and HSE V6A, Shenzhen Dajiang Innovation Technology Co., Ltd., Shengzhen, China) show that application height significantly impacts spray width, with taller heights leading to broader coverage [22]. Furthermore, Tang et al. explored that the downwash wind field of eight-rotor UAVs transitions from an unsteady to a steady state over time, generating wake vortices, ground-diffusing airflow, and vortex rings during evolution. Their analysis revealed a negative downwash wind field channel in the central rotor area with the wake vortex airflow area expanding as the distance from the rotor increases, causing adjacent left–right wake vortices to transition from independent to gradually coupled states. The “helical effect” of the downwash wind field is offset by the mutual coupling of upper and lower rotors of the UAV. When the nozzles are installed directly below the rotors, the distribution of droplet deposition is superior to that observed in the central axis position, indicating that droplets under the rotors avoid entering the wake vortex coupling area, effectively reducing droplet drift. Field tests further confirmed that measured and simulated downwash wind field velocities exhibited consistent trends, with relative errors ranging from a minimum of 4% to a maximum of 29% [23]. Yallappa D. et al. quantified the influence on spray deposition through experiments. It was found that the downwash airflow was uniformly distributed on the rotating ring of the rotor, with a standard deviation of less than 0.5 m/s, indicating that the airflow stability was relatively high, and the velocity showed a trend of increasing first and then decreasing with the radial distance. The maximum speed (13.8 m/s) occurs at a load of 10 kg, a hovering height of 1 m, and 0.5 m in the X direction. The minimum velocity (0.3 m/s) occurs at a load of 0 kg, a height of 1 m, and a position of 2 m in the X direction. The overall shape of the downwash airflow field gradually expands from a “four-point shape” to a “square shape” and eventually evolves into an “elliptical shape”. The low-speed zone has a wider expansion range. The high-speed zone is concentrated directly beneath the rotor, while the low-speed zone merges beneath the rotor to form a continuous area [24].
The downwash wind field generated by rotor-driven UAVs is also influenced by ambient wind direction and speed. Zhang et al. demonstrated that, when natural wind speed exceeds 3 m/s, the downwash wind field velocity of hexacopter UAVs is dominated by ambient wind, and the conditions for hovering and spraying operations become unachievable. The natural wind can disrupt the central symmetry of the rotor downwash wind field, causing the downward wind to exhibit rearward deflection, and the extent of rearward deflection increases as the natural wind speed and hovering height increase [25]. However, changes in flight altitude and the decreasing load of the tank will alter the flow field beneath the unmanned aerial vehicle, thereby affecting the droplet distribution [26]. The Syngenta team discovered through wind tunnel experiments (with wind speeds ranging from 1.5 to 4.5 m/s) that the ambient wind caused the effective spray width to shift 2 m towards the crosswind direction, and the drift of fine droplets (<100 μm) increased by three times. It is recommended that, when the natural wind speed is greater than 3 m/s, coarse droplets (>300 μm) combined with reducing the flight altitude (1.5–2 m) are adopted to control the drift [27]. Li et al. suggested that the intensity of the downward pressure wind field varies with flight inclination, dividing the area below the rotors into front, middle, and rear zones along the flight direction, with increasing wind field strength in sequence [28]. Moreover, the downwash wind field of rotor UAVs significantly affects crop morphology, thereby influencing droplet deposition. Shi et al. analyzed the dynamic behavior of rice plants under UAV downwash wind fields and found that stronger downwash leads to more pronounced plant deformation, with canopy morphology closely linked to droplet deposition outcomes [29].
Numerous studies indicate that the wind field generated by UAV rotors significantly influences droplet movement and deposition distribution. Understanding the effects of wind fields on droplet dynamics and distribution characteristics is of critical scientific importance for improving droplet adhesion on target surfaces, enhancing deposition uniformity, and mitigating drift-associated risks. Therefore, this study has employed UAVs with different payloads to simulate varying takeoff wind fields. The study focused on conducting spraying operations aimed to control cotton aphid and defoliation ripening in maximum payload conditions. By investigating the impacts of different wind fields on droplet deposition and spraying efficacy, the current research aimed at providing valuable guidance for precise and effective utilizations of UAVs in cotton fields.
2. Materials and Methods
2.1. Field Plot
The experiment was conducted in 2024 within a cotton field located in the research area of Shihezi University in Beiquan Town, Shihezi City, Xinjiang, China (44°33′61″ N, 85°97′05″ E, Figure 1). The field had been planted with the “Huiyuan 720” cotton variety, sown on 24 April 2024, with a planting density of 175,000 plants/hm2. The experiment employed the traditional wide and narrow row planting method for cotton sowing—a common pattern where wide and narrow rows alternate to optimize light penetration, air circulation, and mechanized operations (e.g., fertilization, pest control)—having six rows per film with a spacing of 66 + 10 cm. This configuration means rows are arranged in a repeating cycle of 66 cm (wide row) and 10 cm (narrow row), forming three sets of wide–narrow pairs per film to balance plant spacing and land use efficiency while facilitating drip tube installation. The mulch film width was 2.05 m, accommodating the six rows and ensuring proper coverage for the subsurface drip system. During the entire growth period, drip irrigation was applied with one film and two tubes, wherein drip tubes are placed beneath the mulch film to deliver water and nutrients directly to root zones. The two tubes per film ensure uniform water supply across all six rows, especially in the narrow rows, by matching the row spacing and irrigation coverage requirements. The experimental site was moderately fertilized in such a way that fertilizers were applied to the cotton field in amounts consistent with typical agricultural practices in the region but not excessive enough to cause nutrient imbalances or excessive growth. Specifically, a balanced fertilizer was employed, which provided the crop with essential nutrients such as nitrogen (N), phosphorus (P), and potassium (K) at a level intended to support healthy growth and development without exceeding standard agronomic recommendations.
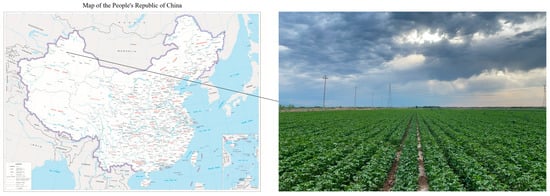
Figure 1.
The graphical map of the experimental site.
Meteorological variables monitored throughout the experiment, including wind speed, wind direction, air temperature, and relative humidity, are presented in Table 1.

Table 1.
Meteorological variables monitored throughout the experiment.
2.2. Sprayers
The UAVs used in this study were manufactured by Shenzhen Dajiang Innovation Technology Co., Ltd., Shengzhen, China (Table 2). Operational parameters for the UAV were programmed by using an intelligent handheld terminal, with carrier phase difference technology for precise and accurate flight positioning. During the two spraying operations, the spraying volume of the UAV was 30.0 L/ha, the spraying width during the operation was 5.0 m, the flight height was 2.5 m (above the ground), and the flight speed was 5.0 m/s.
Table 2.
Technical parameters of UAVs.
The boom sprayer used in the current study was mounted on a John Deere954 tractor (John Deere, Morin, IL, USA) as the traction main body combined with a farmer’s self-assembled sprayer. The volume of the sprayer’s tank was 1000 L, with the dimensions of 2400 mm × 1920 mm × 3150 mm (length × width × height), and liquid pump flow of 100 L/min. It was equipped with 32 flat-fan nozzles (model 11003, Dongguan Huajue Spray Technology Co., Ltd., Dongguan, China), featuring a 110° spray angle and a nominal orifice size suitable for medium-to-coarse droplet formation. The nozzles were evenly spaced along an 11.25 m long boom, with a nozzle spacing of 35 cm, with a single spray width of 70 cm (50% overlap between adjacent nozzles), ensuring uniform spray coverage. The effective spraying width of this boom sprayer is also 11.25 m, and the boom was rigidly mounted with adjustable height brackets. The boom was positioned at a height of 60 cm from the ground.
2.3. Experimental Design
As shown in Figure 2A, the spraying area for the UAV was 1600 m2 (10 m × 160 m) and spraying area for the boom sprayer was 1800 m2 (11.25 m × 160 m), with three repetitions for each spraying operation. The first spraying was conducted from 8:00–12:00 on 14 July 2024 (UTC+8) to control cotton aphids (Aphis gossypii Glover) with 22.4% spirotetramat SC (Hebei Mingshun Agricultural Technology Co., Ltd., Shijiazhuang, China) at a rate of 375 mL/ha. At the time of spraying, the cotton plants were at the flower and boll forming stage, and the average plant height was 74 cm. The second spraying was conducted from 11:00–16:00 on 4 September 2024 (UTC+8) in order to promote cotton boll opening and defoliation. The treatment involved a combination of 360 g/L thidiazuron and 180 g/L diuron SC (180 mL/ha for the UAV and 360 mL/ha for the boom sprayer, Hebei Noda Agricultural Chemicals Co., Ltd., Shijiazhuang, China) along with a 40% ethephon solution (900 mL/ha for UAV and 1800 mL/ha for boom sprayer, Jiangsu Anpon Electrochemical Co., Ltd., Huaian, China). At this stage, the cotton was at the boll opening stage, and the average plant height was 92 cm, with approximately 40% of the cotton bolls already opened [30]. After 7 days, a third spraying with the UAV was conducted from 11:00–14:00 on 11 September 2024 (UTC+8), using the same formulations: 360 g/L thidiazuron·180 g/L diuron SC (180 mL/ha) and 40% ethephon solution (900 mL/ha).
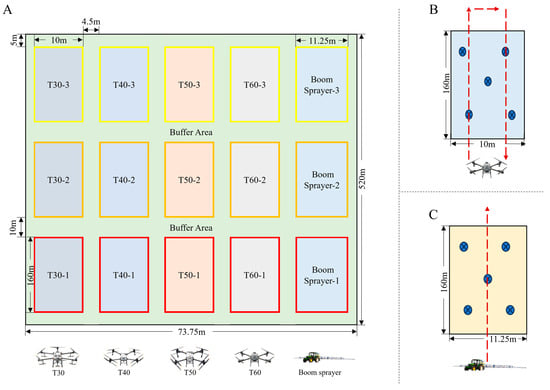
Figure 2.
Schematic diagram of experimental plot layout. (A) Spraying area for the UAV and boom sprayer; (B) Five-point sampling for the UAV; (C) Five-point sampling for the boom sprayer.
2.4. Droplet Deposition and Pesticide Utilization Rate
2.4.1. Pesticide Utilization Rate
In accordance with the “technical methodology of determining pesticide utilization rate in field-Part 1: technical methodology of determining pesticide deposition rate by foliar spray in field crop—Allura Red as a tracer (NY/T 3630.1-2020)” [31], Allura Red (Zhejiang jigaode pigment Technology Co., Ltd., Longgang, China) was used as a tracer at a rate of 450 g/ha. Allura Red dye tracers are used to quantify the actual liquid volume deposited on plant surfaces by measuring the absorbance of dye using spectrophotometry, thus enabling more precise measurement of droplet deposition. It was added into the pesticide solution and was mixed thoroughly. During each spraying, the UAV was fully loaded to its maximum takeoff weight in order to achieve the maximum wind field. After 30 min of spraying, a five-point sampling method was used in each plot (Figure 2B,C). Two cotton plants were selected from each point, cut from the base of stem, and placed in a sealed bag. One cotton plant from each sampling point was washed with 100 mL distilled water, and the washing solution was then filtered through a water-based needle filter (WondaDisc II, d = 13 mm, pore size = 0.22 μm, Shanghai Island Jinjier Trading Co., Ltd., Shanghai, China). The absorbance value of filtrate was measured at 514 nm by a Tecan Infinite 200 PRO ELIASA (Tecan company, Männedorf, Switzerland). The utilization rate was calculated according to Equation (1).
where represents the absorbance value of the test sample, represents the absorbance value of the blank control, represents the slope value of the standard curve, represents the volume of eluent in mLs, is the pesticide deposition (%), is the planting density (plant/m2), represents the total amount of indicator per unit area applied (g/ha), is the number of sampled plants.
Six concentrations of Allura Red, 0.2, 0.5, 1.0, 2.0, 5.0, and 10.0 mg/L, were selected and utilized to form a relevant absorbance range. The resulting strand curve was y = 0.0317x + 0.0417 (R2 = 0.9999), where x is the absorbance of the Allura Red solution and y is the concentration of the Allura Red solution in mg/L.
2.4.2. Droplet Deposition
Water-sensitive paper (WSP, Hebei Mingshun Agricultural Technology Co., Ltd., Shijiazhuang, China) was utilized to assess the key deposition characteristics which include coverage, number of spray impacts/stains, and deposition of the impact/stains [32]. WSP was used because it provides a visual assessment of droplet coverage and uniformity, and WSP is the most widely used artificial collector worldwide for the rapid assessment of spray distribution behavior in the field [33]. Three sampling lines, each of which contained 10 sampling points with an interval of 1.0 m, were set along the UAV flight route, and the distance between the sampling lines was set to be 10 m (Figure 3A). Each sampling point was further divided into three parts and named as upper, middle, and lower layers. For the spraying at the flowering stage, the WSPs were placed at heights of 30, 50, and 70 cm from the ground. At the same time, the heights of WSPs for the boll opening stage were set to be 50, 70, and 90 cm above the ground (Figure 3B,C). Nearly 30 s after spraying, all WSPs were collected and placed in ziplock bags and then transferred to the laboratory for further analysis. Each bag was labeled describing the treatment, replication, and site information. In the laboratory, further analysis was performed after scanning the WSPs at a resolution of 600 dpi with a scanner (FileScan2500, Shanghai Zhongjing Technology Co., Ltd., Shanghai, China). ImageJ software (ImageJ 1.3 8, National Institutes of Health, Bethesda, MD, USA) was then used to extract droplet deposits from the digital image to analyze the number of spray deposits, the area coverage, and the droplet deposition [32].
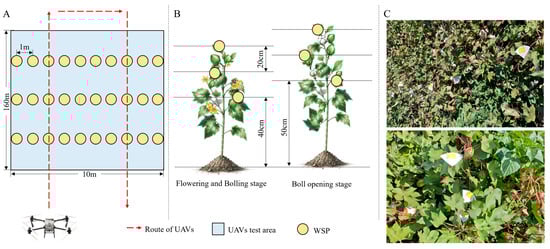
Figure 3.
Experimental layout for spraying pattern analysis from a single UAV flight pass. (A) Sampling points in the pesticide application area of UAVs for plant protection; (B) Sampling points in the pesticide application area of boom sprayer for plant protection; (C) Schematic diagram of field layout.
To assess the uniformity of droplet deposition between spray widths, the coefficient of variation (CV) of droplet deposition densities was measured at various locations within the effective spray width of the UAV sprayers on the cotton canopy. The CV of the droplet deposition density was calculated using the following Equations (2) and (3):
where S denotes the sample standard deviation, Xi represents the number of droplets per unit area at each collection point, n represents the number of collection points, and is the mean droplet density.
2.5. Control Effect
2.5.1. Aphids
The survey and recording for the population of cotton aphid Aphis gossypii were conducted by Mseddi’ method [34]. In order to investigate the control efficacy of pesticide spraying on the aphid population, the parallel-jump method was utilized to investigate the population densities of cotton aphid Aphis gossypii and spider mite Tetranychus urticae in each treatment zone prior to spraying and at 1, 3, and 7 days after spraying. The five-point method was utilized for each treatment zone and five cotton plants were selected from each point. For a comprehensive investigation, the total number of aphids from a 10-point survey using one cotton plant for each point was counted. The defoliation rate and control efficacy were obtained on the basis of numbers of live insects in each zone before and after pesticide application, using Equations (4) and (5).
where D represents the insect population decline rate. Na represents the number of insects before spraying. Nb represents the number of insects after spraying. CE denotes the control efficiency. Da is the decline rate of the insects within the treated area, and Db is the decline rate of the insects within the control area.
D = ((Na − Nb)/N) × 100%
CE = ((Da − Db)/(100 − Db)) × 100%
2.5.2. Boll Opening and Defoliation
Before the application of pesticide within the target area, 15 cotton plants were randomly selected and tagged to count the number of leaves, open bolls, and non-opened bolls on each cotton plant. The number of leaves, opened bolls, and non-opened bolls were calculated 5, 7, 10, 15, and 20 days after application of pesticide. The defoliation and boll opening rates were then calculated according to Equations (6) and (7).
where NBS denotes the number of leaves before spraying and NAS denotes the number of leaves after spraying.
where Nc is the number of opened bolls and Nd is the total number of bolls.
Defoliation rate (%) = ((NBS − NAS)/NBS)) × 100%
Boll opening rate (%) = (Nc/Nd) × 100%
2.6. Data Analysis
The data were analyzed using Origin 9.1 software (Origin 9.1 origin Lab, Northampton, MA, USA) and SPSS 22 (SPSS Inc., an IBM Company, Chicago, IL, USA) statistical analysis software. The analyses were performed using one-way ANOVA to compare group means. The LSD test was selected for post hoc comparison. The confidence interval was set to be 95%, and p < 0.05 was considered to indicate a significant difference between the two groups.
3. Results
3.1. Effect of UAV Wind Field on Droplet Coverage
Figure 4 represents the droplet coverage, which refers to the percentage of leaf surface area covered by droplets. The wind field generated by UAVs had significantly influenced the coverage of spray droplets (Figure 4), with droplet coverage showing a decreasing trend from the upper to middle and lower layers of the cotton canopy across all treatments. When the insecticides were applied for aphid control, the droplet coverage in the upper layer of the cotton canopy for T30, T40, T50, and T60 was 4.00%, 4.19%, 4.06%, and 4.43%, respectively, with no significant differences observed among treatments. These findings indicate that the UAV wind field had a minimal impact on droplet coverage in the upper cotton canopy. In contrast, the middle canopy showed a notable difference, and T40 (3.13%), T50 (3.07%), and T60 (3.12%) exhibited significantly higher droplet coverage than T30 (2.58%). A similar trend was observed in the lower canopy, and T40 (2.28%), T50 (2.24%), and T60 (2.25%) had significantly higher coverage than that of T30 (1.91%). This is because T40, T50, and T60 generated a stronger wind field with more intense rotor downwash airflow compared to T30 that facilitated a better droplet deposition in the middle and lower canopy due to the efficient transport of droplets via the airflow.
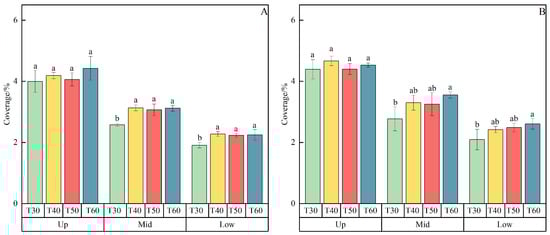
Figure 4.
The effect of wind field on insecticide (A) and harvest-aid (B) droplet coverage of UAV. There is no significant difference (p > 0.05) among the values marked with the same letter.
When the harvest aids were applied, the droplet coverage in the upper cotton canopy for T30, T40, T50, and T60 was 4.39%, 4.67%, 4.40%, and 4.53%, respectively, with no significant differences among the treatments. Notably, in the middle canopy, T60 achieved a significantly higher coverage of 3.55% compared to T30 (2.77%), while no significant differences were found between T60 and T40 (3.30%) or T50 (3.25%). In the lower canopy, T60 achieved a droplet coverage of 2.61% which was significantly higher than that of T30 (2.09%), with no significant differences observed between T40 (2.42%) and T50 (2.49%). The differences observed in spray deposition between the insecticide and harvest-aid treatments can be attributed to their distinct formulation properties. Insecticides generally exhibit higher droplet coverage due to their faster drying rate and smaller droplet sizes. In contrast, harvest-aid formulations, which are more viscous, are designed for improved canopy penetration, resulting in more concentrated deposition in the lower canopy layers. These formulation-specific characteristics influenced both droplet deposition and efficacy across the different UAV models used in this study.
3.2. Effect of UAV Wind Field on Droplet Density
The wind field generated by UAVs had significantly influenced the density of sprayed droplets (Figure 5), with droplet density showing a decreasing trend from the upper to middle and lower layers of the cotton canopy across all treatments. When the insecticides were applied for aphid control, T60 achieved the highest droplet density in the upper cotton canopy (37.86 droplets/cm2), which was significantly higher than that of T30 (30.30 droplets/cm2), while no significant differences were observed for T40 (31.37 droplets/cm2) and T50 (32.99 droplets/cm2). In the middle canopy, droplet densities for T30, T40, T50, and T60 were 22.83, 24.46, 26.83, and 28.71 droplets/cm2, respectively, with T60 exhibiting significantly higher density than the others. The stronger downwash airflow generated by the rotors of T60 facilitated the transport of more droplets to the middle canopy, ensuring a better droplet coverage within the middle layer of the cotton canopy. In the lower layer of the cotton canopy, droplet densities were generally lower than in the upper and middle layers: T30 (15.27 droplets/cm2), T40 (20.41 droplets/cm2), T50 (21.65 droplets/cm2), and T60 (21.28 droplets/cm2). Despite this, T40, T50, and T60 still had an advantage over T30, indicating that UAVs with stronger wind fields can overcome leaf obstruction and increase droplet density in the middle and lower layers of the cotton canopy during aerial spraying.
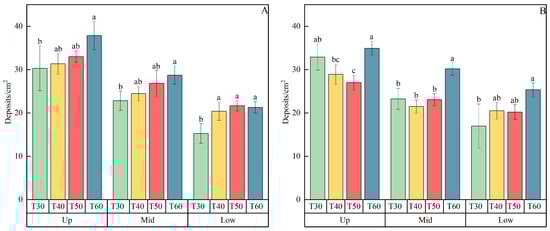
Figure 5.
The effect of wind field on insecticide (A) and harvest-aid (B) droplet density of UAVs. There is no significant difference (p > 0.05) among the values marked with the same letter.
When spraying cotton harvest aids, droplet densities in the upper canopy were 32.91 droplets/cm2, 28.93 droplets/cm2, 26.99 droplets/cm2, and 34.93 droplets/cm2 for T30, T40, T50, and T60, respectively. Notably, T40 and T50 exhibited lower droplet densities in both upper and middle canopies than T30, possibly due to the drift of small-sized droplets caused by sudden lateral crosswind during spraying [35]. This drift likely resulted in lower droplet density compared to T30. In the middle layer of the cotton canopy, droplet densities for T30, T40, T50, and T60 during harvest-aid spraying were 23.25 droplets/cm2, 21.47 droplets/cm2, 23.09 droplets/cm2, and 30.19 droplets/cm2, respectively. The droplet density of T60 for spraying harvest aid was significantly higher than that of other treatments, indicating that T60 provides denser droplet coverage in the middle canopy, which helps improve the efficacy of harvest aids. In the lower layer of the cotton canopy, the droplet densities were 16.98 droplets/cm2, 20.52 droplets/cm2, 20.20 droplets/cm2, and 25.34 droplets/cm2 for T30, T40, T50, and T60, respectively. T60 exhibited significantly higher droplet density when compared with all other models of UAV. The strong wind field generated by T60 facilitates better penetration through plant obstructions, droplet delivery to the target areas, and providing more effective support for cotton defoliation operations.
The higher impact density of the defoliant (Figure 5B) compared to the insecticide (Figure 5A) is likely due to its formulation containing surfactants that reduce surface tension, especially the fan-shaped nozzle of T30, promoting finer atomization and a higher number of small droplets despite identical nozzle settings. This aligns with the defoliant’s lower viscosity, which enhances atomization efficiency through centrifugal nozzles, resulting in denser droplet distribution on WSP.
3.3. Effect of UAV Wind Field on Droplet Deposition
Figure 6 represents the droplet deposition. The wind field generated by UAVs had a significant impact on the droplet deposition (Figure 6). Droplet size distributions were analyzed based on the area of droplet impacts on WSP, categorized using ImageJ software. The results showed that UAV spraying generated a broad range of droplet sizes. Larger droplets were predominantly deposited in the upper canopy layers, where wind attenuation was less of a factor, while smaller droplets were more prevalent in the lower canopy layers, where stronger rotor downwash facilitated better penetration. These distributions varied across treatments. The droplet deposition of each treatment showed a downward trend from the upper to the middle and lower parts of the cotton canopy. During aerial spraying of pesticide, the droplet deposition of each treatment in the lower canopy was generally lower than those in the upper and middle canopies. This is because the branches and leaves in the upper part of the cotton plants strongly block the droplets, making it difficult for the droplets to reach the lower parts. When the UAVs were used to spray insecticides to control aphids, the droplet deposition of treatments with T30, T40, T50, and T60 in the upper cotton canopy were 0.259 (μL/cm2), 0.254 (μL/cm2), 0.250 (μL/cm2), and 0.261 (μL/cm2), respectively, and there were no significant differences among the treatments. In the middle layer of the cotton canopy, the droplet depositions of T30, T40, T50, and T60 were 0.175 (μL/cm2), 0.190 (μL/cm2), 0.177 (μL/cm2), and 0.191 (μL/cm2), respectively. Among them, the droplet deposition of T60 was relatively high, with a significant difference compared to T30. In the lower layer of the cotton canopy, the droplet depositions of T30, T40, T50, and T60 were 0.119 (μL/cm2), 0.136 (μL/cm2), 0.134 (μL/cm2), and 0.141 (μL/cm2), respectively. Here, also, the droplet deposition of T60 in the lower layer of the cotton canopy was relatively high, with a significant difference when compared with T30.
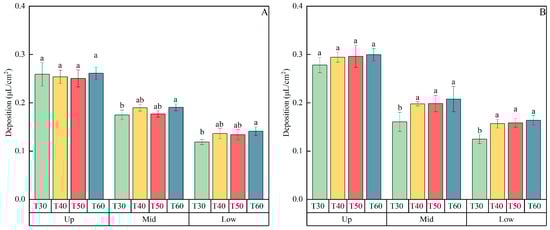
Figure 6.
The effect of wind field on insecticide (A) and harvest-aid (B) droplet deposition of UAVs. There is no significant difference (p > 0.05) among the values marked with the same letter.
When the UAVs were used to spray harvest aids, the droplet depositions for T30, T40, T50, and T60 were 0.278 (μL/cm2), 0.294 (μL/cm2), 0.296 (μL/cm2), and 0.299 (μL/cm2), respectively. No significant differences were observed among the treatments. In the middle layer of the cotton canopy, the droplet depositions for the treatments with T30, T40, T50, and T60 were 0.161 (μL/cm2), 0.198 (μL/cm2), 0.198 (μL/cm2), and 0.208 (μL/cm2), respectively. The droplet depositions for T40, T50, and T60 were significantly higher than that of T30. In the lower layer of the cotton canopy, the droplet depositions for T30, T40, T50, and T60 were found to be 0.125 (μL/cm2), 0.157 (μL/cm2), 0.158 (μL/cm2), and 0.164 (μL/cm2), respectively. The droplet depositions of T40, T50, and T60 were significantly higher than that of T30. UAV models with stronger wind fields, such as T60, facilitated better penetration and deposition into the lower canopy layers, which is more directly reflected in deposition data (Figure 6), whereas coverage may not fully capture this benefit due to non-uniform leaf surface exposure.
3.4. Effect of UAV Downwash Airflow on Droplet Distribution Uniformity and Penetration
The uniformity of droplet distribution is quantified by the coefficient of variation (CV) of droplet density within the same canopy layer, where lower CV values indicate superior distribution homogeneity. Field trials are highly influenced by environmental conditions, resulting in large coefficients of variation (CVs) for droplet density and coverage. The effects of UAV wind fields on droplet distribution uniformity and penetration are presented in Table 2 and Table 3. When spraying insecticides, T40 exhibited the best average droplet uniformity (63.58%), followed by T50 (68.55%) and T60 (64.10%), while T30 had poor uniformity (80.11%). For harvest-aid spraying, T60 achieved the highest average uniformity (59.29%), followed by T50 (64.02%), T40 (65.42%), and T30 (67.92%). Overall, droplet uniformity was relatively stable across treatments, except for T30 during insecticide spraying, likely because of its weaker six-rotor downwash airflow being more susceptible to environmental interference, leading to uneven droplet distribution.
Table 3.
The effect of wind fields on insecticide deposition droplet uniformity and canopy penetration.
Table 3 and Table 4 further illustrate stratification in distribution uniformity: upper canopy layers exhibited the highest uniformity (48.47–81.78%), followed by middle (59.10–68.35%) and lower (56.78–94.97%) layers. This hierarchal distribution is mainly attributed to the expanded leaf exposure and unobstructed airflow in upper canopies, where improved illumination and ventilation promote droplet drying and adhesion, enhancing uniformity [36]. The droplet uniformity in the middle layer of the cotton canopy is influenced by a variety of factors. During the pesticide spraying operation of the plant protection UAVs, the lower rotor downwash wind field can deliver some of the droplets into the middle canopy, however, because of the attenuation of the airflow or the unevenness of the wind field, the droplet coverage of the middle canopy may not be as uniform as that of the upper canopy [37,38]. Furthermore, the denser leaf structure in the middle canopy can also cause severe inter-leaf shading, adversely affecting droplet penetration and distribution. The lower canopy exhibits the most uneven coverage due to gravitational forces and obstruction by upper/middle layer canopies during droplet descent. Previous studies on orchard spray drift have found that updraft vortices from rotor downwash are the key factors in UAV spray drift, potentially causing uneven lower canopy coverage [12], consistent with the findings of this study. Interestingly, T60 showed better lower canopy uniformity than the other UAVs, possibly due to its stronger downwash airflow, which reduces the effect of environmental disturbances on droplet distribution.
Table 4.
The effect of wind fields on harvest-aid droplet deposition uniformity and canopy penetration.
To assess the droplet penetration within the canopy, penetration was evaluated as the ratio of droplet deposition in the lower canopy to that in the upper canopy. As shown in Table 3 and Table 4, T40 (53.74% for insecticide, 53.22% for harvest aid), T50 (53.45%, 53.50%), and T60 (54.09%, 56.04%) had higher penetration rates than T30 (45.83%, 44.76%). This is likely because UAVs with stronger wind fields generate more intense downwash airflow, enabling the droplets to penetrate the upper canopy and deposit more effectively in the middle and lower canopies.
3.5. Effect of UAV Wind Field on Pesticide Utilization Rate
As shown in Table 5, the pesticide utilization rates for T30, T40, T50, and T60 for insecticide spraying to control cotton aphids were 75.47%, 76.13%, 77.76%, and 77.86%, respectively, each significantly higher than that of the boom sprayer. UAVs, with their low-altitude spraying capabilities, enable more precise pesticide delivery to the target surface, which minimizes pesticide drift and reduces airborne waste. Furthermore, UAV spray systems typically generate finer droplets that adhere more easily to the target crop surfaces, increasing pesticide coverage and adhesion, thereby enhancing utilization rates. In contrast, boom sprayers operate at ground level and are affected by factors such as terrain and crop height, leading to uneven pesticide distribution. The high-volume spray mode of boom sprayers causes droplets to aggregate into water droplets on cotton plants, which then roll off onto the ground, reducing effective adhesion and lowering pesticide utilization efficiency.
Table 5.
Effect of UAV wind field on pesticide utilization rate.
3.6. Effect of UAV Wind Field on Spraying Effect
As shown in Table 6, when comparing the control efficacy of five sprayers against cotton aphids, UAVs showed significantly lower efficacy than boom sprayers 1 day after spraying, with T30 exhibiting the least efficacy (61.93%). This is likely because aphids predominantly inhabit the abaxial surfaces of upper and middle leaves of the cotton canopy. The spray pattern of boom sprayers tends to ensure more droplet deposition on the backsides of leaf that enhances the contact toxicity against aphids. In contrast, UAV spraying focuses more on adaxial surface of the leaves, which results in fewer pesticide droplets reaching the abaxial surfaces, leading to reduced contact toxicity. Aphid mortality occurred because of ingesting leaf sap after plants absorbed the pesticide, leading to a slower control effect. Three days after spraying, the control efficacy of the UAV was lower than that of the boom sprayers but showed a gradual increase. Notably, T40, T50, and T60 exhibited similar efficacy against cotton aphids, each around 81%. By seven days after spraying, UAV control efficacy continued to improve, further narrowing the gap with boom sprayers. T40 achieved the highest efficacy (91.55%), nearly comparable to boom sprayers (93.36%). This suggests that, over longer periods, UAVs can achieve control efficacy equivalent to traditional boom sprayers. Additionally, the data showed that T40, T50, and T60 had significantly higher control efficacy than T30. This is because T40, T50, and T60 generated stronger wind fields, with rotor downwash airflow carrying more droplets to leaf abaxial surfaces. Enhanced droplet penetration improved the pesticide contact with aphids on the backsides of leaves, which improved the control efficacy.
Table 6.
Effect of UAV wind field on aphid control efficacy.
As demonstrated in Table 7, UAVs achieved defoliation rates comparable to single spraying by boom sprayers at 10 days after spraying. Notably, the limited canopy penetration of UAV-sprayed harvest aids hindered the defoliation efficacy, however, the second spraying significantly improved this outcome, with defoliation rates exceeding 93% by 20 days after spraying. Surveys conducted 5 and 7 days after spraying showed that T40, T50, and T60 significantly exhibited a higher defoliation rate than T30, likely because T30’s weaker rotor downwash airflow hindered droplet deposition and canopy penetration, leading to lower defoliation. However, no significant differences were observed in the defoliation among all treatments at 10 days after spraying.
Table 7.
Effect of UAV wind field on defoliation.
The results presented in Table 8 showed that boll opening rates at 5 and 7 days after boom sprayer spraying were higher than those of UAVs, possibly due to more uniform pesticide distribution on cotton plants by boom sprayers, facilitating better absorption of ethephon ripening agents. However, after the second spraying with UAVs, boll opening rates between UAVs and boom sprayers became statistically indistinguishable, with both methods achieving boll opening rates exceeding 90.0% 20 days after spraying. No significant differences in boll opening rates were observed among T30, T40, T50, and T60 at 5, 7, 10, 15, and 20 days after spraying. Boll opening rates were primarily influenced by the natural growth of cotton plants, and both the UAV and the boom sprayer application achieved satisfactory results in terms of boll opening efficacy.
Table 8.
Effect of UAV wind field on boll opening.
4. Conclusions
This study has investigated the effects of UAV wind fields on droplet deposition and penetration within the cotton canopies and further evaluated the impact of these wind fields on spraying efficacy after measuring the pesticide utilization rate and control efficacy. The findings revealed that, under identical flight parameters, stronger wind fields generated by UAVs significantly enhanced the droplet coverage, density, and deposition in the middle and lower cotton canopy, thereby improving droplet penetration rates through the cotton canopy. The pesticide utilization rate of UAV spraying (75.47–77.86%) was significantly higher than that of traditional boom sprayers, demonstrating a 32.2% increase. Although the UAVs initially exhibited lower control efficacy against cotton aphids compared to boom sprayers, the application of stronger UAV wind fields improved both the aphid control and defoliation efficacy.
Future research prospects could focus on expanding the application of UAV-based pesticide spraying to diverse crop species beyond cotton, aiming to understand the adaptability of UAV-generated wind fields across varied canopy architectures—such as dense orchards, tall cereal crops, or delicate vegetable canopies. This would enable the development of crop-specific spraying protocols to maximize deposition efficiency in different agricultural systems. Additionally, integrating advanced sensing technologies (e.g., LiDAR, multispectral cameras) and machine learning algorithms to create intelligent UAV systems capable of real-time adaptive adjustments to flight parameters (e.g., altitude, speed, nozzle pressure) and spraying strategies based on dynamic canopy morphology and environmental variables (e.g., wind velocity, temperature) is critical. Such innovations would enhance precision in pesticide delivery and reduce over-spraying in complex field scenarios.
Furthermore, long-term ecological and environmental impact assessments of UAV spraying are essential to ensure sustainability. This includes evaluating pesticide residue dynamics in soil and water systems, assessing potential risks to non-target organisms (e.g., pollinators, beneficial insects), and quantifying the carbon footprint of UAV operations compared to traditional methods. Exploring hybrid approaches that combine UAV technology with ground-based robotic platforms or precision agriculture tools could also address challenges in heterogeneous fields, improving overall resource efficiency and reducing operational costs. By addressing these research gaps, the development of standardized, environmentally friendly UAV spraying protocols can be advanced, contributing to global sustainable pest management and smart agriculture practices.
Author Contributions
X.H. and H.L. conceived and designed the experiments, H.L., Y.L., M.Z., L.Y., Z.G. and Y.Y. performed the experiments and analyzed the data, X.H. and H.L. wrote the paper, M.Z., G.Z. and C.W. revised the manuscript. All authors have read and agreed to the published version of the manuscript.
Funding
This work was supported by the Major Science and Technology Projects of the Xinjiang Uygur Autonomous Region (2023A02009).
Data Availability Statement
All original contributions discussed in this research are fully elaborated within the manuscript; additional queries should be addressed to the corresponding author.
Conflicts of Interest
The authors declare no conflicts of interest.
References
- Wang, X.N.; Liu, Y.P.; Wang, S.L.; Wang, S.W. Effects of Spray Adjuvants on Droplet Deposition Characteristics in Litchi Trees under UAV Spraying Operations. Agronomy 2024, 14, 2125. [Google Scholar] [CrossRef]
- Raouhi, E.M.; Lachgar, M.; Hrimech, H.; Kartit, A. Unmanned Aerial Vehicle-Based Applications in Smart Farming: A Systematic Review. Int. J. Adv. Comput. Sci. Appl. 2023, 14, 1150–1165. [Google Scholar] [CrossRef]
- Shaikh, F.K.; Karim, S.; Zeadally, S.; Nebhen, J. Recent Trends in Internet-of-Things-Enabled Sensor Technologies for Smart Agriculture. IEEE Internet Things J. 2022, 9, 23583–23598. [Google Scholar] [CrossRef]
- Delavarpour, N.; Koparan, C.; Zhang, Y.; Steele, D.D.; Betitame, K.; Bajwa, S.G.; Sun, X. A Review of the Current Unmanned Aerial Vehicle Sprayer Applications in Precision Agriculture. J. ASABE 2023, 66, 703–721. [Google Scholar] [CrossRef]
- Nahiyoon, S.A.; Ren, Z.; Wei, P.; Li, X.; Li, X.; Xu, J.; Yan, X.; Yuan, H. Recent Development Trends in Plant Protection UAVs: A Journey from Conventional Practices to Cutting-Edge Technologies—A Comprehensive Review. Drones 2024, 8, 457. [Google Scholar] [CrossRef]
- Hu, P.; Zhang, R.R.; Yang, J.X.; Chen, L.P. Development Status and Key Technologies of Plant Protection UAVs in China: A Review. Drones 2022, 6, 354. [Google Scholar] [CrossRef]
- Rajesh, P.; Mohankumar, A.P.; Kavitha, R.; Suthakar, B.; Ganesan, K. Optimizing the impact of spray characteristics of hybrid drone on spray deposition in cotton crops. Curr. Sci. 2024, 127, 297–306. [Google Scholar] [CrossRef]
- Eun, H.R.; Kim, S.H.; Lee, Y.H.; Kim, S.M.; Lee, Y.J.; Yung, H.Y.; Min, Y.G.; Noh, H.H.; Shin, Y. Comparison of off-target pesticide drift in paddy fields from unmanned aerial vehicle spraying using cellulose deposition sampler. Ecotoxicol. Environ. Saf. 2024, 285, 117075. [Google Scholar] [CrossRef]
- Yallappa, D.; Kavitha, R.; Surendrakumar, A.; Suthakar, B.; Kumar, A.P.; Kalarani, M.K.; Kannan, B. Effect of downwash airflow distribution of multi-rotor unmanned aerial vehicle on spray droplet deposition characteristics in rice crop. Curr. Sci. 2023, 125, 172–182. [Google Scholar] [CrossRef]
- Zhu, Y.Z.; Guo, Q.W.; Tang, Y.; Zhu, X.; He, Y.; Huang, H.S.; Luo, S.M. CFD simulation and measurement of the downwash airflow of a quadrotor plant protection UAV during operation. Comput. Electron. Agric. 2022, 201, 107286. [Google Scholar] [CrossRef]
- Guo, Q.; Zhu, Y.; Tang, Y.; Hou, C.; Fang, M.; Chen, X. Numerical Simulation of the Effects of Downwash Airflow and Crosswinds on the Spray Performance of Quad-Rotor Agricultural UAVs. Smart Agric. Technol. 2025, 11, 100940. [Google Scholar] [CrossRef]
- Li, X.; Giles, D.K.; Andaloro, J.T.; Long, R.; Lang, E.B.; Watson, L.J.; Qandah, I. Comparison of UAV and fixed-wing aerial application for alfalfa insect pest control: Evaluating efficacy, residues, and spray quality. Pest Manag. Sci. 2021, 77, 4980–4992. [Google Scholar] [CrossRef] [PubMed]
- Martin, D.E.; Latheef, M.A. Payload Capacities of Remotely Piloted Aerial Application Systems Affect Spray Pattern and Effective Swath. Drones 2022, 6, 205. [Google Scholar] [CrossRef]
- Guo, Q.W.; Zhu, Y.Z.; Tang, Y.; Hou, C.J.; He, Y.; Zhuang, J.J.; Zheng, Y.L.; Luo, S.M. CFD simulation and experimental verification of the spatial and temporal distributions of the downwash airflow of a quad-rotor agricultural UAV in hover. Comput. Electron. Agric. 2020, 172, 105343. [Google Scholar] [CrossRef]
- Pachuta, A.; Berner, B.; Chojnacki, J.; Moitzi, G.; Dvořák, J.; Keutgen, A.; Najser, J.; Kielar, J.; Najser, T.; Mikeska, M. Propellers Spin Rate Effect of a Spraying Drone on Quality of Liquid Deposition in a Crown of Young Spruce. Agriculture 2023, 13, 1584. [Google Scholar] [CrossRef]
- Li, J.Y.; Lan, Y.B.; Wang, J.W.; Chen, S.D.; Yao, W.X.; Huang, C.; Liu, Q.; Liang, Q.P. Distribution law of rice pollen in the wind field of small UAV. Int. J. Agric. Biol. Eng. 2017, 10, 32–40. [Google Scholar]
- Tang, Q.; Zhang, R.R.; Chen, L.P.; Xu, M.; Yi, T.C.; Zhang, B. Droplets movement and deposition of an eight-rotor agricultural UAV in downwash flow field. Int. J. Agric. Biol. Eng. 2017, 10, 47–56. [Google Scholar]
- Guo, Q.W.; Huang, F.; Hou, C.J.; Zhuang, J.J.; Huang, H.S.; Tan, Z.P.; Fang, M.W.; Tang, Y. Numerical simulation and validation of downwash airflow during dual-aircraft collaborative operations of quad-rotor agricultural UAVs. Measurement 2025, 247, 116782. [Google Scholar] [CrossRef]
- Liu, Z.; Gao, R.; Zhao, Y.; Wu, H.; Liang, Y.; Liang, K.; Liu, D.; Huang, T.; Xie, S.; Lv, J.; et al. Study on the Characteristics of Downwash Field Range and Consistency of Spray Deposition of Agricultural UAVs. Agriculture 2024, 14, 931. [Google Scholar] [CrossRef]
- Shi, Q.; Pan, Y.; He, B.; Zhu, H.; Liu, D.; Shen, B.; Mao, H. The Airflow Field Characteristics of UAV Flight in a Greenhouse. Agriculture 2021, 11, 634. [Google Scholar] [CrossRef]
- Chojnacki, J.; Pachuta, A. Impact of the Parameters of Spraying with a Small Unmanned Aerial Vehicle on the Distribution of Liquid on Young Cherry Trees. Agriculture 2021, 11, 1094. [Google Scholar] [CrossRef]
- Martin, D.E.; Woldt, W.E.; Latheef, M.A. Effect of Application Height and Ground Speed on Spray Pattern and Droplet Spectra from Remotely Piloted Aerial Application Systems. Drones 2019, 3, 83. [Google Scholar] [CrossRef]
- Tang, Y.; Fu, Y.Q.; Guo, Q.W.; Huang, H.S.; Tan, Z.P.; Luo, S.M. Numerical simulation of the spatial and temporal distributions of the downwash airflow and spray field of a co-axial eight-rotor plant protection UAV in hover. Comput. Electron. Agric. 2023, 206, 107634. [Google Scholar] [CrossRef]
- Yallappa, D.; Kavitha, R.; Surendrakumar, A.; Balaji, K.; Suthakar, B.; Kumar, A.P.M.; Ravi, Y.; Ashoka, A.; Kavan, K. Downwash airflow distribution pattern of hexa-copter unmanned aerial vehicles. Int. J. Agric. Biol. Eng. 2024, 17, 24–34. [Google Scholar]
- Zhang, H.; Qi, L.J.; Wu, Y.L.; Cheng, Z.Z.; Liu, G.G.; Elizabeth, M.; Xiao, Y.; Yang, Z.P. Distribution characteristics of rotor downwash airflow field under spraying on orchard using unmanned aerial vehicle. Trans. CSAE 2019, 35, 44–54. [Google Scholar]
- Kumar, S.P.; Jat, D.; Sahni, R.K.; Jyoti, B.; Kumar, M.; Subeesh, A.; Parmar, B.S.; Mehta, C.R. Measurement of droplets characteristics of UAV based spraying system using imaging techniques and prediction by GWO-ANN model. Measurement 2024, 234, 114759. [Google Scholar] [CrossRef]
- Grant, S.; Perine, J.; Abi-Akar, F.; Lane, T.; Kent, B.; Mohler, C.; Scott, C.; Ritter, A. A Wind-Tunnel Assessment of Parameters That May Impact Spray Drift during UAV Pesticide Application. Drones 2022, 6, 204. [Google Scholar] [CrossRef]
- Li, H.Z.; Zhu, H.; Jiang, Z.H.; Lan, Y.B. Performance characterization on downwash flow and spray drift of multirotor unmanned agricultural aircraft system based on CFD. Int. J. Agric. Biol. Eng. 2022, 15, 1–8. [Google Scholar] [CrossRef]
- Shi, Q.; Liu, D.; Mao, H.P.; Shen, B.G.; Li, M.Q. Wind-induced response of rice under the action of the downwash flow field of a multi-rotor UAV. Biosyst. Eng. 2021, 203, 60–69. [Google Scholar] [CrossRef]
- Duan, L.; Fang, Z.H.; Dou, Z.C.; Liu, Y.P.; Wen, M.K.; Hou, T.Y.; Han, X.Q. The Relationship Between Droplet Density and the Defoliation Effect of Cotton Harvest Aids. ACS Omega 2024, 9, 16486–16495. [Google Scholar] [CrossRef]
- NY/T 3630.1-2020; Technical Methodology of Determining Pesticide Utilization Rate in FIELD-PART 1: Technical Methodology of Determining Pesticide Deposition Rate by Foliar Spray in Field Crop—Allura Red as a Tracer. China Agricultural Press: Beijing, China, 2020.
- Hussain, M.; Wang, Z.; Huang, G.; Mo, Y.; Kaousar, R.; Duan, L.; Tan, W. Comparison of Droplet Deposition, 28-Homobrassinolide Dosage Efficacy and Working Efficiency of the Unmanned Aerial Vehicle and Knapsack Manual Sprayer in the Maize Field. Agronomy 2022, 12, 385. [Google Scholar] [CrossRef]
- Emanuele, C.; Sebastian, L.; Luciano, C.; Salvatore, P.; Giuseppe, M. Shape descriptor analysis of droplet stains on water sensitive papers. Smart Agric. Technol. 2025, 11, 2772–3755. [Google Scholar]
- Mseddi, J.; Farhat-Touzri, D.B.; Azzouz, H. Selection and characterization of thermotolerant Beauveria bassiana isolates and with insecticidal activity against the cotton-melon aphid Aphis gossypii (Glover) (Hemiptera: Aphididae). Pest Manag. Sci. 2022, 78, 2183–2195. [Google Scholar] [CrossRef]
- Martin, D.E.; Perine, J.W.; Grant, S.; Abi-Akar, F.; Henry, J.L.; Latheef, M.A. Spray Deposition and Drift as Influenced by Wind Speed and Spray Nozzles from a Remotely Piloted Aerial Application System. Drones 2025, 9, 66. [Google Scholar] [CrossRef]
- Ding, W.M.; Ding, S.M.; Fu, X.M.; Zhou, L.F.; Chen, J. Design and experiment of combined disc air-assisted orchard sprayer. Trans. Chin. Soc. Agric. Eng. 2015, 31, 64–71. [Google Scholar]
- Martin, D.E.; Latheef, M.A. Aerial Electrostatic Spray Deposition and Canopy Penetration in Cotton. J. Electrost. 2017, 90, 38–44. [Google Scholar] [CrossRef]
- Ranabhat, S.; Price, R. Effects of Flight Heights and Nozzle Types on Spray Characteristics of Unmanned Aerial Vehicle (UAV) Sprayer in Common Field Crops. AgriEngineering 2025, 7, 22. [Google Scholar] [CrossRef]
Disclaimer/Publisher’s Note: The statements, opinions and data contained in all publications are solely those of the individual author(s) and contributor(s) and not of MDPI and/or the editor(s). MDPI and/or the editor(s) disclaim responsibility for any injury to people or property resulting from any ideas, methods, instructions or products referred to in the content. |
© 2025 by the authors. Licensee MDPI, Basel, Switzerland. This article is an open access article distributed under the terms and conditions of the Creative Commons Attribution (CC BY) license (https://creativecommons.org/licenses/by/4.0/).