Article

Comparative Nutrient Study of Raphanus sativus L. Sprouts Microgreens, and Roots

by
Dominika Kajszczak
1,*,
Dorota Sosnowska
1,
Radosław Bonikowski
2,
Kamil Szymczak
2,
Barbara Frąszczak
3,
Katarzyna Pielech-Przybylska
4 and
Anna Podsędek
1
1
Institute of Molecular and Industrial Biotechnology, Faculty of Biotechnology and Food Sciences, Lodz University of Technology, Stefanowskiego 2/22, 90-537 Łódź, Poland
2
Institute of Natural Products and Cosmetics, Faculty of Biotechnology and Food Sciences, Lodz University of Technology, Stefanowskiego 2/22, 90-537 Łódź, Poland
3
Department of Vegetable Crops, Poznań University of Life Sciences, Dąbrowskiego 159, 60-594 Poznań, Poland
4
Institute of Fermentation Technology and Microbiology, Faculty of Biotechnology and Food Sciences, Lodz University of Technology, Stefanowskiego 2/22, 90-537 Łódź, Poland
*
Author to whom correspondence should be addressed.
Agronomy 2025, 15(5), 1216; https://doi.org/10.3390/agronomy15051216 (registering DOI)
Submission received: 16 April 2025 / Revised: 7 May 2025 / Accepted: 15 May 2025 / Published: 17 May 2025
(This article belongs to the Section Horticultural and Floricultural Crops)

Abstract

:
Radish (Raphanus sativus L.) is an important vegetable crop worldwide. Four red radish cultivars (Carmen, Jutrzenka, Saxa 2, and Warta) were evaluated for their macronutrients (protein, fat, available carbohydrates), as well as ash, and dietary fiber at the sprout, microgreen, and mature (root) stages. Fatty acids, organic acids, and sugars were also profiled by using chromatographic methods. Radish roots are characterized by a good chemical composition due to a lower fat content, lower energy value, and higher available carbohydrate content compared to sprouts and microgreens. Microgreens outperformed other forms of radish in terms of organic acids, ash, and soluble dietary fiber, while sprouts contained the most protein. Both immature forms of radish proved to be better sources of fiber than their mature roots. In all radish samples analyzed, glucose, oxalic acid, and oleic acid or alpha-linolenic acid were the dominant sugar, organic acid, and fatty acid, respectively. The results indicate a diverse composition of radish sprouts, microgreens, and roots, and confirm the validity of using red radishes in various forms as valuable components of our diet.

1. Introduction

Radishes (Raphanus sativus L.) are a member of the Brassicaceae family and are a common crop in many parts of the world with edible roots, leaves, and seeds. Roots are the most eaten part of radish. They have large variations in colors, including white, yellow, green, red, pink, purple, and black. Most have a white interior, but some have colored flesh. They are also characterized by different shapes (e.g., round, cylindrical) and sizes. Radish has a very short period of vegetation (about 30 days), which makes it suitable for growing several times a year. Radish roots are eaten raw, and are also pickled, baked, and added to stir-fries [1,2,3]. In addition, radish sprouts and microgreens can be consumed in fresh form at all times of the year. They have become more popular worldwide because of their nutritional value and health advantages, and can play an important role in dietary diversity. Sprouts and microgreens offer the possibility of using soilless cultivation, have minimal space requirements, can be adapted to a controlled indoor cultivation system, and do not require phytosanitary treatments and fertilization [4]. Moreover, they can be produced indoors or outdoors by the consumers themselves. Sprouts and microgreens are used in many ways, i.e., as additives to salads, drinks, soups, and sandwiches [5,6]. Sprouts are harvested when the cotyledons are still underdeveloped and true leaves have not begun to emerge, and they usually ripen in less than a week. The entire plant (root, seed, and shoot) is consumed. Microgreens are larger than sprouts, have a central stem with two fully developed, non-senescent cotyledon leaves, and mostly one pair of small true leaves. They are usually harvested from 7 to 21 days after germination and consumed without root and seed [6].
During the last decades, the root and leaf of mature radish, as well as radish sprouts and microgreens, have received considerable research attention due to their association with health-promoting properties, including antioxidant, anticancer, antimicrobial, antidiabetic, hepatoprotective, gastroprotective, cardioprotective, immune-protective, and nephroprotective effects [1,7,8,9,10,11,12,13,14]. The observed beneficial health effects were mainly associated with phytochemicals such as glucosinolates and their hydrolysis compounds (isothiocyanates), ascorbic acid, and phenolic compounds. Despite numerous studies on the composition of bioactive compounds and the biological activity of radish, there is little research from the last decade on the content of basic nutrients in roots [15,16,17,18,19,20,21], sprouts [13,22,23], and microgreens [13,24,25,26,27]. Macronutrients, i.e., proteins, lipids, and carbohydrates, are a major source of energy in the human diet. Some other compounds, i.e., moisture, ash, and fibers, are also reported for human health [28]. Radish, among root vegetables and brassica vegetables, is characterized by the lowest caloric value (16 kcal/100 g), total proteins (0.57–0.68%), lipids (0.01–0.1%), carbohydrates (3.0–3.4%), and dietary fiber (0.32–1.6%) [1,29]. Additionally, radish microgreens showed the highest nutrient density among ten culinary microgreens species [19]. Moreover, previous research has focused on selected nutrients and does not consider cultivar differences. Only a few studies have compared the macronutrient content of different cultivars of radish sprouts [22], microgreens [25,26], and roots [15,16,30], respectively.
It should be emphasized that only a few studies have compared the chemical composition of vegetables at different stages of development [3,31,32,33,34]. Regarding radish, its sprouts contained significantly greater amounts of glucosinolates and isothiocyanates than the mature radish root of eight cultivars, while anthocyanin content was significantly greater in the roots [3]. Contrary to this, mature radish roots were found to be a significantly higher source for antioxidants and some minerals (Cu, Mn, and Fe) than microgreens [33]. Additionally, to the authors’ knowledge, the studies comparing changes in the basic composition between radish sprouts, microgreens, and roots are very limited. Wojdyło et al. [13] demonstrated lower contents of soluble solids, organic acids, sugars, free amino acids, and L-ascorbic acid in commercial microgreens than in sprouts, but comparable amounts of ash. Therefore, the compositional data for radish requires updating. The objective of this work was to characterize sprouts, microgreens, and roots of four red radish cultivars, highlighting the content of basic nutrients to promote their applications as natural, healthy foods. This type of comparative research has not been conducted so far.

2. Materials and Methods

2.1. Chemicals, Standards, and Equipment

The reagents used were hydrogen chloride, sulphuric acid, sodium hydroxide, boric acid, glacial acetic acid, petroleum ether, n-hexane, and ethanol from Chempur (Piekary Śląskie, Poland), protease from Bacillus licheniformis (≥2.4 U/g), anthrone, 3,5-dimethylphenol from Sigma-Aldrich (Steinheim, Germany), and acetonitrile, trimethylamine, methyl nonanoate, and trimethylsulfonium hydroxide solution (TMSH) from Merck (Darmstadt, Germany). Reference compounds, such as fructose, glucose, and sucrose, and acids, such as galacturonic, citric, fumaric, malic, oxalic, quinic, succinic, and tartaric, were obtained from Sigma-Aldrich (Steinheim, Germany). All reagents and chemicals were of analytical grade and prepared by using high-purity deionized water (Milli-Q Ultrapure Water SystemCorp., Bedford, MA, USA). A freeze dryer (Martin Christ, Alpha 1-2/LD, Osterode am Harz, Germany), rotary evaporator (Rotavapor R-3, Büchi, Flavil, Switzerland), Kjeldahl (Büchi India Pvt., Flavil, Switzerland), Automated Distillation Apparatus, and spectrophotometer Metertech SP-830 Plus (Medson S.c., Paczkowo, Poland) were used for analysis.

2.2. Plant Material

Four radish cultivars were used as experimental planting material. The seeds of these cultivars were obtained from a commercial source (“W. Legutko” Company, Jutrosin, Poland). The Carmen cultivar produces large, spherical, red roots and is a medium-early cultivar with a mild flavor. It maintains its consumption value for a long time. The Jutrzenka cultivar produces egg-shaped, pink roots. The flesh is white and has a mild taste. The Saxa cultivar forms spherical roots with a red color. It is an early, high-yielding cultivar. The Warta cultivar produces cylindrical scarlet-red roots with white, mild-tasting flesh. The plants were cultivated in the open field at the ‘Marcelin’ Research Station, Poznań University of Life Sciences, Poland. The seeds were sown using the line sowing method. The seeds were sown, maintaining plant spacing of 20 cm × 5 cm. The plants were collected thirty-five days after sowing.
Sprout cultivationbefore sowing, the seeds were pre-soaked in water at 30 °C for 2 h. The seeds were then drained and spread out on germination trays. The trays were corrugated and had a valve to drain excess water. The sprouts were grown in single-layer trays to ensure even access to light. Three trays were used for each cultivar, with the tray being a single replicate. Seeds and later sprouts were watered three times a day during growth. Cultivation took place in a vegetation camera under fully controlled conditions. For the first two days, the seeds germinated in the dark at 23 °C, then the temperature was lowered to 21 °C during the light period and 17 °C during the dark period. For the next four days, the sprouts were irradiated with white light at a PPFD of 100 µmol m−2 s−1 for a period of 16 h (day)/8 h (night). The daily light dose was approximately 5.8 mol m2. Harvesting was performed after six days of cultivation.
Microgreen cultivationmicrogreens were grown in 30 × 50 × 5 cm (7.5 L) microgreen trays placed on the tables in the growth chambers. Seeds were sown at 3 g per tray. Four trays were sown for each cultivar (one trayone replicate). The plants were grown on Hartmanns universal substrate pH 5.5–6.5 ± 0.2 (in water) with the addition of PG Mix NPK 14:16:18 multi-nutrient fertilizer at 1.0–1.3 kg/m3 (±20%). After sowing, the seeds were covered with sand and generously sprinkled. During cultivation, the substrate was moistened every two days. The cultivation cycle ended when the microgreens developed their first true leaves (15 days after sowing). At harvest, the plants were cut with scissors just above the substrate. No pesticides or additional fertilizers were applied during cultivation. The plants were grown under controlled conditions in the growth chambers. During emergence, the temperature was 23 °C for the first three days, then 21/17 ± 2 °C (day/night). The relative humidity was 60–70%. The plants were cultivated under white LED light, and the photosynthetic photon flux density (PPFD) measured near the top of the plant was 230 ± 10 µmol m−2 s−1. The daily light dose was approximately 13.2 mol m2 with a 16 h photoperiod.
After harvesting, radish sprouts, microgreens, and roots (Figure 1) were washed with tap water, followed by weeping in air. Then, the plants were prone to freezing at −20 °C for 24 h and dried at −20 °C for 20 h under vacuum pressure of 0.03 Mbar, and final drying at 40 °C for 4 h (0.002 Mbar). After drying, the plants were milled into a fine powder in a domestic grinder and sealed in tight glass vessels in a laboratory cabinet without light for further analysis. Fresh plants were used only to determine the content of moisture and ash.

2.3. Moisture and Ash Content

Briefly, 2 g of fresh or 0.1 g of dried plant materials were dried at 105 °C to a constant weight. The moisture of the sample was calculated from the difference in the sample weight before and after drying. Then, the samples were placed in a muffle furnace and heated to 550 °C for 6 h. The ash content was calculated as the quotient of the mass of the sample after burning and the mass of the sample before drying, multiplied by 100.

2.4. Total Protein Content

The content of crude protein was determined using the Kjeldahl method, including digestion of the freeze-dried sample (200 mg) with 15 mL of concentrated sulfuric acid in the presence of a catalyst (selenium mixture) in a digestion block until it changes from a greenish to a clear and colorless solution. The blank sample was digested in parallel with the sample. The resulting solution was neutralized with 32% sodium hydroxide in the presence of a 1% solution of phenolphthalein, and the liberated ammonia was distilled into 20 mL of 4% boric acid with Tashiro’s indicator and then titrated against 0.1 M hydrogen chloride. The nitrogen content was multiplied by a factor of 6.25 to estimate the protein content.

2.5. Crude Fat Content

The total crude fat content was determined by taking 1g of sample and extracting it with 350 mL of hexane (boiling point about 69 °C) using the Soxhlet apparatus for 4 h. The solvent was evaporated and then stored in a hot air oven at 105 °C for 30 min. The flask, after cooling, was weighed to determine the fat content [24].

2.6. Dietary Fiber Content

Total dietary fiber (DF) was determined as the sum of soluble (SDF) and insoluble (IDF) dietary fiber in the plant samples deprived of fat with chloroform, mono- and oligosaccharides with 80% ethanol, and protein with protease, according to Gouw et al. [35]. The content of soluble dietary fiber was the sum of uronic acids and neutral sugars determined by spectrophotometric method in the filtrate after acid hydrolysis of the samples. The insoluble dietary fiber concentration was evaluated as the sum of uronic acids and neutral sugars in the residue after acid hydrolysis of samples and the mass of Klason lignin. Lignin was quantified and gravimetrically reduced by the ash mass. Neutral sugars were determined by an anthrone reagent, while uronic acids were measured with a 3,5-dimethylphenol reagent, and their contents were expressed as glucose and galacturonic acid equivalents, respectively.

2.7. Available Carbohydrate Content and Energy Value

Available carbohydrates were calculated by difference [100 − (moisture + fat + protein + ash + total dietary fiber)] and expressed as g/100 g fresh weight. The energy value (kcal/100 g) was calculated using conversion factors: protein and available carbohydrates 4 kcal/g, fat 9 kcal/g, and total dietary fiber 2 kcal/g [36].

2.8. Extraction and Analysis of Sugars

Freeze-dried radish samples (0.4 g) with 20 mL of 80% ethanol were extracted in an ultrasonic bath for 10 min and centrifuged at 5000 rpm for 10 min. The extraction step was repeated four times with new portions of ethanol. Then, the supernatants were combined and filtered through syringe filters filled with regenerated cellulose (RC) with a pore size of 0.40 μm (Pureland, Chemland, Stargard, Poland). Individual sugars in supernatants were determined by the HPLC system with a refractive index (RI) detector (Waters Corp., Milford, MA, USA). Separation was achieved on an XBridge BEH Amide column (2.5 μm × 4.6 × 150 mm Column XP, Waters Corp., Milford, MA, USA) according to the procedure described by van Tran et al. [37]. The elution system was acetonitrile–water with 0.2% triethylamine (75:25 v/v), running isocratically at a flow rate of 1.4 mL/min. The column temperature was 35 °C. The sample injection was 10 μL, and the run time was 10 min. The parameters of the RI detector were a sampling rate of 10 points/s and a sensitivity of 8. Sugars were quantified from the refractive index peaks and, using calibration curves, performed with fructose, glucose, and sucrose standards. The results were expressed as grams of individual sugar per 100 g of fresh weight.

2.9. Extraction and Analysis of Organic Acids

Freeze-dried radish samples (0.3 g) with 2 mL of a 1% solution of meta-phosphoric acid were mixed for 2 min and centrifuged at 10,000 rpm for 10 min. The supernatant was filtered through syringe filters filled with regenerated cellulose (RC) with a pore size of 0.40 μm (Pureland, Chemland, Stargard, Poland). Individual organic acids in the supernatants were determined via the HPLC system with a photodiode array detector (Waters Corp., Milford, MA, USA). Separation was achieved on an ion exclusion Rezex ROA-Organic H+ column (300 × 7.8 mm, Phenomenex, Torrance, CA, USA) according to the procedure described by Aubert et al. [38]. The elution system was 0.005 N sulfuric acid, running isocratically at a flow rate of 0.5 mL/min. Organic acids were quantified from the absorbance peaks at 210 nm and using calibration curves performed with citric, fumaric, malic, oxalic, succinic, and tartaric acid standards. The results were expressed as mg of individual organic acid per 100 g of fresh weight.

2.10. Fatty Acid Composition

Fatty acids were determined after conversion to methyl esters. A 100 mg sample of crude fat obtained according to Section 2.5 was dissolved in 4 mL of tert-butyl methyl ether, and 1 mL was taken. An internal standard (methyl nonanoate) and 200 µL of TMSH (~0.25 M in methanol) were added to the solution. The sample was then incubated at 80 °C for 1 h. After the incubation period, analysis was performed using gas chromatography-mass spectrometry (GC-MS) on a Pegasus 4D system (Leco Corp., St. Joseph, MI, USA) equipped with an SP-2560 capillary column (length 100 m, internal diameter 0.25 mm, film thickness 0.2 µm). Helium was used as a carrier gas with a constant flow of 0.8 mL/min. The injector and the transfer line temperature were set at 250 °C. The column oven temperature program was as follows: from 140 °C (5 min) to 240 °C (30 min) at 4 °C/min. Electron ionization at 70 eV, with an ion source temperature of 200 °C. The mass range was set from 33 to 450 amu, with an acquisition rate of 50 spectra/s. Identification was carried out by comparing the obtained mass spectra with data from the Wiley Registry/NIST Mass Spectral Library and the Food, Flavors, Fragrances, and Related Compounds database, as well as by comparing retention times with those of standard compounds (Supelco 37 Component FAME Mix, Merck KGaA, Darmstadt, Germany).

2.11. Statistical Analysis

Data analysis was conducted using the Statistica 12.5 software (StatSoft, Kraków, Poland), with all measurements in triplicate and results shown as mean values with standard deviations (SDs). The results were expressed as grams per 100 g of fresh weight (FW). Analysis of variance (ANOVA) and Tukey’s post hoc test were used to evaluate differences among radish samples, identifying statistically significant differences at p < 0.05. A principal component analysis (PCA) was performed to compare the radish of four cultivars in the three different growth stages based on their chemical composition. All analyses were carried out using XLSTAT software 2024.1.0 (Lumivero, Denver, CO, USA).

3. Results and Discussion

3.1. Nutrient Composition of Radish Sprouts, Microgreens, and Roots

The content of moisture, total protein, crude fat, ash, and total dietary fiber, as well as calculated total available carbohydrates and energy value of the radish sprouts, microgreens, and roots, are listed in Table 1. The total protein, crude fat, and available carbohydrates in the analyzed radish forms differed significantly (p < 0.05). Water was the main component of all radish forms, with the content in the range 90.90–94.97%. Apart from that, all examined radish sprouts were dominated by protein (2.90–3.52 g/100 g), while roots were dominated by available carbohydrates (2.37–3.47 g/100 g). The microgreens cv. Carmen and Warta were predominated by dietary fiber (3.09 and 2.21 g/100 g, respectively) and cv. Jutrzenka and Saxa 2 by available carbohydrates (2.69 and 4.20 g/100 g, respectively). On the other hand, microgreens and roots were characterized by the lowest fat content (0.11–0.55 g/100 g), while sprouts contained the least amount of ash (0.56–0.82 g/100 g), except for sprouts cv. Warta, which had the lowest available carbohydrate content. Our results indicate a similar amount of total dietary fiber and a higher content of protein, fat, and ash in sprouts than in the other tested small radish and radish sprouts by Zieliński et al. [39]. In comparison to the published results, the radish microgreens were characterized by lower or similar protein content, higher ash content, and comparable levels of crude fat and total dietary fiber [13,19,26,40]. Furthermore, in this study, comparable protein, fat, and ash contents were found in the radish roots to those reported by Goyeneche et al. [21] and Knez et al. [29]. In turn, the radish roots examined by Goyeneche et al. [21] contained a similar total fiber content, while those analyzed by Knez et al. [29] were as much as five times poorer in this component. It should be emphasized that none of the cited works examined different radish cultivars. Lu et al. [30] observed wide variation in the content of nutrients among different radish genotypes. The protein concentration in forty-two Chinese radish cultivars ranged from 0.034 to 0.12 g/100 g, while the crude fiber content ranged from 0.45 to 1.85 g/100 g. The analysis of six radish varieties, including white, red, and green, showed large differences in protein (about 6-fold), fat (8-fold), and carbohydrate (4-fold) contents [15].
To the best of our knowledge, no studies have compared the nutrient content of sprouts, microgreens, and radish roots. Generally, the results of this study indicate a significant decrease in total protein and crude fat content in microgreens and roots compared to sprouts. On the contrary, the amount of available carbohydrates was lowest in sprouts. Drozdowska et al. [41] showed a 2- and 3-fold reduction in the content of protein and fat, respectively, but a 3.5-fold increase in the amount of digestible carbohydrates in mature five-month-old red cabbage compared to fourteen-day-old young shoots. Furthermore, the authors observed a more than 2-fold reduction in ash content and no change in dietary fiber content. In our studies, we found an almost 2-fold decrease in the amount of ash and dietary fiber in the radish roots after 35 days of cultivation compared to fifteen-day-old microgreens. In addition, the ash content in radish sprouts and roots was similar, and sprouts contained a lower or higher concentration of dietary fiber than microgreens or roots, respectively.
The comparison of the nutrient composition of the sprouts, microgreens, and roots of the analyzed radish cultivars does not allow any clear conclusions to be drawn. Only in a few cases were statistically significant differences (p < 0.05) found between sprouts, microgreens, and roots grown from the seeds of four radish cultivars. For example, the sprouts of the Carmen cultivar statistically contained the least ash, while the sprouts of the Warta cultivar contained the most. In the analyzed microgreens, the Saxa 2 radish cultivar stood out due to its statistically higher content of ash and available carbohydrates, and the lowest concentration of dietary fiber and fat. Statistically significant cultivar differences in the case of radish roots were observed only for dietary fiber content.
The analyzed forms of radish differed significantly (p < 0.05) in terms of energy value. The radish sprouts had the highest total calories (29.14–37.86 kcal/100 g) due to their high fat, protein, and available carbohydrate contents (Table 1). Among the analyzed radish cultivars and forms, the most energy would be provided by the sprouts cv. Saxa 2 and cv. Jutrzenka, microgreens cv. Saxa 2, and roots cv. Jutrzenka. On the contrary, the lowest calories were found in the cv. Carmen sprouts and microgreens, and the roots of the Saxa 2 cultivar. Statistically significant differences in each radish assortment occurred only for the sprouts of the Warta cultivar, microgreens of the Saxa 2 and Warta cultivars, and among the roots of the Jutrzenka cultivar. A similar energy value was found in radish microgreens by Kawitchoren et al. [26] and in roots by Knez et al. [29]. It should be noted that, in the cited publications, energy value was estimated based on the content of protein, fat, and carbohydrates, and may be overestimated due to the presence of dietary fiber in the latter. The Food and Agriculture Organization of the United Nations (FAO) recommends that the energy provided by fermentation of dietary fiber, which is about 8 kJ/g (1.91 kcal), should also be included in the calculation of total energy [36]. The value of about 2 kcal/g is because about 70% of the dietary fiber is fermented in the colon, and that part of the energy produced by this process is lost as gas and in the feces.

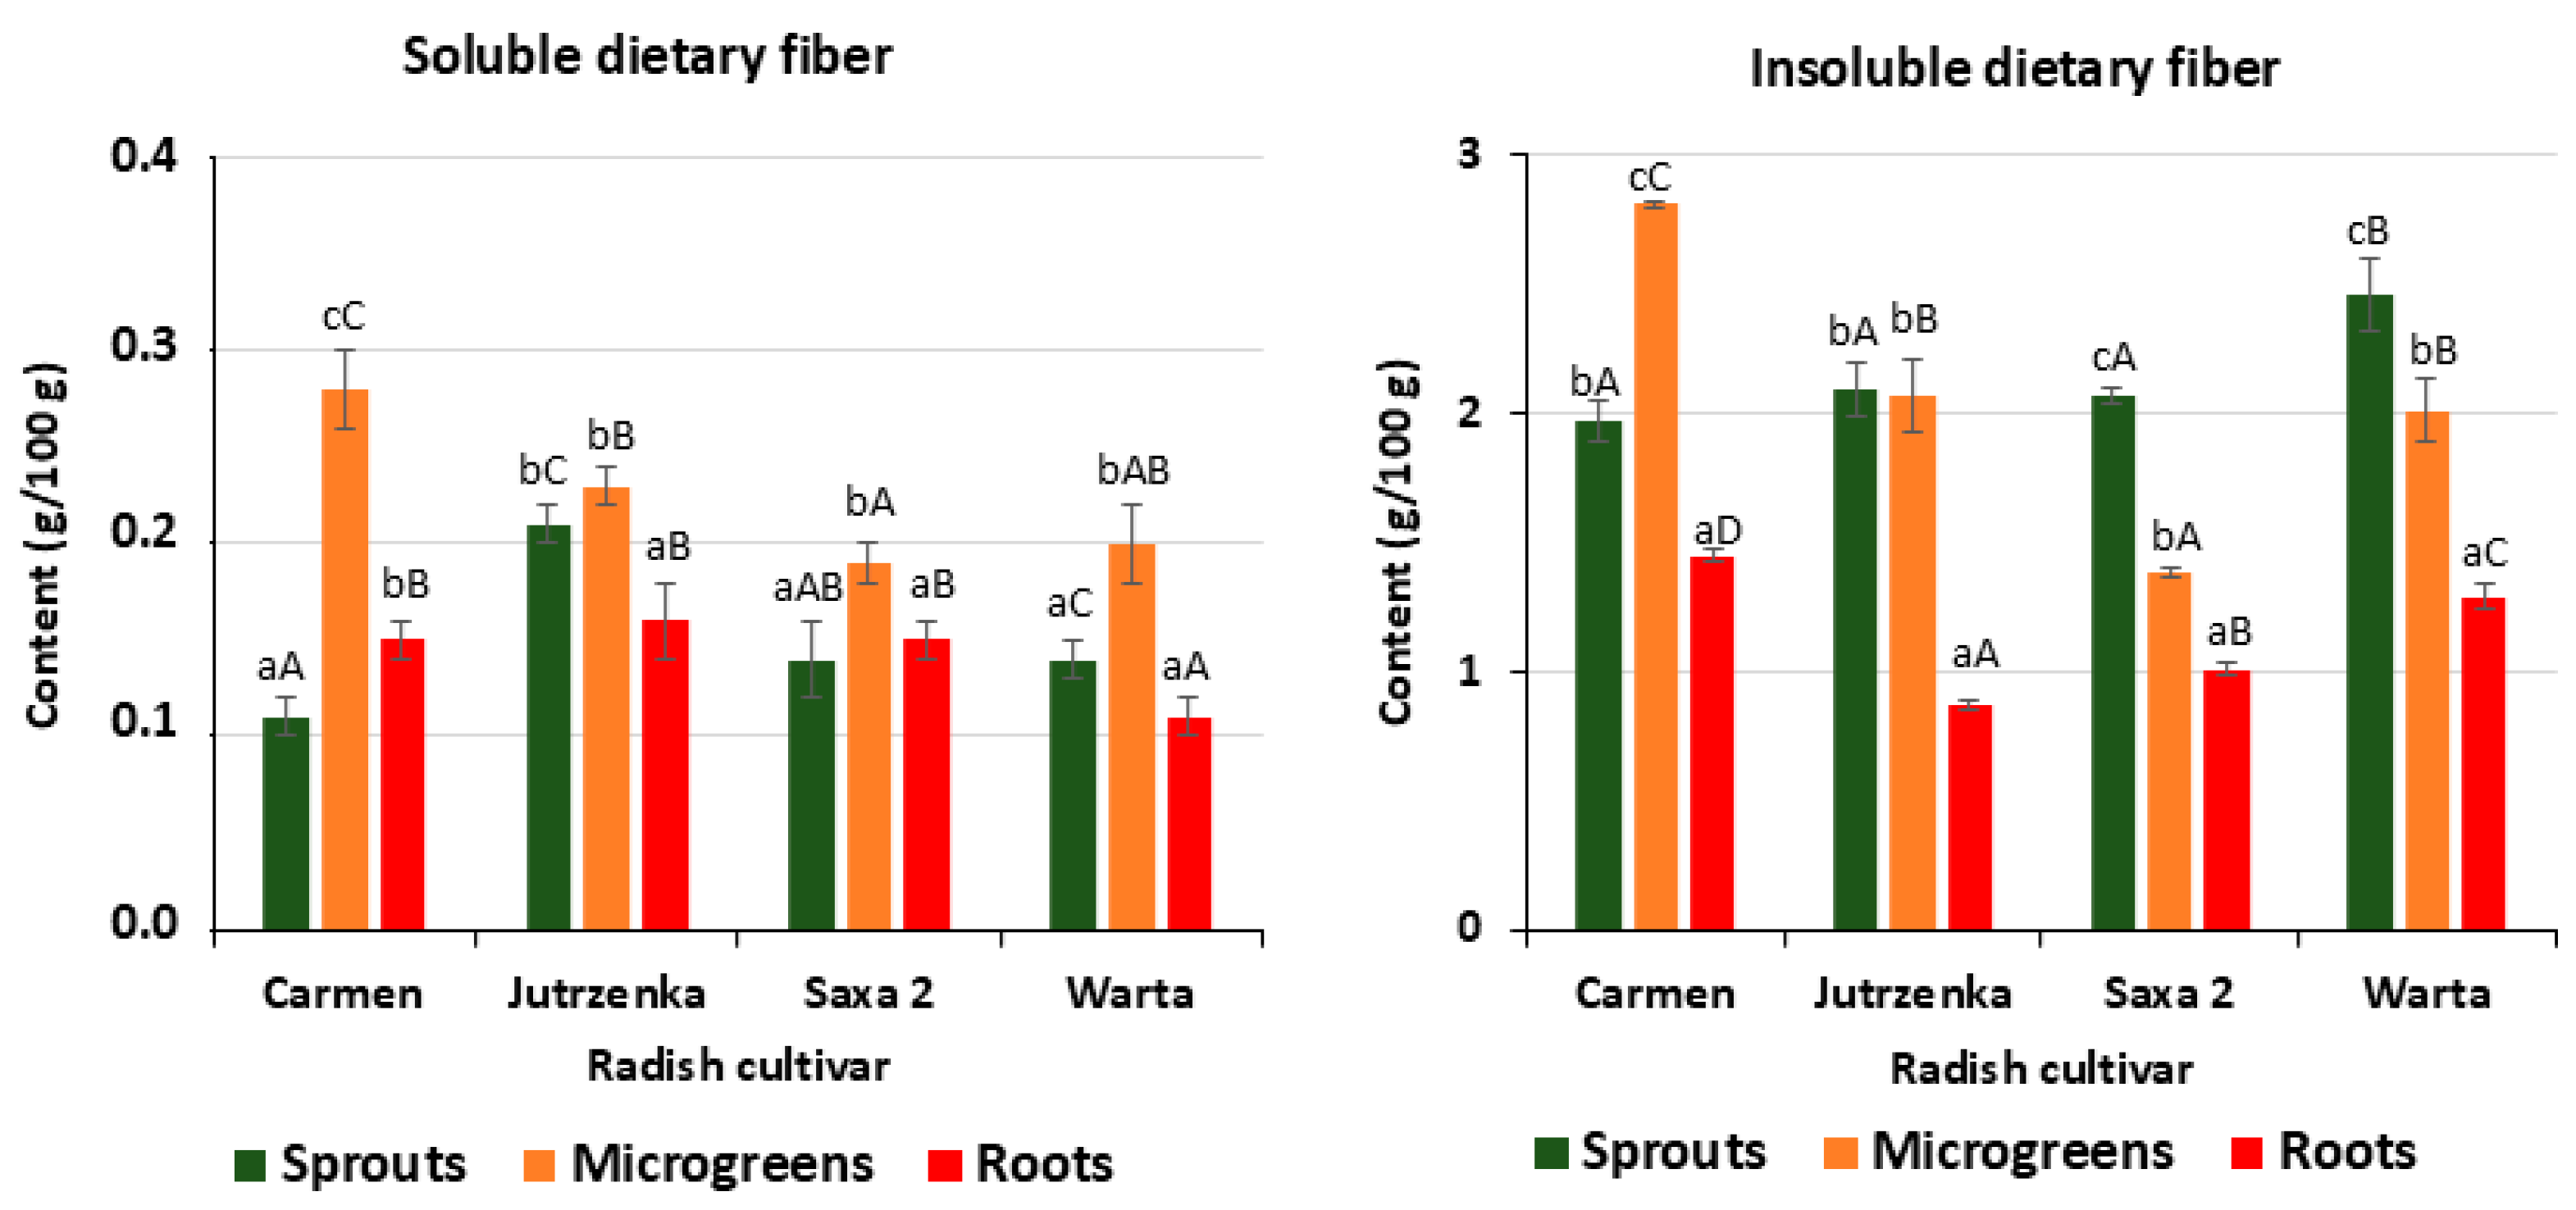
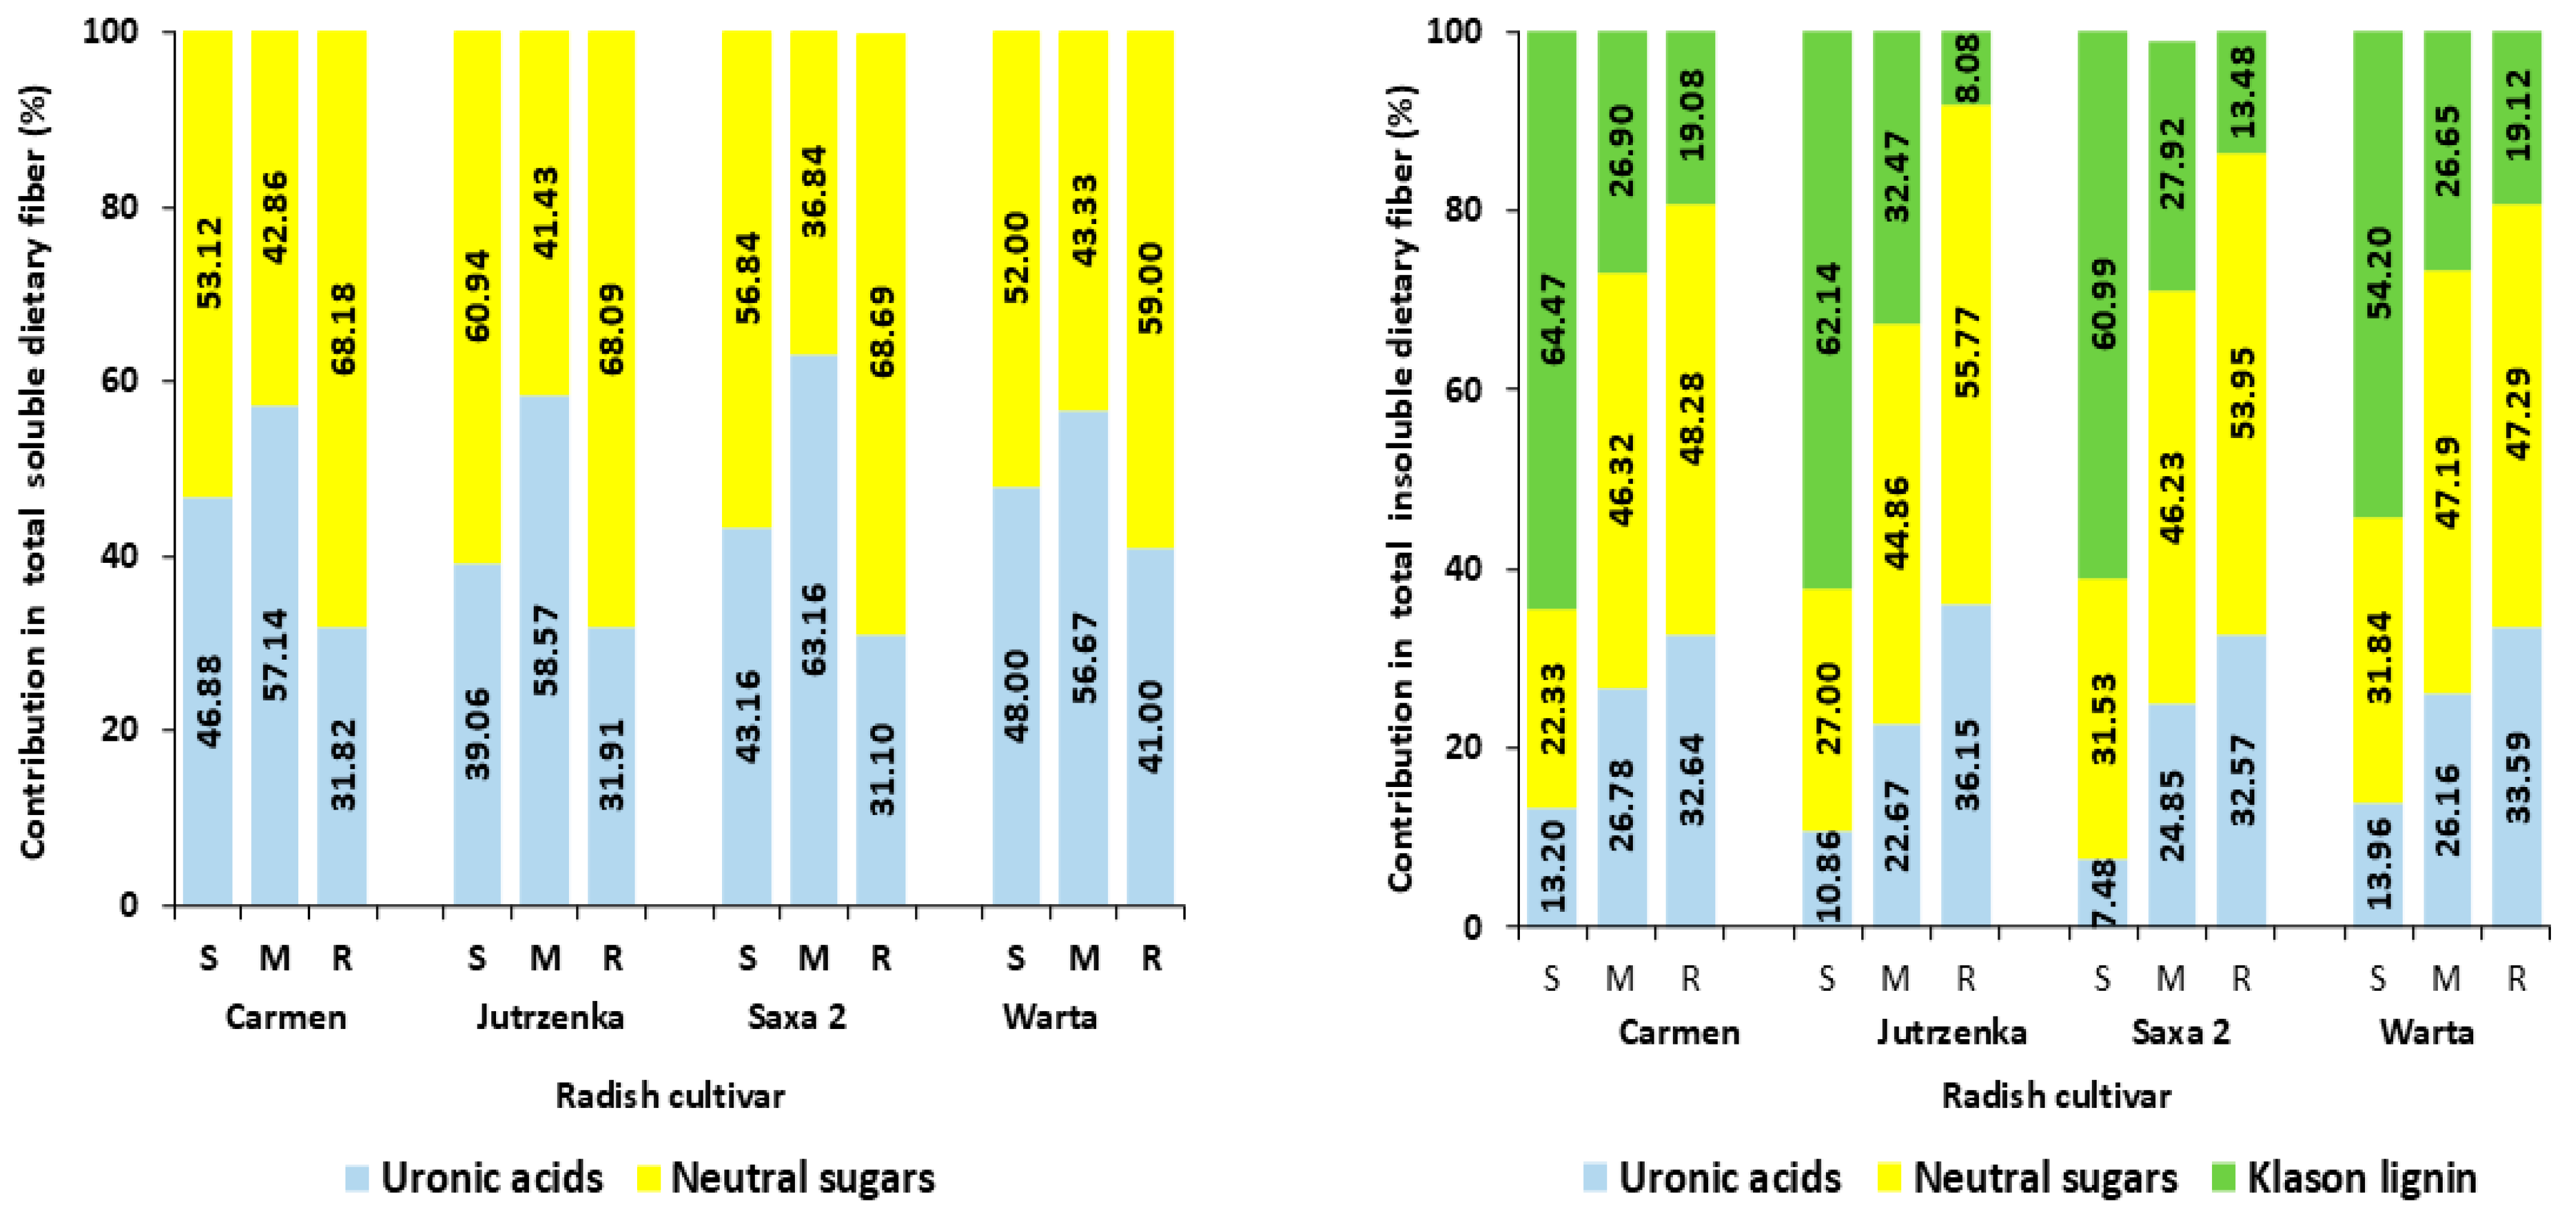
3.2. Composition of Dietary Fiber

A healthy human diet should provide about 25–35 g of fiber per day because of its ability to reduce the risk of diabetes, cardiovascular disease, high blood pressure, stroke, obesity, and some gastrointestinal disorders, and appears to improve the functioning of the immune system [42]. Fiber is a recognized essential nutrient, and its intake is still low, so research into its composition in foods, including the increasingly popular sprouts and microgreens, is justified. So far, only single studies have determined the content of dietary fiber in radish sprouts [39] and microgreens [19], and a few studies refer to the roots [21,30,43,44]. According to published data, the concentration of total dietary fiber ranged from 2.22 to 2.77% in sprouts, 1.78% in microgreens, and from 0.32 to 4.29% in radish roots. A similar amount of total dietary fiber in radish sprouts and roots was determined in our work (Table 1). Only the values obtained for microgreens grown from three radish cultivars (except for the cv. Saxa 2) exceeded the literature data and ranged from 2.21 to 3.09%. Dietary fiber is a heterogeneous mixture of undigested and unabsorbed carbohydrate polymers (with three or more monomeric units) and lignin with a wide variety of physicochemical and biological properties. Depending on the water solubility, fiber components are classified as soluble and insoluble. The soluble fraction includes β-glucans, gums, pectin, and an indigestible oligosaccharide. The insoluble fraction is cellulose, hemicellulose, and lignin. Insoluble dietary fiber increases stool weight because of the water holding and reduces intestinal transit time. Water-soluble fiber components may prolong food transit time and slow down the digestive process in the gastrointestinal tract due to the formation of a gel-like substance in the stomach. Additionally, soluble fiber is fermented by colonic microbiota into short-chain fatty acids (SCFAs) with various health benefits [42]. Two-day fermentation of in vitro digested fresh radish sprouts with fecal supernatant from twelve human participants increased SCFA levels and gut microbiota diversity [45]. The compositional analysis of dietary fiber revealed that insoluble dietary fiber dominated in radish sprouts, microgreens, and roots (Figure 2). Its content ranged from 1.97 to 2.46 g/100 g in sprouts, from 1.38 to 2.81 g/100 g in microgreens, and from 0.87 to 1.45 g/100 g in radish roots. Insoluble dietary fiber constituted 90.72–94.86% in the sprouts, 87.71–90.96% in the microgreens, and 84.97–91.71% in the roots of total dietary fiber. For comparison, in the radish sprouts analyzed by Zieliński et al. [39], the insoluble dietary fraction constituted from 63.06 to 85.56% of the total fiber. A similar share of the insoluble fiber fraction in the total fiber (92.77%) was determined in black radish roots [43]. Among the various forms of radish, the highest content of this fiber fraction was found in the sprouts of the Warta cultivar, as well as in the microgreens and roots of the Carmen cultivar. As the radish matured from sprouts to microgreens and then to mature roots, the insoluble dietary fiber content increased significantly (p < 0.05) for the three radish cultivars, except for the cv. Jutrzenka (Figure 2). However, differences between cultivars for a given form of radish occurred only in the case of the roots. For comparison, in terms of the content of insoluble dietary fiber in the sprouts, differences were only found in the Warta cultivar, while, among microgreens, the Carmen and Saxa 2 cultivars were statistically different from the others.
Regardless of the radish cultivar analyzed, the dominant component of insoluble dietary fiber in sprouts was lignin (54.20–64.47%), whereas, in microgreens and roots, it was neutral sugars (44.86–47.19% and 47.29–55.77%, respectively)—Figure 3. According to Schäfer et al. [44], the insoluble fiber polysaccharides of radish roots mainly consisted of neutral sugars, such as glucose, arabinose, galactose, xylose, and mannose, and of galacturonic acid, which was determined after sulfuric acid hydrolysis. This method was also used in the present study. Additionally, the results of the methylation analysis suggested a high proportion of cellulose and, in smaller amounts, xyloglucans. The pectin fraction of radish insoluble fiber mainly contained homogalacturonan I, and, to a lesser extent, rhamnogalacturonan [44].
The soluble dietary fiber content ranged from 0.11 to 0.21 g/100 g in sprouts, from 0.19 to 0.28 g/100 g in microgreens, and from 0.11 to 0.16 g/100 g in radish roots (Figure 2). The share of the soluble fraction in total dietary fiber varied depending on the radish form and cultivar. In sprouts, it ranged from 5.14 to 9.28%, in microgreens, from 9.04 to 12.08%, while, in roots, it was in the range of 8.06–15.36%. In small radish and radish sprouts, the content of soluble dietary fiber was 0.41 and 0.20 g/100 g, respectively [39]. For comparison, soluble dietary fiber constituted 6.99% of the total dietary fiber of black radish, with as much as 87% of this fraction being high molecular weight components precipitated by 76% ethanol [43]. In ten different microgreens, soluble dietary fiber accounted for 0.7–16% of the total dietary fiber content, with radish microgreens accounting for 15.73% [19]. Generally, radish microgreens analyzed in the present study have the highest soluble dietary fiber content. Statistically significant cultivar differences (p < 0.05) were found for the sprouts cv. Jutrzenka, microgreens cv. Carmen, and roots of the Warta cultivar, whereas, for the three radish forms, they occurred only in the Carmen cultivar. The soluble dietary fiber fraction of all radish cultivars in both the sprouts (52.00–60.94%) and roots (59.00–68.69%) was dominated by neutral sugars, while, in the microgreens, uronic acids predominated (56.67–63.16%)—Figure 3. Unfortunately, the pectin content, which is a component of the soluble dietary fraction, was not determined in our study. Wojdyło et al. [13] reported a low pectin content in commercial radish sprouts (0.3%) and its absence in radish microgreens. Other authors obtained a pectin preparation by alkaline hydrolysis of radish root pomace with a yield of 15.18% [46]. The molecular structure of this pectin preparation consisted of homogalacturonan, rhamnogalacturonan I and II, and xylogalacturonan. The predominant monosaccharides of the radish pomace pectin were galacturonic acid, arabinose, galactose, and rhamnose.

3.3. Composition of Sugars

Monosaccharides are either direct products of photosynthesis in plants or are produced from glucose by certain metabolic pathways in plant cells. Soluble sugars contribute to plant growth and stress responses [47]. Moreover, sugars are one of the elements of taste and flavor in plants [48]. The analyzed by HPLC-IR method radish sprouts, microgreens, and roots of four cultivars differed statistically (p < 0.05) in terms of total sugars and fructose content (Table 2). However, the glucose and sucrose contents did not differ statistically between sprouts and microgreens of the Saxa and Carmen cultivars, respectively.
Glucose was the dominant sugar found in all radish sprouts, microgreens, and mature roots. Its content in sprouts ranged from 0.14 to 0.37 g/100 g; in microgreens, it was in the range of 0.15–0.47 g/100 g, and, in roots, it varied from 1.07 to 1.75 g/100 g. Of the four radish cultivars studied, the roots were also found to be richest in fructose, while the highest concentration of sucrose was accumulated in the cv. Jutrzenka and Saxa 2 sprouts and in the cv. Carmen and Warta radish roots. Cultivar differences (p < 0.05) were observed only for glucose, fructose, and total sugars in the radish roots. Based on the results obtained, a reduction in fructose content in microgreens relative to sprouts and a significant increase in its content during further development into roots was observed. For comparison, the glucose content did not differ between sprouts and microgreens in radish cv. Jutrzenka and Saxa2, and was significantly increased in roots. Of all the analyzed forms and cultivars of radish, the roots of the Jutrzenka cultivar had the highest glucose and fructose content (1.75 and 0.73 g/100 g, respectively), while the sprouts of the same cultivar contained the most sucrose (0.11 g/100 g). Commercial sprouts analyzed by Wojdyło et al. [13] contained glucose and fructose in the amounts of 0.9 and 0.3 g/100 g, respectively, which is more than in the tested sprouts of four radish cultivars in the presented work (up to 0.37 and 0.19 g/100 g, respectively). On the other hand, in the cited article, the sugar content in commercial radish microgreens was not determined. Sprouts obtained from the seeds of six radish varieties grown in China were also characterized by a higher content of total sugars (1.46–2.11 g/100 g) [49]. Moreover, germination of seeds, utilizing their storage material, significantly reduced the total and soluble sugar content. Similarly, Xiao and coworkers [27] reported higher glucose, fructose, and sucrose contents in China in rose radish microgreens. In addition, glucose and fructose levels, contrary to our data, were comparable. Red radish roots of the Nevadar cultivar contained more glucose (0.89–1.36 g/100 g) than fructose (0.56–1.00 g/100 g), regardless of the cultivation conditions (in greenhouse or field), which is consistent with our results [50].

3.4. Composition of Organic Acids

Organic acids, including carboxylic acids, are involved in various fundamental pathways in plant metabolism and catabolism as intermediate or final products. They are responsible for sensory properties and may influence the stability of food [51]. The contents of six carboxylic acids in radish sprouts, microgreens, and roots, determined by the HPLC method, are shown in Table 3. Our studies confirmed the presence of oxalic, citric, malic, fumaric, succinic, and tartaric acids in radish [13,15,17,52]. In comparison to the literature data, no quinic, acetic, lactic, and glutaric acids were found in the analyzed radish samples. In all analyzed radish samples, oxalic acid was identified to be the predominant acid, with the highest content in microgreens (35.02–88.87 mg/100 g), then in sprouts (28.45–32.35 mg/100 g), and with the lowest amount in roots (13.36–25.94 mg/100 g). Its contribution of total acids was estimated as 50–71% in sprouts, 42–61% in microgreens, and 42–63% in roots. Similarly, Wojdyło et al. [13] indicated oxalic acid as the main organic acid in commercial radish sprouts and microgreens, and other authors in radish roots [15,17]. In plants, oxalic acid can be converted to calcium oxalate, and both forms may be a significant risk factor for kidney or urolithiasis in people who consume large amounts of foods high in oxalate [52]. However, Kim et al. [53] found only trace amounts of oxalates in radish root. In comparison, chard, amaranth, and spinach were the richest in oxalates, with their contents ranging from 1.27 to 1.51 g/100 g of vegetable. In terms of concentration, fumaric and citric acids were next in the sprouts, while fumaric and malic acids were found in the microgreens and roots. It should be emphasized that succinic acid was not present in any of the sprout cultivars, while tartaric acid was not detected in the roots of the Carmen and Jutrzenka cultivars.
The highest total organic acid content (144.99 mg/100 g) was measured in microgreens of the Saxa 2 cultivar, and the lowest content (30.59 mg/100 g) in roots of the Carmen cultivar. All four radish cultivars showed statistical differences between oxalic, citric, malic, succinic, fumaric, and tartaric acid contents and radish forms. Additionally, statistically significant cultivar differences were found in the content of malic and fumaric acids in sprouts, in the content of fumaric acid in microgreens, and in terms of the oxalic acid content in roots.

3.5. Composition of Fatty Acids

Dietary fats are the most condensed source of energy and play a crucial role in the absorption and transportation of fat-soluble vitamins and antioxidants. Fatty acids make up up to 90% of the fats found in foods. From a health point of view, food lipid composition is important in terms of saturated and unsaturated fatty acids (mono- and polyunsaturated as well as cis and trans isomers of fatty acids). Additionally, polyunsaturated fatty acids of the n-3 (omega-3) and n-6 (omega-6) families are classified as essential acids since the human body lacks the necessary enzyme to produce them. Essential fatty acids play a vital role in maintaining the health of the immune, nervous, cardiovascular, and reproductive systems [54]. The fatty acid compositions of radish sprouts, microgreens, and roots were analyzed using gas chromatography-mass spectrometry. The contents of total saturated, monounsaturated, and polyunsaturated fatty acids of the analyzed radish sprouts, microgreens, and roots are presented in Figure 4. Additionally, Table 4 shows a composition of saturated acids, Table 5 shows monounsaturated acids, and Table 6 shows profiles of polyunsaturated acids.
Among the different radish forms, sprouts had the highest concentration of saturated, monounsaturated, and polyunsaturated fatty acids and, consequently, the highest content of total fatty acids (Figure 4). Monounsaturated fatty acids, with a contribution of 52–61% in the total fatty acid content, dominated in radish sprouts. In contrast, polyunsaturated fatty acids were present in the highest concentration in microgreens and radish roots (50–67% and 43–47% of total content, respectively). On the other hand, saturated fatty acids were present in the smallest amounts in sprouts and roots, and monounsaturated fatty acids in microgreens. Monounsaturated fatty acids were also the dominant fatty acids in sprouts of black radish, kale, and broccoli [22]. The data given in Figure 4 show large variations in the concentration of different fatty acids in the analyzed radish samples depending on their forms and cultivars. All four radish cultivars showed statistical differences between total and saturated fatty acid contents and radish forms (Figure 4). Additionally, statistically significant cultivar differences were found in the content of total fatty acids in microgreens.
The fatty acid composition of the analyzed radish samples is presented in Table 4, Table 5 and Table 6. In the present study, a total of 27 fatty acids were identified, 11 of which were saturated, 9 monounsaturated, and 7 polyunsaturated. For comparison, Zlatkowić et al. [55] identified 11 fatty acids in fodder radish seed oil. Pant and coworkers [40] identified six primary fatty acids in radish pink and radish white microgreens, while Bowen-Forbes et al. [22] found 12 fatty acids in radish sprouts, and 6 fatty acids in black radish roots were described by Mitrović et al. [56]. The major fatty acids of the analyzed radish comprised oleic, linoleic, alpha-linolenic, erucic, and palmitic acids. Statistically significant differences between radish development stages for all cultivars were found for palmitic and linoleic acid. Additionally, statistically significant differences were found in the content of oleic acid, alpha-linoleic acid, and erucic acid, except in the Jutrzenka cultivar. Palmitic acid accounted for an average of 74%, 66%, and 62% of the total saturated fatty acids in sprouts, microgreens, and roots, respectively (Table 4). The average share of oleic acid in the total monounsaturated fatty acids was 48%, 49%, and 60% in sprouts, microgreens, and roots, respectively (Table 5). For comparison, the contribution of erucic acid in this group of fatty acids was 39%, 13%, and <1% in sprouts, microgreens, and roots, respectively. Erucic acid was also found in black radish, kale, and broccoli sprouts, but its contribution to total fatty acids was the lowest in radish sprouts [22]. Zlatkowić et al. [55] classified fodder radish seed oil as high erucic acid oil because its concentration was about 21%, which made it unsuitable for human and livestock consumption, as concentrations of this acid up to 5% are safe for humans [40]. In their own studies, radish sprouts were found to be the richest in erucic acid, with a content ranging from 0.16% (cv. Carmen) to 0.49% (cv. Saxa 2). The polyunsaturated acids in radish were dominated by linoleic and alpha-linolenic acids. (Table 6). Linoleic acid constituted on average 52%, 26%, and 31% of the total polyunsaturated fatty acids in sprouts, microgreens, and roots, respectively. Whereas the share of alpha-linolenic acid in the total content of polyunsaturated acids averaged for the four radish cultivars was 46%, 72%, and 69% in sprouts, microgreens, and roots, respectively. Alpha-linolenic and linoleic acids are essential fatty acids and precursors of omega-3 and omega-6 fatty acids, respectively. Both omega-6 (e.g., arachidonic acid) and omega-3 (e.g., eicosapentaenoic acid and docosahexaenoic acid) are precursors of eicosanoids, which play important roles in regulating inflammation. In general, eicosanoids derived from omega-6 fatty acids are pro-inflammatory, whereas eicosanoids derived from omega-3 fatty acids are anti-inflammatory. With the increasing omega-6 to omega-3 ratio, chronic inflammatory diseases such as nonalcoholic fatty liver disease, cardiovascular disease, obesity, inflammatory bowel disease, rheumatoid arthritis, and Alzheimer’s disease are on the rise [54,57]. For optimal human health, it is recommended to maintain a ratio of omega-6 to omega-3 fatty acids of 1:1–2:1 [54]. In the analyzed radish, this ratio was 1.2 in sprouts, 0.4 in microgreens, and 0.5 in roots. For comparison, the ratio of linoleic acid to alpha-linolenic acid in seven-day-old sprouts of Black Spanish Round radish was equal to 0.7 [22], and in fodder radish seed oil was 1.25 [55]. Therefore, consumption of various forms of radish may contribute to decreasing the omega-6 to omega-3 fatty acids ratio in the diet and reducing the incidence of chronic inflammatory diseases.

3.6. Principal Component Analysis

Principal component analysis (PCA) was conducted to identify the key sources of variability between the three radish forms (sprouts, microgreens, and roots) of the Carmen, Jutrzenka, Saxa 2, and Warta cultivars based on their energy value and chemical composition. The Kaiser criterion (eigenvalues of components > 1) and the criterion of the degree of explained variability (>80%) were used to select the principal components. Table 7 shows the eigenvalues of the determined principal components and their contribution to explaining the observed variability.
The two principal components, PC1 and PC2, together describe 83.79% of the variability (56.17% and 27.62%, respectively). Based on factor loadings ≥0.5 (Table 8), important variables were selected for PC1 and PC2.
The first principal component was correlated with energy value, total protein, crude fat, available carbohydrates, total dietary fiber, insoluble dietary fiber, fructose, glucose, total sugars, citric acid, tartaric acid, palmitic acid, stearic acid, oleic acid, erucic acid, linoleic acid, alpha-linolenic acid, total saturated fatty acids, total monounsaturated fatty acids, total diunsaturated fatty acids, total triunsaturated fatty acids, and total fatty acids. Most of the factors loading for the aforementioned variables, except for available carbohydrates, fructose, glucose, and total sugars, were positive, indicating a directly proportional effect of these variables on the development of the PC1 principal factor value. In contrast, the second principal component was identified with variables such as ash, soluble dietary fiber, sucrose, oxalic acid, malic acid, succinic acid, fumaric acid, and total organic acids, most of which (except sucrose) were also positive. The factor loading value for petroselinic acid was the lowest (<0.5) of all the variables tested, indicating a moderate correlation with PC1 and PC2. Petroselinic acid, therefore, does not play a significant role in differentiating the samples tested in the principal component space considered.
The selected PC1 and PC2 effectively represented the observations evaluated in this study. PC1 included sprouts and roots of the four radish cultivars, while PC2 included microgreens of all radish cultivars tested. The score plot (Figure 5) revealed a clear distribution of studied samples in the three groups based on the radish forms. PC1 differentiated sprouts and roots well, while PC2 was responsible for separating microgreens from the other two groups. From the results obtained, it can be concluded that the studied radish forms differ in their chemical composition regardless of cultivars.
To better understand and visualize the correlation between chemical composition and the three radish growth stages, a biplot was prepared (Figure 6). Although PCA analysis identified three main groups corresponding to the different radish forms (Figure 5), within the groups representing sprouts and microgreens, some differences between cultivars were observed. Observations representing the initial stage of growth, i.e., sprouts for all four red radish cultivars, are located in the area of positive PC1 values. Among them, two cultivars stand out the most: Saxa 2 and Jutrzenka, which had the highest contribution to the PC1. The high PC1 factor loadings obtained by the Saxa 2 and Jutrzenka cultivars indicate that they are closely related to the group of variables that showed the highest positive correlations with the PC1. The sprouts of these two radish cultivars were characterized by the highest content of chemical components represented by these variables, i.e., crude fat, oleic acid, erucic acid, palmitic acid, linoleic acid, total saturated fatty acids, total mono- di- and triunsaturated fatty acids, and total fatty acids.
For the microgreens, there was a clear clustering of observations in the area of high positive PC2 values, especially for the Carmen and Saxa 2 cultivars, which achieved the highest values there. The studied four red radish cultivars showed a strong correlation with variables closely related to PC2, i.e., malic acid, succinic acid, oxalic acid, fumaric acid, total organic acids, and ash—the PC2 explains 85.8%, 75.2%, 71.6%, 62.5%, 87.3%, and 77.4% of their variance, respectively. The obtained results indicate the presence of high concentrations of the above-mentioned components, characteristic of this stage of growth, especially in the case of two cultivars, i.e., Carmen and Saxa 2.
In turn, all observations representing the radish roots are located in the area of negative PC1 values. The first principal component describes these observations very well, explaining 74.9–79.1% of their variability. The analyzed samples were very similar to each other, forming a compact group unlike sprouts and microgreens, suggesting a similar chemical composition of the studied radish cultivars. Indeed, the roots of all four tested cultivars were characterized by high contents of glucose, fructose, and total sugars, compared to sprouts and microgreens. In contrast, the other variables positively correlated with PC1, including all labeled fatty acids, were present in the lowest concentrations in the roots.

4. Conclusions

Radish roots are the most popular part of this vegetable consumed worldwide, although radish sprouts and microgreens are also becoming increasingly popular among consumers. To accurately assess the quality of radish at different development stages, it is necessary to obtain comprehensive information, including analysis of the main nutrients. To the best of our knowledge, no studies have compared the content of protein, fat, ash, and carbohydrates, including sugars and dietary fiber, in the sprouts, microgreens, and roots of different radish cultivars. Statistical analysis of the results obtained showed that different red radish forms (sprouts, microgreens, and mature roots) exhibit distinct chemical profiles regardless of cultivar. The roots of the four radish cultivars had only a higher sugar content and lower content of protein, fat, total and insoluble dietary fiber, organic acid, and energy value compared to both sprouts and microgreens. In general, the qualitative composition of sugars and organic and fatty acids in all analyzed radish forms was similar. These results may contribute to expanding knowledge on the nutritional quality of radish sprouts, microgreens, and roots and their use in various types of diets, such as a diet rich in essential fatty acids or fiber. The sprouts, especially of the Saxa 2 and Jutrzenka cultivars, showed a high content of essential fatty acids, suggesting their usefulness in diets aimed at improving the lipid profile. In turn, the high content of organic acids, ash, and total soluble fiber in microgreens, especially of the Carmen and Saxa 2 cultivars, may indicate their high functional potential in the scope of supporting digestion and providing minerals. Further studies are needed to determine the composition of bioactive components and their biological activity, and to understand the influence of the food matrix on the bioavailability of both nutrients and bioactive components present in radish sprouts, microgreens, and roots, which will contribute to the development of dietary guidelines for human nutrition and health.

Author Contributions

Conceptualization, D.K. and A.P.; methodology, D.S., K.S., and B.F.; formal analysis, D.K., R.B., K.P.-P., and D.S.; investigation, D.K., D.S., K.S., R.B., and B.F.; data curation, D.K., D.S., A.P., and R.B.; writing—original draft preparation, D.K. and A.P.; writing—review and editing, D.K. and A.P.; visualization, D.K., D.S., and K.P.-P.; supervision, A.P. All authors have read and agreed to the published version of the manuscript.

Funding

This research received no external funding.

Data Availability Statement

The original contributions presented in this study are included in the article. Further inquiries can be directed to the corresponding author.

Conflicts of Interest

The authors declare no conflicts of interest.

References

  1. Gamba, M.; Asllanaj, E.; Raguindin, P.F.; Glisic, M.; Franco, O.H.; Minder, B.; Muka, T. Nutritional and phytochemical characterization of radish (Raphanus sativus): A systematic review. Trends Food Sci. Technol. 2021, 113, 205–218. [Google Scholar] [CrossRef]
  2. Zhang, J.; Qiu, X.; Tan, Q.; Xiao, Q.; Mei, S. A comparative metabolomics study of flavonoids in radish with different skin and flesh colors (Raphanus sativus L.). J. Agric. Food Chem. 2020, 68, 14463–14470. [Google Scholar] [CrossRef] [PubMed]
  3. Hanlon, P.R.; Barnes, D.M. Phytochemical composition and biological activity of 8 varieties of radish (Raphanus sativus L.) sprouts and mature taproots. J. Food Sci. 2011, 76, C185–C192. [Google Scholar] [CrossRef]
  4. Alloggia, F.P.; Bafumo, R.F.; Ramirez, D.A.; Maza, M.A.; Camargo, A.B. Brassicaceae microgreens: A novel and promissory source of sustainable bioactive compounds. Curr. Res. Food Sci. 2023, 6, 100480. [Google Scholar] [CrossRef]
  5. Aziz, A.; Noreen, S.; Khalid, W.; Mubarik, F.; Niazi, M.K.; Koraqi, H.; Ali, A.; Lima, C.M.G.; Alansari, W.S.; Eskandrani, A.A.; et al. Extraction of bioactive compounds from different vegetable sprouts and their potential role in the formulation of functional foods against various disorders: A literature-based review. Molecules 2022, 27, 7320. [Google Scholar] [CrossRef]
  6. Ebert, A.W. Sprouts and microgreens—Novel food sources for healthy diets. Plants 2022, 11, 571. [Google Scholar] [CrossRef]
  7. Tallei, T.E.; Kapantow, N.H.; Niode, N.J.; Sailah, I.; Savitri, M.; Lahay, M.Y.; Barasarathi, J. The therapeutic potential of red radish microgreens in modulating inflammation and cancer pathways. CyTA-J. Food 2025, 23, 2467410. [Google Scholar] [CrossRef]
  8. Vučetić, A.; Šovljanski, O.; Pezo, L.; Gligorijević, N.; Kostić, S.; Vulić, J.; Čanadanović-Brunet, J. A comprehensive antioxidant and nutritional profiling of Brassicaceae microgreens. Antioxidants 2025, 14, 191. [Google Scholar] [CrossRef]
  9. Khan, R.S.; Khan, S.S.; Siddique, R. Radish (Raphanus sativus): Potential antioxidant role of bioactive compounds extracted from radish leaves—A review. Pak. J. Med. Health Sci. 2022, 16, 2. [Google Scholar] [CrossRef]
  10. Younus, I.; Siddiq, A.; Baig, S.G.; Sadaf, R.; Fayyaz, T.B.; Ain, N.U.; Ahmer, A. An analytical report of phytochemical constituents, pharmacological potential, and toxic effects of radish. Pak. J. Med. Health Sci. 2022, 16, 3. [Google Scholar] [CrossRef]
  11. Tomas, M.; Zhang, L.; Zengin, G.; Rocchetti, G.; Capanoglu, E.; Lucini, L. Metabolomic insight into the profile, in vitro bioaccessibility and bioactive properties of polyphenols and glucosinolates from four Brassicaceae microgreens. Food Res. Int. 2021, 140, 110039. [Google Scholar] [CrossRef] [PubMed]
  12. Jaafar, N.A.; Ahmed, A.S.; Al-Sandooq, D.L. Detection of active compounds in radish Raphanus sativus L. and their various biological effects. Plant Arch. 2020, 20, 1647–1650. [Google Scholar]
  13. Wojdyło, A.; Nowicka, P.; Tkacz, K.; Turkiewicz, I.P. Sprouts vs. microgreens as novel functional foods: Variation of nutritional and phytochemical profiles and their in vitro bioactive properties. Molecules 2020, 25, 4648. [Google Scholar] [CrossRef]
  14. Manivannan, A.; Kim, J.H.; Kim, D.S.; Lee, E.S.; Lee, H.E. Deciphering the nutraceutical potential of Raphanus sativus—A comprehensive overview. Nutrients 2019, 11, 402. [Google Scholar] [CrossRef]
  15. Cai, D.; Dong, Y.; Wang, L.; Zhao, S. Integrated metabolomics and transcriptomics analysis provides insights into biosynthesis and accumulation of flavonoids and glucosinolates in different radish varieties. Curr. Res. Food Sci. 2025, 10, 100938. [Google Scholar] [CrossRef]
  16. Jambalsuren, B.; Dondog, P. Biochemical analysis of radish and beet species. Mong. J. Agric. Sci. 2023, 16, 31–36. [Google Scholar] [CrossRef]
  17. El-Beltagi, H.S.; Maraei, R.W.; Shalaby, T.A.; Aly, A.A. Metabolites, Nutritional quality and antioxidant activity of red radish roots affected by gamma rays. Agronomy 2022, 12, 1916. [Google Scholar] [CrossRef]
  18. Godlewska, K.; Pacyga, P.; Michalak, I.; Biesiada, A.; Szumny, A.; Pachura, N.; Piszcz, U. Systematic investigation of the effects of seven plant extracts on the physiological parameters, yield, and nutritional quality of radish (Raphanus sativus var. sativus). Front. in Plant Sci. 2021, 12, 651152. [Google Scholar] [CrossRef]
  19. Ghoora, M.D.; Babu, D.R.; Srividya, N. Nutrient composition, oxalate content and nutritional ranking of ten culinary microgreens. J. Food Compos. Anal. 2020, 91, 103495. [Google Scholar] [CrossRef]
  20. Ashraf, R.; Sultana, B.; Riaz, S.; Mushtaq, M.; Iqbal, M.; Nazir, A.; Zafar, Z. Fortification of phenolics, antioxidant activities and biochemical attributes of radish root by plant leaf extract seed priming. Biocatal. Agr. Biotech. 2018, 16, 115–120. [Google Scholar] [CrossRef]
  21. Goyeneche, R.; Roura, S.; Ponce, A.; Vega-Gálvez, A.; Quispe-Fuentes, I.; Uribe, E.; Di Scala, K. Chemical characterization and antioxidant capacity of red radish (Raphanus sativus L.) leaves and roots. J. Funct. Foods 2015, 16, 256–264. [Google Scholar] [CrossRef]
  22. Bowen-Forbes, C.; Armstrong, E.; Moses, A.; Fahlman, R.; Koosha, H.; Yager, J.Y. Broccoli, kale, and radish sprouts: Key phytochemical constituents and DPPH free radical scavenging activity. Molecules 2023, 28, 4266. [Google Scholar] [CrossRef] [PubMed]
  23. Francis, H.; Debs, E.; Koubaa, M.; Alrayess, Z.; Maroun, R.G.; Louka, N. Sprouts use as functional foods. optimization of germination of wheat (Triticum aestivum L.), alfalfa (Medicago sativa L.), and radish (Raphanus sativus L.) seeds based on their nutritional content evolution. Foods 2022, 11, 1460. [Google Scholar] [CrossRef] [PubMed]
  24. Rani, S.; Singh, N.; Kaur, C.; Varghese, E. Measurement of phytochemical content and nutritional characteristics of microgreens grown in high altitude region of India. J. Food Meas. Charact. 2024, 18, 3113–3127. [Google Scholar] [CrossRef]
  25. Tilahun, S.; Baek, M.W.; An, K.-S.; Choi, H.R.; Lee, J.H.; Hong, J.S.; Jeong, C.S. Radish Microgreens Produced Without Substrate in a Vertical Multi-Layered Growing Unit Are Rich in Nutritional Metabolites. Front. Plant Sci. 2023, 14, 1236055. [Google Scholar] [CrossRef]
  26. Kowitcharoen, L.; Phornvillay, S.; Lekkham, P.; Pongprasert, N.; Srilaong, V. Bioactive composition and nutritional profile of microgreens cultivated in Thailand. Appl. Sci. 2021, 11, 7981. [Google Scholar] [CrossRef]
  27. Xiao, Z.; Lester, G.E.; Park, E.; Saftner, R.A.; Luo, Y.; Wang, Q. Evaluation and correlation of sensory attributes and chemical compositions of emerging fresh produce: Microgreens. Postharvest Biol. Technol. 2015, 110, 140–148. [Google Scholar] [CrossRef]
  28. Mobeen; Wang, X.; Saleem, M.H.; Parveen, A.; Mumtaz, S.; Hassan, A.; Adnan, M.; Fiaz, S.; Ali, S.; Iqbal Khan, Z.; et al. Proximate composition and nutritive value of some leafy vegetables from Faisalabad, Pakistan. Sustainability 2021, 13, 8444. [Google Scholar] [CrossRef]
  29. Knez, E.; Kadac-Czapska, K.; Dmochowska-Ślęzak, K.; Grembecka, M. Root vegetables—Composition, health effects, and contaminants. Int. J. Environ. Res. Public Health 2022, 19, 15531. [Google Scholar] [CrossRef]
  30. Lu, Z.L.; Liu, L.W.; Li, X.Y.; Gong, Y.Q.; Hou, X.L.; Zhu, X.W.; Yang, J.L.; Wang, L.Z. Analysis and evaluation of nutritional quality in Chinese radish (Raphanus sativus L.). Agr. Sci. China 2008, 7, 823–830. [Google Scholar] [CrossRef]
  31. Martínez-Ispizua, E.; Calatayud, Á.; Marsal, J.I.; Cannata, C.; Basile, F.; Abdelkhalik, A.; Soler, S.; Valcárcel, J.V.; Martínez-Cuenca, M.-R. The nutritional quality potential of microgreens, baby leaves, and adult lettuce: An underexploited nutraceutical source. Foods 2022, 11, 423. [Google Scholar] [CrossRef] [PubMed]
  32. Di Bella, M.C.; Niklas, A.; Toscano, S.; Picchi, V.; Romano, D.; Lo Scalzo, R.; Branca, F. Morphometric characteristics, polyphenols and ascorbic acid variation in Brassica oleracea L. Novel foods: Sprouts, microgreens and baby leaves. Agronomy 2020, 10, 782. [Google Scholar] [CrossRef]
  33. Yadav, L.P.; Koley, T.K.; Tripathi, A.; Singh, S. Antioxidant potentiality and mineral content of summer season leafy greens: Comparison at mature and microgreen stages using chemometric. Agric. Res. 2019, 8, 165–175. [Google Scholar] [CrossRef]
  34. Waterland, N.L.; Moon, Y.; Tou, J.C.; Kim, M.J.; Pena-Yewtukhiw, E.M.; Park, S. Mineral content differs among microgreen, baby leaf, and adult stages in three cultivars of kale. HortScience 2017, 52, 566–571. [Google Scholar] [CrossRef]
  35. Gouw, V.P.; Jung, J.; Zhao, Y. Functional properties, bioactive compounds, and in vitro gastrointestinal digestion study of dried fruit pomace powders as functional food ingredients. LWT-Food Sci. Technol. 2017, 80, 136–144. [Google Scholar] [CrossRef]
  36. de Menezes, E.W.; Grande, F.; Giuntini, E.B.; Lopes, T.D.V.C.; Dan, M.C.T.; do Prado, S.B.R.; Lajolo, F.M. Impact of dietary fiber energy on the calculation of food total energy value in the Brazilian Food Composition Database. Food Chem. 2016, 193, 128–133. [Google Scholar] [CrossRef]
  37. van Tran, K.; Ross, E.; Hancock, P. Evaluation of XBridge™ BEH Amide Columns for the analysis of five sugars in food and beverages using an Arc HPLC, Coupled to a 2414 RI Detector. Waters Corp. 2022, 720007835. Available online: https://www.waters.com (accessed on 14 May 2025).
  38. Aubert, C.; Bony, P.; Chalot, G.; Landry, P.; Lurol, S. Effects of storage temperature, storage duration, and sub L.;sequent ripening on the physicochemical characteristics, volatile compounds, and phytochemicals of western red nectarine (Prunus persica L. Batsch). J. Agric. Food Chem. 2014, 62, 4707–4724. [Google Scholar] [CrossRef]
  39. Zieliński, H.; Frias, J.; Piskuła, M.K.; Kozłowska, H.; Vidal-Valverde, C. Vitamin B1 and B2, dietary fiber and minerals content of Cruciferae sprouts. Eur. Food Res. Technol. 2005, 221, 78–83. [Google Scholar] [CrossRef]
  40. Pant, Y.; Lingwan, M.; Masakapalli, S.K. Metabolic, biochemical, mineral and fatty acid profiles of edible Brassicaceae microgreens establish them as promising functional food. Food Chem. Adv. 2023, 3, 100461. [Google Scholar] [CrossRef]
  41. Drozdowska, M.; Leszczyńska, T.; Koronowicz, A.; Piasna-Słupecka, E.; Domagała, D.; Kusznierewicz, B. Young shoots of red cabbage are a better source of selected nutrients and glucosinolates in comparison to the vegetable at full maturity. Eur. Food Res. Technol. 2020, 246, 2505–2515. [Google Scholar] [CrossRef]
  42. Waddell, I.S.; Orfila, C. Dietary fiber in the prevention of obesity and obesity-related chronic diseases: From epidemiological evidence to potential molecular mechanisms. Crit. Rev. Food Sci. Nutr. 2023, 63, 8752–8767. [Google Scholar] [CrossRef] [PubMed]
  43. Kalala, G.; Kambashi, B.; Everaert, N.; Beckers, Y.; Richel, A.; Pachikian, B.; Bindelle, J. Characterization of fructans and dietary fibre profiles in raw and steamed vegetables. Int. J. Food Sci. Nutr. 2018, 69, 682–689. [Google Scholar] [CrossRef]
  44. Schäfer, J.; Brett, A.; Trierweiler, B.; Bunzel, M. Characterization of cell wall composition of radish (Raphanus sativus L. var. sativus) and maturation related changes. J. Agric. Food Chem. 2016, 64, 8625–8632. [Google Scholar] [CrossRef] [PubMed]
  45. Li, R.; Chen, X.; Shi, C.; Zhu, Y. Study on the effect of radish sprouts on short-chain fatty acids and gut microbial diversity in healthy individuals. Foods 2025, 14, 170. [Google Scholar] [CrossRef]
  46. Tang, L.; Li, M.; Zhao, G.; Ye, F. Characterization of a low-methoxyl pectin extracted from red radish (Raphanus sativus L.) pomace and its gelation induced by NaCl. Int. J. Biol. Macromol. 2024, 254, 127869. [Google Scholar] [CrossRef]
  47. Gibson, S.I. Control of plant development and gene expression by sugar signaling. Curr. Opin. Plant Biol. 2005, 8, 93–102. [Google Scholar] [CrossRef]
  48. Rouphael, Y.; Schwarz, D.; Krumbein, A.; Colla, G. Impact of grafting on product quality of fruit vegetables. Sci. Hortic. 2010, 127, 172–179. [Google Scholar] [CrossRef]
  49. Guo, C.; Zhu, Y. Comparative analysis of phytochemicals and antioxidant activities in seeds and sprouts of different varieties of radish (Raphanus sativus L.): TOPSIS-entropy weight method. Front. Plant Sci. 2025, 16, 1531570. [Google Scholar] [CrossRef]
  50. Schreiner, M.; Huyskens-Keil, S.; Peters, P.; Schonhof, I.; Krumbein, A.; Widell, S. Seasonal climate effects on root colour and compounds of red radish. J. Sci. Food Agric. 2002, 82, 1325–1333. [Google Scholar] [CrossRef]
  51. Priecina, L.; Karklina, D. Composition of major organic acids in vegetables and spices. In CBU International Conference Proceedings; ISE Research Institute: Tokyo, Japan, 2015; Volume 3, pp. 447–454. [Google Scholar] [CrossRef]
  52. Mei, S.; He, Z.; Zhang, J. Identification and analysis of major flavor compounds in radish taproots by widely targeted metabolomics. Front. Nutr. 2022, 9, 889407. [Google Scholar] [CrossRef] [PubMed]
  53. Kim, D.J.; Kim, H.K.; Kim, M.H.; Lee, J.S. Analysis of oxalic acid of various vegetables consumed in Korea. Food Sci. Biotechnol. 2007, 16, 650–654. [Google Scholar]
  54. Saini, R.K.; Keum, Y.S. Omega-3 and omega-6 polyunsaturated fatty acids: Dietary sources, metabolism, and significance—A review. Life Sci. 2018, 203, 255–267. [Google Scholar] [CrossRef]
  55. Zlatković, V.S.; Grahovac, N.L.; Banković Ilić, I.B.; Mitrović, P.M.; Troter, D.Z.; Todorović, Z.B.; Marjanović Jeromela, A.M.; Veljković, V.B. Effects of screw pressing conditions on fodder radish seed oil yield, throughput, and fatty acid profile. J. Food Process Eng. 2024, 47, e14588. [Google Scholar] [CrossRef]
  56. Mitrović, J.S.; Nikolić, N.Č.; Karabegović, I.T.; Todorović, Z.B.; Lazić, M.M.; Stojanović, G.S. The comparative study on the composition of acylglycerols and fatty acids in celery, parsnip and black radish roots. Adv. Technol. 2018, 7, 28–34. [Google Scholar] [CrossRef]
  57. Patterson, E.; Wall, R.; Fitzgerald, G.F.; Ross, R.P.; Stanton, C. Health implications of high dietary omega-6 polyunsaturated fatty acids. J. Nutr. Metab. 2012, 2012, 539426. [Google Scholar] [CrossRef]
Figure 1. Photographs of the four radish cultivars used in this study showing sprouts, microgreens, and mature roots.
Agronomy 15 01216 g001
Figure 2. The contents of soluble and insoluble dietary fiber of sprouts, microgreens, and roots of four radish cultivars. Different small letters indicate significant difference between radish forms for a given radish cultivar, and different capital letters indicate significant difference between radish cultivars for a given radish form at p < 0.05.
Agronomy 15 01216 g002
Figure 3. The percentage of soluble and insoluble fiber fraction of sprouts (S), microgreens (M), and roots (R) of four radish cultivars.
Agronomy 15 01216 g003
Figure 4. Content of total fatty acids, saturated, monounsaturated, and polyunsaturated fatty acids of sprouts, microgreens, and roots of four radish cultivars. Different small letters indicate significant difference between radish forms for a given radish cultivar, and different capital letters indicate significant difference between radish cultivars for a given radish form at p < 0.05.
Agronomy 15 01216 g004
Figure 5. Plot of the distribution of the observations in the two-dimensional layout of two principal components, PC1 and PC2.
Agronomy 15 01216 g005
Figure 6. Biplot principal components PC1 and PC2 based on the chemical composition of the four radish cultivars at three different growth stages.
Agronomy 15 01216 g006
Table 1. Moisture, macronutrient, ash, and dietary fiber content (g/100 g fresh weight), and energy value (kcal/100 g FW) of sprouts, microgreens, and roots of four radish cultivars.
Radish CultivarStage of DevelopmentMoistureTotal ProteinCrude FatAshTotal Dietary FiberAvailable
Carbohydrates
Energy Value
CarmenSprouts92.65 ± 0.36 bB2.90 ± 0.02 cA1.23 ± 0.04 cA0.56 ± 0.03 aA2.08 ± 0.08 bA0.58 ± 0.09 aB29.14 ± 0.67 cA
Microgreens91.54 ± 0.18 aB2.35 ± 0.03 bC0.55 ± 0.04 bC1.07 ± 0.04 bA3.09 ± 0.02 cC1.40 ± 0.18 bA26.12 ± 0.49 bB
Roots94.81 ± 0.12 cB0.55 ± 0.01 aB0.11 ± 0.01 aA0.56 ± 0.01 aA1.60 ± 0.02 aD2.37 ± 0.12 cA15.87 ± 0.41 aA
JutrzenkaSprouts91.35 ± 0.13 aA2.99 ± 0.02 cA2.05 ± 0.08 cB0.67 ± 0.03 aB2.30 ± 0.10 bA0.65 ± 0.10 aB37.58 ± 0.26 cC
Microgreens91.96 ± 0.08 bB1.49 ± 0.18 bA0.54 ± 0.01 bC1.02 ± 0.08 bA2.31 ± 0.13 bB2.69 ± 0.22 bC26.18 ± 0.42 bB
Roots94.33 ± 0.22 cA0.49 ± 0.01 aA0.12 ± 0.01 aA0.56 ± 0.01 aA1.02 ± 0.02 aA3.47 ± 0.20 cB18.97 ± 0.88 aB
Saxa 2Sprouts91.18 ± 0.31 aA3.24 ± 0.19 cB2.06 ± 0.04 cB0.82 ± 0.01 aC2.21 ± 0.03 cA0.49 ± 0.04 aAB37.86 ± 0.26 cC
Microgreens90.90 ± 0.11 aA1.50 ± 0.01 bB0.32 ± 0.02 bA1.51 ± 0.20 bB1.57 ± 0.03 bA4.20 ± 0.16 cD28.84 ± 0.47 bC
Roots94.97 ± 0.09 bB0.51 ± 0.01 aA0.11 ± 0.02 aA0.65 ± 0.04 aB1.17 ± 0.02 aB2.59 ± 0.04 bA15.72 ± 0.31 aA
WartaSprouts91.54 ± 0.16 aA3.52 ± 0.03 cC1.32 ± 0.03 cA0.68 ± 0.07 aB2.60 ± 0.14 cB0.35 ± 0.04 aA32.53 ± 0.10 cB
Microgreens92.49 ± 0.11 bC1.64 ± 0.03 bAB0.43 ± 0.03 bB1.18 ± 0.01 bA2.21 ± 0.12 bB2.05 ± 0.17 bB23.03 ± 0.35 bA
Roots94.63 ± 0.12 cAB0.51 ± 0.00 aA0.13 ± 0.02 aA0.75 ± 0.05 aC1.41 ± 0.05 aC2.58 ± 0.11 cA16.33 ± 0.45 aA
Different small letters within the same column indicate significant difference between radish forms for a given radish cultivar at p < 0.05. Different capital letters within the same column indicate significant difference between radish cultivars for a given radish form at p < 0.05.
Table 2. Sugar content (g/100 g fresh weight) of sprouts, microgreens, and roots of four radish cultivars.
Radish
Cultivar
Radish FormFructoseGlucoseSucroseTotal
CarmenSprouts0.16 ± 0.00 bB0.21 ± 0.00 aB0.05 ± 0.00 aA0.42 ± 0.01 aB
Microgreens0.09 ± 0.00 aC0.47 ± 0.02 bC0.05 ± 0.00 aC0.61 ± 0.02 bC
Roots0.40 ± 0.02 cB1.34 ± 0.02 cB0.08 ± 0.01 bBC1.82 ± 0.04 cB
JutrzenkaSprouts0.19 ± 0.02 bB0.37 ± 0.03 aC0.11 ± 0.01 cB0.67 ± 0.05 bC
Microgreens0.06 ± 0.00 aB0.34 ± 0.00 aB0.04 ± 0.01 aB0.44 ± 0.01 aB
Roots0.73 ± 0.02 cD1.75 ± 0.06 bD0.08 ± 0.01 bAB2.56 ± 0.07 cD
Saxa 2Sprouts0.12 ± 0.00 bA0.16 ± 0.01 aA0.10 ± 0.00 cB0.38 ± 0.02 bB
Microgreens0.04 ± 0.01 aA0.15 ± 0.02 aA0.03 ± 0.01 aA0.22 ± 0.02 aA
Roots0.55 ± 0.01 cC1.07 ± 0.01 bA0.07 ± 0.01 bA1.69 ± 0.02 cA
WartaSprouts0.12 ± 0.01 bA0.14 ± 0.01 aA0.05 ± 0.01 bA0.31 ± 0.02 aA
Microgreens0.09 ± 0.01 aC0.34 ± 0.02 bB0.02 ± 0.00 aA0.45 ± 0.03 bB
Roots0.34 ± 0.02 cA1.51 ± 0.03 cC0.08 ± 0.02 cC1.93 ± 0.04 cC
Different small letters within the same column indicate significant difference between radish forms for a given radish cultivar at p < 0.05. Different capital letters within the same column indicate significant difference between radish cultivars for a given radish form at p < 0.05.
Table 3. Organic acid content (mg/100 g fresh weight) of sprouts, microgreens, and roots of four radish cultivars.
Radish CultivarRadish FormOxalic AcidCitric AcidTartaric AcidMalic AcidSuccinic AcidFumaric AcidTotal Content
CarmenSprouts32.35 ± 0.37 bB4.35 ± 0.14 bA1.10 ± 0.02 bA1.18 ± 0.03 aA0.00 aA12.73 ± 0.51 bC51.71 ± 0.44 bB
Microgreens59.92 ± 4.29 cB7.73 ± 0.16 cC1.85 ± 0.13 cC21.57 ± 0.42 cB8.91 ± 0.47 cC38.88 ± 1.51 cD138.86 ± 3.45 cC
Roots15.60 ± 0.65 aB1.63 ± 0.17 aC0.00 aA7.54 ± 0.23 bB2.21 ± 0.04 bAB3.61 ± 0.11 aB30.59 ± 0.76 aA
JutrzenkaSprouts29.59 ± 0.60 bA5.73 ± 0.21 cB1.61 ± 0.12 cB4.52 ± 0.20 aC0.00 aA15.24 ± 0.39 cD56.69 ± 1.19 bC
Microgreens63.75 ± 1.59 cB3.91 ± 0.09 bA0.93 ± 0.08 bA20.43 ± 0.36 cB7.05 ± 0.26 bB11.63 ± 0.18 bA107.70 ± 1.58 cB
Roots20.14 ± 0.36 aC1.05 ± 0.06 aAB0.00 aA6.26 ± 0.16 bA3.05 ± 0.12 bC5.38 ± 0.16 aC35.88 ± 0.52 aB
Saxa 2Sprouts31.62 ± 0.88 bB9.97 ± 0.79 cC2.26 ± 0.09 cC7.61 ± 0.30 aD0.00 aA11.65 ± 0.42 bB63.11 ± 2.11 bD
Microgreens88.87 ± 9.31 cC4.09 ± 0.07 bA1.59 ± 0.06 bB18.81 ± 0.80 cA4.27 ± 0.14 cA27.36 ± 1.10 cC144.99 ± 9.04 cC
Roots13.36 ± 0.32 aA1.13 ± 0.07 aB0.24 ± 0.01 aC9.30 ± 0.45 bC2.46 ± 0.20 bB5.44 ± 0.25 aC31.93 ± 0.87 aA
WartaSprouts28.45 ± 0.55 aA4.66 ± 0.26 bAB1.00 ± 0.09 bA2.32 ± 0.04 aB0.00 aA3.51 ± 0.26 bA39.94 ± 1.20 aA
Microgreens35.02 ± 1.63 bA6.39 ± 0.14 cB1.52 ± 0.09 cB20.70 ± 0.12 cB4.43 ± 0.19 cA15.97 ± 0.21 cB84.03 ± 1.80 bA
Roots25.94 ± 0.77 aD0.83 ± 0.05 aA0.21 ± 0.01 aB9.61 ± 0.36 bC2.12 ± 0.08 bA2.58 ± 0.09 aA41.29 ± 1.31 aC
Different small letters within the same column indicate significant difference between radish forms for a given radish cultivar at p < 0.05. Different capital letters within the same column indicate significant difference between radish cultivars for a given radish form at p < 0.05.
Table 4. Saturated fatty acid content (mg/100 g fresh weight) of sprouts, microgreens, and roots of four radish cultivars.
Fatty AcidCarmenJutrzenkaSaxa 2Warta
SproutsMicrogreensRootsSproutsMicrogreensRootsSproutsMicrogreensRootsSproutsMicrogreensRoots
Lauric (C12:0)0.62 ± 0.021.93 ± 0.090.03 ± 0.000.00 ± 0.000.93 ± 0.030.00 ± 0.000.50 ± 0.031.38 ± 0.050.36 ± 0.020.03 ± 0.000.69 ± 0.040.09 ± 0.00
Myristic (C14:0)1.23 ± 0.052.15 ± 0.050.63 ± 0.030.93 ± 0.031.74 ± 0.040.38 ± 0.011.49 ± 0.062.18 ± 0.090.23 ± 0.001.72 ± 0.064.98 ± 0.190.71 ± 0.02
Pentadecanoic (C15:0)0.18 ± 0.010.62 ± 0.020.12 ± 0.000.11 ± 0.010.00 ± 0.000.58 ± 0.030.14 ± 0.000.67 ± 0.030.20 ± 0.010.80 ± 0.030.50 ± 0.020.24 ± 0.01
Palmitic (C16:0)78.63 ± 3.93 cA55.57 ± 1.95 bB10.72 ± 0.47 aA143.02 ± 6.72 cC75.60 ± 2.57 bC16.35 ± 0.75 aBC114.83 ± 5.44 cB47.12 ± 1.98 bA14.94 ± 0.66 aB81.73 ± 2.45 cA46.52 ± 2.00 bA16.99 ± 0.85 aC
Heptadecanoic (C17:0)0.00 ± 0.001.24 ± 0.030.34 ± 0.010.78 ± 0.030.97 ± 0.020.01 ± 0.000.42 ± 0.020.46 ± 0.010.00 ± 0.001.11 ± 0.030.74 ± 0.030.52 ± 0.01
Stearic (C18:0)10.34 ± 0.39 cA4.94 ± 0.25 bA2.31 ± 0.11 aB14.15 ± 0.68 cB10.37 ± 0.31 bC5.09 ± 0.24 aC20.52 ± 0.62 cC4.38 ± 0.21 bA1.89 ± 0.10 aA10.04 ± 0.45 cA7.13 ± 0.22 bB2.34 ± 0.10 aB
Arachidic Acid (C20:0)6.66 ± 0.203.06 ± 0.131,44 ± 0.0417.64 ± 0.651.85 ± 0.043.26 ± 0.1020.11 ± 0.622.70 ± 0.131.57 ± 0.048.32 ± 0.352.75 ± 0.091.39 ± 0.04
Heneicosanoic (C21:0)0.00 ± 0.002.61 ± 0.072.38 ± 0.080.00 ± 0.000.00 ± 0.001.06 ± 0.050.00 ± 0.0012.83 ± 0.364.07 ± 0.130.00 ± 0.000.00 ± 0.002.02 ± 0.08
Behenic (C22:0)3.00 ± 0.083.41 ± 0.150.00 ± 0.003.42 ± 0.120.84 ± 0.021.02 ± 0.055.21 ± 0.253.74 ± 0.120.46 ± 0.013.92 ± 0.150.68 ± 0.020.52 ± 0.02
Lignoceric (C24:0)1.35 ± 0.047.69 ± 0.360.00 ± 0.004.64 ± 0.185.16 ± 0.140.00 ± 0.006.35 ± 0.303.99 ± 0.140.00 ± 0.004.43 ± 0.164.20 ± 0.190.41 ± 0.01
Cerotic (C26:0)0.00 ± 0.000.29 ± 0.010.00 ± 0.000.00 ± 0.005.37 ± 0.140.00 ± 0.000.00 ± 0.002.73 ± 0.140.00 ± 0.000.00 ± 0.000.00 ± 0.000.00 ± 0.00
Different small letters within the same row indicate significant difference between radish forms for a given radish cultivar at p < 0.05. Different capital letters within the same row indicate significant difference between radish cultivars for a given radish form at p < 0.05.
Table 5. Monounsaturated fatty acid content (mg/100 g fresh weight) of sprouts, microgreens, and roots of four radish cultivars.
Fatty AcidCarmenJutrzenkaSaxa 2Warta
SproutsMicrogreensRootsSproutsMicrogreensRootsSproutsMicrogreensRootsSproutsMicrogreensRoots
Myristoleic (C14:1)1.11 ± 0.040.00 ± 0.000.00 ± 0.000.00 ± 0.000.57 ± 0.020.00 ± 0.000.00 ± 0.000.69 ± 0.030.00 ± 0.002.36 ± 0.070.56 ± 0.030.00 ± 0.00
Palmitoleic (C16:1 n7)6.73 ± 0.287.56 ± 0.280.55 ± 0.017.13 ± 0.245.74 ± 0.180.47 ± 0.017.40 ± 0.285.23 ± 0.150.62 ± 0.0311.14 ± 0.511.62 ± 0.071.34 ± 0.04
cis-10-Heptadecenoic (C17:1 n7)1.23 ± 0.051.63 ± 0.070.00 ± 0.002.01 ± 0.082.48 ± 0.110.00 ± 0.002.07 ± 0.072.01 ± 0.100.00 ± 0.002.42 ± 0.121.36 ± 0.070.00 ± 0.00
Petroselinic (C18:1 n6)0.00 ± 0.00 aA21.76 ± 0.59 bC0.00 ± 0.00 aA0.00 ± 0.00 aA12.81 ± 0.34 bB22.58 ± 0.70 cB0.00 ± 0.00 aA14.25 ± 0.73 bB0.00 ± 0.00 aA0.00 ± 0.00 aA10.25 ± 0.54 bA30.78 ± 0.92 cC
Elaidic (C18:1 n9t)0.00 ± 0.000.00 ± 0.000.00 ± 0.000.65 ± 0.030.00 ± 0.000.00 ± 0.000.52 ± 0.020.00 ± 0.000.00 ± 0.001.06 ± 0.030.00 ± 0.000.00 ± 0.00
Oleic Acid (C18:1 n9c)253.43 ± 11.91 bA30.83 ± 1.29 aA30.42 ± 1.03 aD544.79 ± 22.56 cC46.75 ± 1.78 bB7.37 ± 0.03 aA553.60 ± 32.41 bC31.67 ± 0.98 aA26.42 ± 0.98 aC323.56 ± 10.35 cB33.53 ± 1.14 bA12.92 ± 0.39 aB
cis-11-Eicosenoic (C20:1 n9)52.08 ± 1.512.64 ± 0.130.94 ± 0.03149.58 ± 5.092.28 ± 0.060.42 ± 0.01119.16 ± 7.953.39 ± 0.160.52 ± 0.0160.24 ± 2.712.43 ± 0.090.68 ± 0.02
Erucic (C22:1 n9)164.63 ± 6.26 bA5.88 ± 0.17 aA0.80 ± 0.03 aB446.92 ± 25.16 bC4.84 ± 0.21 aA0.00 ± 0.00 aA490.77 ± 25.30 bC16.52 ± 0.63 aC0.00 ± 0.00 aA279.28 ± 9.78 bB10.08 ± 0.52 aB0.00 ± 0.00 aA
Nervonic (C24:1n9)3.47 ± 0.154.55 ± 0.170.60 ± 0.0213.45 ± 0.601.86 ± 0.070.00 ± 0.0016.17 ± 0.811.42 ± 0.050.00 ± 0.008.90 ± 0.272.38 ± 0.070.08 ± 0.00
Different small letters within the same row indicate significant difference between radish forms for a given radish cultivar at p < 0.05. Different capital letters within the same row indicate significant difference between radish cultivars for a given radish form at p < 0.05.
Table 6. Polyunsaturated fatty acid content (mg/100 g fresh weight) of sprouts, microgreens, and roots of four radish cultivars.
Fatty AcidCarmenJutrzenkaSaxa 2Warta
SproutsMicrogreensRootsSproutsMicrogreensRootsSproutsMicrogreensRootsSproutsMicrogreensRoots
Linolelaidic (C18:2 n6t)0.00 ± 0.000.00 ± 0.000.00 ± 0.000.33 ± 0.010.00 ± 0.000.00 ± 0.001.08 ± 0.040.00 ± 0.000.00 ± 0.000.00 ± 0.000.00 ± 0.000.00 ± 0.00
Linoleic (C18:2 n6c)183.01 ± 8.61 cA100.22 ± 2.80 bD15.56 ± 0.76 aB349.15 ± 20.65 cD77.38 ± 3.25 bC12.16 ± 0.58 aA309.55 ± 17.32 cC52.76 ± 2.64 bB14.61 ± 0.56 aB222.39 ± 7.12 cB42.63 ± 2.33 bA15.04 ± 0.46 aB
cis-11,14-Eicosadienoic (C20:2 n6)3.15 ± 0.131.72 ± 0.050.00 ± 0.004.26 ± 0.140.80 ± 0.020.00 ± 0.004.86 ± 0.170.90 ± 0.030.00 ± 0.002.76 ± 0.080.44 ± 0.020.00 ± 0.00
cis-13,16-Docosadienoic (C22:2 n6)0.00 ± 0.000.00 ± 0.000.00 ± 0.001.94 ± 0.070.00 ± 0.000.00 ± 0.003.11 ± 0.100.86 ± 0.020.00 ± 0.000.85 ± 0.030.00 ± 0.000.00 ± 0.00
alpha-Linolenic (C18:3n3)158.48 ± 7.29 bA222.25 ± 6.23 cB29.72 ± 0.83 aB264.34 ± 9.52 bC260.06 ± 12.21 bC34.88 ± 1.36 aC274.31 ± 16.47 cC98.62 ± 5.75 bA24.98 ± 0.82 aA232.38 ± 7.44 cB213.67 ± 7.94 bB38.35 ± 1.95 aC
gamma-Linolenic (C18:3n6)0.30 ± 0.012.52 ± 0.130.12 ± 0.000.42 ± 0.025.17 ± 0.260.00 ± 0.000.56 ± 0.022.02 ± 0.080.15 ± 0.010.17 ± 0.010.65 ± 0.020.07 ± 0.00
cis-11,14,17-Eicosatrienoic (C20:3 n3)0.00 ± 0.002.01 ± 0.070.00 ± 0.000.00 ± 0.000.44 ± 0.010.00 ± 0.000.00 ± 0.000.37 ± 0.010.00 ± 0.000.00 ± 0.001.44 ± 0.060.00 ± 0.00
Different small letters within the same row indicate significant difference between radish forms for a given radish cultivar at p < 0.05. Different capital letters within the same row indicate significant difference between radish cultivars for a given radish form at p < 0.05.
Table 7. Eigenvalues and their contribution to explaining observed variability.
Principal ComponentEigenvalueVariability (%)Cumulative Variance %
PC117.4156.1756.17
PC28.5627.6283.79
Table 8. Factor loadings for principal components.
No.ParameterPC1PC2No.ParameterPC1PC2
1Energy value0.9630.00517Succinic acid−0.2770.867
2Total protein0.947−0.03718Fumaric acid0.3140.791
3Crude fat0.941−0.32319Total organic acids0.2290.934
4Ash0.1030.88020Palmitic acid0.961−0.092
5Available carbohydrates−0.7680.36321Stearic acid0.892−0.216
6Total dietary fiber0.7440.41822Petroselinic acid−0.4900.373
7Soluble dietary fiber0.2060.75123Oleic acid0.870−0.469
8Insoluble dietary fiber0.7500.43024Erucic acid0.858−0.469
9Fructose−0.693−0.57125Linoleic acid0.936−0.317
10Glucose−0.823−0.38426alpha-Linolenic acid0.9060.260
11Sucrose0.155−0.74427Total saturated fatty acids0.972−0.035
12Total sugars−0.789−0.46428Total monounsaturated fatty acids0.868−0.459
13Oxalic acid0.2100.84629Total diunsaturated fatty acids0.937−0.317
14Citric acid0.8530.30530Total triunsaturated fatty acids0.9000.274
15Tartaric acid0.8420.42131Total fatty acids0.939−0.315
16Malic acid−0.1390.927
Disclaimer/Publisher’s Note: The statements, opinions and data contained in all publications are solely those of the individual author(s) and contributor(s) and not of MDPI and/or the editor(s). MDPI and/or the editor(s) disclaim responsibility for any injury to people or property resulting from any ideas, methods, instructions or products referred to in the content.

