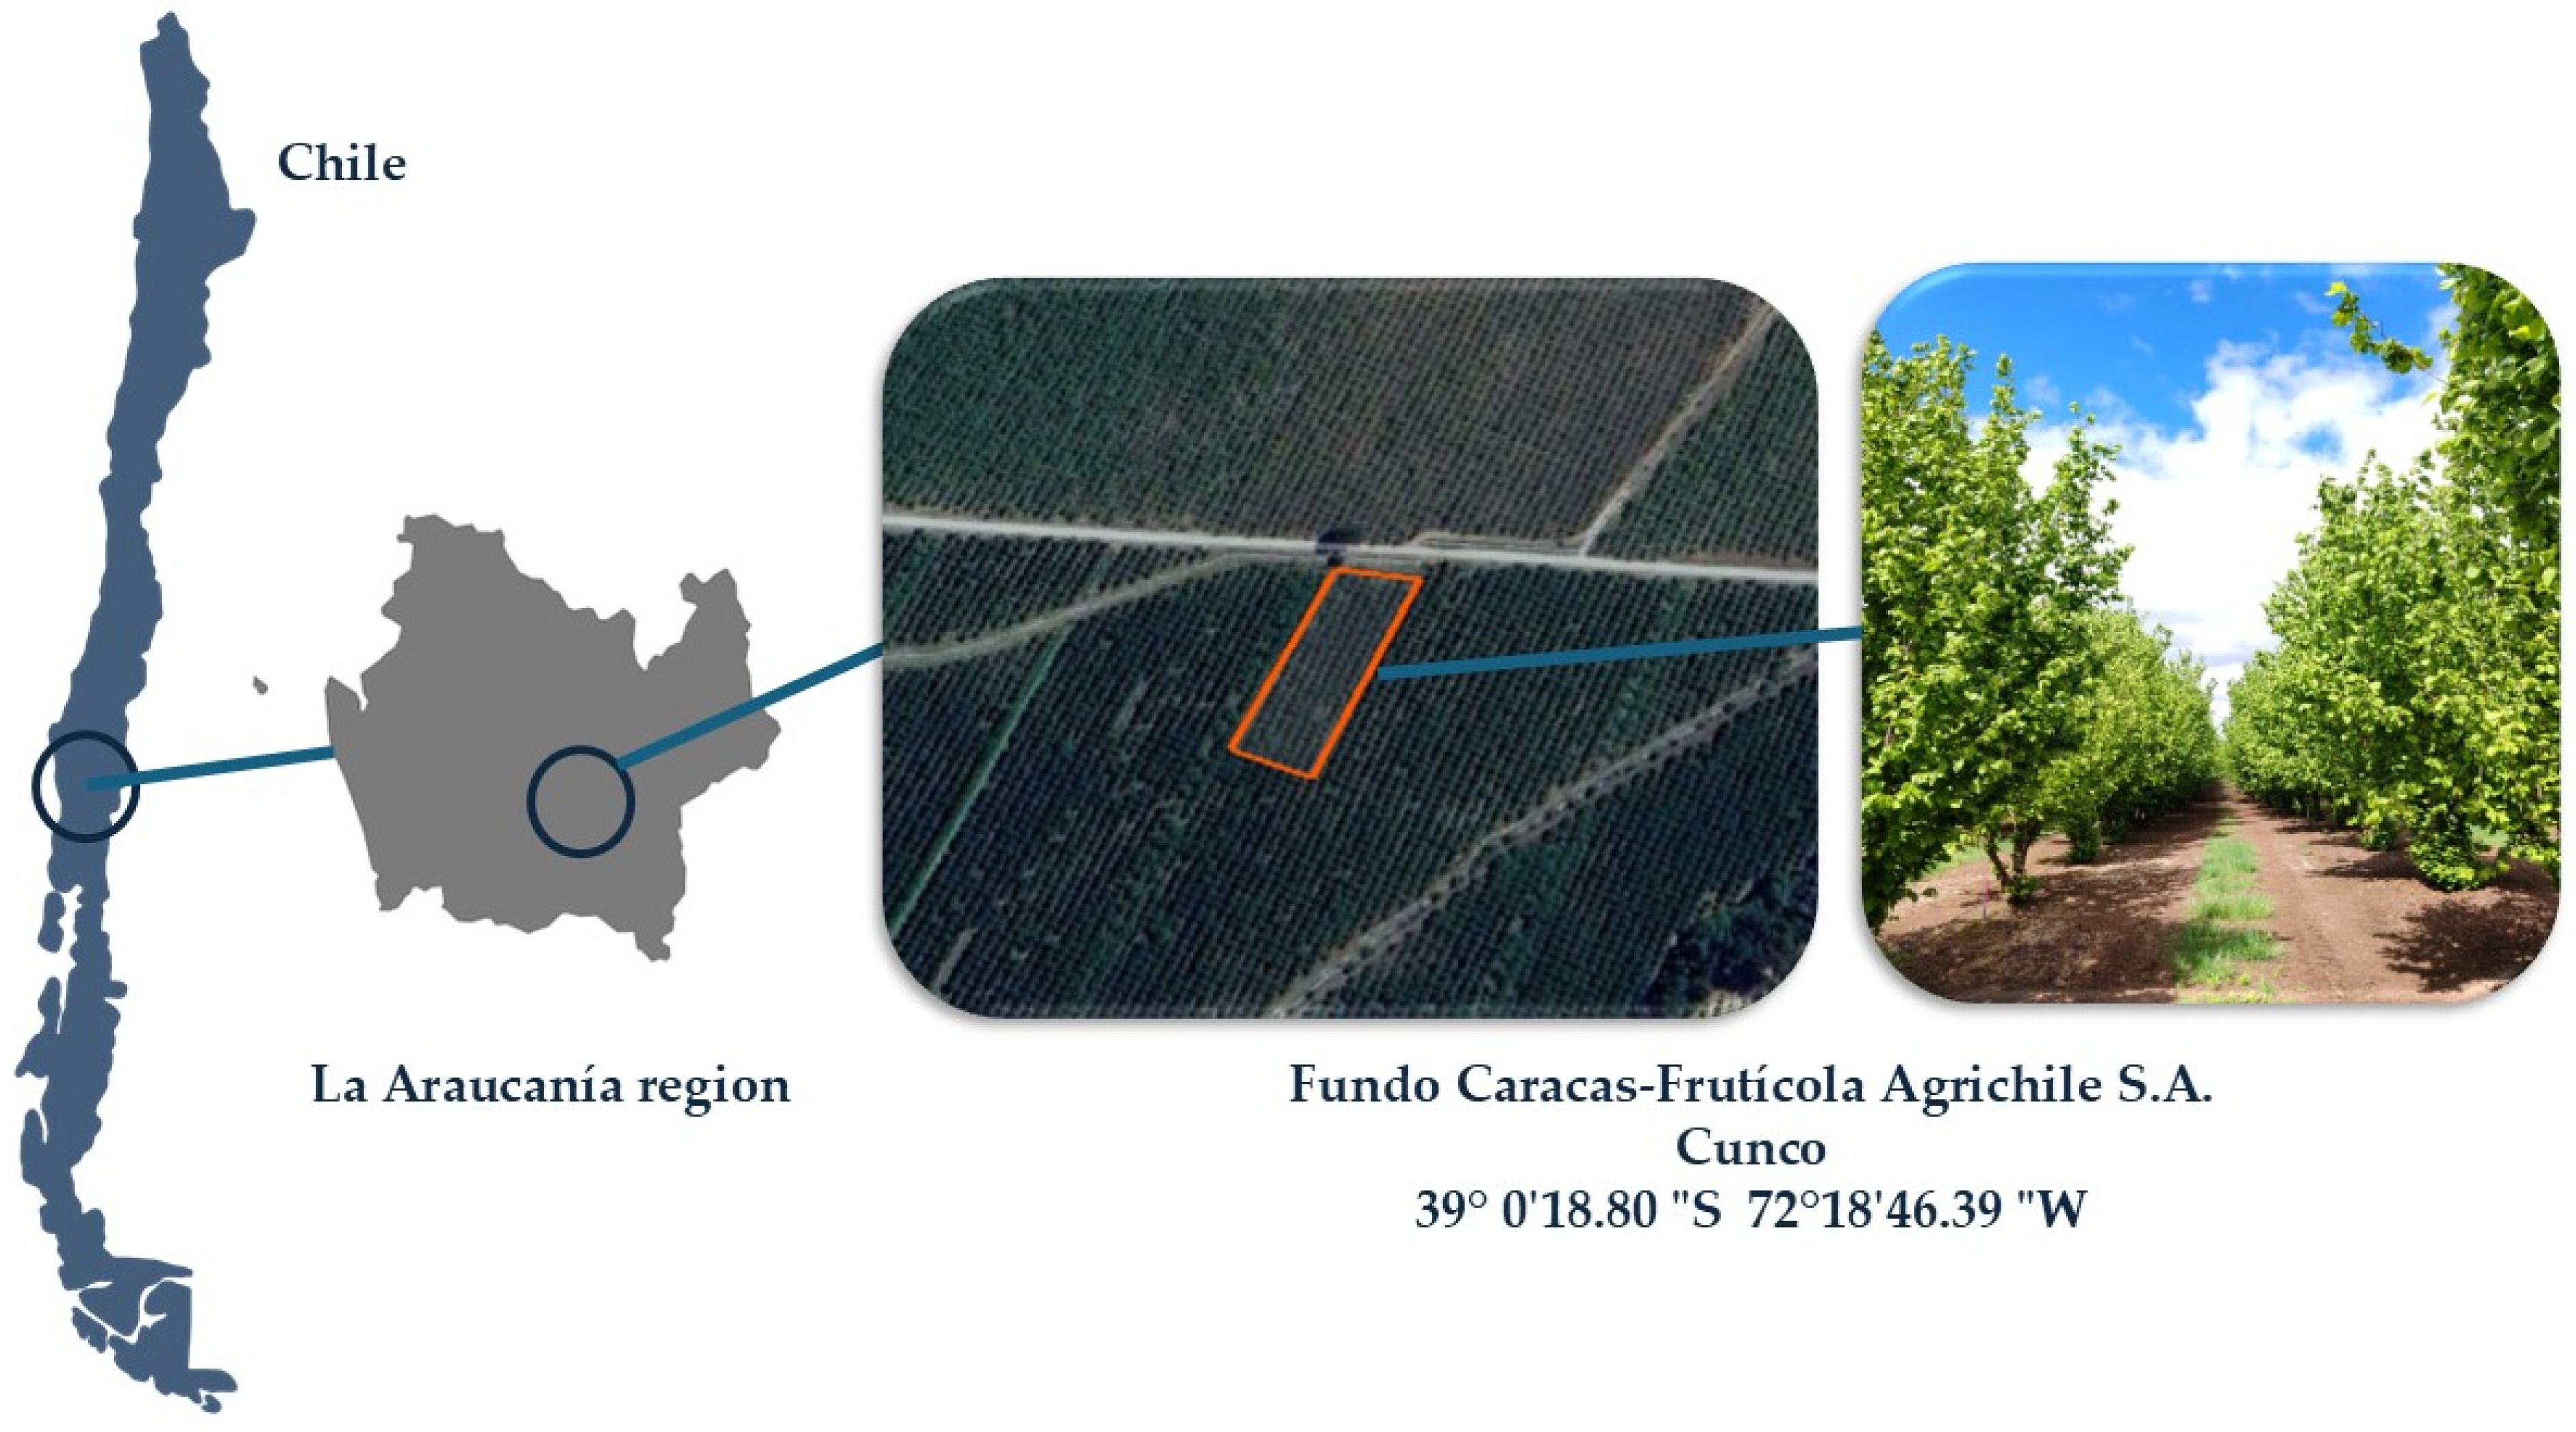
Figure 1.
Experimental site, Fundo Caracas, Cunco (39°00′ S, 72°31′ W), La Araucanía region, Chile.
Figure 1.
Experimental site, Fundo Caracas, Cunco (39°00′ S, 72°31′ W), La Araucanía region, Chile.
Figure 2.
Weather parameters of precipitation (mm), minimum temperature (°C), and maximum temperature (°C) during the 2020/2021, 2021/2022, and 2022/2023 seasons at the experimental site, Fundo Caracas, Cunco (39°00′ S, 72°31′ W), La Araucanía region, Chile.
Figure 2.
Weather parameters of precipitation (mm), minimum temperature (°C), and maximum temperature (°C) during the 2020/2021, 2021/2022, and 2022/2023 seasons at the experimental site, Fundo Caracas, Cunco (39°00′ S, 72°31′ W), La Araucanía region, Chile.
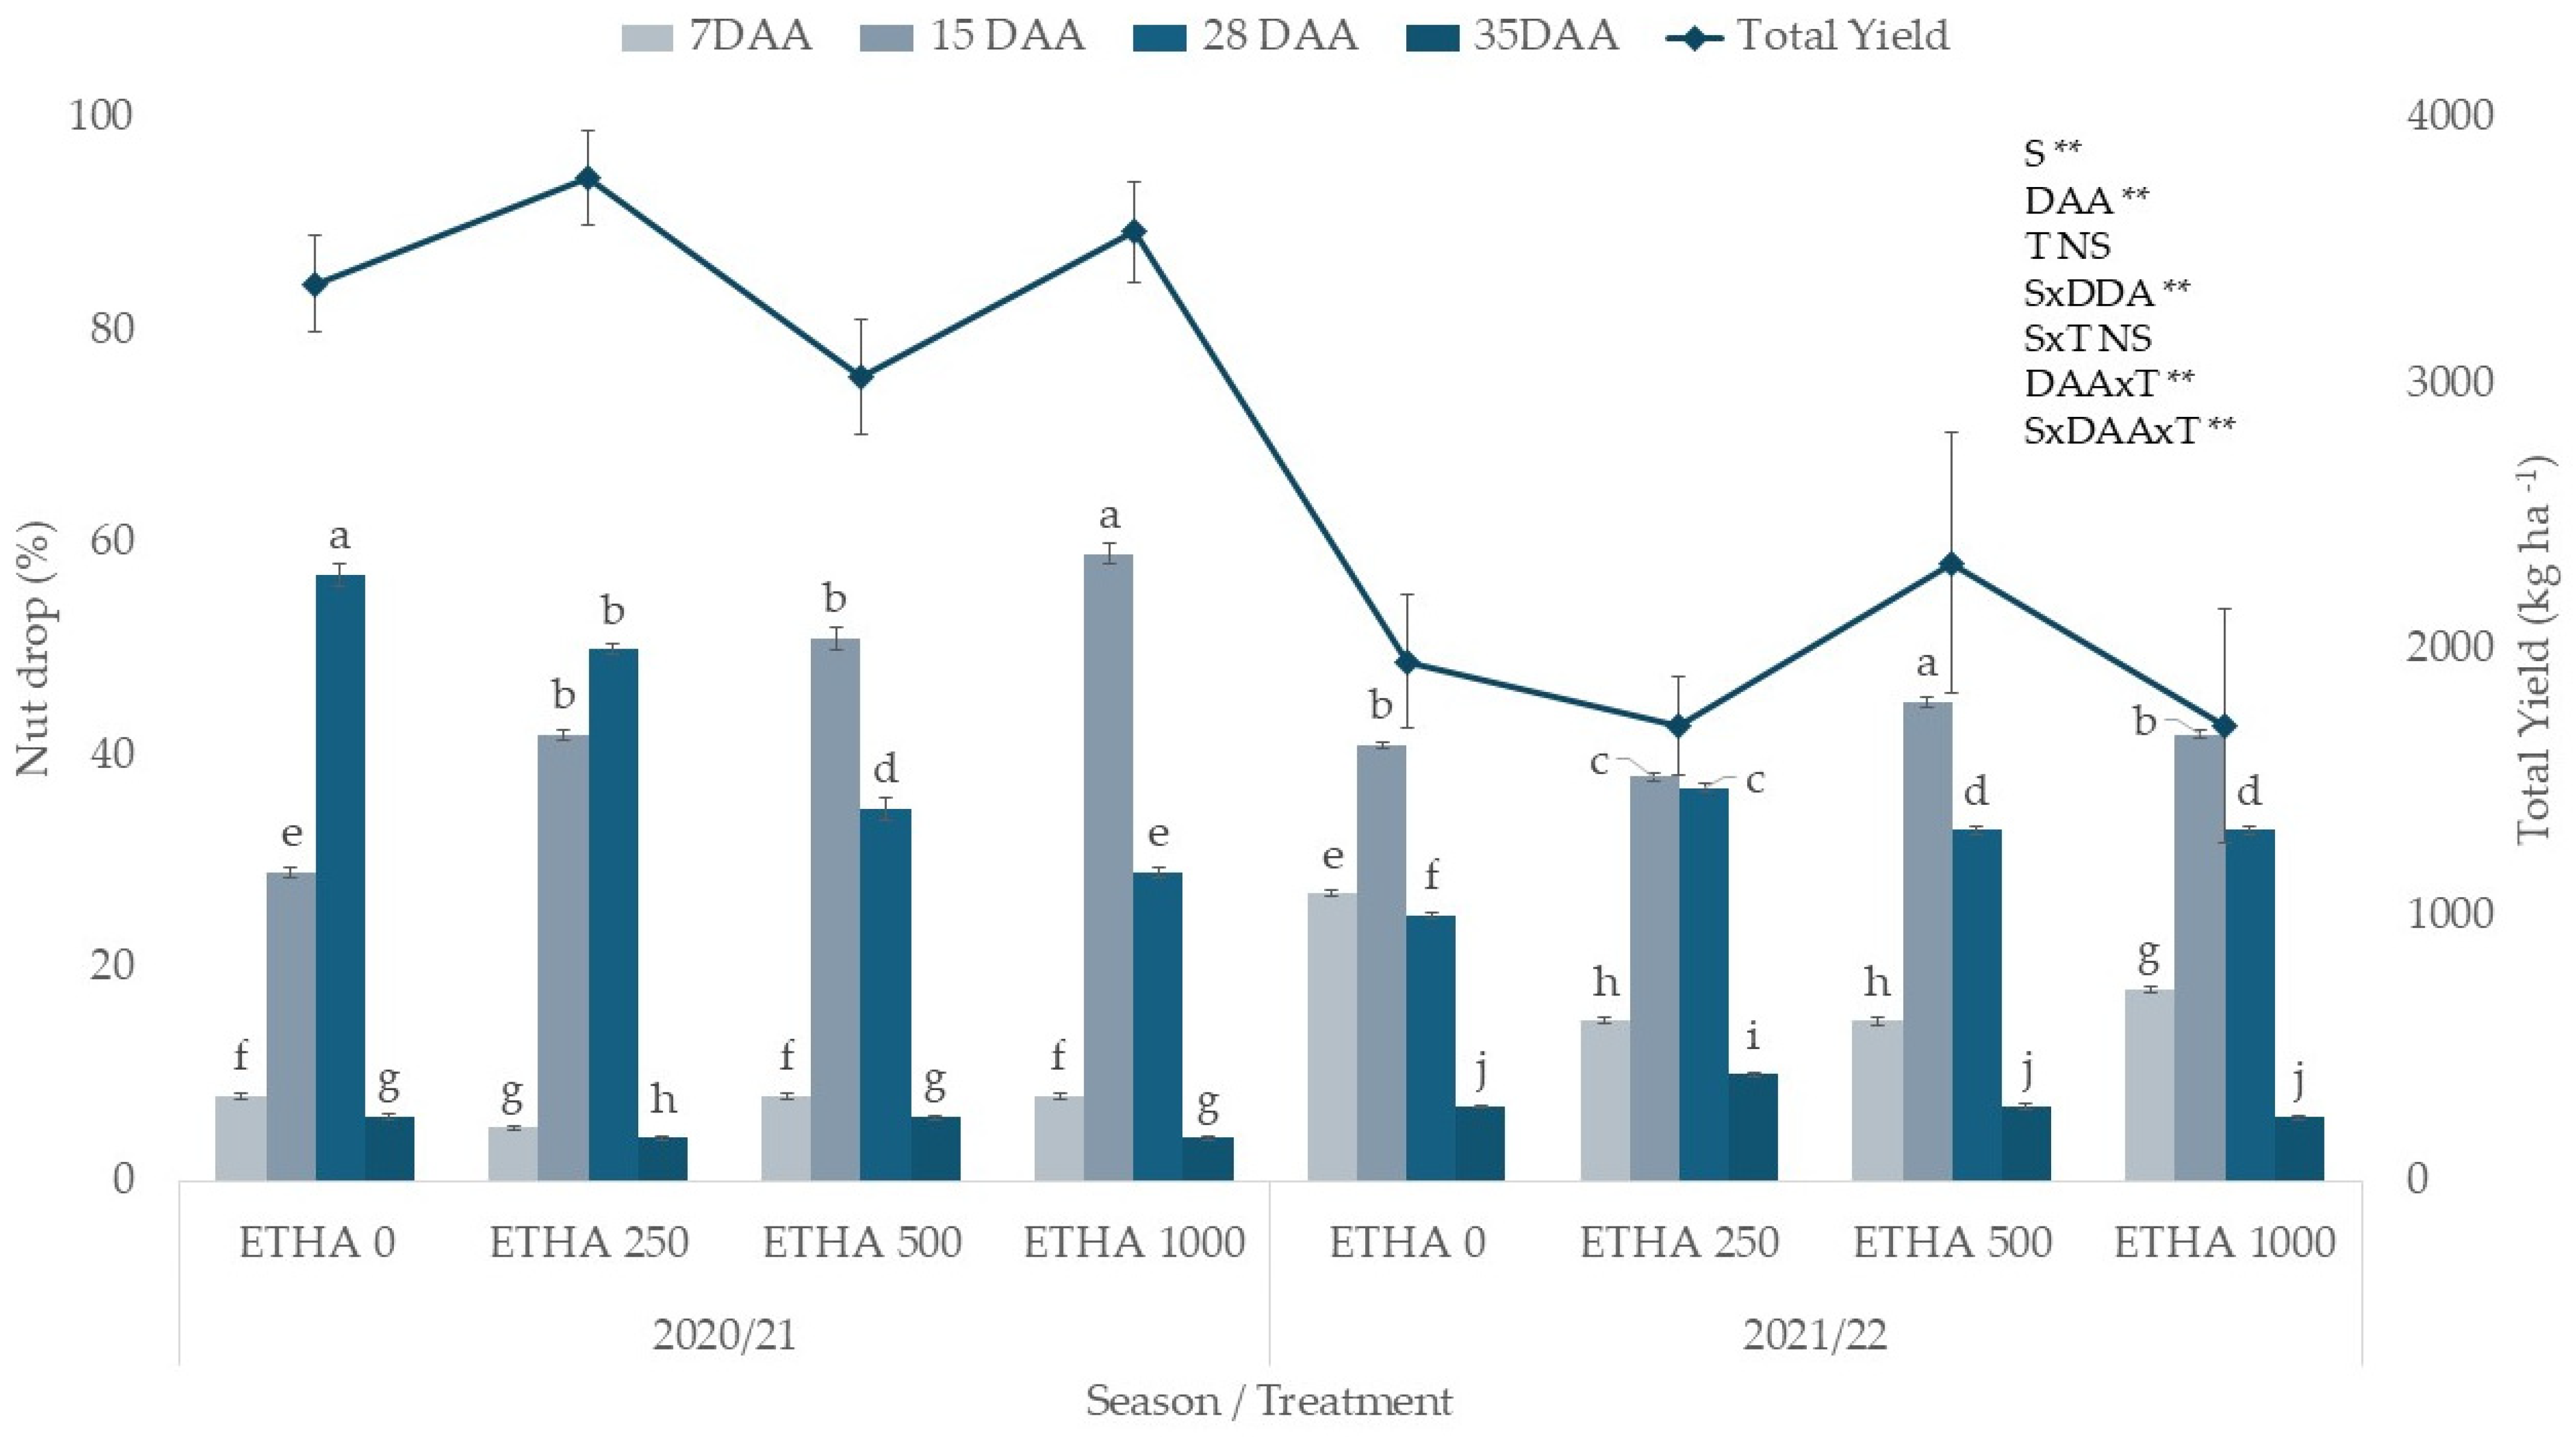
Figure 3.
Nut drop (%) in the experiment and total nut yield (kg ha−1) for ETHA at 7, 15, 28, and 35 DAA represented by the blue line and bars, respectively, per treatment of ETHA 0, 250, 500, and 1000 mg L−1 for the 2020/2021 and 2021/2022 seasons in Cunco, La Araucanía region. Bars and lines represent the mean of four replications ± S.E. Different letters indicate statistical differences among treatments within each spray program. NS, not significant; ** p ≤ 0.001.
Figure 4.
Nut drop (%) in the experiment and total nut yield (kg ha−1) for ETHB at 7, 15, 28, and 35 DAA represented by the blue lines and bars, respectively, per treatment of ETHB 0, 250, 500 and 1000 mg L−1 for the 2021/2022 and 2022/2023 seasons in Cunco, La Araucanía region. Bars and lines represent the mean of four replications ± S.E. Different letters indicate statistical differences among treatments within each spray program. NS, not significant; ** p ≤ 0.001.
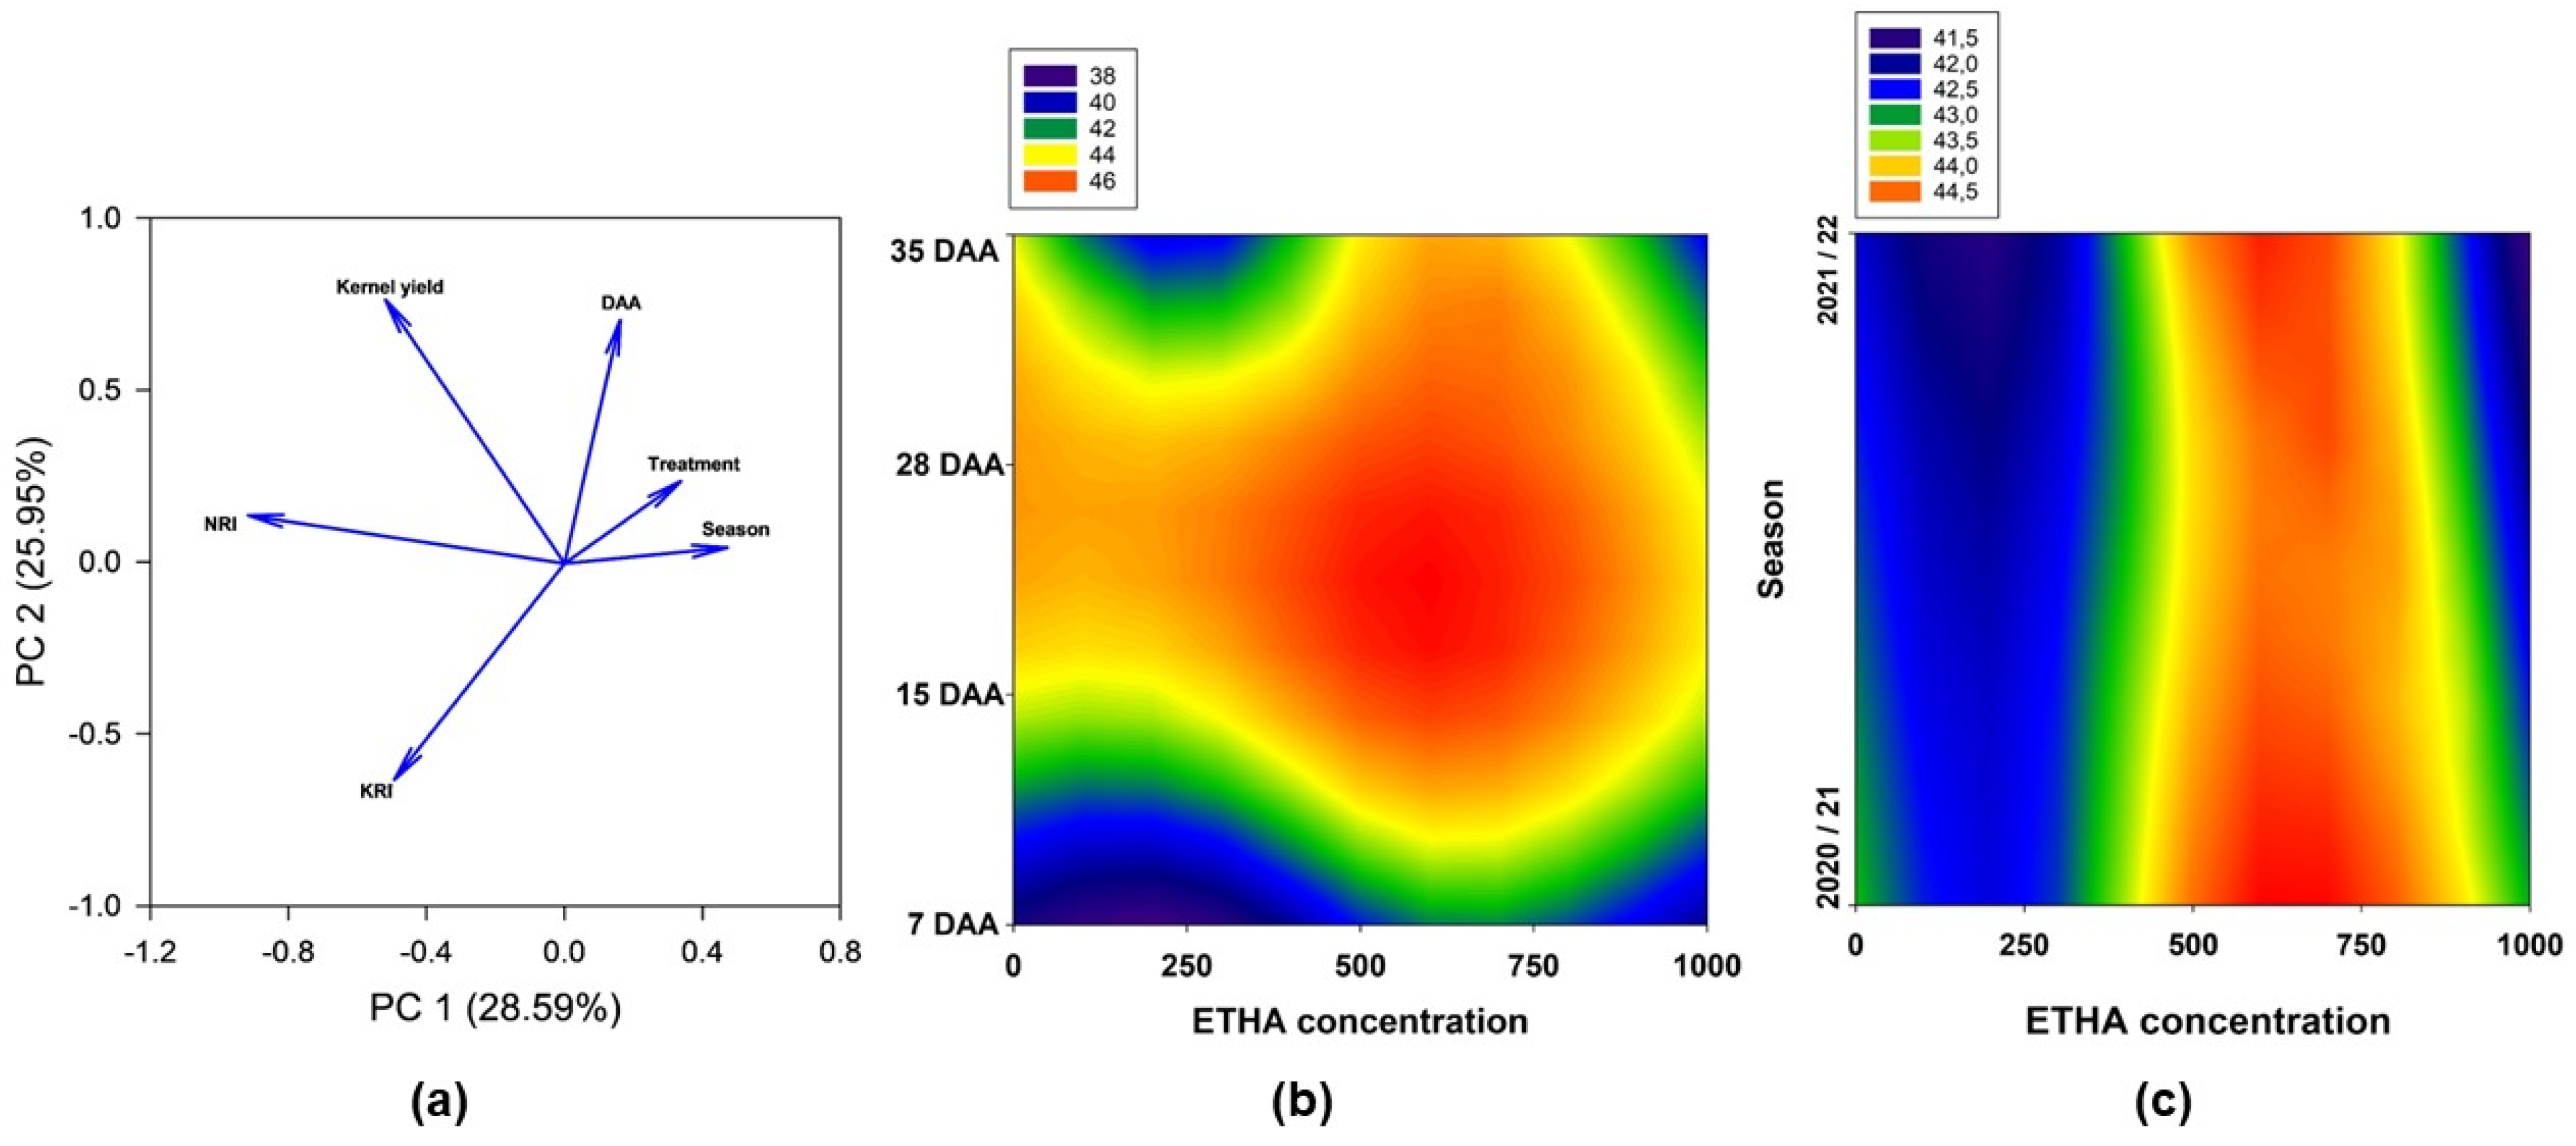
Figure 5.
(a) Principal component analysis (PCA) for industrial parameters considering the 2020/2021 and 2021/2022 seasons: harvest at 7, 15, 28, and 35 DAA after ethephon application; kernel yield; nut roundness index (NRI); and kernel roundness index (KRI) in ETHA. Color map of kernel yield (%) for (b) the 2020/2021 and 2021/2022 seasons and ETHA 0, 250, 500, and 1000 mg L−1 treatments. (c) Harvest moment (7, 15, 28, and 35 DAA) and treatment (ETHA 0, 250, 500, and 1000 mg L−1). Cunco, La Araucanía region.
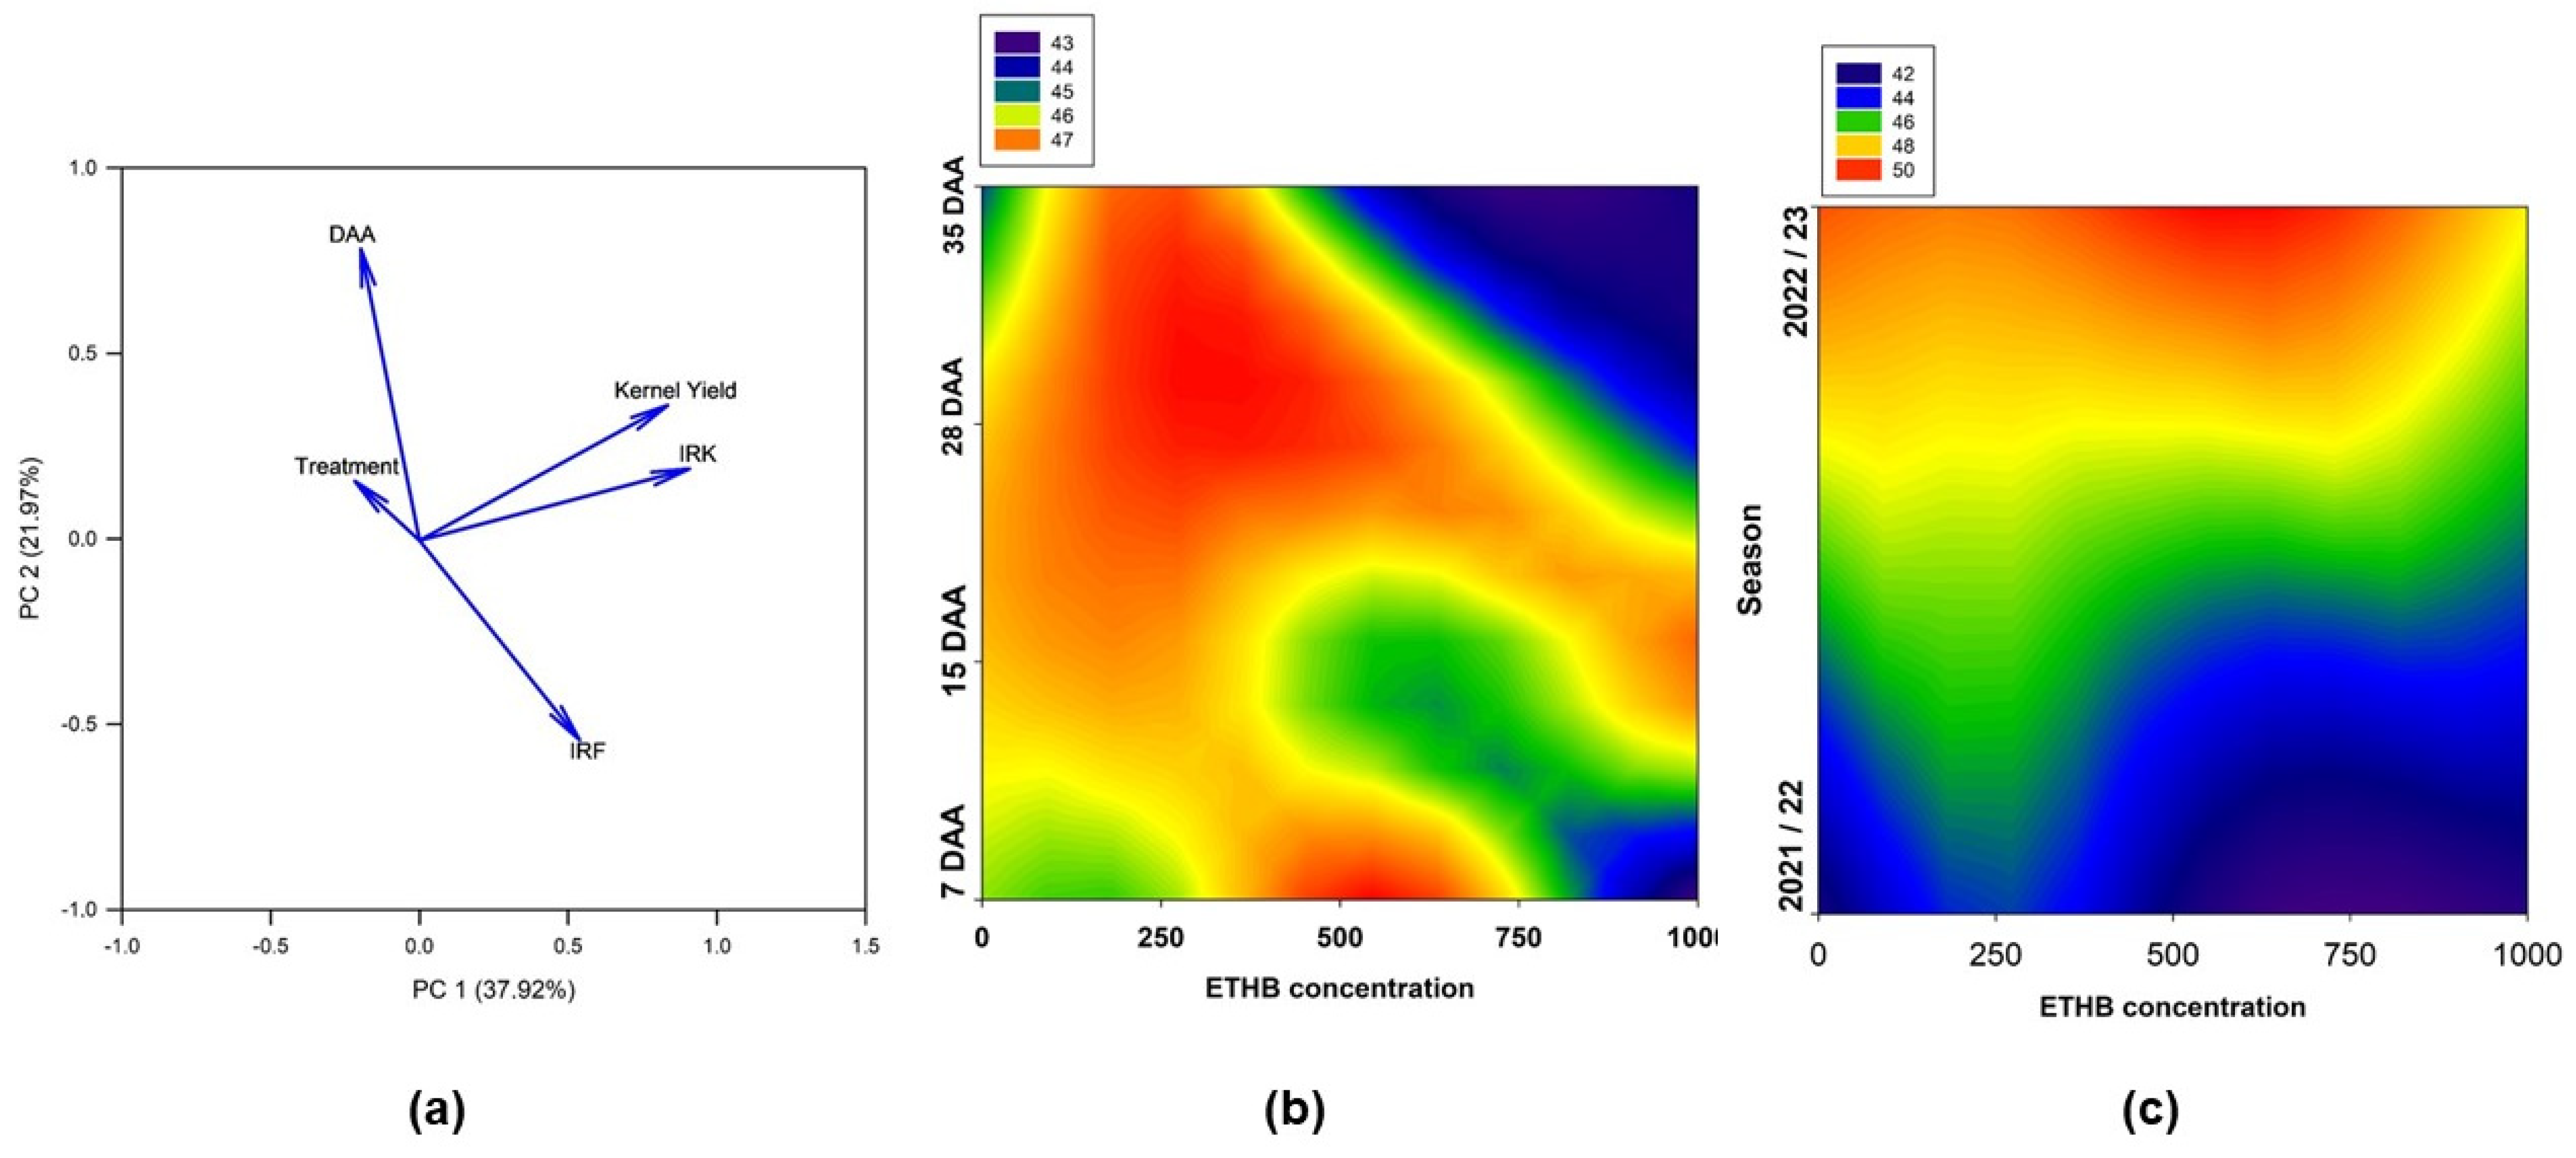
Figure 6.
(a) Principal component analysis (PCA) for industrial parameters considering the 2021/2022 and 2022/2023 seasons: harvest at 7, 15, 28, and 35 DAA after ethephon application; kernel yield; nut roundness index (NRI); and kernel roundness index (KRI) in ETHB. Color map of kernel yield (%) for (b) the 2021/2022 and 2022/2023 seasons and treatment (ETHB 0, 250, 500, and 1000). (c) Harvest moment (7, 15, 28, and 35 DAA) and treatment (ETHB 0, 250, 500, and 1000). Cunco, La Araucanía region.
Figure 7.
Ratio of glomerulus to catkins during May, June, July, and August in four treatments of ethephon applied in concentrations of 0 (control), 250, 500, and 1000 mg L−1 (ppm), identified as ETHA and ETHB, 15 days prior to harvest estimation (single application) for the 2020/2021, 2021/2022, and 2022/2023 seasons. Darker shades indicate greater interaction, while all lighter shades show less interaction. Colors represent the mean of four replications ± S.E (p ≤ 0.05). Cunco, La Araucanía region.
Figure 8.
Shoot length (cm) for three years—2021, 2022, and 2023—for four treatments of ETHA 0, 250, 500, and 1000 mg L−1. Data represent the mean of four replication ± S.E. Cunco, La Araucanía region.
Figure 8.
Shoot length (cm) for three years—2021, 2022, and 2023—for four treatments of ETHA 0, 250, 500, and 1000 mg L−1. Data represent the mean of four replication ± S.E. Cunco, La Araucanía region.
Figure 9.
Shoot length (cm) for two years—2022 and 2023—in four treatments of ETHB 0, 250, 500, and 1000 mg L−1. Data represent the mean of four replications ± S.E (* p ≤ 0.05, NS: No significance). Cunco, La Araucanía region.
Figure 9.
Shoot length (cm) for two years—2022 and 2023—in four treatments of ETHB 0, 250, 500, and 1000 mg L−1. Data represent the mean of four replications ± S.E (* p ≤ 0.05, NS: No significance). Cunco, La Araucanía region.
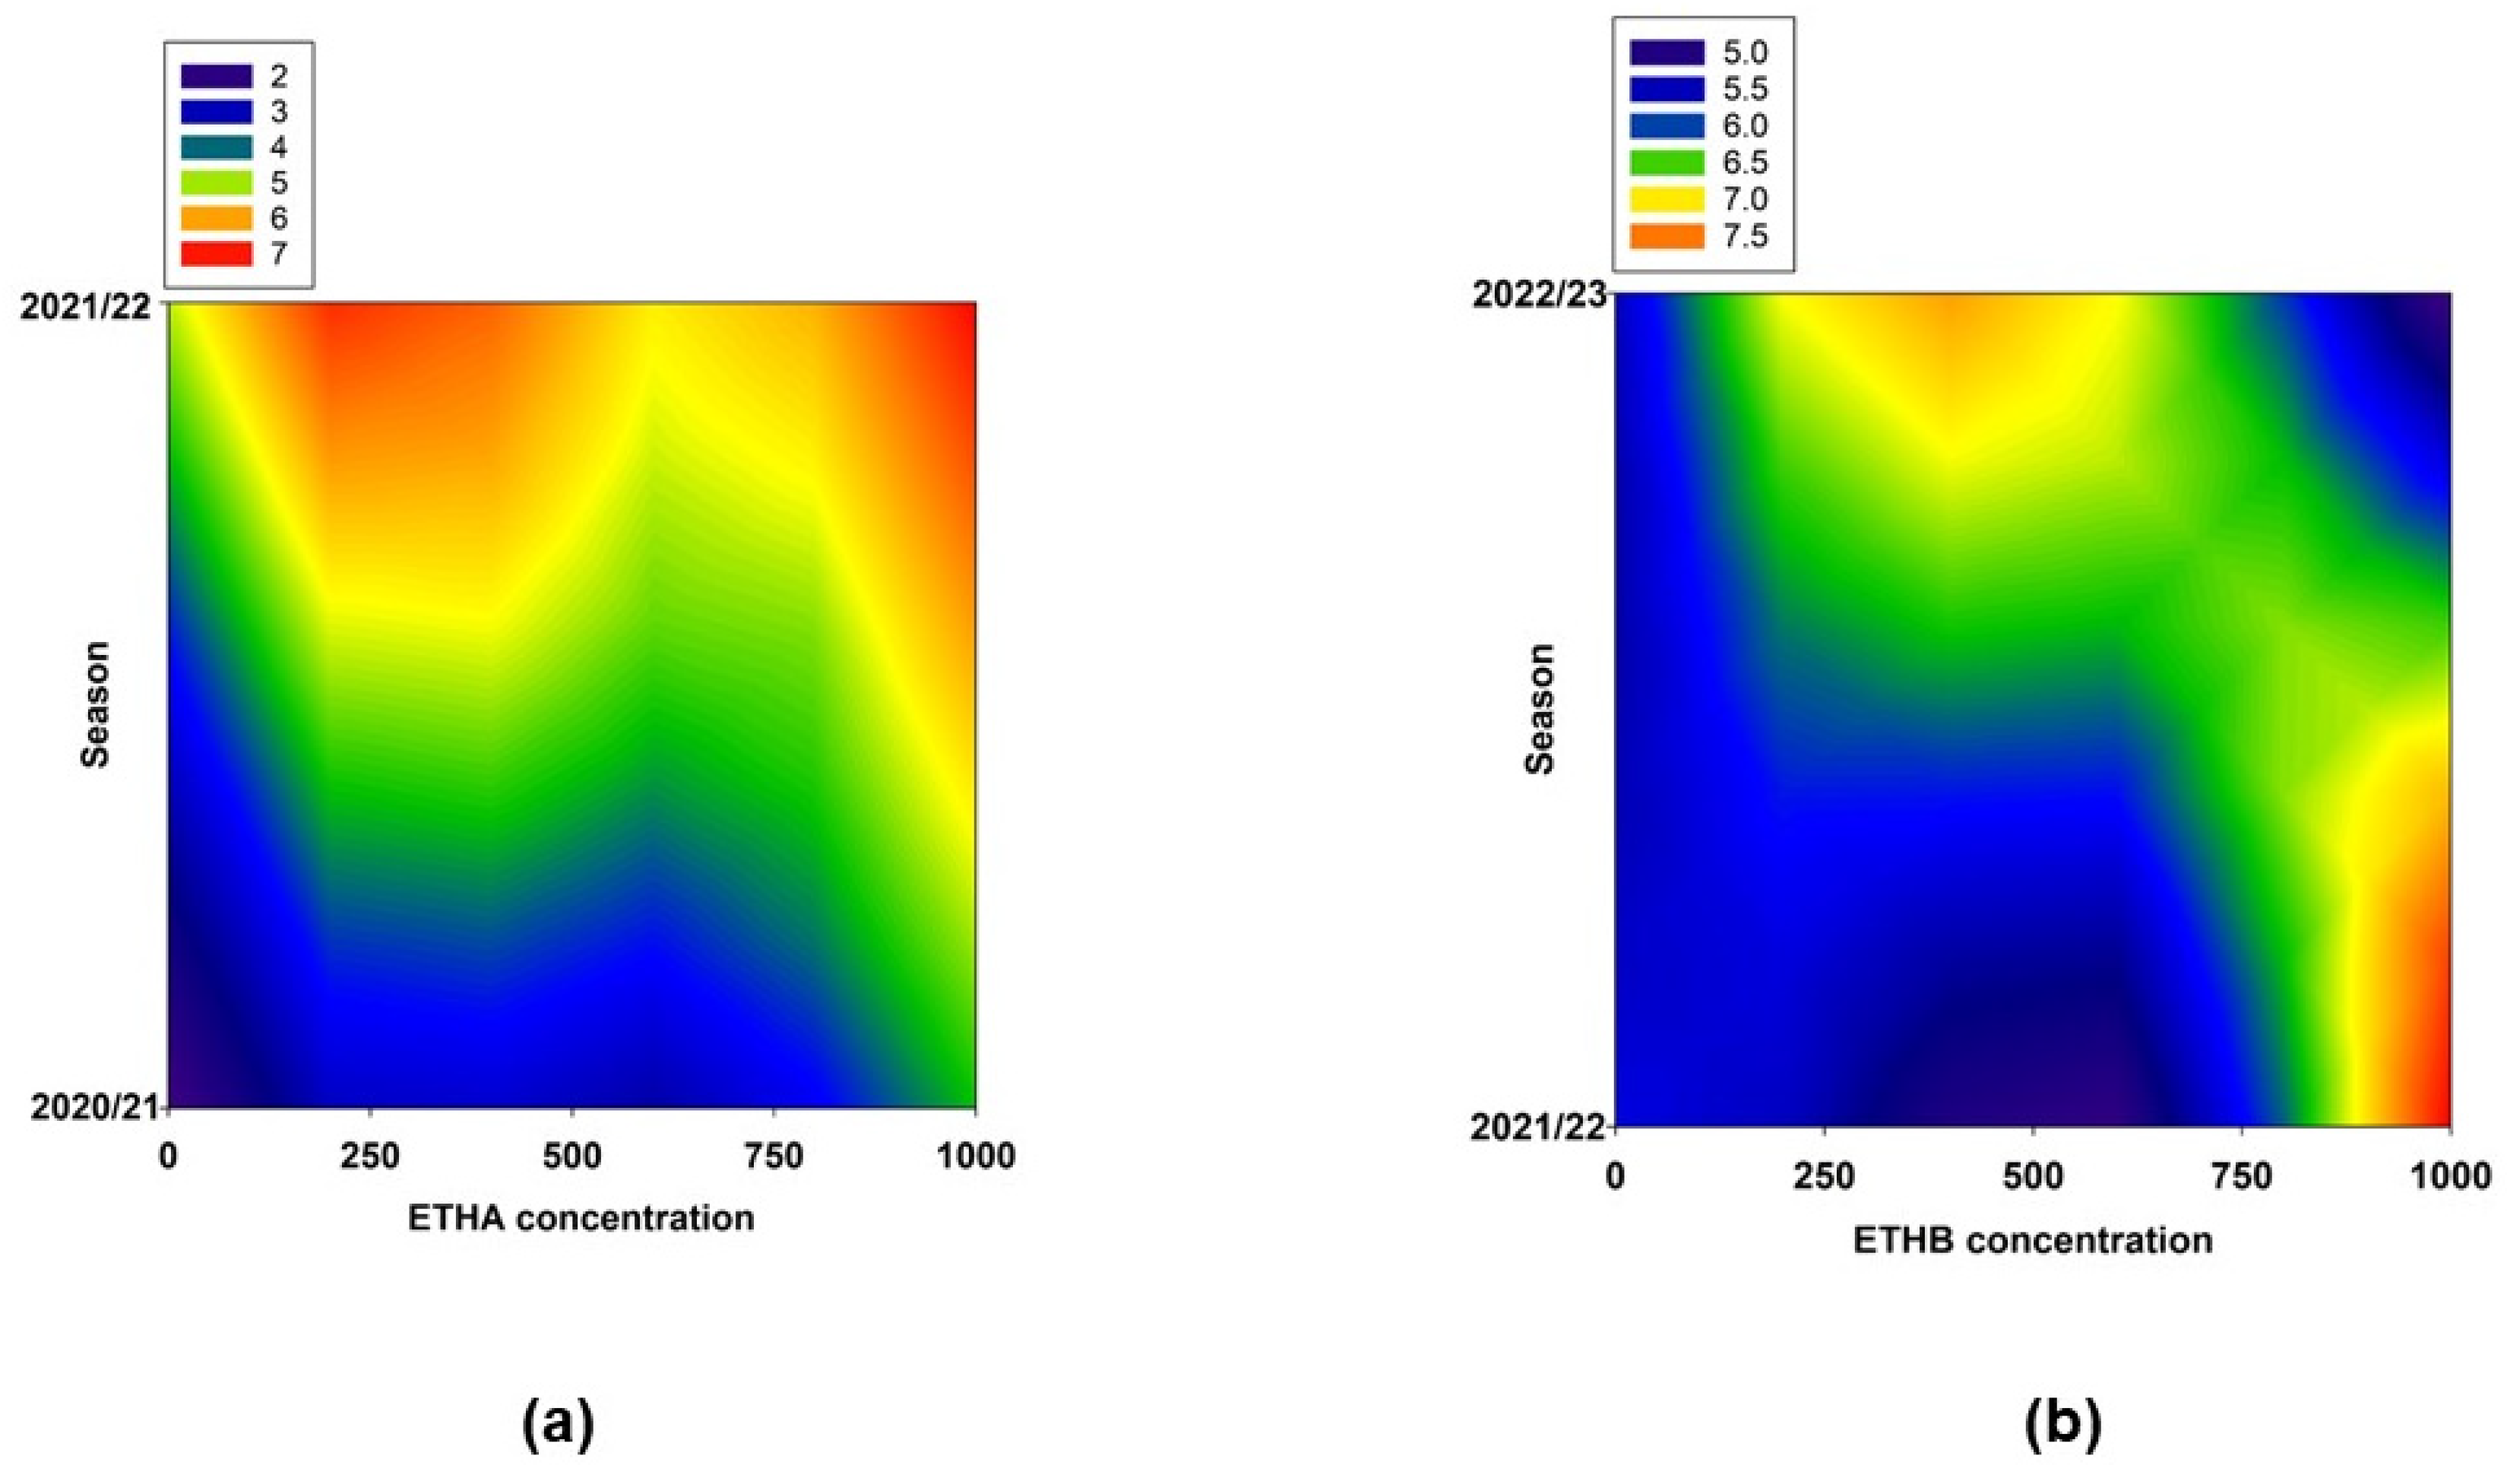
Figure 10.
Color map of catkins that dropped: (a) 2020/2021 and 2021/2022 seasons and treatment (ETHA 0, 250, 500, and 1000), and (b) 2021/2022 and 2022/2023 seasons and treatment (ETHB 0, 250, 500, and 1000). Cunco, La Araucanía region.
Figure 10.
Color map of catkins that dropped: (a) 2020/2021 and 2021/2022 seasons and treatment (ETHA 0, 250, 500, and 1000), and (b) 2021/2022 and 2022/2023 seasons and treatment (ETHB 0, 250, 500, and 1000). Cunco, La Araucanía region.
Table 1.
Ethephon concentration (mg L−1), season, and spraying day for cv. Tonda di Giffoni hazelnut trees at the experimental site, Fundo Caracas, Cunco (39°00′ S, 72°31′ W), La Araucanía region, Chile.
Table 1.
Ethephon concentration (mg L−1), season, and spraying day for cv. Tonda di Giffoni hazelnut trees at the experimental site, Fundo Caracas, Cunco (39°00′ S, 72°31′ W), La Araucanía region, Chile.
| Ethephon Concentration | Season |
|---|
| Treatment | (mg L−1) | 2020/2021 | 2021/2022 | 2022/2023 |
|---|
| | | Administration day |
| ETH 0 | 0 | 28 February 2021 | 6 March 2022 | N/A 1 |
| ETH 250 | 250 |
| ETH 500 | 500 |
| ETH 1000 | 1000 |
Table 2.
Total nut yield (kg ha⁻1) for ETHA and ETHB treatments (0, 250, 500, and 1000 mg L−1) for the 2020/2021, 2021/2022, and 2022/2023 seasons in Cunco, La Araucanía region. Data represent the mean of four replications ± standard error. Different letters indicate significant statistical differences (p ≤ 0.05) among treatments within each ETH spray program. NS: not significant, * p ≤ 0.05.
| Treatment | Season |
|---|
| 2020/2021 | 2021/2022 | 2022/2023 |
|---|
| Nut Yield (kg ha−1) |
|---|
| ETHA 0 | 3377.50 | ± | 70.19 | b | 1956.25 | ± | 84.49 | b | | | | |
| ETHA 250 | 3776.88 | ± | 111.78 | a | 1715.63 | ± | 156.45 | b | | | | |
| ETHA 500 | 3027.13 | ± | 79.40 | c | 2325.00 | ± | 143.04 | a | | | | |
| ETHA 1000 | 3572.50 | ± | 74.02 | ab | 1715.63 | ± | 105.03 | b | | | | |
| ETHB 0 | | | | | 2432.50 | ± | 74.48 | b | 3105.00 | ± | 63.57 | b |
| ETHB 250 | | | | | 2705.00 | ± | 83.93 | a | 3666.88 | ± | 50.66 | a |
| ETHB 500 | | | | | 2182.50 | ± | 132.98 | c | 3251.25 | ± | 119.17 | b |
| ETHB 1000 | | | | | 2345.00 | ± | 116.09 | bc | 3288.75 | ± | 84.90 | b |
| T | NS | NS | NS |
| S | * | * | * |
| T × S | NS | NS | NS |
Table 3.
Industrial quality of nuts and kernels at 7, 15, 28, and 35 DAA per treatment (T) with ETHA 0, 250, 500, and 1000 mg L−1 for the 2020/2021 and 2021/2022 seasons (S). Data represent the mean of four replications ± S.E (n = 40). Cunco, La Araucanía region. Different letters indicate statistical differences (p ≤ 0.05) among treatments within DAA. NS, not significant; * p ≤ 0.05.
| | | 2020/2021 | 2021/2022 |
|---|
| DAA | Treatment | Nut Weight | Kernel Weight | Shell Thickness | Nut Weight | Kernel Weight | Shell Thickness |
|---|
| (g) | (mm) | (g) | (mm) |
|---|
| 7 | ETHA 0 | 2.28 | ± | 0.10 | b | 0.85 | ± | 0.05 | c | 1.35 | ± | 0.08 | a | 2.54 | ± | 0.07 | b | 1.16 | ± | 0.03 | a | 1.34 | ± | 0.04 | ab |
| ETHA 250 | 2.35 | ± | 0.11 | b | 0.95 | ± | 0.04 | c | 1.35 | ± | 0.13 | a | 2.41 | ± | 0.08 | b | 1.16 | ± | 0.03 | a | 1.43 | ± | 0.05 | ab |
| ETHA 500 | 2.25 | ± | 0.02 | b | 0.95 | ± | 0.04 | c | 1.18 | ± | 0.10 | ab | 2.38 | ± | 0.07 | b | 1.09 | ± | 0.04 | ab | 1.31 | ± | 0.04 | ab |
| ETHA 1000 | 2.23 | ± | 0.11 | b | 0.92 | ± | 0.07 | c | 1.21 | ± | 0.12 | ab | 2.27 | ± | 0.08 | bc | 1.03 | ± | 0.05 | b | 1.29 | ± | 0.04 | ab |
| | Mean | 2.28 | ± | 0.08 | | 0.92 | ± | 0.05 | | 1.27 | ± | 0.11 | | 2.40 | ± | 0.08 | | 1.11 | ± | 0.04 | | 1.34 | ± | 0.04 | |
| 15 | ETHA 0 | 2.51 | ± | 0.05 | ab | 1.19 | ± | 0.03 | ab | 1.27 | ± | 0.11 | ab | 2.55 | ± | 0.08 | b | 1.14 | ± | 0.06 | ab | 1.57 | ± | 0.05 | a |
| ETHA 250 | 2.57 | ± | 0.09 | a | 1.18 | ± | 0.06 | ab | 1.24 | ± | 0.14 | ab | 2.51 | ± | 0.07 | b | 1.10 | ± | 0.05 | ab | 1.41 | ± | 0.14 | ab |
| ETHA 500 | 2.40 | ± | 0.06 | b | 1.15 | ± | 0.05 | b | 1.21 | ± | 0.12 | ab | 2.40 | ± | 0.05 | b | 1.10 | ± | 0.03 | ab | 1.25 | ± | 0.04 | b |
| ETHA 1000 | 2.50 | ± | 0.07 | ab | 1.14 | ± | 0.04 | ab | 1.31 | ± | 0.15 | ab | 2.78 | ± | 0.24 | a | 1.13 | ± | 0.04 | ab | 1.54 | ± | 0.04 | a |
| | Mean | 2.49 | ± | 0.07 | | 1.16 | ± | 0.04 | | 1.26 | ± | 0.13 | | 2.56 | ± | 0.11 | | 1.12 | ± | 0.04 | | 1.44 | ± | 0.07 | |
| 28 | ETHA 0 | 2.70 | ± | 0.04 | a | 1.26 | ± | 0.02 | a | 1.29 | ± | 0.12 | ab | 2.54 | ± | 0.08 | b | 1.10 | ± | 0.06 | ab | 1.39 | ± | 0.05 | ab |
| ETHA 250 | 2.62 | ± | 0.09 | ab | 1.24 | ± | 0.04 | a | 1.25 | ± | 0.11 | ab | 2.54 | ± | 0.09 | b | 1.15 | ± | 0.04 | ab | 1.51 | ± | 0.04 | a |
| ETHA 500 | 2.42 | ± | 0.05 | b | 1.13 | ± | 0.03 | b | 1.08 | ± | 0.09 | b | 2.44 | ± | 0.06 | b | 1.14 | ± | 0.05 | ab | 1.49 | ± | 0.05 | a |
| ETHA 1000 | 2.54 | ± | 0.06 | ab | 1.17 | ± | 0.03 | ab | 1.21 | ± | 0.12 | ab | 2.28 | ± | 0.09 | c | 1.02 | ± | 0.06 | bc | 1.53 | ± | 0.04 | a |
| | Mean | 2.57 | ± | 0.06 | | 1.20 | ± | 0.03 | | 1.21 | ± | 0.11 | | 2.45 | ± | 0.08 | | 1.10 | ± | 0.05 | | 1.48 | ± | 0.05 | |
| 35 | ETHA 0 | 2.37 | ± | 0.07 | b | 1.05 | ± | 0.05 | bc | 1.34 | ± | 0.13 | a | 2.49 | ± | 0.08 | b | 1.07 | ± | 0.06 | ab | 1.50 | ± | 0.05 | ab |
| ETHA 250 | 2.28 | ± | 0.11 | b | 1.05 | ± | 0.04 | b | 1.07 | ± | 0.10 | b | 2.44 | ± | 0.09 | b | 1.07 | ± | 0.05 | ab | 1.35 | ± | 0.05 | ab |
| ETHA 500 | 2.68 | ± | 0.08 | a | 1.20 | ± | 0.07 | a | 1.30 | ± | 0.08 | ab | 2.35 | ± | 0.06 | bc | 1.07 | ± | 0.05 | bc | 1.28 | ± | 0.04 | b |
| ETHA 1000 | 2.59 | ± | 0.10 | ab | 1.18 | ± | 0.03 | ab | 1.26 | ± | 0.11 | ab | 2.20 | ± | 0.07 | c | 0.96 | ± | 0.06 | c | 1.20 | ± | 0.03 | b |
| | Mean | 2.48 | ± | 0.09 | | 1.12 | ± | 0.05 | | 1.24 | ± | 0.11 | | 2.37 | ± | 0.07 | | 1.04 | ± | 0.05 | | 1.33 | ± | 0.04 | |
| Significance | S | NS | | NS | | * | | NS | | NS | | * | |
| DAA | * | | * | | NS | | * | | * | | NS | |
| T | NS | | NS | | NS | | NS | | NS | | NS | |
| S × DAA | NS | | NS | | NS | | NS | | NS | | NS | |
| S × T | NS | | NS | | NS | | NS | | NS | | NS | |
| DAA × T | NS | | NS | | NS | | NS | | NS | | NS | |
| S × DAA × T | NS | | NS | | NS | | NS | | NS | | NS | |
Table 4.
Industrial quality of nuts and kernels at 7, 15, 28, and 35 DAA per treatment (T) with ETHB 0, 250, 500, and 1000 mg L−1 for the 2021/2022 and 2022/2023 seasons (S). Data represent the mean of four replications ± S.E (n = 40). Cunco, La Araucanía region. Different letters indicate statistical differences (p ≤ 0.05) among treatments within each spray program. NS, not significant; * p ≤ 0.05.
| | | 2021/2022 | 2022/2023 |
|---|
| DAA | Treatment | Nut Weight | Kernel Weight | Shell Thickness | Nut Weight | Kernel Weight | Shell Thickness |
|---|
| (g) | (mm) | (g) | (mm) |
|---|
| 7 | ETHB 0 | 2.55 | ± | 0.08 | a | 1.14 | ± | 0.05 | a | 1.57 | ± | 0.05 | a | 2.27 | ± | 0.07 | ab | 1.14 | ± | 0.04 | ab | 2.50 | ± | 1.36 | a |
| ETHB 250 | 2.46 | ± | 0.08 | a | 1.16 | ± | 0.03 | ab | 1.27 | ± | 0.04 | b | 2.38 | ± | 0.05 | a | 1.14 | ± | 0.05 | a | 1.24 | ± | 0.17 | b |
| ETHB 500 | 2.49 | ± | 0.07 | ab | 1.22 | ± | 0.04 | ab | 1.26 | ± | 0.04 | b | 2.28 | ± | 0.07 | a | 1.18 | ± | 0.08 | a | 1.22 | ± | 0.15 | b |
| ETHB 1000 | 2.43 | ± | 0.08 | b | 1.09 | ± | 0.05 | b | 1.35 | ± | 0.05 | b | 2.21 | ± | 0.07 | ab | 1.02 | ± | 0.05 | ab | 1.25 | ± | 0.15 | b |
| | Mean | 2.48 | ± | 0.08 | | 1.15 | ± | 0.04 | | 1.36 | ± | 0.05 | | 2.28 | ± | 0.07 | | 1.12 | ± | 0.06 | | 1.55 | ± | 0.46 | |
| 15 | ETHB 0 | 2.53 | ± | 0.07 | ab | 1.12 | ± | 0.04 | a | 1.33 | ± | 0.05 | b | 2.34 | ± | 0.06 | a | 1.20 | ± | 0.03 | ab | 1.26 | ± | 0.21 | b |
| ETHB 250 | 2.64 | ± | 0.06 | a | 1.20 | ± | 0.03 | a | 1.38 | ± | 0.05 | b | 2.31 | ± | 0.08 | ab | 1.20 | ± | 0.03 | ab | 1.20 | ± | 0.14 | b |
| ETHB 500 | 2.47 | ± | 0.05 | ab | 1.16 | ± | 0.04 | ab | 1.32 | ± | 0.04 | b | 2.11 | ± | 0.08 | a | 1.17 | ± | 0.03 | a | 1.16 | ± | 0.14 | b |
| ETHB 1000 | 2.57 | ± | 0.08 | b | 1.16 | ± | 0.05 | ab | 1.34 | ± | 0.05 | b | 2.34 | ± | 0.07 | ab | 1.21 | ± | 0.02 | ab | 1.28 | ± | 0.18 | b |
| | Mean | 2.55 | ± | 0.07 | | 1.16 | ± | 0.04 | | 1.34 | ± | 0.05 | | 2.28 | ± | 0.07 | | 1.19 | ± | 0.03 | | 1.22 | ± | 0.17 | |
| 28 | ETHB 0 | 2.48 | ± | 0.09 | ab | 1.07 | ± | 0.07 | a | 1.50 | ± | 0.05 | a | 2.35 | ± | 0.04 | ab | 1.19 | ± | 0.02 | ab | 1.22 | ± | 0.18 | b |
| ETHB 250 | 2.47 | ± | 0.06 | ab | 1.12 | ± | 0.05 | a | 1.40 | ± | 0.05 | ab | 2.47 | ± | 0.07 | b | 1.27 | ± | 0.03 | a | 1.26 | ± | 0.18 | b |
| ETHB 500 | 2.22 | ± | 0.09 | b | 1.01 | ± | 0.07 | b | 1.40 | ± | 0.06 | ab | 2.37 | ± | 0.05 | a | 1.22 | ± | 0.02 | ab | 1.22 | ± | 0.20 | b |
| ETHB 1000 | 2.28 | ± | 0.09 | b | 0.96 | ± | 0.06 | b | 1.42 | ± | 0.05 | ab | 2.23 | ± | 0.07 | ab | 1.15 | ± | 0.04 | ab | 1.16 | ± | 0.22 | b |
| | Mean | 2.36 | ± | 0.08 | | 1.04 | ± | 0.06 | | 1.43 | ± | 0.05 | | 2.36 | ± | 0.05 | | 1.21 | ± | 0.03 | | 1.22 | ± | 0.20 | |
| 35 | ETHB 0 | 2.23 | ± | 0.09 | ab | 0.97 | ± | 0.06 | ab | 1.40 | ± | 0.05 | ab | 2.22 | ± | 0.07 | ab | 1.16 | ± | 0.03 | b | 1.30 | ± | 0.23 | b |
| ETHB 250 | 2.30 | ± | 0.07 | a | 1.03 | ± | 0.07 | a | 1.40 | ± | 0.11 | ab | 2.27 | ± | 0.06 | ab | 1.15 | ± | 0.04 | a | 1.25 | ± | 0.19 | b |
| ETHB 500 | 2.19 | ± | 0.11 | b | 0.91 | ± | 0.08 | b | 1.41 | ± | 0.03 | b | 2.22 | ± | 0.05 | b | 1.15 | ± | 0.02 | ab | 2.52 | ± | 1.44 | a |
| ETHB 1000 | 2.31 | ± | 0.10 | b | 0.98 | ± | 0.07 | b | 1.39 | ± | 0.05 | b | 2.25 | ± | 0.06 | ab | 1.16 | ± | 0.03 | ab | 1.31 | ± | 0.21 | b |
| | Mean | 2.26 | ± | 0.09 | | 0.97 | ± | 0.07 | | 1.40 | ± | 0.06 | | 2.24 | ± | 0.06 | | 1.16 | ± | 0.03 | | 1.59 | ± | 0.52 | |
| Significance | S | * | | * | | * | | * | | * | | * | |
| DAA | NS | | NS | | NS | | NS | | NS | | NS | |
| T | NS | | NS | | NS | | NS | | NS | | NS | |
| S × DAA | NS | | NS | | NS | | NS | | NS | | NS | |
| S × T | NS | | NS | | NS | | NS | | NS | | NS | |
| DAA × T | NS | | NS | | NS | | NS | | NS | | NS | |
| S × DAA × T | NS | | NS | | NS | | NS | | NS | | NS | |
Table 5.
Wrinkled, moldy, blank, and double kernels detected at 7, 15, 28, and 35 DAA under ETHA (0, 250, 500, and 1000 mg L−1) for the 2020/2021 and 2021/2022 seasons. Cunco, La Araucanía region (n = 40).
Table 5.
Wrinkled, moldy, blank, and double kernels detected at 7, 15, 28, and 35 DAA under ETHA (0, 250, 500, and 1000 mg L−1) for the 2020/2021 and 2021/2022 seasons. Cunco, La Araucanía region (n = 40).
| Treatment | DAA | Season |
|---|
| 2020/2021 | 2021/2022 |
|---|
| Wrinkled | Moldy | Blank | Double | Wrinkled | Moldy | Blank | Double |
|---|
| (%) |
|---|
| ETHA 0 | 7 | 20.00 | 2.50 | 0.00 | 5.00 | 2.50 | 5.00 | 5.00 | 2.50 |
| 15 | 5.00 | 7.50 | 0.00 | 2.50 | 7.50 | 7.50 | 7.50 | 15.00 |
| 28 | 0.00 | 0.00 | 0.00 | 0.00 | 0.00 | 6.67 | 6.67 | 0.00 |
| 35 | 2.50 | 10.00 | 0.00 | 0.00 | 2.50 | 10.00 | 5.00 | 10.00 |
| Mean | 6.88 | 5.00 | 0.00 | 1.88 | 3.13 | 7.29 | 6.04 | 6.88 |
| ETHA 250 | 7 | 37.50 | 2.50 | 7.50 | 2.50 | 0.00 | 5.00 | 5.00 | 0.00 |
| 15 | 5.00 | 5.00 | 0.00 | 2.50 | 0.00 | 10.00 | 7.50 | 5.00 |
| 28 | 2.50 | 2.50 | 2.50 | 0.00 | 7.50 | 15.00 | 2.50 | 30.00 |
| 35 | 0.00 | 2.50 | 2.50 | 0.00 | 2.50 | 10.00 | 10.00 | 5.00 |
| Mean | 11.25 | 3.13 | 3.13 | 1.25 | 2.50 | 10.00 | 6.25 | 10.00 |
| ETHA 500 | 7 | 15.00 | 7.50 | 5.00 | 7.50 | 2.50 | 2.50 | 2.50 | 5.00 |
| 15 | 2.50 | 0.00 | 0.00 | 0.00 | 7.50 | 10.00 | 0.00 | 0.00 |
| 28 | 2.50 | 2.50 | 0.00 | 2.50 | 7.50 | 15.00 | 0.00 | 25.00 |
| 35 | 5.00 | 0.00 | 0.00 | 2.50 | 0.00 | 2.50 | 2.50 | 5.00 |
| Mean | 6.25 | 2.50 | 1.25 | 3.13 | 4.38 | 7.50 | 1.25 | 8.75 |
| ETHA 1000 | 7 | 15.00 | 12.50 | 10.00 | 5.00 | 2.50 | 10.00 | 5.00 | 5.00 |
| 15 | 12.50 | 0.00 | 0.00 | 2.50 | 5.00 | 10.00 | 0.00 | 30.00 |
| 28 | 0.00 | 0.00 | 0.00 | 5.00 | 2.50 | 7.50 | 5.00 | 32.50 |
| 35 | 0.00 | 0.00 | 5.00 | 2.50 | 0.00 | 5.00 | 10.00 | 15.00 |
| Mean | 6.88 | 3.13 | 3.75 | 3.75 | 2.50 | 8.13 | 5.00 | 20.63 |
Table 6.
Wrinkled, moldy, blank, and double kernels detected in hazelnuts harvested at 7, 15, 28, and 35 DAA under ETHB (0, 250, 500, and 1000 mg L−1) for the 2021/2022 and 2022/2023 seasons. Cunco, La Araucanía region (n = 40).
Table 6.
Wrinkled, moldy, blank, and double kernels detected in hazelnuts harvested at 7, 15, 28, and 35 DAA under ETHB (0, 250, 500, and 1000 mg L−1) for the 2021/2022 and 2022/2023 seasons. Cunco, La Araucanía region (n = 40).
| Treatment | DAA | Season |
|---|
| 2021/2022 | 2022/2023 |
|---|
| Wrinkled | Moldy | Blank | Double | Wrinkled | Moldy | Blank | Double |
|---|
| (%) |
|---|
| ETHB 0 | 7 | 7.5 | 7.5 | 7.5 | 15.0 | 2.5 | 5.0 | 0.0 | 5.0 |
| 15 | 5.0 | 7.5 | 7.5 | 7.5 | 0.0 | 0.0 | 0.0 | 0.0 |
| 28 | 3.3 | 13.3 | 6.7 | 3.3 | 0.0 | 0.0 | 0.0 | 0.0 |
| 35 | 0.0 | 7.5 | 5.0 | 5.0 | 2.5 | 2.5 | 2.5 | 0.0 |
| Mean | 3.96 | 8.96 | 6.67 | 7.71 | 1.25 | 1.88 | 0.63 | 1.25 |
| ETHB 250 | 7 | 2.5 | 2.5 | 5.0 | 7.5 | 0.0 | 5.0 | 2.5 | 0.0 |
| 15 | 0.0 | 12.5 | 0.0 | 7.5 | 2.5 | 2.5 | 5.0 | 2.5 |
| 28 | 2.5 | 12.5 | 0.0 | 2.5 | 0.0 | 0.0 | 0.0 | 0.0 |
| 35 | 0.0 | 12.5 | 10.0 | 0.0 | 2.5 | 2.5 | 2.5 | 2.5 |
| Mean | 1.25 | 10.00 | 3.75 | 4.38 | 1.25 | 2.50 | 2.50 | 1.25 |
| ETHB 500 | 7 | 0.0 | 12.5 | 5.0 | 7.5 | 2.5 | 7.5 | 0.0 | 2.5 |
| 15 | 0.0 | 5.0 | 0.0 | 5.0 | 0.0 | 5.0 | 10.0 | 0.0 |
| 28 | 2.5 | 7.5 | 12.5 | 0.0 | 0.0 | 0.0 | 0.0 | 2.5 |
| 35 | 2.5 | 2.5 | 20.0 | 2.5 | 2.5 | 2.5 | 0.0 | 2.5 |
| Mean | 1.25 | 6.88 | 9.38 | 3.75 | 1.25 | 3.75 | 2.50 | 1.88 |
| ETHB 1000 | 7 | 2.5 | 0.0 | 10.0 | 10.0 | 12.5 | 2.5 | 2.5 | 2.5 |
| 15 | 0.0 | 7.5 | 5.0 | 0.0 | 0.0 | 5.0 | 2.5 | 2.5 |
| 28 | 10.0 | 2.5 | 10.0 | 5.0 | 0.0 | 0.0 | 0.0 | 0.0 |
| 35 | 5.0 | 7.5 | 15.0 | 0.0 | 2.5 | 2.5 | 0.0 | 0.0 |
| Mean | 4.38 | 4.38 | 10.00 | 3.75 | 3.75 | 2.50 | 1.25 | 1.25 |
Table 7.
Quality features of kernel yield (%), nut roundness index (NRI), and kernel roundness index (KRI) at 7, 15, 28, and 35 DAA per treatment (T) under ETHA 0, 250, 500, and 1000 mg L−1 for the 2020/2021 and 2021/2022 seasons (S). Data represent the mean of four replications ± S.E (n = 40). Cunco, La Araucanía region. Different letters indicate statistical differences (p ≤ 0.05) among treatments within each spray program. NS, not significant; ** p ≤ 0.001.
| | | 2020/2021 | 2021/2022 |
|---|
| DAA | Treatment | Kernel Yield | NRI | KRI | Kernel Yield | NRI | KRI |
|---|
| (%) | | | (%) | | |
|---|
| 7 | ETHA 0 | 40.57 | ± | 1.64 | b | 1.02 | ± | 0.01 | a | 0.98 | ± | 0.06 | a | 43.86 | ± | 1.24 | ab | 0.95 | ± | 0.01 | a | 0.84 | ± | 0.04 | bc |
| ETHA 250 | 36.15 | ± | 3.19 | c | 0.94 | ± | 0.01 | b | 0.83 | ± | 0.08 | b | 42.95 | ± | 2.12 | ab | 0.93 | ± | 0.02 | ab | 0.89 | ± | 0.03 | abc |
| ETHA 500 | 41.93 | ± | 2.24 | ab | 0.96 | ± | 0.03 | b | 0.90 | ± | 0.06 | ab | 44.00 | ± | 2.74 | ab | 0.92 | ± | 0.01 | b | 0.91 | ± | 0.03 | ab |
| ETHA 1000 | 39.15 | ± | 2.63 | b | 0.97 | ± | 0.01 | b | 0.91 | ± | 0.02 | b | 40.20 | ± | 1.63 | b | 0.93 | ± | 0.01 | a | 0.84 | ± | 0.04 | bc |
| | Mean | 39.45 | ± | 2.43 | | 0.97 | ± | 0.02 | | 0.90 | ± | 0.05 | | 42.75 | ± | 1.93 | | 0.93 | ± | 0.01 | | 0.87 | ± | 0.04 | |
| 15 | ETHA 0 | 40.55 | ± | 3.32 | b | 0.99 | ± | 0.03 | ab | 0.92 | ± | 0.06 | ab | 41.55 | ± | 2.55 | ab | 1.00 | ± | 0.02 | a | 0.93 | ± | 0.06 | ab |
| ETHA 250 | 43.49 | ± | 0.96 | ab | 0.92 | ± | 0.02 | c | 0.91 | ± | 0.02 | b | 41.96 | ± | 2.24 | b | 0.95 | ± | 0.02 | a | 0.82 | ± | 0.04 | c |
| ETHA 500 | 45.86 | ± | 1.63 | a | 0.92 | ± | 0.01 | c | 0.94 | ± | 0.02 | ab | 43.41 | ± | 1.53 | a | 0.94 | ± | 0.02 | a | 0.90 | ± | 0.04 | bc |
| ETHA 1000 | 43.12 | ± | 1.53 | ab | 0.96 | ± | 0.02 | b | 0.94 | ± | 0.02 | ab | 41.56 | ± | 0.99 | ab | 0.94 | ± | 0.01 | ab | 0.87 | ± | 0.03 | bc |
| | Mean | 43.25 | ± | 1.86 | | 0.95 | ± | 0.02 | | 0.93 | ± | 0.03 | | 42.12 | ± | 1.83 | | 0.96 | ± | 0.02 | | 0.88 | ± | 0.04 | |
| 28 | ETHA 0 | 44.54 | ± | 1.51 | ab | 0.97 | ± | 0.02 | b | 0.95 | ± | 0.05 | ab | 43.65 | ± | 1.11 | a | 0.97 | ± | 0.02 | a | 0.92 | ± | 0.05 | ab |
| ETHA 250 | 43.72 | ± | 1.51 | ab | 0.95 | ± | 0.01 | bc | 0.89 | ± | 0.01 | b | 45.42 | ± | 0.76 | a | 0.95 | ± | 0.01 | a | 0.97 | ± | 0.02 | a |
| ETHA 500 | 45.33 | ± | 2.45 | ab | 0.94 | ± | 0.01 | bc | 0.92 | ± | 0.02 | ab | 46.72 | ± | 1.28 | a | 0.93 | ± | 0.01 | ab | 0.95 | ± | 0.04 | a |
| ETHA 1000 | 42.26 | ± | 1.34 | b | 0.93 | ± | 0.01 | c | 0.88 | ± | 0.01 | b | 45.61 | ± | 0.99 | a | 0.96 | ± | 0.01 | a | 0.98 | ± | 0.04 | a |
| | Mean | 43.96 | ± | 1.71 | | 0.94 | ± | 0.01 | | 0.91 | ± | 0.02 | | 45.35 | ± | 1.03 | | 0.95 | ± | 0.01 | | 0.95 | ± | 0.04 | |
| 35 | ETHA 0 | 41.93 | ± | 3.19 | ab | 0.96 | ± | 0.01 | bc | 0.83 | ± | 0.08 | b | 41.20 | ± | 2.14 | ab | 0.95 | ± | 0.02 | a | 0.89 | ± | 0.07 | abc |
| ETHA 250 | 44.00 | ± | 2.24 | ab | 0.96 | ± | 0.01 | b | 0.92 | ± | 0.02 | ab | 43.06 | ± | 2.66 | ab | 0.92 | ± | 0.01 | b | 0.87 | ± | 0.05 | bc |
| ETHA 500 | 41.56 | ± | 1.05 | bc | 0.94 | ± | 0.02 | bc | 0.94 | ± | 0.06 | ab | 44.57 | ± | 1.05 | a | 0.93 | ± | 0.01 | ab | 0.85 | ± | 0.04 | bc |
| ETHA 1000 | 43.49 | ± | 1.11 | ab | 0.93 | ± | 0.02 | bc | 0.95 | ± | 0.02 | a | 40.09 | ± | 1.47 | b | 0.92 | ± | 0.01 | b | 0.83 | ± | 0.02 | bc |
| | Mean | 42.75 | ± | 1.90 | | 0.95 | ± | 0.02 | | 0.91 | ± | 0.05 | | 42.23 | ± | 1.83 | | 0.93 | ± | 0.01 | | 0.86 | ± | 0.04 | |
| Significance | S | NS | NS | ** | NS | NS | ** |
| DAA | ** | NS | NS | ** | NS | NS |
| T | NS | NS | NS | NS | NS | NS |
| S × DAA | NS | NS | NS | NS | NS | NS |
| S × T | NS | NS | NS | NS | NS | NS |
| DAA × T | NS | NS | NS | NS | NS | NS |
| S × DAA × T | NS | NS | NS | NS | NS | NS |
Table 8.
Quality features of kernel yield (%), nut roundness index (NRI), and kernel roundness index (KRI) at 7, 15, 28, and 35 DAA per treatment (T) under ETHA 0, 250, 500, and 1000 mg L−1 for the 2021/2022 and 2022/2023 seasons (S). Data represent the mean of four replications ± S.E (n = 40). Cunco, La Araucanía region. Different letters indicate statistical differences (p ≤ 0.05) among treatments within each spray program. NS, not significant; ** p ≤ 0.001.
| | | 2021/2022 | 2022/2023 |
|---|
| DAA | Treatment | Kernel Yield | NRI | KRI | Kernel Yield | NRI | KRI |
|---|
| (%) | | | (%) | | |
|---|
| 7 | ETHB 0 | 41.55 | ± | 2.55 | a | 1.00 | ± | 0.02 | a | 0.93 | ± | 0.06 | ab | 49.97 | ± | 0.62 | b | 0.96 | ± | 0.02 | a | 0.97 | ± | 0.09 | ab |
| ETHB 250 | 44.29 | ± | 1.97 | a | 0.96 | ± | 0.02 | ab | 0.88 | ± | 0.04 | b | 47.07 | ± | 0.35 | c | 1.01 | ± | 0.02 | a | 0.87 | ± | 0.05 | b |
| ETHB 500 | 43.76 | ± | 1.54 | a | 0.95 | ± | 0.03 | ab | 0.92 | ± | 0.04 | b | 51.50 | ± | 3.72 | a | 0.98 | ± | 0.01 | a | 0.91 | ± | 0.06 | ab |
| ETHB 1000 | 40.90 | ± | 1.00 | a | 0.95 | ± | 0.01 | ab | 0.86 | ± | 0.02 | b | 45.00 | ± | 2.41 | c | 0.98 | ± | 0.02 | a | 0.98 | ± | 0.09 | ab |
| | Mean | 42.62 | ± | 1.77 | | 0.96 | ± | 0.02 | | 0.90 | ± | 0.04 | | 48.38 | ± | 1.77 | | 0.98 | ± | 0.02 | | 0.93 | ± | 0.07 | |
| 15 | ETHB 0 | 43.73 | ± | 1.47 | b | 0.96 | ± | 0.03 | a | 0.90 | ± | 0.05 | ab | 49.26 | ± | 1.05 | a | 0.97 | ± | 0.02 | a | 0.82 | ± | 0.04 | b |
| ETHB 250 | 45.53 | ± | 0.81 | b | 0.96 | ± | 0.01 | a | 0.98 | ± | 0.01 | a | 47.98 | ± | 0.85 | b | 1.00 | ± | 0.01 | a | 0.81 | ± | 0.06 | b |
| ETHB 500 | 43.99 | ± | 2.96 | b | 0.93 | ± | 0.01 | ab | 1.11 | ± | 0.16 | a | 46.87 | ± | 2.11 | b | 0.96 | ± | 0.02 | a | 0.95 | ± | 0.02 | ab |
| ETHB 1000 | 46.36 | ± | 0.52 | a | 0.96 | ± | 0.01 | a | 1.00 | ± | 0.02 | a | 47.86 | ± | 1.48 | b | 0.97 | ± | 0.02 | a | 0.81 | ± | 0.05 | b |
| | Mean | 44.90 | ± | 1.44 | | 0.95 | ± | 0.01 | | 1.00 | ± | 0.06 | | 47.99 | ± | 1.37 | | 0.97 | ± | 0.02 | | 0.85 | ± | 0.04 | |
| 28 | ETHB 0 | 40.57 | ± | 2.89 | c | 0.96 | ± | 0.00 | a | 0.91 | ± | 0.09 | ab | 50.82 | ± | 0.42 | a | 0.96 | ± | 0.01 | a | 0.84 | ± | 0.08 | b |
| ETHB 250 | 45.61 | ± | 1.54 | a | 0.94 | ± | 0.02 | ab | 0.94 | ± | 0.03 | ab | 49.57 | ± | 2.15 | a | 0.96 | ± | 0.01 | a | 0.90 | ± | 0.08 | ab |
| ETHB 500 | 43.69 | ± | 0.87 | b | 0.94 | ± | 0.01 | ab | 0.85 | ± | 0.05 | b | 51.17 | ± | 0.57 | a | 0.97 | ± | 0.01 | a | 0.88 | ± | 0.09 | ab |
| ETHB 1000 | 39.20 | ± | 1.36 | d | 0.93 | ± | 0.02 | b | 0.84 | ± | 0.02 | b | 49.20 | ± | 1.14 | a | 0.96 | ± | 0.02 | a | 0.84 | ± | 0.06 | b |
| | Mean | 42.27 | ± | 1.66 | | 0.94 | ± | 0.01 | | 0.88 | ± | 0.04 | | 50.19 | ± | 1.07 | | 0.96 | ± | 0.01 | | 0.87 | ± | 0.08 | |
| 35 | ETHB 0 | 41.41 | ± | 0.88 | b | 1.00 | ± | 0.01 | a | 0.95 | ± | 0.02 | a | 48.15 | ± | 2.26 | b | 0.93 | ± | 0.00 | b | 0.86 | ± | 0.09 | ab |
| ETHB 250 | 43.05 | ± | 3.47 | a | 0.93 | ± | 0.02 | ab | 0.89 | ± | 0.09 | ab | 51.58 | ± | 1.94 | a | 0.99 | ± | 0.02 | a | 0.88 | ± | 0.02 | b |
| ETHB 500 | 37.31 | ± | 4.33 | c | 0.93 | ± | 0.01 | ab | 0.78 | ± | 0.07 | b | 51.90 | ± | 0.84 | a | 0.95 | ± | 0.02 | ab | 0.92 | ± | 0.03 | ab |
| ETHB 1000 | 39.31 | ± | 1.54 | c | 0.95 | ± | 0.01 | a | 0.86 | ± | 0.03 | b | 47.72 | ± | 2.69 | b | 0.97 | ± | 0.01 | ab | 0.79 | ± | 0.04 | b |
| | Mean | 40.27 | ± | 2.56 | | 0.96 | ± | 0.01 | | 0.87 | ± | 0.05 | | 49.84 | ± | 1.93 | | 0.96 | ± | 0.01 | | 0.86 | ± | 0.05 | |
| Significance | S | ** | NS | NS | ** | NS | NS |
| DAA | NS | NS | NS | NS | NS | NS |
| T | NS | NS | NS | NS | NS | NS |
| S × DAA | NS | NS | NS | NS | NS | NS |
| S × T | NS | NS | NS | NS | NS | NS |
| DAA × T | NS | NS | NS | NS | NS | NS |
| S × DAA × T | NS | NS | NS | NS | NS | NS |
Table 9.
Inflorescence activity expressed in ratio of glomerulus/catkins determined during from May to August for ETHA 0, 250, 500, and 1000 mg L−1 for the 2020/2021 and 2021/2022 seasons (S). Cunco, La Araucanía region. Data represent the mean of four replications ± S.E. Different letters indicate statistical differences (p ≤ 0.05) among treatments within each spray program. NS, not significant.
| Season | Treatment | May | June | July | August |
|---|
| 2020/21 | ETHA 0 | 0.14 | ± | 0.04 | a | 0.19 | ± | 0.05 | ab | 0.06 | ± | 0.03 | b | 0.63 | ± | 0.09 | a |
| ETHA 250 | 0.25 | ± | 0.13 | b | 0.16 | ± | 0.12 | b | 0.18 | ± | 0.10 | b | 0.38 | ± | 0.18 | b |
| ETHA 500 | 0.08 | ± | 0.06 | c | 0.38 | ± | 0.11 | a | 0.62 | ± | 0.14 | a | 0.78 | ± | 0.15 | a |
| ETHA 1000 | 0.02 | ± | 0.01 | c | 0.04 | ± | 0.03 | c | 0.12 | ± | 0.06 | b | 0.63 | ± | 0.18 | a |
| 2021/22 | ETHA 0 | 0.14 | ± | 0.04 | a | 0.19 | ± | 0.05 | a | 0.06 | ± | 0.03 | b | 0.63 | ± | 0.09 | a |
| ETHA 250 | 0.02 | ± | 0.02 | b | 0.20 | ± | 0.13 | a | 0.00 | ± | 0.00 | b | 0.90 | ± | 0.10 | a |
| ETHA 500 | 0.00 | ± | 0.00 | c | 0.06 | ± | 0.05 | b | 0.05 | ± | 0.05 | b | 0.55 | ± | 0.16 | a |
| ETHA 1000 | 0.00 | ± | 0.00 | c | 0.00 | ± | 0.00 | b | 0.00 | ± | 0.00 | b | 0.60 | ± | 0.16 | a |
| Significance | S | NS | NS | NS | NS |
| T | NS | NS | NS | NS |
| S × T | NS | NS | NS | NS |
Table 10.
Inflorescence activity expressed in ratio of glomerulus/catkins determined from May to August for ETHA 0, 250, 500, and 1000 mg L−1 for the 2021/2022 and 2022/2023 seasons (S). Cunco, La Araucanía region. Data represent the mean of four replications ± S.E. Different letters indicate statistical differences (p ≤ 0.05) among treatments within each spray program. NS, not significant, * p ≤ 0.05.
| Season | Treatment | May | June | July | August |
|---|
| 2021/22 | ETHB 0 | 0.14 | ± | 0.04 | a | 0.19 | ± | 0.05 | b | 0.06 | ± | 0.03 | b | 0.63 | ± | 0.09 | a |
| ETHB 250 | 0.13 | ± | 0.07 | a | 0.18 | ± | 0.09 | b | 0.02 | ± | 0.02 | b | 0.64 | ± | 0.15 | a |
| ETHB 500 | 0.10 | ± | 0.04 | a | 0.23 | ± | 0.11 | b | 0.00 | ± | 0.00 | | 0.60 | ± | 0.16 | a |
| ETHB 1000 | 0.11 | ± | 0.07 | a | 0.46 | ± | 0.29 | a | 0.00 | ± | 0.00 | | 0.13 | ± | 0.13 | b |
| 2022/23 | ETHB 0 | 0.06 | ± | 0.03 | b | 0.27 | ± | 0.09 | a | 0.68 | ± | 0.21 | a | 0.91 | ± | 0.09 | a |
| ETHB 250 | 0.05 | ± | 0.02 | a | 0.30 | ± | 0.09 | a | 0.89 | ± | 0.22 | a | 0.92 | ± | 0.08 | a |
| ETHB 500 | 0.01 | ± | 0.01 | b | 0.09 | ± | 0.05 | b | 0.29 | ± | 0.14 | b | 0.50 | ± | 0.17 | a |
| ETHB 1000 | 0.01 | ± | 0.01 | b | 0.21 | ± | 0.11 | a | 0.19 | ± | 0.11 | b | 0.67 | ± | 0.14 | a |
| Significance | S | * | NS | NS | NS |
| T | NS | NS | NS | NS |
| S × T | NS | NS | NS | NS |


 ,
, 


