1. Introduction
Wheat is a cornerstone of global agriculture and food security, providing nearly 20% of the world’s caloric and protein intake [
1]. Its adaptability to a wide range of climates and soils has made it one of the most extensively cultivated crops globally, occupying over 215 million hectares annually [
2]. Despite its significance, wheat production faces mounting challenges due to various abiotic and biotic stresses, among which salinity is one of the most pervasive and detrimental. Soil salinity affects more than 20% of irrigated agricultural land worldwide and is predicted to increase due to improper irrigation practices, rising water tables, and the effects of climate change [
3].
Salinity imposes osmotic stress, ionic toxicity, and oxidative stress on plants, collectively impairing growth, development, and yield [
4]. These stresses disrupt metabolic processes, hinder nutrient uptake, and induce cellular damage, manifesting as reduced germination, stunted growth, delayed flowering, and diminished seed production [
5]. Addressing the impact of salt stress on wheat is critical for maintaining global food security, particularly in arid and semi-arid regions where soil salinization is accelerating.
Efforts to improve wheat productivity under salinity hinge on developing stress-tolerant cultivars capable of thriving in saline conditions without compromising yield [
6]. This requires an in-depth understanding of the genetic and physiological mechanisms underlying salinity tolerance. Conventional breeding approaches have achieved moderate success in improving salt tolerance, but these methods are often time-consuming and limited by the complexity of the trait. Salinity tolerance is governed by multiple quantitative trait loci (QTLs) interacting with environmental factors, making it challenging to identify and select for favorable alleles using phenotypic evaluations alone [
7].
Advances in molecular biology and genomics have transformed crop improvement strategies by enabling the precise characterization of genetic diversity and identification of QTLs associated with complex traits [
8]. Among molecular markers, simple sequence repeats (SSRs) have emerged as a powerful tool for genetic analysis due to their high polymorphism, co-dominance, reproducibility, and ease of use [
9]. Genetic diversity is the foundation of crop improvement, providing the raw material for selection and adaptation. Evaluating the genetic diversity of wheat genotypes under salt stress is crucial for identifying potential donors of salinity tolerance and broadening the genetic base of breeding programs [
10].
Studies have shown that wheat genotypes exhibit substantial variability in their response to salt stress, with differences in traits such as germination rate, root and shoot biomass, ion accumulation, and grain yield [
11]. By assessing genetic diversity using SSR markers, researchers can quantify the extent of variability within and between wheat populations and identify genotypes with desirable traits for breeding.
Marker–trait association analysis, commonly performed using genome-wide association studies (GWAS) or linkage mapping, allows researchers to pinpoint genomic regions linked to phenotypic variation [
12]. For instance, studies have identified QTLs associated with traits such as sodium exclusion, osmotic adjustment, and antioxidant activity in wheat under saline conditions. SSR markers linked to these QTLs can be used for marker-assisted selection (MAS), accelerating the development of salt-tolerant cultivars [
13].
Yield is a multifaceted trait influenced by numerous genetic and environmental factors, particularly under stress conditions [
14]. Under salt stress, yield-related traits such as spike length, grain number per spike, grain weight, and biomass are significantly affected. These traits are not only influenced by salinity but also by interactions with other environmental variables, making it imperative to use robust analytical approaches for their study [
15]. Integrating SSR marker data with phenotypic evaluations under controlled and field conditions provides a comprehensive understanding of the genetic determinants of yield traits. Previous studies have demonstrated the utility of SSR markers in identifying QTLs associated with salt tolerance in wheat. For example, Kumar [
16] reported significant associations between SSR markers and traits such as ion homeostasis and root architecture, which contribute to salinity tolerance. Similarly, Alotaibi et al. [
17] identified several QTLs linked to grain yield and biomass under salt stress using SSR markers in a diverse wheat panel. These findings underscore the potential of high-density SSR markers to increasing genome coverage and advancing wheat breeding programs targeting salinity tolerance.
Despite these advancements, challenges remain in translating genomic discoveries into practical breeding outcomes. The complexity of salinity tolerance, coupled with the influence of genotype–environment interactions, necessitates a holistic approach that integrates molecular, physiological, and agronomic perspectives. Furthermore, the limited representation of wild wheat relatives and landraces in genetic studies restricts the discovery of novel alleles for salt tolerance. Expanding the genetic diversity of breeding populations by incorporating underutilized germplasm is essential for unlocking the full potential of molecular breeding. This study aims to address these challenges by evaluating the genetic diversity of wheat genotypes using SSR markers and identifying marker–trait associations with yield-related traits under salt stress.
The outcomes of this research are expected to contribute to the development of molecular breeding strategies for improving wheat productivity in saline soils. By identifying genetic markers linked to yield traits, this study will facilitate the selection of salt-tolerant genotypes for breeding programs, supporting the global effort to enhance agricultural resilience in the face of climate change and soil salinization.
2. Materials and Methods
The study involved a wheat salinity trial conducted under field conditions to assess the effects of medium salinity (target EC ~10 dS/m) on wheat agronomic performance for potential selection. A randomized complete block design (RCBD) was employed to minimize the influence of environmental heterogeneity and intervarietal interactions. Prior to planting, the field site was prepared with a loamy soil substrate. Medium-salinity platforms were established by adjusting the soil electrical conductivity (EC) to approximately 6.8 dS/m through the incorporation of saline irrigation water (EC = 8 dS/m). Soil salinity levels were regularly monitored before and during the trial using a portable EC meter to maintain consistent saline conditions. Irrigation was applied uniformly every other day using saline water to sustain the target salinity levels.
Ninety wheat genotypes, sourced from the Mexican gene bank (
Table S1), were used in the experiment. Seeds were sown manually into randomized 1 m
2 subplots, with each subplot spaced 0.5 m apart to avoid border effects. Within each subplot, 3 cm deep furrows were made and spaced 30 cm (1 foot) apart. Approximately 50 seeds were sown per square meter to ensure sufficient plant density for evaluation. Each genotype was represented by three biological replicates (independently cultivated plots), and three technical replicates (repeated measurements within each plot) were taken to ensure statistical robustness. Plants were cultivated under these conditions until physiological maturity, at which point phenotypic measurements for key agronomic traits were recorded.
The canopy temperature was measured using an infrared thermometer (FLIR TG165, Teledyne FLIR LLC, Wilsonville, OR, USA). Measurements were conducted on clear, sunny days during the mid-morning (10:00–11:30 a.m.) and early afternoon (2:00–3:30 p.m.) to capture diurnal variations in canopy temperature. The infrared thermometer was held at a consistent angle and distance from the canopy to ensure accuracy. Readings were taken from multiple points within each experimental plot and averaged to provide a representative canopy temperature for each plot.
The leaf area index (LAI) was measured using a portable LAI meter (LI-2200C, LI-COR Biosciences, Lincoln, NE, USA) at the physiological maturity stage. The meter was used to collect readings at multiple locations within each plot to ensure uniform coverage, and the values were averaged to determine the mean LAI for each plot. To ensure data reliability, the instrument was calibrated before each measurement session. LAI was calculated as follows:
The dry matter content of wheat grains was determined by drying freshly harvested samples to a constant weight. The grains were cleaned and weighed before being placed in a forced air oven set at 105 °C for 24 h. After drying, the samples were reweighed, and the dry matter content was calculated as a percentage of the dry weight relative to the initial fresh weight. This method ensured precise and consistent measurements across all samples. The harvest index (HI) was calculated as the ratio of economic yield (grain yield) to the total aboveground biomass yield. After harvesting, biomass and grain yields were recorded by drying and weighing the samples.
Wheat grain yield was determined by harvesting mature grains from each experimental plot. Post-harvest, the grains were cleaned, weighed, and adjusted to a standard moisture content of 12% to account for variations in moisture levels. The grain yield was then expressed in kilograms per hectare (kg/ha) to facilitate comparison across treatments. The number of fertile tillers was determined at the anthesis stage by manually counting tillers within a specified area of each experimental plot. The counts were averaged over multiple replicates to obtain the mean number of tillers per plot, expressed as tillers per square meter (tillers/m2). Straw yield was assessed by collecting all above-ground biomass, excluding grains, from each experimental plot at physiological maturity. The collected straw was dried in an oven at 65 °C until a constant weight was achieved. The dry weight of the straw was recorded and expressed in kilograms per hectare (kg/ha).
Thousand Kernel Weight (TKW) was determined by randomly selecting three samples of 1000 grains from the harvested grains of each plot. The grains were either counted manually or using an automated seed counter, weighed using a precision balance, and the weight recorded. The TKW was expressed in grams (g).
2.1. Allele Scoring Genetic Diversity, and Molecular Variance
The cetyltrimethylammonium bromide (CTAB) principle, as described by Doyle [
18], was used for the extraction of whole-genome DNA from the young, fully expanded leaves collected at the early tillering stage of 90 wheat varieties and quantified using NanoDrop 2000 (Thermo Fisher Scientific, Waltham, MA, USA). Fragment lengths of each allele were scored relative to a 50 bp DNA ladder, with alleles recorded as present [1] or absent [0]. Band sizes for each marker were denoted as a/b, where ‘a’ is the upper band and ‘b’ is the lower band. Arlequin software v3.5.2.2 was used to calculated allele frequency, allele number per locus, gene diversity, observed heterozygosity, and polymorphism information content (PIC) for each SSR. Molecular variance analysis (AMOVA) was performed using the Shannon statistics test with GenAlEx v6.502 [
19,
20]. Population structure was analyzed using STRUCTURE 2.3.4, employing Bayesian clustering with k values ranging from 1 to 10 [
21]. The analysis included 10,000 Markov Chain Monte Carlo (MCMC) replications, a burn-in period of 10,000, and admixture models. The optimal number of populations (k) was determined using the maximum likelihood (LnP(D)) and the ad hoc statistic (ΔK). Fifteen independent runs, each with 100,000 iterations and a 100,000 burn-in period, were conducted with k values ranging from 1 to 5.
2.2. Linkage Disequilibrium (LD) Analysis
Linkage disequilibrium (LD) parameters (r
2) among loci were estimated using the TASSEL program (available online:
http://www.maizegenetics.net, accessed on 22 September 2023). Pairwise significance was calculated using 1000 permutations. The LD was assessed separately for unlinked loci (unlinked r
2) and loci on the same chromosome (syntenic r
2). Syntenic r
2 values were plotted against map distance for chromosomes 2D and 5A, with a second-degree loess smooth line fitted using R (available online:
http://www.r-project.org, accessed on 26 January 2019). A critical r
2 value, indicating linkage, was derived from the distribution of unlinked r
2. Unlinked r
2 estimates were square root-transformed to approximate a normal distribution, and the 95th percentile of this distribution was taken as the population-specific critical r
2. The point where the loess curve intersected this baseline was considered the extent of LD on the chromosome.
2.3. Association Mapping
A total of 100 SSR markers were selected based on their previously reported polymorphism among wheat genotypes, their distribution across the wheat genome to ensure broad coverage, and their known associations with agronomic or stress-related traits (
Table S2). Preference was also given to markers exhibiting high polymorphism information content (PIC) values to ensure effective differentiation among genotypes.
Association mapping was performed to evaluate the relationship between 100 SSR markers and phenotypic traits in 90 wheat varieties using the software TASSEL v4.0. Genotypic data for the SSR markers were obtained, and phenotypic data for the traits of interest were recorded for each variety. Two statistical models, the General Linear Model (GLM) and the Generalized Linear Mixed Model (GLMM), were employed to perform the association analysis. The GLM was used to assess the fixed effects of markers, while the GLMM accounted for both fixed and random effects, such as population structure and kinship, to control for confounding factors.
The GLM was specified as follows: Y = Xβ + ϵY = X\beta +\epsilon, where YY is the vector of phenotypic values, XX is the matrix of marker genotypes, β\beta is the vector of marker effects, and ϵ\epsilon is the error term. The GLMM incorporated the random effects as follows: Y = Xβ + Zγ + ϵY = X\beta + Z\gamma +\epsilon, where ZγZ\gamma represents the random effects (kinship or population structure) and γ\gamma is the vector of random effects. Association analyses were conducted for each trait with the marker data, and the significance of marker–trait associations was determined using a threshold based on false discovery rate (FDR) correction to control for multiple testing. Both models were executed in TASSEL with 10,000 permutations to assess the significance of marker–trait associations, and the results were validated based on the observed and expected distributions of p-values.
2.4. Statistical Analysis
The distributions of agronomic traits were assessed using histograms, while a scatter plot matrix was employed to examine the relationships between traits. Hierarchical clustering analysis was performed to classify the wheat varieties based on genetic similarity. Kinship estimates were calculated using SSR data, allowing for the quantification of relationships among accessions. Marker–trait associations were explored through both Mixed Linear Models (MLM) and Generalized Linear Mixed Models (GLMM), with significance levels set at p < 0.01. Kinship and association analyses were conducted using TASSEL version 5, while population structure analysis was carried out using STRUCTURE. Other analyses were performed in R, with the appropriate packages applied.
3. Results
An analysis of variance (ANOVA) revealed that varietal differences significantly influenced some traits, while others remained statistically unaffected at the
p ≤ 0.01 significance level. The leaf area index (LAI) exhibited a highly significant varietal effect, with between-group variation far exceeding within-group variation, indicating a strong genetic influence (
Table 1). Canopy temperature also showed significant variation among varieties, with between-group variance clearly greater than the within-group variance. In contrast, the grain area did not show significant varietal differences as the difference between the mean squares of the between-groups and within-groups was minimal. On the other hand, dry matter (DW) revealed a highly significant effect with the between-groups mean square being more than double that of the within-groups.
Varietal differences in harvest index (HI) were not significant (F = 1.47, p = 0.014), despite a higher between-groups mean square relative to the within-groups. Although the ANOVA indicated a difference in grain yield among varieties, the small effect size (between-groups mean square = 0.97 vs. within-groups = 0.54) suggests that the observed differences are not agronomically meaningful. Significant varietal differences were observed in tiller number where the between-groups mean square notably exceeded the within-groups value. Straw yield also showed a significant varietal effect with the between-groups mean square which was more than double that of the within-groups. Lastly, thousand kernel weight (TKW) showed no significant variation across varieties (F = 1.10, p = 0.287), as the between-groups (88.04) and within-groups (79.69) variances were nearly equivalent.
3.1. Trait Distribution Across Varieties
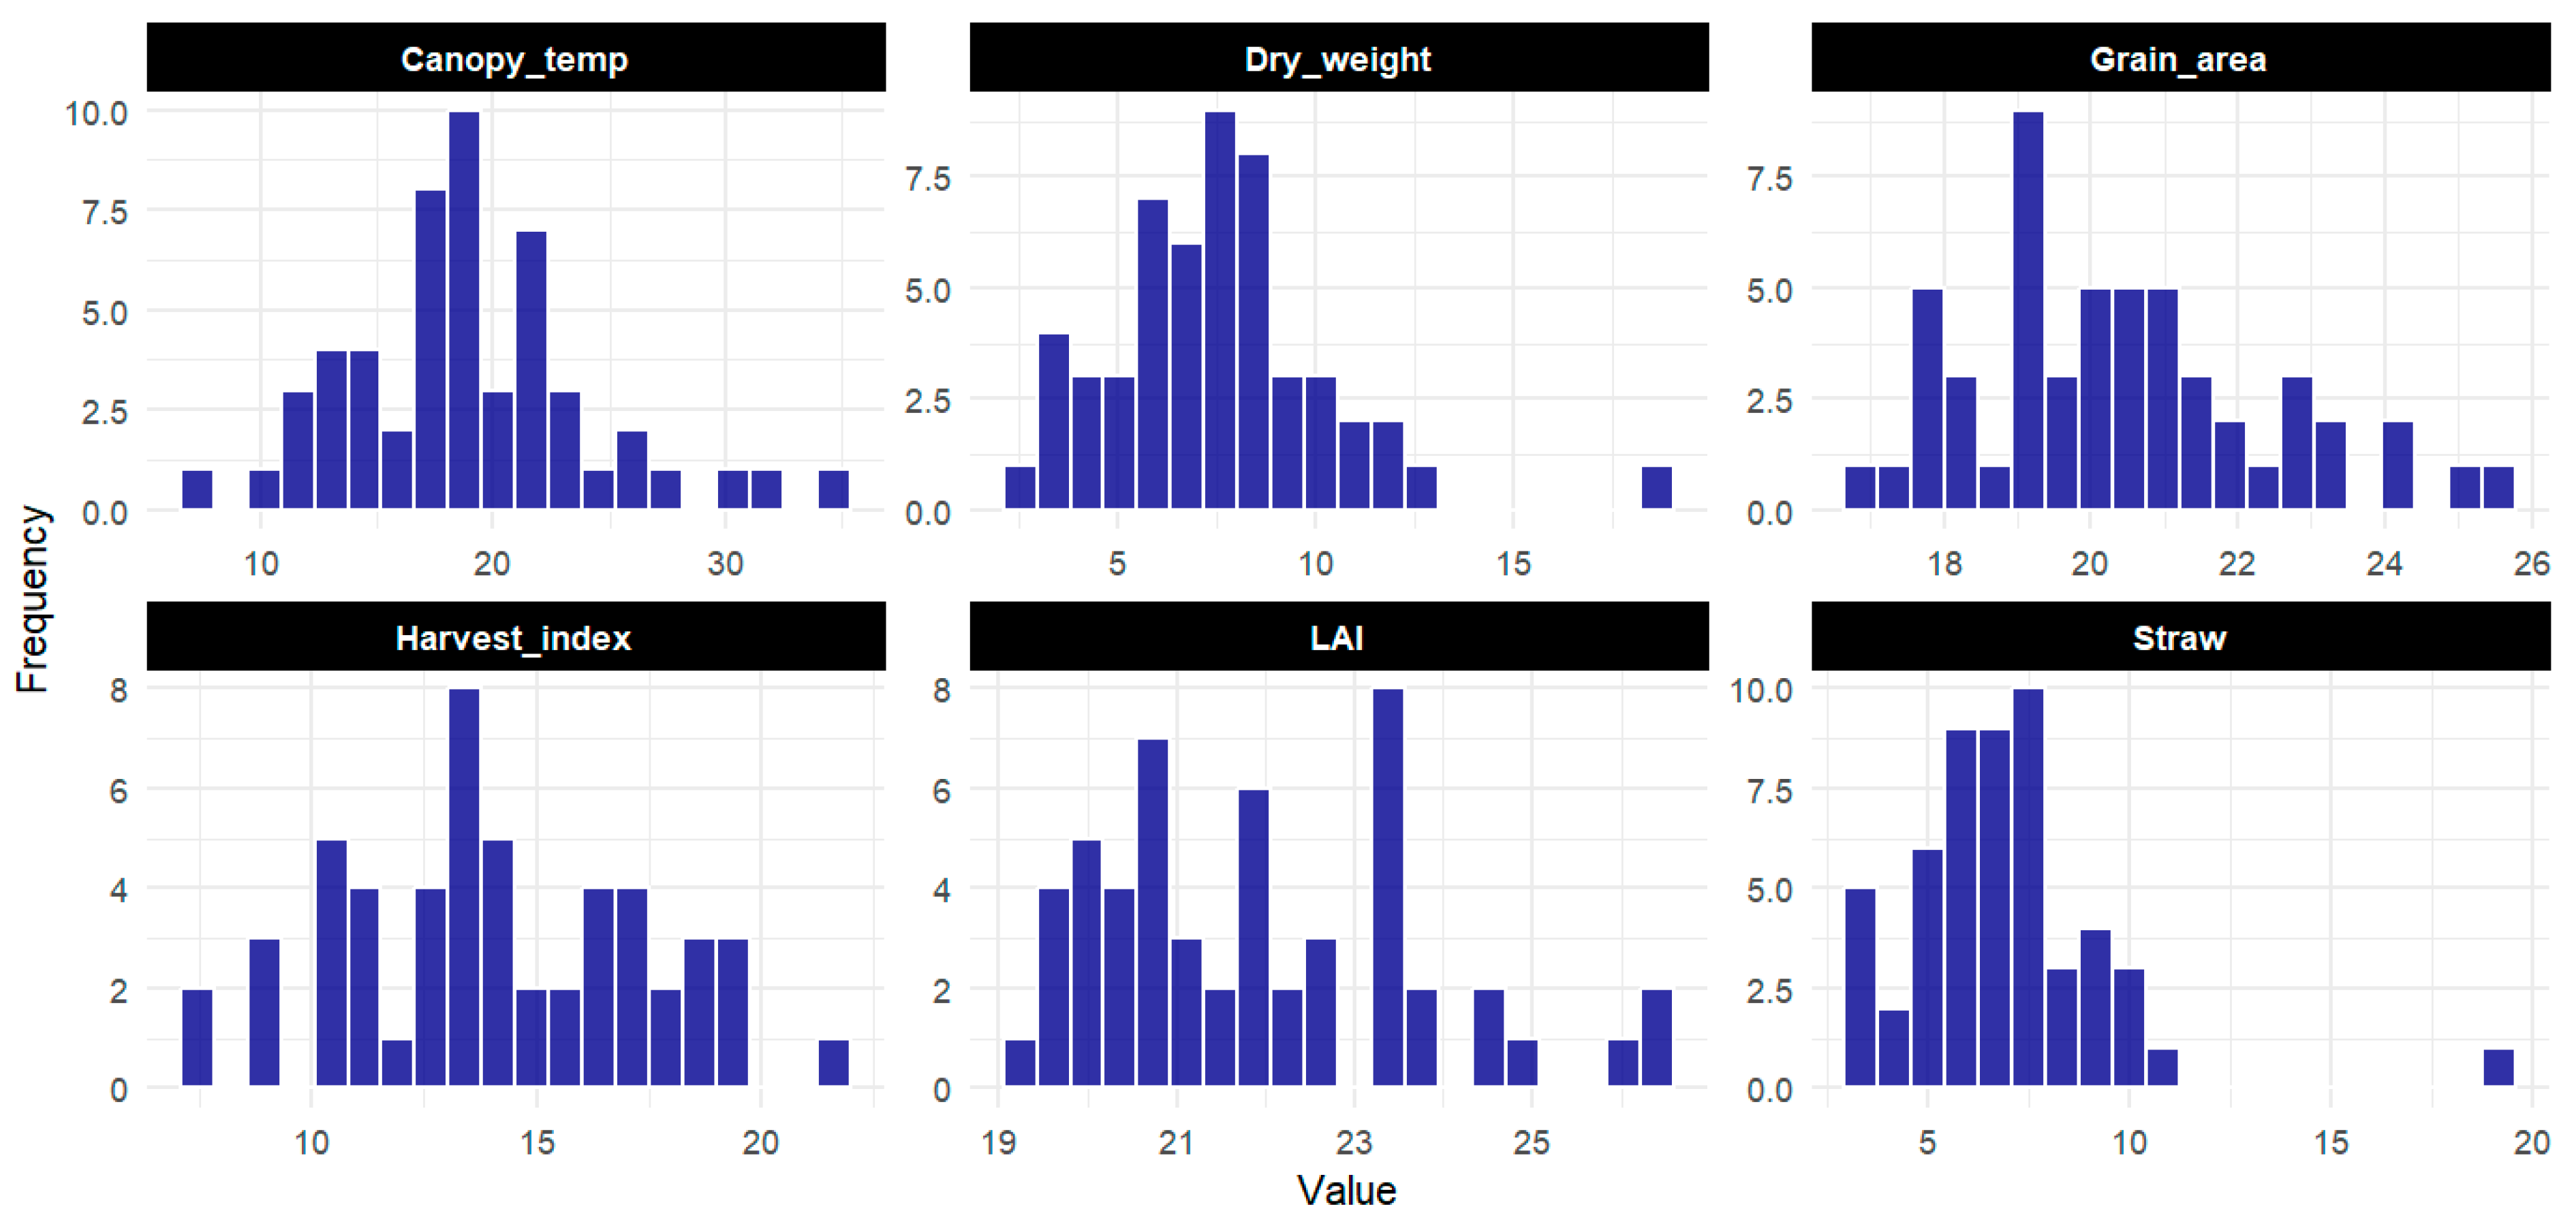
The distribution of parameters across different varieties was analyzed using histograms and overlaid density curves, providing a detailed understanding of the frequency and spread of the data. The LAI exhibited a relatively uniform distribution with a slight central peak, accompanied by positive skewness and leptokurtic characteristics, indicating a concentration of values around the center with a longer right tail and heavier-than-normal extremes. The accompanying density curve suggested a nearly normal distribution, although a few outliers were observed at the lower end, which may warrant further investigation for specific varieties. The canopy temperature exhibited a right-skewed distribution, with most values clustering on the lower end and a gradual tapering off towards higher values. The density curve confirmed this skew, highlighting that temperature values were predominantly moderate, with a few varieties experiencing higher temperatures. The grain area displayed a near-normal distribution, with the density curve showing a central peak and a slight rightward skew in the histogram. The dry mater distribution was bimodal, indicating the presence of two distinct groups within the varieties: one group with lower dry weights and another with higher dry weights. This bimodal distribution was confirmed by both the histogram and the density curve, suggesting substantial variation in dry weight across the varieties. The harvest index displayed a slight left-skewed distribution, with most values concentrated around the 15–18 range. The histogram showed a higher frequency of lower HI values, with the density curve reinforcing this by having a peak on the lower end and a gradual decline toward the higher values. This suggests that the harvest index values were generally moderate across varieties, but with some variation toward the lower end. The grain yield was skewed to the right, with most values below 2, indicating that lower yields were more common, while a few varieties exhibited exceptionally high yields. The density curve further emphasized this rightward skew, showing a long tail toward higher values. The number of tillers showed a normal distribution, indicating consistency in the number of tillers across the varieties. The histogram and density curve both displayed a bell-shaped curve, suggesting uniformity in the tiller numbers across the dataset. Finally, the straw also exhibited a right-skewed distribution, like that of grain yield. The histogram showed a concentration of lower straw values, with a few varieties producing much higher straw amounts. The density curve confirmed this, with a gradual decrease in frequency as straw values increased (
Figure 1).
3.2. Parametric Interactions Under Salt Stress
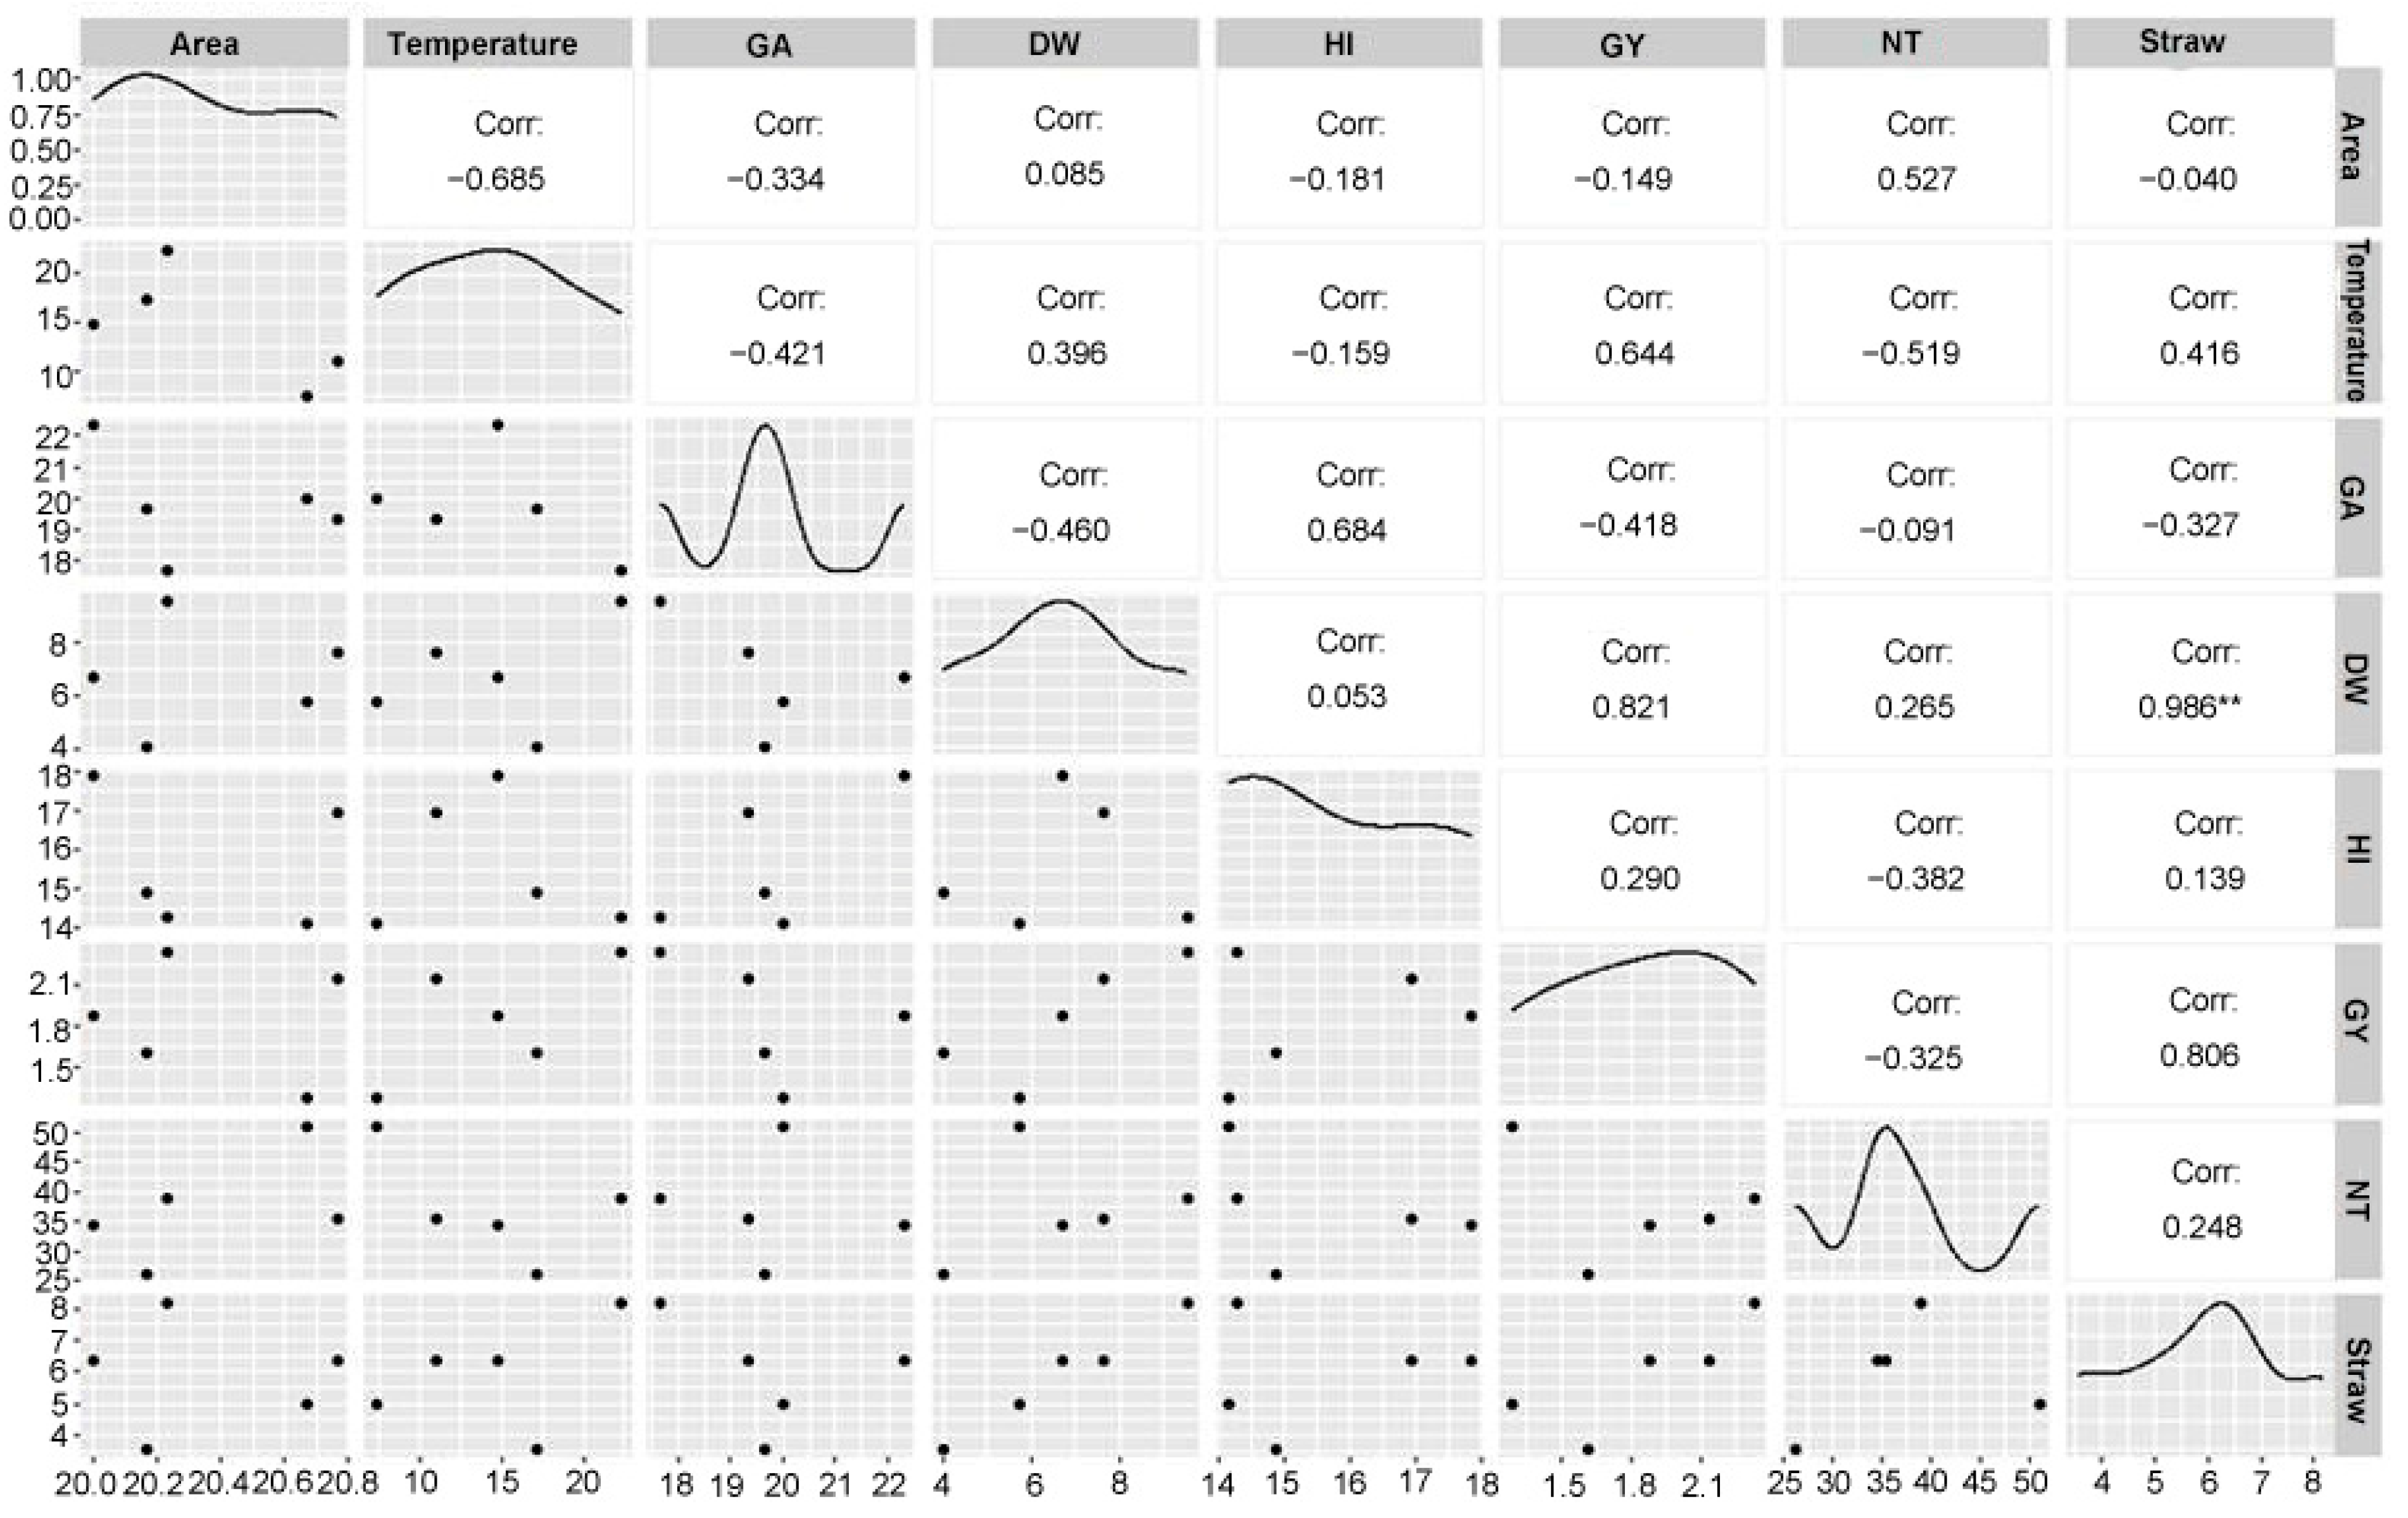
Overall, the scatter plot matrix not only reveals strong and weak associations but also highlights the complexity of interactions among traits. A key observation is the strong positive correlation between dry weight and grain yield, highlighting that higher biomass accumulation directly contributes to increased grain yield. Similarly, a positive association between straw and dry weight suggests that these traits are interlinked, possibly influenced by shared genetic or environmental factors. The clustering of data points by wheat varieties within the matrix further indicated that specific varieties exhibit distinct trait combinations, reflecting genetic variability and phenotypic expression. For instance, canopy temperature showed a notable negative correlation with the number of tillers, which could be attributed to physiological adaptations in plants to minimize water loss under elevated temperatures. Interestingly, harvest index and grain area demonstrated weak or inconsistent relationships with others, suggesting independence or variability in their roles within the dataset. The inclusion of variety-specific data points enabled the identification of clustering patterns, highlighting the diversity of traits across different varieties (
Figure 2).
3.3. Analysis of Molecular Variance
The results of the Analysis of Molecular Variance (AMOVA) indicate that genetic variation is partitioned both among and within populations. Specifically, 34.89% of the total genetic variation was attributed to differences among populations, while the remaining 65.11% was accounted for by variation within populations. The total variance was calculated as 4.36, with variance components of 1.47 among populations and 2.89 within populations (
Table 2). These results highlight the significant contribution of within-population variation to the overall genetic diversity of the 90 wheat varieties analyzed using 100 SSR markers.
3.4. Genetic Diversity and Population Structure
The major allele frequency across all markers averaged 0.48, ranging from 0.28 (WMC617, indicating high allelic diversity) to 0.90 (BARC101, where a single allele dominated). Allele numbers varied widely, with 2–7 alleles per locus (mean = 3.9 ± 1.4). Polymorphic information content values, reflecting marker utility, ranged from 0.18 (BARC101) to 0.80 (WMC617), with an overall mean of 0.59. Approximately 58% of markers showed moderate to high polymorphism (PIC > 0.5). WMC markers demonstrated the highest average PIC 0.65, followed by GWM (0.62), BARC (0.57), and CFA/CFD (0.55). Top-performing markers included WMC617 (PIC = 0.80), GWM340 (0.79), and BARC89 (0.76), all with high allele numbers. Observed heterozygosity was generally low (0.08), consistent with wheat’s self-pollinating biology. Exceptions included BARC240 (H = 0.25) and CFA2040 (H = 0.21) (
Table S3).
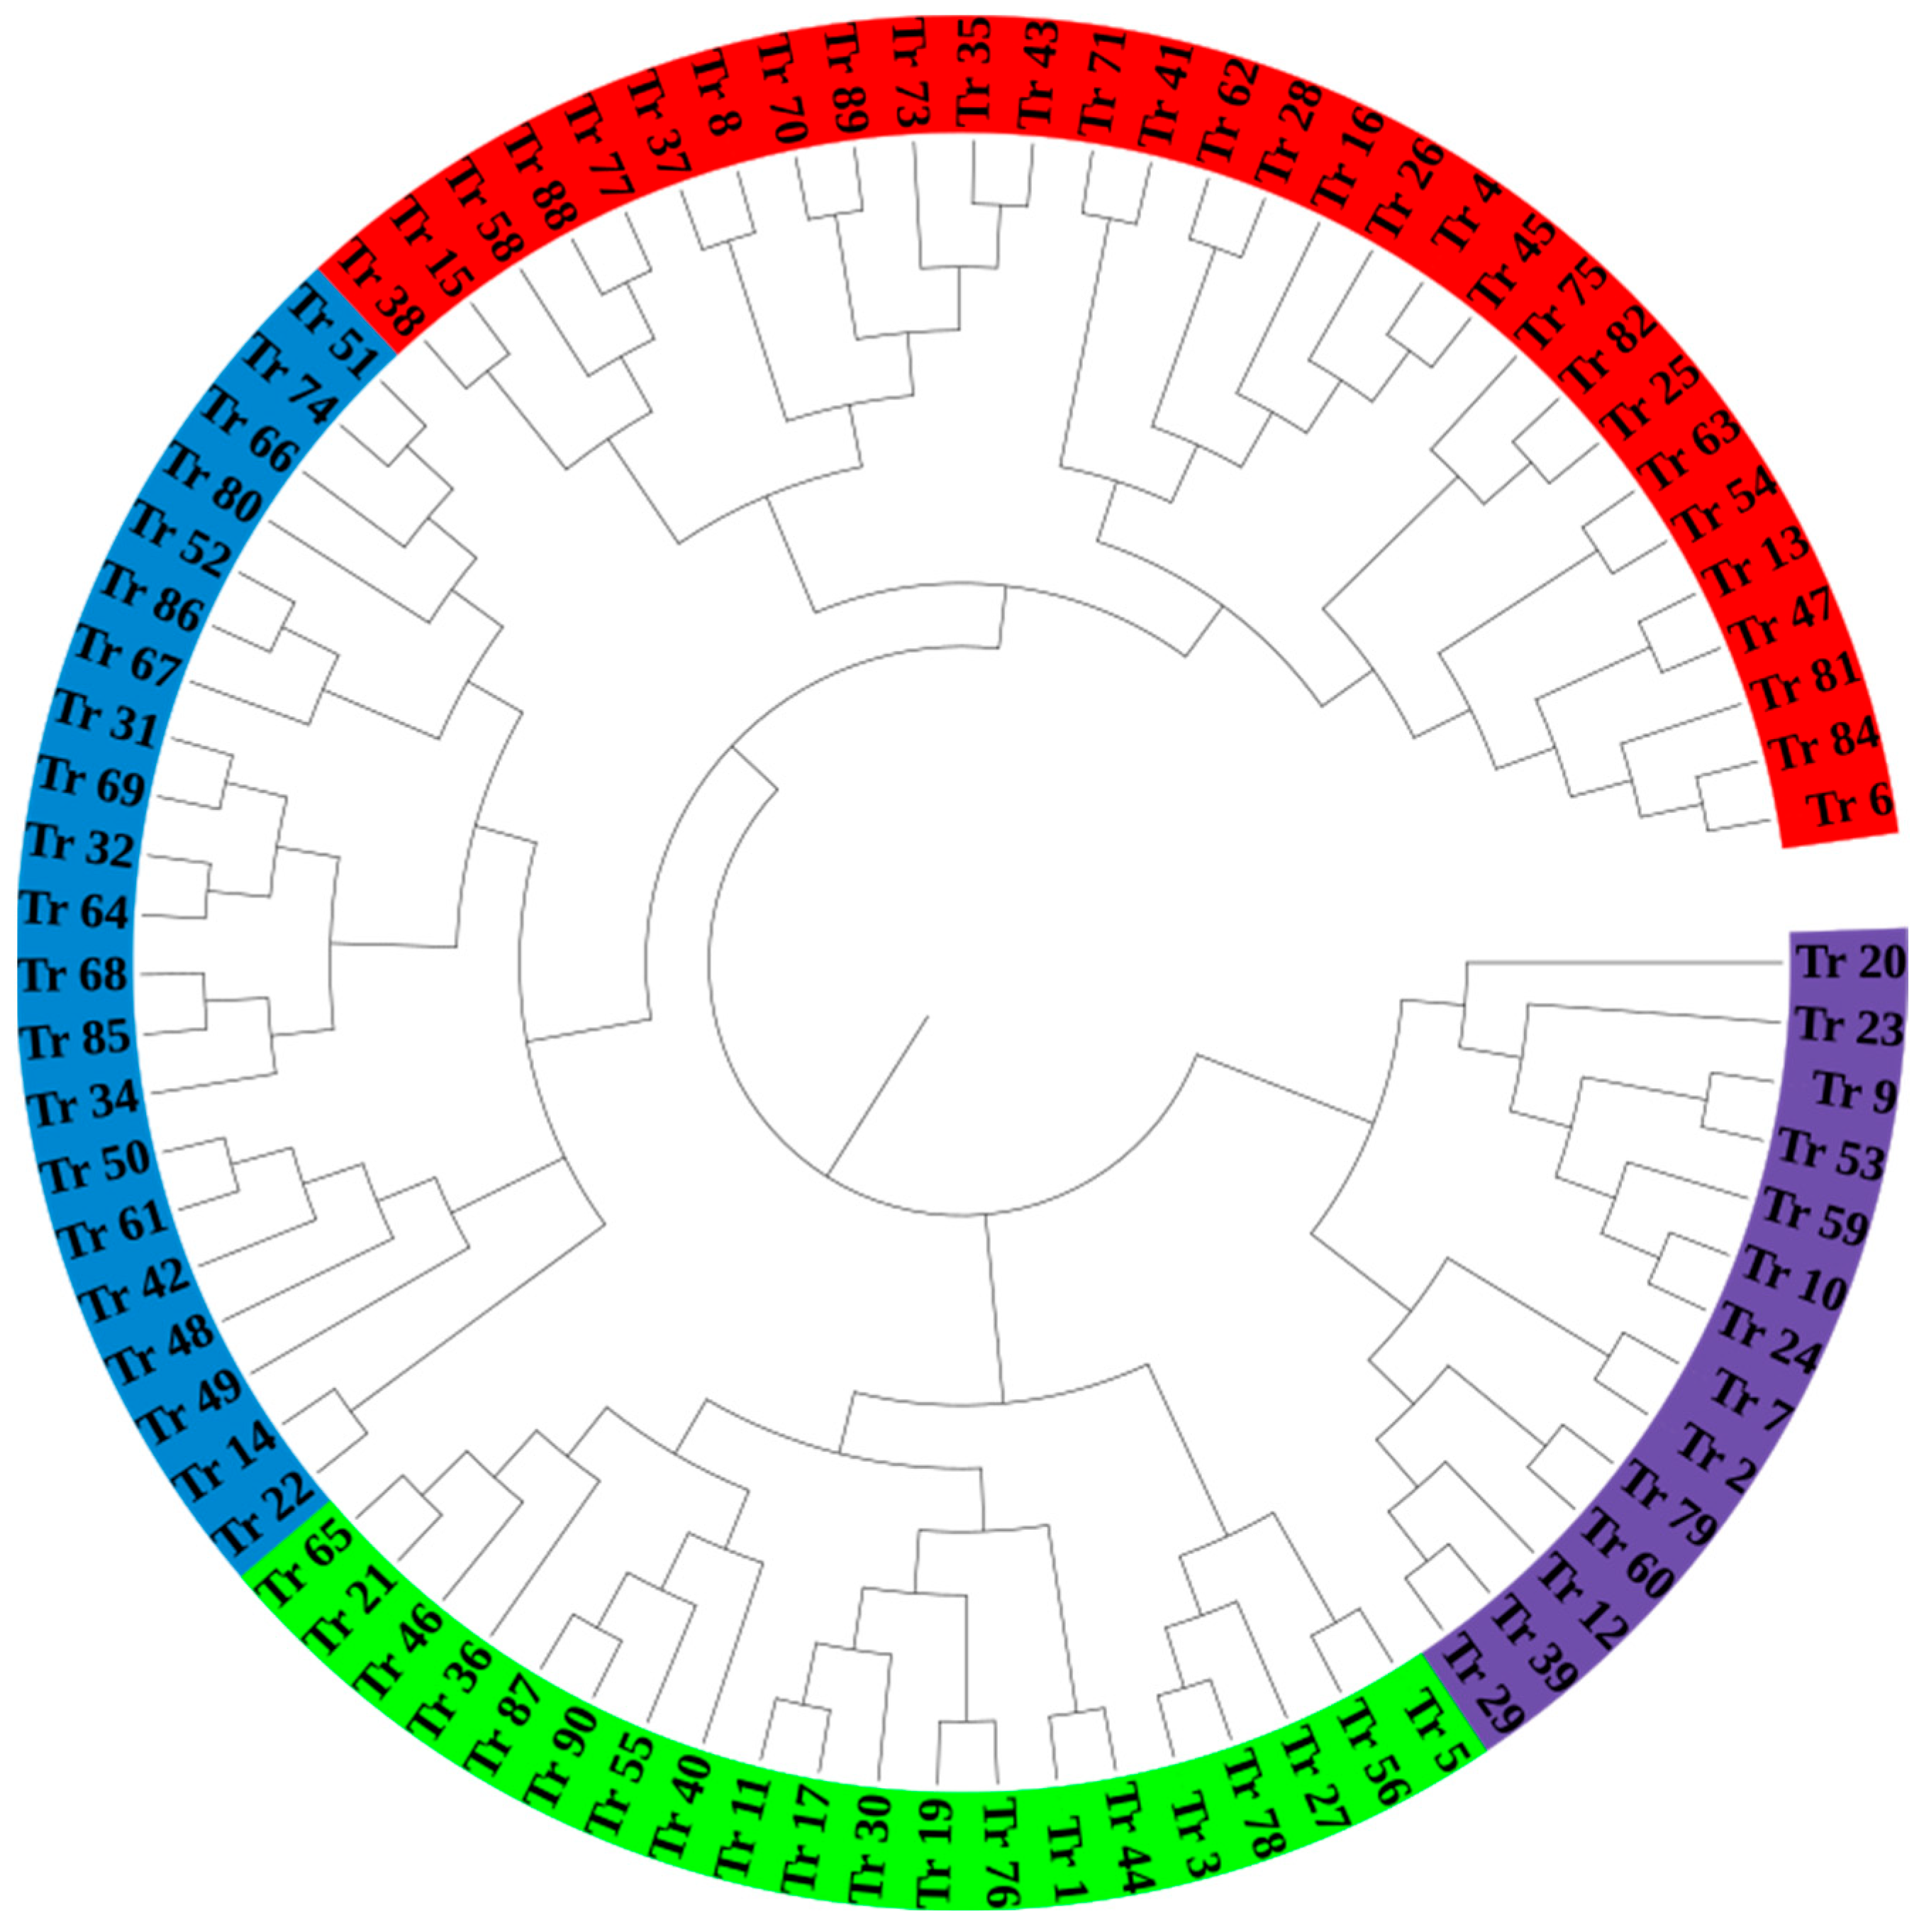
To investigate the genetic basis of key agronomic traits and develop targeted strategies for improving wheat varieties, we constructed a dendrogram to depict the genetic relationships among 90 wheat varieties, based on a genetic distance matrix derived from 100 SSR markers. Hierarchical clustering revealed five distinct groupings, highlighting both closely related and genetically divergent varieties. Varieties with short branch lengths within the same cluster, such as 7 (G 9691), 8 (CWI 50,822), and 10 (CWI 96,473), exhibit high genetic similarity, suggesting minimal divergence and likely shared ancestry or selection history. Similarly, varieties 23 (CWI 96,475) and 20 (CWI 1232) formed a closely related subgroup, further emphasizing their genetic proximity. In contrast, varieties such as 84 (CWI 79,908) and 66 (G 6277), located on longer branches in distinct clusters, demonstrate substantial genetic divergence. Notably, varieties such as 20 and 6 displayed the greatest genetic distance, reflecting their significant divergence, which could be attributed to distinct breeding histories or environmental adaptations. Larger clusters within the dendrogram revealed genetically homogeneous subgroups, such as varieties 32, 33, and 34, while other clusters demonstrated greater diversity (
Figure 3). The observed clustering patterns underscore the significant genetic diversity among the wheat varieties, providing valuable insights into their genetic structure. This diversity offers opportunities for breeding programs to select genetically distant parental lines, maximize heterosis, and introduce novel alleles into breeding populations.
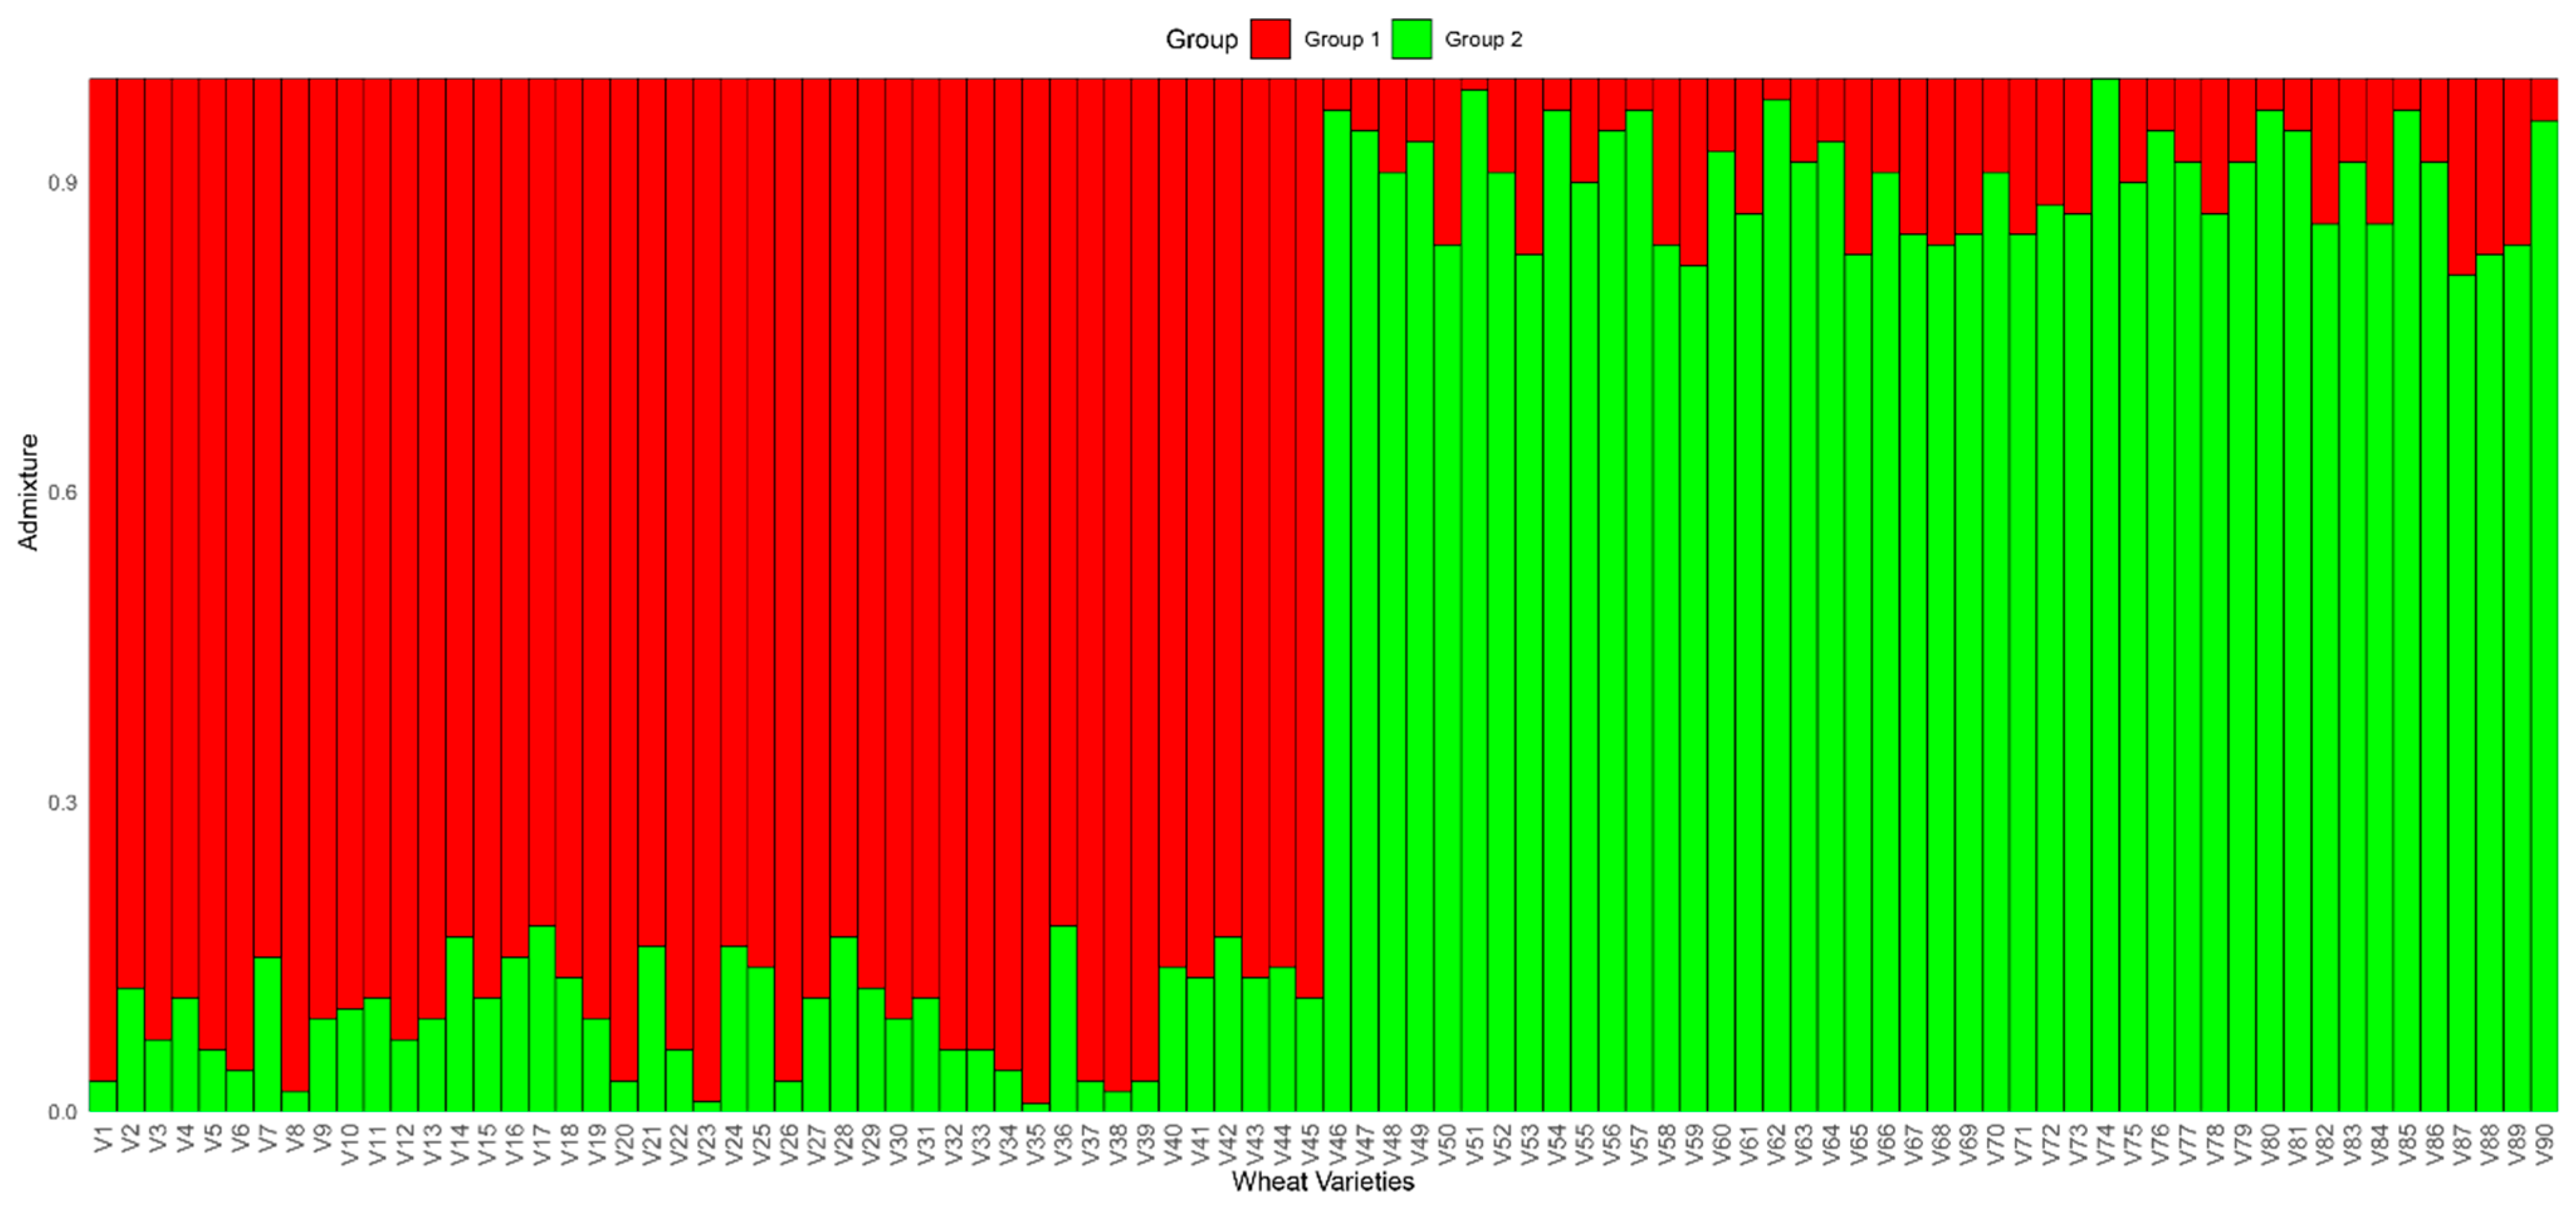
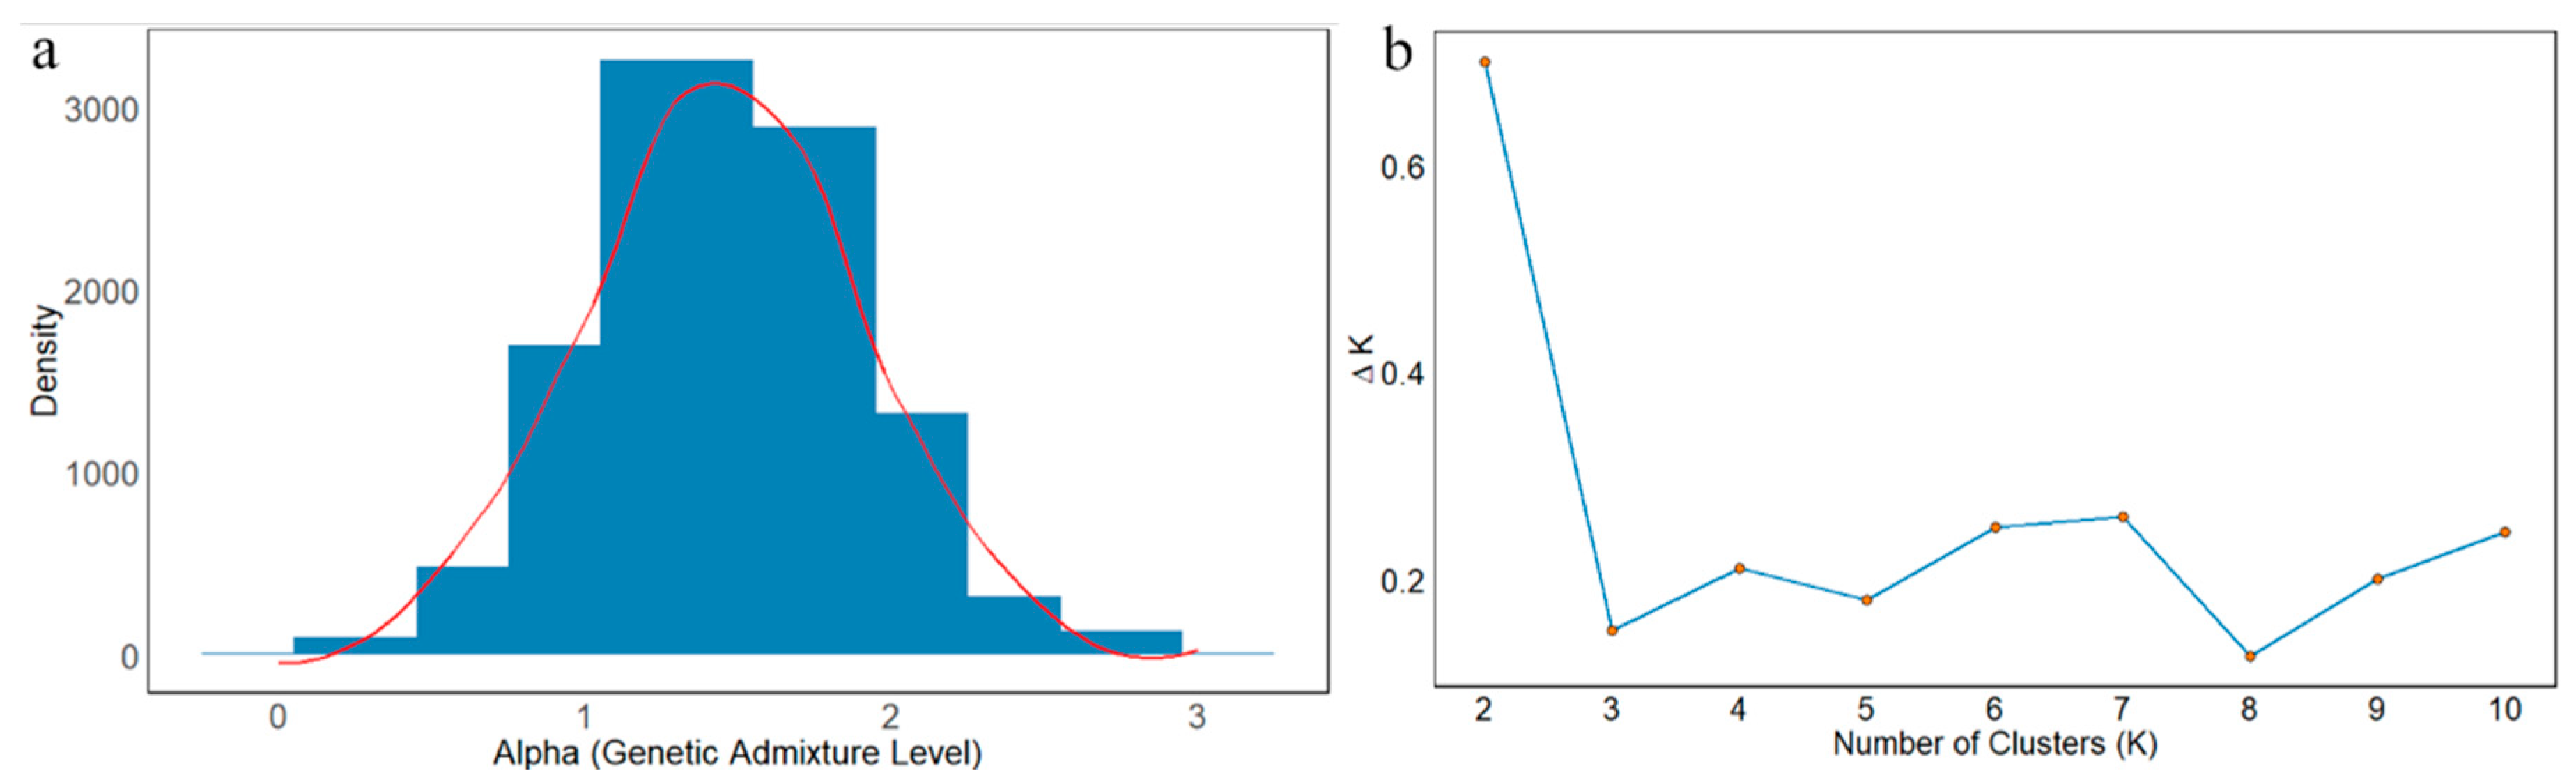
A population structure analysis was performed on 90 wheat varieties to assess genetic differentiation and admixture patterns. The results revealed two primary genetic groups, labeled Group 1 and Group 2, with slight admixture observed between them. The wheat varieties were categorized based on their proportion of genetic composition from each group. Group 1 was predominantly observed in the first 45 varieties, with these varieties exhibiting an average genetic contribution of 82% from Group 1 and only 18% from Group 2. Conversely, Group 2 was more prevalent in the last 45 varieties, with an average of 86% contribution from Group 2 and only 14% from Group 1. The thresholds reflect empirically observed ancestry clusters validated by PCA/phylogenetic concordance and align with the ≥80% heuristic for predominant ancestry in population genetics. Interestingly, small admixtures were observed in some of the varieties. For instance, certain varieties in the Group 1-dominated section varying levels of genetic contribution from Group 2, with proportions ranging between 5% and 20%. Similarly, in the Group 2-dominated section, several varieties showed admixture from Group 1, although these were less pronounced, with proportions typically ranging from 10% to 15% (
Figure 4). These admixtures suggest potential introgression or gene flow between the two groups, possibly due to past breeding practices, shared ancestry, or hybridization events. Further, the clear separation of Group 1 and Group 2, along with the small admixtures, indicates that the wheat varieties under study exhibit strong genetic differentiation, but with minor levels of inter-group genetic exchange. This admixture pattern may be indicative of past gene flow between these groups, potentially influenced by historical breeding or environmental adaptation strategies.
Furthermore, the population structure analysis, based on the Delta K method, revealed a clear peak at K = 2, which corresponds to the most optimal number of clusters, as indicated by the highest Delta K value. Subsequent values for K = 3 to K = 10 were notably lower, with Delta K values consistently below 0.3, suggesting minimal differentiation beyond K = 2. These results indicate that the population is best characterized by two genetic clusters, with no substantial evidence for further subdivision. The observed structure suggests a strong genetic distinction between the two groups, with little to no significant admixture or gene flow beyond K = 2 (
Figure 5a,b).
3.5. Kinship, Linkage Disequilibrium and Association Analysis
The relative kinship estimates based on the 74 SSR data indicated that 80.34% of the pairwise kinship estimates were within the range of 0 to 0.05; the remaining estimates ranged from 0.05 to 0.71, with a continuously decreasing number of pairs filling in the higher estimate categories (
Figure 3). The kinship analysis revealed that most of the accessions had a null or weak relationship with the other accessions in this population (
Table S4).
The linkage disequilibrium (LD) analysis of 90 wheat genotypes using 100 SSR markers revealed a wide range of r
2 values. Most of the r
2 values were concentrated in the lower range, with 4159 instances falling between 0 and 0.01, indicating weak linkage. The frequency of r
2 values decreased as the values increased, with 996 instances between 0.01 and 0.02, and 374 between 0.02 and 0.03. As the r
2 values continued to rise, the number of occurrences diminished, with notable peaks occurring between 0.8099 and 0.8199 (49 instances), and 0.8399 to 0.8499 (213 instances). The highest recorded r
2 values were found in the interval between 0.9899 and 0.9999, with 386 instances, suggesting a higher degree of linkage in this range. In contrast, higher r
2 values were generally less frequent, highlighting a threshold beyond which genetic linkage may be inferred. This distribution of r
2 values indicates that linkage disequilibrium is more prominent in certain regions of the genome, with varying levels of LD across the wheat genotypes, particularly in regions with lower r
2 values and specific marker intervals (
Table S5).
This study employed both the MLM and the GLMM to identify significant genetic markers associated with key agronomic traits. The findings demonstrated the effectiveness of GLMM in capturing associations, as it generally identified a greater number of markers and explained a higher proportion of phenotypic variation for certain traits, reflecting its ability to account for complex data structures and random effects. For leaf area index, MLM identified two significant markers with
p-values explaining 5.32% to 14.81% of the observed phenotypic variation. The GLMM, in comparison, detected four markers with
p-values, accounting for 7.09% to 16.30% of the phenotypic variance. In the case of canopy temperature, MLM identified 13 significant markers with
p-values, explaining 6.32% to 19.63% of the phenotypic variation. The GLMM, however, identified nine markers with
p-values ranging from 0.0017 to 0.0098, explaining 13.22% to 19.34% of the phenotypic variance, demonstrating its enhanced sensitivity for this trait. For grain area, MLM detected four significant markers with
p-values ranging from 0.0010 to 0.0072, accounting for 8.21% to 14.27% of the phenotypic variation. In contrast, GLMM identified one marker with
p-values, explaining 7.03% to 14.09% of the variance. The analysis of thousand kernel weight revealed that MLM identified six significant markers with
p-values explaining 3.50% to 9.72% of the phenotypic variation. The GLMM detected five markers with
p-values ranging from 0.0027 to 0.0058, explaining 3.06% to 8.10% of the variation. For dry matter, MLM identified three significant markers with
p-values, accounting for 5.03% to 14.54% of the phenotypic variation. The GLMM, however, detected seven markers with
p-values ranging from 0.0016 to 0.0048, explaining 4.80% to 9.32% of the variation and underscoring its higher marker detection power. The harvest index analysis revealed that MLM identified two significant markers with
p-values ranging from 0.0018 to 0.0079, explaining 5.43% to 10.21% of the phenotypic variation. The GLMM identified eight markers with
p-values between 0.0037 and 0.0061, accounting for 8.74% to 11.27% of the variation. For the tiller number, MLM identified eight significant markers with
p-values ranging from 0.0034 to 0.0045, explaining 6.62% to 9.94% of the phenotypic variation. The GLMM, however, detected one marker with
p-values explaining 4.32% to 11.13% of the phenotypic variance. Finally, for grain yield, MLM detected four significant markers with
p-values ranging from 0.0082 to 0.0093, explaining 2.80% to 13.92% of the phenotypic variation. The GLMM identified three markers with
p-values ranging from 0.0027 to 0.0071, accounting for 3.16% to 8.37% of the variation (
Table 3).
4. Discussion
The comprehensive analysis of genetic and phenotypic variability in wheat accessions offers valuable insights into the relationships between key agronomic traits and their underlying genetic architecture. By examining the distribution of these traits and the genetic markers associated with them, we can better understand the complexities of wheat genetics and improve breeding strategies aimed at enhancing crop performance under saline conditions.
The trait distributions of the 90 wheat varieties revealed distinct patterns that can be attributed to both genetic factors and environmental influences. Traits such as leaf area index, grain area, and number of tillers demonstrated relatively uniform distributions, suggesting a stable genetic influence across the varieties. These traits appear to exhibit less variability, likely due to strong genetic control or minimal environmental effects. In contrast, more complex traits such as dry weight and straw exhibited more varied distributions. The DW followed a bimodal distribution, with two distinct groups of varieties showing markedly different levels of biomass accumulation. This distribution pattern could indicate the presence of distinct genetic subpopulations within the wheat accessions, with some varieties naturally predisposed to higher biomass accumulation than others. The right-skewed distribution of straw suggests that most of the varieties in this population exhibit relatively low to moderate straw production, with a smaller subset producing higher straw biomass, which may be genetically controlled or influenced by environmental conditions such as soil fertility or water availability.
The identification of significant positive correlations between traits such as dry weight and grain yield highlights the importance of optimizing biomass accumulation to improve crop yield. This finding aligns with previous research suggesting that increasing biomass production can directly contribute to higher grain yields, which is critical for enhancing food security in wheat-producing regions [
22,
23,
24,
25,
26,
27,
28]. The observed correlation between straw and dry weight further supports this notion, as higher straw production typically accompanies increased biomass. This relationship indicates that these traits are likely influenced by shared genetic factors or environmental variables, making them ideal targets for crop improvement programs aiming to optimize both grain and biomass production. Conversely, the negative correlation between canopy temperature and the number of tillers suggests that wheat plants exhibit physiological adaptations to minimize water loss under salt stress [
16]. This adaptation is crucial for improving water-use efficiency, especially in regions where water scarcity is a significant challenge. Plants with lower transpiration rates may exhibit greater physiological drought tolerance, which is increasingly important under the context salt stress [
29].
The visual stratification facilitated the detection of outliers and unique trends associated with specific varieties, offering valuable insights for selection and crop improvement strategies. These significant multivariate interactions provided a robust foundation for hypothesis generation, further genetic diversity analyses, and the identification of potential trait associations. Multivariate analysis further illuminated the genetic diversity present in the wheat accessions. The clustering of trait values by variety suggested that certain varieties exhibit distinct combinations of traits, potentially reflecting underlying genetic diversity. This clustering allowed for the identification of varieties with unique trait combinations, which may hold promise for targeted breeding programs. The clustering pattern also revealed that certain varieties with similar genetic backgrounds tend to exhibit similar phenotypic traits, supporting the hypothesis that genetic variation is a major determinant of phenotypic expression [
30]. This information is essential for breeders looking to select varieties with specific agronomic traits, such as high biomass or drought tolerance, for use in breeding programs aimed at enhancing wheat production in challenging environments.
The hierarchical clustering analysis of the 90 wheat varieties, performed using a distance matrix and the average linkage method, revealed five distinct genetic groups within the population. The circular dendrogram generated by this analysis visually represented these genetic clusters, with varieties within the same cluster exhibiting shorter branches, indicating a closer genetic relationship. Conversely, varieties from different clusters were separated by longer branches, which reflected greater genetic divergence. The use of a color-coded palette to differentiate the clusters facilitated the visualization of genetic relationships between the varieties and provided a clear depiction of the genetic structure of the population. The identification of five distinct genetic clusters suggests that the wheat accessions are genetically diverse, with certain varieties exhibiting close genetic relationships and others showing more pronounced genetic differences. This genetic diversity is essential for the development of wheat varieties that can perform well across a range of environments, as it provides breeders with a pool of genetic material that can be utilized for improving key traits such as yield, disease resistance, and drought tolerance [
31].
Kinship analysis based on SSR markers further highlighted the genetic diversity within the wheat population. The analysis revealed that a significant majority (80.34%) of the pairwise kinship estimates were within the range of 0 to 0.05, suggesting that most of the accessions are genetically distant from each other. This indicates a high level of genetic variation within the population, which is beneficial for breeding programs as it allows for the introduction of novel alleles that can contribute to the improvement of various agronomic traits. The presence of low kinship estimates between most of the accessions suggests that there are few closely related accessions in the population, further supporting the notion of high genetic diversity and highlighting the potential for genetic gains in breeding efforts. Further, the results demonstrate that LD in this wheat population is not uniform across the genome. While most of the markers exhibit low to moderate levels of LD, indicating potential recombination and independent assortment, there are distinct regions with stronger LD, suggesting tightly linked loci, which could be valuable for identifying candidate genes associated with traits of interest.
The application of both the MLM and the GLMM to identify significant genetic markers associated with agronomic traits demonstrated the complementary strengths of both approaches. GLMM, which accounts for both fixed and random effects [
32], was found to be more effective in capturing the genetic associations for most traits, especially those with complex genetic architectures and environmental interactions. The GLMM identified a greater number of significant markers and explained a higher proportion of the phenotypic variation compared to MLM. This is particularly evident for traits such as canopy temperature and dry weight, where GLMM identified a higher number of markers and accounted for a larger proportion of the phenotypic variance. The greater sensitivity of GLMM to complex genetic interactions and random effects makes it an ideal model for identifying markers associated with traits influenced by multiple genes and environmental factors. This model is particularly useful for traits with polygenic control, where the genetic architecture is more intricate and harder to capture using traditional models.
In contrast, MLM was effective for identifying significant markers for traits with simpler genetic structures, such as leaf area index and thousand kernel weight. While MLM detected fewer markers for some traits, it still provided robust estimates of the phenotypic variance explained, demonstrating its utility for traits with less complex genetic backgrounds. MLM’s strength lies in its ability to model fixed effects and incorporate covariates, making it a valuable tool for studying traits that are less influenced by environmental factors or interactions. The ability of MLM to provide accurate estimates of marker–trait associations for traits with simpler genetic structures complements the strengths of GLMM, suggesting that a combined approach utilizing both models can provide a more comprehensive understanding of the genetic basis of agronomic traits.
The results from this study underscore the importance of model selection in genetic association studies. While GLMM demonstrated superior performance in terms of the marker detection and phenotypic variance explained here, MLM remains a valuable tool for simpler traits. The combination of both models allows for a more thorough analysis of the genetic underpinnings of agronomic traits, which can inform breeding strategies aimed at improving crop performance. The identification of significant genetic markers for key agronomic traits such as canopy temperature, dry weight, and grain yield provides valuable insights for future wheat breeding programs. These markers can be used to accelerate the development of wheat varieties with improved traits, such as enhanced drought tolerance, increased biomass production, and higher grain yields, ultimately contributing to greater food security and agricultural sustainability.
5. Conclusions
This study provided valuable insights into the genetic diversity and salt stress responses of 90 wheat genotypes using SSR markers and phenotypic evaluation under medium salinity conditions. Significant variation was observed across key agronomic traits, and association mapping identified several SSR markers linked to yield-related characteristics. The results confirmed the effectiveness of the GLMM in detecting genetic associations while accounting for complex population structures. The genetic diversity and population structure analyses revealed a broad genetic base among the wheat varieties, offering opportunities for breeding programs.
Overall, our findings highlight the potential of integrating morphological trait evaluation with molecular marker information to accelerate the development of salt-tolerant wheat varieties. Future studies combining high-density genotyping and phenological trait assessments will further enhance the precision of marker-assisted selection for salinity tolerance.


