Article

Increased Light Intensity Mitigates CO2 and CH4 Emissions from Paddy Soil by Mediating Iron Redox Cycling Coupled with Organic Carbon Transformation

College of Agriculture, Henan University of Science & Technology, Luoyang 471003, China
*
Author to whom correspondence should be addressed.
Agronomy 2025, 15(5), 1137; https://doi.org/10.3390/agronomy15051137
Submission received: 12 March 2025 / Revised: 3 May 2025 / Accepted: 4 May 2025 / Published: 6 May 2025

Abstract

:
Iron redox cycling in paddy soils drives the release and mineralisation of dissolved organic carbon (DOC), influencing the emission of CO2 and CH4. Light irradiation exerts an inhibitory effect on the mineralisation of soil organic carbon, but the responses to light intensity of iron redox processes coupled with organic carbon transformation and greenhouse gas emissions remain underexplored. Here, we conducted a slurry incubation experiment with paddy soil at varying light intensities. The dynamics of soil ferrous iron [Fe(II)], DOC, dissolved inorganic carbon (DIC), and chlorophyll a, as well as headspace CO2 and CH4, were monitored over a 40-day period. The results demonstrated that light irradiation inhibited iron reduction, leading to a 58.1–74.7% decrease in soil Fe(II) concentration compared to dark incubation. The oxidation of Fe(II) generated from iron reduction was enhanced under light incubation (3.12–3.53 mg g−1), and the oxidation rate constant trended higher with increasing light intensity. Light irradiation reduced CO2 and CH4 emissions to 8.8–76.9% and 2.3–6.7% of those under dark incubation, respectively. With the extension of incubation time, soil DIC concentration showed an increase followed by a decrease under light incubation, and the earlier DIC decrease occurred at higher light intensities. The DOC decrease rate constant was greater under light incubation (0.024–0.042 d−1) than under dark incubation (0.012 d−1). Light irradiation activated phototrophic microorganisms producing chlorophyll a (4.71–6.46 mg g−1), whereas this pigment was undetectable under dark incubation. Organic carbon mineralisation was positively correlated with Fe(II) concentration, and Fe(II) oxidation was positively correlated with chlorophyll a concentration and DOC decrease (p < 0.05). Agricultural practices optimizing light exposure, such as shallow flooding or reducing plant density, are promising approaches to bolster DOC sequestration and mitigate CO2 and CH4 emissions in paddy fields.

1. Introduction

Wetland soils may act as a source of greenhouse gases, such as CO2 and CH4 [1]. The global carbon stock in wetland soils is ~612 × 109 t [2], with up to 45 × 109 t of carbon bound to iron oxides [3]. Iron oxides can be readily reduced by microorganisms under anaerobic conditions [4,5,6,7], mainly through the dissimilatory reduction of ferric iron [Fe(III)] to ferrous iron [Fe(II)] [4,8]. Microbial Fe(III) reduction in soils requires organic carbon as an electron donor [4,9,10]. Exogenous organic carbon input, such as organic acids and sugars, can accelerate Fe(III) reduction in soils [10,11], which promotes the release of iron-bound organic carbon [3,12,13,14]. In particular, the Fe(III) reduction process prevails in flooded paddy soils, facilitating carbon mineralisation to CO2 and CH4 [15,16].
Light irradiation can inhibit organic carbon mineralisation, potentially reducing CO2 and CH4 emissions [17,18]. This effect is attributed to anaerobic Fe(II) oxidation, mediated by phototrophic microorganisms, including oxygenic phototrophs (e.g., cyanobacteria [18,19,20]) and anoxygenic phototrophs (e.g., photoferrotrophs [17,21], Rhodopseudomonas palustris [22]). Oxygenic phototrophs produce O2, facilitating the chemical oxidation of Fe(II) to Fe(III) hydroxides, whereas anoxygenic phototrophs, an evolutionary predecessor of oxygenic phototrophs [19,20], use Fe(II) as an electron donor in anaerobic photosynthesis, forming Fe(III) oxides without O2 [21,23,24]. These two groups of phototrophs interact by competing for Fe(II) and responding to O2 gradients. Generally, the anoxygenic oxidation of Fe(II) dominates in strict anoxia, and the oxygenic contribution increases with increasing light intensity [25,26]. Phototrophs, either oxygenic or anoxygenic, assimilate CO2 in the form of microbial biomass carbon [18,27]. Light availability shapes the microbial community structure and function by affecting photosynthetic efficiency [28]. The storage of carbon via microbial photosynthesis is in close association with light intensity. When below the light saturation point, higher light intensity increases the rate of photosynthetic O2 production by phytoplankton (e.g., algae); excessive light intensity induces cell damage, thus inhibiting photosynthetic O2 production [29,30]. However, the effect of varying light intensities on iron-mediated carbon cycling in paddy soils is underexplored, and field-applicable insights are lacking.
Fe(II) oxidation by phototrophs can form poorly crystalline Fe(III) oxyhydroxides (e.g., ferrihydrite [31]), which physically protect organic carbon from microbial decomposition [32,33,34]. Organic carbon sequestration by Fe(III) oxides refers to the capture and stabilisation of dissolved organic carbon (DOC) through adsorption and co-precipitation, which can reduce the possibility of mineralisation into CO2 and CH4 [35]. Additionally, Fe(III) oxides may immobilise heavy metals like cadmium (Cd) [36] and arsenic (As) [37], enhancing soil quality. Within a certain range, higher light intensity can enhance phototrophic activity, thereby accelerating Fe(II) oxidation and consequent DOC sequestration. However, light-induced Fe(II) oxidation also reduces Fe(II) availability, potentially constraining phototroph growth [38,39,40]. These findings suggest that light irradiation can shift the carbon cycle in paddy soils from mineralisation to sequestration, but iron redox processes coupled to carbon transformations are rarely linked to light intensity, limiting strategies for eco-friendly rice production.
Therefore, it was hypothesised that light irradiation stimulates distinct phototrophic microorganisms in paddy soils by enhancing photosynthetic activity, which promotes Fe(II) oxidation to form Fe(III) oxides that sequester DOC; higher light intensity amplifies these effects on iron redox cycling to mitigate CO2 and CH4 emissions. Using paddy soil collected from the middle and lower reaches of the Yellow River, China, we conducted a laboratory incubation experiment under varying light conditions. The objectives of the present study were to 1) qualify the responses of iron redox processes in paddy soil to light intensity by monitoring the dynamics of Fe(II) and 2) evaluate the effects of light intensity on organic carbon transformation in paddy soil by analysing the dynamics of dissolved inorganic and organic carbon (DIC, DOC) and carbon-containing greenhouse gases (CO2, CH4). The results of this study could provide a glimpse into iron-mediated carbon cycling in paddy fields driven by light intensity, fostering the development of light-based agricultural practices to enhance carbon storage and reduce environmental impacts.

2. Materials and Methods

2.1. Description of Experimental Soil

Surface soil (0–20 cm) was collected in October 2023 from a paddy field in Huimeng Town, Mengjin County, Henan Province, China (34°48′21″ N, 112°39′51″ E). The soil type was classified as Fluvisols according to the World Reference Base for Soil Resources (HWSD Database version 2.0). The soil was air-dried, ground, and passed through a 1 mm sieve before use. The soil properties were tested using standard methods [41]. Specifically, the soil pH was 8.16 ± 0.08, measured with a soil-to-water ratio of 1:2 (w/v). The soil organic matter content was 2.56 ± 0.02% (potassium dichromate volumetric method), with 7.03 ± 0.64 µmol g−1 of DIC and 12.14 ± 0.76 µmol g−1 of DOC (water extraction at 5:1, v/w). The soil total iron concentration was 46.04 ± 1.33 mg g−1 (LiBO2 fusion at 950 °C), the free iron concentration was 10.24 ± 0.67 mg g−1 (dithionite-citrate-bicarbonate extraction), and the amorphous iron concentration was 2.20 ± 0.17 mg g−1 (citrate extraction). Fe(II) was not detectable in the soil before the experiment (0.5 M HCl extraction)

2.2. Soil Incubation Experiment

The simulated incubation experiment was conducted in a total of 600 penicillin vials (10 mL), with each containing exactly 3.000 g of soil and 3.00 mL of deionised water (soil: water = 1:1, w/v). All vials were purged with N2 for 5 min to ensure anoxic conditions without CO2, then sealed with rubber plugs and aluminium crimp caps. After that, the vials were randomly and equally divided into four treatments (n = 150 each): a dark treatment and three light treatments. Vials of the dark treatment were placed in a dark incubator, and vials of the light treatments were kept in three artificial climate chambers (FPG3; Life Science and Technology Co., Ltd., Ningbo, China), with varying light intensities (covering 75%, 50%, and 0% of fluorescent tubes with aluminium foil, designated L1, L2, and L3 treatments, respectively). All light treatments were illuminated with the same fluorescent lights (T5, Opple, Shanghai China), with a colour temperature of 6500 K. An illuminometer (LX101; Lutron, Taiwan, China) was used to measure light intensity in the incubators, expressed as photosynthetic photon flux density (L1: 11.57 ± 0.61 µmol m−2 s−1; L2: 15.75 ± 0.63 µmol m−2 s−1; L3: 34.24 ± 1.08 µmol m−2 s−1). These light intensities fall within the range required for the photosynthetic activity of naturally occurring phototrophs [28]. All vials were incubated at 30 ± 1 °C for 40 d, with destructive sampling regularly (1, 3, 5, 7, 9, 12, 15, 20, 25, 30, 40 d) to analyse Fe(II), carbon, and chlorophyll a concentrations (three replicates).
At each time of sampling, three vials per treatment were randomly selected, to (i) evaluate iron redox processes—the vials were sufficiently shaken and then decapped; 0.40 mL of the soil slurry per vial was aspirated and extracted with 4.6 mL of 0.5 M HCl at 30 ± 1 °C for 24 h for the measurement of Fe(II) concentrations; (ii) monitor the carbon dynamics—headspace gas samples were extracted using a 1 mL disposable syringe and directly used to measure CO2 and CH4 concentrations; after gas sampling, each vial was decapped to wash out the soil slurry with 12 mL deionised water (soil-to-total water = 1:5, w/v); the slurry was shaken and passed through a 45 μm filter (Bojin Technology, Tianjin, China) before the determination of dissolved carbon concentrations; and (iii) assess the production of chlorophyll a—the soil slurry in each vial was washed out using 15 mL of 80% acetone solution, thoroughly ground with an agate mortar, and then centrifuged (2435× g, 4 °C, 3 min); the supernatant was collected to measure chlorophyll a concentration.

2.3. Sample Analysis

Total iron, free iron, and amorphous iron in the original soil were quantified using atomic absorption spectroscopy (AA240, Agilent, Palo Alto, CA, USA). Fe(II), extracted from soil slurries by 0.5 M HCl [hereinafter referred to as Fe(II)], was quantified colourimetrically with o-phenanthroline [18]. Dissolved organic and inorganic carbon were quantified with a TOC analyser (TOC-VCPH; Shimadzu, Kyoto, Japan). CO2 and CH4 in the headspace were analysed using a gas chromatograph (GC7900; Tianmei, Shanghai, China) equipped with a TDX01 column and a thermo-conductivity detector, and quantified by an external standard method. The analytical conditions were as follows: inlet temperature, 110 °C; column temperature, 100 °C; detector temperature, 150 °C; and bridge current, 90 mA. The chlorophyll a concentration in supernatant samples was measured using dual-wavelength colourimetry [42].

2.4. Data Calculation and Analysis

To reflect light-induced phototrophic Fe(II) oxidation, Fe(II) oxidation was calculated as the difference between the peak Fe(II) concentration during incubation and the Fe(II) concentration at each sampling time. This oxidation process slows down over time due to substrate depletion, following a curved (sigmoidal) trend [23]. A logistic model (Equation (1)) was used to fit the trend in Fe(II) oxidation, as it can describe the rapid initial oxidation and subsequent slowdown typical of microbial processes.
C Fe II reox = a 1 + b e kt
where CFe(II)reox is the amount of Fe(II) oxidation, mg g−1; a is the Fe(II) oxidation capacity, mg g−1; b is a parameter related to the curve shape, dimensionless; k is the Fe(II) oxidation rate constant, d−1; and t is the incubation time, d.
Organic carbon mineralisation was calculated as the sum of CO2, CH4, and DIC produced in the system. To evaluate DOC dynamics driven by light intensity, the DOC decrease (ΔDOC) was defined as the difference between the initial DOC concentration at the start of incubation (0 d) and the DOC concentration at the time of sampling. Since first-order kinetic equations are widely used to model soil organic carbon mineralisation processes [43], the relationships between dissolved carbon concentrations and incubation time were fitted using a first-order kinetic equation (Equation (2)):
Ct = C0 × e−kt
where C0 is the maximum of DIC or DOC concentration over the incubation period, mg g−1, and k is the apparent rate constant, d−1.
Data were processed with Microsoft Excel 2016 (Microsoft Corp., Redmond, WA, USA). Origin Pro 8.5 (OriginLab Corp., Northampton, MA, USA) and IBM SPSS Statistics 23.0 (IBM Corp., Armonk, NY, USA) were used for graphing and statistical analysis, respectively. The comparison of means between different treatment groups was conducted using one-way analysis of variance (ANOVA), and Tukey’s test was used to determine the significance of differences (p < 0.05).

3. Results

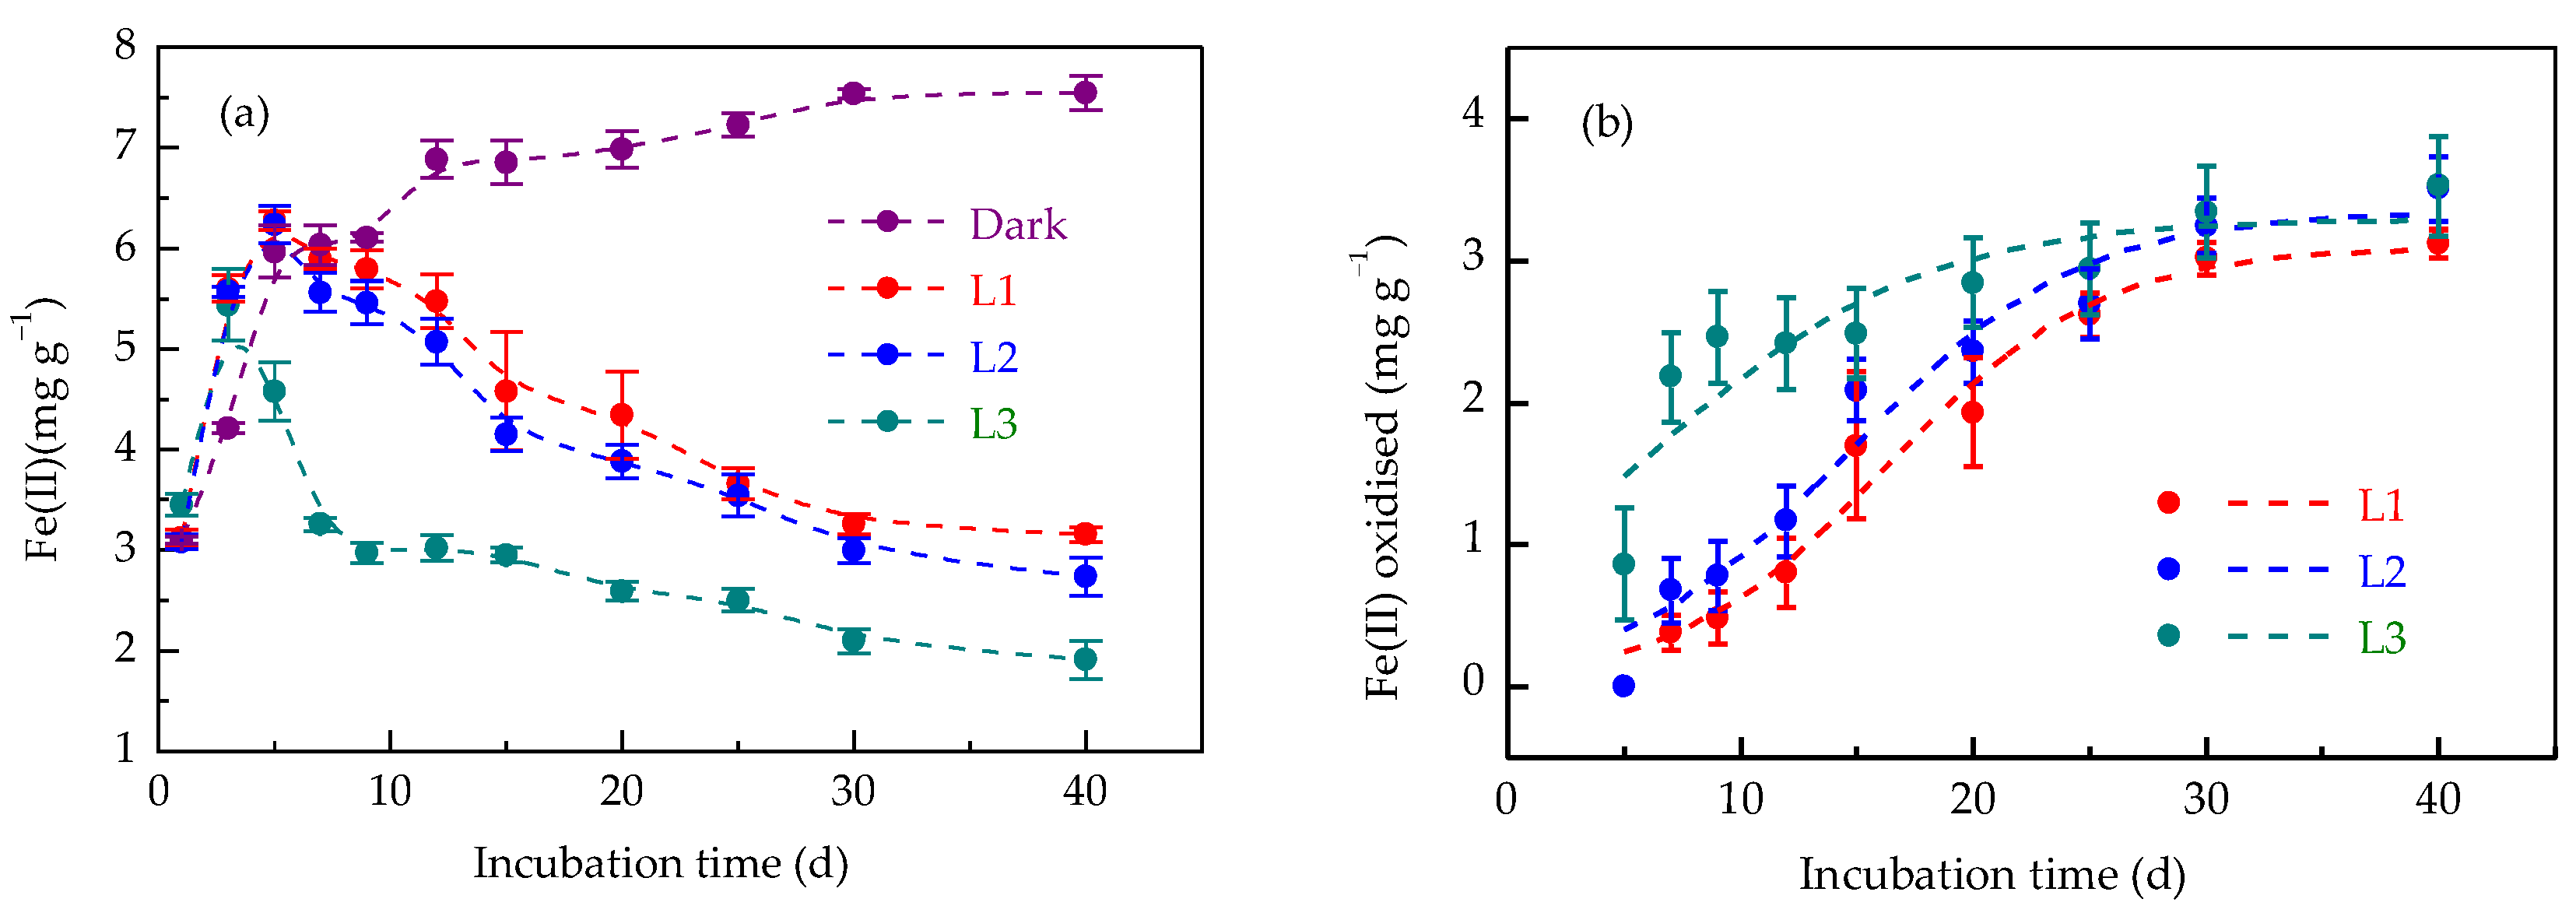
3.1. Responses of Iron Redox Cycling to Light Intensity

Light irradiation altered iron redox dynamics in anoxic paddy soil (Figure 1). Under dark incubation, Fe(III) reduction dominated, yielding 7.55 ± 0.17 mg g−1 Fe(II) at 40 d, with 79.1% of Fe(II) produced within the first 5 d (Figure 1a). The Fe(II) concentration continued to increase with the extension of incubation time, indicating a pure Fe(III) reduction process in the absence of light-driven oxidation. In contrast, the Fe(II) concentrations in L1 and L2 treatments peaked at 5 d, whereas in L3, the peak value occurred at 3 d, reflecting a faster oxidation onset at higher light intensities (Figure 1a).
Light irradiation promoted the oxidation of Fe(II) produced in soil. Fe(II) oxidation increased with increasing incubation time, reaching 3.12 ± 0.10, 3.50 ± 0.23, and 3.53 ± 0.35 mg g−1 in L1, L2, and L3 treatments, respectively, at 40 d (Figure 1b). The sigmoidal-shaped relationship between Fe(II) oxidation and incubation time conformed to the logistic model (Figure 1b, Table 1). Higher light intensities accelerated the Fe(II) oxidation rate, generating a four-fold difference between L1 and L3 treatments (Table 1).

3.2. Changes in Organic Carbon Mineralisation Under Varying Light Intensities

Light irradiation negatively affected organic carbon mineralisation compared to dark conditions. In the dark treatment, organic carbon mineralisation reached 30.79 ± 0.52 μmol g−1 at 40 d (Figure 2a), comprising 21.0% CO2 (6.47 ± 0.47 μmol g−1), 26.7% CH4 (8.22 ± 0.39 μmol g−1), and 53.0% DIC (16.31 ± 0.08 μmol g−1). Light irradiation markedly inhibited organic carbon mineralisation. In particular, CO2 and CH4 emissions were undetectable in the L3 treatment after 15 and 12 d, respectively, with only 0.37 ± 0.02 μmol g−1 of DIC produced at 40 d.
Light irradiation changed the patterns of CH4 emissions from soil. Under dark conditions, the CH4 emissions increased gradually and then rapidly with the extension of incubation time, reaching 8.22 ± 0.39 μmol g−1 at 40 d. Among all three light treatments, the CH4 emissions peaked at 5–7 d, becoming undetectable after 12 d (Figure 2b). The maximum CH4 emissions from L1, L2, and L3 treatments were considerably lower (0.55 ± 0.02, 0.51 ± 0.04, and 0.19 ± 0.03 μmol g−1, respectively), accounting for only 6.7%, 6.2%, and 2.3% of those in the dark treatment, respectively. This indicates light irradiation inhibited CH4 emissions, with greater effects at higher intensities.
CO2 emissions followed a similar trend to CH4 dynamics, plateauing at 6.47 ± 0.47 μmol g−1 under dark conditions (Figure 2c). In contrast, the CO2 emissions from light treatments peaked at 5–7 d, and the maximum CO2 emissions from L1, L2, and L3 treatments were reduced to 4.98 ± 0.50 μmol g−1 (76.9%), 4.60 ± 0.60 μmol g−1 (71.1%), and 0.57 ± 0.30 μmol g−1 (8.8%) compared to those in the dark treatment, respectively. The results were suggestive of the light inhibition of soil CO2 emissions in the early stage of incubation. Thereafter, CO2 emissions of L1, L2, and L3 treatments decreased to undetectable levels after 20, 15, and 7 d, respectively, indicating faster emission suppression at higher light intensities.
Light irradiation additionally altered the trend in the soil DIC concentration over the incubation period. The DIC concentrations demonstrated an initial increase with the extension of incubation time and then levelled off under dark incubation, whereas an increase followed by a dramatic decrease was observed under light incubation (Figure 2d). Higher light intensities resulted in an earlier decrease in DIC, which peaked at 3 d in the L3 treatment and 7 d in the L2 and L1 treatments (Figure 2d). During the DIC decrease stage, the relationship between DIC concentration and incubation time under varying light intensities followed apparent first-order kinetics (Table 2). Higher light intensities contributed to a greater rate constant and a faster consumption of DIC.

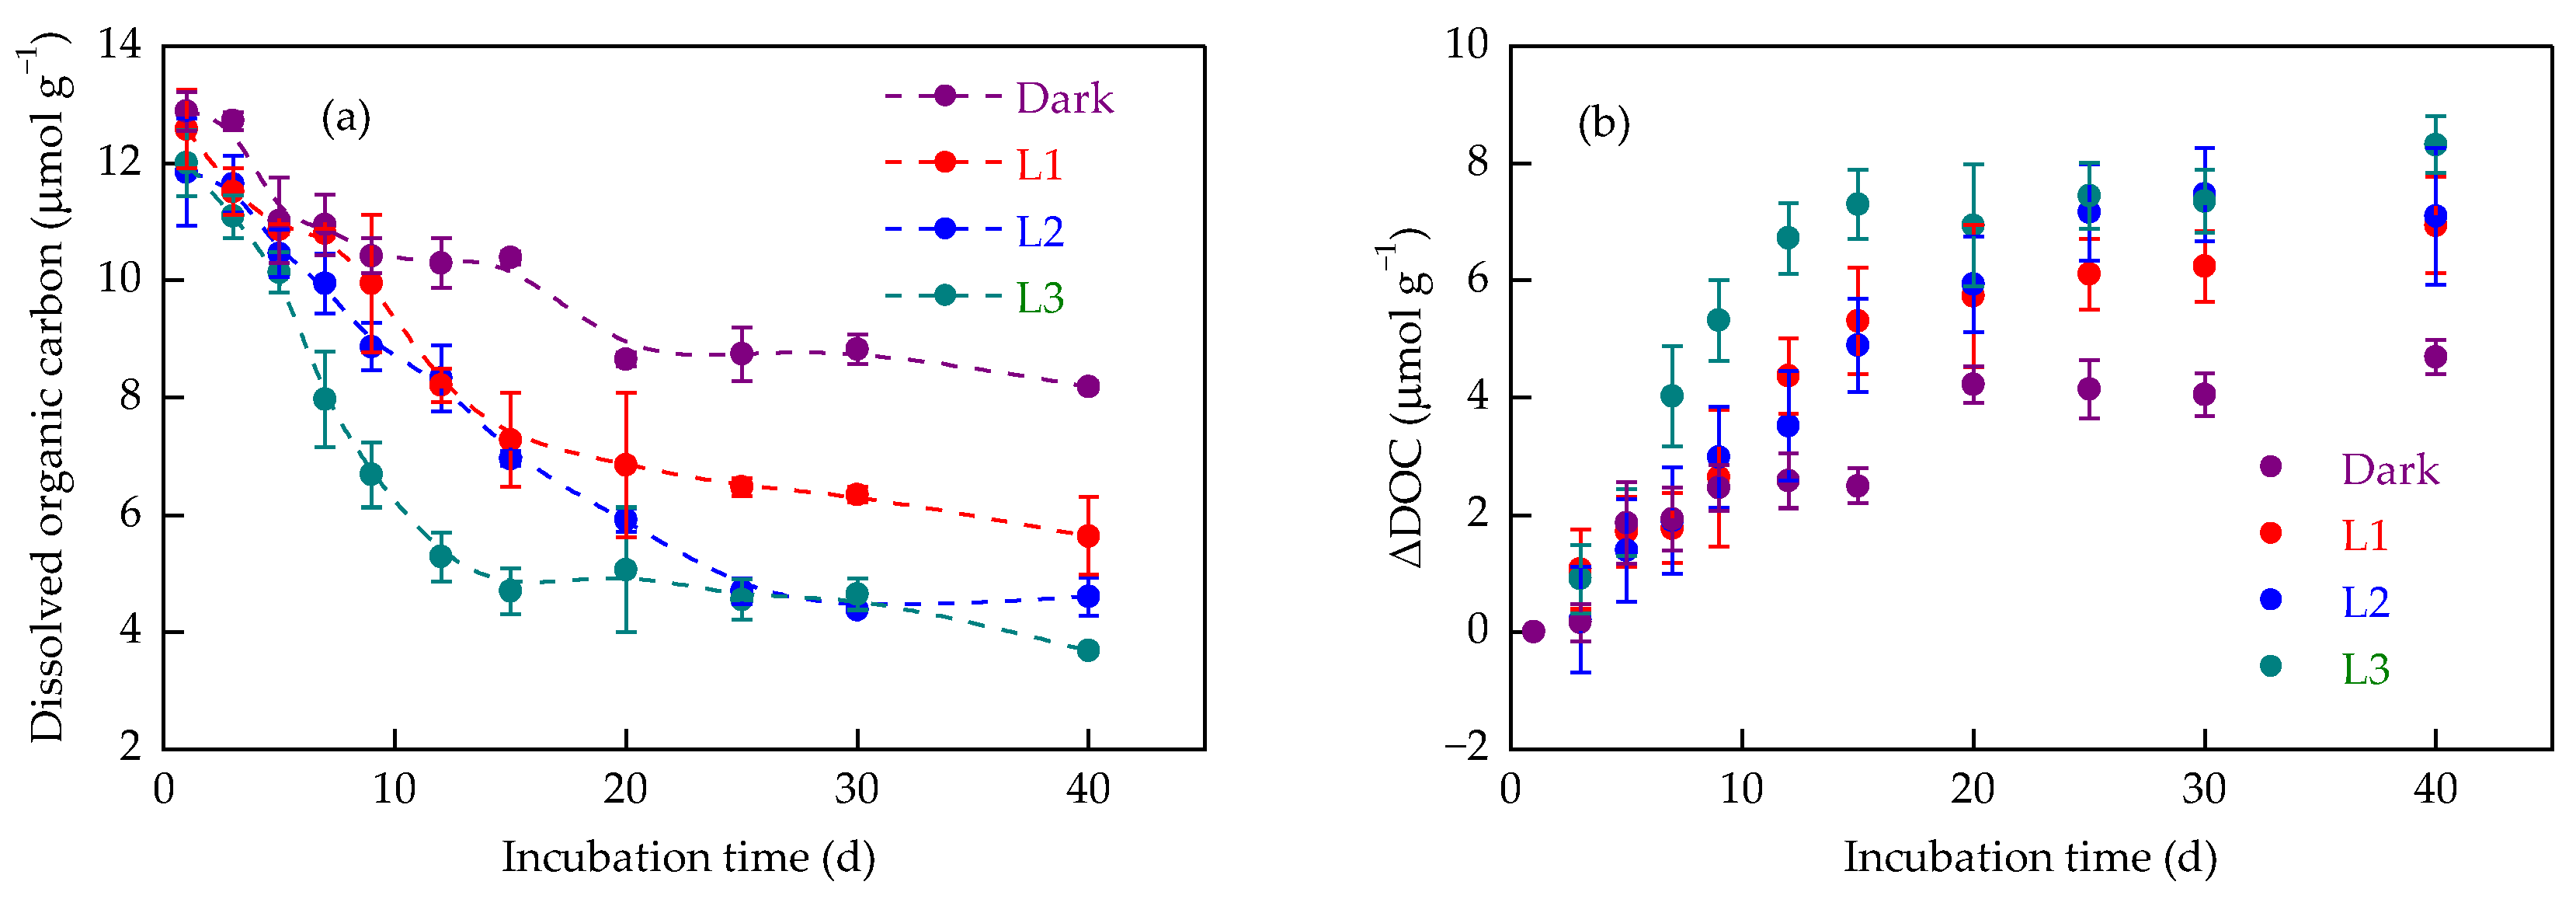
3.3. Dynamics of Dissolved Organic Carbon in Response to Light Intensity

Light irradiation accelerated DOC decrease compared to dark conditions. In the dark treatment, soil DOC concentrations decreased gradually with the extension of incubation time, with 8.19 ± 0.09 µmol g−1 remaining stable at 40 d (Figure 3a). Light irradiation exacerbated the downward trend in soil DOC concentrations, which decreased to 5.64 ± 0.67, 4.60 ± 0.32, and 3.68 ± 0.07 µmol g−1 in L1, L2, and L3 treatments, respectively. The largest ΔDOC in L3 treatment (8.32 ± 0.49 µmol g−1) correlated with the highest Fe(II) oxidation (3.53 ± 0.35 mg g−1). The ΔDOC dynamics with incubation time followed apparent first-order kinetics (Figure 3b, Table 3). The apparent decrease rate constant in DOC was 0.012 ± 0.002 d−1 under dark incubation. With increasing light intensity, the rate constant progressively increased, and the greatest value was recorded for the L3 treatment (0.034 ± 0.003 d−1), implying consistent DOC sequestration across light intensities (Table 3).

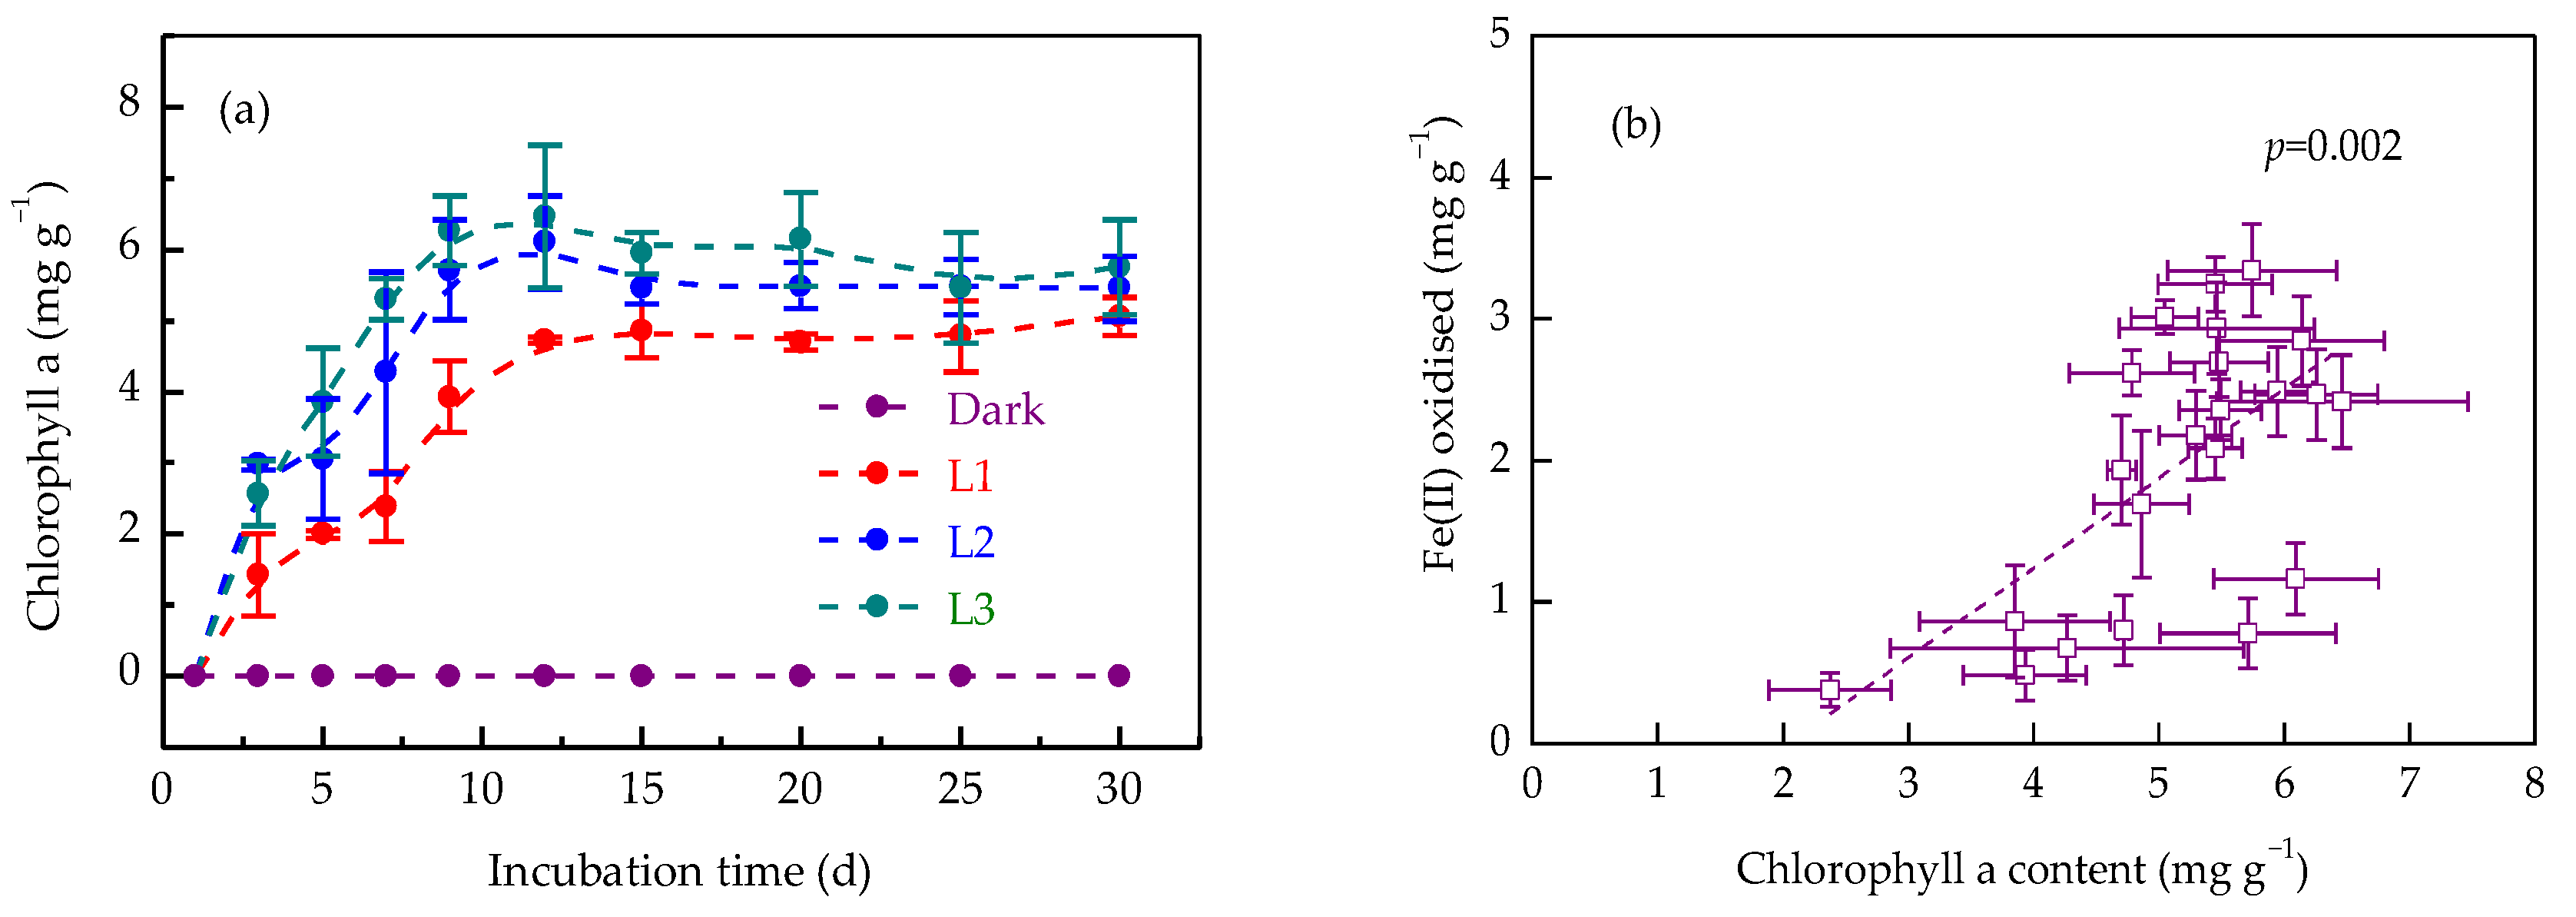
3.4. Effects of Light Intensity on Chlorophyll a Production

Light irradiation activated phototrophic microorganisms in soil, promoting the production of chlorophyll a. Chlorophyll a was undetectable in samples of the dark treatment throughout the incubation process (Figure 4a). In light treatments, soil chlorophyll a concentrations ranged from 1.43 ± 0.58 to 2.98 ± 0.07 mg g−1 at 3 d. With the extension of incubation time, the chlorophyll a concentrations demonstrated a gradual increase in L1, L2, and L3 treatments, reaching 4.71 ± 0.05, 6.09 ± 0.65, and 6.46 ± 1.00 mg g−1, respectively, at 12 d. After that, a slight decrease in chlorophyll a concentrations was observed in L2 and L3 treatments, by 10.6% and 11.1%, respectively. Higher light intensities (L3) enhanced chlorophyll a production, correlating with the faster Fe(II) oxidation rate constant (0.87 ± 0.35 d−1). The chlorophyll a content was positively correlated with the amount of Fe(II) oxidised (p < 0.01) (Figure 4b), indicating Fe(II) oxidation was driven by phototrophs.

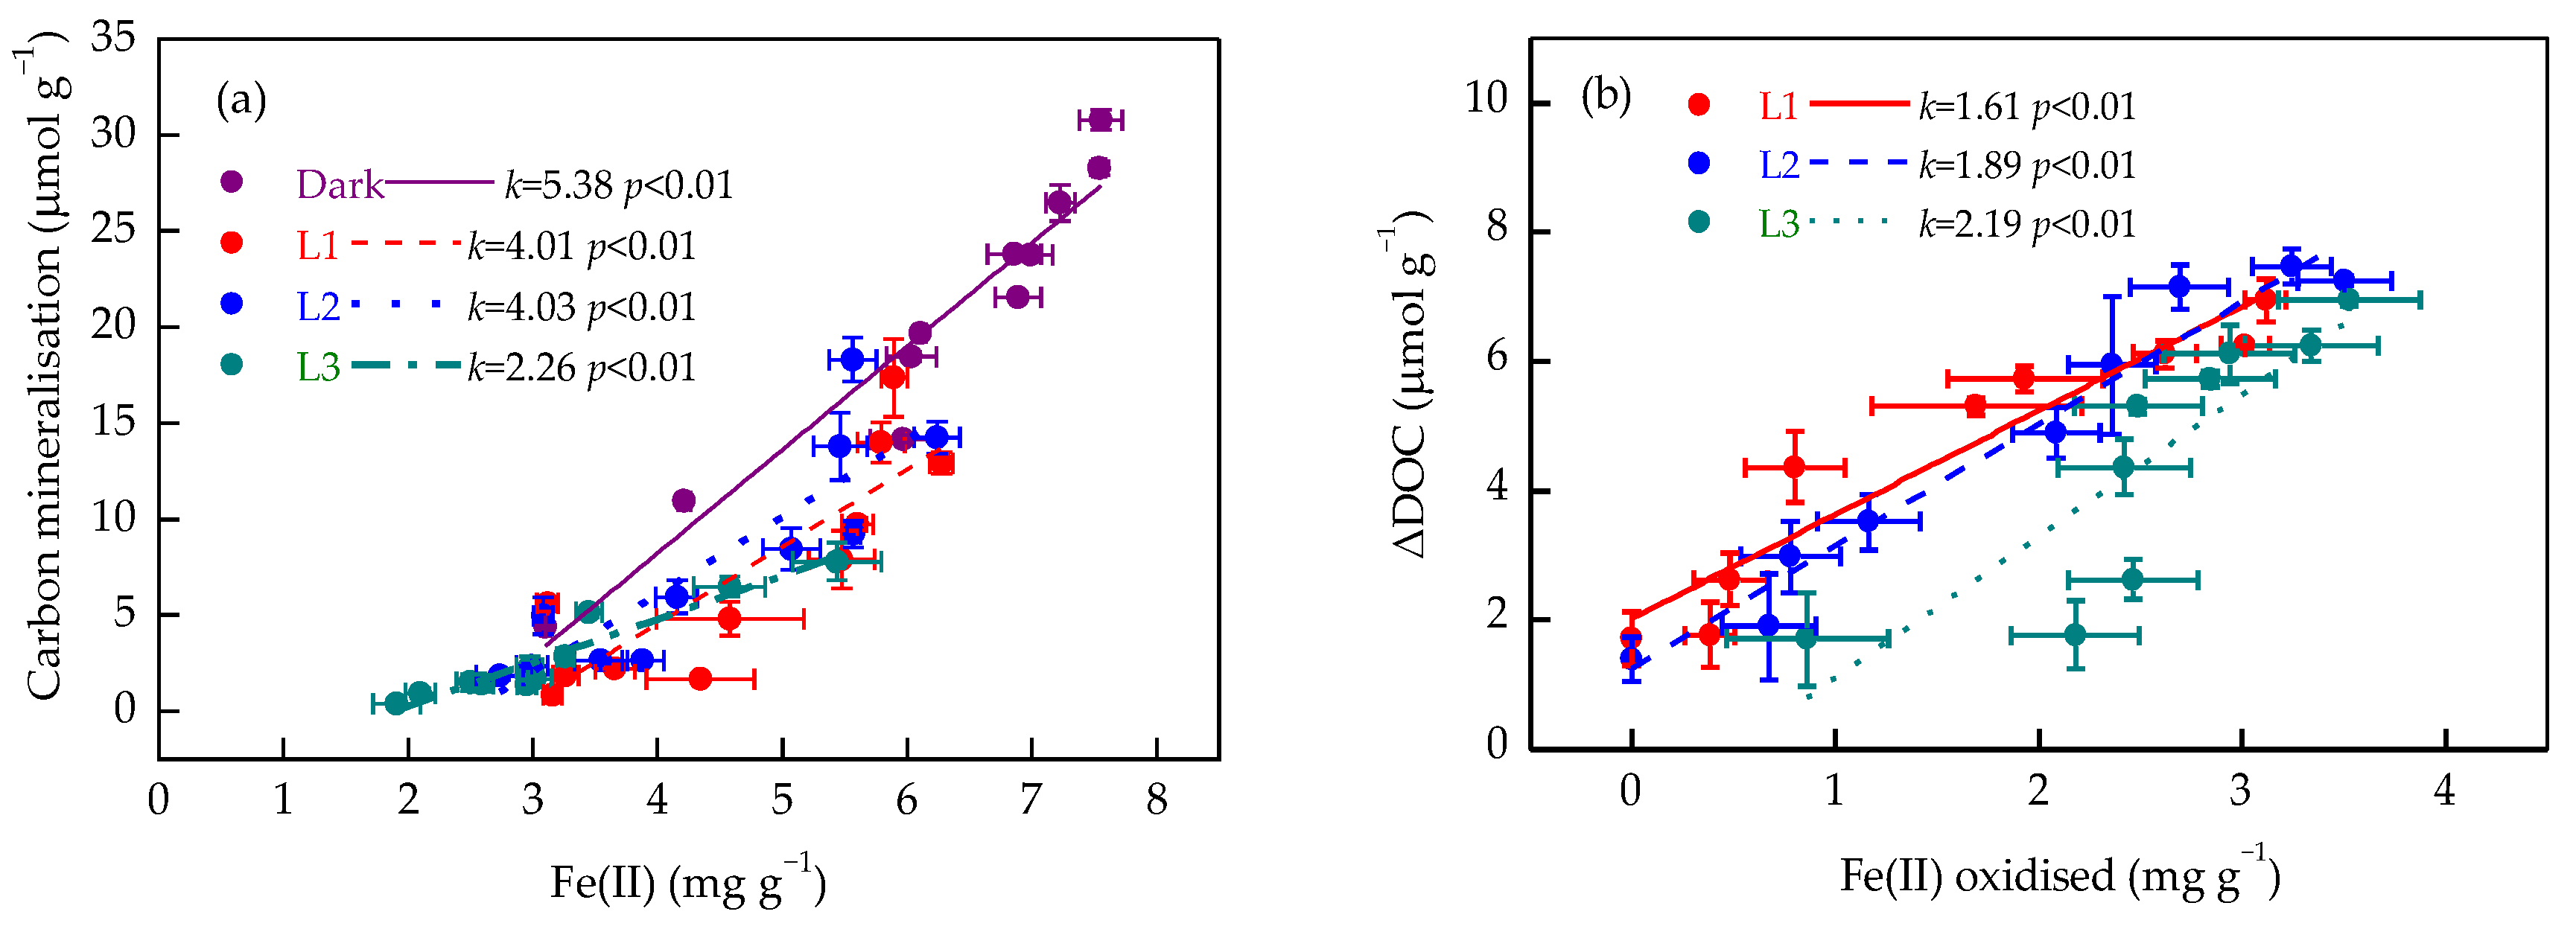
3.5. Relationships Between Iron Redox Processes and Organic Carbon Transformation

In the dark treatment, soil Fe(II) concentrations were significantly positively correlated with the amount of organic carbon mineralised (Figure 5a). The linear relationship remained in soil samples when incubated under varying light conditions. The slopes of the linear relationship were 4.01 and 4.03 for the L1 and L2 treatments, respectively, greater than 2.26 for the L3 treatment. These results suggest that higher light intensity led to decreased organic carbon mineralisation in soil. Accordingly, Fe(II) oxidation was positively correlated with ΔDOC, and the slope increased with increasing light intensity (Figure 5b), reflecting enhanced DOC sequestration.

4. Discussion

4.1. Light Intensity Modulates Iron Redox Cycling in Paddy Soil

This study unravelled prominent effects of light intensity on iron redox reactions in the paddy soil. Flooding triggered rapid Fe(III) reduction, producing substantial Fe(II) under dark conditions, representing 73.7% of free iron. Light irradiation shifted the iron dynamics and promoted Fe(II) oxidation across treatments, with higher light intensities accelerating the oxidation rate. This agrees with previous studies showing light-driven Fe(II) oxidation in anaerobic soils [18,44].
Phototrophic microorganisms drove the shift from Fe(III) reduction to Fe(II) oxidation in the soil, as evidenced by considerable chlorophyll a production under light conditions, but not in the darkness. Light irradiation can activate phototrophic microorganisms [40], with both anoxygenic phototrophs (e.g., photoferrotrophs [17,23,45]) and oxygenic phototrophs (e.g., cyanobacteria [19,20,40]) contributing to Fe(II) oxidation. Within the range of 11.57–34.24 µmol m−2 s−1, higher light intensities increased the chlorophyll a concentration and Fe(II) oxidation rate in soil, suggesting enhanced phototrophic activity. The amount of Fe(II) oxidation (60–70% of peak Fe(II) concentration) aligns with reported ranges in anoxic paddy soils, and the oxidation amount at higher light intensities even surpasses typical values in sediments [23,46].
In the presence of light, Fe(II) oxidation proceeded in the soil via distinct mechanisms. Oxygenic phototrophs, such as cyanobacteria, produce O2 during photosynthesis, enabling chemical Fe(II) oxidation: 4Fe2+ + O2 + 10H2O → 4Fe(OH)3 + 8H+, which forms insoluble Fe(III) hydroxides [24,31]. In our anoxic setup, the limited O2 supply likely facilitated localised Fe(II) oxidation via the oxygenic pathway, which was amplified at a high light intensity (L3: 34.24 ± 1.08 µmol m−2 s−1). Conversely, anoxygenic phototrophs, represented by ‘Rhodopseudomonas’ [22], oxidise Fe(II) anaerobically, using it as an electron donor: 4Fe2+ + HCO3 + 10H2O → 4Fe(OH)3 + (CH2O) + 7H+, which produces Fe(III) oxides and biomass carbon. This anoxygenic pathway might dominate phototrophic Fe(II) oxidation during early incubation (3–5 d), when anoxia restricted O2 availability. Both oxygenic and anoxygenic processes formed Fe(III) oxides, sequestering DOC and effectively reducing CO2 and CH4 emissions.
The interaction between oxygenic and anoxygenic phototrophs shaped Fe(II) oxidation dynamics in the soil during light incubation. In the early stage (1–5 d), anoxygenic phototrophs likely prevailed in N2-purged vials, oxidising Fe(II) anaerobically due to strict anoxia and producing Fe(III) oxides without O2 interference [23,25,26]. With increasing light intensity, oxygenic phototrophs contributed more O2, facilitating chemical Fe(II) oxidation and forming microoxic zones, as the chlorophyll a concentration peaked (L3: 6.46 mg g−1). This increase in photosynthetic O2 production could inhibit O2-sensitive anoxygenic phototrophs [47], possibly resulting in the slight decrease in chlorophyll a concentration after 12 d of light incubation, yet both phototrophs synergised to enhance Fe(III) oxide formation. Competition for Fe(II) likely occurred, as oxygenic oxidation consumed Fe(II) needed by anoxygenic phototrophs, particularly at higher light intensities. Temporally, anoxygenic oxidation dominated early and oxygenic contribution increased later, reflecting a balance driven by light and O2 gradients [25,26]. Molecular analyses based on 16S rRNA and functional gene (e.g., psbA, psbB) sequencing could help to quantify these dynamics in future studies.
The light-induced formation of Fe(III) oxides in the soil may lead to the immobilisation of heavy metals like Cd [36] and As [37]. This suggests that light management strategies, such as shallow flooding, could reduce metal bioavailability in paddy fields. Field-scale validation is needed, as canopy shading and water turbidity may limit light penetration.

4.2. Iron Redox Cycling Shapes Soil Organic Carbon Dynamics Under Increased Light Intensity

Iron redox process profoundly influenced organic carbon transformation in the paddy soil. Under dark conditions, the Fe(III) reduction released iron-bound DOC, but dissimilatory iron-reducing microorganisms simultaneously oxidised organic carbon as an electron donor, ultimately reducing the DOC concentration by 4.21 µmol g−1. Organic carbon mineralisation (CO2, CH4, DIC) reached 30.79 ± 0.52 µmol g−1, exceeding the DOC loss (ΔDOC), which confirms that Fe(III) reduction fuelled carbon emissions [12,15]. This link is underscored by a strong positive correlation between Fe(II) concentration and organic carbon mineralisation. Light irradiation increased microbial biomass carbon [18] via phototrophic growth (indicated by chlorophyll a production), but this biomass carbon remained insoluble, contributing minimally to DOC, unless cells lysed [48].
Light irradiation inhibited organic carbon mineralisation, reducing CO2 and CH4 emissions by 23.1–91.2% and 93.3–97.7%, respectively, compared to dark conditions. This stemmed from phototrophic activity consuming DIC via photosynthesis, forming microbial biomass carbon [18]. Higher light intensities amplified DOC decreases driven by Fe(II) oxidation. Newly formed Fe(III) oxides, with a lower solubility (Ksp Fe(OH)3 = 3.0 × 10−39, Ksp Fe(OH)2 = 8.0 × 10⁻¹⁶ [49]), adsorbed and co-precipitated DOC, amplifying the DOC loss. The positive correlation between Fe(II) oxidation and DOC decrease was strengthened at higher light intensities, indicating robust carbon sequestration.
Our results suggest that along with increased carbon storage in biomass, physical protection by Fe(III) oxides is also a key factor driving the light inhibition of organic carbon mineralisation. Agricultural practices like shallow flooding or reducing plant density could enhance light penetration, promoting Fe(III) oxide formation and carbon storage as reducing CO2 and CH4 emissions. Our laboratory setting ensured controlled conditions but differed from field environments. It has been found that high light intensities (e.g., L3) slightly inhibit phototrophs, as observed in phytoplankton [29], potentially limiting Fe(II) oxidation and carbon sequestration as well. Future research should validate laboratory findings in field experiments, exploring light management strategies and quantifying the relative contributions of anoxygenic versus oxygenic phototrophs using genomic tools. Integrating these insights with rice agronomy could balance productivity and sustainability.

5. Conclusions

Light irradiation stimulated phototrophic microorganisms in anoxic paddy soil in terms of chlorophyll a production, with anoxygenic phototrophs oxidising Fe(II) anaerobically and oxygenic phototrophs facilitating chemical Fe(II) oxidation. Higher light intensities accelerated the onset of Fe(II) oxidation and consequently enhanced the formation of Fe(III) oxides, which sequestered dissolved organic carbon and suppressed CO2 and CH4 emissions by 23.1–91.2% and 93.3–97.7%, respectively. These findings suggest practical management strategies for sustainable rice production. Shallow flooding improves light penetration to the soil surface, and reducing plant density or widening row spacing can further increase light exposure, particularly in densely planted fields. Such practices could promote carbon sequestration, reduce greenhouse gas emissions, and decrease heavy metal bioavailability through Fe(III) oxide formation. Field studies are required to validate these strategies under diverse soil and climate conditions, accounting for factors like canopy shading and water turbidity. Future research should employ genomic tools to quantify the contributions of anoxygenic versus oxygenic phototrophs, refining light-based management practices.

Author Contributions

Conceptualisation, L.S.; methodology, X.W.; validation, M.J. and L.S.; formal analysis, M.L. and Y.H.; investigation, M.J. and M.L.; resources, X.W. and X.C.; data curation, M.J. and M.L.; writing—original draft preparation, M.J.; writing—review and editing, L.S., Y.H. and X.C.; visualisation, Y.H. and X.C.; supervision, X.W.; project administration, L.S. and X.W.; funding acquisition, L.S. All authors have read and agreed to the published version of the manuscript.

Funding

This research was funded by the National Natural Science Foundation of China, grant number U1904121.

Institutional Review Board Statement

This article does not contain any studies with human participants or animals performed by any of the authors.

Data Availability Statement

The original contributions presented in this study are included in the article. Further inquiries can be directed to the corresponding author.

Conflicts of Interest

The authors declare no conflicts of interest. The funding sources provided financial support for the study, and had no involvement in study design, data collection, analysis, interpretation, manuscript writing, or the decision to submit the report for publication.

References

  1. Liu, X.; Lu, X.; Yu, R.; Sun, H.; Xue, H.; Qi, Z.; Cao, Z.; Zhang, Z.; Liu, T. Greenhouse gases emissions from riparian wetlands: An example from the Inner Mongolia grassland region in China. Biogeosciences 2021, 18, 4855–4872. [Google Scholar] [CrossRef]
  2. Yu, Z.; Loisel, J.; Brosseau, D.P.; Beilman, D.W.; Hunt, S.J. Global peatland dynamics since the Last Glacial Maximum. Geophys. Res. Lett. 2010, 37, 1–5. [Google Scholar] [CrossRef]
  3. Lalonde, K.; Mucci, A.; Ouellet, A.; Gélinas, Y. Preservation of organic matter in sediments promoted by iron. Nature 2012, 483, 198–200. [Google Scholar] [CrossRef] [PubMed]
  4. Lovley, D.R.; Holmes, D.E.; Nevin, K.P. Dissimilatory Fe(III) and Mn(IV) reduction. Adv. Microb. Physiol. 2004, 49, 219–286. [Google Scholar] [CrossRef]
  5. Jaisi, D.P.; Hailiang, D.; Liu, C. Kinetic analysis of microbial reduction of Fe(III) in Nontronite. Environ. Sci. Technol. 2007, 41, 2437–2444. [Google Scholar] [CrossRef]
  6. Loughlin, E.J. Microbial reduction of geogenic and synthetic goethite and hematite. Minerals 2024, 14, 1086. [Google Scholar] [CrossRef]
  7. Kostka, J.E.; Wu, J.; Nealson, K.H.; Stucki, J.W. The impact of structural Fe(III) reduction by bacteria on the surface chemistry of smectite clay minerals. Geochim. Cosmochim. Acta 1999, 63, 3705–3713. [Google Scholar] [CrossRef]
  8. Byrne, J.M.; Klueglein, N.; Pearce, C.; Rosso, K.M.; Appel, E.; Kappler, A. Redox cycling of Fe(II) and Fe(III) in magnetite by Fe-metabolizing bacteria. Science 2015, 347, 1473–1476. [Google Scholar] [CrossRef]
  9. Kamura, T.; Takai, Y.; Ishikawa, K. Microbial reduction mechanism of ferric iron in paddy soils (Part I). Soil Sci. Plant Nutr. 2012, 9, 5–9. [Google Scholar] [CrossRef]
  10. Lovley, D.R.; Phillips, E.J. Organic matter mineralization with reduction of ferric iron in anaerobic sediments. Appl. Environ. Microbiol. 1986, 51, 683–689. [Google Scholar] [CrossRef]
  11. He, J.; Qu, D. Dissimilatory Fe(III) reduction characteristics of paddy soil extract cultures treated with glucose or fatty acids. J. Environ. Sci. 2008, 20, 1103–1108. [Google Scholar] [CrossRef] [PubMed]
  12. Buettner, S.W.; Kramer, M.G.; Chadwick, O.A.; Thompson, A. Mobilization of colloidal carbon during iron reduction in basaltic soils. Geoderma 2014, 221–222, 139–145. [Google Scholar] [CrossRef]
  13. Pan, W.; Kan, J.; Inamdar, S.; Chen, C.; Sparks, D. Dissimilatory microbial iron reduction release DOC (dissolved organic carbon) from carbon-ferrihydrite association. Soil Biol. Biochem. 2016, 103, 232–240. [Google Scholar] [CrossRef]
  14. Kleber, M.; Bourg, I.C.; Coward, E.K.; Hansel, C.M.; Myneni, S.C.B.; Nunan, N. Dynamic interactions at the mineral–organic matter interface. Nat. Rev. Earth Environ. 2021, 2, 402–421. [Google Scholar] [CrossRef]
  15. Chen, C.; Hall, S.J.; Coward, E.; Thompson, A. Iron-mediated organic matter decomposition in humid soils can counteract protection. Nat. Commun. 2020, 11, 2255. [Google Scholar] [CrossRef]
  16. Luo, M.; Zhu, W.; Huang, J.; Liu, Y.; Duan, X.; Wu, J.; Tong, C. Anaerobic organic carbon mineralization in tidal wetlands along a low-level salinity gradient of a subtropical estuary: Rates, pathways, and controls. Geoderma 2019, 337, 1245–1257. [Google Scholar] [CrossRef]
  17. Widdel, F.; Schnell, S.; Heising, S.; Ehrenreich, A.; Assmus, B.; Schink, B. Ferrous iron oxidation by anoxygenic phototrophic bacteria. Nature 1993, 362, 834–836. [Google Scholar] [CrossRef]
  18. Wang, X.; Sun, L.; Chen, Z.; Guo, D.; Fan, H.; Xu, X.; Shi, Z.; Chen, X. Light inhibition of carbon mineralization associated with iron redox processes in calcareous paddy soil. J. Soils Sediments 2020, 20, 3171–3180. [Google Scholar] [CrossRef]
  19. Davín, A.A.; Woodcroft, B.J.; Soo, R.M.; Morel, B.; Murali, R.; Schrempf, D.; Clark, J.W.; álvarez-Carretero, S.; Boussau, B.; Moody, E.R.R.; et al. A geological timescale for bacterial evolution and oxygen adaptation. Science 2025, 388, eadp1853. [Google Scholar] [CrossRef]
  20. Soo, R.M.; Hemp, J.; Parks, D.H.; Fischer, W.W.; Hugenholtz, P. On the origins of oxygenic photosynthesis and aerobic respiration in Cyanobacteria. Science 2017, 355, 1436. [Google Scholar] [CrossRef]
  21. Thompson, K.J.; Kenward, P.A.; Bauer, K.W.; Warchola, T.; Gauger, T.; Martinez, R.; Simister, R.L.; Michiels, C.C.; Lliros, M.; Reinhard, C.T.; et al. Photoferrotrophy, deposition of banded iron formations, and methane production in Archean oceans. Sci. Adv. 2019, 5, eaav2869. [Google Scholar] [CrossRef] [PubMed]
  22. Nikeleit, V.; Maisch, M.; Byrne, J.M.; Harwood, C.; Kappler, A.; Bryce, C. Phototrophic Fe(II) oxidation by Rhodopseudomonas palustris TIE-1 in organic and Fe(II)-rich conditions. Environ. Microbiol. 2024, 26, e16608. [Google Scholar] [CrossRef] [PubMed]
  23. Hegler, F.; Posth, N.R.; Jiang, J.; Kappler, A. Physiology of phototrophic iron(II)-oxidizing bacteria: Implications for modern and ancient environments. FEMS Microbiol. Ecol. 2008, 66, 250–260. [Google Scholar] [CrossRef] [PubMed]
  24. Emerson, D.; Fleming, E.J.; McBeth, J.M. Iron-oxidizing bacteria: An environmental and genomic perspective. Annu. Rev. Microbiol. 2010, 64, 561–583. [Google Scholar] [CrossRef]
  25. Kushkevych, I.; Procházka, V.; Vítězová, M.; Dordević, D.; Abd El-Salam, M.; Rittmann, S.K.M.R. Anoxygenic photosynthesis with emphasis on green sulfur bacteria and a perspective for hydrogen sulfide detoxification of anoxic environments. Front. Microbiol. 2024, 15, 1417714. [Google Scholar] [CrossRef]
  26. Ozaki, K.; Thompson, K.J.; Simister, R.L.; Crowe, S.A.; Reinhard, C.T. Anoxygenic photosynthesis and the delayed oxygenation of Earth’s atmosphere. Nat. Commun. 2019, 10, 3026. [Google Scholar] [CrossRef]
  27. Sun, Y.; Casella, S.; Fang, Y.; Huang, F.; Faulkner, M.; Barrett, S.; Liu, L.N. Light modulates the biosynthesis and organization of cyanobacterial carbon fixation machinery through photosynthetic electron flow. Plant Physiol. 2016, 171, 530–541. [Google Scholar] [CrossRef]
  28. Bengtsson, M.M.; Wagner, K.; Schwab, C.; Urich, T.; Battin, T.J. Light availability impacts structure and function of phototrophic stream biofilms across domains and trophic levels. Mol. Ecol. 2018, 27, 2913–2925. [Google Scholar] [CrossRef]
  29. Jodłowska, S.; Sliwińska, S. Effects of light intensity and temperature on the photosynthetic irradiance response curves and chlorophyll fluorescence in three picocyanobacterial strains of Synechococcus. Photosynthetica 2014, 52, 223–232. [Google Scholar] [CrossRef]
  30. Maltsev, Y.; Maltseva, K.; Kulikovskiy, M.; Maltseva, S. Influence of Light Conditions on Microalgae Growth and Content of Lipids, Carotenoids, and Fatty Acid Composition. Biology 2021, 10, 1060. [Google Scholar] [CrossRef]
  31. Nikeleit, V.; Roth, L.; Maisch, M.; Kappler, A.; Bryce, C. Phototrophic Fe(II) oxidation benefits from light/dark cycles. Environ. Microbiol. Rep. 2024, 16, e13239. [Google Scholar] [CrossRef] [PubMed]
  32. Melton, E.D.; Schmidt, C.; Kappler, A. Microbial iron(II) oxidation in littoral freshwater lake sediment: The potential for competition between phototrophic vs. nitrate-reducing iron(II)-oxidizers. Front. Microbiol. 2012, 3, 197. [Google Scholar] [CrossRef] [PubMed]
  33. Hemingway, J.; Rothman, D.; Grant, K.; Rosengard, S.; Eglinton, T.; Derry, L.; Galy, V. Mineral protection regulates the long-term global preservation of natural organic carbon. Nature 2019, 570, 228–231. [Google Scholar] [CrossRef] [PubMed]
  34. Jia, N.; Li, L.; Guo, H.; Xie, M. Important role of Fe oxides in global soil carbon stabilization and stocks. Nat. Commun. 2024, 15, 10318. [Google Scholar] [CrossRef]
  35. Eusterhues, K.; Rennert, T.; Knicker, H.; Kögel-Knabner, I.; Totsche, K.U.; Schwertmann, U. Fractionation of organic matter due to reaction with ferrihydrite: Coprecipitation versus adsorption. Environ. Sci. Technol. 2011, 45, 527–533. [Google Scholar] [CrossRef]
  36. Muehe, E.M.; Obst, M.; Hitchcock, A.; Tyliszczak, T.; Behrens, S.; Schröder, C.; Byrne, J.M.; Michel, F.M.; Krämer, U.; Kappler, A. Fate of Cd during microbial Fe(III) mineral reduction by a novel and Cd-tolerant geobacter species. Environ. Sci. Technol. 2013, 47, 14099–14109. [Google Scholar] [CrossRef]
  37. Glodowska, M.; Stopelli, E.; Schneider, M.; Lightfoot, A.; Rathi, B.; Straub, D.; Patzner, M.; Duyen, V.T.; Berg, M.; Kleindienst, S.; et al. Role of in situ natural organic matter in mobilizing As during microbial reduction of FeIII-Mineral-Bearing Aquifer Sediments from Hanoi (Vietnam). Environ. Sci. Technol. 2020, 54, 4149–4159. [Google Scholar] [CrossRef]
  38. Qiu, G.; Koedooder, C.; Qiu, B.; Shaked, Y.; Keren, N. Iron transport in cyanobacteria—From molecules to communities. Trends Microbiol. 2022, 30, 309. [Google Scholar] [CrossRef]
  39. Molot, L.A.; Li, G.; Findlay, D.L.; Watson, S.B. Iron-mediated suppression of bloom-forming cyanobacteria by oxine in a eutrophic lake. Freshw. Biol. 2010, 55, 1102–1117. [Google Scholar] [CrossRef]
  40. Tania, L.; Grace, M.W.; Elizabeth, D.S. Iron availability allows sustained cyanobacterial growth: A dual-lake case study. Inland Waters 2021, 11, 417–429. [Google Scholar] [CrossRef]
  41. Lu, R. Analytical Method of Soil Agricultural Chemistry; China Agricultural Science and Technology Press: Beijing, China, 2000; pp. 13, 47–55, 65, 107–108. (In Chinese) [Google Scholar]
  42. Lichtenthaler, H.K. Chlorophylls and carotenoids: Pigments of photosynthetic biomembranes. Methods Enzymol. 1987, 148, 350–382. [Google Scholar] [CrossRef]
  43. Saviozzi, A.; Vanni, G.; Cardelli, R. Carbon mineralization kinetics in soils under urban environment. Appl. Soil Ecol. 2014, 73, 64–69. [Google Scholar] [CrossRef]
  44. Chen, Z.; Wang, X.; Sun, L.; Dong, L.; Guo, D.; Shi, Z. Nitrate-dependent and photosynthetic Fe(II) oxidation processes in a calcareous paddy soil. Acta Pedol. Sin. 2023, 60, 127–137. (In Chinese) [Google Scholar] [CrossRef]
  45. Hamilton, T.L.; Bennett, A.C.; Murugapiran, S.K.; Havig, J.R. Anoxygenic phototrophs span geochemical gradients and diverse morphologies in terrestrial geothermal springs. Msystems 2019, 4, e00498-19. [Google Scholar] [CrossRef]
  46. Melton, E.D.; Swanner, E.D.; Behrens, S.; Schmidt, C.; Kappler, A. The interplay of microbially mediated and abiotic reactions in the biogeochemical Fe cycle. Nat. Rev. Microbiol. 2014, 12, 797–808. [Google Scholar] [CrossRef]
  47. Hamilton, T.L. The trouble with oxygen: The ecophysiology of extant phototrophs and implications for the evolution of oxygenic photosynthesis. Free Radic. Biol. Med. 2019, 140, 233–249. [Google Scholar] [CrossRef]
  48. Joergensen, R.G. The fumigation-extraction method to estimate soil microbial biomass: Calibration of the kEC value. Soil Biol. Biochem. 1996, 28, 25–31. [Google Scholar] [CrossRef]
  49. Xia, Y. Practical Manual for Laboratory Technicians; Chemical Industry Press: Beijing, China, 2015; pp. 208–209. (In Chinese) [Google Scholar]
Figure 1. Dynamics of Fe(II) concentration (a) and Fe(II) oxidation (b) in paddy soil during dark and light incubation. Fe(II) was extracted using 0.5 M HCl, and Fe(II) oxidation was calculated as the difference between peak Fe(II) concentration over the entire incubation period and the Fe(II) concentration at the time of sampling. Data are expressed as mean ± SD (n = 3). L1, L2, and L3 represent the light treatments with low to high light intensity.
Agronomy 15 01137 g001
Figure 2. Dynamics of organic carbon mineralisation (a), CH4 emission (b), CO2 emission (c), and dissolved inorganic carbon (DIC) produced (d) in paddy soil during dark and light incubation. Data are expressed as mean ± SD (n = 3). L1, L2, and L3 represent the light treatments with low to high light intensity.
Agronomy 15 01137 g002
Figure 3. Dynamics of dissolved organic carbon (DOC) concentration (a) and its decrease (ΔDOC) (b) in paddy soil during dark and light incubation. Data are expressed as mean ± SD (n = 3). L1, L2, and L3 represent the light treatments with low to high light intensity.
Agronomy 15 01137 g003
Figure 4. Dynamics of chlorophyll a concentration (a) and its relation to Fe(II) oxidation (b) in paddy soil during dark and light incubation. Data are expressed as mean ± SD (n = 3). L1, L2, and L3 represent the light treatments with low to high light intensity.
Agronomy 15 01137 g004
Figure 5. Relationships between Fe(II) concentration and carbon mineralisation (a), and between Fe(II) oxidation and decrease in dissolved organic carbon concentration (ΔDOC) (b), at varying light intensities. Data are expressed as mean ± SD (n = 3). L1, L2, and L3 represent the light treatments with low to high light intensity.
Agronomy 15 01137 g005
Table 1. Relationship between Fe(II) oxidation and incubation time in paddy soil under varying light intensities based on the logistic model (Equation (1)).
TreatmentFinal Fe(II) Oxidation
(mg g−1)
Oxidation Capacity,
a (mg g−1)
Oxidation Rate Constant, k
(d−1)
Correlation Coefficient, R2Probability of Significance, pNumber of Samples Fitted, n
L13.12 ± 0.10 aA3.10 ± 0.17 aA0.22 ± 0.04 b0.97<0.0019
L23.50 ± 0.23 aA3.35 ± 0.23 aA0.20 ± 0.04 b0.95<0.0019
L33.53 ± 0.35 aA3.29 ± 0.29 aA0.87 ± 0.35 a0.74<0.00110
Note: L1, L2, and L3 denote light treatments with increasing light intensity. Final Fe(II) oxidation is presented as the difference in Fe(II) concentration between the peak value during incubation and the final value at 40 d. Lowercase letters within a column indicate significant differences between treatments (p < 0.05). Uppercase letters within a row indicate significant differences between measured and modelled Fe(II) oxidation capacities (p < 0.05).
Table 2. Relationship between dissolved inorganic carbon (DIC) concentration and incubation time in soil samples under varying light intensities during the DIC decrease stage based on the first-order kinetic model (Equation (2)).
TreatmentDecrease Rate Constant, k, d−1Correlation Coefficient, R2Probability of Significance, pNumber of Samples Fitted, n
L10.14 ± 0.02 b0.99<0.0018
L20.18 ± 0.03 b0.98<0.0018
L30.26 ± 0.05 a0.94<0.00110
Note: L1, L2, and L3 represent the light treatments with low to high light intensity. Lowercase letters within a column denote significant differences between treatments (p < 0.05).
Table 3. Relationship between dissolved organic carbon (DOC) concentration and incubation time in soil samples under varying light intensities based on the first-order kinetic model (Equation (2)).
TreatmentInitial DOC Concentration, C0 (µmol g−1)Decrease Rate Constant, k, d−1Correlation Coefficient, R2Probability of Significance, pNumber of Samples Fitted, n
Dark12.30 ± 0.35 a0.012 ± 0.002 d0.84<0.00111
L112.29 ± 0.44 a0.024 ± 0.003 c0.91<0.00111
L212.35 ± 0.38 a0.034 ± 0.003 b0.96<0.00111
L311.61 ± 0.86 a0.042 ± 0.007 a0.83<0.00111
Note: L1, L2, and L3 represent the light treatments with low to high light intensity. Lowercase letters within a column denote significant differences between treatments (p < 0.05).
Disclaimer/Publisher’s Note: The statements, opinions and data contained in all publications are solely those of the individual author(s) and contributor(s) and not of MDPI and/or the editor(s). MDPI and/or the editor(s) disclaim responsibility for any injury to people or property resulting from any ideas, methods, instructions or products referred to in the content.

