Article

Drift Suppression by Adjusting Flight Parameters for Manned Helicopters in Forested Regions

1
College of Intelligent Manufacturing, Anhui Science and Technology University, Chuzhou 233100, China
2
College of Mechanical and Electronic Engineering, Nanjing Forestry University, Nanjing 210037, China
3
Peking University Institute of Advanced Agricultural Sciences, Weifang 262113, China
4
School of Engineering, Anhui Agricultural University, Hefei 233031, China
5
Tianjin Marine Instrument Research Institute Jiujiang Branch, Jiujiang 332007, China
*
Author to whom correspondence should be addressed.
Agronomy 2025, 15(5), 1129; https://doi.org/10.3390/agronomy15051129
Submission received: 18 March 2025 / Revised: 28 April 2025 / Accepted: 2 May 2025 / Published: 4 May 2025
(This article belongs to the Special Issue Advances in Precision Pesticide Spraying Technology and Equipment)

Abstract

:
Under complex climatic conditions, variable application parameters and a two-dimensional application route, it is difficult to ensure the accurate deposition of pesticide droplets during helicopter aerial applications. This is especially true when the deposition area is forested. The Agricultural Dispersal (AGDISP) model was used with an optimization procedure to study the influence of flight height, flight speed, and ambient wind speed. Optimization techniques were used to obtain the best fit between the simulation results. Three objectives were used to propose a new application strategy, namely (i) the average deposition in the forest area; (ii) the uniformity of droplet deposition; and (iii) the deposition at a distance of 50 m downwind outside the forest area. A new application strategy was proposed, where the forest area was divided into two subareas, namely the safe area (the area away from forest boundaries) and the edge area (the area close to forest boundaries). Flight height and speed were adjusted to ensure the desired average deposition and uniformity in the safety area and the desired deposition at 50 m downwind in the edge area. Six helicopter spraying experiments at different wind speeds were conducted at Longtan, Nanjing, China. The deposition effects of the new strategy were compared with those of the common manual empirical method (operating at the same height and speed over the whole forest). It was found that at wind speeds of 2 m/s, 1 m/s, and 2.5 m/s, the average deposition in the safe area was improved by 4.82%, 0.91%, and 8.24%, respectively, and that in the edge area, it was improved by 7.04%, 0.90%, and 0.77%, respectively. Conversely, the deposition at 50 m downwind was reduced by 25.00%, 16.58% and 22.90%, respectively. These experimental results demonstrated that the new strategy can effectively reduce the droplet drift. We achieved the synergistic optimization goal of moderate (and uniform) deposition in the forest area with low deposition outside the forest area. This study can provide important technical references for precision forestry.

1. Introduction

Manned helicopters used for forestry aerial applications have the advantages of a faster operation speed, a larger pesticide load, a single operation area of more than 1000 acres, a lower risk of poisoning to applicators, no need for runway, etc., which make them especially suitable for large-area sudden forestry pest control [1,2,3,4]. Since the distance from the tree canopy during helicopter operation can be as high as 10 m, after the pesticide leaves the nozzle, a phenomenon of pesticides drifting out of the target forest area occurs due to the combined effects of ambient wind, downwash airflow, etc., which pose a high risk of environmental contamination and reduce the utilization efficiency of pesticides [5,6]. Therefore, it is important to study the technology of helicopter precision applications.
Many scholars have carried out research to make aerial applications more accurate. Teske et al. [7] carried out an experimental study on spraying by fixed-wing aircraft with results illustrating >20% of the pesticide droplets in the non-target area. This illustrates the seriousness of pesticide drift. Wang et al. [8] studied the performance of three typical commercial UAVs (helicopter, six-rotor and eight-rotor) in vineyards and found that pesticide drift was the most serious when using an unmanned helicopter. Yao et al. [9] studied the droplet deposition and pest control effects of manned helicopter application on pine trees. Hewitt [10] and Valcore [11] studied the development of aerial adjuvant technology, with the expectation of reducing drift by altering the physical properties of the pesticide. Lan et al. [12] studied the physicochemical properties of different aerial adjuvants and the deposition characteristics of aerial adjuvants on corn leaves, and the results showed that aerial adjuvants can improve the deposition of pesticides on the surface of crops and reduce the drift phenomenon. There are also many scholars who are keen to carry out research on application route planning. Torres et al. [13] studied the full-coverage path planning problem of UAVs on three-dimensional terrain. Nanavati et al. [14] proposed a generalized data-driven optimal path planning framework which makes UAVs apply pesticides more uniformly by optimizing the operation width. Xu et al. [15] further considered the constraints of the pesticide load capacity of UAVs and investigated the optimization of task distribution and operation path sequencing during multi-UAV spraying operations. Fang et al. [16] investigated a full-coverage operation path planning scheme that included the position planning of take-off/landing points for manned pesticide application helicopters. All these studies have promoted the advancement of aerial precision pesticide application technology.
It is found that the research on the technology of precision aerial applications mainly focuses on droplet deposition and route planning. In the case of droplet deposition patterns, the relationship between the droplet deposition and uniformity is usually studied for different heights, speeds, nozzle models, application rates, and so on. Meanwhile, route planning focuses on how to efficiently cover the agricultural or forested areas to be operated on. These approaches to route planning are not significantly different from the techniques used in path planning for ground-based operational machinery [17,18], which can be traced back to the vehicle route planning problem in management science [19,20]. However, for ground-based machinery, the drift is usually small. There is a huge difference from aerial application operations that operate at high speeds. When aerial application is conducted, the pesticide droplets will be affected by the location of the spraying route, the air velocity, the flight height, the ambient wind speed, and other factors, even if the aircraft operates in accordance with the existing theoretical optimal geometry of the full-coverage application route. So, it is more meaningful to consider the flight height and speed to achieve the expected droplet deposition when a two-dimensional spraying route is adopted. Fortunately, the deposition pattern of large aircraft applications has been extensively studied, and the well-known AGDISP model was developed for use in deposition calculations for forestry and other aerial spraying operations [21,22,23,24,25]. Hoffmann and Kirk [26] used an Air Tractor 402B aircraft (Air Tractor Inc., Olney, TX, USA) to analyze and test the drift characteristics of two different aerial spray nozzles used to spray pesticides over crops and concrete runways and compared the measured results with the AGDISP model, validating the applicability of the AGDISP model. This paper attempts to suppress droplet drift from the perspective of route planning, and these studies above lay the foundation for realizing this idea.
We employ the AGDISP model to predict the average droplet deposition and application uniformity inside the forest area and deposition outside the forest area for manned helicopters under a variety of different ambient wind speeds, flight heights, and flight speeds. Machine learning algorithms are used for data modeling and to explore the interrelation of different objectives. Finally, we construct parameter-matching diagrams under diverse ambient wind speeds to provide guidance for successful helicopter aerial application.

2. Materials and Methods

In this section, we first introduce the method of collecting data with the AGDISP and then present the machine learning algorithm for predicting data. Next, we introduce the new pesticide application strategy. Finally, the on-site spraying experiment method is introduced.

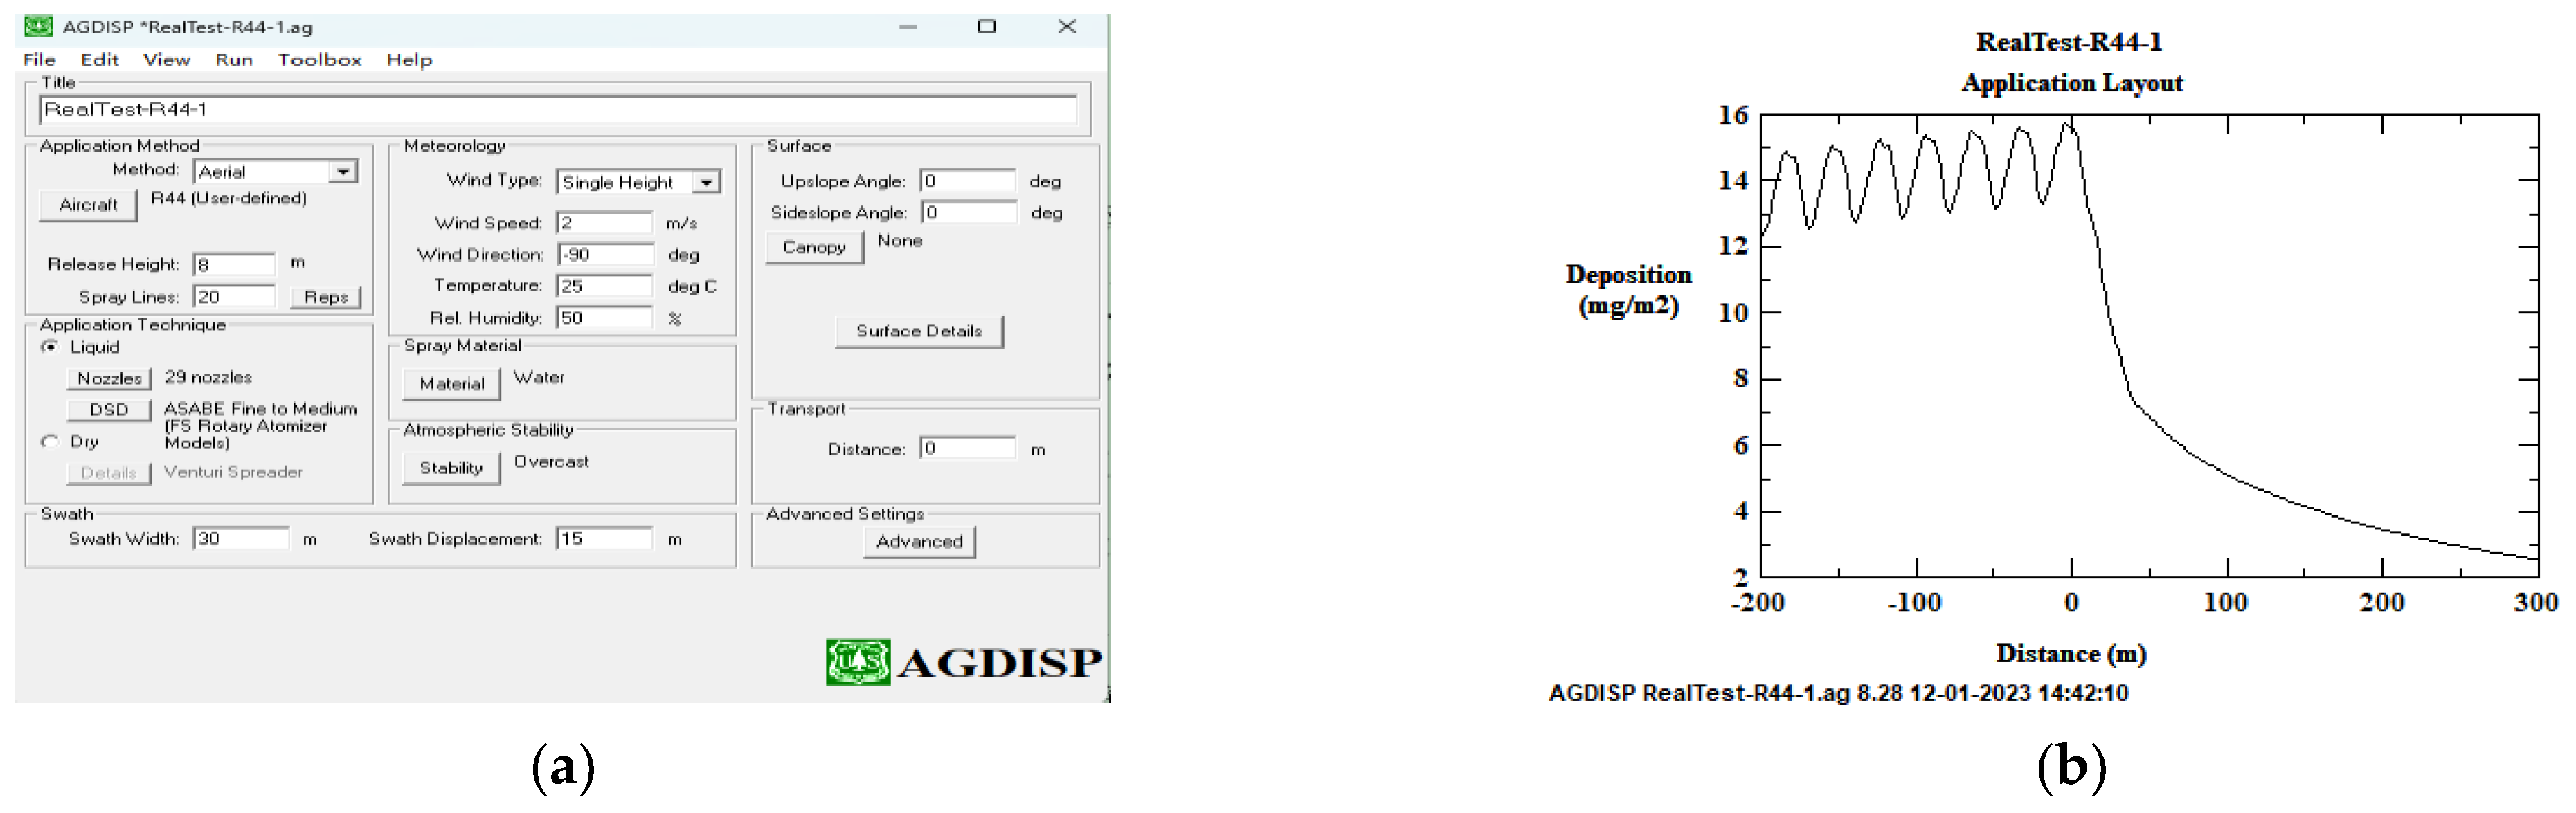
2.1. Acquisition of Droplet Deposition Data by AGDISP

Flight speed, flight height, and ambient wind speed significantly affect the deposition effect of helicopter applications [9]. Droplet ejections from a nozzle are subject to crosswinds, helicopter downwash, and airflow in multiple wind fields. Deposition is difficult to establish by theoretical derivation. Therefore, the AGDISP is used to estimate drop deposition under the influence of ambient wind.
We simulate the application scenario of a helicopter spraying pesticide, as shown in Figure 1. The helicopter had a full load of 200 kg of pesticides and a speed range of 90–162 km/h. The rotor length was 10.1 m. The self-designed rotary nozzles were mounted under the 6.7 m truss in a uniform distribution [27]. These nozzles produced droplets with a size distribution similar to the ASABE fine-to-medium classification. The number of nozzles along the boom was 29. The pesticide was a mixture of 3% additives and 97% water, the application rate was set at 12 L/ha, and the density of the liquid was 1 g/cm3. The application area was a flat area. The helicopter applied the pesticide from the edge of the application area (Swath displacement = 15 m) for the first route, and then turned around into the next route after every other time it covered the width (Spraying width = 30 m), and the cycle was repeated until the entire application area was covered.
The flight speed, height, and wind speed were selected as the three variables, and the levels of the test factors provided in Table 1 were imported into the AGDISP (developed by the National Aeronautics and Space Administration, the USDA Forest Service, and the U. S. Army, Version 8.28). Example AGDISP output figures demonstrate the pesticide droplet deposition at each location, as shown in Figure 2. The AGDISP provides specific simulation outputs (it does not directly provide mapped data). To analyze the pesticide droplet deposition, further image processing techniques were employed. The flowchart for data acquisition is presented in Figure 2. The captured image was first grayed out, then median-filtered, followed by cropping the image to retain only the numerical regions containing the deposition curves, and finally, the specific values of the deposition quantities were obtained by analogy based on the ranges of the horizontal and vertical coordinates as well as the positions of the pixel points in the horizontal and vertical coordinates. Using Python (OpenCV2), we obtained deposition measurements at multiple locations.
Due to limitations imposed by the pixel size of the image, the acquired data did not have completely uniform horizontal coordinate intervals. Hence, statistical methods were applied to further analyze the data. To evaluate the application’s effectiveness, three objectives are defined: the average deposition of pesticide droplets in the forest area, the coefficient of variation of deposition in the forest area, and deposition at different downwind locations.
Given potential variations in the cross-coordinate intervals of the acquired data, the calculation of the average deposition is redefined using the integral method, as expressed in Equation (1). The coefficient of variation is computed according to Equation (2), and the calculation of the deposition at different downwind locations is illustrated in Equation (3).
(1) Objective 1: average deposition within forested areas (AD), mg/m2.
A D = 1 0 x min x min 0 f ( x ) d x 1 x min i = 1 n 1 f ( ξ i ) + f ( ξ i + 1 ) 2 ( ξ i + 1 ξ i )
where ξ i denotes the location of the sampling point, f ( ξ i ) denotes the amount of deposition at the sampling point, f ( x ) denotes the deposition curve of the droplets, x min denotes the location of the left boundary of the forest area, and the superscript 0 of the integral symbol denotes the location of the right boundary of the forest area. n denotes the number of sampling points.
(2) Objective 2: coefficient of variation in sedimentation within forested areas (CV).
C V = 1 n 1 i = 1 n f ( ξ i ) A D 2 A D
(3) Objective 3: the deposition at different downwind locations (Dx), mg/m2.
D x = f ( x )
where x denotes the downwind location, e.g., 25 m, 50 m, etc., denoted as D25, D50, etc., respectively.

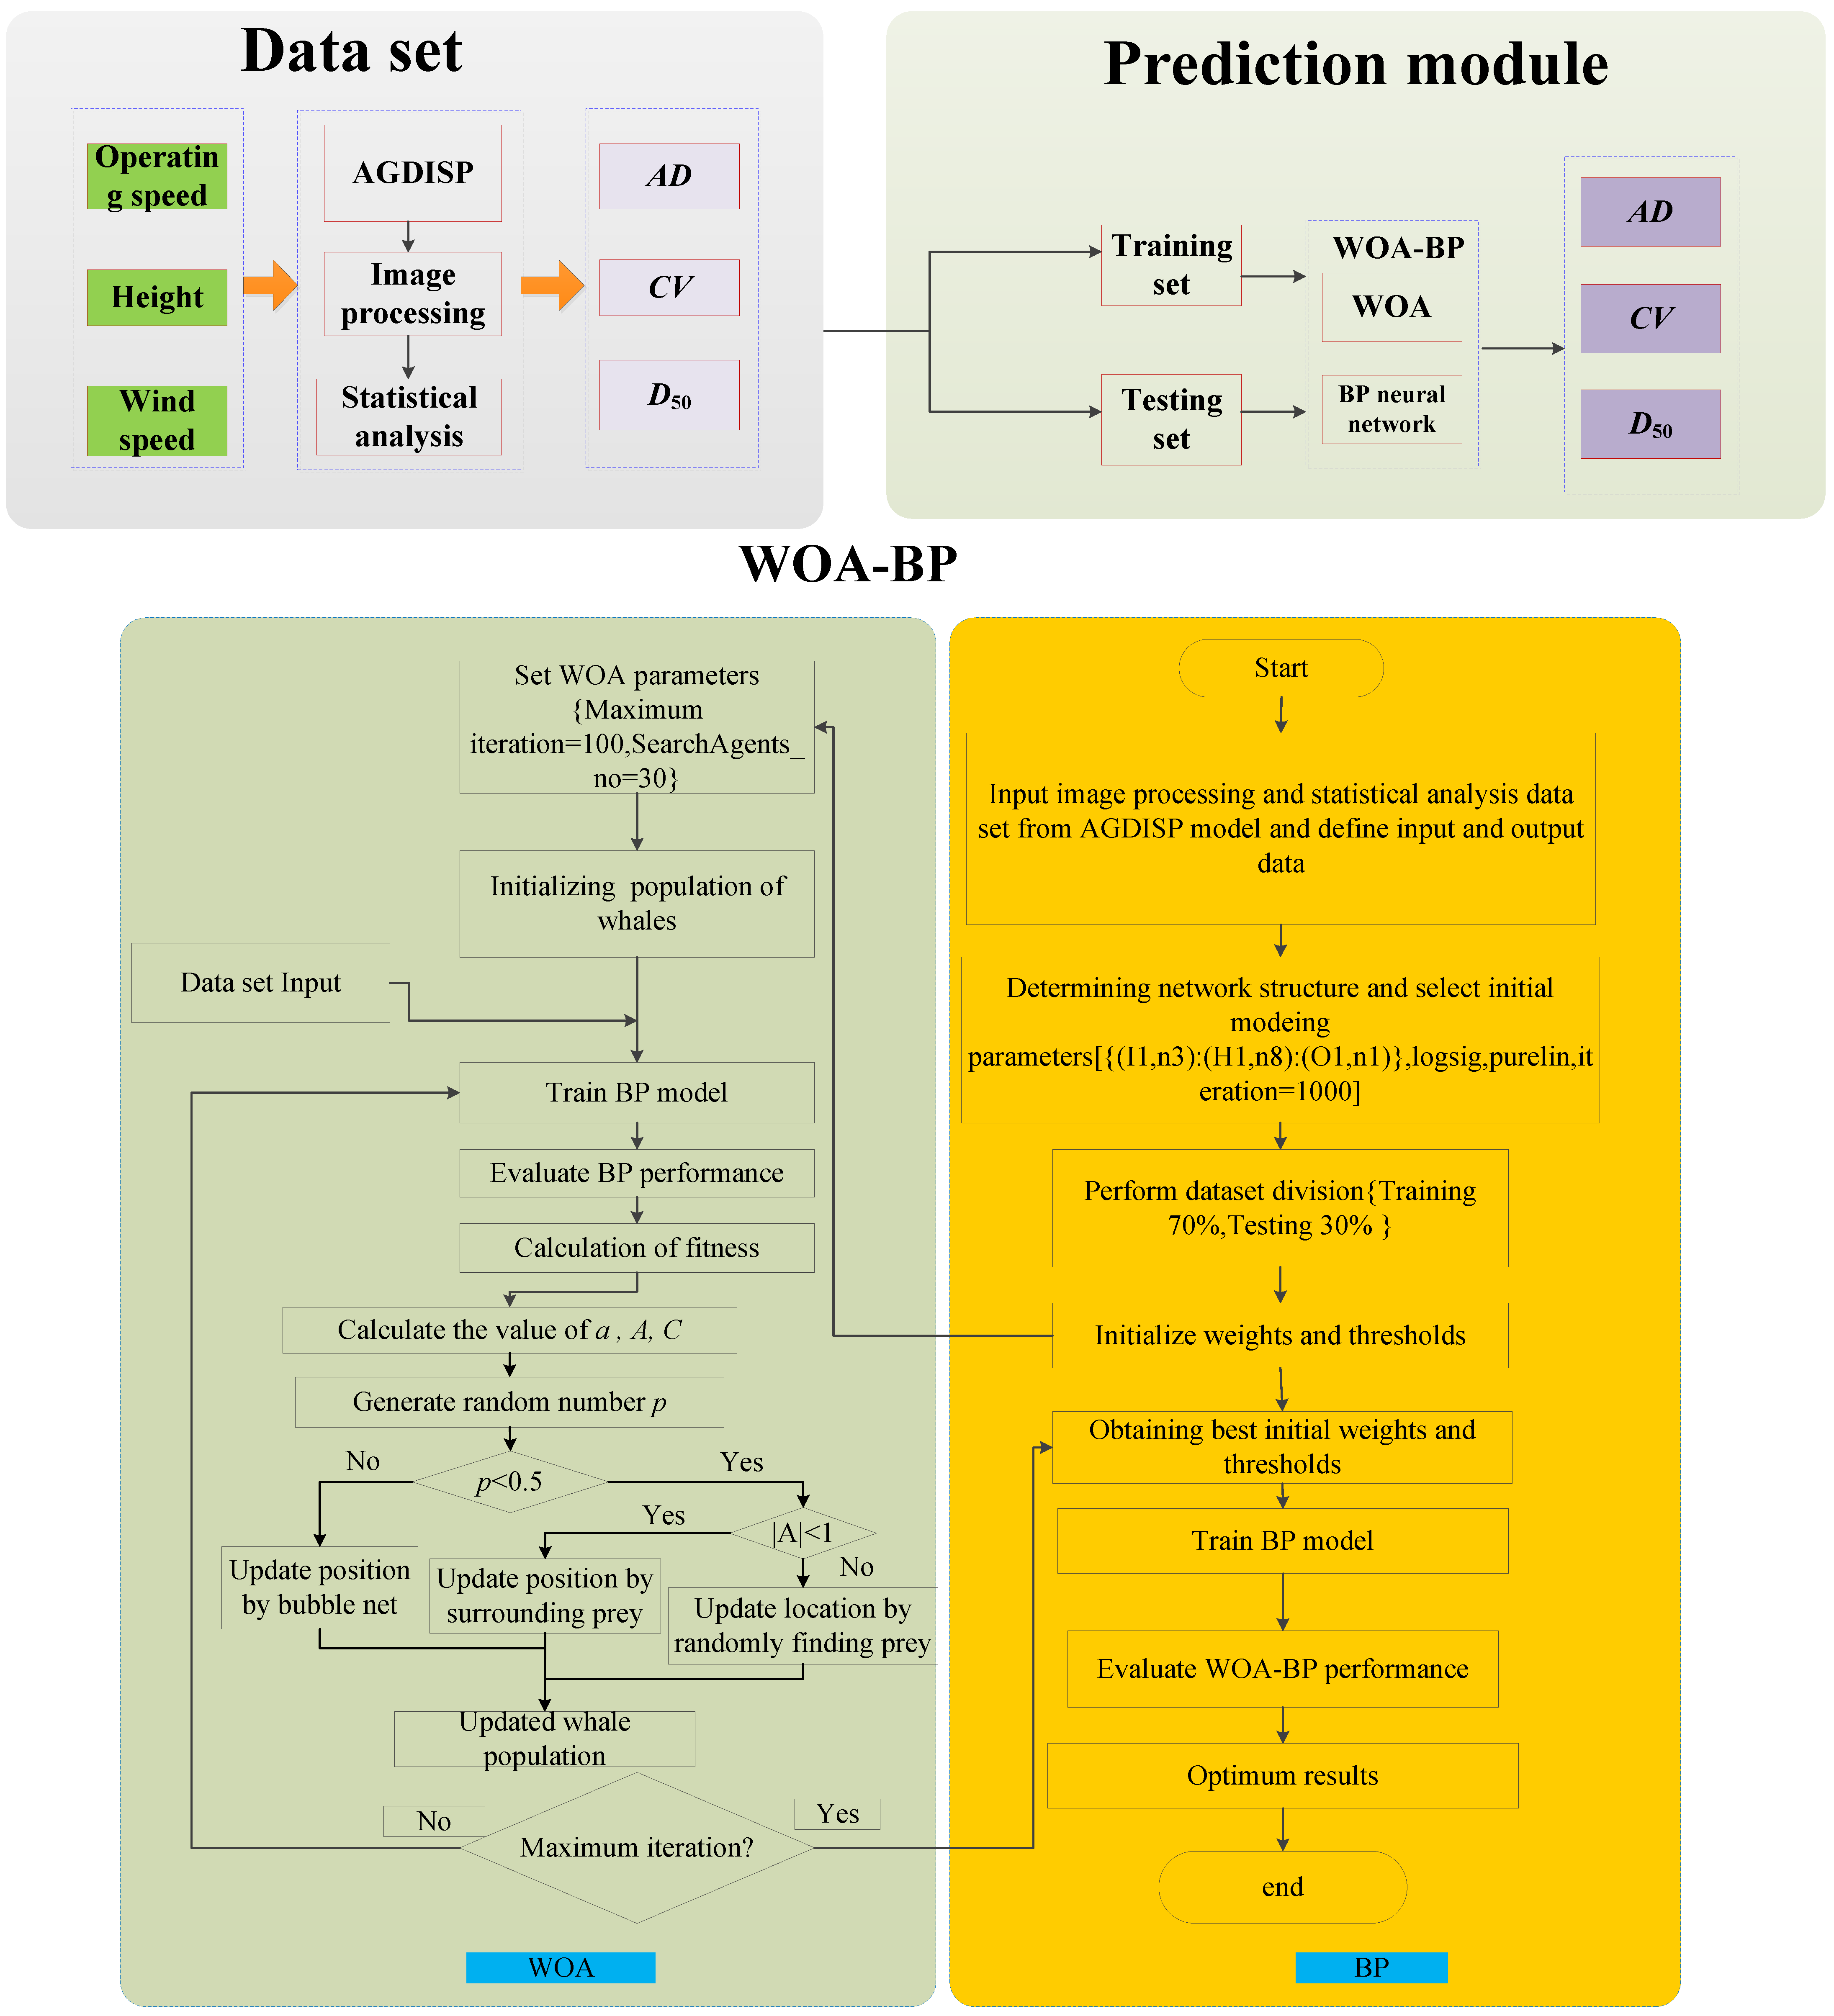
2.2. Droplet Deposition Data Modeling Based on WOA-BP

A total of 216 samples were obtained through the data collection and processing described above. According to the suggestion of Yao [28], at least a 50 m wide downwind area was reserved as a buffer zone, so the downwind deposition was selected at 50 m, i.e., D50. The machine learning method was used to model the droplet deposition data to predict the droplet deposition effect under any conditions. Among many machine learning algorithms, the classic BP neural network was chosen. The BP neural network is a well-known machine learning algorithm that is widely used for the predictive modeling of nonlinear systems [29,30,31]. The modeling process for the data is shown in Figure 3, using the image processing and data statistical analysis methods introduced in Section 2.1. Datasets containing the average deposition within forested areas (AD), the coefficient of variation (CV), and the deposition at 50 m downwind (D50) were obtained for three factors: different flight heights ( H ), flight speeds ( v ), and wind speeds (Ws). A divide-and-conquer strategy was used, and for each target, a prediction model was built. Thus, three BP neural network prediction models were constructed, all with flight height, flight speed, and ambient wind speed as inputs, and the outputs were the average deposition within the forest area (AD), the coefficient of variation of deposition within the forest area (CV), and the deposition at 50 m downwind (D50), respectively. Since the BP neural network weights and thresholds are usually some random numbers when initialized, they may fall into local optimal solutions when iteratively updating the weights using the gradient descent method. For this reason, the whale optimization algorithm (WOA) was used to optimize the initial thresholds and weights of the BP neural network until the BP neural network was able to achieve the optimal fitting performance [32]. The flowchart of the WOA-BP algorithm is shown in Figure 3. The WOA is a well-known population intelligence optimization algorithm that has been widely used [33], which mimics the social behavior of humpback whales. These whales, which are considered highly intelligent animals with emotions, have three behaviors to hunt for prey—encircling prey, the spiral bubble-net feeding maneuver, and searching for prey.

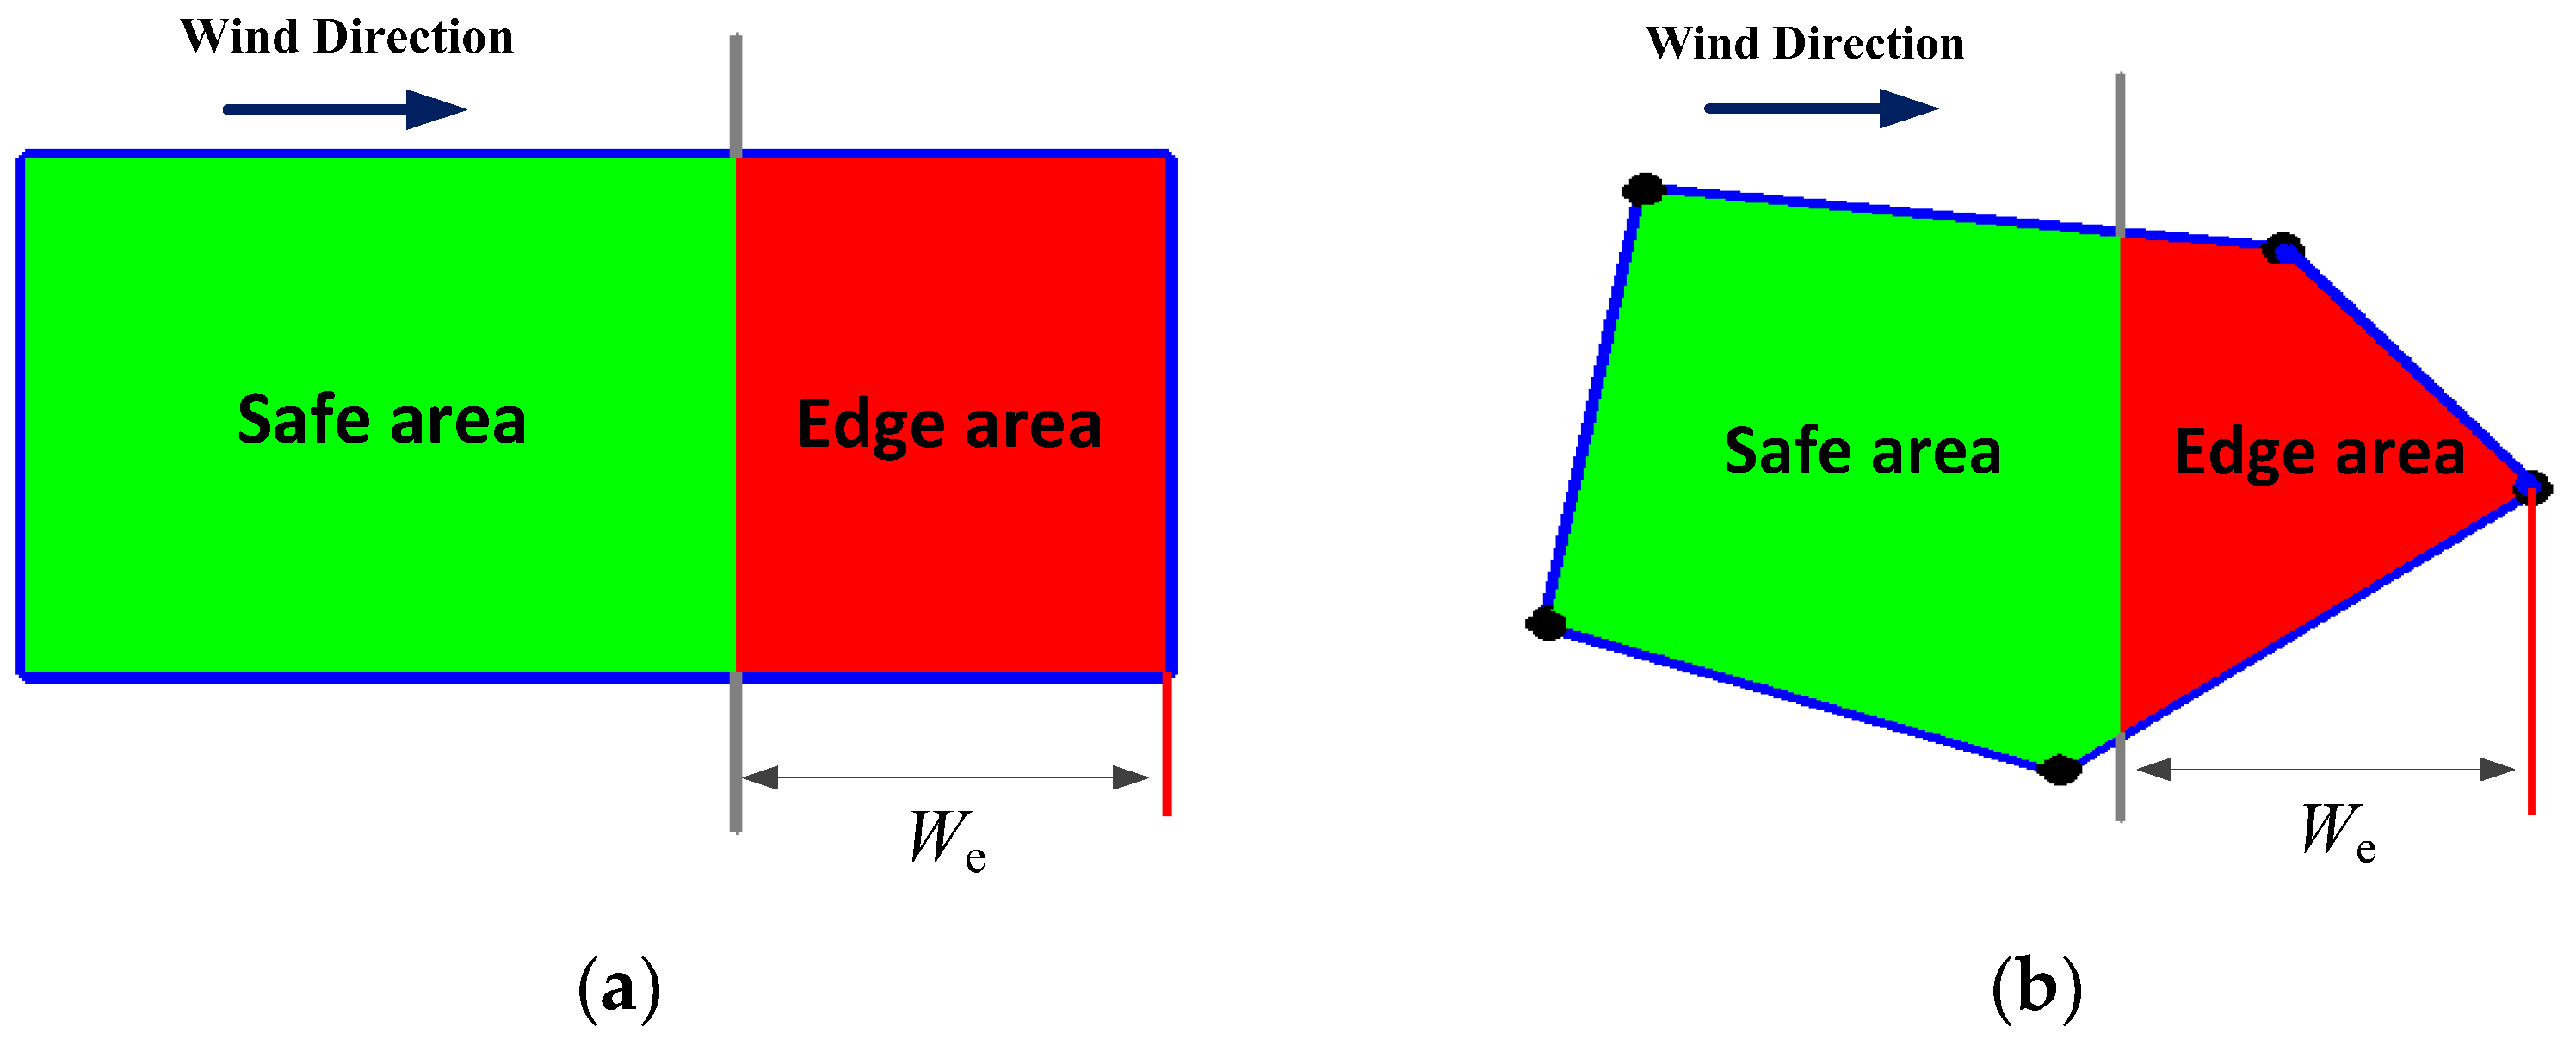
2.3. Developing a New Application Strategy

Pesticide droplets will drift along the direction of the ambient wind [28], so the risk of pesticide droplet drift is higher when spraying pesticides in the forest near the edge of the forest area along the direction of the ambient wind, while the risk of pesticide droplet drift out of the forest area is lower for the other areas inside the forest area. This inspired us to divide the forest area and use a new application strategy with different operational parameters in each area. We divided the application area into safe and edge areas. The area extending from the farthest operational boundary in the downwind direction to the point where We = 60 m (usually twice the length of the spraying width) in the upwind direction [28] was delineated as the edge area, and the rest of the forest area was delineated as the safe area. A schematic diagram of the delineation of the applied forest area is shown in Figure 4. Then, in each sub-area, the specific application strategy was approximated by using different flight heights and flight speeds to obtain different operational effects.
(1) The focus is on the deposition at 50 m downwind (D50) when operating in the edge area in the forest, while secondary consideration is given to the average droplet deposition (AD) and the coefficient of variation (CV). This is because when the helicopter is close to the edge of the forest area, it will transport drops to the environment outside the forest. At this point, the operation parameters corresponding to the smaller D50 should be selected.
(2) When operating in the safe area in the forest, the focus is on AD and CV, and secondary consideration is given to D50. This is because when the helicopter operates in the area far away from the edge of the forest area, there is a certain distance from the boundary of the forest area, and at this time, the risk of drifting outside the forest area is less. At this point, the program that makes AD and CV relatively moderate should be selected.

2.4. Droplet Deposition Experiment

Six helicopter spraying experiments were conducted on 21 October, 28 October and 10 November 2023, respectively, in order to verify the effectiveness of the proposed new pesticide application strategy. The test aircraft was a Robinson Helicopter R44 Thunderbird series helicopter provided by Jiangsu Ningxiang General Aviation Company (Nanjing, China), with a spraying width of 30 m. The test site was located at Longtan Base (118°23′10″ E, 32°49′35″ N) of Jiangsu Ningxiang General Aviation Co., Ltd. (Nanjing, China), on flat grassland with a selected square area measuring 200 m × 80 m, totaling 16,000 m2, without any obstructions around it. The long side of the test area was set along the wind direction.
The experiments were equipped with a self-developed route planning and monitoring system for a helicopter spraying pesticide. The system was developed based on WebGIS, which is capable of recording critical parameters such as flight height, speed, aircraft position, and spray volume in real-time. WebGIS refers to the Geographic Information System (GIS) working on the Web network, combining traditional GIS technology and Web technology to realize a cross-platform, multi-system step-by-step cloud GIS. Aircraft position, application status, and environmental meteorological information were collected. By logging into the same account, the monitoring interface could be simultaneously displayed across multiple networked devices.
The sprayed medium was water. The spray pressures were set at a spray pressure of 0.23 MPa (100 km/h), 0.25 MPa (108 km/h), 0.29 MPa (126 km/h), and 0.31 MPa (135 km/h) based on the flight speeds. Pesticide droplets were collected using water-sensitive paper secured by metal frames at a height of 1.2 m above the ground. Sampling lines were placed in the middle and 50 m downwind in the spraying area, with a 6 m interval between each pair of water-sensitive papers. After spraying, a 3 min wait was observed before promptly collecting the water-sensitive papers and capturing them for storage. Subsequently, the deposition data were analyzed using the well-known image processing software (DepositScan, U.S. Department of Agriculture, Washington, DC, USA, http://www.ars.usda.gov/mwa/wooster/atru/depositscan, accessed on 17 March 2025), as outlined by Zhu et al. [34]. The experimental plan and on-site illustrations are presented in Figure 5.
Five experienced pilots participated in this study. These pilots had long-term experience in forest pesticide-spraying operations. They determined the most commonly used flight speed and the typical flight height (vertical distance from the canopy surface). This approach is referred to as the artificial empirical method. The flight height and speed over the whole forest in the artificial empirical method are fixed, with a typical flight speed of 100 km/h and a flight height of 8 m. The height of the water-sensitive paper placement is 1.2 m above the ground. During the experiment, the flight height was set at 9.2 m. For the control group, the new pesticide application method was adopted, and the matching chart for flight height and speed was consulted. When planning the flight routes for the test area based on the wind direction, efforts were made to ensure that the spraying routes were perpendicular to the wind direction, forming a −90° angle. The test area was divided into a safe area and an edge area. The safe area primarily aimed to ensure average deposition and uniformity, striving for a balance between the two objectives, while the edge area focused on achieving minimal deposition 50 m downwind. The wind speed, wind direction, etc., were recorded using environmental monitoring stations. The specific operational parameters are shown in Table 2.

3. Results

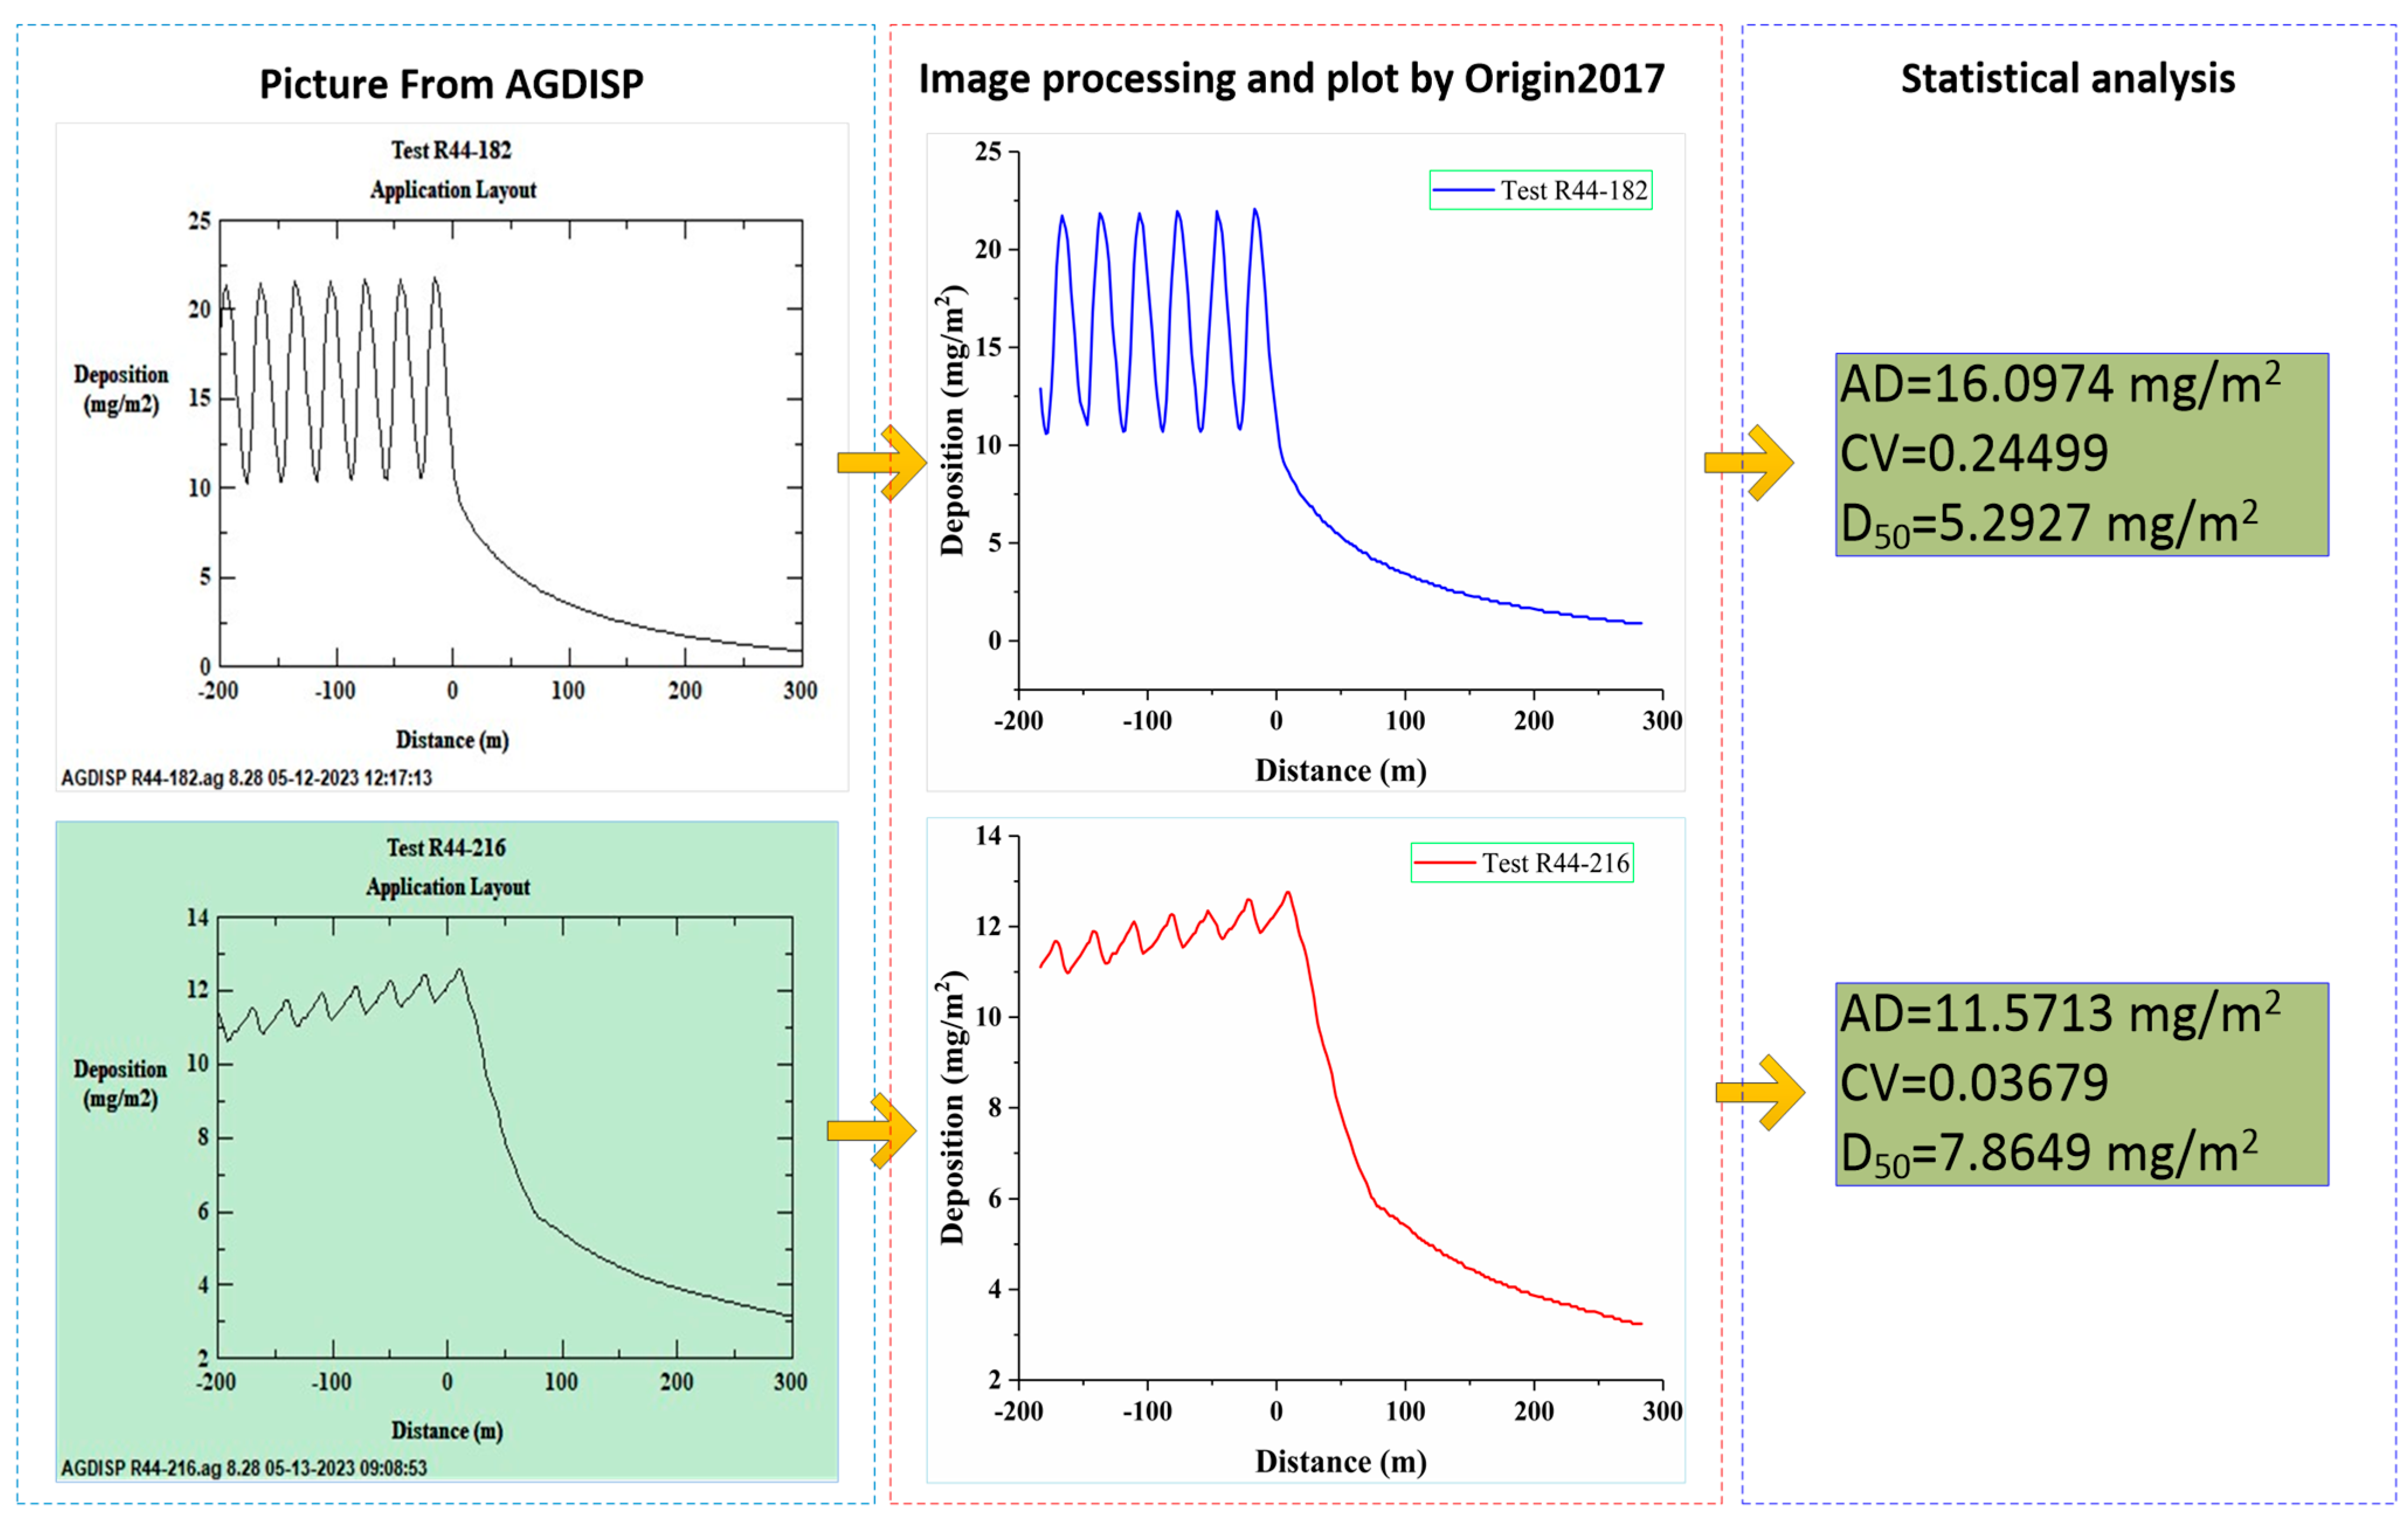
3.1. Effects of Image Processing

Figure 6 shows the effect of image reading: the left side is the picture generated from the calculation with the AGDISP, and the middle is the result after image processing in this paper, with Origin 2017 software (Origin Lab, Northampton, MA, USA) used to draw the result. As can be seen from Figure 4, two parts are very consistent, and the background color does not impact the reading effect. From the simulations, we are able to see that the deposition behavior of pesticide droplets inside and outside the forest area is rather different for different scenarios.
Once these image data are obtained, the different evaluation indexes corresponding to each image deposition are obtained by introducing the statistical analysis method outlined in Section 2.1. The right side of Figure 6 shows the results of the analysis of two deposition images. These indicators are used to evaluate the characteristics of the deposition.

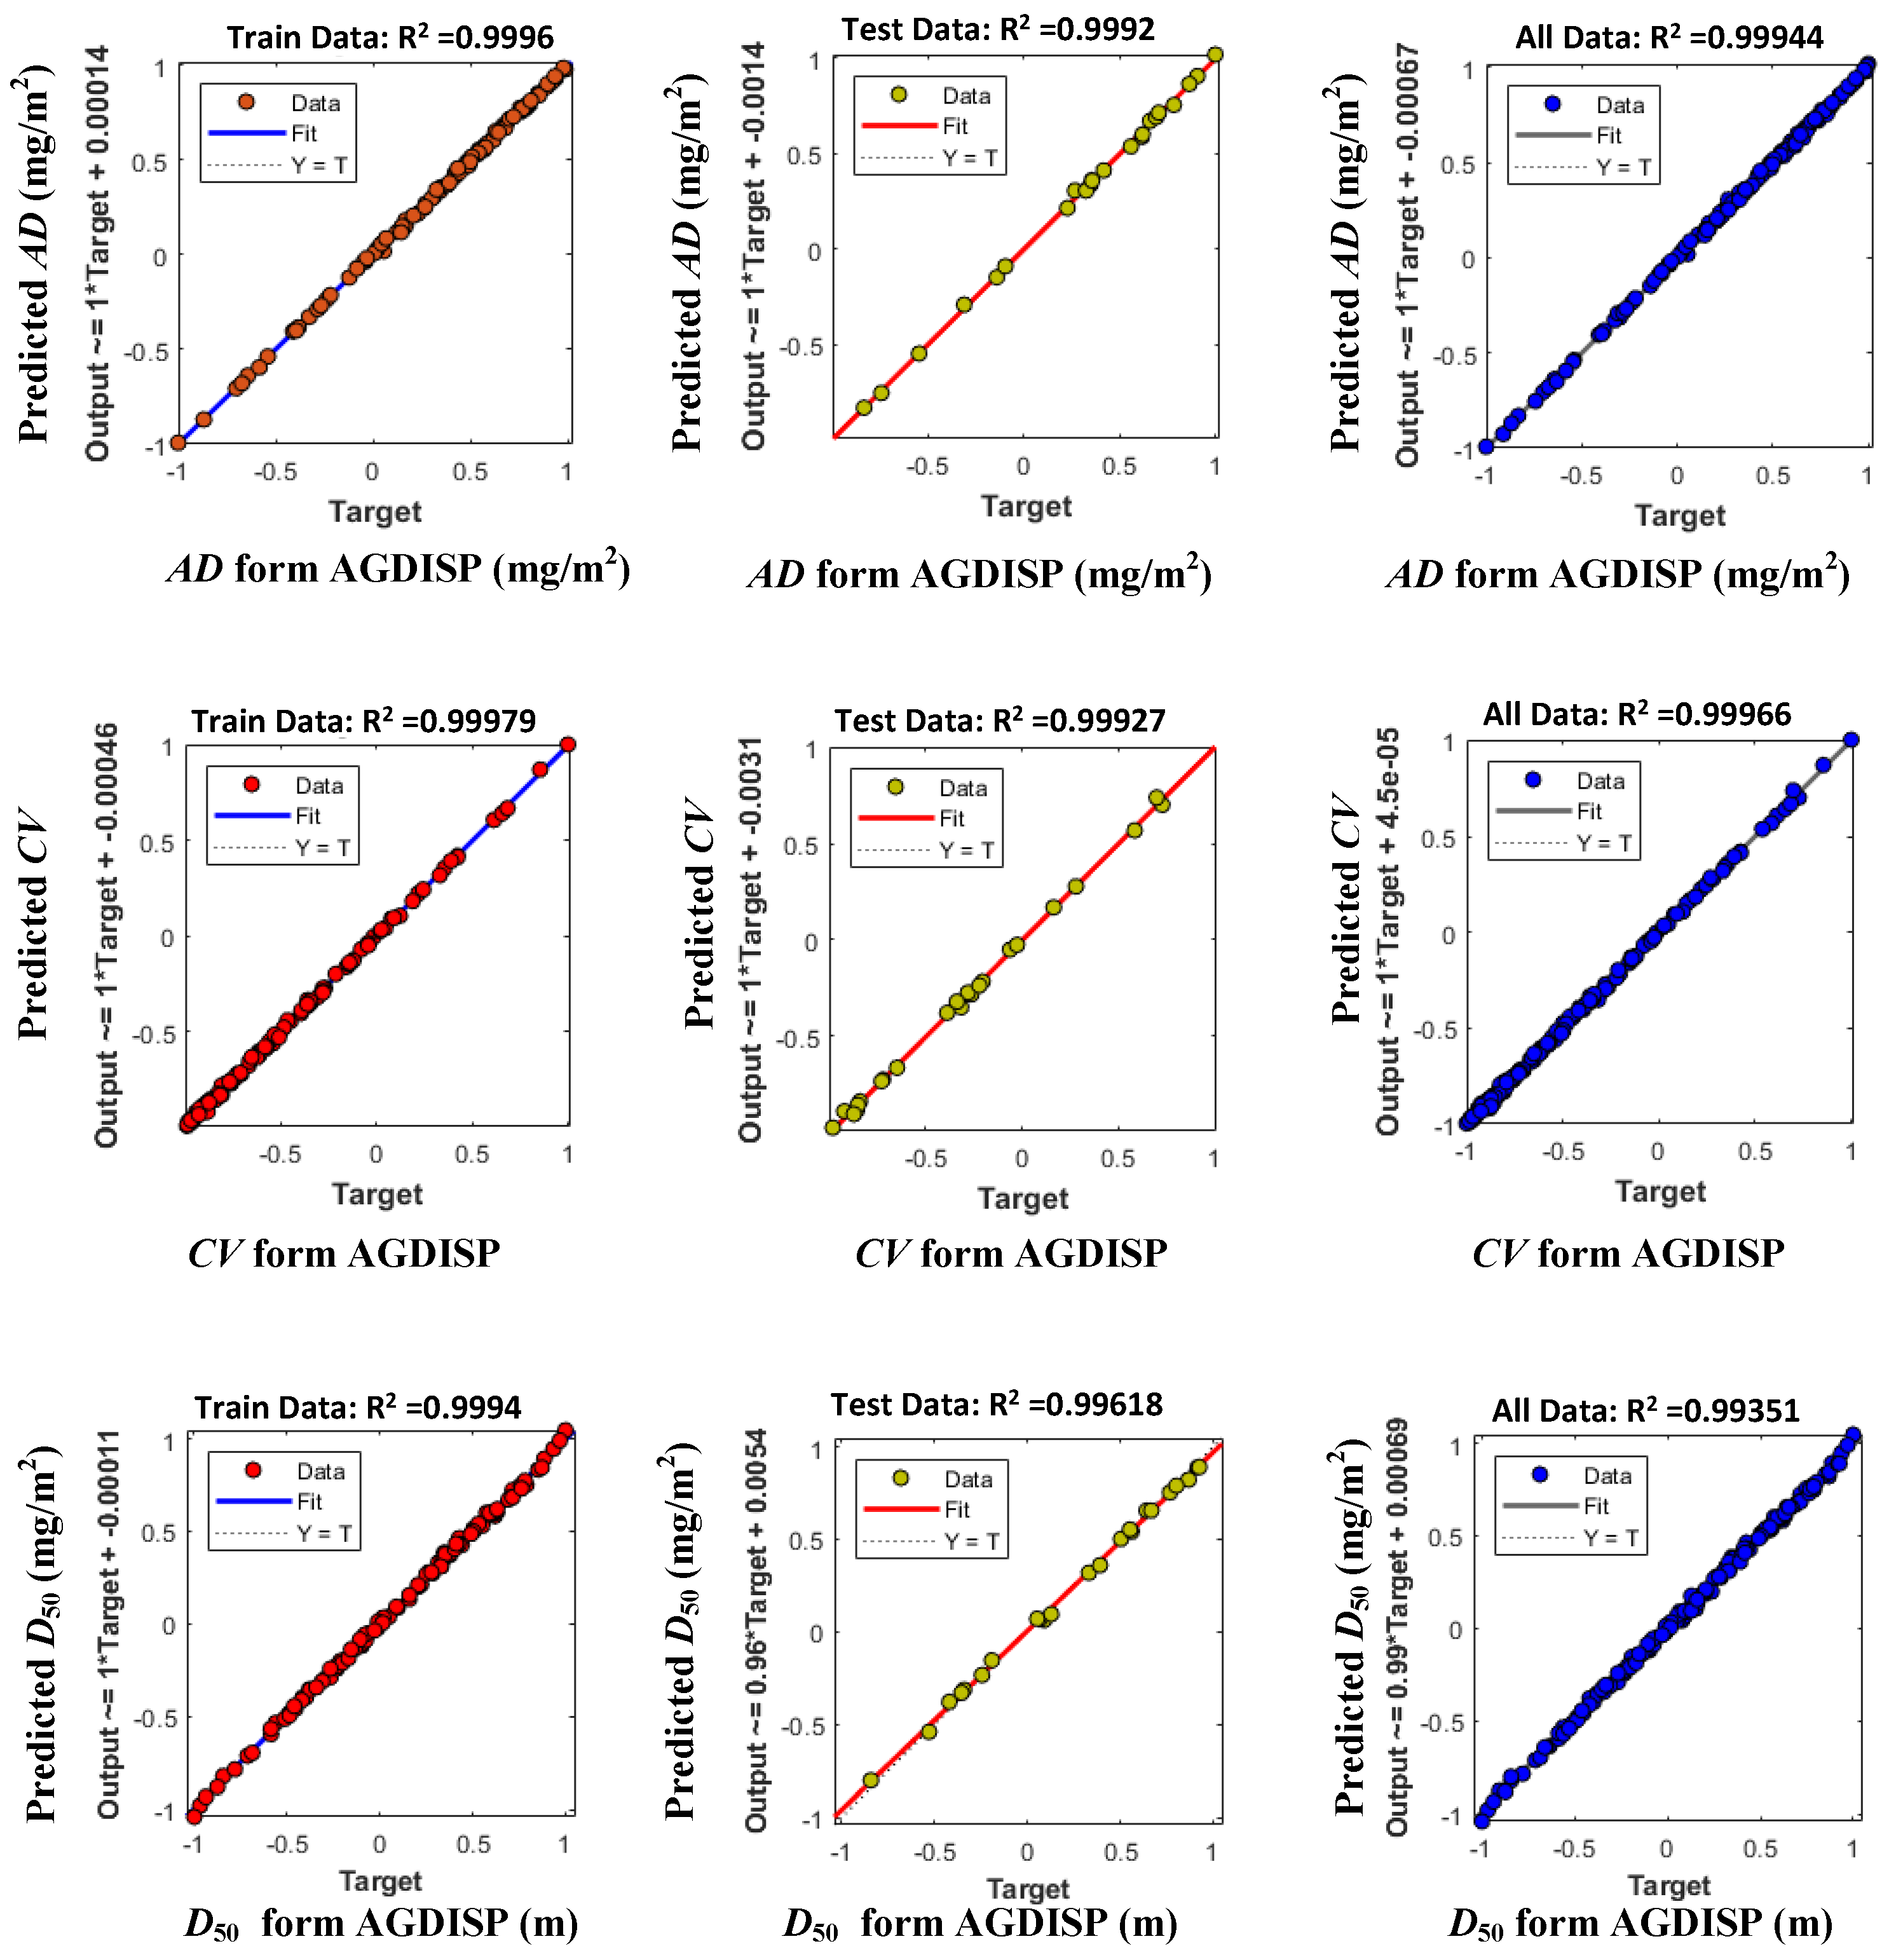
3.2. WOA-BP Prediction Accuracy

The prediction accuracy of the WOA-BP algorithm was evaluated using R2, which was calculated as follows [31,35]:
R 2 = i = 1 n ( Y ^ i Y ¯ ) 2 i = 1 n ( Y i Y ^ i ) 2
where Yi is the value taken from the AGDISP; Y ^ i is the predicted value; Y ¯ is mean value; and n is the total number of datasets.
In the WOA-BP algorithm, the ratio of the test set to the training set was 7:3, the number of neurons in the hidden layer was set to 8, the number of populations was 30, and the number of iterations was 100. As shown in Figure 7, the prediction results of the WOA-BP for the three datasets are demonstrated, and the R2 reaches 0.9994, 0.9997, and 0.9935, respectively. A comparison of the predicted values with the true values (read from the AGDISP) show that both are very close to each other, indicating that the prediction accuracy is very high.

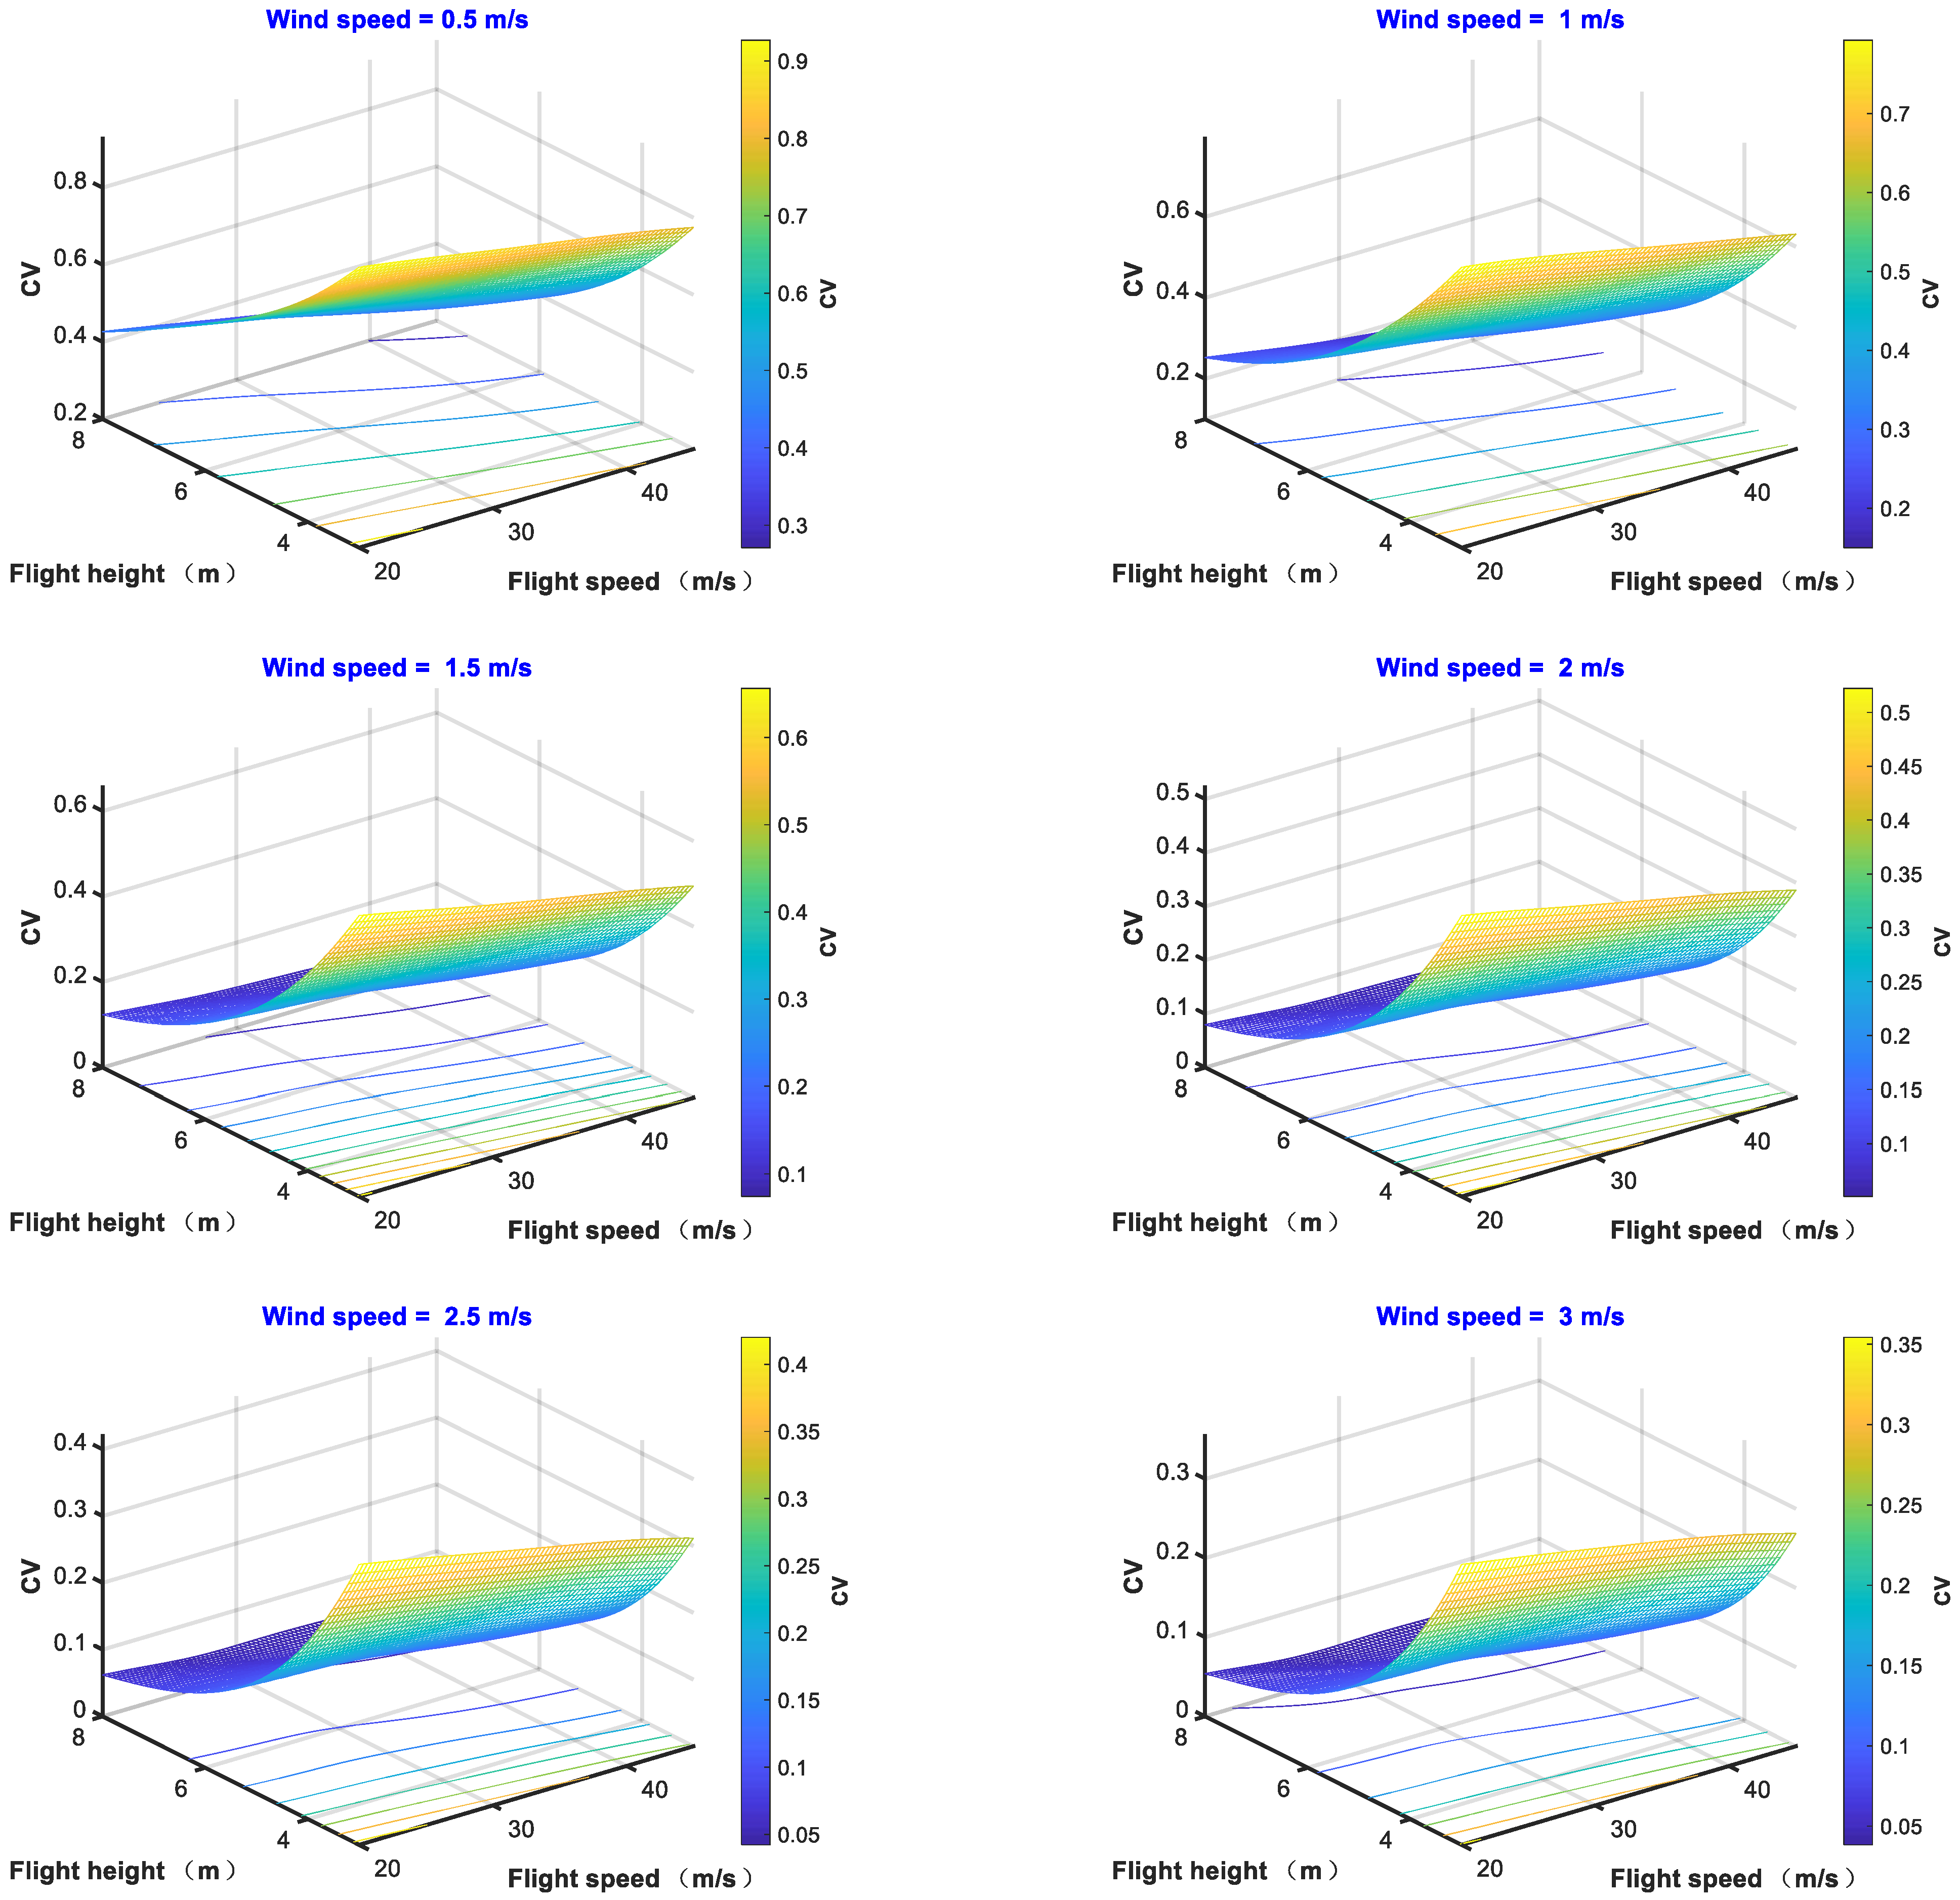
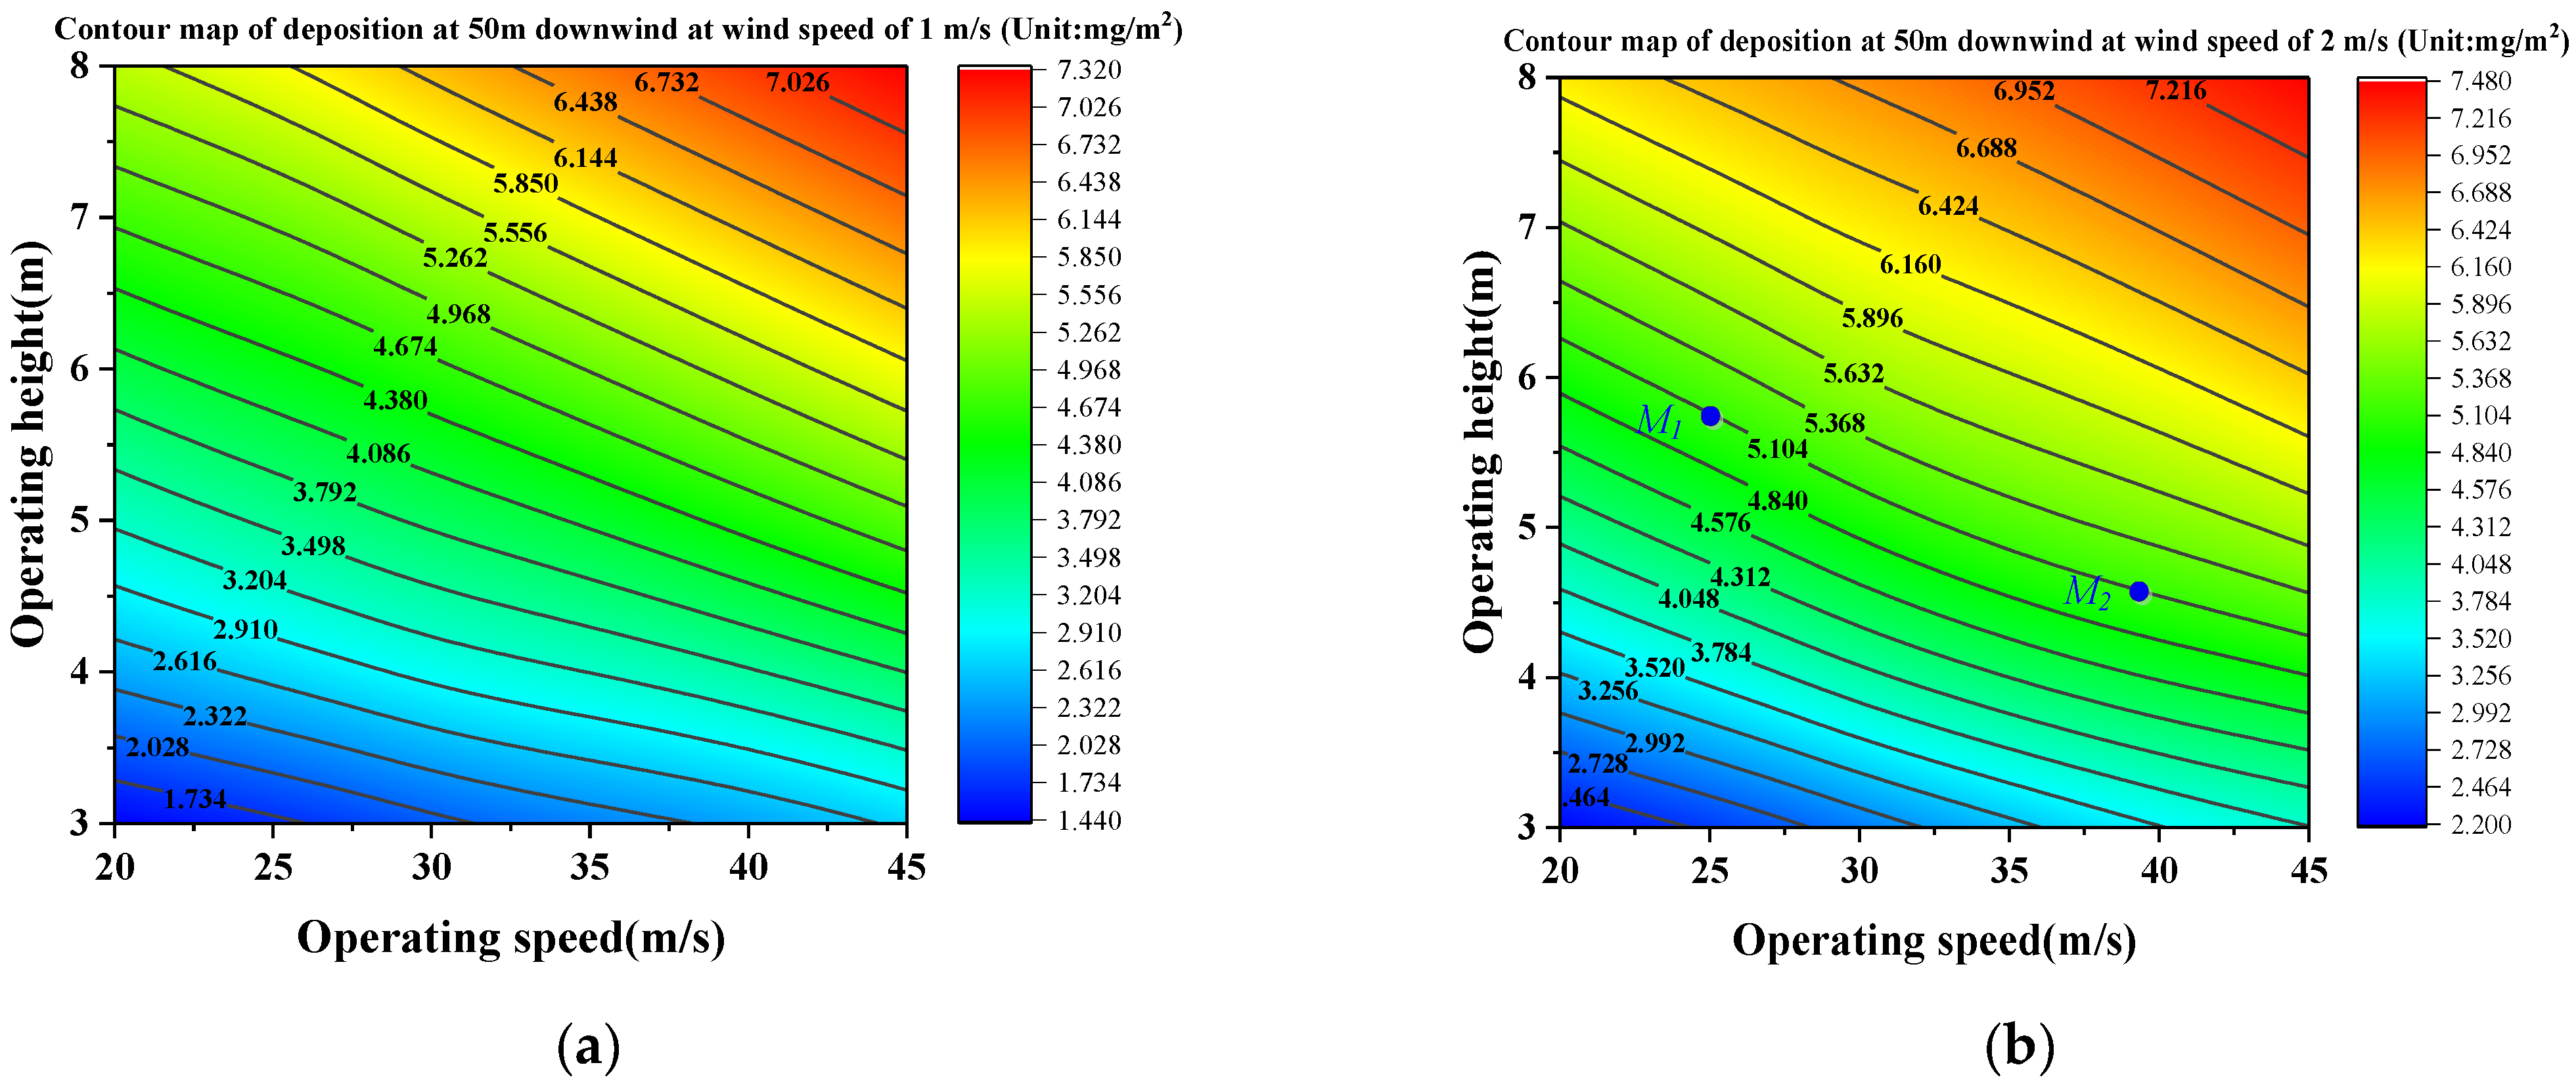
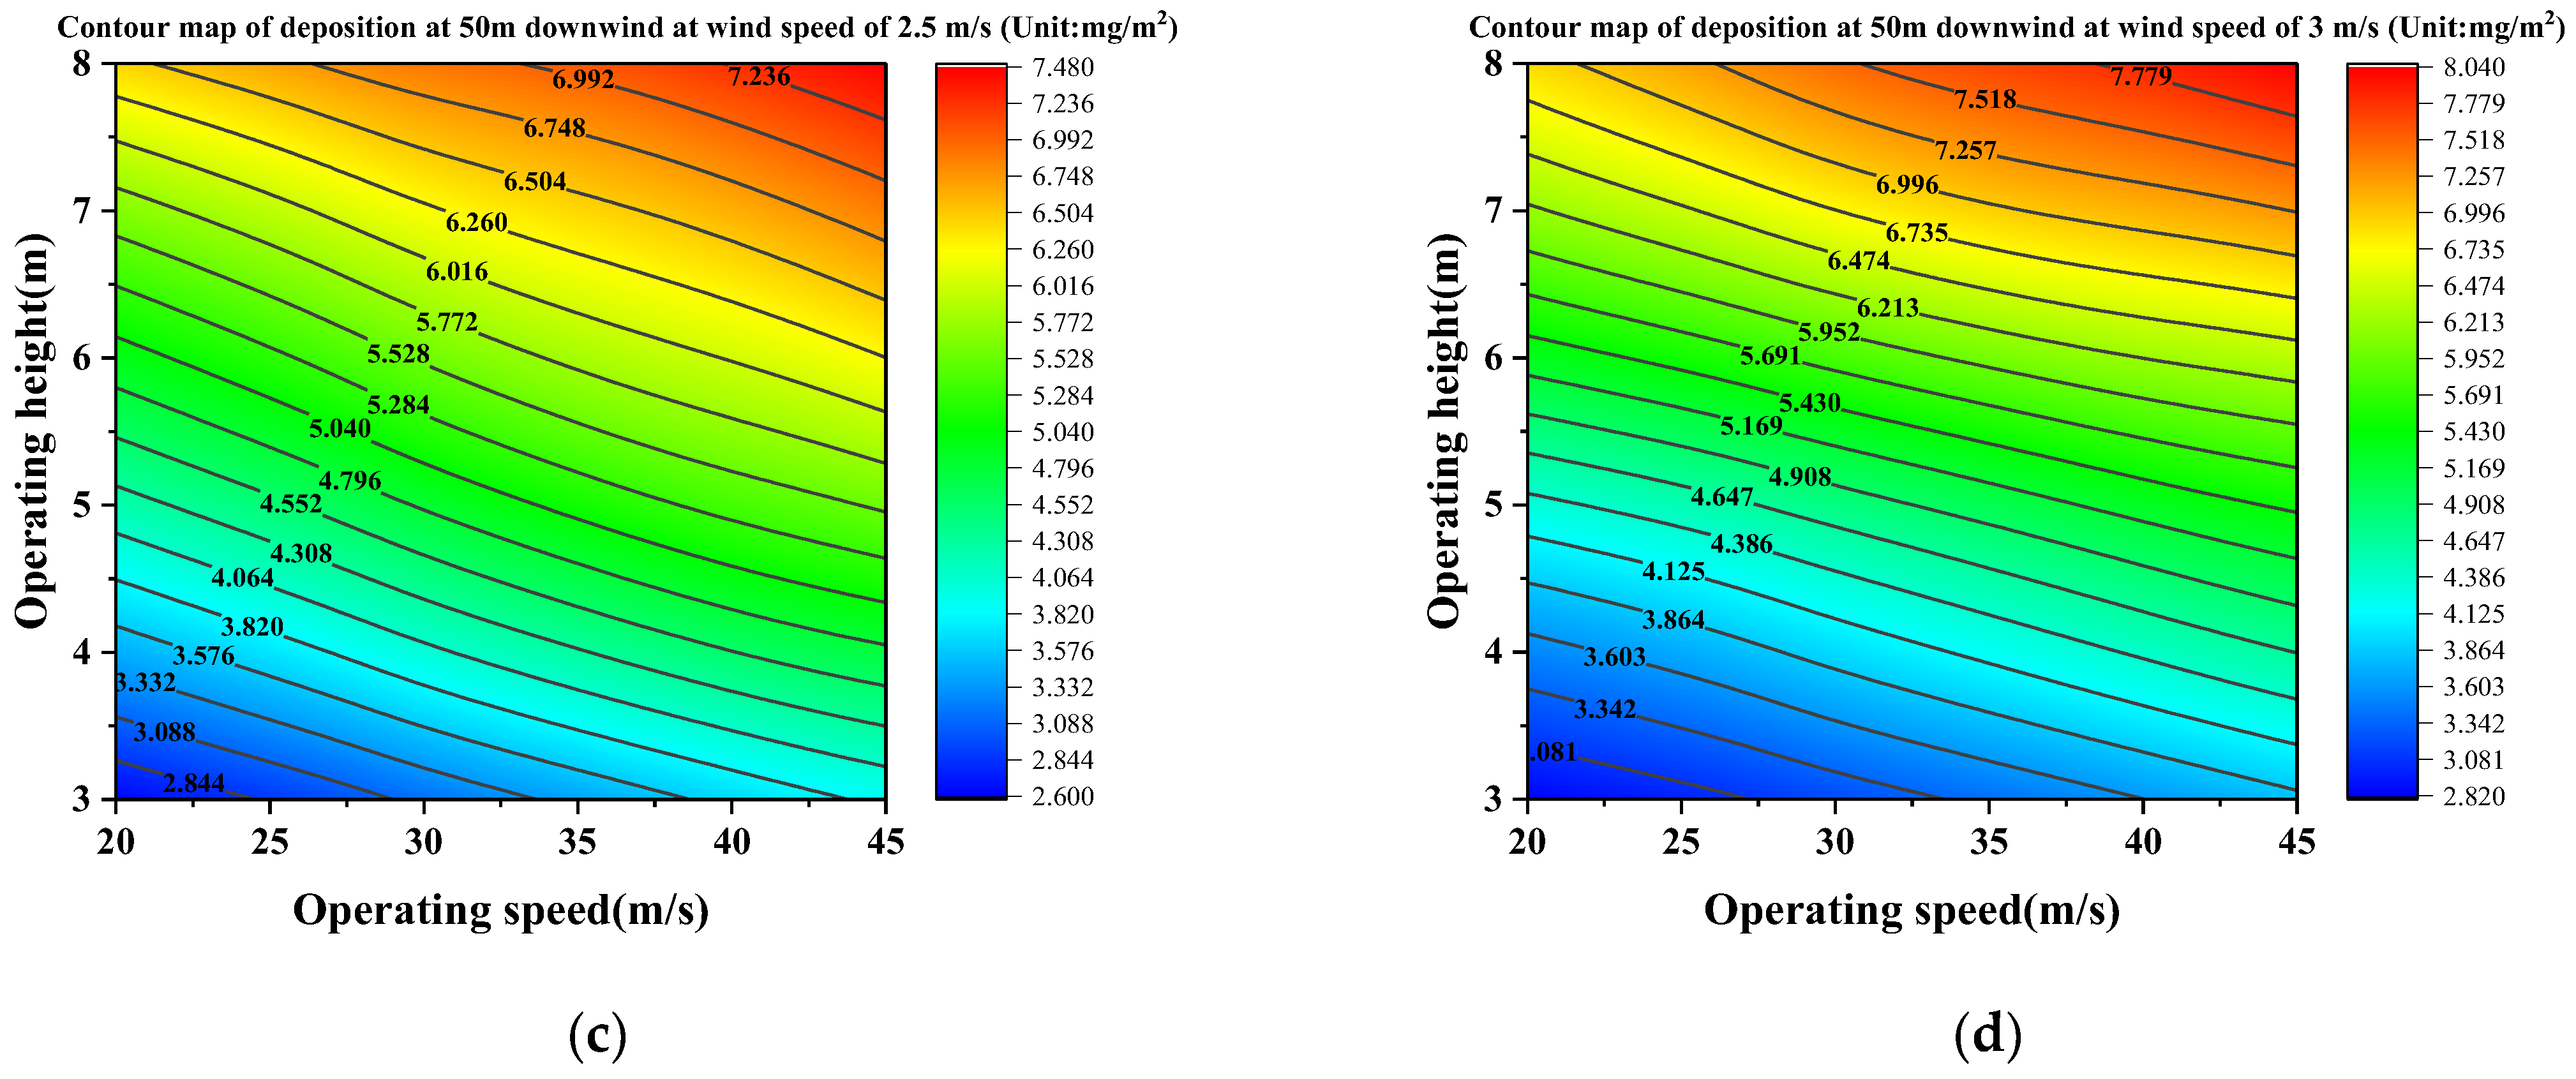
3.3. The Deposition Law of Droplets

The WOA-BP model was constructed to predict the effect of droplet deposition under any conditions regarding ambient wind speed, flight height, and speed. When applying pesticides, the flight height and speed are controllable factors during operation, and they can be obtained by the pilot maneuvering the aircraft, while the ambient wind speed is an uncontrollable factor. Therefore, we mainly analyze the relationship between the droplet deposition (AD) under different flight heights and speeds.
Figure 8 shows the relationship between the variation in average deposition (AD) under different ambient wind speeds with flight height and speed. The average deposition of droplets showed a decreasing trend with decreasing flight height and decreasing flight speed. As the ambient wind speed increased, the average deposition also showed a decreasing trend. This indicates that the average deposition is negatively correlated with flight height, flight speed, and ambient wind speed.
Figure 9 illustrates the relationship between the coefficient of variation (CV) and flight height and flight speed for different wind speeds. For each determined wind speed, the coefficient of variation of droplet deposition shows a decreasing trend with the increase in flight height and flight speed. It also decreased significantly with the increase in ambient wind speed. When the wind speed is 3 m/s, the coefficient of variation is lower than 0.35 in the whole range of flight height and speed, and the coefficient of variation is more than 0.3 or even as high as 0.9 when the wind speed is 0.5 m/s. This shows that the coefficient of variation is negatively correlated with the flight height, flight speed, and ambient wind speed.
Figure 10 illustrates the relationship between the deposition at downwind distances of 50 m (D50) with flight height and flight speed for different wind speeds. At each determined wind speed, the D50 shows an increasing trend as the flight height increases and the flight speed increases. As the ambient wind speed increases, D50 also shows an increasing trend. When the wind speed is 0.5 m/s, the maximum value of D50 is close to 5 mg/m2 for the whole range of flight height and speed, and when the wind speed is 3 m/s, the maximum value of D50 is close to 8 mg/m2, which suggests that there is a positive correlation between the amount of downwind deposition and the flight height, flight speed, and ambient wind speed.
For aerial applications, we always hope that the average deposition of pesticide droplets inside the forest area is larger, the uniformity is better (a smaller coefficient of variation), and the downwind deposition is smaller [9]. However, it was found that the average deposition (AD) was negatively correlated with flight height and speed, the uniformity (CV) was positively correlated with flight height and speed, and the downwind deposition (D50) was positively correlated with flight height and speed for different ambient wind speeds. The above analysis shows that it is possible to control the deposition of droplets by adjusting the flight height and speed. To achieve optimal droplet deposition, a rational application strategy can be developed to control flight height and speed. This strategy should account for varying ambient wind speeds to ensure consistent deposition performance.

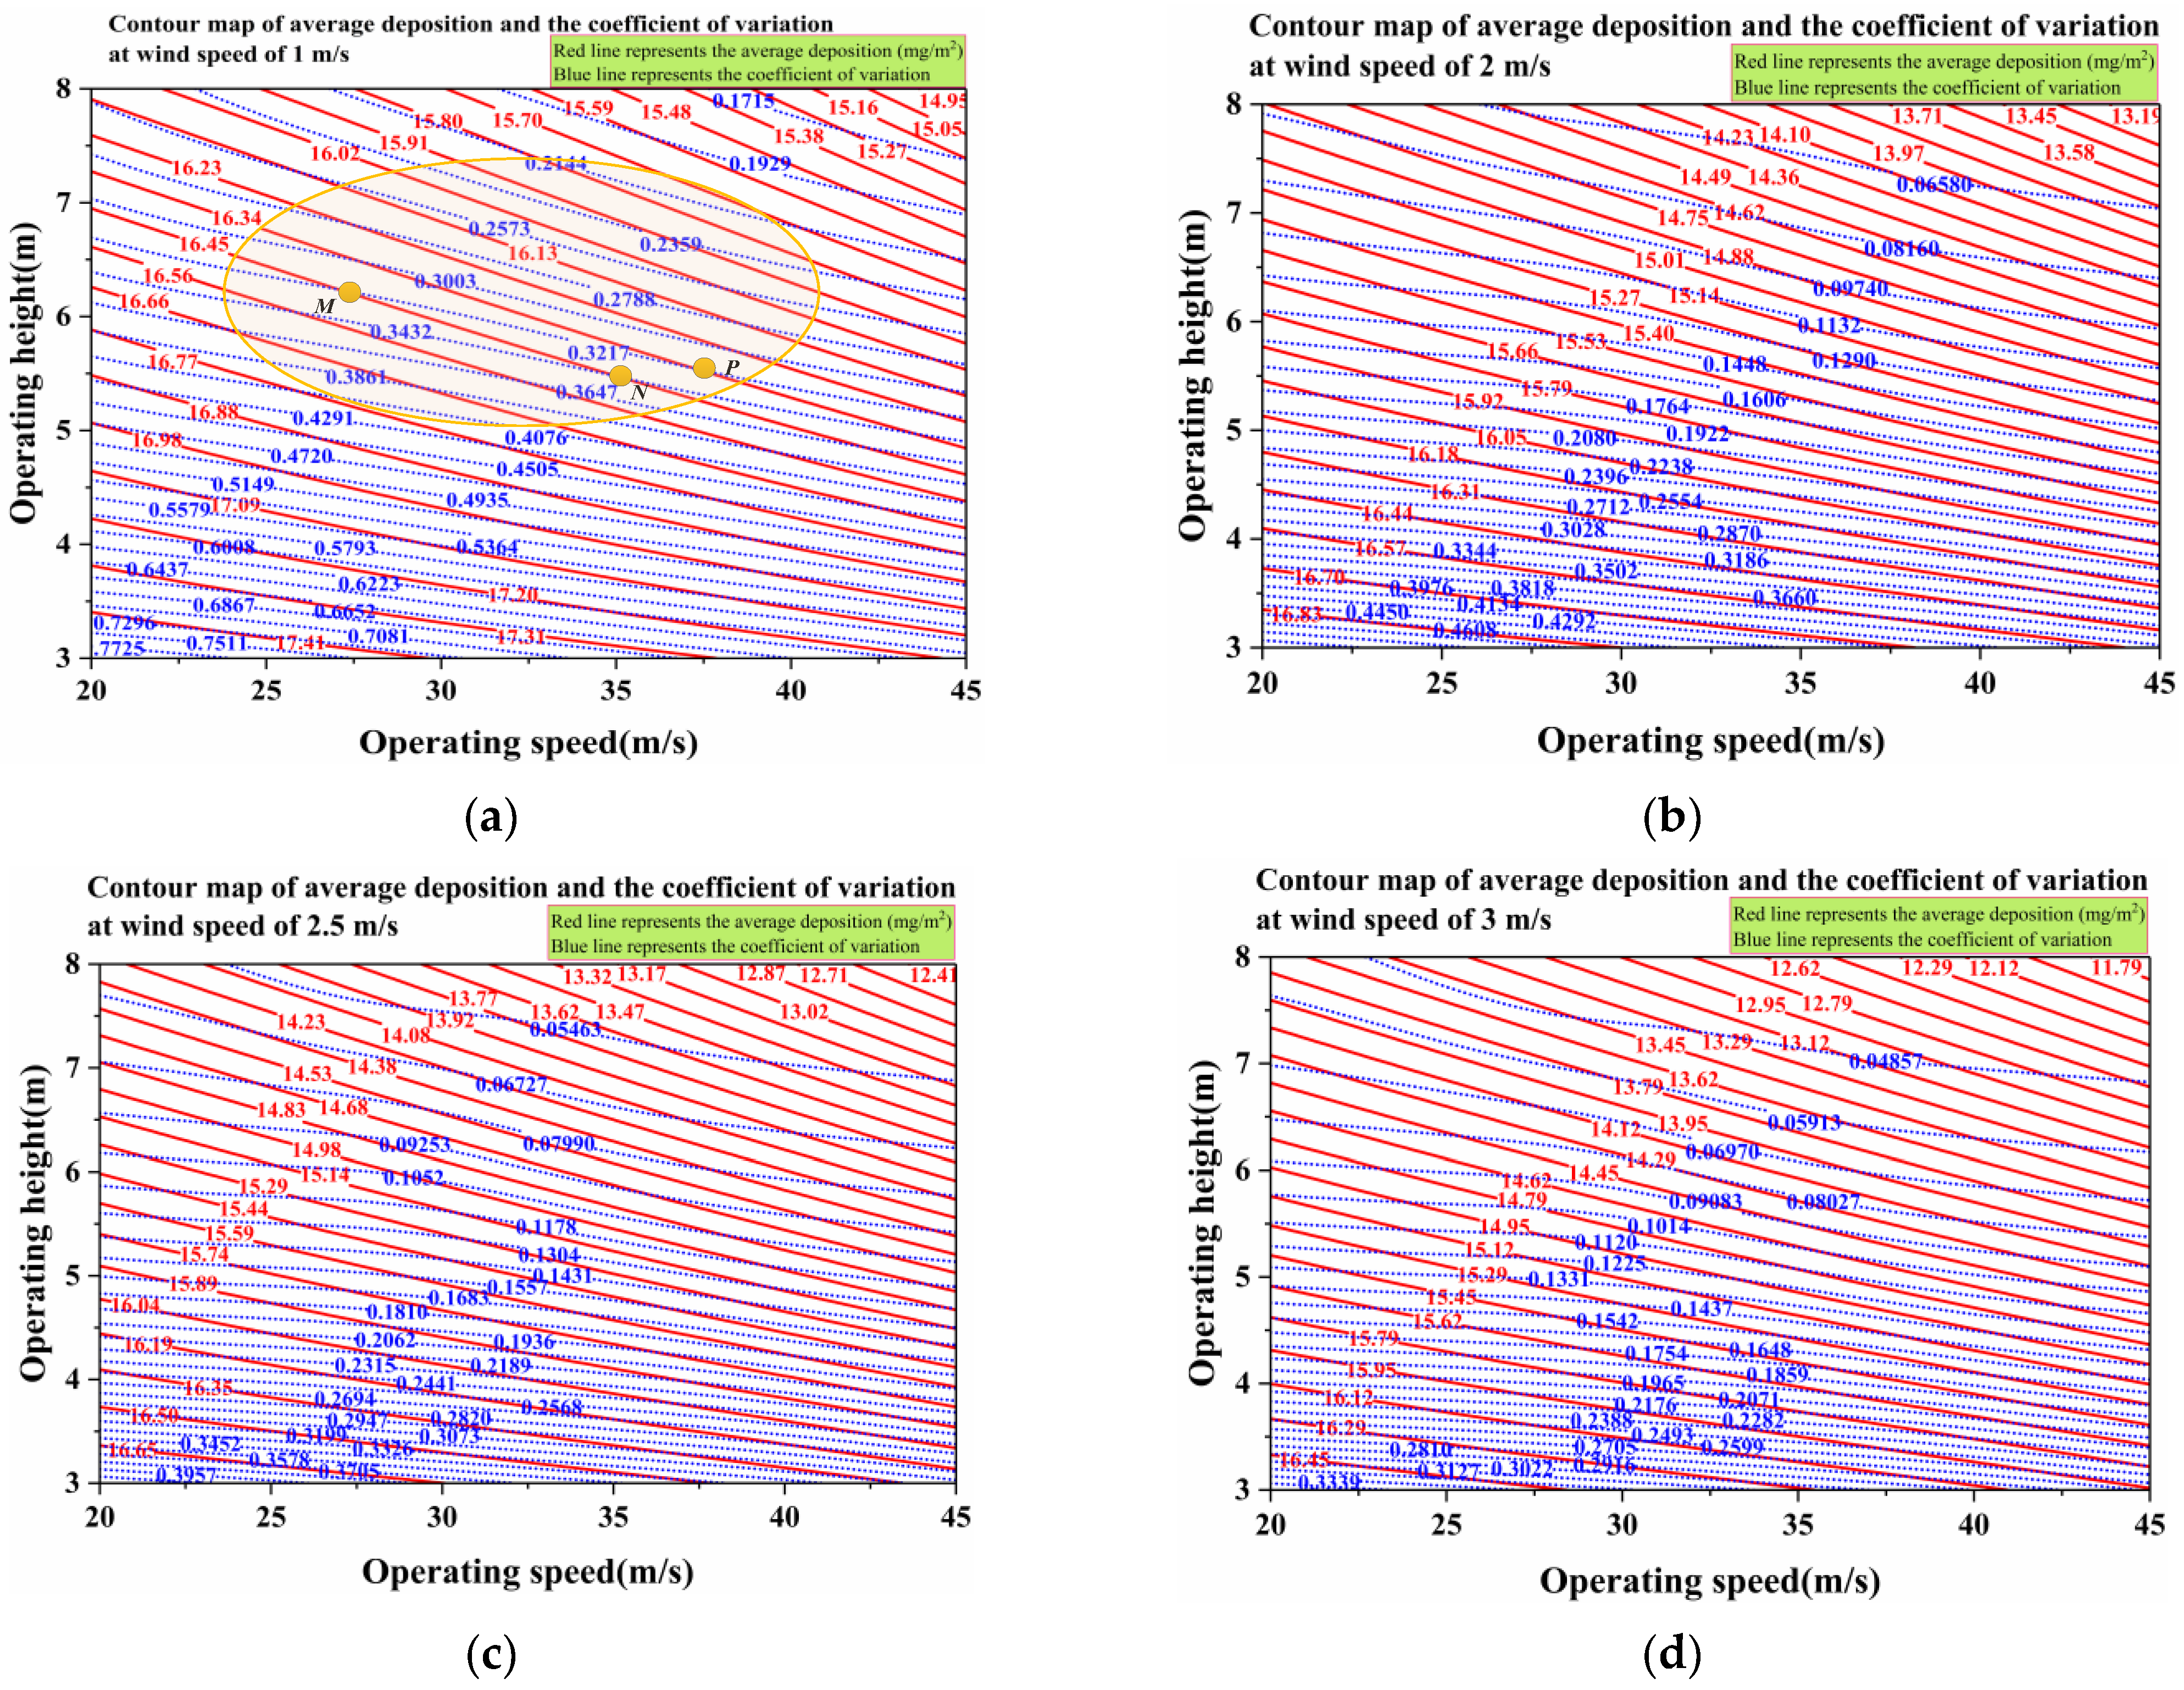
3.4. Matching Chart of Flight Height and Speed

To achieve the objectives of minimizing the risk of pesticide droplet drift in the edge area while enhancing the average deposition and ensuring uniformity in the safe area, an aerial application operational parameter-matching diagram was developed, depicted in Figure 11 and Figure 12. Flight height and speed can be promptly adjusted to achieve the desired application effects while reducing the impact of ambient wind speed to a minimum. Differing from conventional application methods, the new approach comprises two primary steps: dividing the forest area and matching flight height and speed. This strategy is termed the “New strategy”.
In the safe area, the average deposition and the application uniformity in the forest area are mainly considered. The matching flight height and speed under different ambient wind speeds are given in Figure 10. In the diagram, the red solid lines represent the contour lines of average deposition at different operational parameters under varying ambient wind speeds, while the dashed blue lines represent the contour lines of the coefficient of variation under different operational parameters and wind speeds. Figure 10 reveals that under different wind speeds, when both flight height and speed are relatively low (i.e., closer to the lower-left corner of the graph), a greater average deposition can be achieved, albeit with poorer uniformity of droplet deposition. Conversely, when both flight height and speed are higher (i.e., closer to the upper-right corner), the average deposition of droplets decreases, but the uniformity improves. During actual operations, it is advisable to adjust flight height and speed based on the current wind speed, aligning with the contour lines of deposition and uniformity to strike a balance between the two factors. For instance, in Figure 11a, points M (16.45 mg/m2, 0.3217), N (16.45 mg/m2, 0.3432), and P (16.34 mg/m2, 0.3217) are identified, corresponding to operational parameters (flight height, flight speed) of (26.96 m, 6.26 m/s), (35.19 m, 5.44 m/s), and (37.41 m, 5.55 m/s), respectively. This indicates that using any of these three sets of parameters would yield nearly identical application results. Figure 11 provides vital technical guidance for determining flight height and speed during helicopter pesticide application within the safe area.
Operating in the edge area in the forest, where the risk of droplet drift is high, the main consideration is the deposition at 50 m downwind. When this value is lower, it means that less pesticides have drifted outside the forest. Figure 12 shows a matching chart of flight height and speed when operating in the edge area. According to this graph, a reasonable flight height and speed can be matched according to the ambient wind speed. For example, if the wind speed on the day of application is 2 m/s, then according to Figure 12b, in order to make the deposition at 50 m downwind less than 5.104 mg/m2, the operating parameters in the area covered by the contour below are selected. There are two points on the curve, M1 (24.11 m/s, 5.85 m) and M2 (39.93 m/s, 4.53 m). This indicates that application at 5.85 m (from the crop surface) using a speed of 24.11 m/s can give the same result as operating at a flight speed 39.93 m/s at 4.53 m, achieving the same downwind deposition of 5.104 mg/m2 at 50 m. During actual operation, a higher flight speed and height can be selected as far as possible based on this contour without exceeding the amount of downwind deposition to enhance the operational efficiency. Thus, it is easy to obtain the matching charts of flight height and speed in both safe and edge areas at any wind speed, such as 1.8 m/s or 2.9 m/s, to provide guidance for practical operations.

3.5. The Deposition Results of a Real Flight

The deposition results of the six flight tests are shown in Figure 13. The deposition results of the artificial empirical method inside the forest area are shown as Flight 1, Flight 3, and Flight 5 in Figure 13a, respectively. The three flights corresponded to wind speeds of 2 m/s, 1 m/s, and 2.5 m/s, respectively. At a wind speed of 1 m/s, the average deposition in the safe area and the edge area was 15.46 mg/m2 and 15.53 mg/m2, respectively. However, the deposition in the safe area showed a decreasing trend when the wind speed increased to 14.51 mg/m2 (2 m/s) and 13.84 mg/m2 (2.5 m/s), decreasing by 6.14% and 10.48%, respectively. The deposition in the edge area also tended to decrease with increasing wind speed. When the wind speed was 14.78 mg/m2 (2 m/s) and 15.41 mg/m2 (2.5 m/s), the deposition decreased by 4.83% and 0.77%, respectively. This is consistent with the previously obtained conclusion that the average deposition shows a decreasing trend with increasing wind speed for the same operational parameters. However, when comparing the deposition in the safe and edge areas under the same operational parameters, it was found that the difference increased when the wind speed increased. When the wind speed was 1 or 2 m/s, there was almost no difference between the deposition in the safe area and the edge area, but when the wind speed was 2.5 m/s, the deposition in the edge area (15.41 mg/m2) was significantly larger than that in the safe area (13.84 mg/m2), which increased by 11.34%. This may be due to the influence of the ambient wind that the pesticide droplets are subjected to; as the wind speed increases, the amount of pesticide droplet deposition that drifts from the safe area to the edge area increases, resulting in an increase in the safe area and the edge area. Moreover, when the wind speed increased, there was an increase in the difference between the deposition in the safe area and the edge area when operating under the same application parameters. This is unfavorable for forestry applications. Therefore, it is inferred that it is difficult to ensure the efficient and stable deposition of pesticides in the forest area if the application parameters are not properly adjusted according to the ambient wind speed.
Further analysis of the deposition effect in the forest area during the new operation is shown for Flight 2, Flight 4, and Flight 6 in Figure 13a, respectively (see Table 2). A comparison of deposition shows that the new strategy results in higher deposition in both safe and edge areas. In the safe and edge areas, Flight 2 increased the average deposition by 4.82% and 7.04% compared to Flight 1, Flight 4 increased the average deposition by 0.91% and 0.90% compared to Flight 3, and Flight 6 increased the average deposition by 8.24% and 1.04% compared to Flight 5, respectively. At lower wind speeds, when operating according to the new strategy, the difference in deposition between the safe and edge areas was not significantly different from that obtained with the artificial empirical method. However, when wind speeds were higher, the difference in deposition between the safe and edge areas was reduced, decreasing from 1.57 mg/m2 during Flight 5 to 0.59 mg/m2 during Flight 6. This indicates that operating according to the new strategy (Flights 2, 4, and 6) can effectively control the deposition of pesticides inside the forest area, reducing the difference in deposition between the safe and edge areas. When optimizing the operating parameters, the average deposition was kept above 14.90 mg/m2, and the results of the experiments showed that the expected results were achieved.
A comparison of pesticide uniformity is shown in Figure 13b. From the figure, it can be observed that when wind speed is low, the uniformity of pesticide application becomes worse. A comparison reveals that the coefficients of variation for Flight 2, Flight 4, and Flight 6 (new strategy) all slightly increase compared to Flight 1, Flight 3, and Flight 5 (artificial empirical method). This is because, as discussed earlier, uniformity and deposition are two conflicting objectives. In this study, when optimizing the operational parameters, an attempt was made to achieve a balance between the amount of pesticide applied and uniformity. Hence, a slight reduction in uniformity was made to enhance the average deposition while attempting to keep the coefficients of variation below 0.3. (0.3 is our expected threshold). From the figure, it can be seen that the coefficient of variation (CV) for the edge area during Flight 4 is the highest at 0.278, which is below 0.3, achieving the intended goal. This indicates that during actual operations, following the flight height and speed matching chart proposed in this study, it is possible to predict the desired deposition and uniformity inside the forest area after pesticide application, achieving a “foreknowledge” effect. Consequently, both deposition and uniformity after pesticide application are within the expected range, which is crucial for achieving precision spraying.
The deposition of aerial operations outside the forest area was further analyzed. It was expected that the deposition at 50 m downwind would not exceed 5.1 mg/m2 when optimizing the operational parameters. As seen in Figure 13c, the average deposition at 50 m downwind was significantly lower than that obtained with the manual empirical method under the new strategy. The downwind deposition is more than 5.5 mg/m2 for the manual empirical method, and the downwind deposition can be as high as 6.64 mg/m2 and 6.55 mg/m2 for wind speeds of 2 m/s and 2.5 m/s. The downwind deposition at 50 m downwind for Flight 2 was 25% lower than that for Flight 1, and that for Flight 4 was 25% lower than that for Flight 3, while that for Flight 4 was 25% lower than that for Flight 3. When using the recommended operating parameters, the downwind 50 m deposition of Flight 2 was 25% lower than that of Flight 1, that of Flight 4 was 16.58% lower than that of Flight 3, and that of Flight 6 was 22.90% lower than that of Flight 5. For all three flights, the downwind deposition was stable at about 5.0 mg/m2 according to the new strategy, which indicates that the downwind deposition does not increase significantly with the increase in wind speed, which is not the case for the artificial empirical method. This indicates that the deposition of pesticides outside the forest area can be effectively controlled by referring to the aerial height and speed matching map to adapt to different wind speed changes.
Further analysis was conducted on the deposition of aerial operations outside the forest area. It was desired that the deposition at 50 m downwind would not exceed 5.1 mg/m2 during the optimization of operational parameters. From Figure 13c, it can be observed that when employing the new strategy, the average deposition at 50 m downwind was significantly lower compared to using the artificial empirical method. With the artificial empirical method, the deposition downwind exceeded 5.5 mg/m2. During operations with wind speeds of 2 m/s and 2.5 m/s, the deposition at 50 m downwind can reach 6.64 mg/m2 and 6.55 mg/m2, respectively. However, when using the new strategy, the deposition at 50 m downwind for Flight 2 decreased by 25% compared to that of Flight 1, that of Flight 4 decreased by 16.58% compared to that of Flight 3, and that of Flight 6 decreased by 22.90% compared to that of Flight 5. All three flights showed stable downwind deposition (5.0 mg/m2) with the new strategy. Unlike for the artificial empirical method, wind speed increases did not elevate deposition. This suggests that by consulting the flight height and speed matching chart, the deposition of pesticides outside the forest area can be effectively controlled to adapt to different wind speed variations.
In summary, the new strategy can ensure the stable and uniform deposition of pesticide application by a helicopter in a forest and effectively control the drift of the droplets outside the forest area regardless of the change in wind speed. This is of great significance for improving the effect of insect control, reducing off-target environmental concentrations and realizing precise pesticide application. Moreover, the method used in this paper only regulates the operating parameters and does not increase other pest control costs, such as the amount of pesticide spraying and the number of laborers.

4. Discussion

4.1. Comparison of AGDISP Model Predictions and Experimental Results

The experimental conditions were simulated using the AGDISP, and the predictions were compared with field measurements. Flights 1, 3, and 5 were selected for comparison as they maintained a consistent flight height and speed throughout the test area, which facilitated accurate AGDISP simulations. The statistical results are presented in Table 3. The key findings include the following: For the deposition amount (AD), the predicted values were consistently approximately 8% higher than the measured values. The coefficient of variation (CV) showed prediction errors ranging from 10% to 30%. The droplet size (D50) predictions demonstrated errors of between 10% and 15%.
Based on our team’s extensive experience with aerial application research, these error ranges are considered acceptable given the complex experimental conditions involved in aerial spraying operations. The results confirm that the AGDISP provides reliable predictions for both droplet deposition and drift patterns in aerial application scenarios.

4.2. Comparative Analysis of Machine Learning Prediction Models

We employed multiple machine learning algorithms for regression prediction [36,37,38,39,40,41,42,43,44]. Due to space constraints, detailed descriptions of each algorithm are omitted here. As shown in Table 4, the WOA-BP outperformed other models in predicting AD, CV, and D50.
The high prediction accuracy of WOA-BP is critical for constructing our flight parameter-matching charts (Figure 10 and Figure 11), which can provide more precise operational guidance for helicopters spraying pesticides.

4.3. Superiority over Existing Application Route Planning Methods

Currently, helicopter pesticide spraying relies solely on experience to determine the flight and speed of the spraying route. Before spraying, the effectiveness of the operational parameters is often unclear to the operators. Height and speed are not flexibly adjusted according to changes in wind speed. Moreover, existing spraying routes loosely reference path planning on farmland, remaining at the “geometric planning” level, often pursuing complete coverage of the route while ignoring the objective reality that helicopter operations can reach up to 8 m above crop canopy height. During the process of pesticide dispersion from the helicopter to the canopy, environmental wind has a significant impact, leading to the potential drift of spray droplets. This phenomenon is evident from the experimental results in Figure 13c, where using traditional uniform height and speed operations, Flight 5 (2.5 m/s) exhibited a 9.91% increase in downwind deposition compared to Flight 3 (1 m/s), indicating an increase in downwind deposition with higher wind speeds.
This study proposes an almost cost-neutral method through the rational matching of flight height and speed to achieve more precise deposition onto the canopy surface for better spraying effectiveness while maintaining full coverage of the route. By innovatively dividing the spraying area into two subzones, a safe area and an edge area, this approach prioritizes ensuring an accurate deposition amount and uniformity in the safe area while prioritizing reducing downwind deposition in the edge area, thus achieving precise pesticide deposition in the forest and enhancing the ecological safety of aerial spraying. The results from Figure 13c indicate that, with the new strategy, there were no significant differences in downwind deposition for Flight 2 (2 m/s), Flight 4 (1 m/s), and Flight 6 (2.5 m/s), demonstrating the effective control of spray droplet drift.
Another significant contribution of this study is the introduction of a flight height and speed matching chart. Forestry pesticide applicators can quickly match flight height and speed based on their expected spraying effects according to this chart, thereby minimizing the impact of environmental wind speed on spray drift to the lowest possible extent.

4.4. Limitations and Research Outlook

This article presents a flight height and speed matching chart obtained under conditions where the slope in forest areas, the helicopter model, the boom length, the pesticide type, the application rate, the nozzle pressure, the nozzle model, and the quantity are all predetermined. When these conditions change, the flight height and speed matching chart may vary, requiring the use of the methodology outlined in this article to construct a new flight height and speed matching chart.
In the application scenario of this article, the environmental wind speed is perpendicular to the spraying route, representing a situation where spray drift is most severe under crosswind conditions. However, in actual spraying processes, the spraying route is not always perpendicular to the environmental wind speed. If helicopter aerial spraying can meet the lower limit of deposition in the forest area and the upper limit of deposition 50 m downwind under these extreme conditions, then it can easily meet these requirements when the environmental wind speed and spraying route are at different angles.
Future route planning could further consider issues such as bypassing obstacles like power lines and military-restricted areas, as well as optimizing the positions of valves in the spraying system. These considerations also hold significant research value.

5. Conclusions

In order to enable manned helicopter aerial spraying to deposit pesticides more accurately within forest areas and reduce drift outside the target zone, this study proposes a novel spraying strategy on top of comprehensive route planning. A flight height and speed matching chart is designed to quickly determine the appropriate flight height and speed. Six helicopter aerial spraying trials were conducted, comparing the new strategy with the artificial empirical method. The results showed an increase in deposition within safe areas by 4.82%, 0.91%, and 8.24% and in edge areas by 7.04%, 0.90%, and 0.77%, respectively. The uniformity of spraying remained below the expected 0.3. Pesticide deposition at 50 m downwind decreased by 25.00%, 16.58%, and 22.90%, respectively. This fully confirms that the new strategy ensures deposition and uniformity within and outside the forest area within the expected range, achieving the synergistic optimization goal of moderate deposition and uniformity within the forest area and reduced deposition outside the forest area.
This research expands on our current understanding of spraying route planning, which traditionally relies solely on terrain geometry. It provides a solid theoretical basis for setting flight heights and speeds under different environmental wind conditions. We believe the proposed solution will be of considerable value for forest pest control and can serve as an important reference for smart forestry initiatives.

Author Contributions

S.F.: conceptualization, methodology, investigation, writing—original draft, resources, supervision, resources; Y.R.: formal analysis, funding acquisition; N.W.: data curation, formal analysis; L.C.: software, data curation, validation; X.J.: visualization, writing—review and editing; L.S.: resources, investigation, validation; Y.L.: formal analysis, funding acquisition, project administration. All authors have read and agreed to the published version of the manuscript.

Funding

This research was funded by the state scholarship fund granted by the China Scholarship Council grant number (202008320017), the National Natural Science Foundation of China (32401687), the Key Projects of Scientific Research in Higher Educational Institutions in Anhui Province (2023AH051857), and the talent introduction project of Anhui Science and Technology University (230065) and Projects commissioned by companies (20240732).

Data Availability Statement

The data are available from the corresponding author upon reasonable request.

Acknowledgments

We gratefully acknowledge Jiangsu Ningxiang General Aviation Company for providing the R44 helicopter, the Chinese government for flight authorization, and the reviewers/editors for their constructive feedback.

Conflicts of Interest

The authors declare no conflicts of interest.

References

  1. Chen, C.; Park, T.; Wang, X.; Piao, S.; Xu, B.; Chaturvedi, R.K.; Fuchs, R.; Brovkin, V.; Ciais, P.; Fensholt, R.; et al. China and India lead in greening of the world through land-use management. Nat. Sustain. 2019, 2, 122–129. [Google Scholar] [CrossRef] [PubMed]
  2. Fang, S.; Ru, Y.; Liu, Y.; Hu, C.; Chen, X.; Liu, B. Route Planning of Helicopters Spraying Operations in Multiple Forest Areas. Forests 2021, 12, 1658. [Google Scholar] [CrossRef]
  3. Zhan, Y.; Chen, P.; Xu, W.; Chen, S.; Han, Y.; Lan, Y.; Wang, G. Influence of the downwash airflow distribution characteristics of a plant protection UAV on spray deposit distribution. Biosyst. Eng. 2022, 216, 32–45. [Google Scholar] [CrossRef]
  4. Zhang, A.; Xu, L.; Jin, J.; Wu, Y.; Wang, Y. Analysis of pulse combustion processes and thermodynamic cycles in pulse combustors. Exp. Therm. Fluid Sci. 2024, 151, 111104. [Google Scholar] [CrossRef]
  5. Dubuis, P.; Droz, M.; Melgar, A.; Zürcher, U.A.; Zarn, J.A.; Gindro, K.; König, S.L.B. Environmental, bystander and resident exposure from orchard applications using an agricultural unmanned aerial spraying system. Sci. Total Environ. 2023, 881, 163371. [Google Scholar] [CrossRef] [PubMed]
  6. Hilz, E.; Vermeer, A.W.P. Spray drift review: The extent to which a formulation can contribute to spray drift reduction. Crop Prot. 2013, 44, 75–83. [Google Scholar] [CrossRef]
  7. Teske, M.E.; Thistle, H.W.; Schou, W.C.; Miller, P.C.H.; Strager, J.M.; Richardson, B.; Ellis, M.C.B.; Barry, J.W.; Twardus, D.B.; Thompson, D.G. A Review of Computer Models for Pesticide Deposition Prediction. Trans. ASABE 2011, 54, 789–801. [Google Scholar] [CrossRef]
  8. Wang, C.; Herbst, A.; Zeng, A.; Wongsuk, S.; Qiao, B.; Qi, P.; Bonds, J.; Overbeck, V.; Yang, Y.; Gao, W.; et al. Assessment of spray deposition, drift and mass balance from unmanned aerial vehicle sprayer using an artificial vineyard. Sci. Total Environ. 2021, 777, 146181. [Google Scholar] [CrossRef]
  9. Yao, W.; Guo, S.; Wang, J.; Chen, C.; Yu, F.; Li, X.; Xu, T.; Lan, Y. Droplet deposition and pest control efficacy on pine trees from aerial application. Pest Manag. Sci. 2022, 78, 3324–3336. [Google Scholar] [CrossRef]
  10. Hewitt, A.J. Spray optimization through application and liquid physical property variables—I. Environmentalist 2008, 28, 25–30. [Google Scholar] [CrossRef]
  11. Valcore, D.L. Spray optimization through application and liquid physical property variables—II. Environmentalist 2008, 28, 31–33. [Google Scholar] [CrossRef]
  12. Lan, Y.; Shan, C.; Wang, Q.; Liu, Q.; Yang, C.; Xie, Y.; Wang, G. Effects of different spray additives on droplet deposition characteristics during plant protection UAV spraying operations. Trans. Chin. Soc. Agric. Eng. (Trans. CSAE) 2021, 37, 31–38. [Google Scholar] [CrossRef]
  13. Torres, M.; Pelta, D.A.; Verdegay, J.L.; Torres, J.C. Coverage path planning with unmanned aerial vehicles for 3D terrain reconstruction. Expert Syst. Appl. 2016, 55, 441–451. [Google Scholar] [CrossRef]
  14. Nanavati, R.V.; Meng, Y.; Coombes, M.; Liu, C. Generalized data-driven optimal path planning framework for uniform coverage missions using crop spraying UAVs. Precis. Agric. 2023, 24, 1497–1525. [Google Scholar] [CrossRef]
  15. Xu, Y.; Sun, Z.; Xue, X.; Gu, W.; Peng, B. A hybrid algorithm based on MOSFLA and GA for multi-UAVs plant protection task assignment and sequencing optimization. Appl. Soft Comput. 2020, 96, 106623. [Google Scholar] [CrossRef]
  16. Fang, S.; Ru, Y.; Hu, C.; Yang, F.; Xue, J.; Zhou, J. Planning the temporary takeoff/landing site’s location for a pesticide spraying helicopter based on an intelligent fusion algorithm. Comput. Electron. Agric. 2023, 209, 107826. [Google Scholar] [CrossRef]
  17. Lakshmanan, A.K.; Mohan, R.E.; Ramalingam, B.; Le, A.V.; Veerajagadeshwar, P.; Tiwari, K.; Ilyas, M. Complete coverage path planning using reinforcement learning for Tetromino based cleaning and maintenance robot. Autom. Constr. 2020, 112, 103078. [Google Scholar] [CrossRef]
  18. Utamima, A.; Reiners, T. Navigating route planning for multiple vehicles in multifield agriculture with a fast hybrid algorithm. Comput. Electron. Agric. 2023, 212, 108021. [Google Scholar] [CrossRef]
  19. Ansari Ardeh, M.; Mei, Y.; Zhang, M. Genetic Programming With Knowledge Transfer and Guided Search for Uncertain Capacitated Arc Routing Problem. IEEE Trans. Evol. Comput. 2022, 26, 765–779. [Google Scholar] [CrossRef]
  20. Kyriakakis, N.A.; Marinaki, M.; Marinakis, Y. A hybrid ant colony optimization-variable neighborhood descent approach for the cumulative capacitated vehicle routing problem. Comput. Oper. Res. 2021, 134, 105397. [Google Scholar] [CrossRef]
  21. Bilanin, A.J.; Teske, M.E.; Barry, J.W.; Ekblad, R.B. Agdisp: The aircraft spray dispersion model, code development and experimental validation. Trans. ASAE 1989, 32, 0327–0334. [Google Scholar] [CrossRef]
  22. Teske, M.E.; Thistle, H.W.; Fritz, B.K. Modeling Aerially Applied Sprays: An Update to AGDISP Model Development. Trans. ASABE 2019, 62, 343–354. [Google Scholar] [CrossRef]
  23. Robinson, R.C.; Parsons, R.G.; Barbe, G.; Patel, P.T.; Murphy, S. Drift control and buffer zones for helicopter spraying of bracken (Pteridium aquilinum). Agric. Ecosyst. Environ. 2000, 79, 215–231. [Google Scholar] [CrossRef]
  24. Ahmad, F.; Qiu, B.; Dong, X.; Ma, J.; Huang, X.; Ahmed, S.; Chandio, F.A. Effect of operational parameters of UAV sprayer on spray deposition pattern in target and off-target zones during outer field weed control application. Comput. Electron. Agric. 2020, 172, 105350. [Google Scholar] [CrossRef]
  25. Craig, I.P. The GDS model—A rapid computational technique for the calculation of aircraft spray drift buffer distances. Comput. Electron. Agric. 2004, 43, 235–250. [Google Scholar] [CrossRef]
  26. Hoffmann, W.C.; Kirk, I.W. Spray Deposition and Drift from Two “Medium” Nozzles. Trans. ASAE 2005, 48, 5–11. [Google Scholar] [CrossRef]
  27. Ru, Y.; Fang, S.; Xue, J.; Hu, C.; Zhou, J. Experimental study of the influence factors of the droplet size of rotary nozzles during manned helicopter spraying operations. Crop Prot. 2024, 177, 9. [Google Scholar] [CrossRef]
  28. Yao, W.; Lan, Y.; Wang, J.; Wen, S.; Wang, G.; Chen, S. Droplet drift characteristics of aerial spraying of AS350B3e helicopter. Trans. Chin. Soc. Agric. Eng. (Trans. CSAE) 2017, 33, 75–83. [Google Scholar] [CrossRef]
  29. Lv, Z.; Niu, D.; Li, S.; Sun, H. Multi-surrogate assisted PSO with adaptive speciation for expensive multimodal multi-objective optimization. Appl. Soft Comput. 2023, 147, 110724. [Google Scholar] [CrossRef]
  30. Tang, X.; Liu, H.; Feng, D.; Zhang, W.; Chang, J.; Li, L.; Yang, L. Prediction of field winter wheat yield using fewer parameters at middle growth stage by linear regression and the BP neural network method. Eur. J. Agron. 2022, 141, 126621. [Google Scholar] [CrossRef]
  31. Zhang, Y.; Cui, N.; Feng, Y.; Gong, D.; Hu, X. Comparison of BP, WOA-BP and statistical models for predicting daily global solar radiation in arid Northwest China. Comput. Electron. Agric. 2019, 164, 104905. [Google Scholar] [CrossRef]
  32. Mirjalili, S.; Lewis, A. The Whale Optimization Algorithm. Adv. Eng. Softw. 2016, 95, 51–67. [Google Scholar] [CrossRef]
  33. Shuping, F.; Yu, R.; Chenming, H.; Fengbo, Y. Planning of takeoff/landing site location, dispatch route, and spraying route for a pesticide application helicopter. Eur. J. Agron. 2023, 146, 126814. [Google Scholar] [CrossRef]
  34. Zhu, H.; Salyani, M.; Fox, R.D. A portable scanning system for evaluation of spray deposit distribution. Comput. Electron. Agric. 2011, 76, 38–43. [Google Scholar] [CrossRef]
  35. Zhou, H.; Huang, S.; Zhang, P.; Ma, B.; Ma, P.; Feng, X. Prediction of jacking force using WOA-BPNN and PSO-SVR algorithm in curved pipe roof. Tunn. Undergr. Space Technol. 2023, 138, 105159. [Google Scholar] [CrossRef]
  36. Calou, V.B.C.; Teixeira, A.D.S.; Moreira, L.C.J.; Lima, C.S.; de Oliveira, J.B.; de Oliveira, M.R.R. The use of UAVs in monitoring yellow sigatoka in banana. Biosyst. Eng. 2020, 193, 115–125. [Google Scholar] [CrossRef]
  37. Dong, R.; Miao, Y.; Berry, P.; Wang, X.; Yuan, F.; Kusnierek, K.; Baker, C.; Sterling, M. In-season prediction of maize stem lodging risk using an active canopy sensor. Eur. J. Agron. 2023, 151, 126956. [Google Scholar] [CrossRef]
  38. Gao, R.; Tao, J.; Zhang, J.; Ma, L.; Xu, M. NSGA-III-SD based Fuzzy energy management system optimization for lithium battery/supercapacitor HEV. Appl. Soft Comput. 2023, 142, 110280. [Google Scholar] [CrossRef]
  39. Deb, K.; Jain, H. An Evolutionary Many-Objective Optimization Algorithm Using Reference-Point-Based Nondominated Sorting Approach, Part I: Solving Problems With Box Constraints. IEEE Trans. Evol. Comput. 2014, 18, 577–601. [Google Scholar] [CrossRef]
  40. Kok, Z.H.; Mohamed Shariff, A.R.; Alfatni, M.S.M.; Khairunniza-Bejo, S. Support Vector Machine in Precision Agriculture: A review. Comput. Electron. Agric. 2021, 191, 106546. [Google Scholar] [CrossRef]
  41. Okoji, A.I.; Okoji, C.N.; Awarun, O.S. Performance evaluation of artificial intelligence with particle swarm optimization (PSO) to predict treatment water plant DBPs (haloacetic acids). Chemosphere 2023, 344, 140238. [Google Scholar] [CrossRef] [PubMed]
  42. Speiser, J.L.; Miller, M.E.; Tooze, J.; Ip, E. A comparison of random forest variable selection methods for classification prediction modeling. Expert Syst. Appl. 2019, 134, 93–101. [Google Scholar] [CrossRef] [PubMed]
  43. Wang, S.; Zhang, N.; Wu, L.; Wang, Y. Wind speed forecasting based on the hybrid ensemble empirical mode decomposition and GA-BP neural network method. Renew. Energy 2016, 94, 629–636. [Google Scholar] [CrossRef]
  44. Wang, Y.; Wang, G.; Yao, G.; Shen, Q.; Yu, X.; He, S. Combining GA-SVM and NSGA-III multi-objective optimization to reduce the emission and fuel consumption of high-pressure common-rail diesel engine. Energy 2023, 278, 127965. [Google Scholar] [CrossRef]
Figure 1. R44 pesticide-spraying helicopter and spraying application scenarios in AGDISP.
Agronomy 15 01129 g001
Figure 2. AGDISP input interface and output map. (a) AGDISP input interface; (b) AGDISP output map.
Agronomy 15 01129 g002
Figure 3. Flowchart of droplet deposition data processing based on WOA-BP.
Agronomy 15 01129 g003
Figure 4. Schematic diagram of the delineation of application forest areas. (a) Regulated forest area; (b) irregular forest area.
Agronomy 15 01129 g004
Figure 5. Test program and site. (a) Arrangement of test site; (b) arrangement of water-sensitive paper; (c) water-sensitive paper after sampling; (d) rotary nozzle installation; (e) application equipment; (f) helicopter application site; (g) arrangement of the weather station; (h) ground monitoring; (i) on-board Pad monitoring; (j) on-board mobile phone monitoring. Note: 1. pump; 2. aerial nozzle; 3. spray boom; 4. pesticide tank; 5. ground monitoring computer; 6. R44 helicopter; 7. water-sensitive paper holder; 8. water-sensitive paper; 9. water-sensitive paper after sampling; 10. rotary nozzle; 11. flow control valves; 12. weather station; 13. ground monitoring display interface; 14. on-board Pad display interface; 15. on-board mobile phone monitoring.
Agronomy 15 01129 g005
Figure 6. The effect of analyzing the data curve in the image.
Agronomy 15 01129 g006
Figure 7. Comparison of WOA-BP predicted and target values for the three objectives.
Agronomy 15 01129 g007
Figure 8. Variation in AD with fight height and speed.
Agronomy 15 01129 g008
Figure 9. Variation in CV with fight height and speed.
Agronomy 15 01129 g009
Figure 10. Variation in D50 with fight height and speed.
Agronomy 15 01129 g010
Figure 11. Matching chart of flight height and speed under different ambient wind speeds in the safe area. (a) Wind speed at 1 m/s; (b) wind speed at 2 m/s; (c) wind speed at 2.5 m/s; (d) wind speed at 3 m/s.
Agronomy 15 01129 g011
Figure 12. Matching chart of flight height and speed under different ambient wind speeds in the edge area. (a) Wind speed at 1 m/s; (b) wind speed at 2 m/s; (c) wind speed at 2.5 m/s; (d) wind speed at 3 m/s.
Agronomy 15 01129 g012aAgronomy 15 01129 g012b
Figure 13. Analysis of real flight test results. (a) Deposition in forested areas; (b) coefficient of variation of deposition in forested areas; (c) deposition at 50 m downwind.
Agronomy 15 01129 g013
Table 1. Test factor level.
FactorLevel
Flight   speed   v (m/s)20, 25, 30, 35, 40, 45
Flight   height   H (m)3, 4, 5, 6, 7, 8
Wind speed Ws (m/s)0.5, 1, 1.5, 2, 2.5, 3
Table 2. Table of actual flight operation parameters.
Flight NumberDateMethodWind Speed (m/s)Wind DirectionSafe AreaEdge Area
Flight Height (m)Flight Speed (km/h)Flight Height (m)Flight Speed (km/h)
121 October 2023Artificial empirical method2South9.2 (9.5)100 (102)9.2 (9.3)100 (102.1)
221 October 2023New strategy2South7.6 (7.8)126 (127.5)6.7 (6.9)99 (99.5)
328 October 2023Artificial empirical method1Northeast wind9.2 (9.6)100 (101.3)9.2 (9.5)100 (101.2)
428 October 2023New strategy1Northeast wind8.4 (8.5)135 (136.1)7.8 (7.9)108 (109.5)
510 November 2023Artificial empirical method2.5Northeast wind9.2 (9.4)100 (99.9)9.2 (9.3)100 (101.5)
610 November 2023New strategy2.5Northeast wind7.4 (7.8)108 (108.3)6.7 (6.8)90 (90.5)
Note: the data in parentheses are the actual flight speed and actual flight heights at the time of the experiment. The data on the left side of the parentheses are the set flight speeds and flight heights.
Table 3. Comparison of AGDISP model predictions and experimental results.
Flight NumberAD (mg/m2) CVD50 (mg/m2)
AGDISPExperimentErrorAGDISPExperimentErrorAGDISPExperimentError
Flight 115.9814.65 8.31%0.050.06 20.66%7.53 6.64 11.76%
Flight 316.9515.49 8.59%0.180.20 12.82%6.64 5.97 10.17%
Flight 515.8814.62 7.91%0.070.09 26.13%7.56 6.55 13.31%
Table 4. Different machine learning models used to build predictive models.
Machine Learning AlgorithmsR2 (AD)R2 (CV)R2 (D50)
MLR0.93020.89190.9030
BP0.99710.99620.9831
GA-BP0.99770.99880.9973
WOA-BP0.99940.99970.9993
ELM0.99820.99560.9895
RBF0.96720.93020.6259
SVR0.99770.99630.9961
RF0.81160.83720.8907
Note: MLR represents multiple linear regression; BP stands for BP neural network; GA-BP stands for the BP neural network optimized based on the genetic algorithm; ELM stands for extreme learning machine; RBF stands for radial basis neural network; SVR stands for support vector machine regression; and RF stands for random forest regression.
Disclaimer/Publisher’s Note: The statements, opinions and data contained in all publications are solely those of the individual author(s) and contributor(s) and not of MDPI and/or the editor(s). MDPI and/or the editor(s) disclaim responsibility for any injury to people or property resulting from any ideas, methods, instructions or products referred to in the content.

