Article

Detection of Leaf Miner Infestation in Chickpea Plants Using Hyperspectral Imaging in Morocco

by
Mohamed Arame
1,2,*,
Issam Meftah Kadmiri
1,
Francois Bourzeix
2,
Yahya Zennayi
2,
Rachid Boulamtat
3 and
Abdelghani Chehbouni
4
1
Department of Plant, Biotechnology and Soil Sciences (PBS), Mohammed VI Polytechnic University (UM6P), Benguerir 43150, Morocco
2
Analytics-Lab, Mohammed VI Polytechnic University (UM6P), Rabat 43150, Morocco
3
Department of Entomology, International Center for Agricultural Research in the Dry Areas (ICARDA), Rabat P.O. Box 6299, Morocco
4
Center for Remote Sensing Applications (CRSA), Mohammed VI Polytechnic University (UM6P), Benguerir 43150, Morocco
*
Author to whom correspondence should be addressed.
Agronomy 2025, 15(5), 1106; https://doi.org/10.3390/agronomy15051106
Submission received: 26 March 2025 / Revised: 17 April 2025 / Accepted: 20 April 2025 / Published: 30 April 2025
(This article belongs to the Topic Digital Agriculture, Smart Farming and Crop Monitoring)

Abstract

:
This study addresses the problem of early detection of leaf miner infestations in chickpea crops, a significant agricultural challenge. It is motivated by the potential of hyperspectral imaging, once properly combined with machine learning, to enhance the accuracy of pest detection. Originality consists of the application of these techniques to chickpea plants in controlled laboratory conditions using a natural infestation protocol, something not previously explored. The two major methodologies adopted in the approach are as follows: (1) spectral feature-based classification using hyperspectral data within the 400–1000 nm range, wherein a random forest classifier is trained to classify a plant as healthy or infested with eggs or larvae. Dimensionality reduction methods such as principal component analysis (PCA) and kernel principal component analysis (KPCA) were tried, and the best classification accuracies (over 80%) were achieved. (2) VI-based classification, leveraging indices associated with plant health, such as NDVI, EVI, and GNDVI. A support vector machine and random forest classifiers effectively classified healthy and infested plants based on these indices, with over 81% classification accuracies. The main objective was to design an integrated early pest detection framework using advanced imaging and machine learning techniques. Results show that both approaches have resulted in high classification accuracy, highlighting the potential of this approach in precision agriculture for timely pest management interventions.

1. Introduction

Chickpea is a member of the Fabaceae family of legumes. It is consumed as a dry pulse or as a green vegetable [1]. In Morocco, its culture is mainly in the northern provinces around Meknes and Sidi Kacem. This legume is known to possess high nutritional value and is considered among the healthiest sources of vegetable protein [2,3,4]. Chickpeas are brownish yellow in color and a bit larger compared to common peas. Considering recent reports, the total area under chickpea cultivation in Morocco is estimated to be from 50,000 to 80,000 hectares [5]. This legume grows optimally under warm, humid conditions. There are two main varieties of chickpeas, desi chickpeas and kabuli chickpeas. Classification is based on color, thickness, seed size, and tegument shape [5,6]. However, despite its importance, chickpea farming in Morocco faces severe yield losses due to pests, diseases, and drought stress [7,8,9].
Among the major pests which have an adverse effect on chickpea production is the leaf miner (Liriomyza spp.) [10,11]. Leaf miners are tiny larvae which are hidden in the plant tissue, creating some visible tunnels or “mines” during the build-up of the plant tissue. These mines interfere with the photosynthesis of the plant, thereby decreasing the plant’s health, the final yields being lower than projected, and, in the most serious cases, the plants die. The life cycle of leaf miners is mainly divided into four development stages: egg, larva, pupa, and adult stages. Knowledge of these stages is crucial for proper monitoring and infestation control measures in the plants of chickpea grain [10,11]. The egg stage typically lasts 2–5 days, depending on environmental conditions. The larval stage, which causes the most damage to plants by feeding and creating mines, lasts about 5–15 days. This is followed by the pupal stage, which generally takes 7–14 days, during which the insect undergoes metamorphosis. Finally, the adult stage spans approximately 10–15 days, during which the insect reproduces and lays eggs to continue the cycle. The effect of leaf miners is not only direct but also indirect, as the mine can act as an entry point for secondary pathogens causing the disease [12].
Controlling leaf miners requires the adoption of effective and sustainable methods, especially in chickpea crops, where infestations can cause severe damage to yield and quality [13,14]. Traditional approaches, including visual assessments and the quantification of the number of mines visible on leaves, are imprecise by nature. They are very time-consuming, laborious, and highly subjective, often leading to variable results. Moreover, by the time that visible symptoms are detected, the infestation is likely to have progressed significantly, thus making control measures less effective and more resource-demanding [15,16,17]. Early detection is paramount in the implementation of targeted pest management strategies; however, conventional methods are inefficient at detecting the early physiological changes in plants induced by pest activity [18,19]. Similarly, although RGB imaging represents an improvement over manual visual assessment for pest detection [20,21], its effectiveness in agricultural applications, such as controlling leaf miners, remains limited. RGB imaging relies on three broad spectral bands (red, green, and blue), which lack the sensitivity to detect subtle changes in plant physiology and early pest infestations [17,22]. These limitations translate into lower accuracy in detecting early stress symptoms compared with advanced imaging methods. Research indicates that RGB-based systems often face challenges such as occlusions and variations in lighting conditions, which can compromise detection accuracy, particularly in complex agricultural environments [23,24]. These systems are better suited to macroscopic tasks such as plant counting than to nuanced pest or disease detection, for which finer spectral resolution is essential. Hyperspectral imaging (HSI) fills these gaps by capturing detailed reflectance data over hundreds of narrow spectral bands, enabling the identification of specific physiological changes caused by pests. Unlike RGB imaging, HSI provides spectral fingerprints of plant health, which make it the ideal choice for sustainable pest management strategies.
Hyperspectral imaging has, over the years, greatly improved its applications in agriculture, most specifically in detecting the early signs of pest and disease stress in plants. Hyperspectral imaging captures full spectral information across a very wide wavelength range, allowing the detection of subtle physiological changes well before visible symptoms appear. This is an important technology for effective interventions in pest control. Hyperspectral techniques, for instance, have demonstrated efficacy in detecting plant stress attributable to pests and diseases, thereby providing a significant tool for precision agriculture [25]. Furthermore, studies have integrated Hyperspectral Imaging (HSI) with methodologies such as wavelet analysis to classify stress. This is exemplified in tea plants, where key spectral features associated with insect stress were successfully identified [26]. Further research has covered the use of hyperspectral indices, like the normalized difference vegetation index and red edge index, for real-time pest and pathogen stress monitoring to give high accuracy in detection using machine learning techniques [27]. Among these insects, leaf miners are considered important due to their burrowing habit into leaves, which interferes with photosynthesis. Research on remote sensing of leaf miner infestations in urban forests has shown that vegetation indices indicative of leaf miner damage can be detected with hyperspectral cameras well before symptoms are visible. This offers the possibility of timely pest control [28]. Put together, these results highlight the strong potential for hyperspectral imaging to further enhance agricultural monitoring and pest management practices.
This work explores the feasibility of applying advanced remote sensing technologies, specifically hyperspectral imaging (HSI) combined with established machine learning algorithms, for early pest detection in chickpea crops. The goal is to develop a rapid, non-destructive, and accurate method to support timely agricultural decision-making. Traditional pest detection methods are time-consuming, labor-intensive, and subjective, which limit timely and effective pest control interventions. These limitations highlight the need for more efficient and precise methods, such as HSI, to address pest detection challenges in real field conditions. While previous studies have demonstrated the potential of HSI in agriculture, most have focused on other crops or employed artificial infestation conditions. This study addresses that gap by assessing how well hyperspectral imaging and machine learning algorithms can identify subtle spectral changes associated with different chickpea crop health statuses, healthy, egg-infested, and larval-infested, for the early pest detection in natural infestation conditions.

2. Materials and Methods

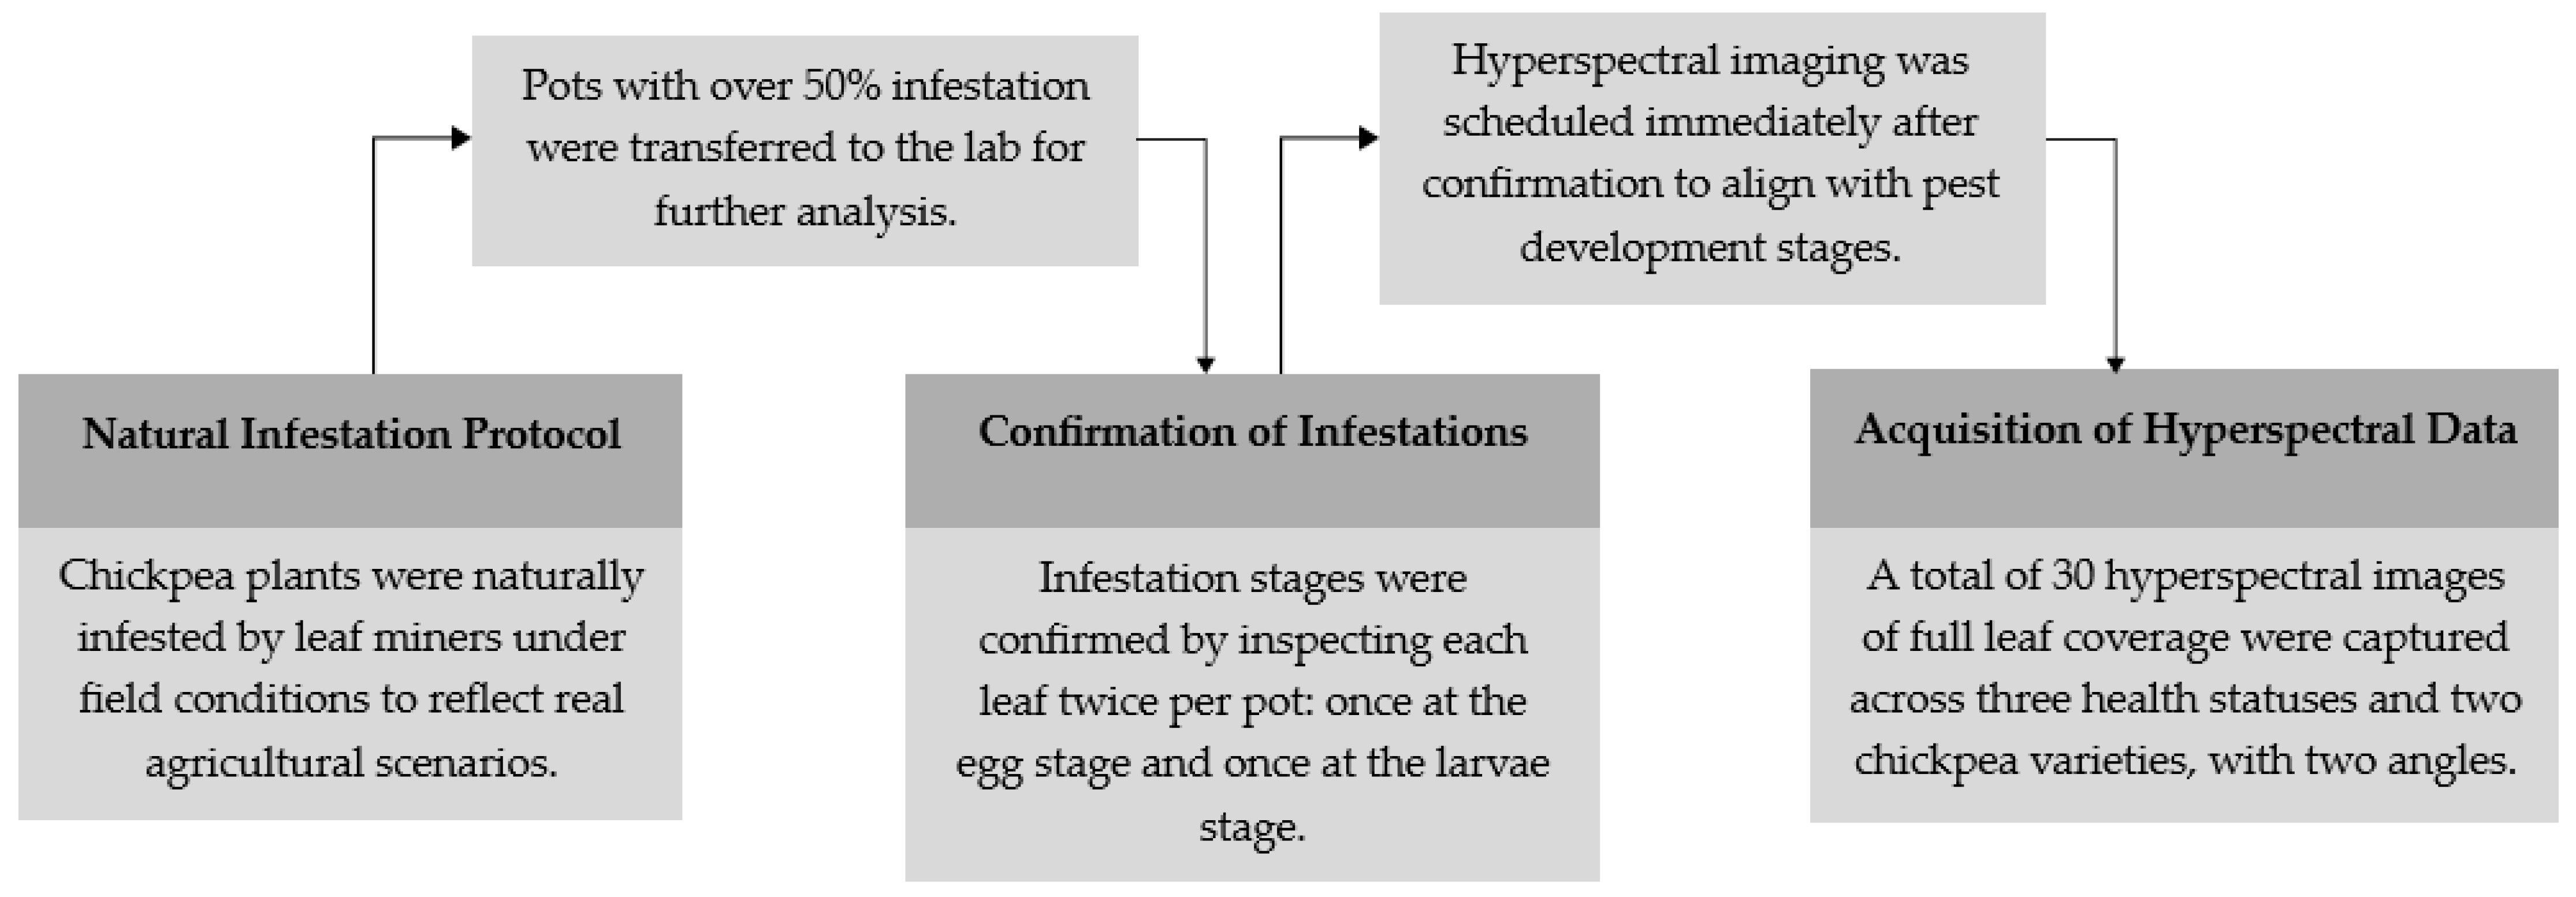
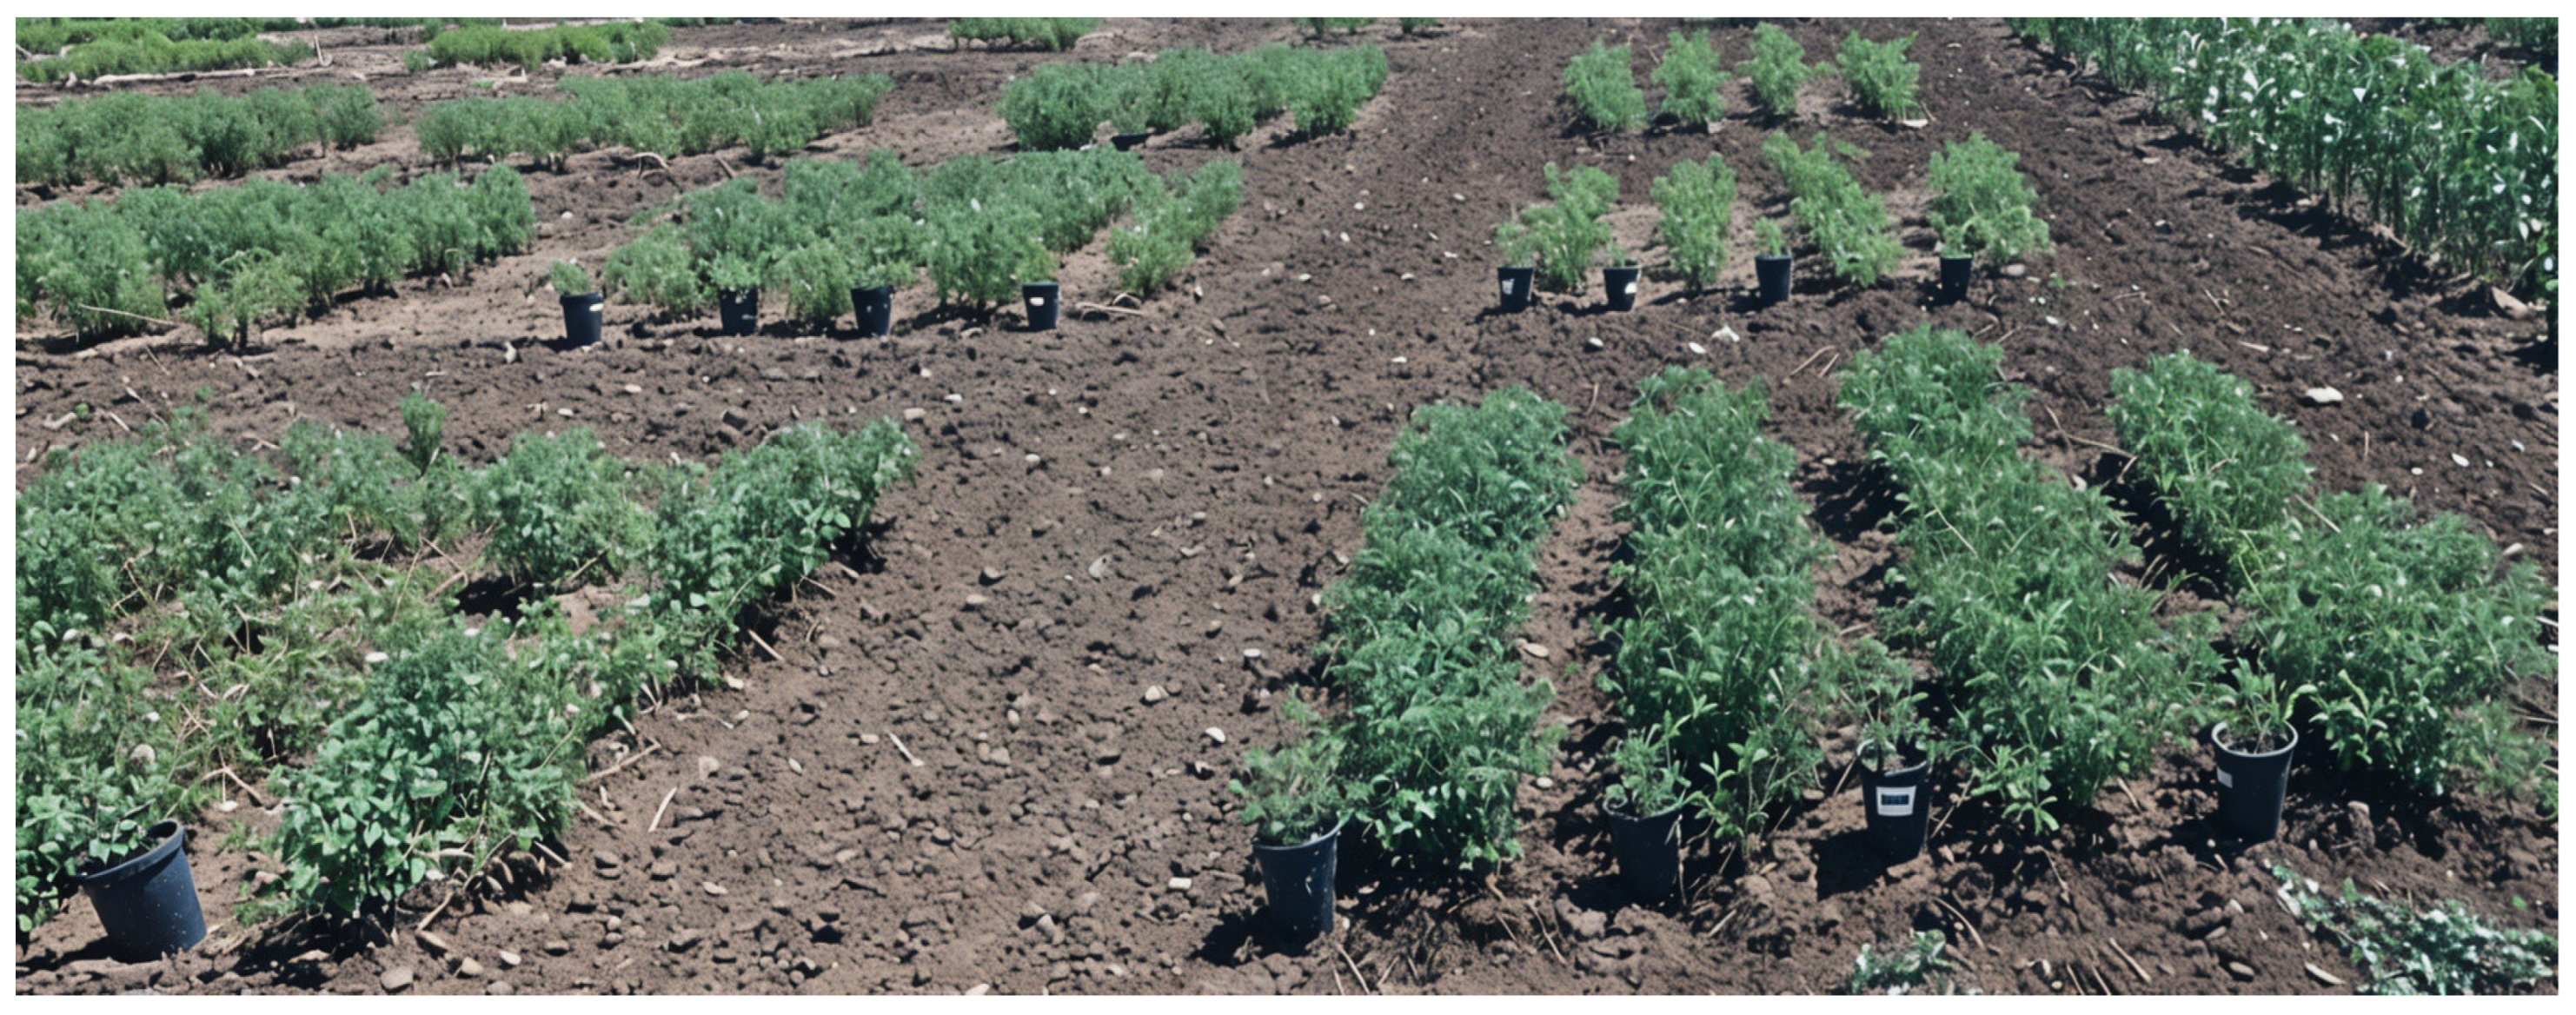
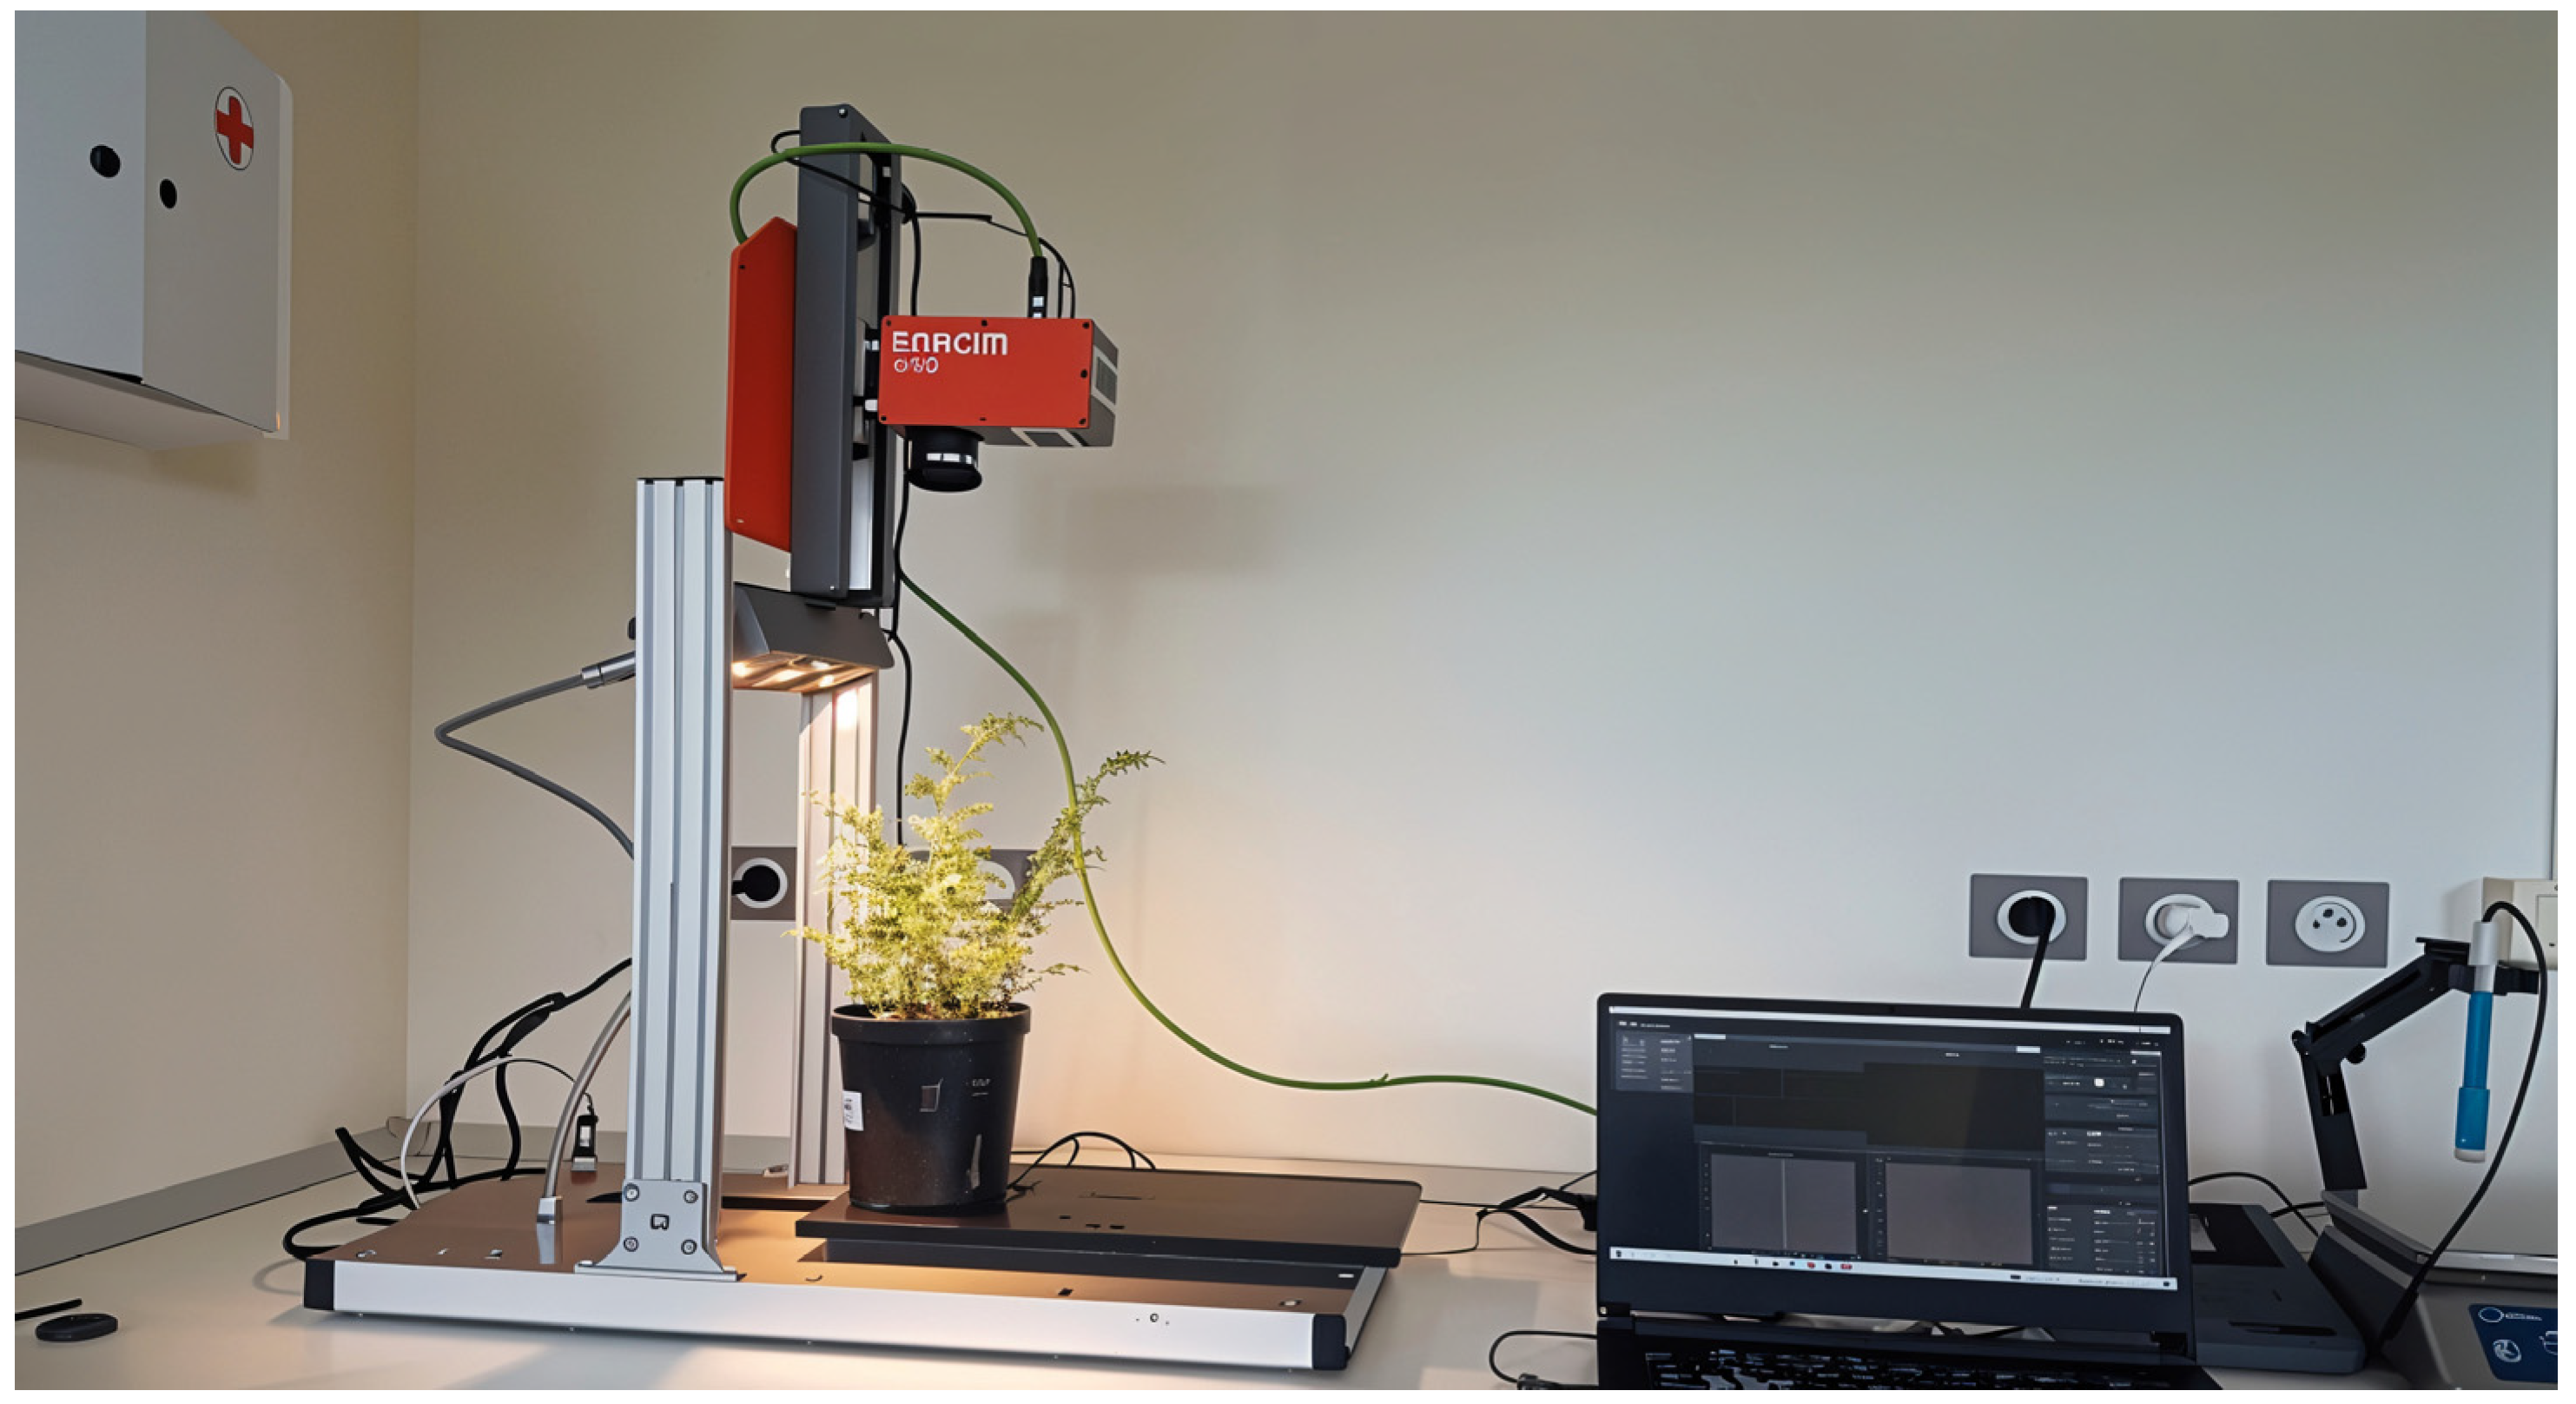
2.1. Materials and Data Collection
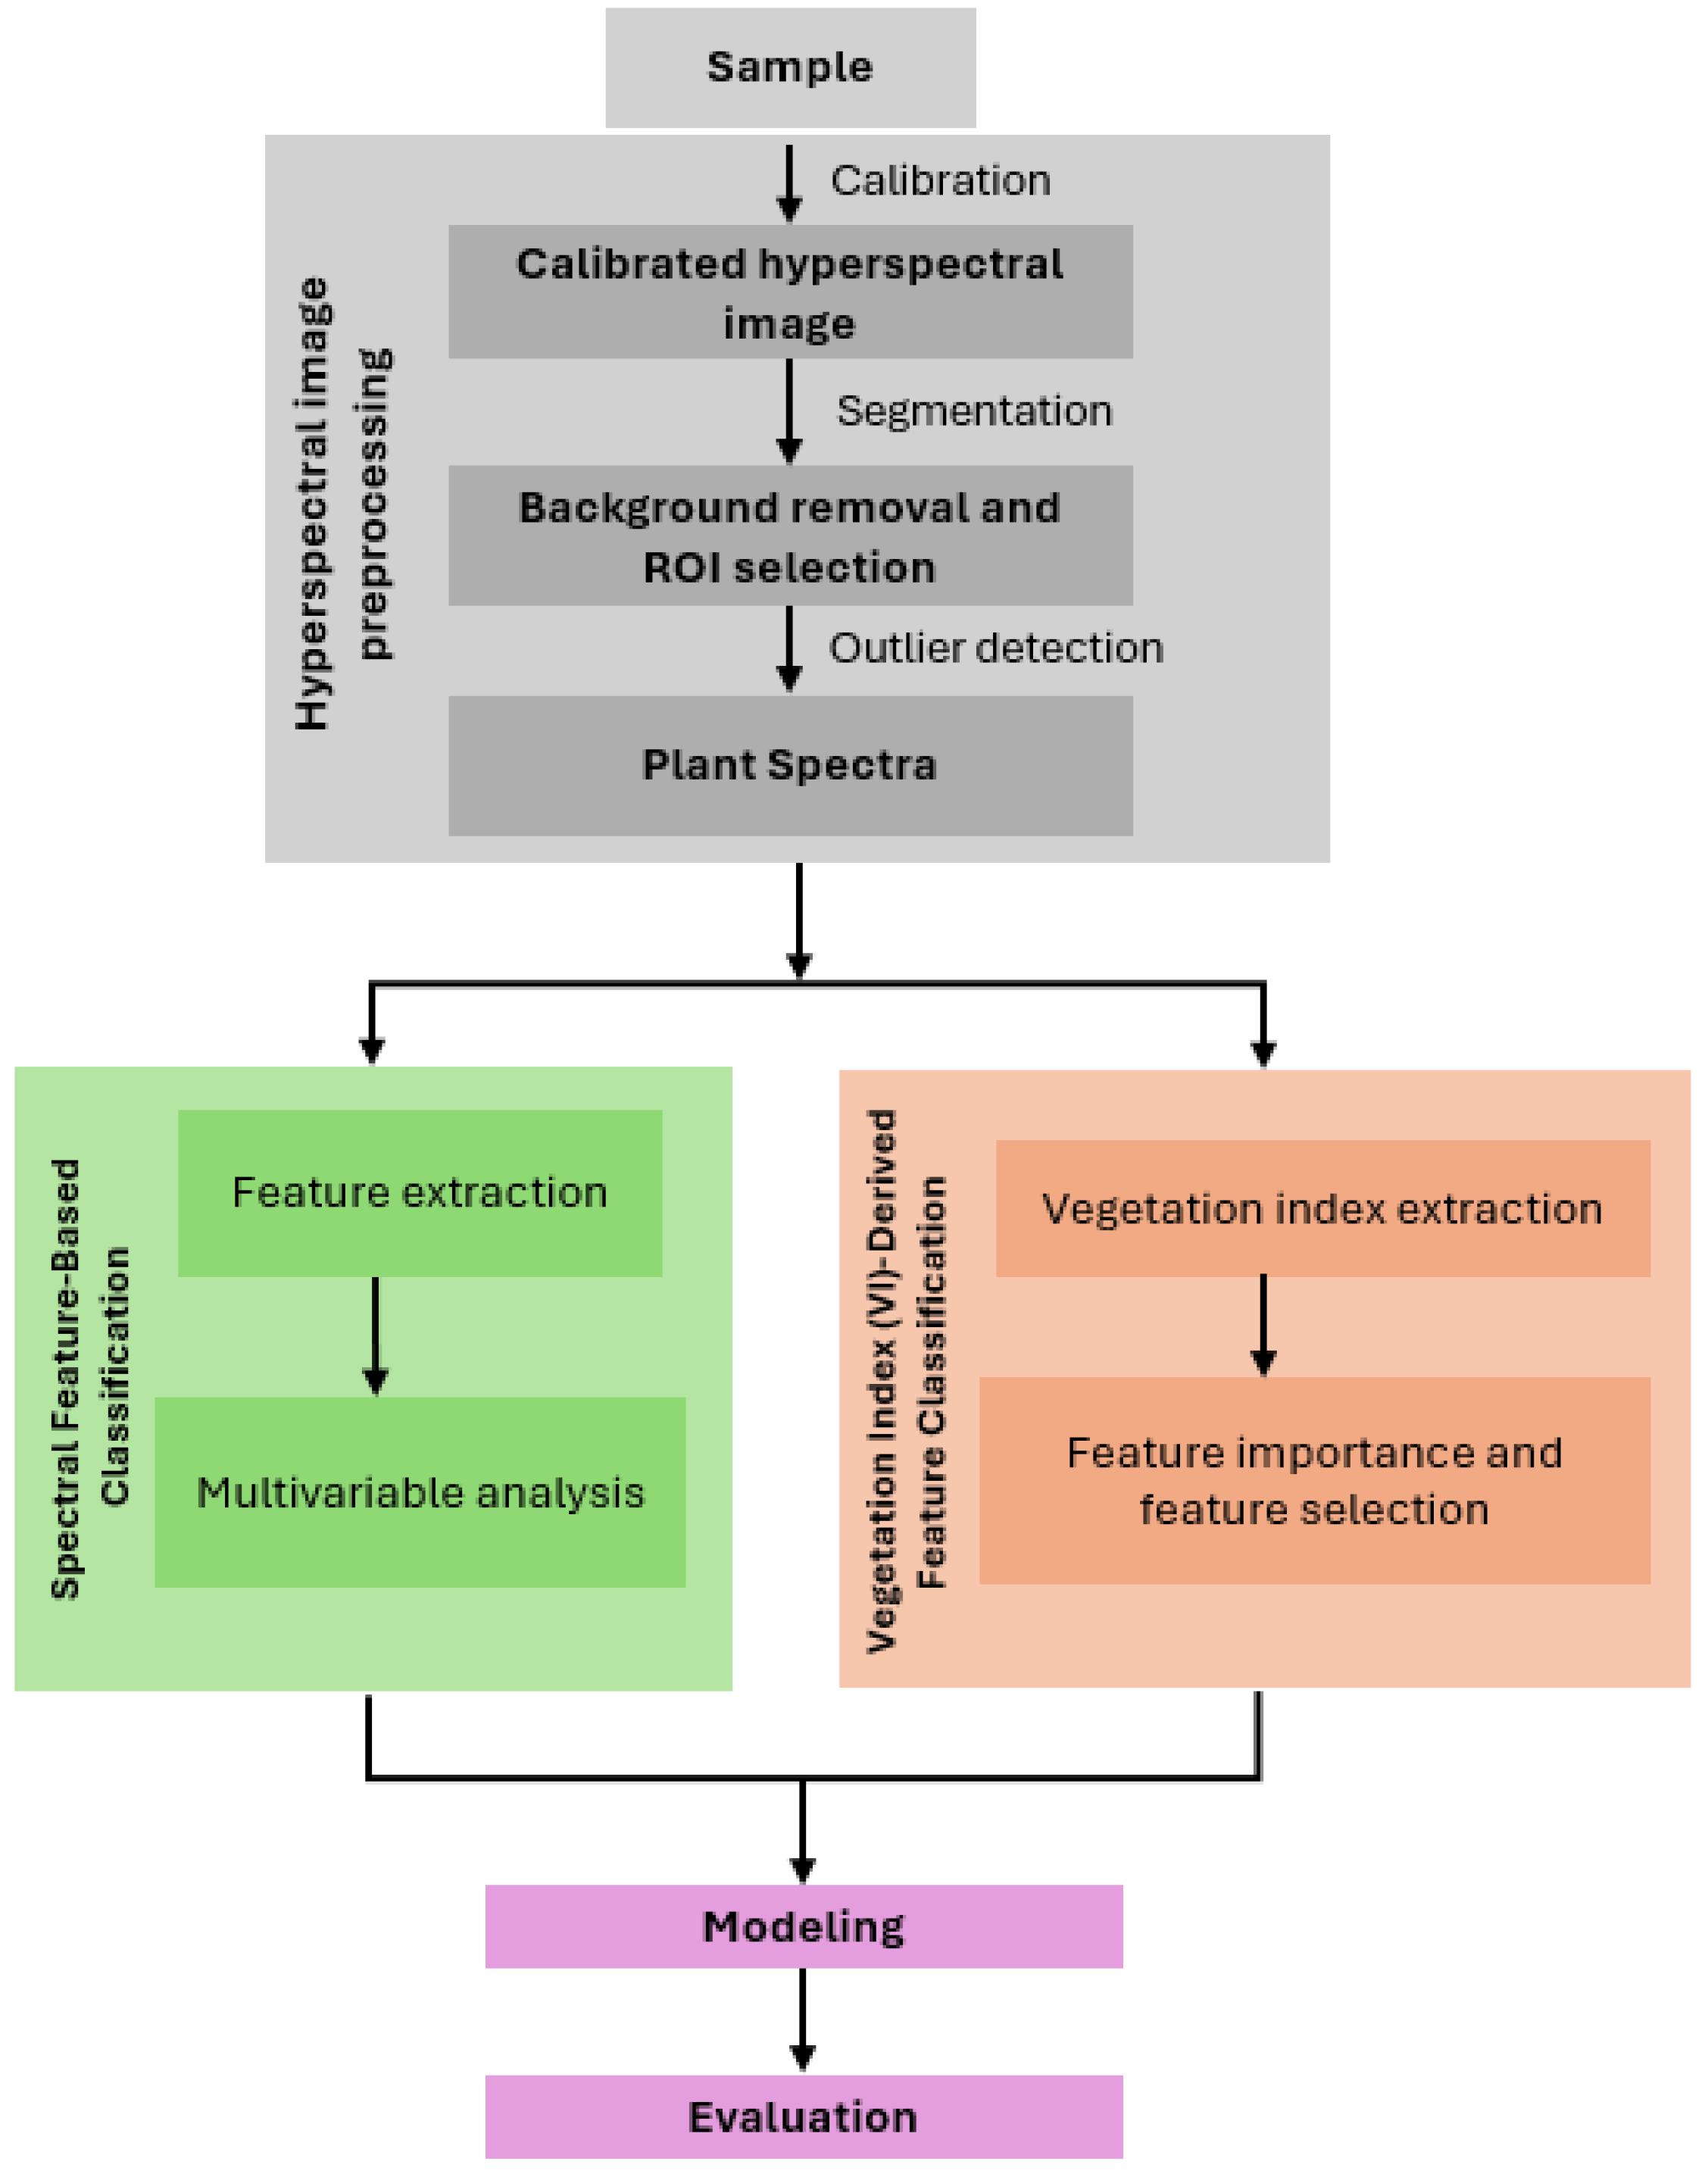
The experiment was designed to monitor the health of chickpea plants during the vegetative stage, focusing on two critical periods of the leaf miner’s life cycle: the egg stage and the larval stage. Two chickpea cultivars, desi and kabuli, were selected for their agricultural significance and varying susceptibilities to leaf miner infestations. A total of 18 pots were prepared, with each pot containing five individual plants, resulting in a total of 90 plants. For each cultivar, three pots were assigned to each health status: healthy, egg-infested, and larva-infested. This setup resulted in six pots per health status, ensuring data variability (Table 1). The selection of five plants per pot was based on optimizing the balance between resource constraints and the need for statistical reliability. Research indicates that pot size and the number of plants per pot can significantly influence plant growth and experimental outcomes. For instance, studies have shown that increasing the number of plants per pot can enhance the yield without adversely affecting individual plant growth, provided that the growth medium per plant is adequate. In our experiment, each pot was filled with sufficient soil to support five plants, ensuring that each plant had adequate resources for growth.
The pots were divided into two groups: one group was naturally exposed to infestation under field conditions, following the natural infestation protocol, while the other group was kept in a non-infested chamber to ensure they remained healthy. Once the first group of plants was infested by eggs, which coincided with the vegetative stage of chickpea plants, in our case, three infested and three healthy control pots of each variety were transported to the laboratory for hyperspectral data acquisition. After data collection, the infested pots were eliminated to prevent further effects, such as incomplete egg-to-larva transformation, and to maintain the integrity of the experimental protocol. After almost one week, eggs transform into larvae, and the same protocol was repeated for the other six larva-infested pots. All pots were grown under standardized environmental conditions, including uniform soil, watering schedules, temperature, and pressure. This ensured that any observed spectral variations could be attributed solely to the infestation status rather than external factors. The health of the plants was monitored regularly, with inspections aligned to the phenological cycle of the plants. These inspections identified the infestation stage (egg or larvae) to accurately label the data. The confirmation of infestation stages was conducted through visual inspection and cross-verification by experts. To effectively investigate the impact of leaf miner infestations on chickpea plants, a structured approach to data collection was implemented and detailed below, encompassing three critical steps (Figure 1), confirmation of infestations, and finally, acquisition of hyperspectral data.
The plants were initially grown in pots under field conditions in Marchouch, Morocco, where they were naturally exposed to populations of leaf miners (Figure 2). Unlike artificial infestation methods commonly used in similar studies [13,29], this approach provided a realistic simulation of agricultural conditions. However, the natural infestation process was influenced by climatic factors such as temperature, humidity, and rainfall, which fluctuated throughout the year [30,31]. These variations affected pest activity and population density, leading to inconsistent infestation levels, particularly in the desi variety, which we did not obtain from the larva-infested plant leaves (Table 2). Strict measures were implemented to confirm infestation status. Special attention was given to plants with an infestation rate of over 50%, where this rate refers to the proportion of leaves on a plant showing signs of infestation. Once the target infestation levels were achieved, the infested pots were carefully transported to the ICARDA laboratory in Rabat, Morocco, for hyperspectral imaging and further analysis.
Then, the ICARDA team conducted a meticulous confirmation process to verify the infestation stages by observing the presence of eggs and larvae on the chickpea leaves. This confirmation was carried out leaf by leaf to ensure accuracy. The inspection process occurred twice for each pot, first during the egg stage and then during the larvae stage. For each inspection, the team examined all the leaves of every plant within the pot to determine the infestation status. The confirmation process was performed immediately before the hyperspectral imaging of each pot. This careful and systematic approach was critical for enabling precise spectral analysis and maintaining the integrity of the experimental protocol. The imaging sessions were carefully scheduled to capture this transition, ensuring accurate temporal alignment with the pest life cycle.
The imaging system used in our study was the Specim FX10 hyperspectral camera (Specim, Oulu, Finland), depicted in Figure 3. This line-scan camera operates in the visible and near-infrared (VNIR) region, covering a spectral range from 400 to 1000 nm, and is equipped with a high spatial resolution of 1024 pixels. It captures 224 spectral bands with a spectral resolution of 5.5 nm, enabling the detection of subtle spectral variations. The camera achieves an imaging speed of up to 330 frames per second at full resolution, facilitating rapid data acquisition. To ensure stability during imaging, the camera was securely mounted on a rigid frame. The setup incorporated a laboratory scanner to facilitate precise movement and accurate imaging. Uniform illumination was achieved using halogen lamps, which provided consistent lighting and minimized shadowing effects. Before every imaging session, the system was calibrated by using a white reference panel for obtaining valid reflectance measurements.
In this study, we employed two analytical approaches using the visible and near-infrared (VNIR) spectral data: spectral feature-based classification, which utilizes the full VNIR range (400–1000 nm) to capture detailed spectral signatures of chickpea plants; and vegetation index-based classification, focusing on specific wavelength intervals to calculate indices like normalized difference vegetation index (NDVI), which uses reflectance values in the red (around 680 nm) and near-infrared (around 800 nm) regions to assess chlorophyll content and photosynthetic activity, indicating overall plant health. However, it is important to note that as the spectral range of the Specim FX10 is limited to 400–1000 nm, which excludes the shortwave infrared (SWIR) region beyond 1000 nm. This limitation may impact the detection of certain vegetation-associated spectral features, such as water content and lignin-cellulose absorption bands, which are prominent in the SWIR region. Consequently, while the camera is effective for capturing the visible and near-infrared (VNIR) plant characteristics, its inability to detect SWIR features may limit comprehensive vegetation analysis.
Hyperspectral images were captured for both varieties across three health statuses: healthy, egg-infested, and larva-infested. A total of 30 images were generated, capturing 2 images per pot, showing 2 different spectral angles of plants covering all their leaves by repositioning the pots relative to the camera. This comprehensive approach ensured that the data reflected all possible variations in plant leaf orientation. Table 2 summarizes the distribution of images, with six pots allocated for each health status (healthy, egg-infested, and larva-infested) across the two chickpea varieties (three pots for each variety). To ensure a consistent and balanced comparison, we captured images and selected two valid and reliable images per pot at each observation point; for example, imaging a healthy plant alongside an egg-infested plant, and separately, a healthy plant alongside a larva-infested plant at the same time (approximately from 8:30 to 12:00 GMT). The six healthy pots were divided into two control groups: one group monitored alongside the egg-infested plants, and the other alongside the larva-infested plants. This design allowed synchronized imaging under consistent conditions and supported robust statistical comparisons across infestation stages.
From the dataset, 20 images were carefully selected for training (Figure 4 shows an example), with 4 images of the first 2 pots per health status from each variety (Table 3). This ensured an even distribution of classes and allowed the model to learn representative features of each condition effectively. The remaining 10 images were designated for testing, maintaining the same class and varietal proportions, presenting the last pot per health status from each variety (Table 3). This splitting strategy ensured a fair and robust evaluation of the model’s performance on unseen data while minimizing potential biases introduced by overrepresentation of certain conditions or varieties and given that the variability between pixel spectral signatures is very limited.

2.2. Methods

2.2.1. Image Preprocessing

This study implements several preprocessing techniques, as shown in Figure 5, to systematically clean and prepare the hyperspectral data for machine learning models aimed at detecting leaf miner infestations in chickpea plants. These preprocessing techniques are crucial steps that significantly influence the accuracy and reliability of subsequent analytical processes and ensure that raw hyperspectral images are converted into a form suitable for analysis, minimizing noise and enhancing the quality of extracted information [32,33].
To address noise and calibrate hyperspectral data, spectral smoothing was performed using the Savitzky–Golay filter, a polynomial-based filtering method that effectively smooths spectral data while preserving key features such as peaks and valleys [34,35]. This ensures the retention of critical spectral information related to plant health. Additionally, normalization was applied to scale the spectral reflectance values to a common range, typically between 0 and 1. This step minimizes the influence of lighting variability and sensor inconsistencies, enabling the focus to remain on the intrinsic spectral characteristics of the plants [35].
Next, for isolating the regions of interest (ROI) specific to chickpea plants, segmentation of calibrated hyperspectral data and background removal was performed using the normalized difference vegetation index (NDVI). NDVI values were calculated for each pixel in hyperspectral images, with a threshold applied to separate vegetative pixels from non-vegetative background pixels. Pixels exceeding a threshold of 0.35 were retained as plant pixels, while the rest were discarded. This step ensures that the analysis focuses solely on plant-specific spectral information, significantly improving the accuracy of the results [36]. Building upon this initial vegetation segmentation, the extraction of ROIs for the infested class required additional refinement to pinpoint specific damage-related regions within the plant canopy. First, initial segmentation was performed to group plant pixels with similar spectral properties, using clustering algorithms, such as k-means. This step generated a preliminary map highlighting distinct regions within the plant based on spectral similarities. Following this, the spectral signatures characteristic of leaf miner damage were carefully analyzed to identify the specific areas affected by the infestation. To ensure precision, visual inspection was employed to confirm the exact locations of infested areas within the plants. This manual confirmation validated the segmentation results by aligning the identified spectral patterns with visible signs of damage, such as mining patterns on the leaves. Finally, the regions of interest (ROIs) corresponding to the confirmed infested areas were extracted for more detailed analysis. These steps ensured precise segmentation of the infested areas, facilitating targeted assessments of pest damage [37,38].
Finally, outlier detection and removal were critical to ensure a clean dataset. Two robust techniques were applied: local outlier factor (LOF) and isolation forest. The LOF algorithm identifies outliers by comparing the local density of data points, flagging those with significantly lower density than their neighbors. This method was particularly useful for detecting subtle anomalies caused by noise or errors during hyperspectral data acquisition [39]. On the other hand, isolation forest is an ensemble-based method that isolates anomalies by creating random partitions in the feature space, which is highly effective for high-dimensional datasets like hyperspectral data. After applying both methods, approximately 5% of the total data was flagged and removed as anomalies, ensuring that only valid and meaningful spectral signatures were included. This filtering resulted in a final dataset comprising 30 hyperspectral images, with each image containing an average of 2000 pixels across 448 spectral bands. The adoption of both techniques provided complementary strengths, enhancing the reliability of the preprocessed dataset for machine learning tasks and ensuring accurate classification of chickpea plant health statuses.
This robust preprocessing pipeline is essential for testing reliable machine learning models for the classification of hyperspectral data by adopting two approaches, focusing on extracting insights from the spectral features of chickpea plants. Spectral feature-based classification: This method extracts raw spectral features directly from each pixel of the hyperspectral images. These features, representing the full spectral profile, were analyzed using multivariate analysis techniques and fed into machine learning models. The detailed spectral information enables precise differentiation between healthy, egg-infested, and larva-infested plant regions. Vegetation index (VI)-derived feature classification: This method calculates key vegetation indices (VIs) like normalized difference vegetation index (NDVI), enhanced vegetation index (EVI), and green normalized difference vegetation index (GNDVI) from hyperspectral data. These indices are mathematical combinations of specific spectral bands designed to highlight aspects of plant health. For classification purposes, each VI was computed at the pixel level across hyperspectral images. To quantify their discriminative power, an importance score was calculated for each VI, reflecting its contribution to distinguishing between healthy, egg-infested, and larva-infested chickpea plants. Higher scores indicated greater relevance in identifying differences in plant health status. These importance scores were then used to select the most significant indices, enhancing model efficiency and interpretability while reducing the risk of overfitting. While both methods rely on pixel-level data, they differ in their focus. Spectral feature-based classification uses the detailed spectral profile of each pixel, while VI-based classification provides a more summarized view of plant health.
For this study, after preprocessing and cleaning the hyperspectral data, principal component analysis (PCA) was employed to select 20,000-pixel spectra for training the model. PCA is a widely recognized dimensionality reduction technique that captures the most significant variance in the data while reducing its dimensional complexity, as discussed by [40]. Statistically, PCA maximizes the variance explained in the data, ensuring that the most informative features are retained while less relevant noise is discarded. To validate this choice, hypothesis testing, such as parametric bootstrap methods, was conducted to confirm the suitability of PCA in capturing the data’s underlying structure [40,41]. These statistical tests provide strong evidence that the PCA transformation is appropriate and does not introduce bias into the data. Furthermore, the use of PCA in hyperspectral image classification has been shown to effectively preserve the diversity of spectral information across different classes without compromising the model’s robustness [42]. The random selection of pixels during PCA ensures that the transformation maintains the intrinsic variability of the data, which is critical for training machine learning models in a way that avoids overfitting and bias, leading to more reliable predictions. The decision to limit the dataset to 20,000 spectra was a balance between computational feasibility and maintaining the variability needed for accurate classification. Although batch processing could have been an alternative to handle larger datasets, PCA-based selection allowed us to prioritize the most informative spectra while keeping the computational pipeline efficient. Figure 6 illustrates the spectral data after selection, highlighting the diversity captured for robust model training and testing. The selected spectra from 20 training images shown in Figure 6a were equally distributed among the three classes to avoid class imbalance, which could bias the model during training. For testing, all pixels from the 10 testing images shown in Figure 6b were used. It should be noted that the noticeable peak around 850 nm is due to the camera’s sensitivity at that range of wavelengths. To ensure data reliability and eliminate potential artifacts, this spectral range was excluded from the analysis. This comprehensive approach ensured that the model was evaluated on data that fully represented the spectral variability and potential edge cases present in the dataset.

2.2.2. Spectral Feature-Based Classification

In this study, principal component analysis (PCA) was used as the primary method for feature extraction from hyperspectral data. PCA was chosen because of its ability to reduce the high dimensionality of hyperspectral images while preserving the most significant spectral features needed for classification [40,41]. This dimensionality reduction not only simplifies the data but also highlights the variability that is most relevant for distinguishing between healthy, egg-infested, and larva-infested chickpea plants. Additionally, kernel PCA was employed to capture non-linear relationships within the data that may not be adequately represented by standard PCA. This approach was particularly useful in enhancing the separation of spectral features across the three classes, ensuring robust performance in the classification tasks. The resulting principal components represent combinations of wavelength bands that capture the most variance in the spectral data. By examining the loadings of these components, we observed that the most influential wavelengths corresponded to regions commonly associated with plant physiological responses such as the red-edge, near-infrared (NIR), and visible ranges. These regions are also where key vegetation indices (VIs) like NDVI are most sensitive. Therefore, the PCs can be interpreted as condensed representations of spectral patterns that are highly relevant to plant health and stress detection, in line with the spectral behavior emphasized by the VIs used in our study. This link not only enhances the biological interpretability of the PCA results but also reinforces their role in identifying health status classes. The use of these methods was motivated by their efficiency in improving model interpretability and computational feasibility, while maintaining classification accuracy [42].

2.2.3. VI-Based Classification

VIs are important tools in hyperspectral imaging that enable the differentiation of plant states and classification with a higher degree of accuracy [43]. In this study, a targeted selection of vegetation indices (VIs) was employed to enhance the classification of hyperspectral data for identifying leaf miner infestations in chickpea plants. The chosen indices are presented in Table 4.
These VIs were selected for their ability to detect changes in chickpea plant health and stress conditions. They were used as features for classification due to their effectiveness in capturing key plant characteristics such as chlorophyll content, photosynthetic efficiency, and structural integrity. This approach aimed to evaluate the effectiveness of vegetation indices (VIs) in leveraging their spectral sensitivity to differentiate healthy, egg-infested, and larval-infested plants with higher accuracy.

2.2.4. Model Selection, Training, and Evaluation

Several machine learning algorithms can classify hyperspectral data, including random forest (RF) and support vector machines (SVM) [51,52]. For this study, random forest was selected for spectral feature-based classification due to its robustness in handling high-dimensional and noisy data, its ability to provide clear feature importance, and its ease of use. Support vector machine (SVM) was chosen for classification based on vegetation indices (VIs), as it performs well in low-dimensional spaces, demonstrates robustness against overfitting, and offers flexibility through kernel methods [53]. These algorithms complement each other, addressing different aspects of hyperspectral data classification. To enhance the models’ performance, hyperparameter tuning was conducted using grid search with 5-fold cross-validation to ensure robustness and generalizability [54]. For random forest, the optimal parameters were determined as 100 trees and a maximum depth of 10. For SVM, the best parameters were a regularization parameter C = 100 and a linear kernel. Both models were evaluated on a distinct testing dataset, ensuring no overlap with the training data. Performance metrics, such as accuracy and precision, were calculated to assess the models’ effectiveness in classifying healthy and infested chickpea plants. These tailored approaches ensured the development of reliable classification systems for detecting leaf miner infestations.

3. Results

3.1. Spectral Feature-Based Classification

In this study, PCA and KPCA were applied to reduce the dimensionality of the hyperspectral data while retaining the maximum amount of information. The optimal number of components was selected based on the explained variance and the cumulative variance threshold. As shown in Figure 7, the cumulative variance plot indicated that a threshold of 90% (red line) explained variance was reached with a specific number of components. Additionally, the scree plot revealed a clear ‘elbow,’ confirming the appropriate number of components to retain. It indicates that by adding more components from 134 is enough to reduce the dimensionality in retaining all information, so then we can choose as we want as number of components (e.g., 50, 100, 150, and 250) with PCA and KPCA to train the model, and then compare results of different number of components. The following are the results obtained after performing random forest on our different datasets (kabuli chickpea dataset, desi chickpea dataset, and combined dataset) for each classification purpose. It is important to note that data for larva-infested plants in the desi variety were not available (Table 2). Consequently, the classification between larva-infested and healthy plants was not conducted for this specific variety as figured in Figures 9, 10, 12, and 13. However, such analysis was feasible for the combined dataset, as it includes healthy plant data from the desi variety.
Case 1: Classification of healthy versus egg-infested plants
Using all 448 spectral features (green bars) consistently yielded the highest validation accuracy, reaching 83% for the combined dataset when distinguishing healthy from egg-infested plants (Figure 8). This confirms the benefit of retaining the full hyperspectral spectrum, which provides richer information for classification. In contrast, dimensionality reduction methods like PCA and KPCA, which reduced the feature set to 50 or 100, resulted in lower performance, suggesting that key spectral details were lost in the process. Among the varieties, kabuli chickpea consistently achieved a validation accuracy above 77% (Figure 8a), outperforming desi chickpea (Figure 8b), likely due to more distinct spectral signatures. When both datasets were combined, the performance closely followed that of kabuli, indicating its stronger influence on model predictions (Figure 8c). This observation aligns with the hypothesis that the spectral profiles of kabuli chickpea are inherently more separable, potentially due to structural or biochemical differences between the two cultivars.
Testing with 250 selected features using the random forest algorithm showed high accuracy for healthy plants (Figure 8d), but performance dropped for egg-infested ones, reflecting the subtle spectral variations at early infestation stages. This highlights the need for advanced feature engineering or improved preprocessing to enhance detection sensitivity. Notably, the combined dataset outperformed desi alone in testing (72% testing accuracy), reinforcing kabuli’s dominant spectral contribution. These results emphasize the value of using full-spectrum data for early pest detection and reveal variety-specific spectral differences critical for accurate classification.
Case 2: Classification of healthy versus larva-infested plants
When classifying between healthy and larva-infested plants, using all 448 features (green bars) yielded the highest validation accuracy, surpassing 86% for kabuli and the combined dataset. This underscores the value of preserving full spectral information to capture subtle yet critical differences. Kabuli chickpea maintained high validation accuracy (exceeding 80%) even with around 134 features (Figure 9a), suggesting its spectral patterns are distinct enough for effective classification with fewer inputs. In contrast, the combined dataset showed a notable accuracy drop when dimensionality reduction was applied: validation accuracy around 62% with 50 or 100 features using PCA/KPCA (Figure 9b). These highlights increased complexity due to the inclusion of desi chickpea data, which introduces spectral variability and makes class boundaries less defined.
Testing results supported these trends (Figure 9c). Kabuli chickpea achieved 83% testing accuracy, confirming the reliability of its spectral signatures. However, testing accuracy slightly declined for the combined dataset using random forest with 250 features, likely due to the added complexity from the desi variety data. These outcomes emphasize how dataset composition and feature selection impact model performance, with kabuli chickpea offering more consistent classification results and desi data requiring more refined feature strategies to preserve accuracy.
Case 3: Classification of healthy versus egg-larva-infested plants
The classification of healthy versus egg-larva-infested plants showed high validation accuracies with PCA and KPCA, even with reduced features starting from 134 (Figure 10). Validation accuracy exceeded 80% across all datasets, indicating that dimensionality reduction effectively retains key spectral information for classification. The combined dataset achieved over 75% accuracy, though lower than kabuli chickpea alone (Figure 10b), suggesting variability due to the spectral complexity of desi chickpea.
Testing results reinforced these patterns (Figure 10c). Kabuli chickpea achieved 79% testing accuracy with 250 reduced features using random forest, demonstrating its suitability. However, performance on the combined dataset was lower, highlighting the challenges posed by combining kabuli and desi spectral data. This underscores the need for tailored approaches to handle dataset complexity in hyperspectral classification. While PCA and KPCA perform well in reducing dimensions without sacrificing accuracy, managing diverse spectral profiles from different varieties requires additional strategies like feature selection or preprocessing to enhance model generalizability and accuracy.
Overall, the analysis shows that using a reduced feature set starting from 134 consistently achieves the highest accuracy, highlighting the importance of retaining critical spectral information for effective classification. Dimensionality reduction methods like PCA and KPCA effectively preserve relevant features, even with significant data complexity reduction. The kabuli chickpea dataset consistently outperforms the desi and combined datasets, suggesting that kabuli’s spectral signatures are more distinct and easier to classify. In contrast, the variability in desi chickpea and spectral overlap between healthy and infested states pose challenges for classification. The combined dataset’s intermediate accuracy reflects the increased complexity from merging datasets with distinct spectral properties. Testing accuracy further supports these observations, with kabuli showing higher accuracy due to more separable spectral features, while desi and combined datasets experience lower accuracy due to increased variability. These findings emphasize the value of combining feature selection strategies with an understanding of dataset variability to improve classification accuracy and robustness. This study underscores the potential of tailored feature selection and dataset-specific preprocessing in optimizing hyperspectral data applications in agriculture.

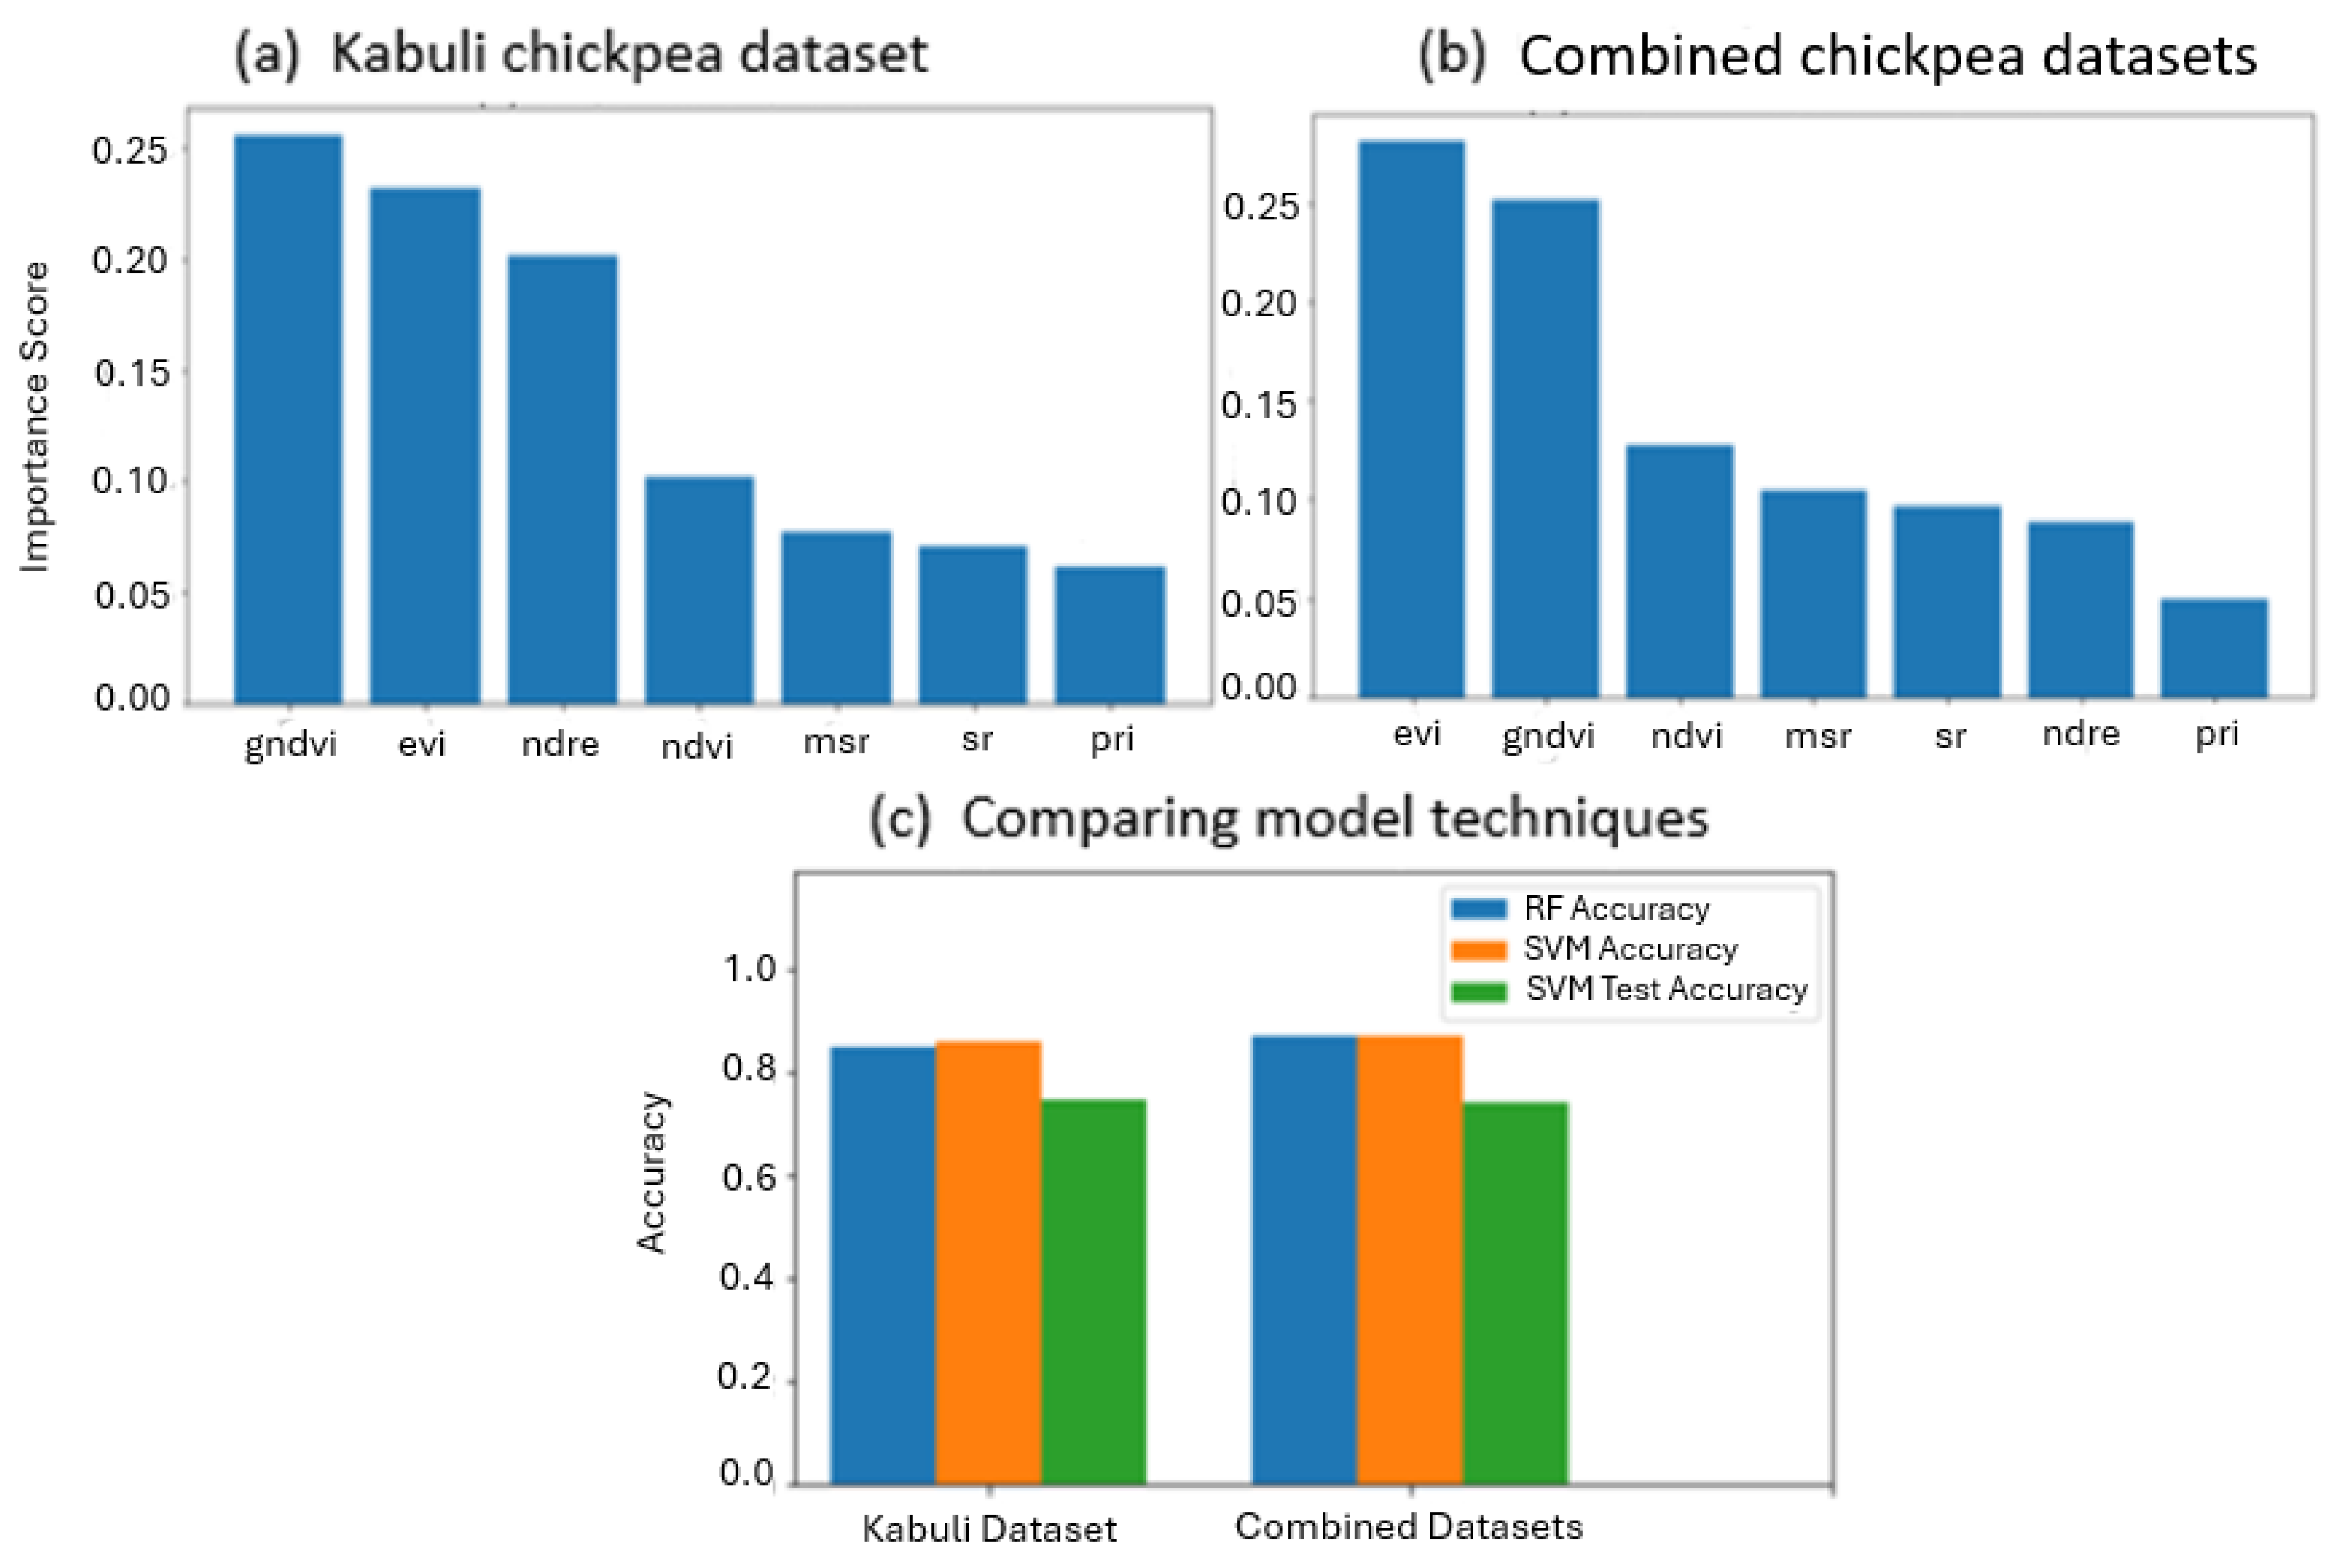
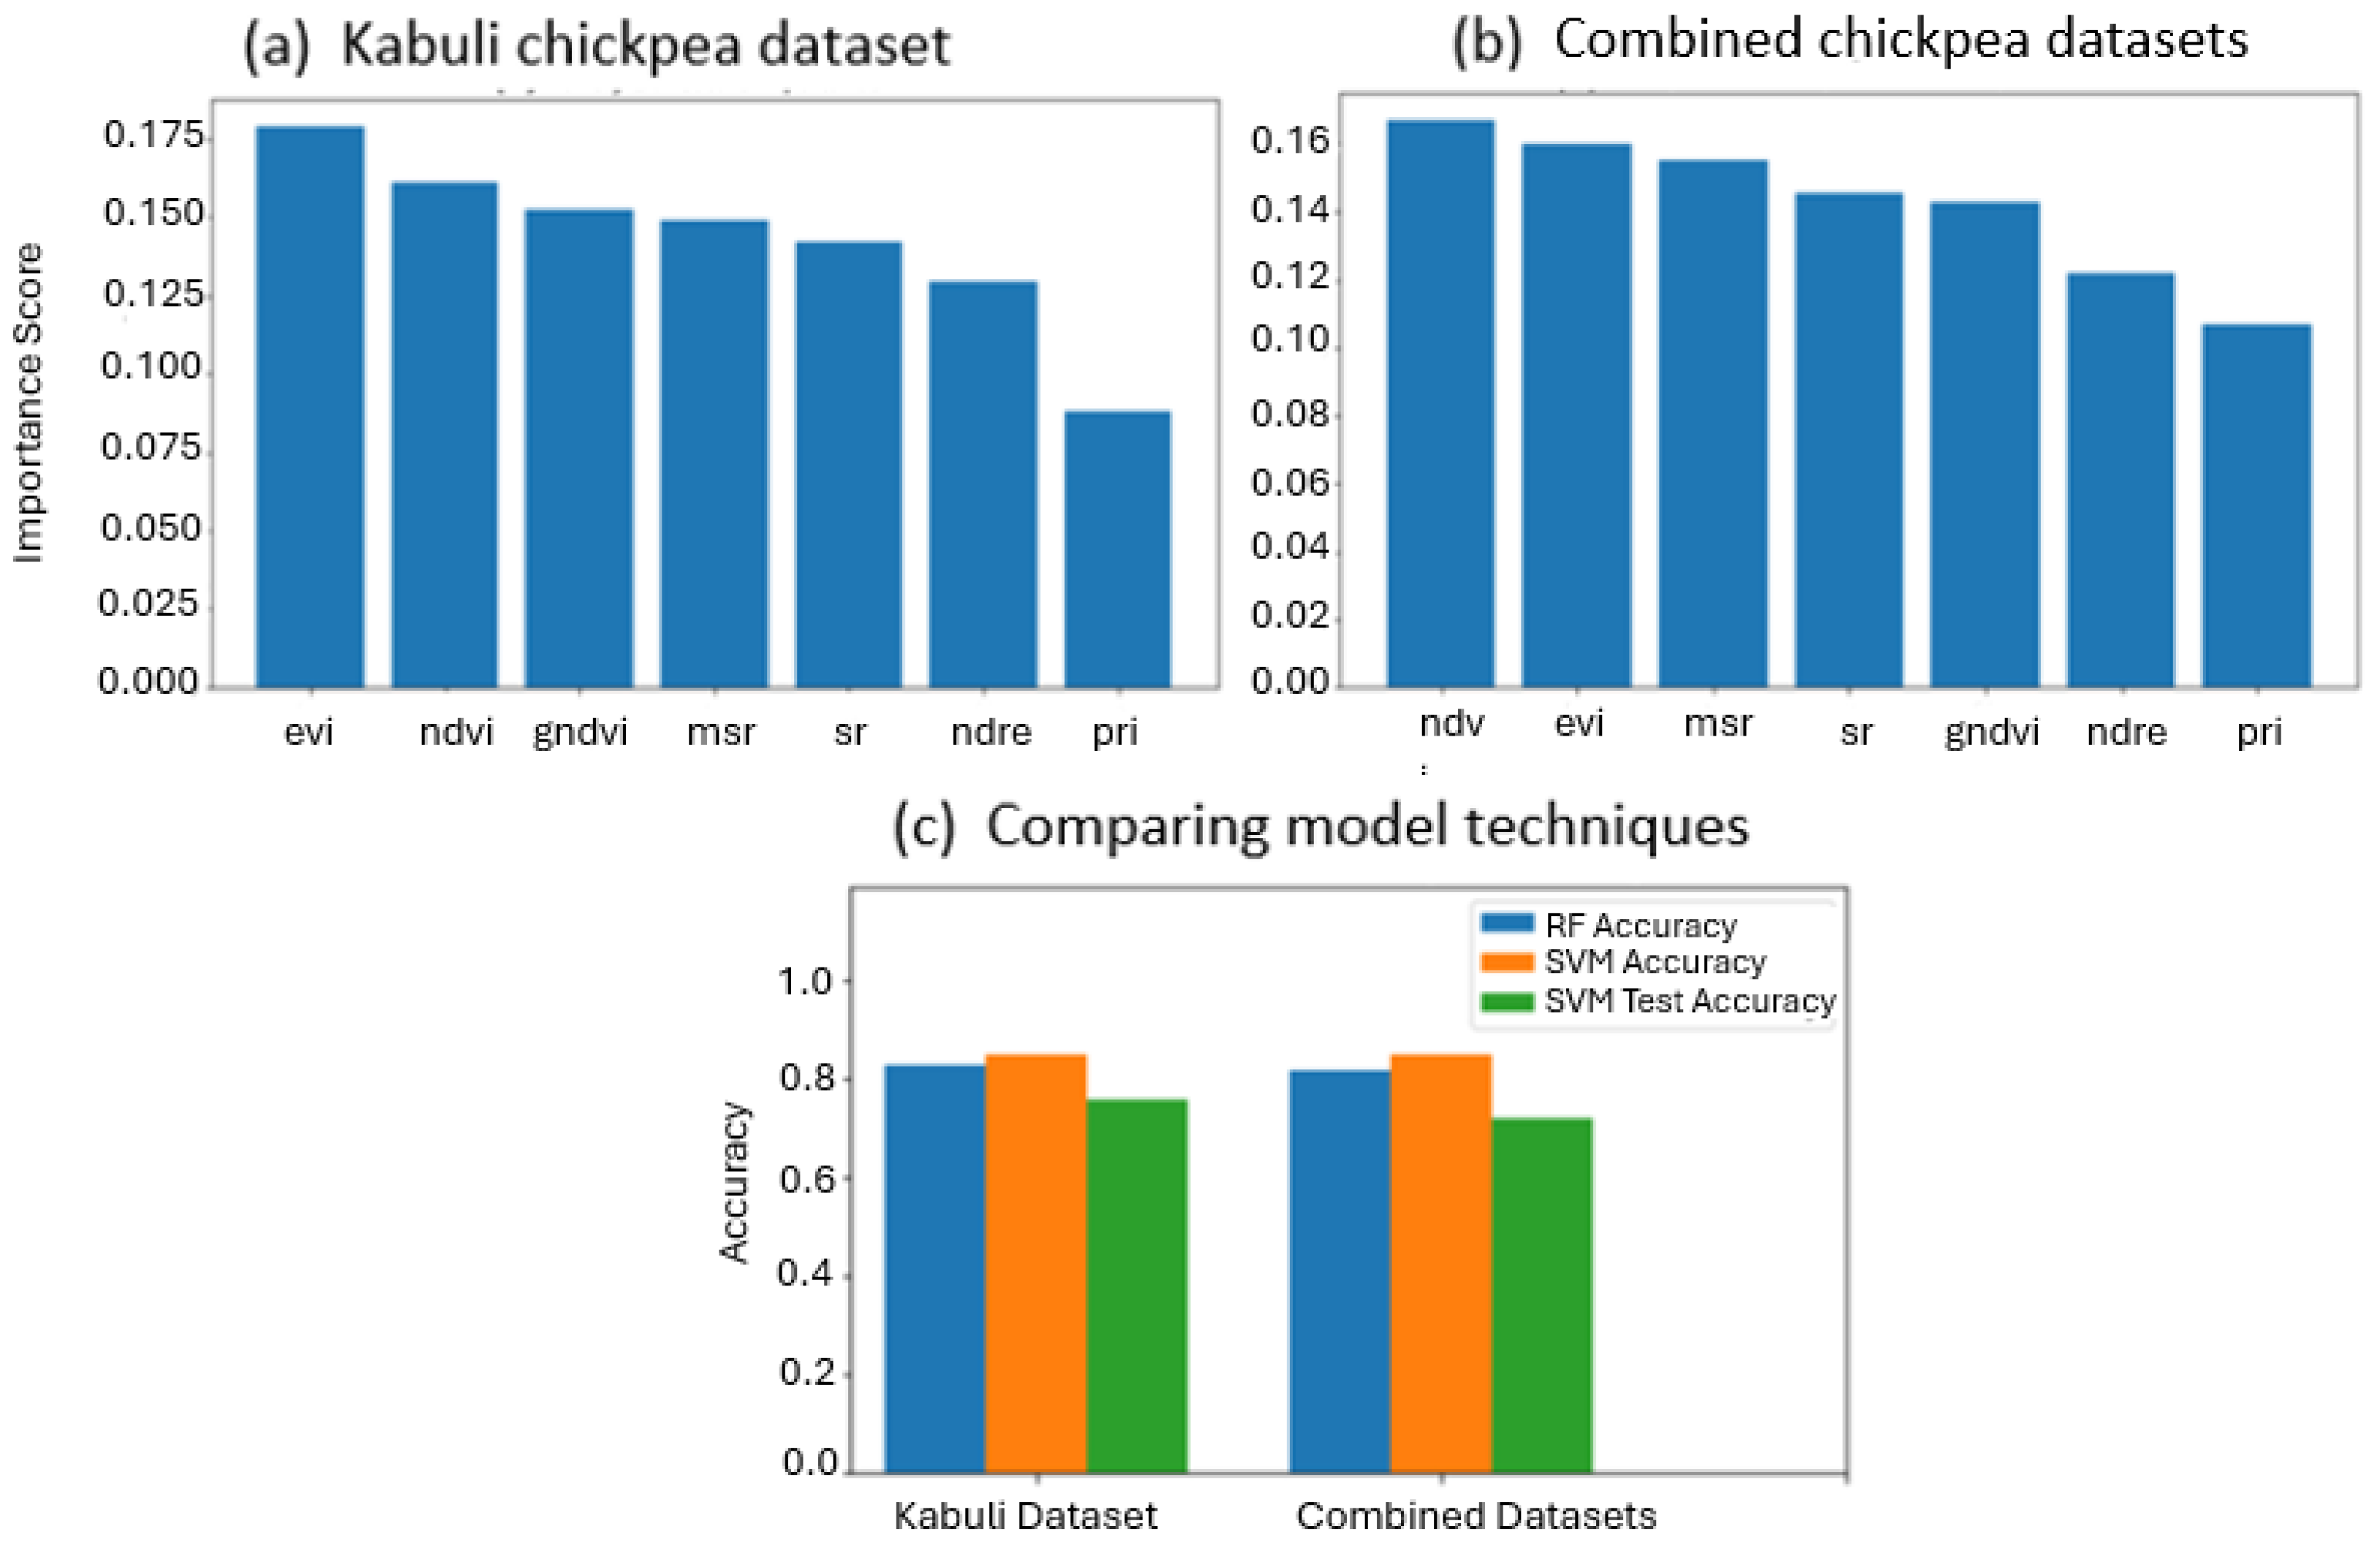
3.2. VI-Based Classification

In this section, we present the results of classification using vegetation indices (VIs) extracted from hyperspectral data. Each index was evaluated based on its contribution to distinguishing between healthy, egg-infested, and larval-infested chickpea plants. The importance scores derived from the models guided the selection of the most relevant indices for classification. Random forest and SVM classifiers were then applied to the kabuli, desi, and combined datasets, providing insights into the performance of VI-based classification across different chickpea varieties.
Case 1: Classification of healthy versus egg-infested plants
In classifying healthy versus egg-infested chickpea plants, NDRE and PRI consistently emerge as the most critical features. For kabuli chickpea (Figure 11a), NDRE, with an importance score of 0.2, effectively captures variations in chlorophyll concentration and leaf structure, reflecting its sensitivity to infestation-related changes. PRI and MSR, each with scores of 0.153, play complementary roles in detecting photosynthetic efficiency and mitigating soil interference. These features enable the SVM model to achieve high training accuracy (0.86) and reasonable test accuracy (0.7), although the moderate drop in test accuracy reflects natural dataset variability.
For desi chickpea (Figure 11b), PRI (0.246) surpasses NDRE (0.159) in importance, indicating that desi’s spectral response to stress and photosynthetic changes is more pronounced. Random forest (RF) outperforms SVM, achieving higher training accuracy (0.89) and test accuracy (0.66), reflecting its ability to handle the more complex spectral data of desi chickpea. The lower test accuracy compared to kabuli suggests greater difficulty in distinguishing between healthy and egg-infested plants in desi chickpea. When combining the datasets (Figure 11c), NDRE (0.186) and PRI (0.181) remain dominant, though the increased variability from merging datasets slightly reduces classification accuracy. The SVM model maintains a test accuracy of 0.67 (Figure 11d), highlighting the challenges of integrating datasets with distinct spectral characteristics. These results reinforce the importance of NDRE and PRI as key indicators of plant health across varieties and demonstrate the nuanced spectral responses between chickpea varieties. Kabuli is more sensitive to NDRE, while desi relies more on PRI, and this study also illustrates how SVM and RF complement each other depending on dataset complexity.
Case 2: Classification of healthy versus larva-infested plants
For the classification of healthy versus larva-infested chickpea plants, GNDVI is the most critical feature for kabuli chickpea (Figure 12a), with an importance score of 0.256. This index’s sensitivity to chlorophyll concentration highlights its relevance in detecting pest-induced stress. EVI (0.232), the second most important feature, enhances the model’s ability to discern vegetation health by minimizing soil and atmospheric noise. The SVM model achieves a training accuracy of 0.86 and a test accuracy of 0.75 (Figure 12c), demonstrating its effectiveness in distinguishing larva-infested plants. For the combined dataset (Figure 12b), EVI (0.281) becomes slightly more influential, followed by GNDVI (0.252). Both RF and SVM models achieve comparable training accuracy of 0.86; however, SVM exhibits better generalization with a slightly higher test accuracy of 0.74 (Figure 12c). This suggests SVM’s adaptability in handling the increased complexity of the combined dataset.
These results confirm the significance of GNDVI and EVI as reliable early indicators of pest infestation. GNDVI, linked to chlorophyll levels, serves as an effective marker for stress caused by larvae, while EVI optimizes spectral data interpretation. The performance of both models reinforces the robustness of these indices and the importance of aligning feature selection with model strengths, with SVM proving more suitable for complex datasets.
Case 3: Classification of healthy versus egg-larva-infested plants
EVI is the most influential feature (importance score: 0.179), followed by NDVI (0.161) in classifying healthy versus egg-larva-infested kabuli chickpea plants (Figure 13a). These indices effectively capture canopy structure and chlorophyll variations, aiding in early stress detection. The SVM model demonstrates strong performance, with a training accuracy of 0.86 and a test accuracy of 0.76 (Figure 13c), confirming its reliability for kabuli classification. When combining kabuli and desi datasets (Figure 13b), NDVI becomes the most important feature (0.167), with EVI close behind (0.160), reflecting their complementary role in identifying infestation-induced stress across varieties. Although the test accuracy drops slightly to 0.72 (Figure 13c), the model maintains satisfactory generalization.
These results confirm NDVI and EVI as critical indicators for hyperspectral pest detection. NDVI’s chlorophyll sensitivity and EVI’s noise-reducing capability make them valuable in agricultural monitoring. The consistent SVM performance, even with increased data complexity, highlights its robustness and supports the use of targeted feature selection for improved pest management strategies.
Overall, both random forest (RF) and support vector machine (SVM) show strong performance in classifying egg-larva-infested versus healthy chickpea plants using hyperspectral data. SVM consistently delivers slightly higher test accuracy, making it more reliable for real-world deployment, while RF excels in training performance and is well-suited for complex datasets where overfitting can be controlled. The effectiveness of both models is enhanced by integrating vegetation indices like NDRE, PRI, GNDVI, EVI, and NDVI, which capture key indicators of plant health and stress. SVM’s superior generalization highlights its robustness under field variability, while RF offers a dependable alternative when accuracy during training is critical. Together, these models, combined with targeted feature selection, offer a scalable framework for early pest detection and improved pest management in chickpea cultivation.

4. Discussion

This study examined the spectral characteristics of plants under varying conditions related to plant status, healthy, infested with eggs, and infested with larvae, employing two distinct approaches: spectral feature-based classification and classification based on vegetation indices. The analysis demonstrated the potential of spectral data for differentiating between plant health statuses, reinforcing its role as a proxy for detecting physiological variations associated with pest presence. This suggests that different stages of infestation may lead to measurable changes in spectral reflectance, which can be captured by advanced classification techniques [55]. These insights are consistent with previous studies that have highlighted the sensitivity of spectral data to subtle shifts in plant condition [52,56]. Vegetation indices, in turn, provided complementary information that supported the trends observed through spectral feature analysis. Indices such as NDVI and EVI were instrumental in reflecting variations related to plant health and stress levels [46,57]. These tools can be particularly valuable in facilitating rapid assessments of plant condition. The coherence between vegetation indices and spectral features strengthens the case for integrating both approaches into remote sensing workflows, especially for monitoring plant health or detecting early signs of pest infestation [58].
The performance benchmarking of the classification models across varying plant conditions indicates that both spectral feature-based and vegetation index-based approaches yield reliable results, as discussed in [52]. Spectral feature-based classification benefits from its ability to leverage detailed spectral data, which may enhance its sensitivity in capturing subtle physiological differences between plant statuses. This aligns with the findings of [52], who demonstrated that hyperspectral reflectance could detect plant diseases before visible symptoms appear. Also, this study used machine learning models with spectral data to effectively classify plant stress types, reinforcing the value of detailed spectral features. Conversely, the vegetation index-based approach, although somewhat less detailed, continues to be practical for rapid health surveillance, particularly in large-scale monitoring scenarios. This is consistent with [59]; this study found that vegetation indices like NDVI were effective for disease detection in crops, especially for operational field-level applications. This method allows for the granularity of hyperspectral data and captures even minute spectral changes. Meanwhile, vegetation indices like NDVI and EVI proved useful for large-scale monitoring and provided insight into chlorophyll variations and planting stress, at somewhat lower yet effective accuracy levels [46,57,59]. Comparative analysis across chickpea varieties also suggests that differences in spectral signal strength can influence classification performance, as noted by [52], which could be an important consideration when applying these models in practice. These findings reinforce the value of combining hyperspectral imaging with machine learning techniques such as random forest and SVM, highlighting the potential of this integrated framework for early pest detection and broader agricultural health surveillance.
The findings of this study underscore the transformative potential of hyperspectral imaging in pest management by enabling early detection of infestations, which facilitates timely and site-specific interventions. This precision minimizes the use of broad-spectrum pesticides, assuring effectiveness in pest control while significantly lessening ecological impact and thereby aligning with sustainable farming goals. Compared with traditional methods that rely on visual assessments or manual counting of pest damage [18,19], hyperspectral imaging offers unparalleled objectivity, speed, and the ability to detect physiological changes in plants before visible symptoms appear. Similar outcomes have been reported in [60]; this study demonstrated hyperspectral imaging’s ability to detect fungal diseases in sugar beet prior to symptom emergence. Similarly, RGB-based imaging, although an improvement on manual methods, is limited by its broad spectral bands, which lack the requisite sensitivity to early infestation stages or slight physiological changes, as also noted by [17,22]. Though the said advantages exist, some of the challenges and limitations are yet to be faced to encourage broader adoption. The research was conducted under controlled greenhouse conditions, which may not perfectly mimic field scenarios where the ambient light, soil type, and plant diversity may affect imaging and model performance [61]. Hyperspectral imaging systems are also quite expensive, require specialized equipment, and demand expertise in both data acquisition and analysis; these are some factors that may limit their use among farmers [62]. Future studies must overcome these barriers by focusing on the development of cost-effective, user-friendly solutions that can operate effectively in diversified agricultural settings. The practical applicability could also be enhanced by integrating hyperspectral technology with mobile or drone-based platforms and by simplifying the data processing pipeline, ensuring that its benefits extend beyond experimental setups into real-world farming systems.

5. Conclusions

The present work highlights the efficiency of HSI in the early detection of attacks due to leaf miners on chickpea plants using a natural infestation protocol, an approach not previously explored. Through the application of advanced machine learning algorithms, specifically random forest (RF) and support vector machines (SVM), our study achieved classification accuracies exceeding 80% across different infestation levels (healthy, egg-infested, and larval-infested). These results demonstrate that HSI can significantly enhance pest management and crop protection through precise identification of subtle physiological changes caused by pest activity. The major conclusions include the following:
  • High Accuracy in Classification: Machine learning applied to spectral and vegetation index-based features from hyperspectral data enabled the accurate distinction between healthy and infested chickpea plants. Notably, both approaches delivered high classification accuracies, confirming that the spectral information is a strong proxy for plant health and infestation status.
  • Integration with Precision: The demonstrated success of both pixel-level spectral features and vegetation indices (e.g., NDVI, EVI, NDRE) in this study supports the integration of HSI with precision agriculture technologies. Such integration allows for non-invasive, real-time monitoring of crop health, reducing dependence on traditional pest control methods and promoting more sustainable practices.
In this regard, future studies on the early detection of leaf miner infestations in chickpea plants should be directed more towards optimizing the application of HSI and improving the algorithms of machine learning. While the present study demonstrated the potential of HSI in the early-stage infestation detection caused by pests, future investigations could be carried out to apply more advanced and hybrid machine learning models that might enable even earlier stages of pest detection. These would further be deployed on-site in real-time, thus enabling continuous monitoring and dynamic adjustments to pest management strategies. This can be complemented by further research into integrating HSI with other sensor technologies, such as thermal and multispectral sensors, whose complementary information regarding plant health under the pressure of pests would be further uncovered. The extension of these studies to different varieties and environments would be very useful in establishing a broader knowledge related to specific hyperspectral signatures linked with infestation and thus facilitating the development of more generalizable models over several crops and conditions. Future studies could focus on the establishment of automated systems that involve HMI and machine learning to provide farmers with real-time warnings, thus scaling up precision farming solutions in the management of pests.

Author Contributions

Conceptualization, M.A. and I.M.K.; methodology, M.A., F.B. and Y.Z.; software, M.A.; validation, M.A., F.B. and Y.Z.; formal analysis, M.A.; investigation, M.A. and R.B.; resources, M.A., F.B. and Y.Z.; data curation, M.A.; writing—original draft preparation, M.A.; writing—review and editing, I.M.K., F.B. and Y.Z.; visualization, M.A.; supervision, I.M.K., F.B., Y.Z. and A.C.; project administration, I.M.K.; funding acquisition, I.M.K. All authors have read and agreed to the published version of the manuscript.

Funding

This project was financially supported by the SpectraVOCs project (agreement between OCP foundation and Université Mohammed VI Polytechnique (UM6P)). The lead author financial support from UM6P.

Institutional Review Board Statement

Not applicable.

Informed Consent Statement

Not applicable.

Data Availability Statement

Data available on request due to privacy restrictions.

Acknowledgments

The authors thank the members of the International Center for Agricultural Research in the Dry Areas (ICARDA) for establishing and managing the onsite experiments and fieldwork. The authors would like to extend their sincere gratitude and appreciation to the editor and the anonymous reviewers for their thoughtful reviews and constructive comments.

Conflicts of Interest

The authors declare no conflicts of interest.

References

  1. Koul, B.; Sharma, K.; Sehgal, V.; Yadav, D.; Mishra, M.; Bharadwaj, C. Chickpea (Cicer arietinum L.) biology and biotechnology: From domestication to biofortification and biopharming. Plants 2022, 11, 2926. [Google Scholar] [CrossRef] [PubMed]
  2. Merga, B.; Haji, J. Economic importance of chickpea: Production, value, and world trade. Cogent Food Agric. 2019, 5, 1615718. [Google Scholar] [CrossRef]
  3. Wang, J.; Li, Y.; Li, A.; Liu, R.H.; Gao, X.; Li, D.; Kou, X.; Xue, Z. Nutritional constituent and health benefits of chickpea (Cicer arietinum L.): A review. Food Res. Int. 2021, 150, 110790. [Google Scholar] [CrossRef] [PubMed]
  4. Mathew, S.E.; Shakappa, D.; Rengel, Z. A review of the nutritional and antinutritional constituents of chickpea (Cicer arietinum) and its health benefits. Crop Pasture Sci. 2022, 73, 401–414. [Google Scholar] [CrossRef]
  5. Houasli, C.; Idrissi, O.; Nsarellah, N. Chickpea genetic improvement in Morocco: State of the art, progress and prospects. Moroc. J. Agric. Sci. 2020, 1. [Google Scholar]
  6. Houasli, C.; Sahri, A.; Nsarellah, N.; Idrissi, O. Chickpea (Cicer arietinum L.) breeding in Morocco: Genetic gain and stability of grain yield and seed size under winter planting conditions. Euphytica 2021, 217, 159. [Google Scholar] [CrossRef]
  7. El Fakhouri, K.; Boulamtat, R.; Sabraoui, A.; El Bouhssini, M. The chickpea Pod borer, Helicoverpa armigera (Hübner): Yield loss estimation and biorational insecticide assessment in Morocco. Agronomy 2022, 12, 3017. [Google Scholar] [CrossRef]
  8. Manjunatha, L.; Puyam, A.; Prema, G.U.; Sanjay Bandi, M.; Kumar, R.; Keerthi, M.C.; Dixit, G.P.; Kavitha, T.R. Chickpea Biotic Stresses. In Genomic Designing for Biotic Stress Resistant Pulse Crops; Springer International Publishing: Cham, Switzerland, 2022; pp. 117–159. [Google Scholar]
  9. Tankodara, K.D.; Gohil, G.R.; Khunt, K.R. Problems faced by the chickpea growers in adoption of recommended chickpea production technology. J. Pharmacogn. Phytochem. 2020, 9, 388–389. [Google Scholar]
  10. Soltani, A.; Ben Abda, M.; Amri, M.; Carapelli, A.; Ben Jemâa, J.M. Seasonal incidence of the leaf miner Liriomyza cicerina Rond (Diptera: Agromyzidae) in chickpea fields and effects of climatic parameters, chickpea variety, and planting date on the leaf miner infestation rate. Euro-Mediterr. J. Environ. Integr. 2020, 5, 58. [Google Scholar] [CrossRef]
  11. Sabraoui, A.; Lhaloui, S.; Bouchelta, A.; El Fakhouri, K.; El Bouhssini, M. Grain yield losses due to leaf miner (Liriomyza cicerina R.) in winter- and spring-planted chickpea in Morocco. Crop Prot. 2019, 117, 115–120. [Google Scholar] [CrossRef]
  12. Mahesha, H.S.; Keerthi, M.C.; Shivakumar, K.V.; Bhargavi, H.A.; Saini, R.P.; Manjunatha, L.; Hickok, D.; Blair, M.W. Development of biotic stress resistant cowpea. In Genomic Designing for Biotic Stress Resistant Pulse Crops; Springer: Cham, Switzerland, 2022; pp. 213–251. [Google Scholar]
  13. Chrigui, N.; Sari, D.; Sari, H.; Eker, T.; Cengiz, M.F.; Ikten, C.; Toker, C. Introgression of resistance to leafminer (Liriomyza cicerina Rondani) from Cicer reticulatum Ladiz. to C. arietinum L. and relationships between potential biochemical selection criteria. Agronomy 2020, 11, 57. [Google Scholar] [CrossRef]
  14. Saxena, H.; Bandi, S.; Devindrappa, M. Pests of pulses. In Pests and Their Management; Springer: Singapore, 2018; pp. 99–136. [Google Scholar]
  15. Ngugi, L.C.; Abelwahab, M.; Abo-Zahhad, M. Recent advances in image processing techniques for automated leaf pest and disease recognition—A review. Inf. Process. Agric. 2021, 8, 27–51. [Google Scholar] [CrossRef]
  16. Thakur, K.; Sharma, A.; Sharma, K. Management of agricultural insect pests with physical control methods. Pharma Innov. J. 2021, 10, 306–314. [Google Scholar]
  17. Rustia, D.J.A.; Lin, C.E.; Chung, J.-Y.; Zhuang, Y.-J.; Hsu, J.-C.; Lin, T.-T. Application of an image and environmental sensor network for automated greenhouse insect pest monitoring. J. Asia-Pac. Èntomol. 2020, 23, 17–28. [Google Scholar] [CrossRef]
  18. Ahmad, M.N.; Shariff, A.R.M.; Moslim, R. Monitoring insect pest infestation via different spectroscopic techniques. Appl. Spectrosc. Rev. 2018, 53, 836–853. [Google Scholar] [CrossRef]
  19. Lima, M.C.F.; de Almeida Leandro, M.E.D.; Valero, C.; Coronel, L.C.P.; Bazzo, C.O.G. Automatic detection and monitoring of insect pests—A review. Agriculture 2020, 10, 161. [Google Scholar] [CrossRef]
  20. Guo, Q.; Wang, C.; Xiao, D.; Huang, Q. Automatic monitoring of flying vegetable insect pests using an RGB camera and YOLO-SIP detector. Precis. Agric. 2023, 24, 436–457. [Google Scholar] [CrossRef]
  21. Duarte, A.; Borralho, N.; Cabral, P.; Caetano, M. Recent advances in forest insect pests and diseases monitoring using UAV-based data: A systematic review. Forests 2022, 13, 911. [Google Scholar] [CrossRef]
  22. Adedeji, A.A.; Ekramirad, N.; Rady, A.; Hamidisepehr, A.; Donohue, K.D.; Villanueva, R.T.; Parrish, C.A.; Li, M. Non-destructive technologies for detecting insect infestation in fruits and vegetables under postharvest conditions: A critical review. Foods 2020, 9, 927. [Google Scholar] [CrossRef]
  23. Júnior, T.D.C.; Rieder, R.; Di Domênico, J.R.; Lau, D. InsectCV: A system for insect detection in the lab from trap images. Ecol. Inform. 2022, 67, 101516. [Google Scholar] [CrossRef]
  24. Júnior, T.D.C.; Rieder, R. Automatic identification of insects from digital images: A survey. Comput. Electron. Agric. 2020, 178, 105784. [Google Scholar] [CrossRef]
  25. Kashyap, B.; Kumar, R. Sensing methodologies in agriculture for monitoring biotic stress in plants due to pathogens and pests. Inventions 2021, 6, 29. [Google Scholar] [CrossRef]
  26. Simović, I.; Šikoparija, B.; Panić, M.; Radulović, M.; Lugonja, P. Remote sensing of poplar phenophase and leaf miner attack in urban forests. Remote Sens. 2022, 14, 6331. [Google Scholar] [CrossRef]
  27. Lu, B.; Dao, P.D.; Liu, J.; He, Y.; Shang, J. Recent advances of hyperspectral imaging technology and applications in agriculture. Remote Sens. 2020, 12, 2659. [Google Scholar] [CrossRef]
  28. Wang, B.; Sun, J.; Xia, L.; Liu, J.; Wang, Z.; Li, P.; Guo, Y.; Sun, X. The applications of hyperspectral imaging technology for agricultural products quality analysis: A review. Food Rev. Int. 2023, 39, 1043–1062. [Google Scholar] [CrossRef]
  29. Soltani, A.; Zouali, Y.; Haoual-Hamdi, S.; Saadouni, D.; Amri, M.; Carapelli, A.; Ben Jemâa, J.M. Relationship between secondary metabolites and infestations caused by chickpea leafminer Liriomyza cicerina (Diptera:Agromyzidae). Int. J. Trop. Insect Sci. 2020, 41, 251–259. [Google Scholar] [CrossRef]
  30. Soltani, A.; Beyareslan, A.; Gençer, L.; Hamdi, S.H.; Bousselmi, A.; Amri, M.; Ben Jemâa, J.M. Parasitoids of chickpea leafminer Liriomyza cicerina (Diptera: Agromyzidae) and their parasitism rate on chickpea fields in North Tunisia. J. Asia-Pac. Èntomol. 2018, 21, 1215–1221. [Google Scholar] [CrossRef]
  31. Nawaz, R.; Abbasi, N.A.; Hafiz, I.A.; Khan, M.F.; Khalid, A. Environmental variables influence the developmental stages of the citrus leafminer, infestation level and mined leaves physiological response of Kinnow mandarin. Sci. Rep. 2021, 11, 7720. [Google Scholar] [CrossRef]
  32. Li, Y.-H.; Tan, X.; Zhang, W.; Jiao, Q.-B.; Xu, Y.-X.; Li, H.; Zou, Y.-B.; Yang, L.; Fang, Y.-P. Research and application of several key techniques in hyperspectral image preprocessing. Front. Plant Sci. 2021, 12, 627865. [Google Scholar] [CrossRef]
  33. Adão, T.; Hruška, J.; Pádua, L.; Bessa, J.; Peres, E.; Morais, R.; Sousa, J.J. Hyperspectral imaging: A review on UAV-based sensors, data processing and applications for agriculture and forestry. Remote Sens. 2017, 9, 1110. [Google Scholar] [CrossRef]
  34. Kordestani, H.; Zhang, C. Direct use of the savitzky–golay filter to develop an output-only trend line-based damage detection method. Sensors 2020, 20, 1983. [Google Scholar] [CrossRef] [PubMed]
  35. Lehnert, L.W.; Meyer, H.; Obermeier, W.A.; Silva, B.; Regeling, B.; Bendix, J. Hyperspectral data analysis in R: The hsdar package. arXiv 2018, arXiv:1805.05090. [Google Scholar] [CrossRef]
  36. Ahmad, N.; Iqbal, J.; Shaheen, A.; Ghfar, A.; Al-Anazy, M.M.; Ouladsmane, M. Spatio-temporal analysis of chickpea crop in arid environment by comparing high-resolution UAV image and LANDSAT imagery. Int. J. Environ. Sci. Technol. 2022, 19, 6595–6610. [Google Scholar] [CrossRef]
  37. Singh, J.; Kaur, H. Plant disease detection based on region-based segmentation and KNN classifier. In Proceedings of the International Conference on ISMAC in Computational Vision and Bio-Engineering 2018 (ISMAC-CVB), Palladam, India, 16–17 May 2018; Springer International Publishing: Cham, Switzerland, 2019. [Google Scholar]
  38. Tamilselvi, P.; Kumar, K.A. Unsupervised machine learning for clustering the infected leaves based on the leaf-colours. In Proceedings of the 2017 Third International Conference on Science Technology Engineering & Management (ICONSTEM), Chennai, India, 23–24 March 2017; IEEE: Piscataway, NJ, USA, 2017. [Google Scholar]
  39. Cheng, Z.; Zou, C.; Dong, J. Outlier detection using isolation forest and local outlier factor. In Proceedings of the Conference on Research in Adaptive and Convergent Systems, Chongqing, China, 24–27 September 2019. [Google Scholar]
  40. Forkman, J.; Josse, J.; Piepho, H.-P. Hypothesis tests for principal component analysis when variables are standardized. J. Agric. Biol. Environ. Stat. 2019, 24, 289–308. [Google Scholar] [CrossRef]
  41. Reddy, G.T.; Reddy, M.P.K.; Lakshmanna, K.; Kaluri, R.; Rajput, D.S.; Srivastava, G.; Baker, T. Analysis of dimensionality reduction techniques on big data. IEEE Access 2020, 8, 54776–54788. [Google Scholar] [CrossRef]
  42. Binol, H. Ensemble learning based multiple kernel principal component analysis for dimensionality reduction and classification of hyperspectral imagery. Math. Probl. Eng. 2018, 2018, 9632569. [Google Scholar] [CrossRef]
  43. Giovos, R.; Tassopoulos, D.; Kalivas, D.; Lougkos, N.; Priovolou, A. Remote sensing vegetation indices in viticulture: A critical review. Agriculture 2021, 11, 457. [Google Scholar] [CrossRef]
  44. Akkara, M.S.; Pimpale, A.R.; Wadatkar, S.B.; Rajankar, P.B.; Ramteke, I.K. Multispectral vegetation indices profiles of chickpea. Pharma Innov. J. 2023, 12, 729–734. [Google Scholar]
  45. Polivova, M.; Brook, A. Detailed investigation of spectral vegetation indices for fine field-scale phenotyping. In Vegetation Index and Dynamics; IntechOpen: London, UK, 2021; p. 103. [Google Scholar]
  46. De Santis, M.A.; Satriani, A.; De Santis, F.; Flagella, Z. Water use efficiency, spectral phenotyping and protein composition of two chickpea genotypes grown in Mediterranean environments under different water and nitrogen supply. Agriculture 2022, 12, 2026. [Google Scholar] [CrossRef]
  47. Indore, N.S.; Chaudhry, M.; Jayas, D.S.; Paliwal, J.; Karunakaran, C. Non-destructive assessment of microstructural changes in Kabuli chickpeas during storage. Foods 2024, 13, 433. [Google Scholar] [CrossRef]
  48. Zhang, C.; Chen, W.; Sankaran, S. High-throughput field phenotyping of Ascochyta blight disease severity in chickpea. Crop Prot. 2019, 125, 104885. [Google Scholar] [CrossRef]
  49. Wu, Y.; Zhao, Q.; Yin, X.; Wang, Y.; Tian, W. Multi-parameter health assessment of jujube trees based on unmanned aerial vehicle hyperspectral remote sensing. Agriculture 2023, 13, 1679. [Google Scholar] [CrossRef]
  50. Gujarkar, V.A.; Kulkarni, P.D.; Pal, A.; Chaudhari, K.; Mohite, V.A. Remote Sensing Based Crop Monitoring System. In Proceedings of the 2022 IEEE Region 10 Symposium (TENSYMP), Mumbai, India, 1–3 July 2022; IEEE: Piscataway, NJ, USA, 2022. [Google Scholar]
  51. Raczko, E.; Zagajewski, B. Comparison of support vector machine, random forest and neural network classifiers for tree species classification on airborne hyperspectral APEX images. Eur. J. Remote Sens. 2017, 50, 144–154. [Google Scholar] [CrossRef]
  52. Nguyen, C.; Sagan, V.; Maimaitiyiming, M.; Maimaitijiang, M.; Bhadra, S.; Kwasniewski, M.T. Early detection of plant viral disease using hyperspectral imaging and deep learning. Sensors 2021, 21, 742. [Google Scholar] [CrossRef]
  53. Sheykhmousa, M.; Mahdianpari, M.; Ghanbari, H.; Mohammadimanesh, F.; Ghamisi, P.; Homayouni, S. Support vector machine versus random forest for remote sensing image classification: A meta-analysis and systematic review. IEEE J. Sel. Top. Appl. Earth Obs. Remote Sens. 2020, 13, 6308–6325. [Google Scholar] [CrossRef]
  54. Adnan, M.; Alarood, A.A.S.; Uddin, M.I.; Rehman, I.U. Utilizing grid search cross-validation with adaptive boosting for augmenting performance of machine learning models. PeerJ Comput. Sci. 2022, 8, e803. [Google Scholar] [CrossRef]
  55. Abd El-Ghany, N.M.; Abd El-Aziz, S.E.; Marei, S.S. A review: Application of remote sensing as a promising strategy for insect pests and diseases management. Environ. Sci. Pollut. Res. 2020, 27, 33503–33515. [Google Scholar] [CrossRef]
  56. Xiao, Z.; Yin, K.; Geng, L.; Wu, J.; Zhang, F.; Liu, Y. Pest identification via hyperspectral image and deep learning. Signal Image Video Process. 2022, 16, 873–880. [Google Scholar] [CrossRef]
  57. Pham, H.T.; Awange, J.; Kuhn, M.; Van Nguyen, B.; Bui, L.K. Enhancing crop yield prediction utilizing machine learning on satellite-based vegetation health indices. Sensors 2022, 22, 719. [Google Scholar] [CrossRef]
  58. Gerhards, M.; Schlerf, M.; Mallick, K.; Udelhoven, T. Challenges and future perspectives of multi-/Hyperspectral thermal infrared remote sensing for crop water-stress detection: A review. Remote Sens. 2019, 11, 1240. [Google Scholar] [CrossRef]
  59. Mahlein, A.-K.; Rumpf, T.; Welke, P.; Dehne, H.-W.; Plümer, L.; Steiner, U.; Oerke, E.-C. Development of spectral indices for detecting and identifying plant diseases. Remote Sens. Environ. 2013, 128, 21–30. [Google Scholar] [CrossRef]
  60. Mahlein, A.-K.; Steiner, U.; Hillnhütter, C.; Dehne, H.-W.; Oerke, E.-C. Hyperspectral imaging for small-scale analysis of symptoms caused by different sugar beet diseases. Plant Methods 2012, 8, 3. [Google Scholar] [CrossRef] [PubMed]
  61. Sankaran, S.; Mishra, A.; Ehsani, R.; Davis, C. A review of advanced techniques for detecting plant diseases. Comput. Electron. Agric. 2010, 72, 1–13. [Google Scholar] [CrossRef]
  62. Qin, J.; Burks, T.F.; Ritenour, M.A.; Bonn, W.G. Detection of citrus canker using hyperspectral reflectance imaging with spectral information divergence. J. Food Eng. 2009, 93, 183–191. [Google Scholar] [CrossRef]
Figure 1. Data collection diagram.
Agronomy 15 01106 g001
Figure 2. Chickpea plants of two different varieties grown in separate pots in the field (Marchouch, Morocco) during the vegetative stage, prior to egg infestation.
Agronomy 15 01106 g002
Figure 3. The experiment site at ICARDA in Rabat, Morocco, using hyperspectral camera measuring a line of 1024 pixels with 448 spectral bands on chickpea plant pot.
Agronomy 15 01106 g003
Figure 4. Red-green-blue (RGB) hyperspectral image example for training set.
Agronomy 15 01106 g004
Figure 5. The overall workflow diagram of data processing and modeling pipeline.
Agronomy 15 01106 g005
Figure 6. The spectral profile of 20,000 selected pixels equally labeled as healthy (blue-curves), infested-eggs (red-curves), and infested-larvae (green-curves) in the training set (a) and testing set (b). Spectral data were resampled to ensure balance between the 3 classes.
Agronomy 15 01106 g006
Figure 7. Cumulative variance explained by adding more principal components.
Agronomy 15 01106 g007
Figure 8. Spectral feature-based classification performance between healthy and egg-infested plants for PCA and KPCA random forest pipeline and datasets. Kabuli chickpea dataset (a), desi chickpea dataset (b), and combined dataset (c). This pipeline is evaluated on the test set (d).
Agronomy 15 01106 g008
Figure 9. Spectral feature-based classification performance between healthy and infested larvae plants for PCA and KPCA random forest pipeline and datasets. Kabuli chickpea dataset (a) and combined datasets (b). This pipeline is evaluated on the test set (c).
Agronomy 15 01106 g009
Figure 10. Spectral feature-based classification performance between healthy and egg-larva-infested plants for PCA and KPCA random forest pipeline and datasets. Kabuli chickpea dataset (a) and combined dataset (b). This pipeline is evaluated on the test set (c).
Agronomy 15 01106 g010
Figure 11. Mean decreased impurity (MDI) feature importance among datasets (ac). The normalized scores for 7 VIs were ranked by their respective classification ability. Kabuli chickpea dataset (a), desi chickpea dataset (b), and combined dataset (c). RF and SVM were trained on trainset and the best one (SVM) was evaluated on the test set (d).
Agronomy 15 01106 g011
Figure 12. Mean decreased impurity (MDI) feature importance among datasets (a,b). The normalized scores for 7 VIs were ranked by their respective classification ability. Kabuli chickpea dataset (a) and combined dataset (c). RF and SVM were trained on trainset and the best one (SVM) was evaluated on the test set (c).
Agronomy 15 01106 g012
Figure 13. Mean decreased impurity (MDI) feature importance among datasets (a,b). The normalized scores for 7 VIs were ranked by their respective classification ability. Kabuli chickpea dataset (a) and combined dataset (c). RF and SVM were trained on trainset and the best one (SVM) was evaluated on the test set (c).
Agronomy 15 01106 g013
Table 1. Summary of chickpea pot sizes by health status for each variety during vegetative stage.
Status/PeriodKabuli Variety PotsDesi Variety PotsTotal
Healthy336
Egg Period336
Larvae Period336
Total9918
Table 2. Summary of hyperspectral images (HSI) size by chickpea health status for each variety by 3 pots during vegetative stage.
Status/PeriodData Measurement Time (GMT Central Time)Kabuli Variety Pots Desi Variety PotsTotal
Egg Period6 May 2024
8:30–12:00
6612
Healthy6 May 2024
8:30–12:00
3312
20 May 2024
8:30–12:00
33
Larvae Period20 May 2024
8:30–12:00
606
Total 181230
Table 3. Summary of hyperspectral images (HSI) size by chickpea health status for trainset and test set during vegetative stage.
Status/PeriodKabuli Variety Desi Variety Total
Train SetTest SetTrain SetTest Set
Healthy424212
Eggs Period424212
Larvae Period42006
Total1268430
Table 4. Vegetation indices (VIs) used for classification of chickpea plant health.
Vegetation Index (VI)AcronymEquationReferences
Normalized Difference Vegetation IndexNDVINDVI = (NIR − Red)/(NIR + Red)[36,44]
Enhanced Vegetation IndexEVIEVI = G × (NIR − Red)/(NIR + C1 × Red − C2 × Blue + L)[45,46]
Simple RatioSRSR = NIR/Red[47]
Green Normalized Difference Vegetation IndexGNDVIGNDVI = (NIR − Green)/(NIR + Green)[45,48]
Modified Simple RatioMSRMSR = [(NIR/Red) − 1]/√[(NIR/Red) + 1][49]
Photochemical Reflectance IndexPRIPRI = (Red531 − Red570)/(Red531 + Red570)[46]
Normalized Difference Red EdgeNDRENDRE = (NIR − RedEdge)/(NIR + RedEdge)[48,50]
Disclaimer/Publisher’s Note: The statements, opinions and data contained in all publications are solely those of the individual author(s) and contributor(s) and not of MDPI and/or the editor(s). MDPI and/or the editor(s) disclaim responsibility for any injury to people or property resulting from any ideas, methods, instructions or products referred to in the content.

