Article

Weed Abundance, Seed Bank in Different Soil Tillage Systems, and Straw Retention

by
Sinkevičienė Aušra
1,2,*,
Bogužas Vaclovas
1,2,
Sinkevičius Alfredas
2,
Steponavičienė Vaida
1,
Anicetas Lenkis
2 and
Kimbirauskienė Rasa
1,2,*
1
Bioeconomy Research Institute, Vytautas Magnus University, K. Donelaičio Street 58, 44248 Kaunas, Lithuania
2
Department of Agroecosystems and Soil Sciences, Vytautas Magnus University, K. Donelaičio Street 58, 44248 Kaunas, Lithuania
*
Authors to whom correspondence should be addressed.
Agronomy 2025, 15(5), 1105; https://doi.org/10.3390/agronomy15051105
Submission received: 28 February 2025 / Revised: 23 April 2025 / Accepted: 24 April 2025 / Published: 30 April 2025
(This article belongs to the Section Weed Science and Weed Management)

Abstract

:
Comprehensive studies are needed to investigate the diversity, abundance, and seed bank of weeds in winter wheat, spring barley, and spring oilseed rape crops due to a lack of experimental studies. Tillage has a long-term impact on agroecosystems. Since 1999, a long-term field experiment has been conducted at the Experimental Station of Vytautas Magnus University. The soil of the experimental site is classified as Epieutric Endocalcaric Planosol (Endoclayic, Episiltic, Aric, Drainic, Endoraptic, Uterquic), according to the World Reference Base. Treatments were arranged using a split-plot design. According to the factorial field experiment, the straw was removed from one part of the experimental field, and on the other part of the field, the straw was chopped and spread at harvesting (factor A). Six tillage systems, conventional (deep) and shallow plowing, shallow loosening, shallow rotovation, catch cropping and rotovation, and no tillage, were used as a subplot (factor B). The current study results show that the number of annual, perennial, and total weeds and the dry matter biomass decreased in shallow-plowed plots compared to deep-plowed plots. Different applied tillage treatments had different effects on perennial weeds. In the upper (0–10 cm) soil layer studied, the number of annual, perennial, and total weed seeds decreased in the fields where the straw was chopped and spread compared to the fields where the straw was removed. In the deeper soil layer (10–25 cm), no tillage with cover crops and direct seeding without cover crops reduced the number of annual and perennial weed seeds compared to deep tillage. The aim of this experiment was to investigate the effects of long-term tillage of different intensities and straw retention systems on weeds in crop fields. The results were obtained in 2019 and 2021 (winter wheat, spring barley, spring oilseed rape).

1. Introduction

Weeds are among the most significant biotic stressors affecting crop productivity. Their presence in arable land can substantially reduce crop yield and quality due to them competing for water, nutrients, light, and space. Weed infestation is influenced by several factors, including climatic conditions, soil properties, crop rotation patterns, and especially tillage practices [1,2]. In general, weeds are well suppressed by cultivated crops such as rapeseed, especially if conditions are good during the later growth stage [3].
Conventional tillage practices, such as deep plowing, have long been considered effective in managing weed populations by burying weed seeds and disrupting established root systems. However, these methods also contribute to soil degradation, organic matter depletion, and increased erosion risks. In contrast, reduced-tillage practices—including shallow plowing, no till, and minimal soil disturbance—are gaining popularity for their benefits in improving soil structure, conserving moisture, and reducing energy inputs. Yet, these systems often lead to an increase in the number of perennial and annual weeds, as well as a change in their species diversity. Thereby, the abundance of weeds in cultivated crops can be controlled in various other ways: for example, with herbicides, agrotechnics can be applied. Weed spread can also be halted by applying appropriate crop rotations by direct sowing into uncultivated soil [4,5].
Straw retention, either through mulching or incorporation into the soil, can further influence weed dynamics. Retained straw can create a physical barrier to light and modify the soil microclimate, affecting weed seed germination and seedling emergence. It can also alter nutrient cycling and microbial activity, which indirectly impact weed competition. Therefore, straw application and reduced tillage have both been reported to improve soil quality [6]. Studies conducted by some Lithuanian and foreign scientists have established that the conventional intensive tillage system, which consists of the main tillage, stubble cultivation and deep plowing in autumn and pre-sowing soil cultivation, harrowing, and rolling, is a more reliable way to destroy weeds, incorporate plant residues, loosen the compacted soil surface, and prepare a suitable seed bed than sowing in shallow loosened or completely uncultivated soil [7]. There are many weed management techniques that can reduce reliance on herbicides, such as direct seeding, competitive varieties, increased seeding rates, strategic fertilizer planting, silage, and cover crops, which all have excellent weed suppression potential [8]. Crop residues can be used in weed management in two ways; they can be used after selecting the appropriate residue of the crop variety when incorporated into the soil, and residues or straw can also be used as mulch on the soil surface in a rotational manner, a sequence that allows residues to remain in the field [9]. Crop residues are the most successful, efficient, and readily available material for weed management [10]. Cover cropping is one strategy that can suppress weeds and enhance pollution-free harvest as a secure approach to achieving global food security for future generations [11]. Crop residues help sustain the agroecosystem through reduced erosion, water conservation, increased biodiversity, nutrient cycling, biological nitrogen fixation, increased soil organic matter, improved weed control [12], and increased crop yields. Therefore, using wheat residues (straw) as mulch or incorporating them into the soil can be useful in controlling weeds in sesame crops and for increasing seed yield.
The number of weeds in soil is more influenced by tillage practices than by crop rotations. In reduced-tillage systems, weediness tends to increase substantially because the number of weed seeds at a depth of 0–10 cm increases significantly, while shallow seed depths create much more favorable conditions for germination [13]. To avoid an increase in weediness in reduced tillage systems, it is necessary to choose the optimal timing for sowing and herbicide application [14,15].
The prevalence of certain weed species in soil depends more on the soil properties and agronomic conditions than on the type of agricultural crop planted. The abandonment of plowing, the reduction in tillage, and in particular sowing in uncultivated soils increases weediness, especially the spread of perennial weeds [5,16]. In Finland, 40 different weed species were found in weed surveys in oilseed rape fields in 2007–2009. Kosteckienė [17] argues that weed characteristics such as greater genetic diversity and phenotypic plasticity give weeds an advantage over many crop species, especially under changing environmental conditions. Therefore, agriculture may be threatened by increased competition from weeds as an indirect effect of climate change [18].
Research has shown that crop yields depend on the prevalence of diseases, pests, and weeds [19,20]. Weeds are a major limiting factor in plant growth, reducing yield and quality [21]. Geddes et al. [22] point out the fact that weeds account for about 34% of yield losses, while yield losses due to pests and pathogens are lower, at about 16–18%. Weeds “rob” crops by taking up nutrients dissolved in moisture and spreading plant diseases and pests. Weeds are better adapted to soil and climatic conditions than cultivated plants, tolerate nutrient deficiencies better, and more easily survive dry periods. They are said to evaporate more moisture than cultivated plants. Neither tillage nor herbicides can eradicate all weeds in crops. Some of them always remain intact [23]. Weeds survive in cultivated fields thanks to their distinctive biological characteristics, which often make them superior to cultivated plants [24]. According to Marcinkevičienė et al. [25], the ability of agricultural plants to outcompete weeds is determined by the increase in crop biomass and the decrease in light flux at the soil surface.
Despite the above-mentioned interactions, the combined effects of long-term tillage systems and straw retention on weed abundance and the composition of soil weed seed banks remain underexplored, particularly under temperate agroecological conditions. However, the complex evaluation index (CEI) can be used to address and visualize these long-term issues. This methodological tool is designed to comprehensively assess soil condition and ecosystem function by integrating multiple parameters into a single assessment system. This method allows for the comparison of different tillage technologies and the impact of straw according to individual indicators and their overall impact on agroecosystems.
This study aimed to fill that gap by evaluating the long-term influence of different tillage intensities and straw management practices on weed abundance, species composition, and weed seed bank dynamics across winter wheat, spring barley, and spring oilseed rape cropping systems.

2. Materials and Methods

2.1. Study Sites

The stationary experiment was set up in 1999 at the Experimental Station of VMU Agriculture Academy. The studies were carried out in 2019–2021. The field soil of the experimental site is a deeper gleyic saturated loamy soil according to the Lithuanian soil classification (LTDK–99) [26], and according to the international classification [27], it is Epieutric Endocalcaric Endogleyic Planosol (Endoclayic, Aric, Drainic, Humic, Episiltic) [1].
Experimental design. The experiment was arranged in a split-plot design with four replicates, comprising a total of 48 plots. The size of the main plots was 102 m2 (6 × 17), with 30 m2 (15 × 2.0) used for the reference plot. Crop rotation included spring oilseed rape, winter wheat, and spring barley. In one part of the experimental field, straw was removed (S0), and in the other part, it was chopped and spread (S1). All tillage systems were tested under both the no-straw and the straw-spread conditions.
Factor A. Straw Management
  • Without straw (S0);
  • With straw (S1).
Factor B. Tillage system
  • Conventional (deep) plowing at a depth of 23–25 cm (CP), control;
  • Shallow plowing at a depth of 10–12 cm (SP);
  • Shallow cultivation at a depth of 8–10 cm (SC);
  • Stubble over winter and shallow cultivation before sowing at a depth of 4–5 cm (SOW);
  • No till with cover crops (NTC);
  • No till without cover crops (NT).

2.2. Weeds in Crop Field

The weed species composition and weed density were evaluated at the end (BBCH 80) of the spring rape (Brassica napus L.), (BBCH 89) winter wheat (Triticum aestivum L.), and (BBCH 89) spring barley (Hordeum vulgare L.) vegetative period in 10 randomly selected spots for each plot. A set of 20 × 30 cm metal frames were used for this purpose. Samples of weeds (biomass g m−2 and number m−2) were taken before harvest. The data were converted to number m−2. The same frames were used to establish the biomass of the weed aerial part (g m−2) at the end of the spring rape, winter wheat, and spring barley vegetative period using the Stancevičius [28] method. The fresh biomass of weeds was dried under laboratory conditions. The air-dried biomass is presented in this study. The number and dry biomass of annual and perennial weed species were determined. The total number of weeds was converted into number m−2 and all dry biomass into g m−2.

2.3. Crop Weed Seed Bank

The size of the weed seed bank in the soil was determined at 0–10 and 10–20 cm depth after crop harvest, with a minimum of 10 plots per plot. Soil samples were taken with an agrochemical drill and mixed, and a composite sample was formed. Samples of the seed bank were taken after harvest. The air-dried soil sample (100 g) was washed with running water through a 0.25 mm sieve until the soil particles were removed. The weed seeds and the rest of the mineral soil were separated from the organic part with a saturated saline solution. The samples were left to dry in the laboratory under air-dry conditions [29]. Samples were placed in Petri dishes and examined under a binocular microscope to identify weed species. Weed seed species were identified according to illustrated manuals [30]. Viable seeds were assessed with gentle finger pressure [31]. The total number of viable seeds in each sample was counted, and the seed density was expressed as the number of seeds per square meter.

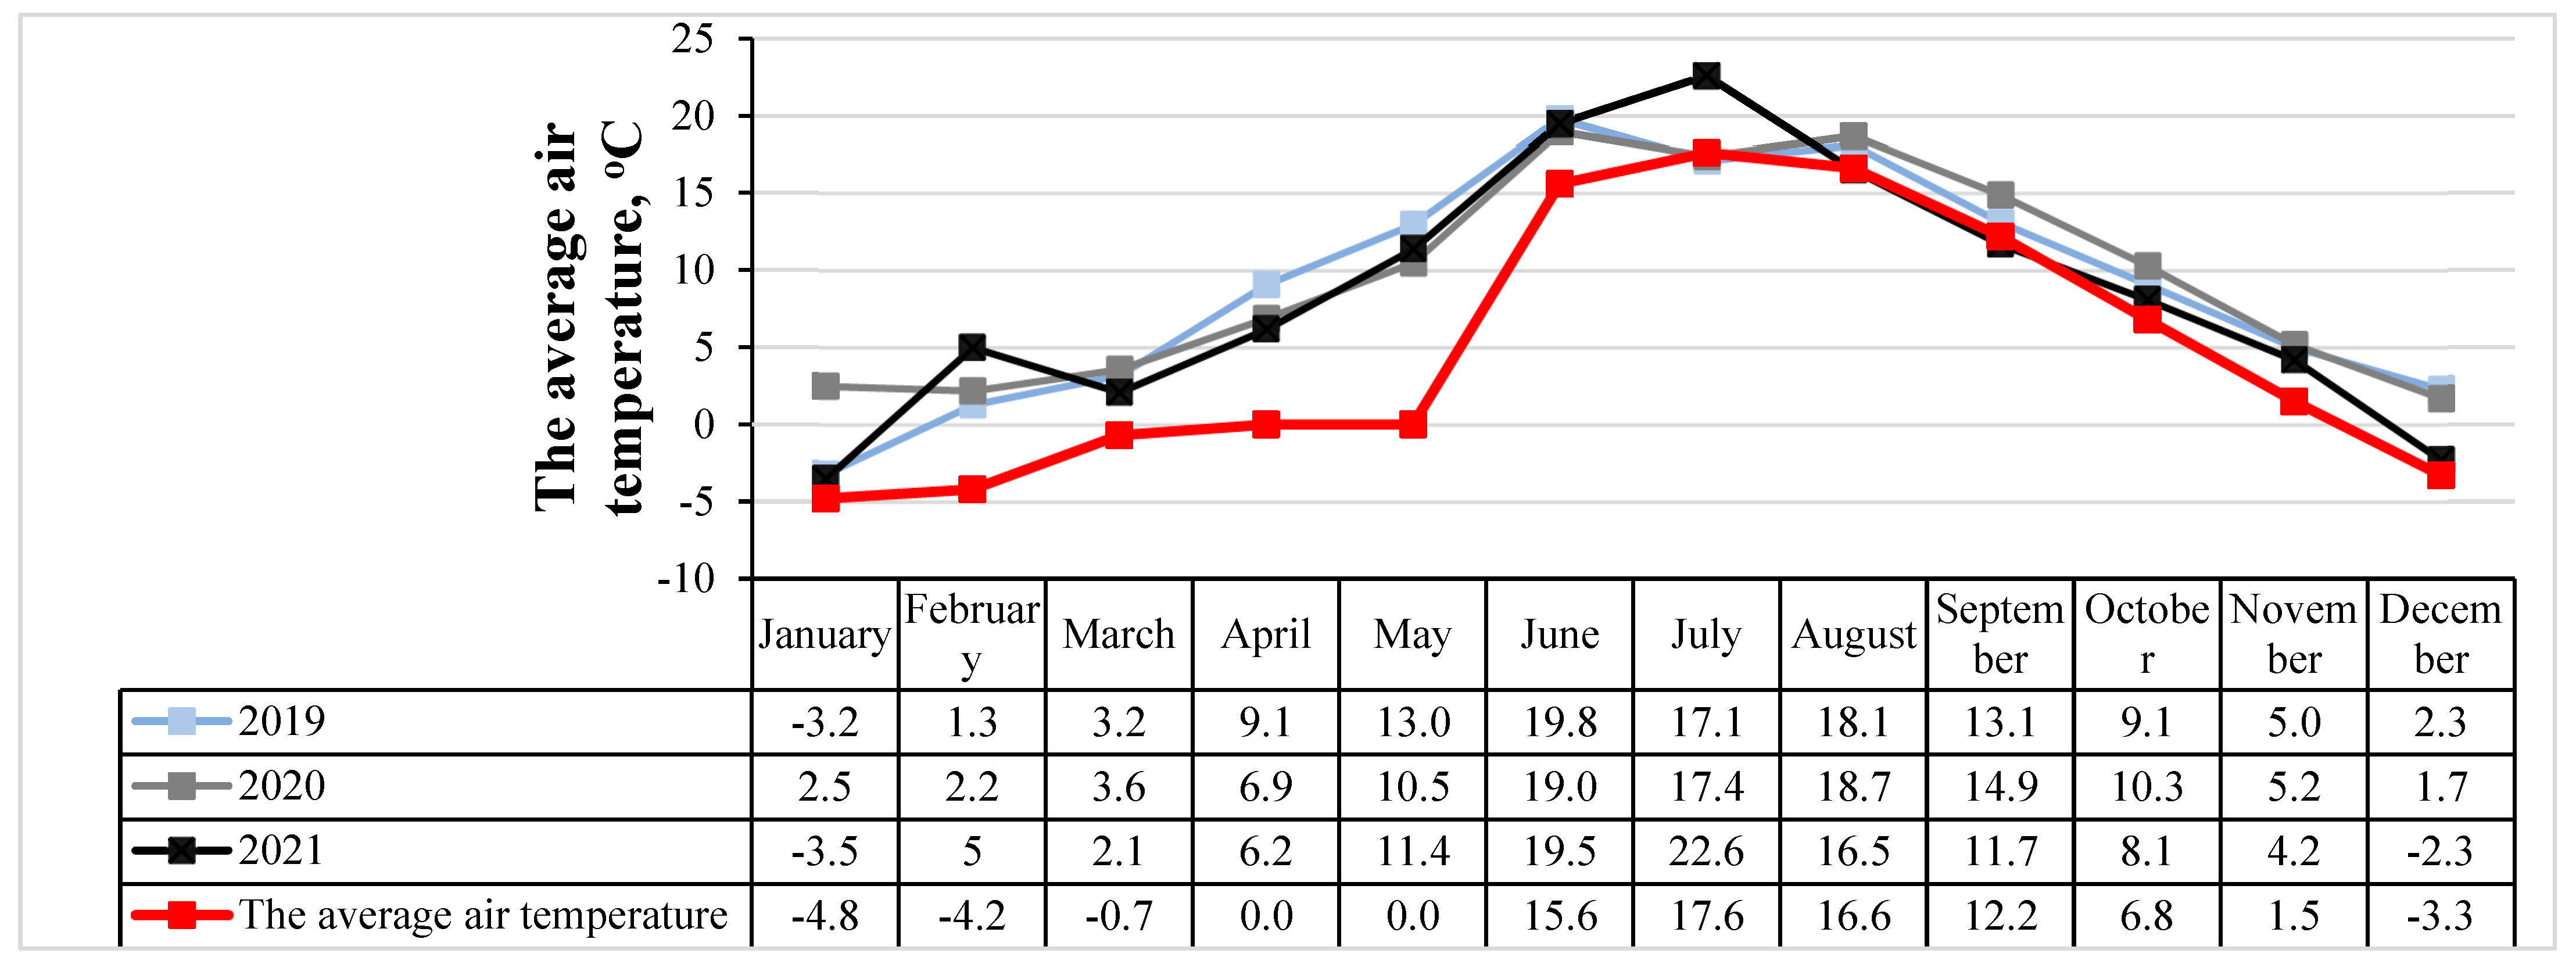
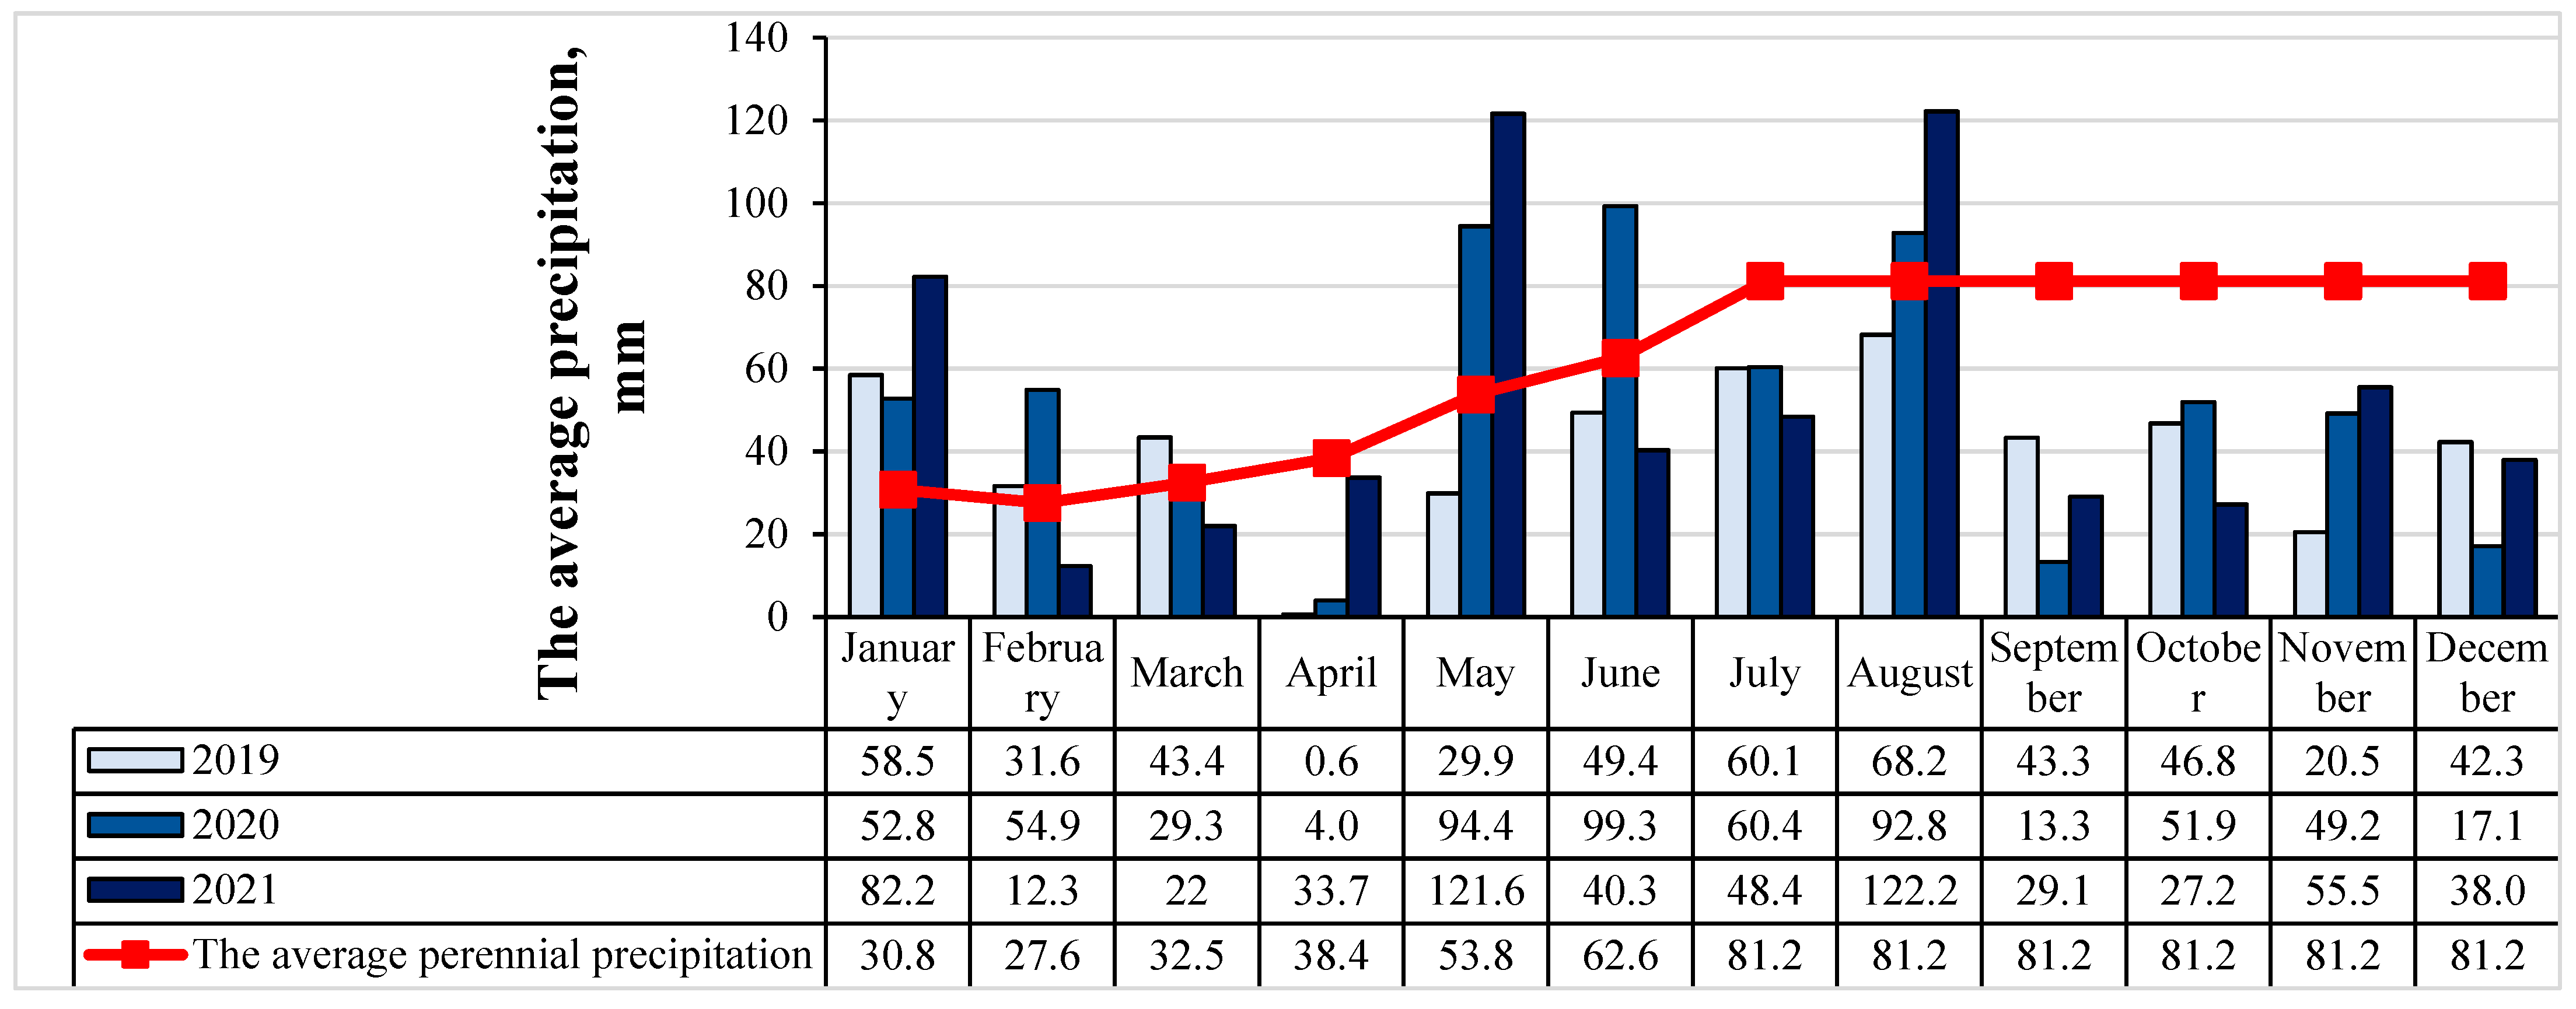
2.4. Meteorological Conditions

In 2019, the amount of precipitation during the vegetation period was lower (108.1 mm), and the average daily air temperature was higher (8.92 °C) than the multi-year average (Figure 1 and Figure 2). In 2020, the air temperature (from 2.2 to 18.7 °C) and the distribution of precipitation (from 4.0 to 99.3 mm) were very uneven.
In 2021, the amount of precipitation at the beginning (May—121.6 mm) and at the end (August—122.2 mm) of the crop vegetation period was higher (67.8 and 41.9 mm), and the temperature (11.4 and 16.5 °C) was similar to the multi-year (12.3 and 16.6 °C) average. And in the middle of the vegetation period, the amount of precipitation (40.3 and 48.4 mm) was too low, and high air temperatures prevailed (19.5 and 22.6 °C).
Summarizing the meteorological conditions of the research year, it can be stated that the air temperatures recorded in October, November, January, February, and March were higher compared to the multi-year average (Figure 1 and Figure 2). Precipitation was lower in April and September and higher in October compared to the multi-year average.

2.5. Statistical Analysis

The two-year results were calculated using a two-factor analysis of variance (ANOVA) using the SPSS F test of the computer software package [32]. The research data were processed by analysis of variance using the SYSTAT 12 computer program. The significance of the differences between the means of the variants was assessed with an LSD test at 95%, 99%, and 99.9% confidence levels. Weediness research data that did not comply with the law of normal distribution were transformed using the mathematical function y = lg10(x + 1) before the statistical analysis. Correlations between traits were assessed by correlation analysis by calculating the correlation coefficient r and its reliability at 95 and 99% confidence levels, and by calculating regression equations with the STAT computer program from the program package SELECTION [33]. The interrelationship of the tested variables was evaluated with correlation–regression analysis using the STAT ENG software. The significance levels for differences between specific treatments and the control are indicated as follows: * for 0.010 < p ≤ 0.050 (significant at the 95% confidence level); ** for 0.001 < p ≤ 0.010 (significant at the 99% confidence level); and *** for p ≤ 0.001 (significant at the 99.99% confidence level). The research data statistical analysis revealed a significant interaction between years in most cases, and therefore, the data for each year are presented separately. A significant interaction between years was identified, so we presented data for individual years.

2.6. Comprehensive Assessment of Different Tillage Systems and Straw Methods

A detailed assessment of the impact of various tillage systems and straw on the agroecosystem was carried out following the methodology of G. Lohmann (1994) and K.U. Heyland (1998) [34,35]. The assessment included several studies and mathematical calculations: determining the values of different indicators, calculating evaluation points (EPs) to standardize indicators expressed in different units, and converting values to a unified scale. A score of 1 corresponds to the worst or minimum value, while a score of 9 represents the best or optimal value. The remaining values for a given indicator were calculated using the following formula:
EPi = (XiXmin)·(XmaxXmin) − 1 × 8 + 1
where EPi is the evaluation point for a given indicator, Xi is the specific measured value, Xmax is the maximum value for that indicator, and Xmin is the minimum value. The standardized indicators are displayed on grids with a scale ranging from 1 to 9. The scale also includes the average value of the individual indicators, known as the score threshold, which is set at 5 and distinguishes between high and low scores. The effectiveness of the given method is represented by the area enclosed by the scores of all its indicators. The complex evaluation index (CEI) was also calculated, incorporating the average evaluation points, the standard deviation of the evaluation points, and the standard deviation of the average score of values below the evaluation threshold. This method makes it possible to objectively and comprehensively assess the impact of different tillage systems and straw on the agroecosystem and to compare their effectiveness more easily.

3. Results

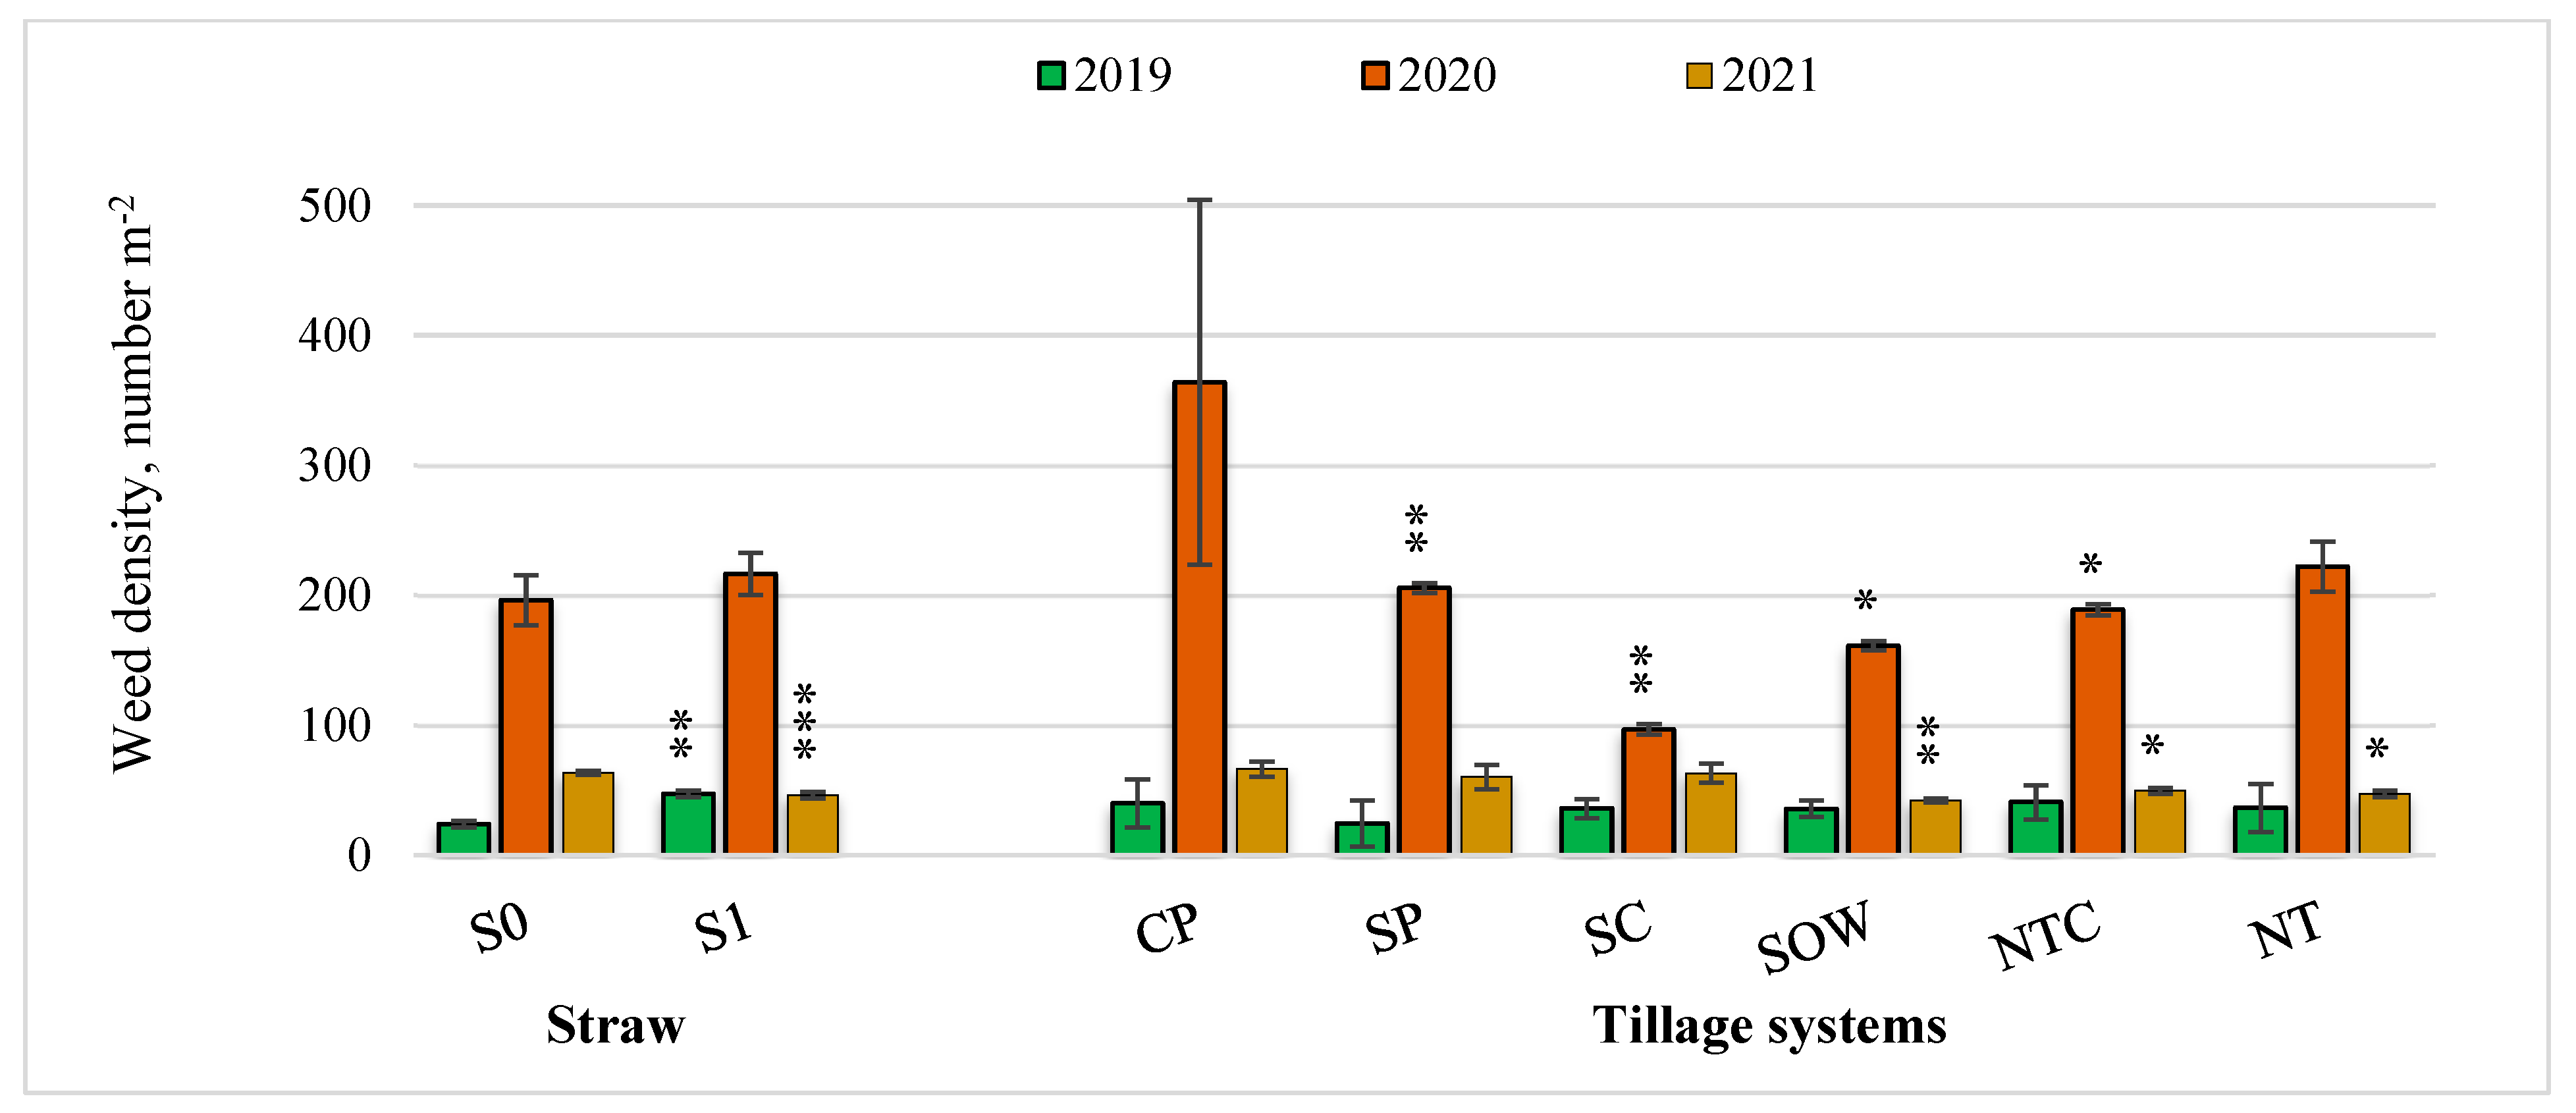
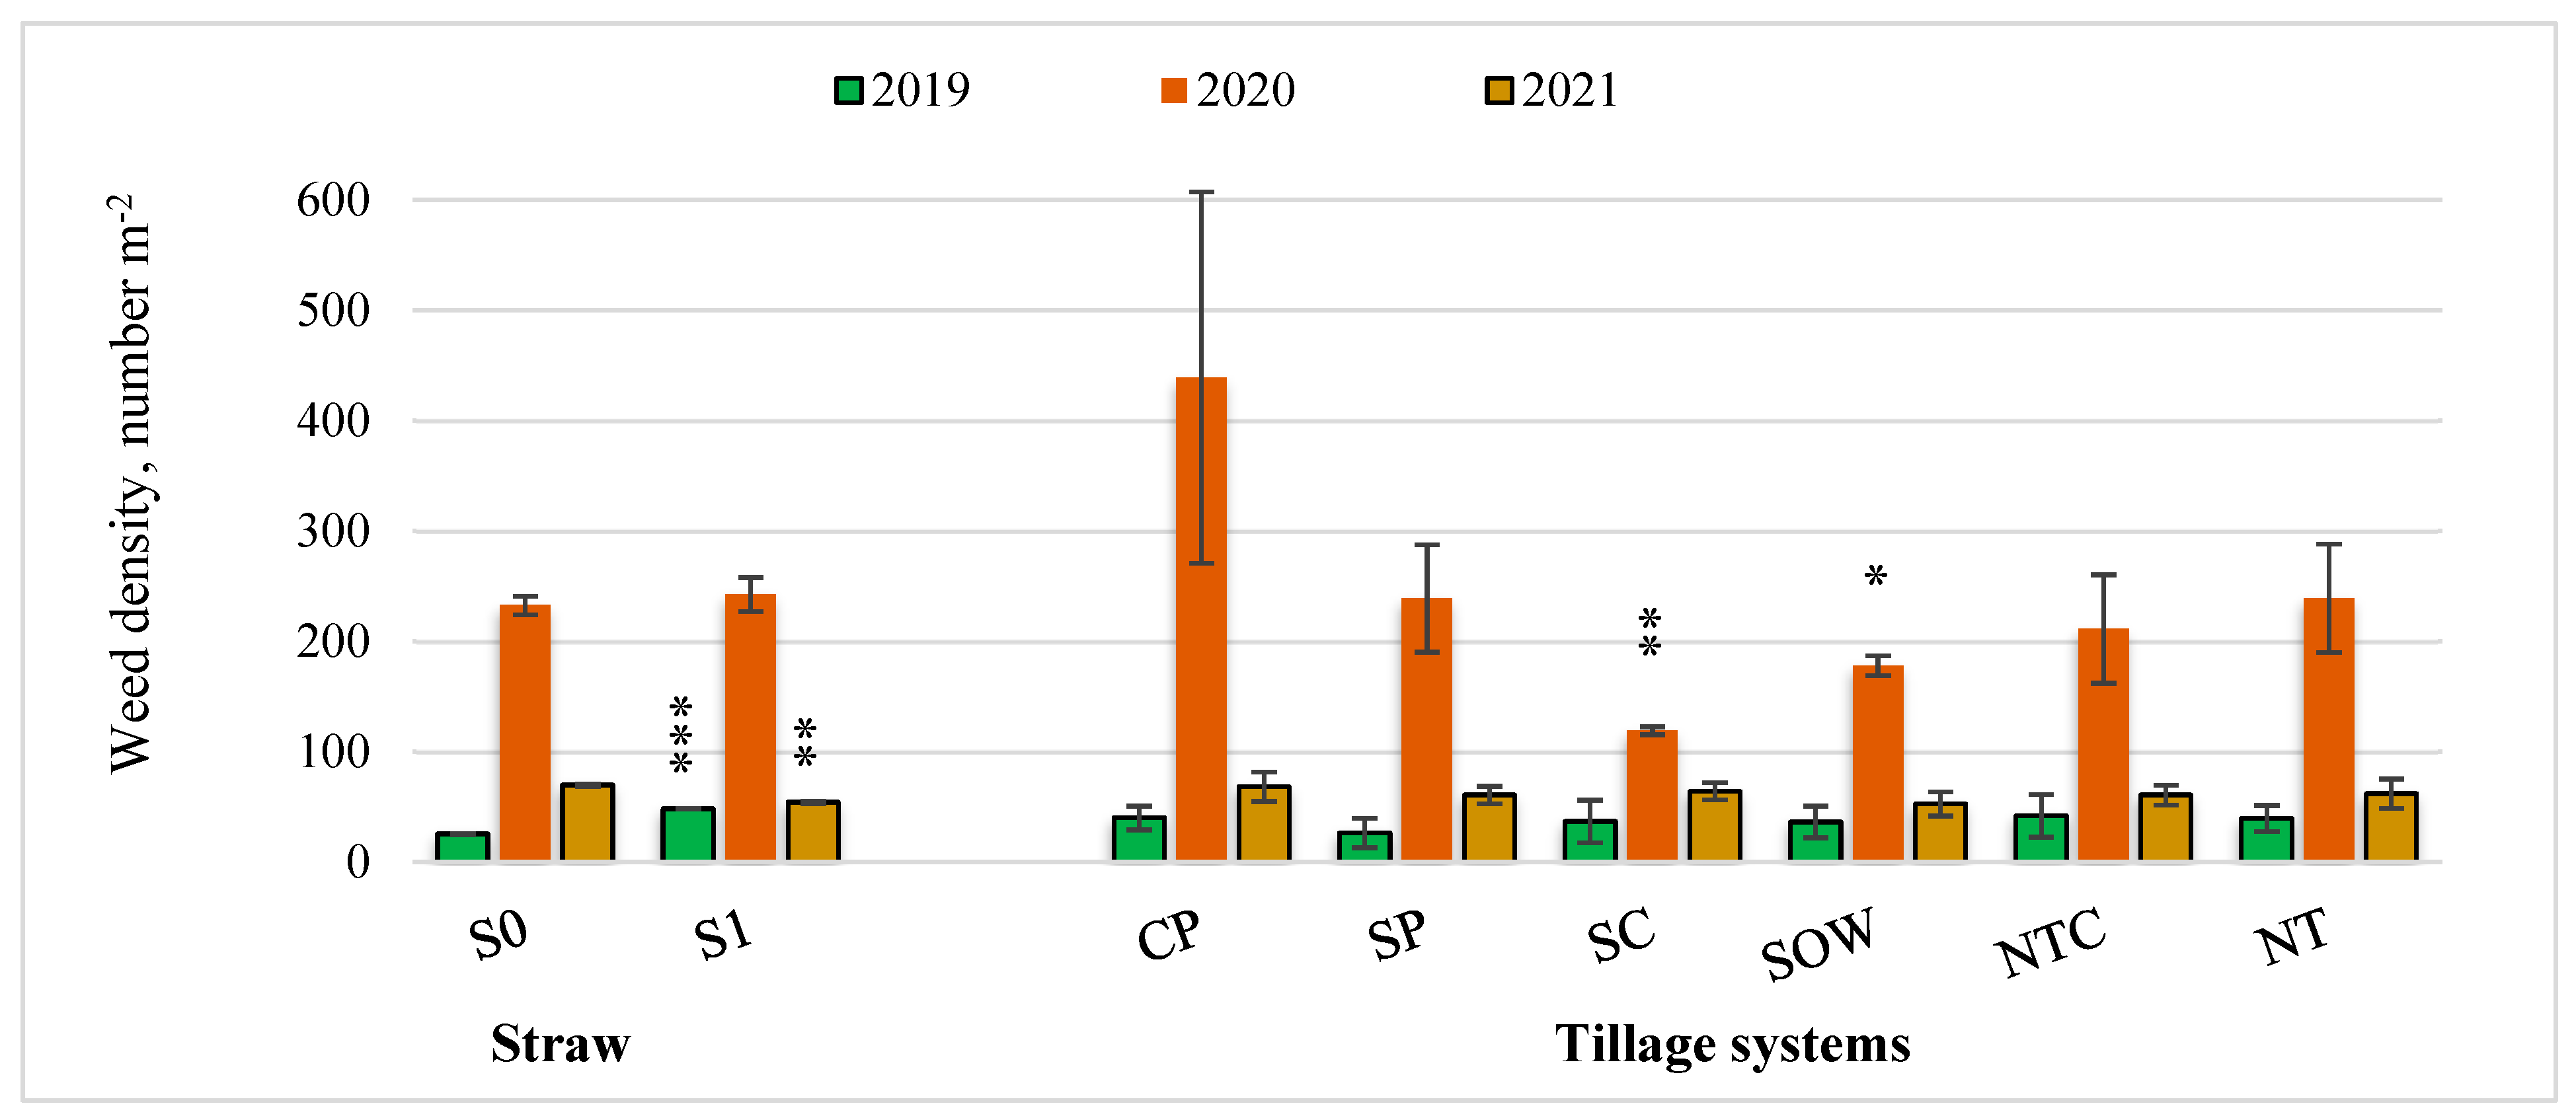
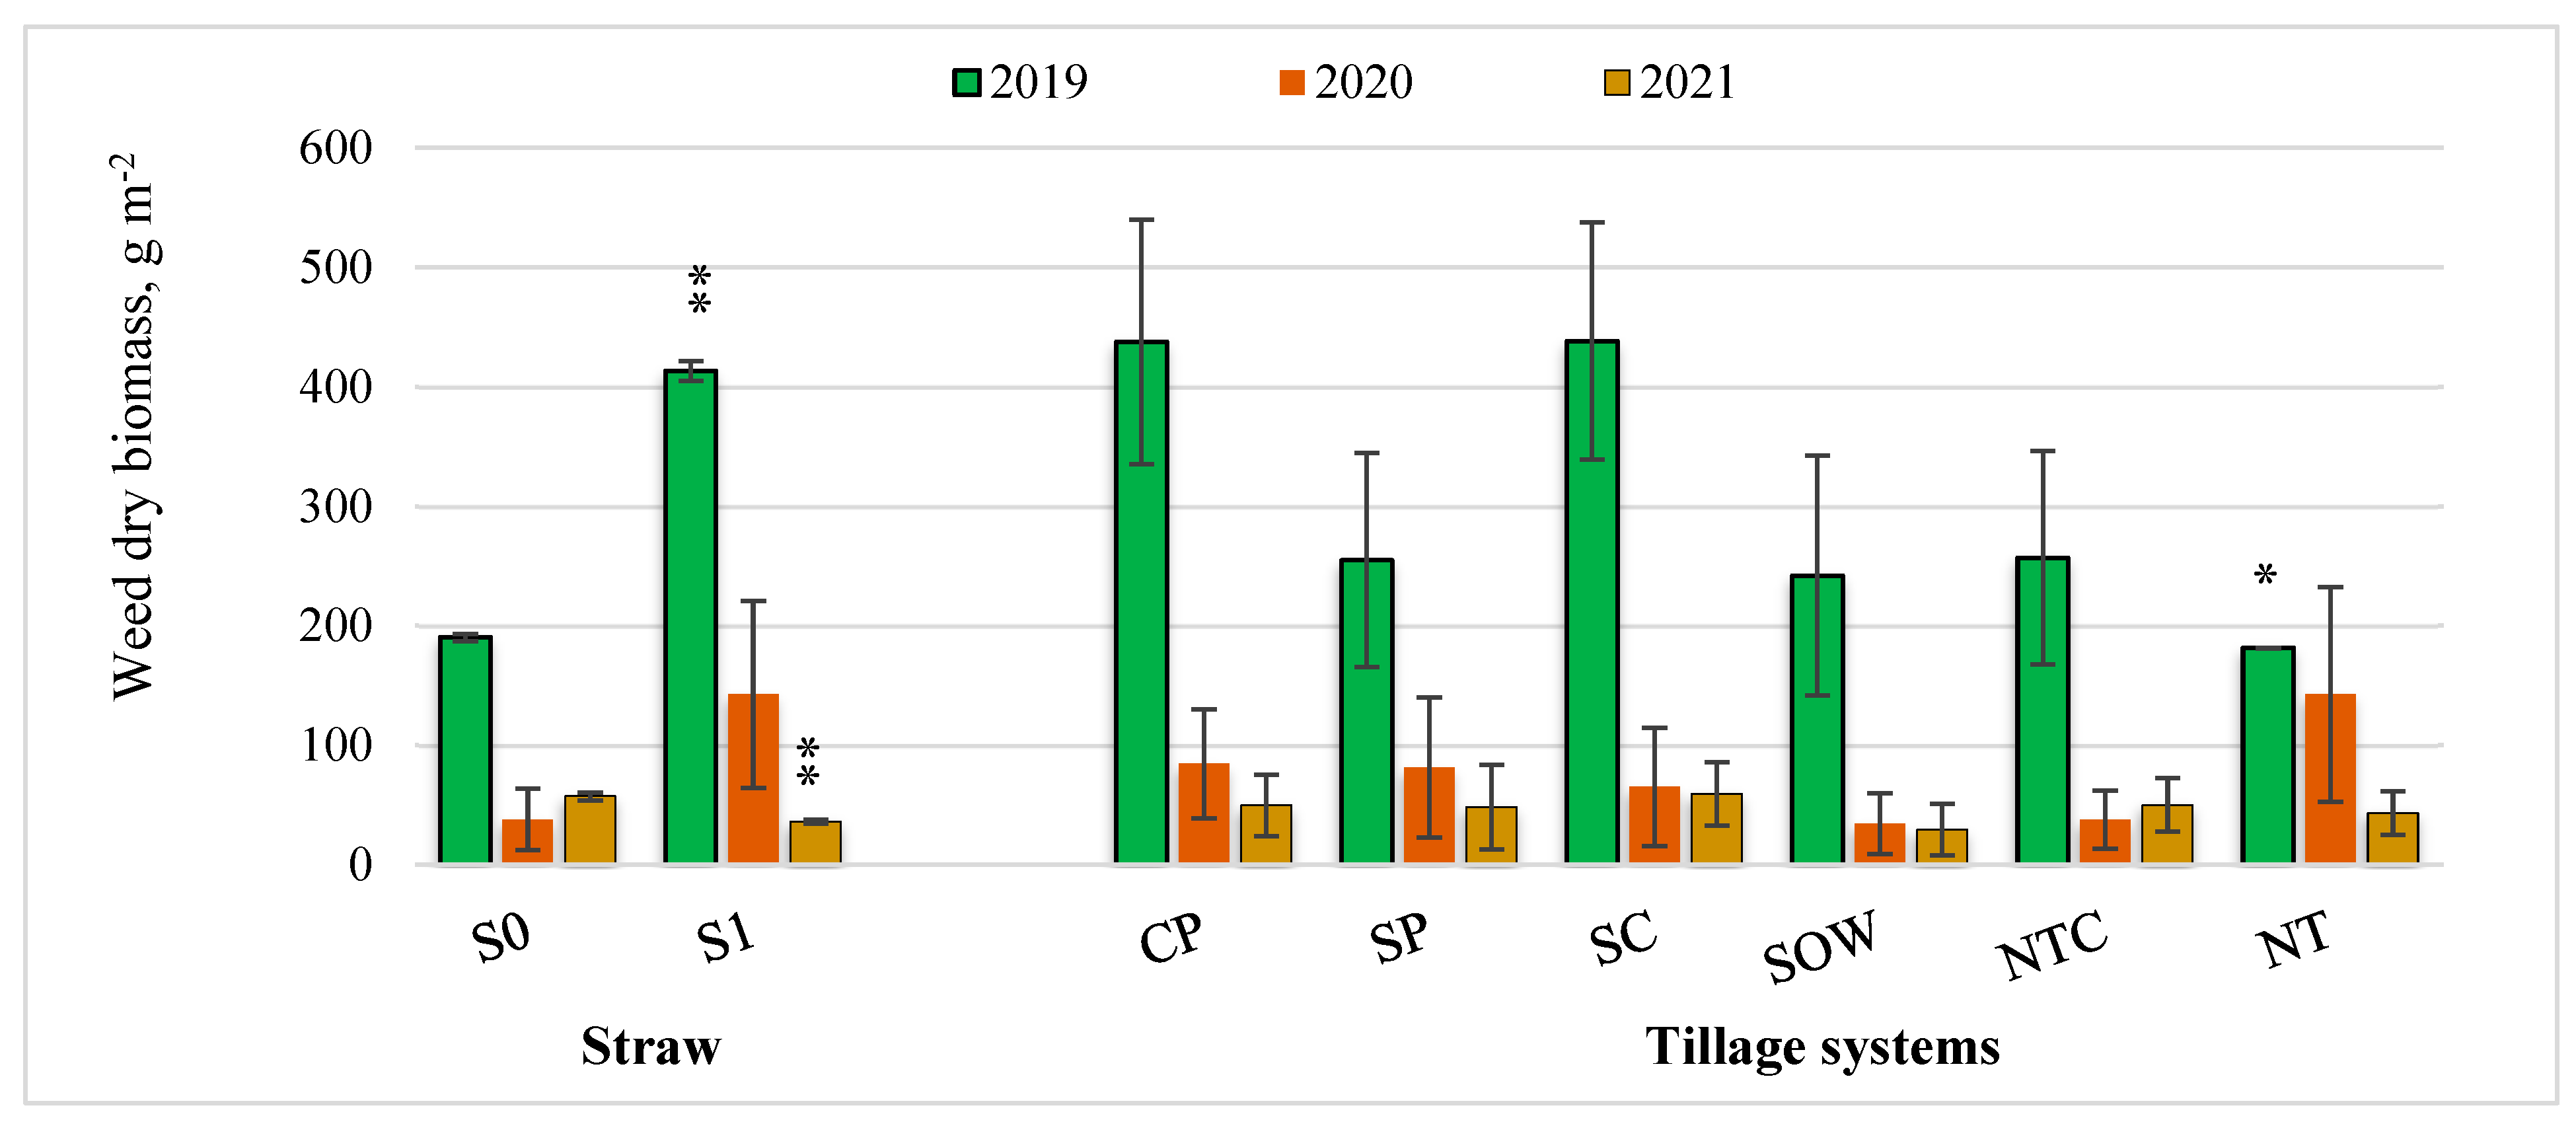
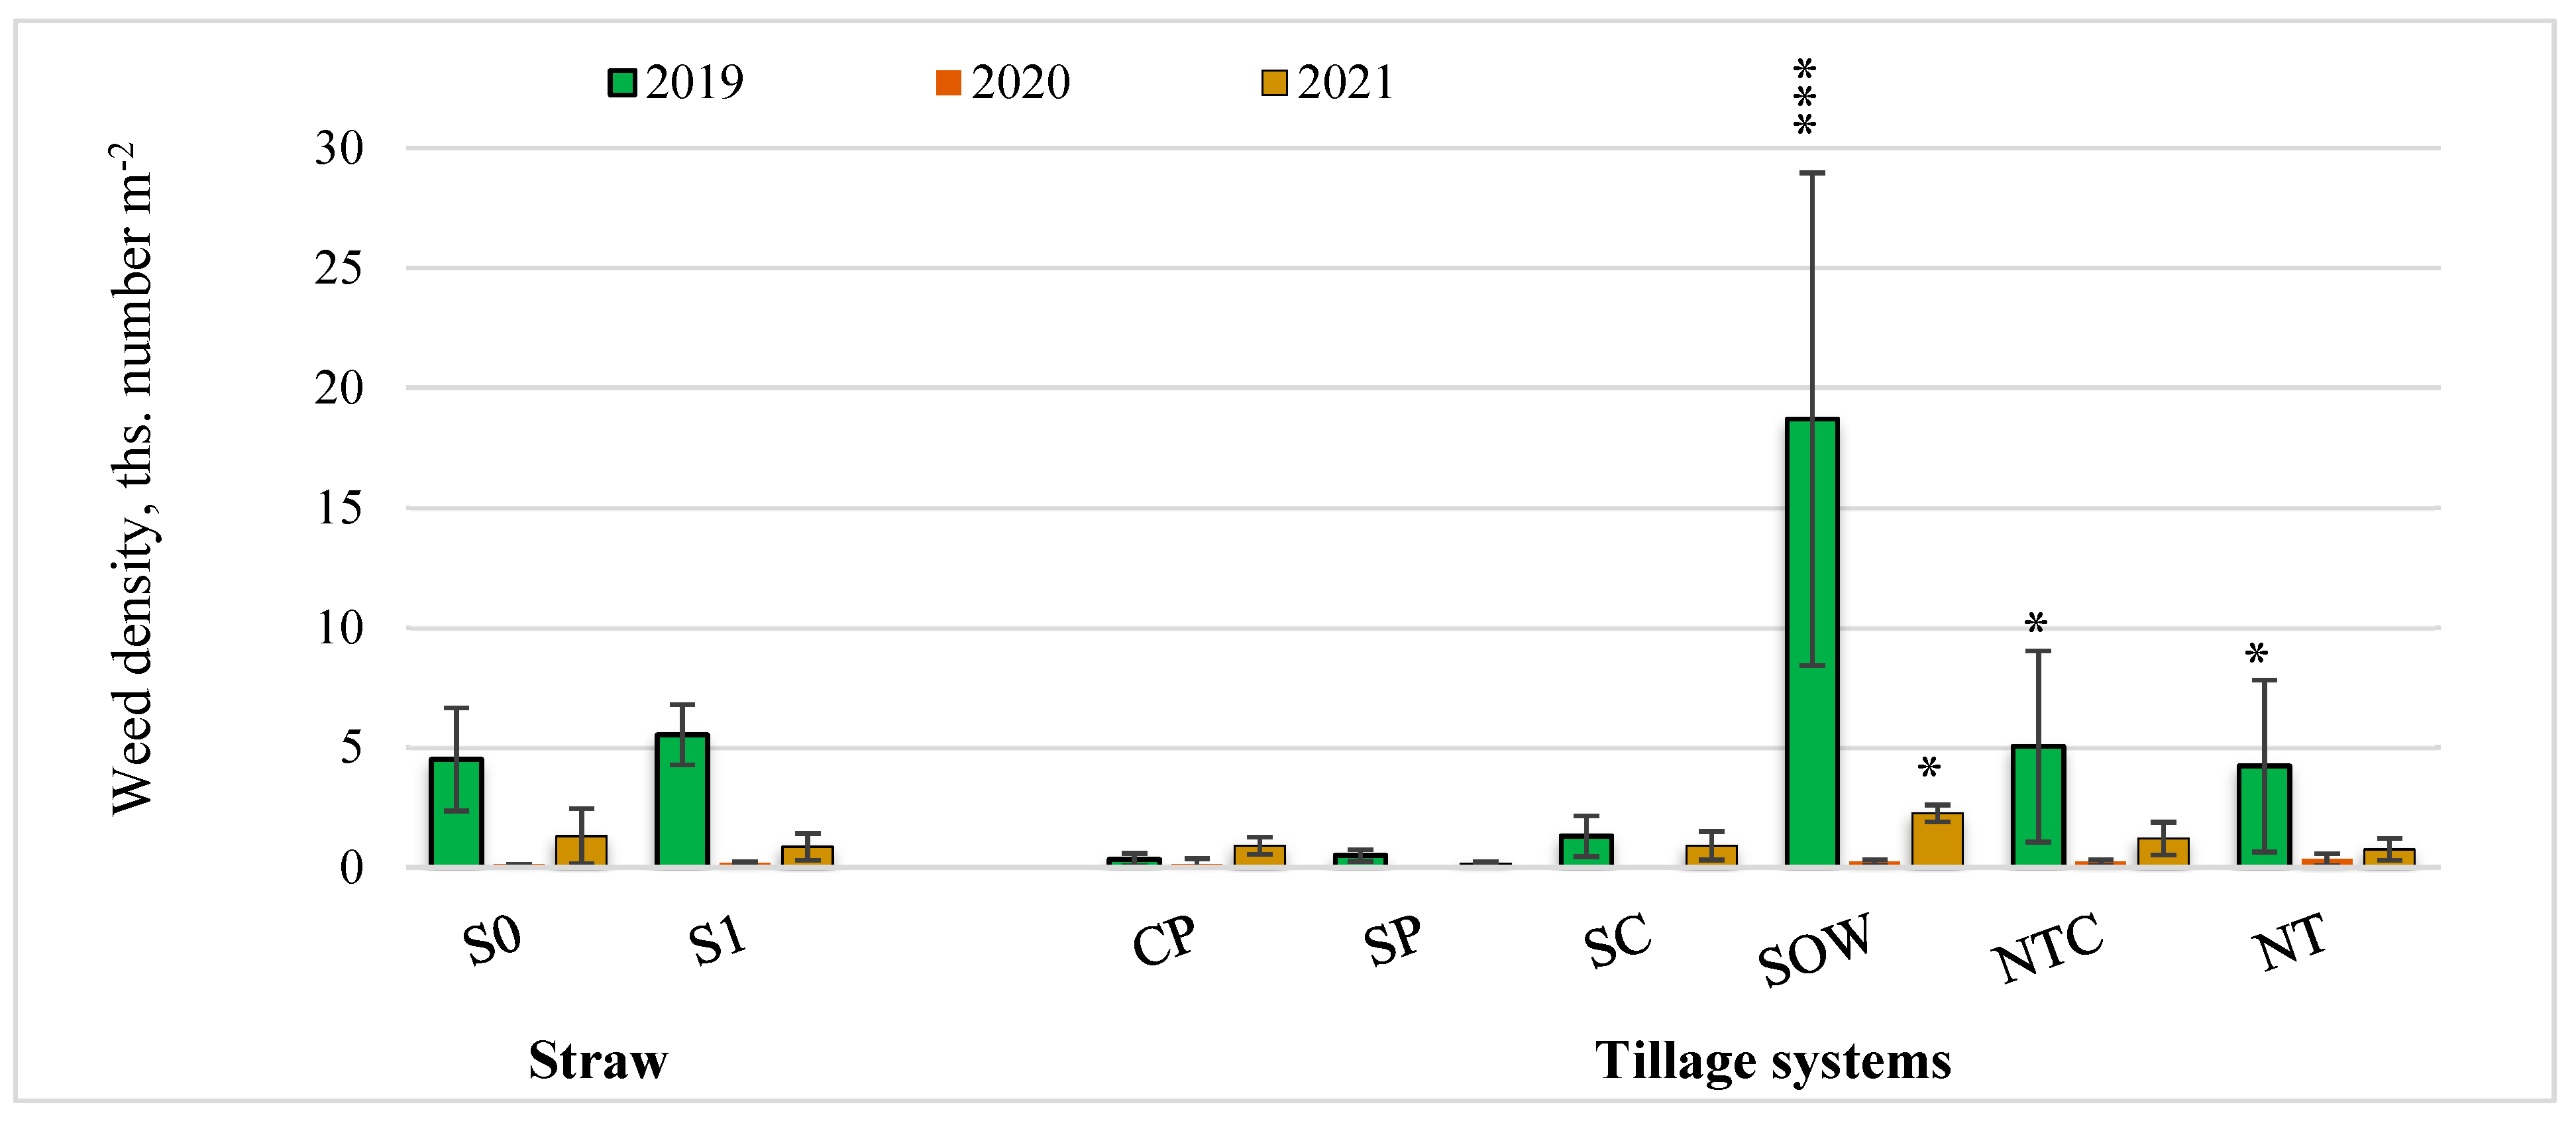
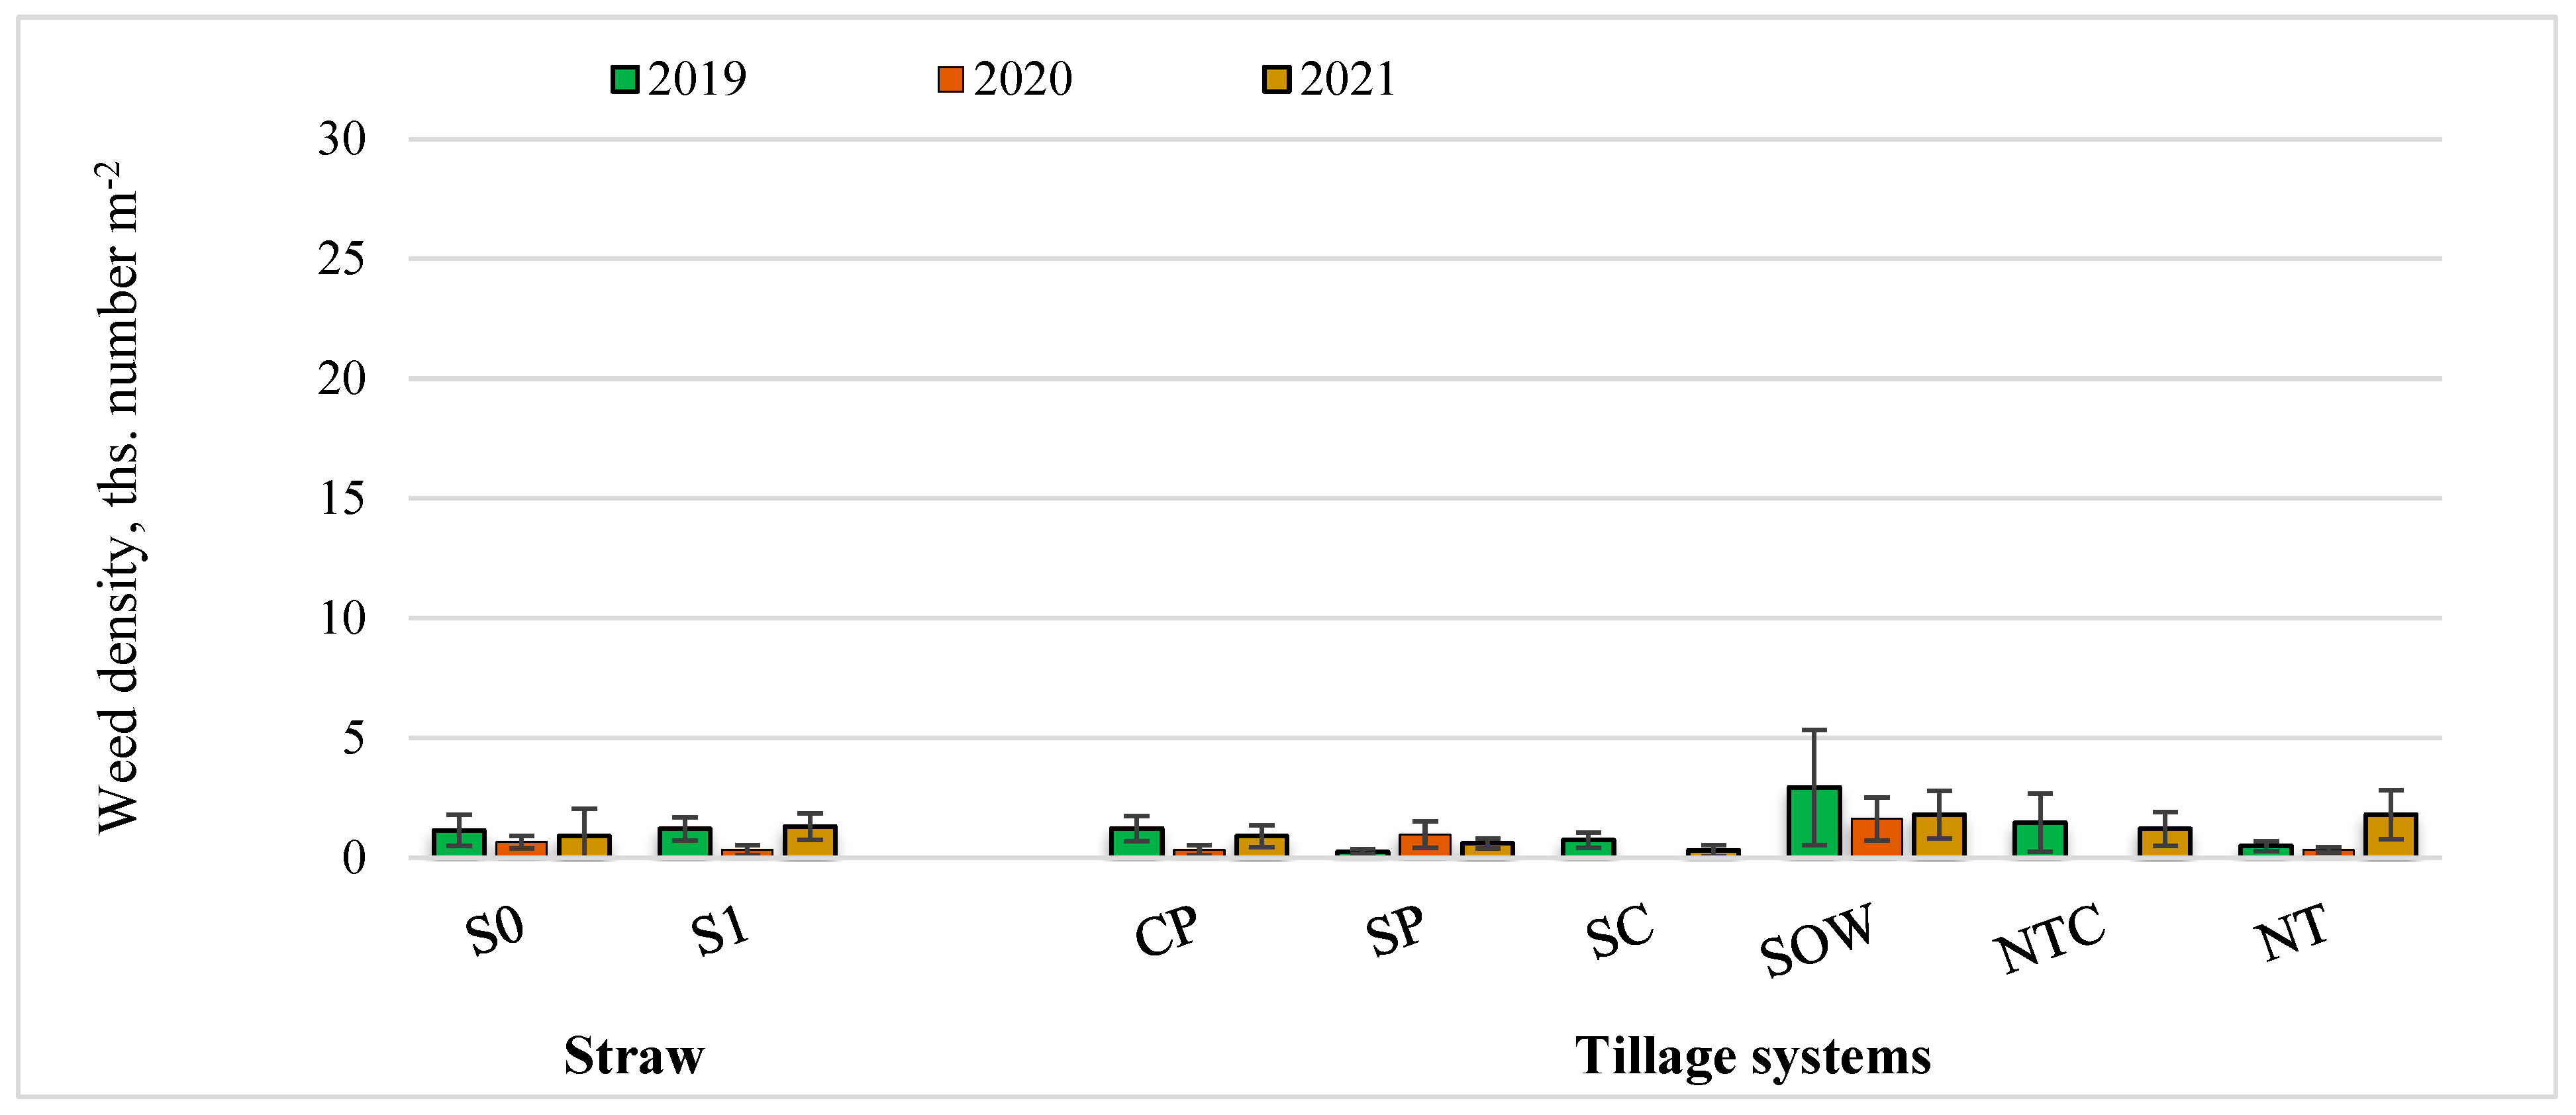
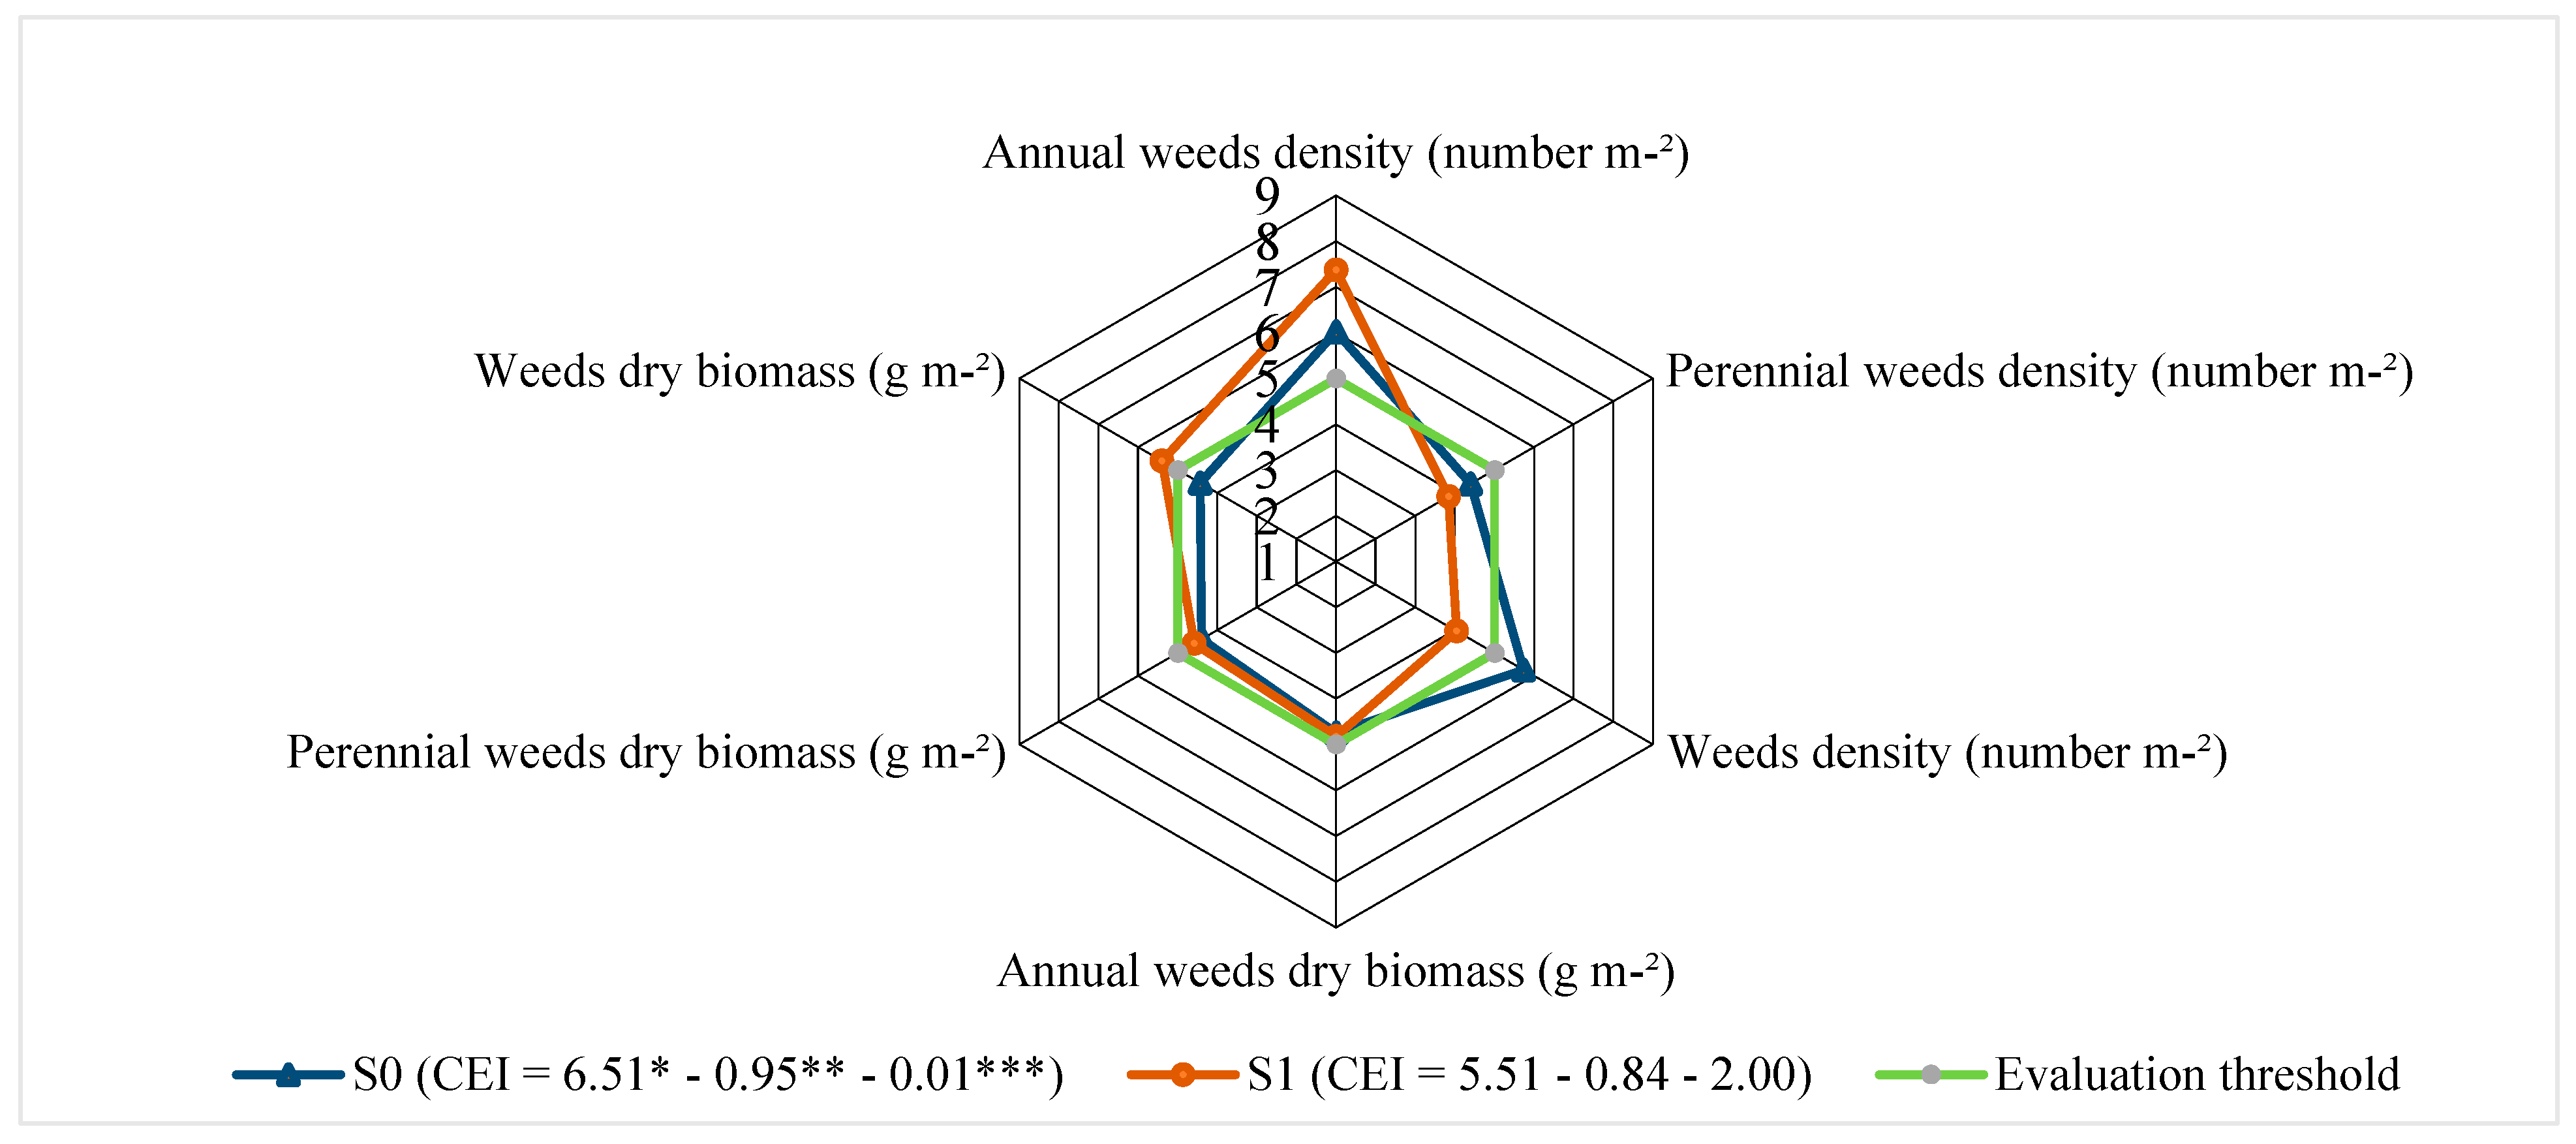
3.1. Weeds in Crop Fields
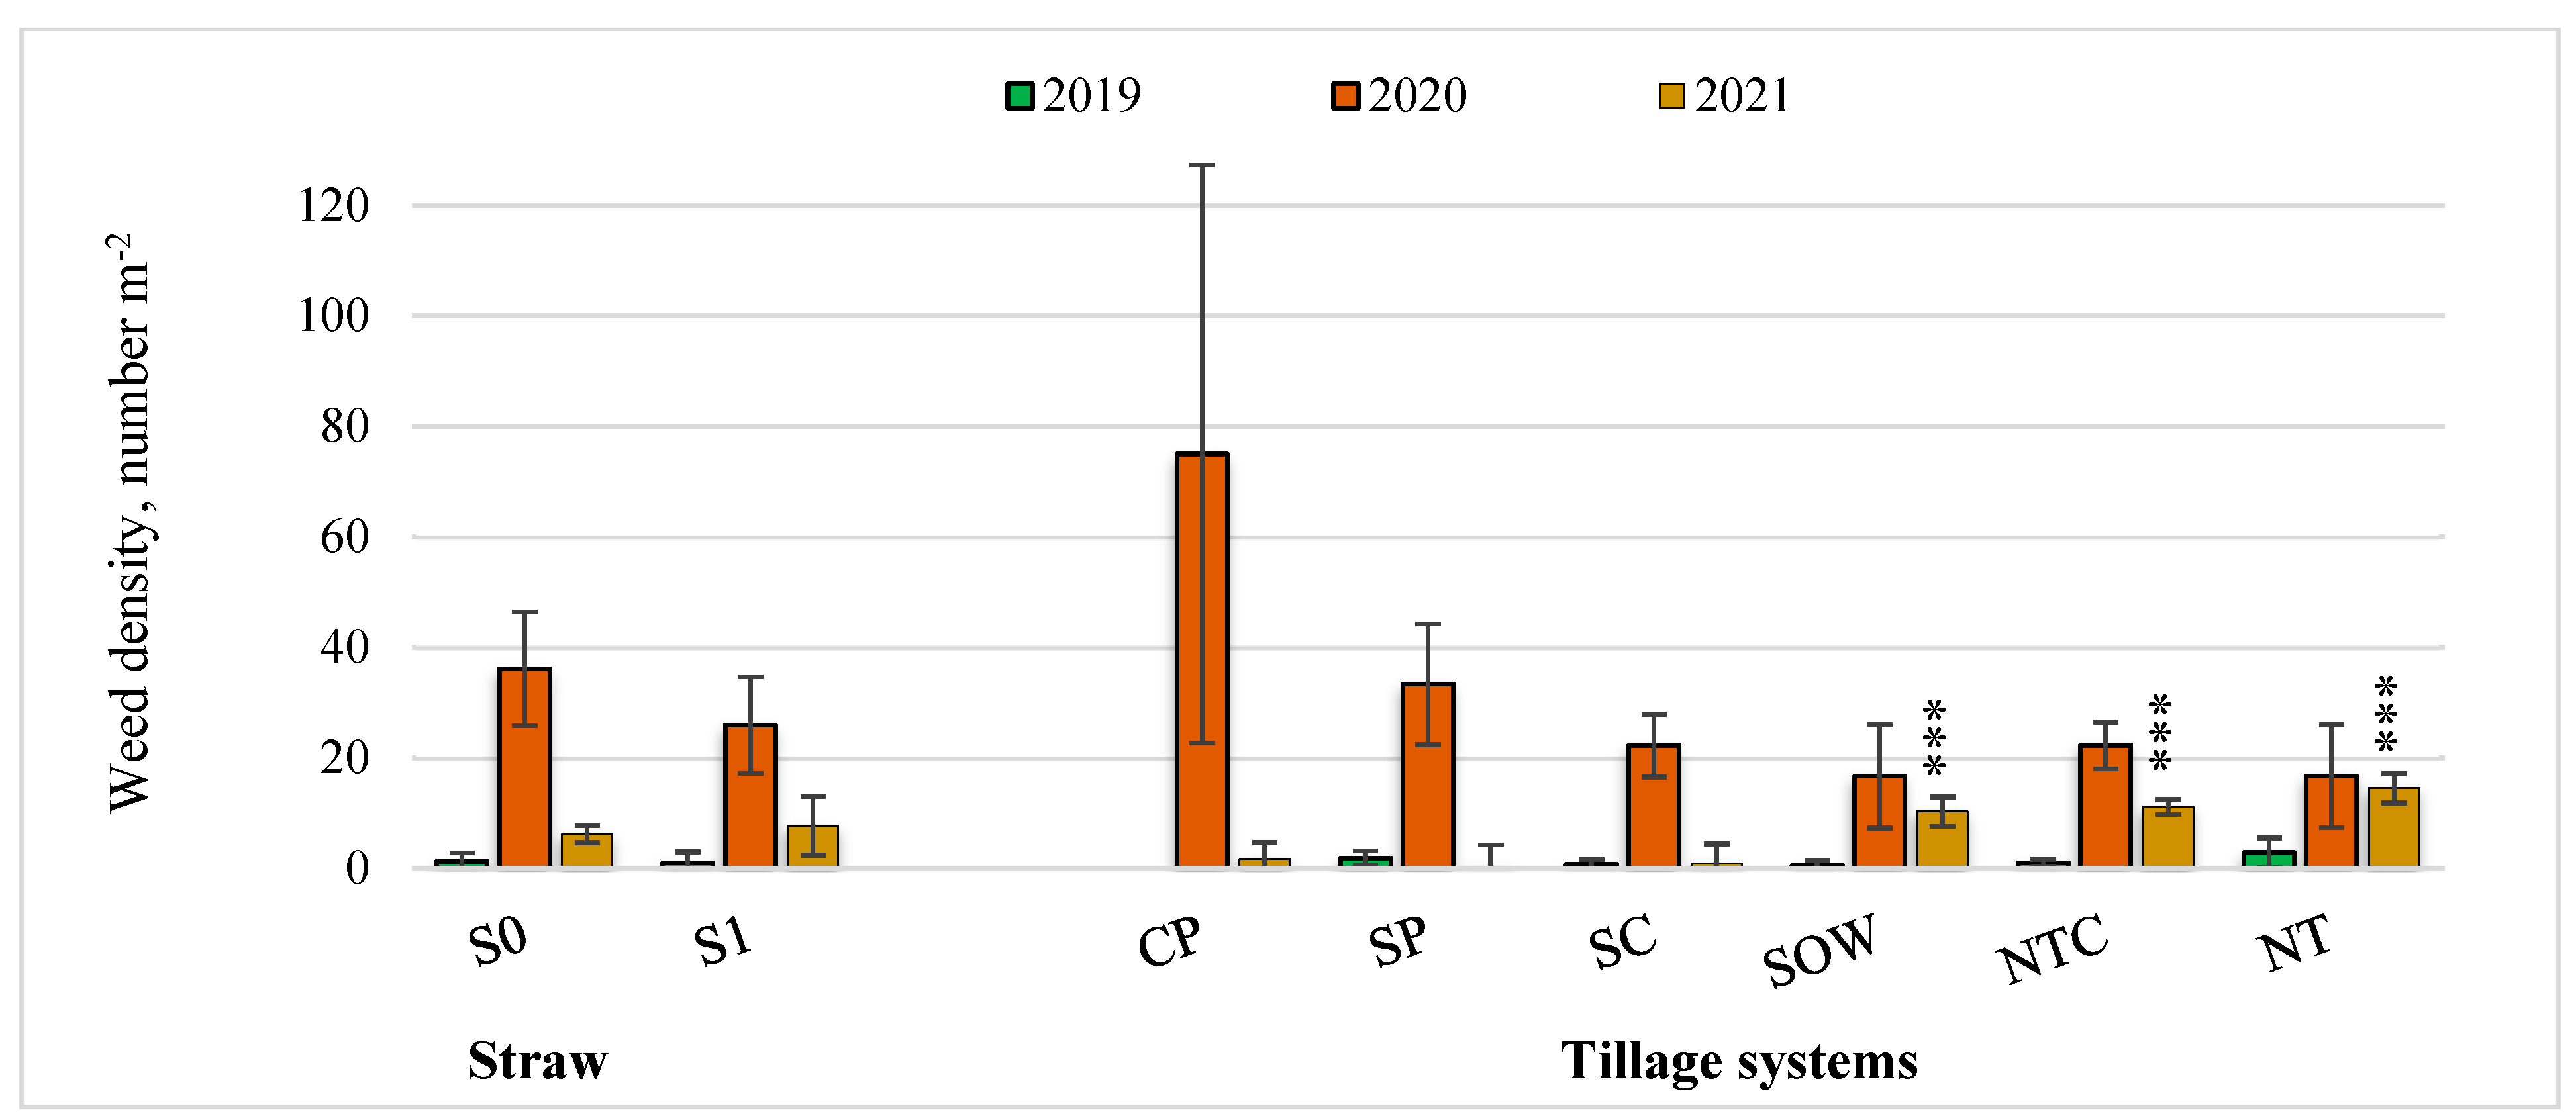
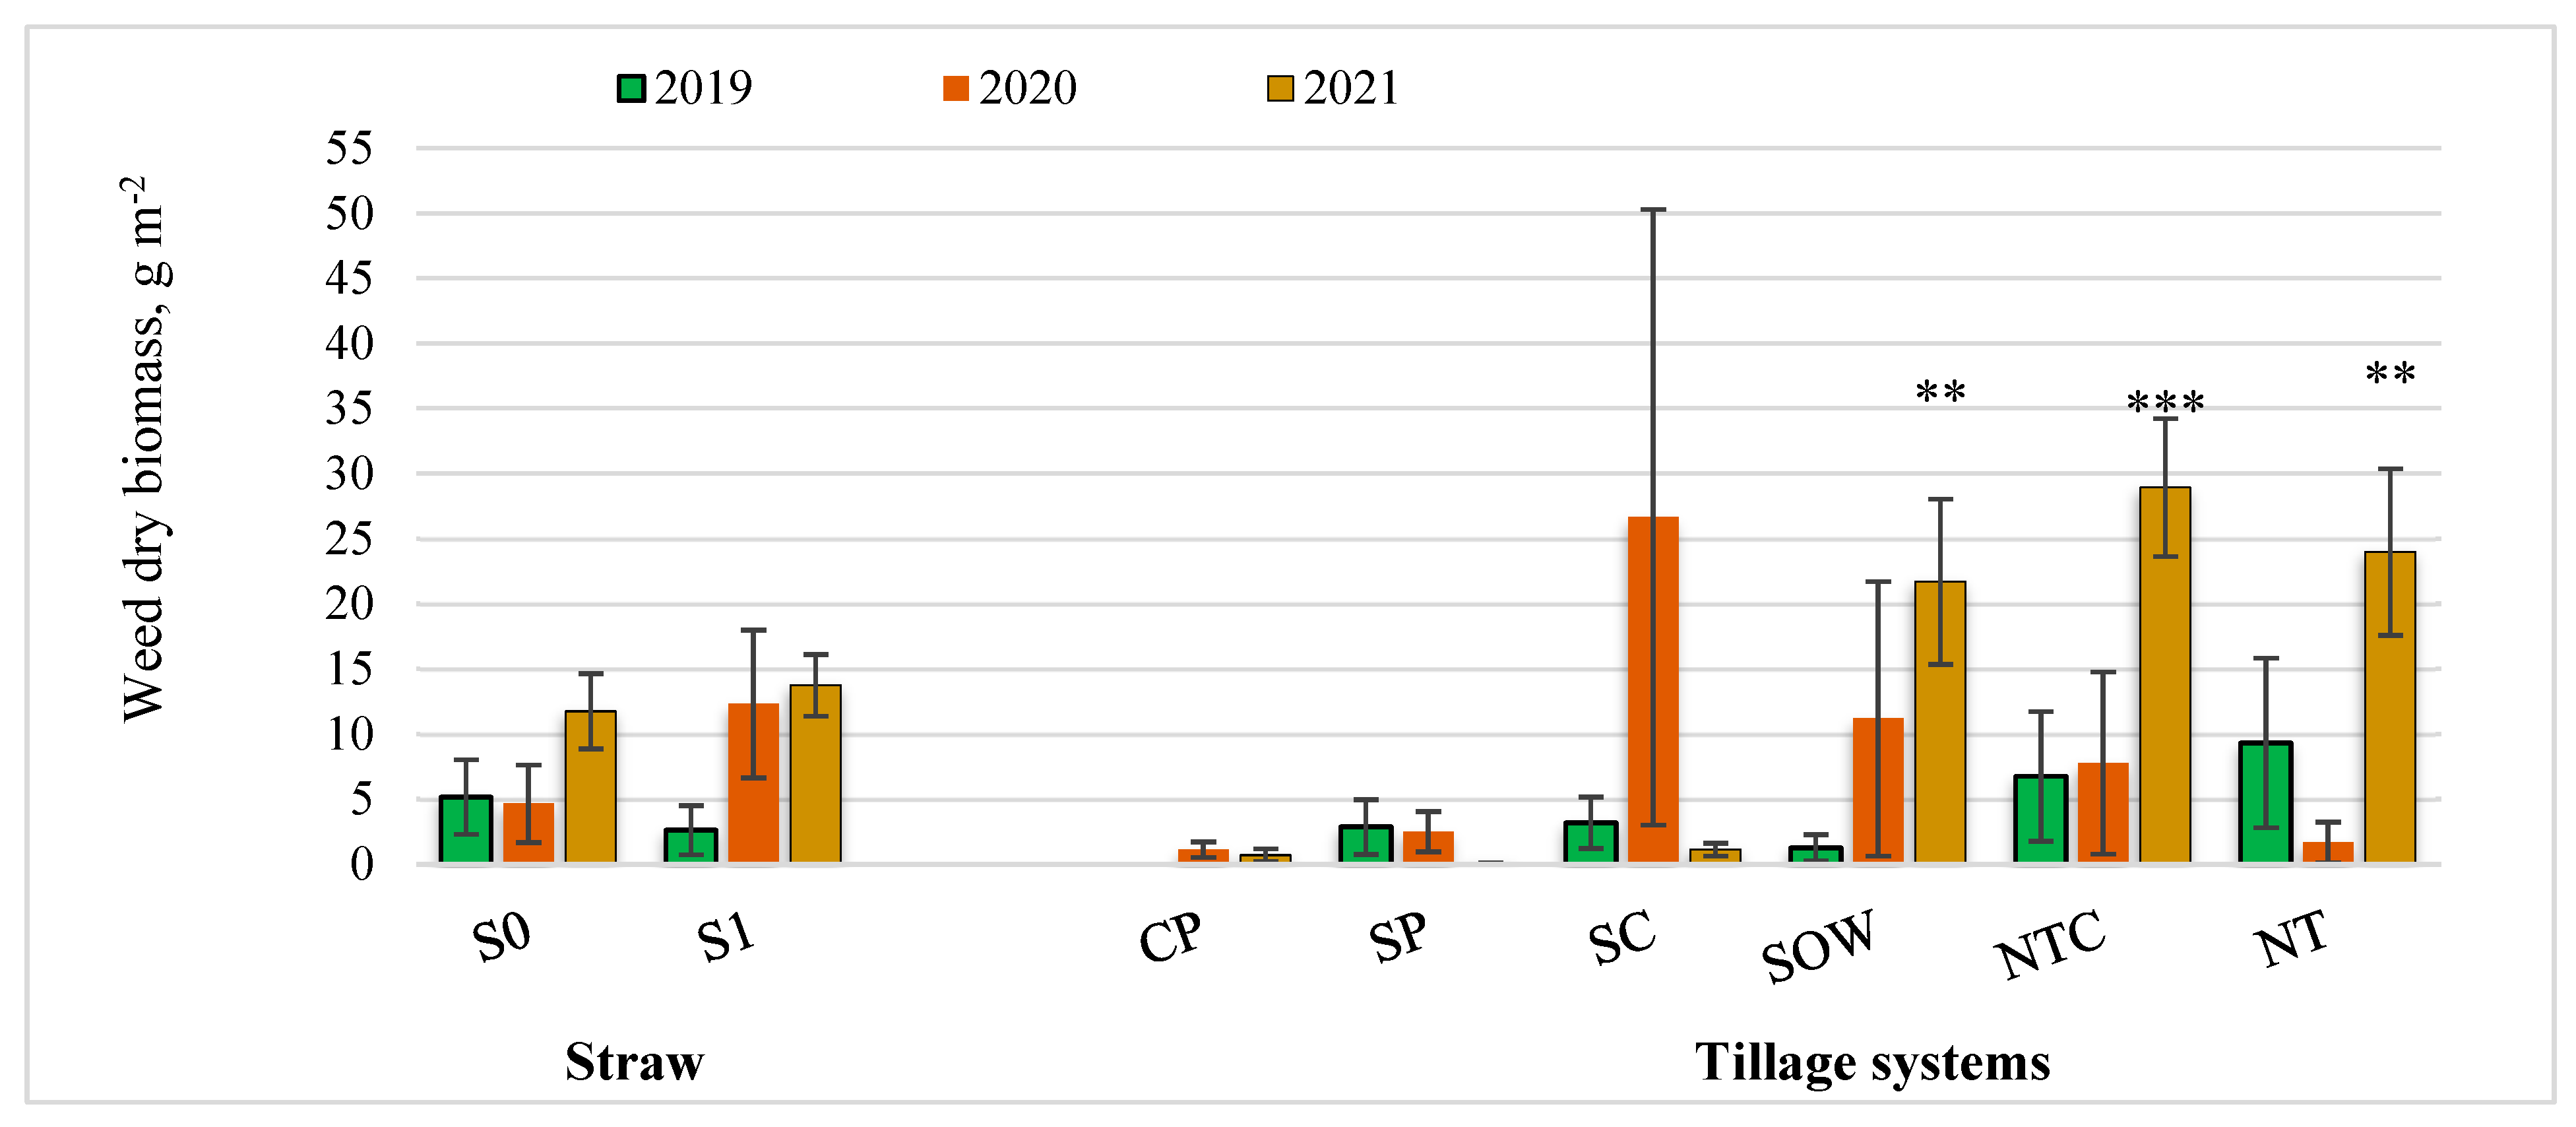
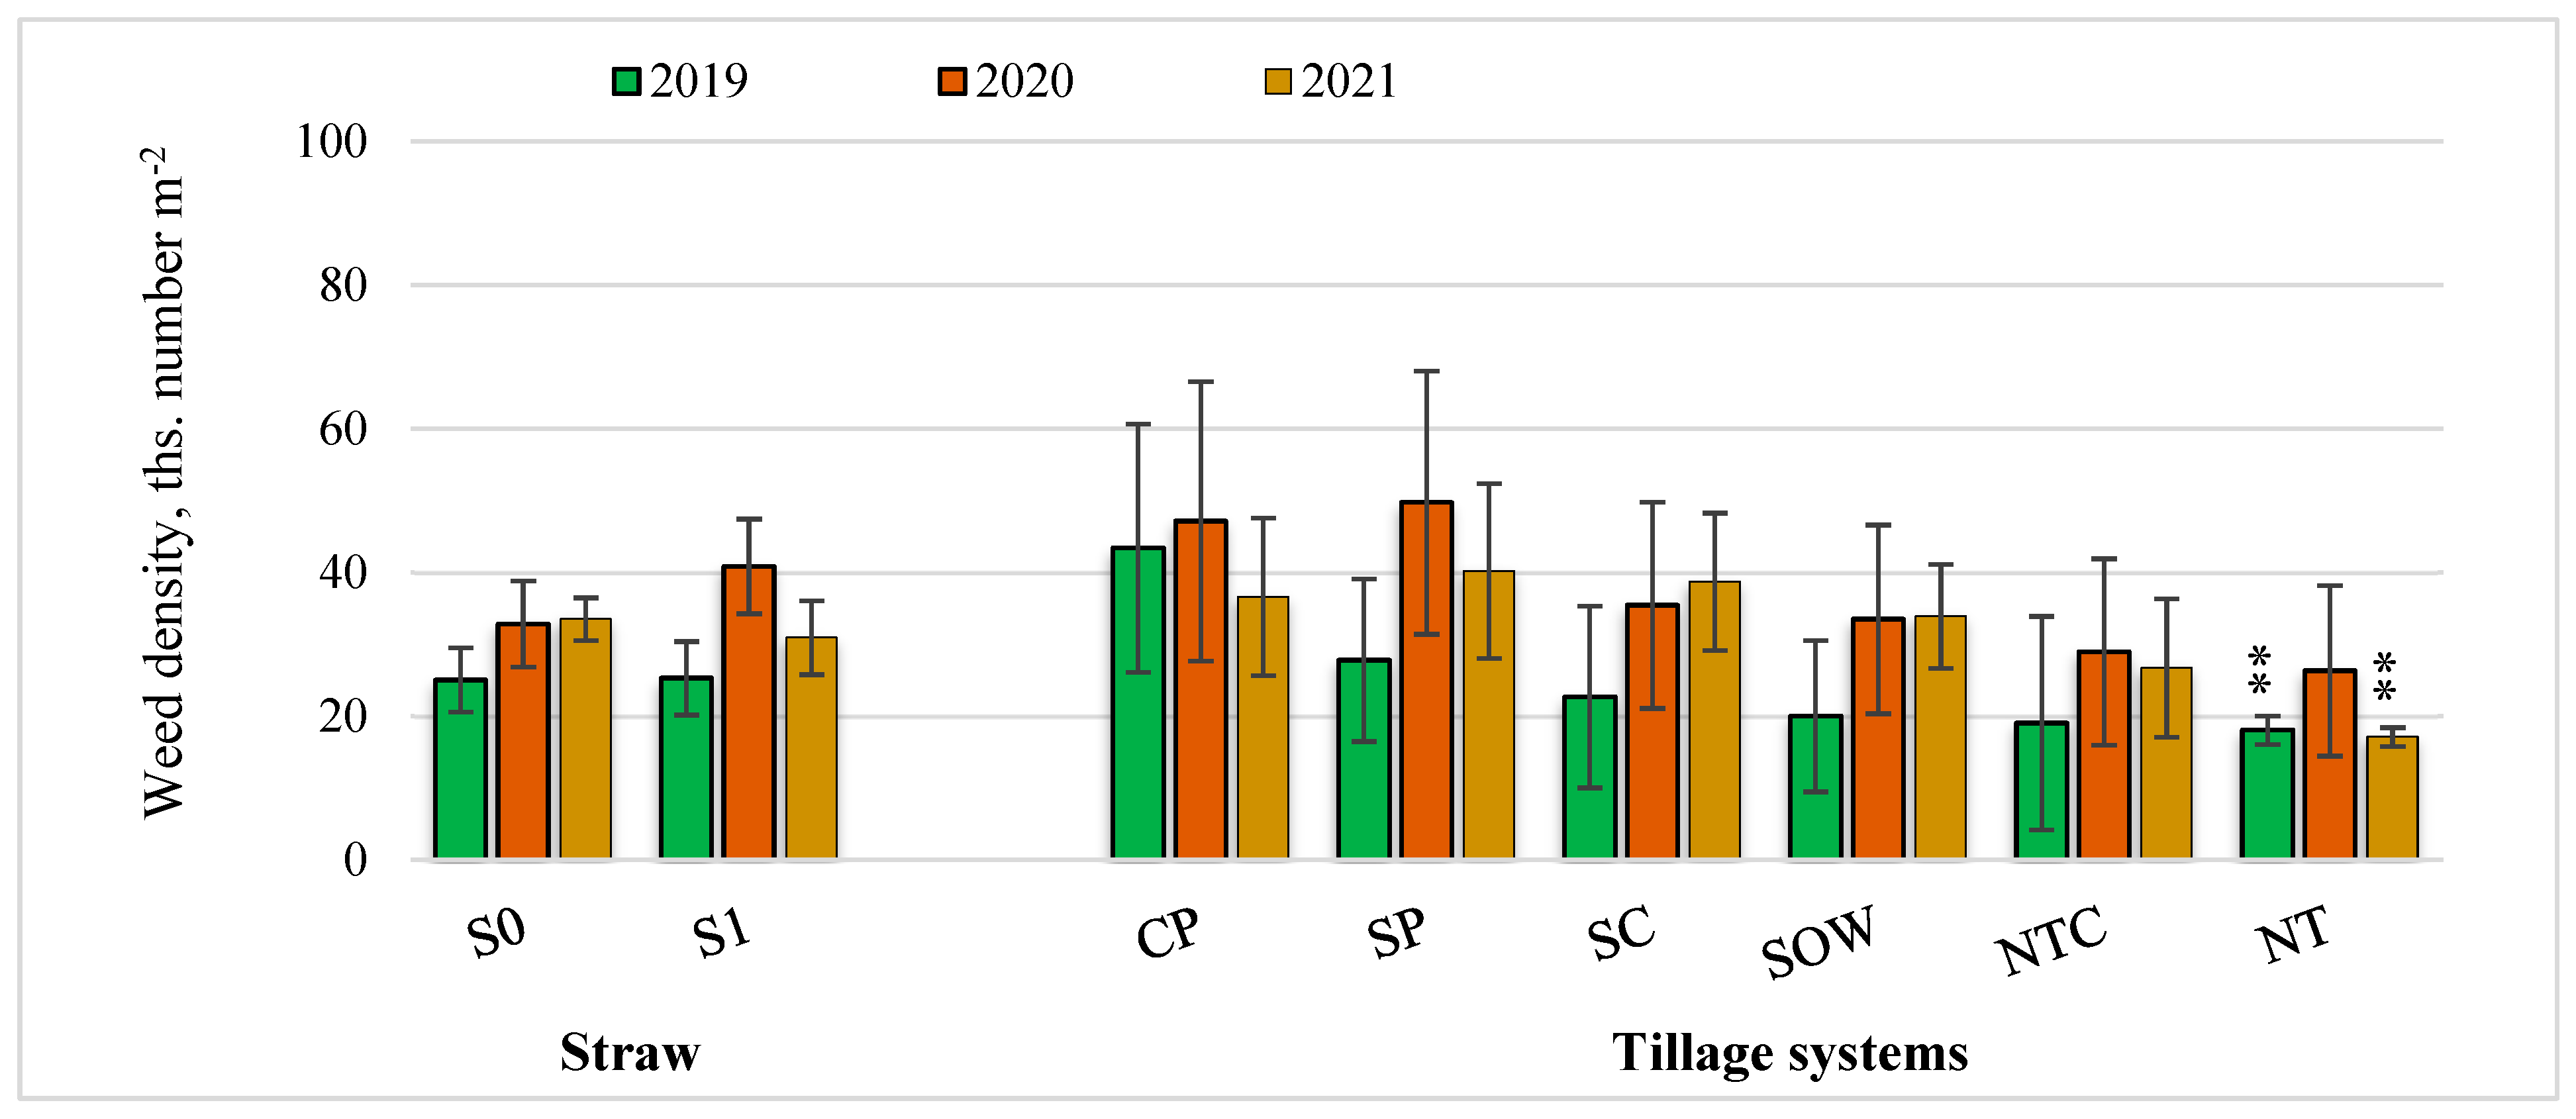
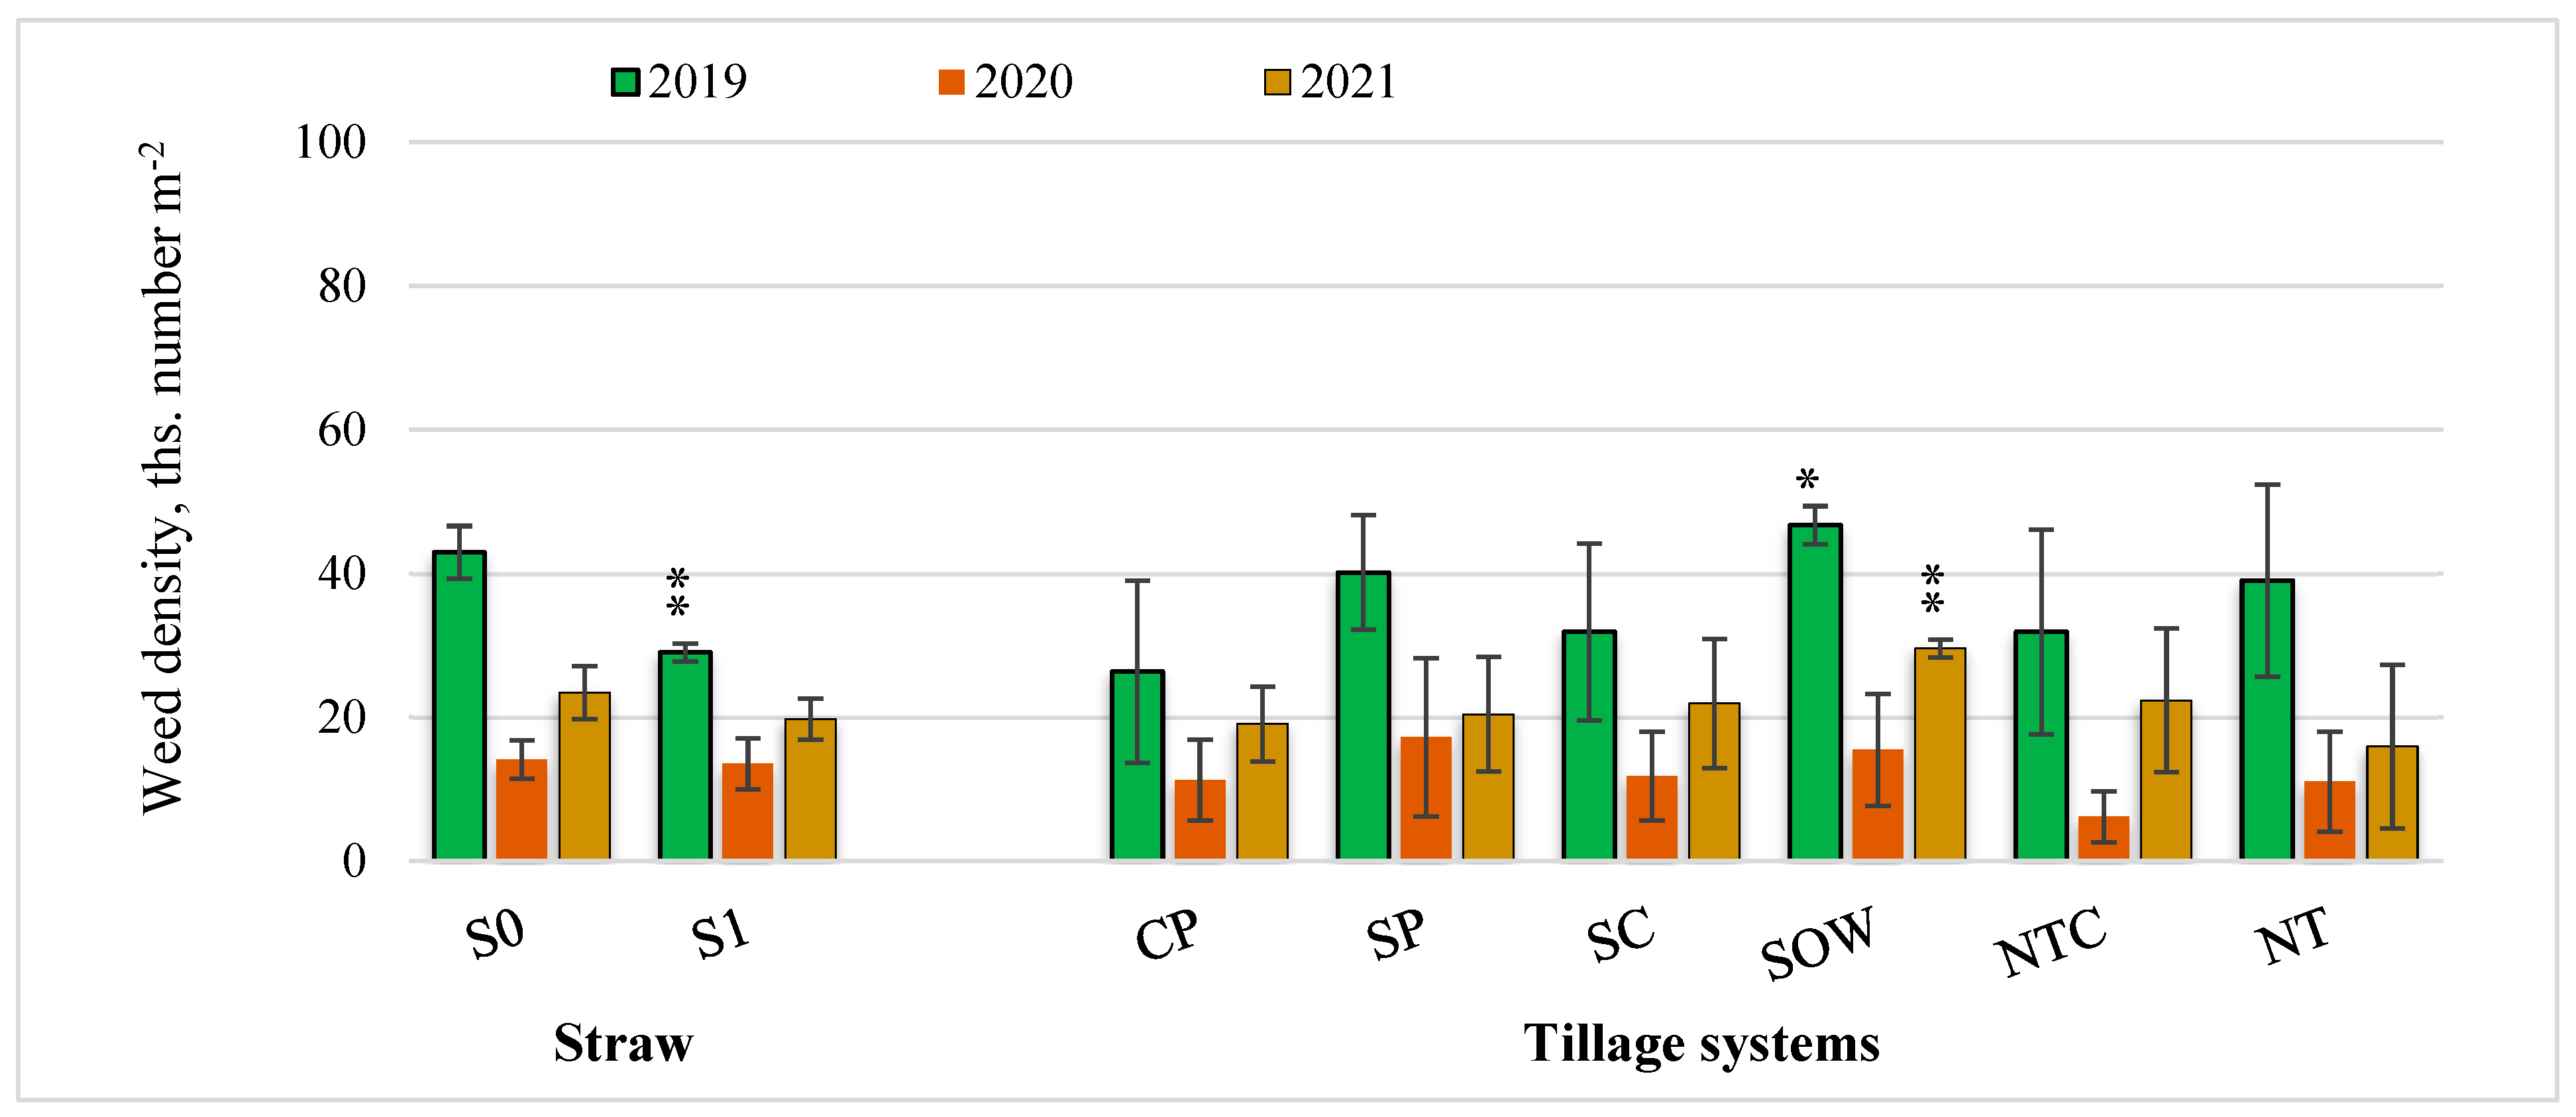
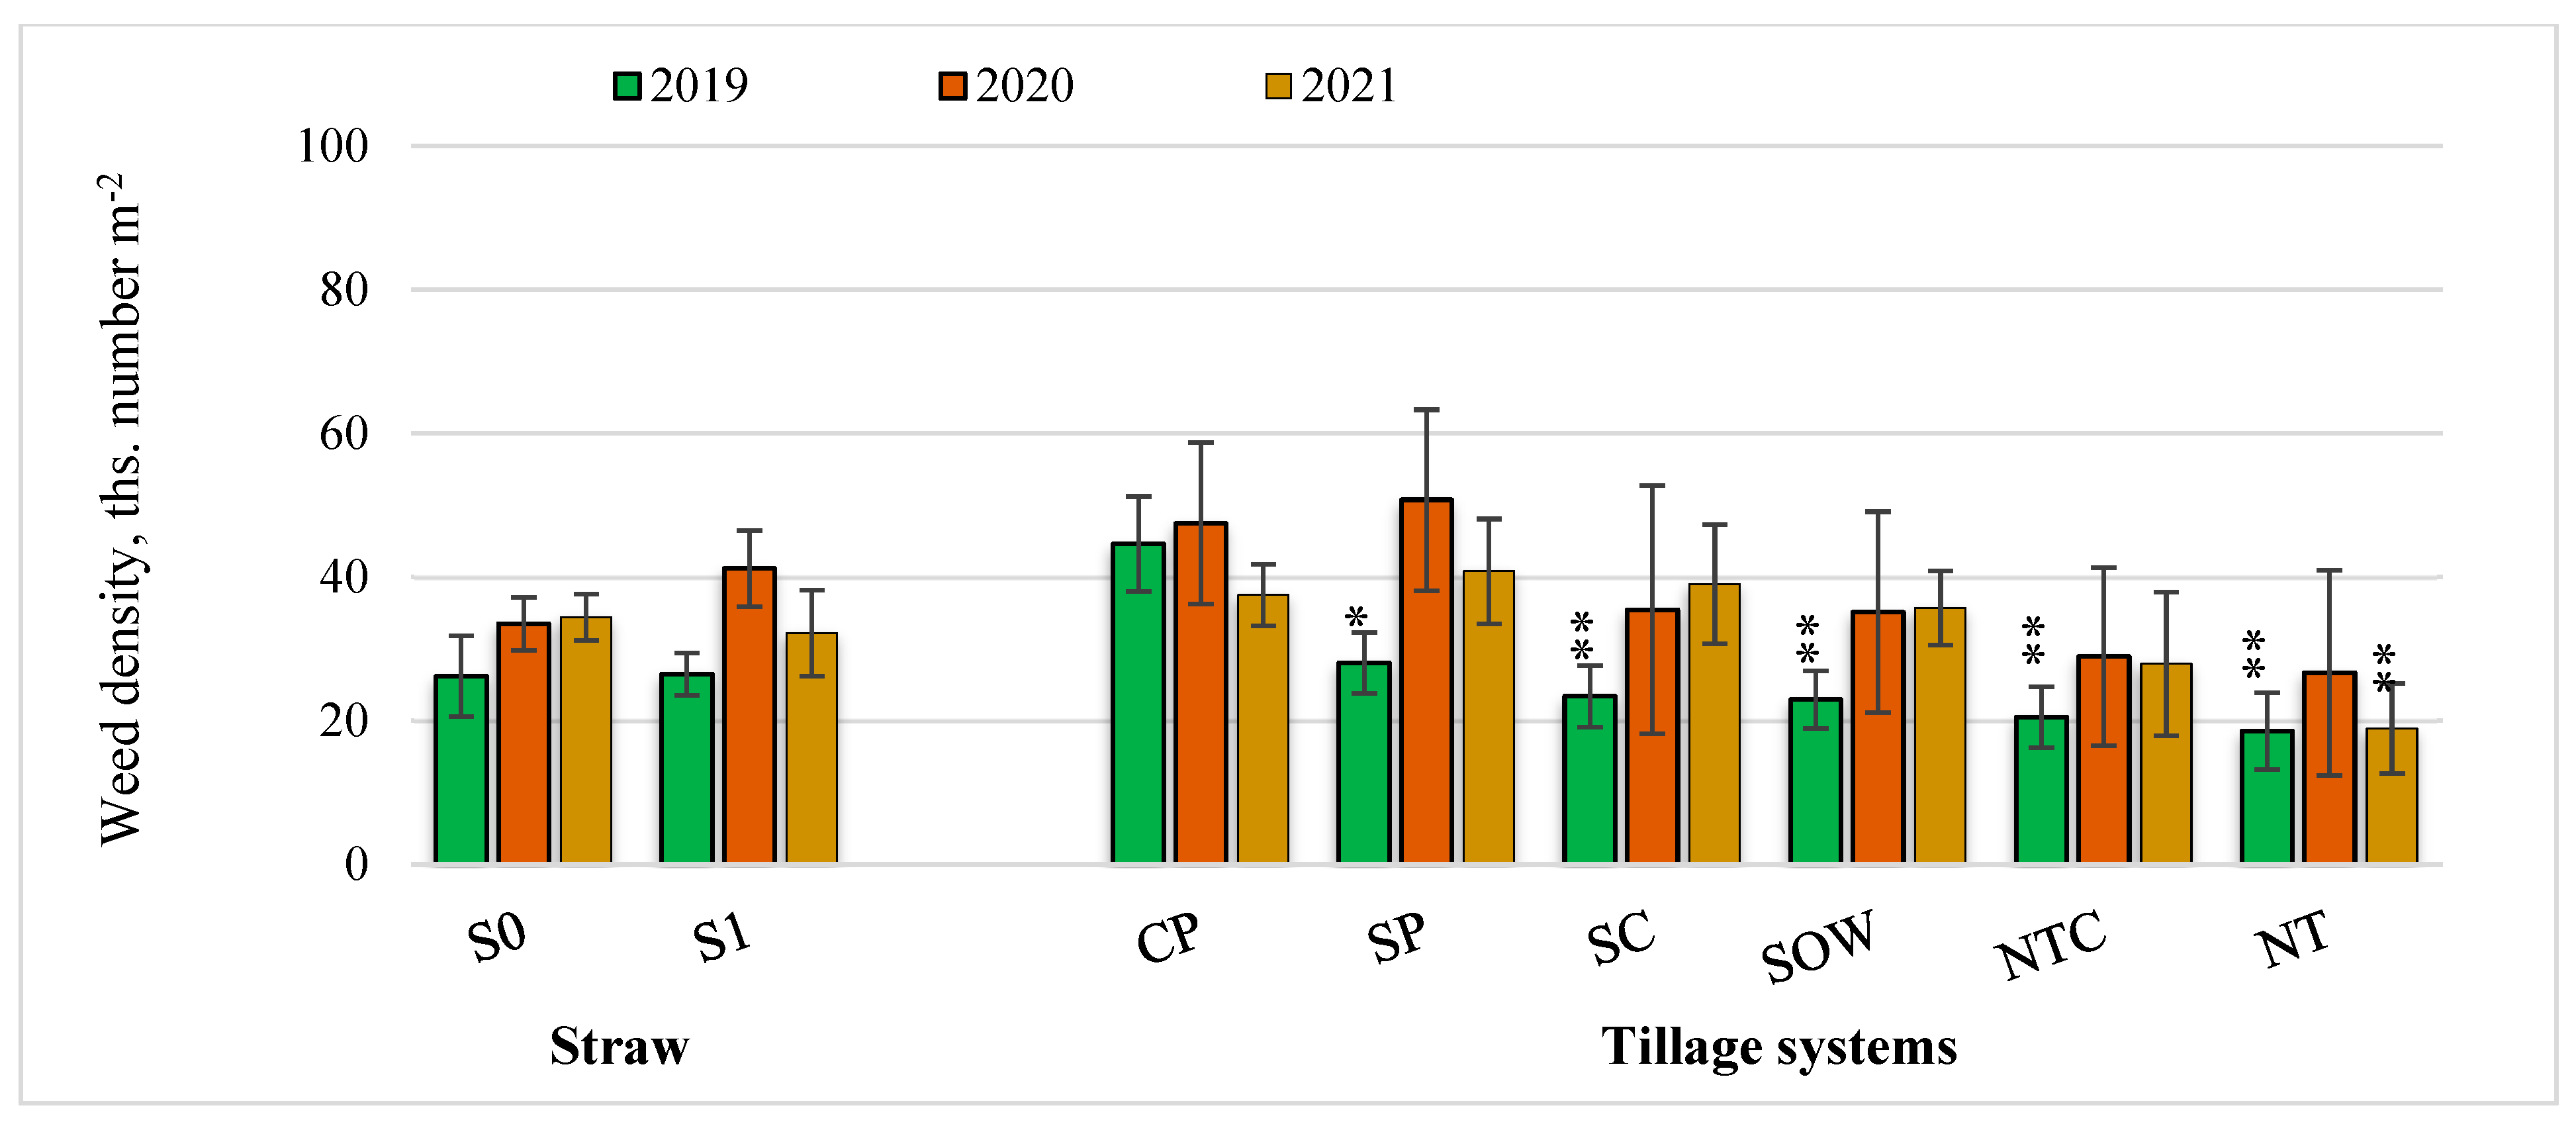
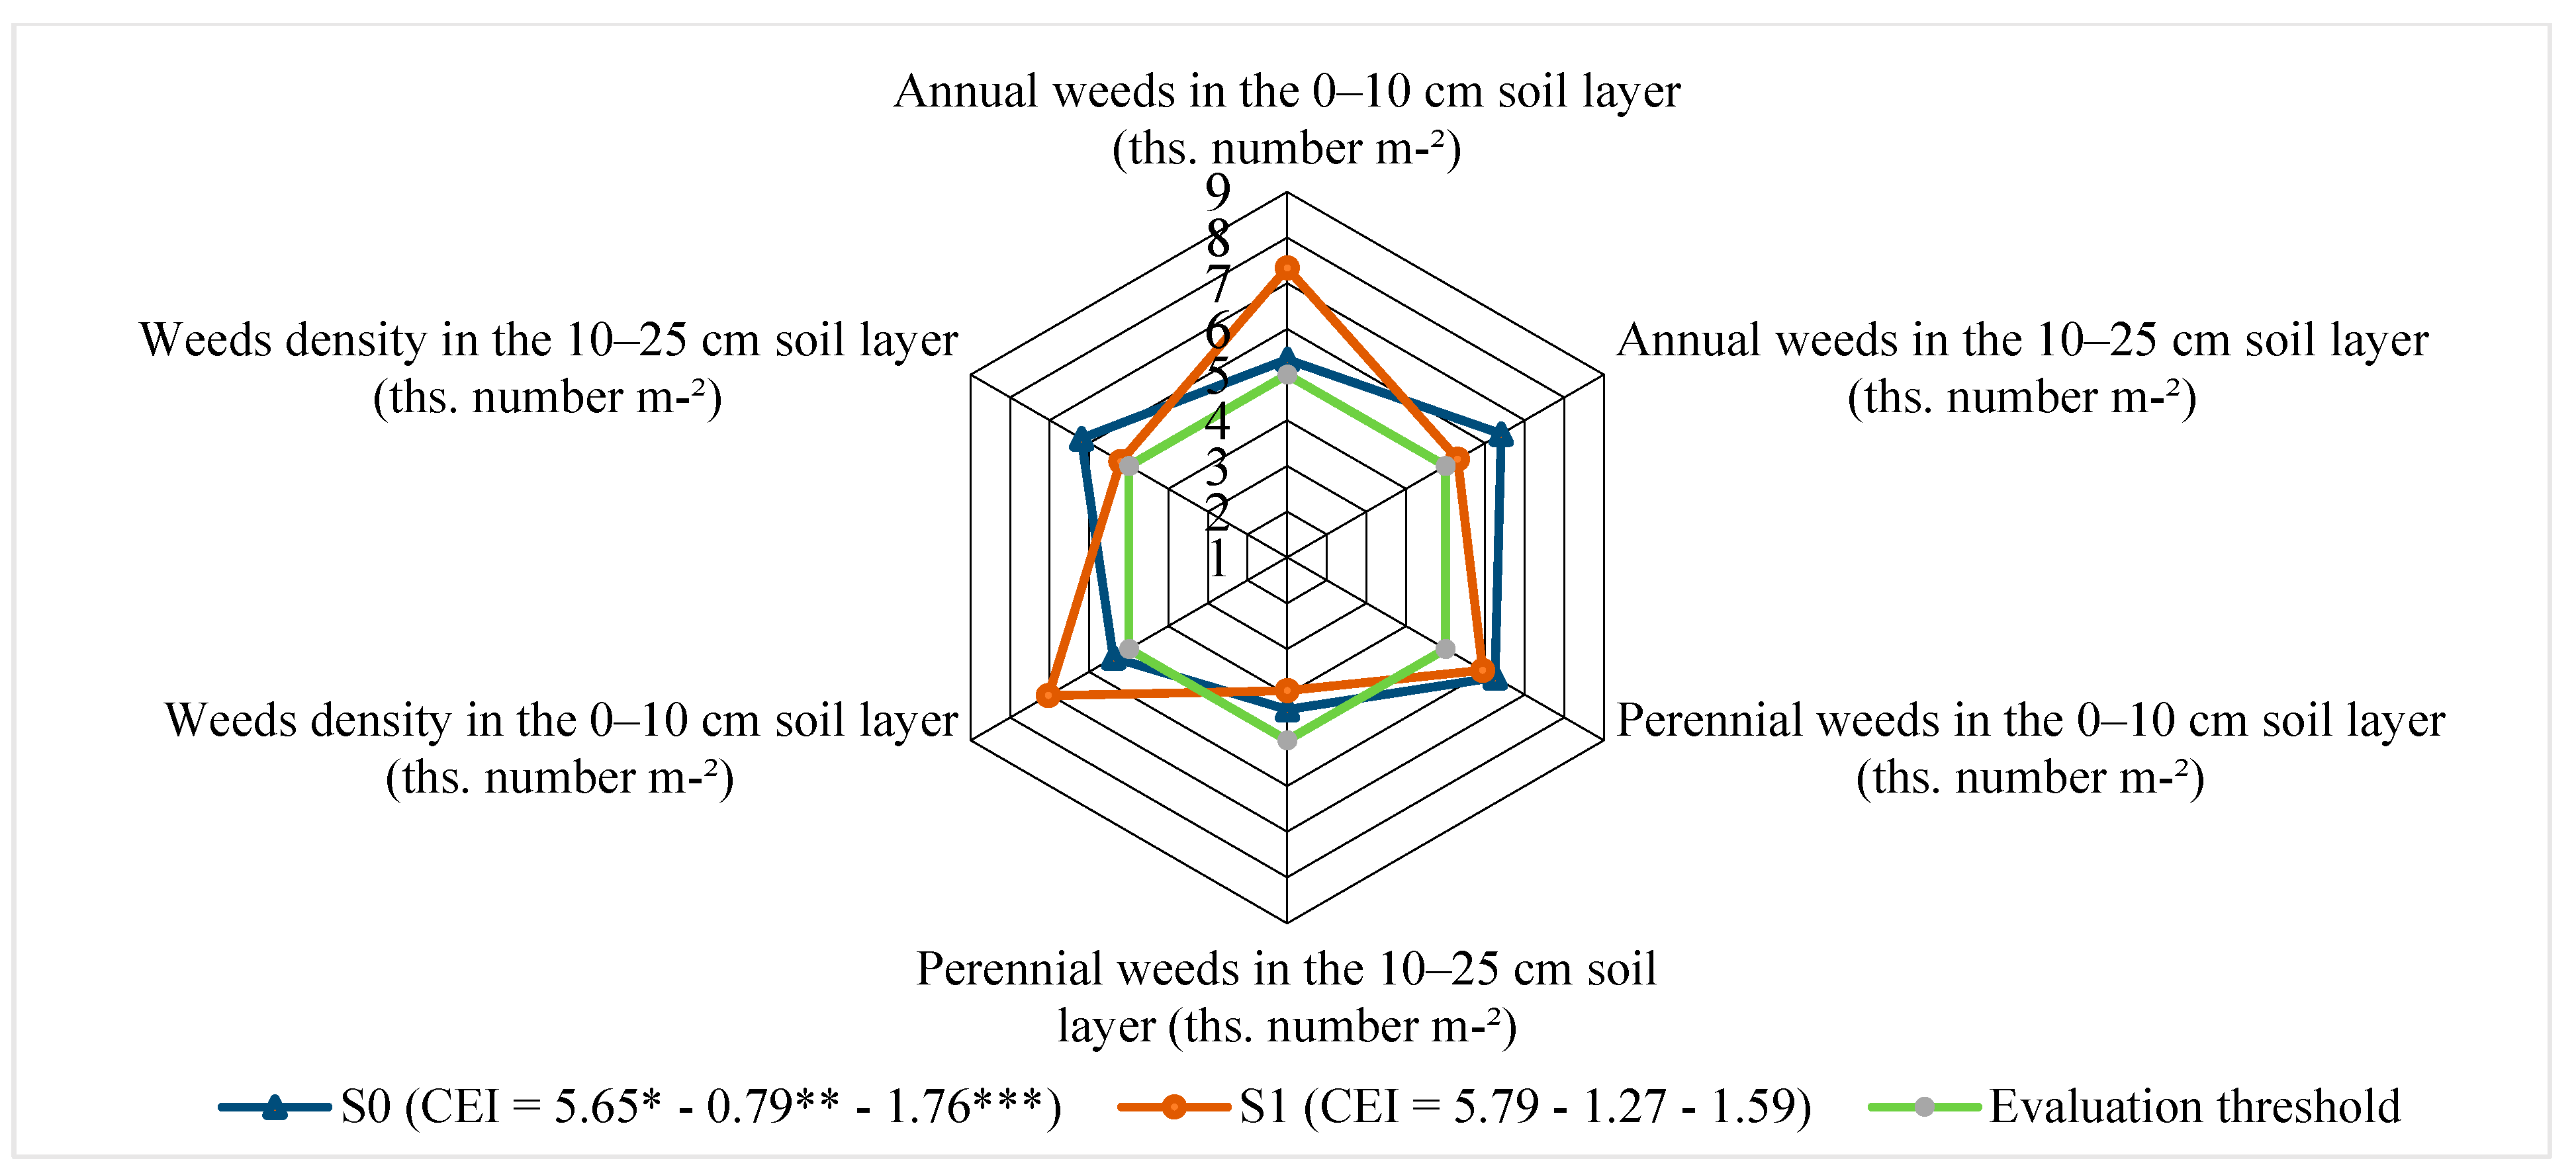
In 2019–2021, annual dicotyledonous weed species dominated: Chenopodium album (L.) and Persicaria lapathifolia (L.). Among the perennial dicotyledonous weeds, Taraxacum officinale (L.) dominated.
In 2019, 28 weed species were found in the summer rapeseed crop, including 21 annual species and 7 perennials. The weeds found belonged to 12 different families: Asteraceae, Brassicaceae, Plantaginaceae, Caryophyllaceae, Euphorbiaceae, Poaceae, Violaceae, Lamiaceae, Rubiaceae, Polygonaceae, Amaranthaceae, Rubiaceae, and Equisetopsida (Figure 3).
In 2019, the weed density of annual weeds (number m−2) increased significantly by a factor of 2.0 in the fields where the straw of the pre-crop was chopped and spread (S1) compared to the fields from which the straw was removed (S0).
In 2020, 22 weed species were found in the winter wheat crop, including 17 short-lived species and 5 perennials. The weeds found belonged to 11 different families: Asteraceae, Brassicaceae, Plantaginaceae, Caryophyllaceae, Euphorbiaceae, Poaceae, Violaceae, Lamiaceae, Rubiaceae, Polygonaceae, and Amaranthaceae.
Fields that were shallowly plowed (SP), directly sowed with cover crops (NTC), and shallowly cultivated in autumn (SC), and fields with stubble left over winter and whose stubble was cut before sowing with a disc cultivator (SOW), showed a significant reduction of 1.8- to 3.8-fold in the weed density of annual weeds. Direct sowing without cover crops (NT) showed a 1.6-fold reduction in the weed density of annual weeds compared to deep plowing (CP).
In 2021, 16 weed species were found in the spring barley crop, including 12 annual species and 4 perennials. The weeds found belonged to nine different families: Asteraceae, Poaceae, Violaceae, Lamiaceae, Rubiaceae, Polygonaceae, Amaranthaceae, Magnoliophyta, and Equisetophyta.
In 2021, the weed density of annual weeds in the different crops (number m−2) before crop harvest was significantly reduced by a factor of 1.4 in the fields where the straw was chopped and spread (S1) compared to the fields from which the straw was removed (S0). Direct sowing with cover crops (NTC), direct sowing without cover crops (NT), and fields with stubble left over winter and fields whose stubble was cut before sowing with a disc cultivator (SOW) showed a significant 1.5–1.3-fold reduction in the number of annual weeds.
From 2019 to 2021, fields where straw was chopped and spread (S1) had no effect on the incidence of annual weeds compared to fields from which straw was removed (S0). Reduced-tillage systems, except direct sowing with cover crops (NTC), reduced the incidence of annual weeds throughout the study period.
In 2019–2020, fields with chopped and spread straw (S1) but different reduced-tillage systems did not show a significantly affected incidence of perennial weeds. In 2019, the application of reduced-tillage technologies increased the number of perennial weeds, but in 2020, the opposite trend was observed (Figure 4).
In 2021, the weed density of perennial weeds increased 1.2-fold in the fields where straw was chopped and spread (S1) compared to the fields where straw was removed (S0) (Figure 4). Direct sowing with cover crops (NTC), direct sowing without cover crops (NT), and fields with stubble left over winter and fields whose stubble was cut before sowing with a disc cultivator (SOW) showed a significant increase in perennial weed numbers of between 6.1- and 8.6-fold.
In 2019–2021, different tendencies were found in the fields where straw was chopped and spread (S1) and in the reduced-tillage fields under different tillage systems (Figure 4).
In 2019, fields where the pre-crop straw was chopped and spread (S1) showed a 1.9-fold increase in the total weed density of weeds compared to fields from which the straw was removed (S0) (Figure 5).
In 2020, fields that were shallowly plowed in autumn (SC) and fields with stubble left over winter and whose stubble was cut with a disc cultivator before sowing (SOW) showed a 2.5- to 3.7-fold decrease in the total weed density of weeds compared to deep-plowed (CP) fields.
In 2021, fields where straw was chopped and spread (S1) showed a significant decrease of 22.0% in the total weed density of weeds compared to fields where straw was removed (S0) (Figure 5). In 2019–2021, chopped and spread straw (S1) did not have the same effect on total weed incidence as removed straw (S0). The reduced-tillage systems applied throughout the study period, except for direct sowing with cover crops (NTC), reduced the total number of weeds.
In 2019, a linear, very strongly positive, and statistically significant correlation (r = 0.99, y = 0.97 + 1.03x, p < 0.01) was found between the number of annual weeds and the total number of weeds in the fields where the straw was removed (S0). In the fields where the straw was chopped and spread (S1), there was a linear, very strongly positive, and statistically significant correlation (r = 0.99, y = 5.20 + 0.95x, p < 0.01) between the number of annual weeds and the number of perennial weeds. In 2020, in the straw-removed fields (S0), there was a linear, very strongly positive, and statistically significant correlation (r = 0.99, y = 5.74 + 0.98x, p < 0.01) between annual and total weeds. In the fields where the straw was chopped and spread (S1), there was a linear, very strongly positive, and statistically significant correlation (r = 0.93, y = 17.12 + 0.95x, p < 0.01) between the number of annual weeds and the total number of weeds. In 2021, in the fields where straw was chopped and spread (S1), a linear, very strongly negative, and statistically significant correlation was found between the number of annual and perennial weeds (−r = 0.91, y = 26.59 − 0.41x, p < 0.05), and a very strongly positive correlation was found between the number of annual weeds and the total number of weeds (r = 0.96, y = 26.59 + 0.59x, p < 0.01).
In 2019, fields where the pre-crop straw was chopped and spread (S1) showed a 2.2-fold increase in the dry matter biomass (g m−2) of annual weeds compared to fields where the straw was removed (S0) (Figure 6). Direct sowing without cover crops (NT) showed a significant 2.4-fold decrease in annual weed dry matter biomass (g m−2).
In the 2020 fields, straw chopping and spreading (S1) and the application of reduced-tillage systems did not have a significant effect on the dry matter biomass (g m−2) of annual weeds.
In 2021, fields where straw was chopped and spread (S1) showed a significant 1.6-fold decrease in the dry matter biomass of annual weeds compared to fields from which straw was removed (S0) (Figure 6).
In the period of 2019–2021, straw chopping and spreading had different effects on the dry matter biomass of annual weeds. The application of shallow plowing (SP), stubble left over winter, and disc cultivation before sowing (SOW) resulted in a decrease in the dry biomass of annual weeds in the fields.
In 2019–2020, in fields where pre-crop straw was chopped and spread (S1) and fields with reduced-tillage systems, the dry matter biomass of perennial weeds was not significantly affected (Figure 7).
In 2021, direct sowing with cover crops (NTC) and direct sowing without cover crops (NT) in fields with stubble left over winter and whose stubble was cut before sowing with a disc cultivator (SOW), there was a significant 31.4- to 41.9-fold increase in the dry matter biomass of perennial weeds when compared with deep-plowed fields (CP).
From 2019 to 2021, the dry biomass of perennial weeds was not significantly different in fields where straw was left to rot compared to fields where straw was removed (S0) (Figure 7). Reduced-tillage systems (SC, SOW, NTC, NT) increased the dry matter biomass (g m−2) of perennial weeds compared to deep plowing (CP).
In 2019, fields where pre-crop straw was chopped and spread (S1) showed a significant (2.1-fold) increase in total weed dry matter biomass (g m−2) compared to fields where straw was removed (S0) (Figure 8).
In 2020, the calculation of total weed dry matter biomass showed the same trends as in 2019.
In 2021, fields where straw was chopped and spread (S1) showed a significant 1.2-fold increase in total weed dry matter biomass compared to fields from which straw was removed (S0) (Figure 8). Straw chopping and spreading had different effects on the total dry biomass of weeds in fields in 2019–2021. In shallow-plowed (SP) fields, the total dry biomass of weeds decreased, but the application of shallow autumn spreading (SC) showed opposite trends compared to conventional tillage (CP).
In 2019, a linear, very strongly positive, and statistically significant correlation (r = 0.99, y = 7.38 + 0.99x, p < 0.01) was found between the annual and total dry biomasses of weeds in the straw-removed fields (S0). In the fields where straw was chopped and spread (S1), a linear, strongly positive, and statistically significant correlation was found between the number of perennial weeds and the dry biomass of perennial weeds (r = 0.83, y = −311.16 + 9.06x, p < 0.05). In the fields where straw was chopped and spread (S1), a linear, very strongly positive, and statistically significant correlation was found between the dry biomasses of annual and perennial weeds (r = 1.00, y = 4.60 + 0.99x, p < 0.01). In 2020, in the fields where straw was chopped and spread (S1), a linear, very strongly positive, and statistically significant correlation was found between the dry biomass of perennial weeds and the total number of weed seeds at 10–20 cm (r = 0.97, y = 9853.00 + 141.95x, p < 0.01). In the fields where the straw was removed (S0), there was a linear, very strongly positive, and statistically significant correlation (r = 0.92, y = −69.34 + 38.35x, p < 0.01) between the number of perennial weeds and the number of seeds of perennial weeds at 10–20 cm. In 2021, in the straw-removed fields (S0), a linear, very strongly positive, and statistically significant correlation (r = 0.93, y = 0.69 + 0.47x, p < 0.01) was found between the number of perennial weeds and the biomass of perennial weeds. In the fields where the straw was chopped and spread (S1), a linear, strongly positive, and statistically significant correlation was found between the dry biomass of perennial weeds and the total number of weeds (r = 0.86, y = 62.37 − 0.72x, p < 0.05), between the dry biomass of perennial weeds and the total number of weed seeds per 10–20 cm (r = 0.89, y = 46,828.60 − 106.46x, p < 0.05), and between the dry biomass of perennial weeds and the number of perennial weeds (r = 0.89, y = 1.16 − 0.48x, p < 0.05). In the fields where the straw was chopped and spread (S1), a linear, very strongly positive, and statistically significant correlation was found between the number of annual weeds and the dry biomass of perennial weeds (r = 0.98, y = 62.23 − 1.17x, p < 0.01), between the dry biomass of perennial weeds and the number of annual weeds (r = 0.93, y = 63.39 − 0.69x, p < 0.01), and between the dry biomass of perennial weeds and the number of seeds of annual weeds at 10 to 20 cm (r = 0.90, y = 46,181.60 + 1112.14x, p < 0.05).
In summary, we can state that in shallow-plowed (SP) fields, the number and biomass of annual and total weeds decreased in all study years. However, the number and biomass of perennial weeds decreased only in the study year 2021. Straw incorporation had a variable effect on the number and biomass of weeds.

3.2. Weed Seed Bank

In 2019–2021, annual dicotyledonous weed species dominated the soil layers studied: Chenopodium album (L.) and Persicaria lapathifolia (L.). Among perennial dicotyledonous weeds, Rumex crispus L. dominated (Figure 9).
In 2019, 10 weed species were found in the spring rapeseed crop, including 8 annual species and 2 perennials. The weeds found belonged to five different families: Brassicaceae, Poaceae, Polygonaceae, Lamiaceae, and Amaranthaceae.
In 2019, in the upper (0–10 cm) soil layer, the weed density of annual weeds (ths. number m−2) decreased significantly by a factor of 1.6 in the fields where the straw was chopped and spread (S1) compared to the fields where the straw was removed (S0) (Figure 9).
In 2020, 16 weed species were found in winter wheat crops, including 13 annual and 3 perennial species. The weeds found belonged to 10 different families: Asteraceae, Brassicaceae, Plantaginaceae, Caryophyllaceae, Poaceae, Rubiaceae, Polygonaceae, Amaranthaceae, Apiaceae, and Fabaceae.
In the upper (0–10 cm) layer of soil tested in 2020, there was a 4.7% decrease in the weed density of annual weeds in the fields where the straw was chopped and spread (S1) compared to the fields from which the straw was removed (S0). Only direct-sown fields without cover crops (NT) showed a 3.8% decrease in annual weeds compared to deep-plowed (CP) fields.
In 2021, 19 weed species were found in the spring barley crop, including 13 annual species and 6 perennials. The weeds found belonged to nine different families: Asteraceae, Brassicaceae, Caryophyllaceae, Poaceae, Polygonaceae, Violaceae, Lamiaceae, Amaranthaceae, and Fabaceae.
In 2021, fields where stubble was left over winter and whose stubble was cut before sowing with a disc cultivator (SOW) showed significantly increased weed density of annual weeds, by a factor of 1.5, compared to deep-plowed fields (CP) (Figure 9).
In 2019–2021, straw chopping and spreading (S1) reduced the number of annual weed seeds in the upper (0–10 cm) soil layer studied compared to fields from which straw was removed (S0). Different tillage systems (SP, SC, SOW, and NTC) increased the weed density of annual weed seeds in the upper (0–10 cm) layer of the soil studied.
In the 2019 direct-sown fields without cover crops, there was a significant 2.4-fold decrease in the weed density of annual weeds in the deeper (10–25 cm) soil layer (Figure 10).
In 2020, no significant differences were found in the deeper soil layer (10–25 cm) when comparing fields with straw (S1) and without straw (S0) and different reduced-tillage systems with deep plowing (CP).
In 2021, in the deeper soil layer (10–25 cm) studied, direct sowing significantly reduced the annual weed density by a factor of 5.1 in the direct-sown fields compared to deep-plowed fields (CP).
In the study years 2019–2021, straw chopping and spreading had no significant effect on the incidence of annual weed seeds in the deeper soil layer (10–25 cm) studied compared to fields where straw was removed. Reduced-tillage systems (SOW, NTC, NT) reduced the incidence of annual weed seeds in the soil layer studied (Figure 10).
In 2019, in the upper (0–10 cm) layer of the soil, the weed density of perennial weeds increased 1.5 to 56.6 times in the fields with reduced-tillage techniques compared to deep-plowed fields (CP) (Figure 11).
In 2020, no perennial weed seeds were detected in the upper layer (0–10 cm) of the soil in the shallow-plowed (SP) and shallow-cultivated (SC) fields tested compared to deep-plowed fields (CP).
In 2021, in the upper layer (0–10 cm) of the soil studied, the weed density of perennial weeds increased significantly by a factor of 2.5 in the fields with stubble left over winter and whose stubble was cut with a disc cultivator (SOW) before sowing when compared to deep-plowed fields (CP) (Figure 11).
From 2019 to 2021, straw chopping and spreading had different effects on the number of perennial weed seeds in the upper (0–10 cm) layer of the soil studied. Fields with stubble left over winter and whose stubble was cut before sowing with a disc cultivator (SOW) and fields that were directly sowed with cover crops (NTC) showed an increase in the weed density of perennial weeds compared to deep-plowed fields (CP).
In the deeper soil layer (10–25 cm) tested between 2019 and 2021, fields where the straw of the pre-crop was chopped and spread (S1) showed different trends in the weed density of perennial weeds compared to fields where the straw was removed (S0) (Figure 12). Fields that were shallowly cultivated in autumn (SC) showed a decreasing trend in perennial weed density, while fields with stubble left over winter and that were disc-cultivated before sowing (SOW) showed an increasing trend compared to deep-plowed fields (CP).
In 2019, in the upper layer (0–10 cm) of the soil tested, the total weed density of weed seeds increased significantly by a factor of 1.7 in the fields where the straw was chopped and spread (S1) compared to the fields where the straw was removed (S0) (Figure 13). Fields with stubble left over winter and whose stubble was cut before sowing with a disc cultivator (SOW) showed a significant 1.8-fold increase in the total weed density of weed seeds compared to deep-plowed fields (CP).
In 2020, different reduced-tillage techniques applied to the top 0–10 cm of the topsoil surveyed showed very different trends.
In 2021, in the topsoil (0–10 cm), the weed density of perennial weeds increased significantly by a factor of 1.6 in the topsoil (0–10 cm) in the fields where stubble was left over winter and fields whose stubble was cut before sowing with a disc cultivator (SOW) compared with deep-plowed fields (CP).
In fields where straw was chopped and spread, the total weed density of weed seeds in the upper (0–10 cm) layer of the soil decreased from 2019 to 2021. Shallow-plowed (SP) and shallow-cultivated (SC) fields and fields where stubble was left over winter and whose stubble was cut before sowing with a disc cultivator (SOW) showed an increase in the total number of weeds compared to deep-plowed (CP) fields.
In 2019, in the deeper soil layer (10–25 cm), all fields with reduced-tillage technologies showed a significant decrease of 1.9- to 2.4-fold in the total weed density of weed seeds compared to deep-plowed fields (CP) (Figure 14).
Different trends were found in the deeper soil layer (10–25 cm) in 2020–2021, in the fields where straw was chopped and spread (S1). However, in fields with different tillage technologies (SAW, NTC, NT), the total number of weed seeds in the topsoil decreased compared to deep-plowed (CP) fields.
In 2019–2021, straw chopping and spreading (S1) had a different effect on the total weed seed abundance in the deeper soil layer (10–25 cm) compared to removing straw from fields (S0). Different tillage technologies (SAW, NTC, NT) reduced the total weed seed incidence compared to conventional tillage (CP) (Figure 14).
In 2020, in the fields where straw was removed (S0), there was a linear, very strongly positive, and statistically significant correlation (r = 0.99, y = −919.54 + 1.05x, p < 0.01) between the annual and total number of weed seedlings in the 0–10 cm layer. In the fields where the straw was chopped and spread (S1), there was a linear, very strongly positive, and statistically significant correlation between the annual and total weeds in the 10–20 cm layer (r = 0.99, y = 519.90 + 0.98x, p < 0.01). In the fields where the straw was chopped and spread (S1), there was a linear, very strong positive, and statistically significant correlation between the number of annual weeds and the total number of weeds in the 0–10 cm layer (r = 1.00, y = 137.72 + 1.01x, p < 0.01). In 2021, in the straw-removed fields (S0), there was a linear, very strongly positive, and statistically significant correlation (r = 0.99, y = −361.72 + 1.04x, p < 0.01) between the annual weeds and the total number of weeds in the 10–20 cm layer (r = 0.99, y = 285.18 + 1.05x, p < 0.01) and between the annual weeds and the total number of weed seeds in the 0–10 cm layer. In the fields where the straw was chopped and spread (S1), there was a linear, very strongly positive, and statistically significant correlation between the annual and total weed seeds in the 10–20 cm layer (r = 0, 99, y = 2133.80 + 0.97x, p < 0.01) and between the annual and total number of weed seeds in 0–10 cm layer (r = 0.98, y = −940.75 + 1.10x, p < 0.01). In the fields where the straw was chopped and spread (S1), there was a linear, strongly positive, and statistically significant correlation between the number of annual weeds and the number of annual weed seeds in the 10–20 cm layer (r = 0.85, y = −9408.62 + 872.34x, p < 0.05), between the weed density of annual weeds and the total number of weeds in the 10–20 cm layer (r = 0.92, y = −5919.58 + 824.97x, p < 0.05), and between the weed density of perennial weeds and the number of perennial weeds in the 10–20 cm layer (r = 0.81, y = 359.67 + 122.15x, p < 0.05).
In summary, we can state that stubble over winter (SOW) in 2019–2021 increased the number of weeds in the studied soil seed layers. In the upper soil layer (0–10 cm), the number of annual and total weeds increased, but in the deeper layer (10–20), the opposite results were found. The number of perennial weed seeds increased in the studied soil layers. The no-till-with-cover-crop (NTC) tillage system increased the number of annual weeds in the upper (0–10 cm) soil layer but decreased it in the deeper layer (10–20 cm).

3.3. Comprehensive Assessment of Different Tillage Systems and Straw

The aim is to reduce soil depletion, stop the loss and degradation of its humus, reduce the leaching of nutrients from the soil, protect against the erosion and decay of structures, promote natural biological processes, and balance organic metabolism [36]. Soil contaminated with weeds is unable to resist increased physical and chemical loads, loses all or part of its full-fledged ecological functions, and becomes damaged in one way or another [37]. It is very difficult to decide which indicator has a greater impact on the crop agroecosystem and which has a lesser impact. A complex assessment system would solve this problem. The results of the complex assessment of the long-term impact of tillage technologies on the agroecosystem, taking into account four indicators, are presented in the figures below (Figure 15, Figure 16, Figure 17 and Figure 18).
In 2019–2021, when assessing the weediness of the above-ground part of crops after using different tillage technologies, it was found that the same effect was found in fields with straw (S1) and without straw (S0) (Figure 15). Removing the straw (S0) caused the annual and total weeds to score above the assessment threshold (5 points). The highest evaluation scores were obtained for the number of annual weeds when straw was spread in the fields using different tillage technologies (S1). Also, one of the highest evaluation scores (above the evaluation limit) was obtained for the total biomass of annual weeds when straw was spread in the fields using different tillage technologies (S1).
In 2019–2021, when assessing the weediness (number and biomass) of the above-ground part of agricultural crops, applying researched tillage technologies (SP, SC, SOW, NTC, NT) showed a strong effect (Figure 16). All tillage systems had an impact on the studied indicators: the number of annual weeds, the number of perennial weeds, and the total weed biomass. Among all tillage systems, no-till-with-cover-crop (NTC) tillage stood out in the study of perennial weed biomass. It was below the assessment limit (4.99). The highest evaluation scores were obtained when examining the number of annual, perennial and total weeds when the shallow cultivation (SC) tillage system was used in the fields. The scores of the obtained indicators of perennial weed biomass increased the most (above the evaluation limit) with the application of deep plowing (CP) and shallow plowing (SP) (Figure 16).
In 2019–2021, when evaluating the seed bank of cultivated plants after applying different tillage technologies, it was found that the fields with straw (S1) and without straw (S0) had a uniformly increasing effect (Figure 17). Removing straw (S0) influenced the number of annual and total weed seeds (in soil layers 0–10, 10–25 cm), increasing the scores to be more than the evaluation limit (5 points). The highest evaluation scores were obtained for the number and total number of annual weed seeds (soil layer 0–10 cm) when straw was spread in fields using different tillage techniques (S1). However, one of the lowest evaluation scores (not reaching the evaluation threshold of 5 points) was obtained for the number of perennial weed seeds (soil layer 10–25 cm) for fields with removed straw (S0) and spread with straw (S1) using different tillage technologies.
In 2019–2021, when evaluating the weed seed bank of agricultural crops, applying different tillage technologies (CP, SP, SC, SOW, NTC, NT) revealed a strong effect (Figure 18). All tillage systems had an influence (above the evaluation limit) on the studied indicators: the number of annual weed seeds (soil layer 0–10 cm, 10–25 cm), the number of perennial weed seeds (soil layer 0–10 cm, 10–25 cm), and the total number of seeds (soil layer 10–25 cm). An exception was the soil in which the examined layer of 0–10 cm weed seed bank was below the assessment limit, when the no-till-with-cover-crops (NTC) technology was applied.
The calculated complex evaluation indicators (KVIs), consisting of the average of all evaluation points (VBs) and standard deviations, not exceeding the evaluation limit, standard deviation, and areas limited by evaluation points, show that the positive impact on the agroecosystem is greater with the application of simplified tillage technologies than with deep plowing technology (CP). Tillage techniques with and without straw (S1, S0) had the same effect on crop weediness.

4. Discussion

4.1. Weeds in Crop Fields

There are 420 weed species in Lithuania. Of these, about 250 are found in crops. As agricultural production has increased, plant growth conditions have changed, and at the same time, the species composition of weeds has also changed [38]. Research has shown that wild radish (Raphanus raphanistrum L.) can reduce oilseed rape yield by up to 90% [39].
Technologies that are environmentally friendly and soil- and resource-friendly are acceptable for modern agriculture [40]. Minimum-tillage systems are becoming increasingly popular [41,42]. The objectives of surface tillage are to control germinated and emergent weeds, break up the turf, smooth the soil surface, prepare seedbeds, apply fertilizers that have been spread on the surface, improve seed germination by compacting the soil with rollers, and so on [42].
Tillage is among the most energy-intensive and costly processes in agricultural production. However, minimum-tillage systems such as no tillage, surface tillage, mulching, and chiseling increase the weediness of the crop in comparison to the conventional tillage system, as the main mass of weeds is shallow (0–10 cm) and regrows quickly [43,44,45]. Studies show that reduced tillage increases the incidence of perennial (couch grass, creeping thistle) and annual weeds in spring and winter cereals [46]. Romaneckas et al. [5], in their studies, determined the abundance of weeds (units m−2) at the beginning and end of Faba bean vegetation. Among all the simplified tillage methods (SP 12–15 cm, DC 25–30 cm, SC 10–12 cm), NT increased the prevalence of perennial weed species most. The most prevalent weeds in the crops were Taraxacum officinale F. H. Wigg., Plantago major L., Sonchus arvensis L., Equisetum arvense L., Elytrigia repens L., and Cirsium arvense L. Many researchers are critical of reduced tillage and argue that reduced tillage is highly detrimental to yields and yield quality, with yields being reduced by increased weediness (weed levels are higher in shallow plowing, shallow no till, and direct sowing [47,48]) and that shallow no-till tillage results in greater compaction of the deeper layers of the soil, with negative effects on seed germination, root development, and yield and quality [49,50].
To reduce the incidence of weeds, diseases, and pests, as well as nutritional problems, an appropriate choice of pre-seed and tillage practices is needed [51]. Weed abundance and spread also depend on climatic conditions [52], soil physical and agrochemical properties, crop density, etc. [53].
The main objective of tillage is to kill perennial weeds, damage their roots, and reduce the number of their seeds in the soil [54]. One of the main factors limiting the potential of tillage reduction and direct sowing on uncultivated soils is increased weediness, as the abandonment of plowing and deep loosening inevitably leads to an increase in weed content [55]. To destroy perennial weeds, damage their root system, and reduce the number of seeds in the soil, we apply basic tillage [17]. One of the main problems is that when deep plowing and loosening are abandoned, weediness inevitably increases in direct sowing fields. The influence of environmental conditions is greater than the choice of tillage systems. The minimum-tillage system did not have a significant effect on crop yields and weed species diversity. Crop rotation had a greater influence on weed species diversity than the choice of tillage method [56].
Changes in soil conditions (through the application of no-tillage techniques, leaving crop residues) change the ecological properties of the soil: moisture, temperature, nutrient content, and soil pH. These conditions and their changes over the years are reflected in the ecological groups of weeds in the agrocenosis of the crop [57]. In experiments where field rotations were applied (spring rape, winter wheat, spring barley), favorable conditions for the spread of different weed species were created [54,57].

4.2. Weed Seed Bank

A study by Avižienytė et al. [58] found that different tillage practices did not affect weed abundance. Generally, the soil differentiated into an upper layer was more contaminated with weed seeds (60.1% of the total), and the deeper layer was less contaminated (39.9%). In the spring crop, the weed mass was on average 28.6%, 41.5%, 39.9%, and 16.1% higher in the shallow-plowed, the deep-plowed, and the no-till fields, respectively, than in the conventionally plowed fields, while in the winter wheat crop, it was 2.5, 2.3, and 3.4 times higher, respectively, than in the conventionally plowed fields and 2.8 times lower in the no-till fields. Other researchers claim that plowing increases the number of weeds in the soil layer, while direct sowing increases the number of weeds only in the top 0–1 cm [59]. D. A. Derksen and other researchers have suggested that changes in weed germination depend more on location and weather conditions—such as rainfall and favorable temperatures—than on tillage [60]. While most tillage methods successfully remove established weeds, their effects on seeds (both plant and soil) can vary from a complete reduction to a significant increase in subsequent seed germination. Tillage can accelerate seed germination by scarifying (cracking, breaking, scratching…), i.e., exposing the seed to a brief flash of light. In addition, the soil is loosened, aerated, mineralized, and dried by the up-and-down movement of the seeds caused by tillage. Also, the conditions change depending on if the soil has been covered with straw or not. These changes in soil conditions can cause seed germination or seed dormancy [61,62,63]. Studies conducted by other authors have also shown that different main tillage treatments generally did not have a consistent effect on final seed germination, seed yield, thousand-seed weight, or quality indicators of crop seeds [64]. Scientists found that plowless tillage initiated higher weed seed distribution in the upper (0–10 cm) soil layers and lower distribution in 10–20 cm layer [65]. It should also be remembered that the number of weeds can be influenced not only by tillage and straw, but also by meteorological conditions [66].

5. Conclusions

The impact of straw in 2019–2021 was found to be very different when analyzing the number of annual weeds, perennial weeds, and the total numbers, as well as dry matter biomass. In the study years (2019–2021), shallow-plowed (SP) fields showed a decrease in annual weed and total weed numbers and dry matter biomass compared to conventionally plowed (CP) fields. Different tillage technologies had different effects on perennial weeds. In the study years (2019–2021), in the upper layer (0–10 cm) of the soil, in fields where straw was chopped and spread (S1), the number of annual weeds and total weed seeds decreased compared to fields where straw was removed (S0). In the upper layer (0–10 cm) of the soil tested, the number of annual, perennial, and total weed seeds increased in fields where stubble had been left over winter and fields whose stubble had been cut with a disc cultivator before sowing (SOW) compared to conventionally plowed (CP) fields. In the deeper soil layer (10–25 cm), direct sowing with cover crops (NTC) and direct sowing without cover crops (NT) showed a decrease in the number of annual weeds and total weed seeds compared to conventional plowing (CP). In fields where stubble was left over winter and fields whose stubble was cut before sowing with a disc cultivator (SOW), the number of annual weeds and total weed seeds decreased, but the number of perennial weeds increased, compared to conventionally plowed (CP) fields. Not using straw (S0) increased weediness in all three years (2019–2021). No-tillage (NT) application reduced weediness in the study years (2019–2021).
The long-term reduction in tillage intensity has a positive complex effect compared to conventional plowing (CP). Direct sowing of no-till-without-cover-crop (NT) fields, in combination with complex measures that ensure the formation of healthy, viable, uncontaminated crops and their seeds, is promising and recommended.

Author Contributions

Conceptualization, S.A. (Sinkevičienė Aušra), S.A. (Sinkevičius Alfredas) and K.R.; methodology, S.A. (Sinkevičienė Aušra), B.V. and K.R.; software, S.A. (Sinkevičienė Aušra), S.A. (Sinkevičius Alfredas) and K.R.; validation, S.A. (Sinkevičienė Aušra) and K.R.; formal analysis, S.A. (Sinkevičienė Aušra), A.L. and K.R.; investigation, S.A. (Sinkevičienė Aušra), A.L., and K.R.; resources, S.A. (Sinkevičienė Aušra) and K.R.; data curation, K.R.; writing—K.R.; writing—K.R.; visualization, K.R.; supervision, S.A. (Sinkevičius Alfredas); project administration, S.V. and K.R.; funding acquisition, S.V. and K.R. All authors have read and agreed to the published version of the manuscript.

Funding

This research received no external funding.

Data Availability Statement

The original contributions presented in the study are included in the article, further inquiries can be directed to the corresponding authors.

Conflicts of Interest

The authors declare no conflicts of interest.

References

  1. Mantel, S.; Dondeyne, S.; Deckers, S. World reference base for soil resources (WRB). In Encyclopedia of Soils in the Environment; Elsevier: Amsterdam, The Netherlands, 2023; pp. 206–217. [Google Scholar]
  2. Harker, K.N.; O’Donovan, J.T. Recent Weed Control, Weed Management, and Integrated Weed Management. Weed Technol. 2013, 1, 1–11. [Google Scholar] [CrossRef]
  3. Balick, M.J.; Cox, P.A. Plants, People, and Culture: The Science of Ethnobotany; Garland Science: New York, NY, USA, 2020; p. 228. [Google Scholar] [CrossRef]
  4. Romaneckas, K.; Romaneckienė, R.; Šarauskis, E.; Pilipavičius, V.; Sakalauskas, A. The effect of conservation primary and zero tillage on soil bulk density, water content, sugar beet growth, and weed infestation. Agron. Res. 2009, 7, 73–86. [Google Scholar]
  5. Romaneckas, K.; Kimbirauskienė, R.; Sinkevičienė, A.; Jaskulska, I.; Buragienė, S.; Adamavičienė, A.; Šarauskis, E. Weed diversity, abundance, and seed bank in differently tilled faba bean (Vicia faba L.) cultivations. Agronomy 2021, 11, 529. [Google Scholar] [CrossRef]
  6. Van Groenigen, K.J.; Bloem, J.; Bååth, E.; Boeckx, P.; Rousk, J.; Bode, S.; Forrista, D.; Jones, M. Abundance, production and stabilization of microbial biomass under conventional and reduced tillage. Soil Biol. Biochem. 2010, 42, 48–55. [Google Scholar] [CrossRef]
  7. Tørresen, K.S.; Skuterud, R.; Tandsaether, H.J.; Hagemo, M.B. Long term experiments with reduced tillage in spring cereals. I. Effects on weed flora, weed seed bank and grain yield. Crop Prot. 2003, 22, 185–200. [Google Scholar] [CrossRef]
  8. Hoffmann, J.H.; Moran, V.C. Assigning success in biological weed control: What do we really mean? In Proceedings of the XII International Symposium on Biological Control of Weeds, La Grande Motte, France, 22–27 April 2007; CAB International: Wallingford, UK, 2008; pp. 687–692. [Google Scholar]
  9. Alsaadawi, A.S.; Dayan, F.E. Potentials and prospects of sorghum allelopathy in agroecosystems. Allelopath. J. 2009, 24, 255–270. [Google Scholar]
  10. Lahmod, N.R. Allelopathic Effects of Sorghum (Sorghum bicolor L.) Moench on Companion Weeds and Subsequence Crop. Ph.D. Thesis, Field Crop Science, College of Agricultural, University of Baghdad, Baghdad, Iraq, 2012. [Google Scholar]
  11. Finney, D.M.; Creamer, N.G.; Weed Management on Organic Farms. Organic Center for Environmental Farming Systems. A Cooperative Effort Between North Carolina State University, North Carolina A T State University, and the North Carolina Department of Agriculture and Consumer Services 2008. Available online: https://cefs.ncsu.edu/ (accessed on 4 February 2007).
  12. Clark, A. Managing Cover Crops Profitably, 3rd ed.; Sup Handbook; United Book Press, Inc.: Bensalem, PE, USA, 2012; Available online: https://www.sare.org/publications/covercrops/covercrops.pdf (accessed on 4 February 2007).
  13. Shaner, D.L.; Beckie, H.J. The future for weed control and technology. Pest Manag. Sci. 2014, 70, 1329–1339. [Google Scholar] [CrossRef]
  14. Chauhan, B.S.; Gill, G.S.; Preston, C. Tillage system effects on weed ecology, herbicide activity and persistence: A review. Aust. J. Exp. Agric. 2006, 46, 1557–1570. [Google Scholar] [CrossRef]
  15. Dayan, F.E. Current status and future prospects in herbicide discovery. Plants 2019, 8, 341. [Google Scholar] [CrossRef]
  16. Nawaz, A.; Farooq, M.; Nadeem, F.; Siddique, K.H.; Lal, R. Rice–wheat cropping systems in South Asia: Issues, options and opportunities. Crop Pasture Sci. 2019, 70, 395–427. [Google Scholar] [CrossRef]
  17. Kosteckienė, S. Regularities of Development and Yields of Spring Rapeseed (Brassica napus L.) Sown at Different Dates. Ph.D. Thesis, Vytautas Didysis University, Kaunas, Akademija, 2022; p. 181. [Google Scholar]
  18. Yalew, S.G.; Vliet, M.T.; Gernaat, D.E.; Ludwig, F.; Miara, A.; Park, C.; Vuuren, D.P. Impacts of climate change on energy systems in global and regional scenarios. Nat. Energy 2020, 5, 794–802. [Google Scholar] [CrossRef]
  19. Meena, S.D.; Susank, M.; Guttula, T.; Chandana, S.H.; Sheela, J. Crop yield improvement with weeds, pest and disease detection. Procedia Comput. Sci. 2023, 218, 2369–2382. [Google Scholar] [CrossRef]
  20. Zhang, Q.; He, Z.; Wang, J. Acute Toxicity, Oxidative Stress, Toxicity Mechanism, and Degradation Dynamics of Trifluralin in Eisenia foetide (Annelida: Lumbricidae). J. Entomol. Sci. 2023, 58, 27–46. [Google Scholar] [CrossRef]
  21. Gallandt, E.R.; Liebman, M.; Huggins, D.R. Improving soil quality: Implications for weed management. J. Crop Prod. 1999, 2, 95–121. [Google Scholar] [CrossRef]
  22. Geddes, C.M.; Tidemann, B.D.; Ikley, J.T.; Dille, J.A.; Soltani, N.; Sikkema, P.H. Potential spring canola yield losses due to weeds in Canada and the United States. Weed Technol. 2022, 36, 884–890. [Google Scholar] [CrossRef]
  23. Shamshitov, A.; Kadžienė, G.; Supronienė, S. The Role of Soil Microbial Consortia in Sustainable Cereal Crop Residue Management. Plants 2024, 13, 766. [Google Scholar] [CrossRef] [PubMed]
  24. Sudianto, E.; Neik, T.X.; Tam, S.M.; Chuah, T.S.; Idris, A.A.; Olsen, K.M.; Song, B.K. Morphology of Malaysian weedy rice (Oryza sativa): Diversity, origin and implications for weed management. Weed Sci. 2016, 64, 501–512. [Google Scholar] [CrossRef]
  25. Marcinkevičienė, A.; Keidan, M.; Pupalienė, R.; Velička, R.; Kriaučiūnienė, Z.; Butkevičienė, L.M.; Kosteckas, R. Nonchemical weed control in winter oilseed rape crop in the organic farming system. In Organic Agriculture; IntechOpen: London, UK, 2017; pp. 121–131. [Google Scholar]
  26. Tuskenytė, V.; Volungevičius, J. Aplinkos Apsaugos Raidos Problema Lietuvoje. Geologija. Geogr. 2015, 1, 105–115. [Google Scholar] [CrossRef]
  27. IUSS Working Group WRB. World Reference Base for Soil Resources 2020. In International Soil Classification System for Naming Soils and Creating Legends for Soil Maps; Update 2023. World Soil Resources Report; FAO: Rome, Italy, 2020; pp. 1–13. [Google Scholar]
  28. Stancevičius, A. Weed Accounting and Weed Field Mapping; Mokslas: Vilnius, Lithuania, 1979. (In Lithuanian) [Google Scholar]
  29. Stancevičius, A. New Rational Method for Determining Weed Seed Content in the Soil. Agronomy, Land Reclamation and Hydro-Engineering; Lithuanian University of Agriculture: Kaunas, Lithuania, 1980. (In Lithuanian) [Google Scholar]
  30. Guan, G.Q.; Zhang, Y.R.; Sun, G.Y.; Ding, S.X.; Wang, Y.B. Illustrated Handbook of Weed Seed; Science Press: Beijing, China, 2000. (In Chinese) [Google Scholar]
  31. Vasileiadis, V.P.; Froud-Williams, R.J.; Eleftherohorinos, I.G. Vertical distribution, size and composition of the weed seed bank under various tillage and herbicide treatments in a sequence of industrial crops. Weed Res. 2007, 47, 222–230. [Google Scholar] [CrossRef]
  32. Leonavičienė, T. SPSS Programų Paketo Taikymas Statistiniuose Tyrimuose; Vilniaus Pedagoginio Universiteto Leidykla: Vilnius, Lithuania, 2007; p. 126. [Google Scholar]
  33. Raudonius, S. Application of statistics in plant and crop research: Important issues. Zemdirb.-Agric. 2017, 104, 377–382. [Google Scholar] [CrossRef]
  34. Lohmann, G. Entwicklung Eines Bewertungsverfahrens Für Anbausysteme Mit Differenzierten Aufwandmengen Ertragssteigernder und Ertragssichernder Betriebsmittel. Ph.D. Dissertation, Institut für Pflanzenbau der Rheinischen Friedrich-Wilhelms-Universität Bonn, Bonn, Germany, 1994. [Google Scholar]
  35. Heyland, K.U. Zur Methodik einer integrierten Darstellung und Bewertung der Produktionverfahren im Pflanzenbau. Pflanzenbauwissenscgaften 1998, 2, 145–159. [Google Scholar]
  36. Mauer, K.; Hellmann, S.L.; Groth, M.; Fröbius, A.C.; Zischler, H. The genome, transcriptome, and proteome of the fish parasite Pomphorhynchus laevis (Acanthocephala). PLoS ONE 2020, 15. [Google Scholar] [CrossRef] [PubMed]
  37. Pliūra, A.; Bajerkevičienė, G.; Suchockas, V.; Lygis, V.; Jankauskienė, J. Septynių miško medžių rūšių atsakas į su klimato kaita susijusių veiksnių-šalnų, karščio, sausrų, didesnio intensyvumo UV spinduliuotės ir didesnių ozono bei anglies dioksido koncentracijų kompleksinį poveikį jauname amžiuje. Agrariniai ir Miškininkystės Mokslai: Naujausi Tyrimų Rezultatai ir Inovatyvūs Sprendimai: Mokslinės Konferencijos Pranešimai. 2019, Volume 9, pp. 45–48. Available online: https://scholar.google.com/scholar?hl=en&as_sdt=0%2C5&q=Pli%C5%ABra%2C+A.%3B+Bajerkevi%C4%8Dien%C4%97%2C+G.%3B+Suchockas%2C+V.%3B+Lygis%2C+V.%3B+Jankauskien%C4%97%2C+J.+Septyni%C5%B3+mi%C5%A1ko+med%C5%BEi%C5%B3+r%C5%AB%C5%A1i%C5%B3+atsakas+%C4%AF+su+klimato+kaita+susijusi%C5%B3+veiksni%C5%B3-%C5%A1aln%C5%B3%2C+kar%C5%A1%C4%8Dio%2C+sausr%C5%B3%2C+didesnio+intensyvumo+UV+spinduliuot%C4%97s+ir+didesni%C5%B3+ozono+bei+anglies+di-oksido+koncentracij%C5%B3+kompleksin%C4%AF+poveik%C4%AF+jauname+am%C5%BEiuje.+In+Agrariniai+ir+Mi%C5%A1kininkyst%C4%97s+Mokslai%3A+Naujausi+Tyrim%C5%B3+Rezultatai+ir+Inovatyv%C5%ABs+Sprendimai%3A+Mokslin%C4%97s+Konferencijos+Prane%C5%A1imai%3B+2019%3B+Volume+9%2C+pp.+45%E2%80%9348.&btnG= (accessed on 4 February 2007).
  38. Rašomavičius, V. Laukų Augalijos Tyrimai: Mokslinė Ataskaita; LAMMC: Vilnius, Lithuania, 2008; p. 74. [Google Scholar]
  39. Blackshaw, R.E.; Anderson, R.L.; Lemerle, D. Cultural Weed Management. Non-Chemical Weed Management: Principles, Concepts and Technology; CAB International: Wallingford, UK, 2007; pp. 35–48. [Google Scholar]
  40. Kassam, A. Conservation agriculture for regenerative and resilient production systems. In Biological Approaches to Regenerative Soil Systems; CRC Press: Boca Raton, FL, USA, 2023; pp. 251–264. [Google Scholar]
  41. Vilde, A.; Lapins, D.; Dinaburga, G.; Cesnieks, S.; Valainis, O. Investigations in precise agriculture: Results, problems, perspective development. Eng. Rural. Dev. 2012, 11, 74–80. [Google Scholar]
  42. Laguerre, G.; Contreras, A., Jr.; Hanson, B.D. Evaluation of weed control efficacy and crop safety of the PPO-inhibiting herbicide tiafenacil in California orchard cropping systems. Weed Technol. 2024, 38, 46–63. [Google Scholar] [CrossRef]
  43. Marcinkevičienė, A.; Bogužas, V. The influence of catch crops and manure on soil bioactivity in sustainable and organic farming. Žemdirbystė 2006, 93, 146–154. [Google Scholar]
  44. Velykis, A.; Satkus, A. Weed infestation and changes in field pea (Pisum sativum L.) yield as affected by reduced tillage of a clay loam soil. Zemdirb.-Agric. 2010, 97, 73–82. [Google Scholar]
  45. Juchnevičienė, A.; Raudonius, S.; Avižienytė, D.; Romaneckas, K.; Bogužas, V. Ilgalaikio supaprastinto žemės dirbimo ir tiesioginės sėjos įtaka žieminių kviečių pasėliui. Žemės Ūkio Moksl. 2012, 19, 139–150. [Google Scholar] [CrossRef]
  46. Skuodienė, R. The influence of primary soil tillage, deep loosening and organic fertilizers on weed incidence in crop. Žemdirbystė 2016, 103, 135–142. [Google Scholar]
  47. Murad, N.Y.; Mahmood, T.; Forkan, A.R.M.; Morshed, A.; Jayaraman, P.P.; Siddiqui, M.S. Weed detection using deep learning: A systematic literature review. Sensors 2023, 23, 3670. [Google Scholar] [CrossRef]
  48. Bachheti, A.; Sharma, A.; Bachheti, R.K.; Husen, A.; Pandey, D.P. Plant allelochemicals and their various applications. In Co-Evolution of Secondary Metabolites; Springer: Berlin/Heidelberg, Germany, 2020; pp. 441–465. [Google Scholar]
  49. Eimutytė, E.; Adamavičienė, A.; Pupalienė, R.; Oksas, M.; Kimbirauskienė, R.; Čekanauskas, S.; Romaneckas, K. Effect of Non-chemical Weed Control Systems on Weediness of Organically Grown Sugar Beet Crop; International Scientific Conference: AgroEco2016: Programme and Abstracts; Aleksandro Stulginskio University: Kaunor, Akademija, 2016; Volume 23, pp. 103–113. [Google Scholar]
  50. Almoussawi, M.; Abdallah, A.M.; Habanjar, K.; Awad, R. Effect of (Sm, Co) co-doping on the structure and electrical conductivity of ZnO nanoparticles. Mater. Res. Express 2020, 7, 105011. [Google Scholar] [CrossRef]
  51. Hossain, M.A.; Khoo, K.T.; Cui, X.; Poduval, G.K.; Zhang, T.; Li, X.; Hoex, B. Atomic layer deposition enabling higher efficiency solar cells: A review. Nano Mater. Sci. 2020, 2, 204–226. [Google Scholar] [CrossRef]
  52. Jastrzębska, M.; Kostrzewska, M.K.; Marks, M.; Jastrzębski, W.P.; Treder, K.; Makowski, P. Crop rotation compared with continuous rye cropping for weed biodiversity and rye yield. A case study of a long-term experiment in Poland. Agronomy 2019, 9, 644. [Google Scholar] [CrossRef]
  53. Mockevičienė, R. Necheminių Piktžolių Kontrolės Priemonių ir Biologinių Preparatų Įtaka Vasarinių Rapsų Agrocenozei. Ph.D. Dissertation, Aleksandro Stulginskio Universitetas, Kaunas, Lithuania, 2017; p. 133. [Google Scholar]
  54. Marcinkevičienė, A.; Velička, R.; Mockevičienė, R.; Pupalienė, R.; Kriaučiūnienė, Z.; Butkevičienė, L.M.; Kosteckas, R.; Čekanauskas, S. Non-chemical weed control systems in organically grown spring oilseed rape. Acta Fytotechnol. zootechnol. 2015, 18, 34–36. [Google Scholar] [CrossRef]
  55. Alarcón, R.; Hernández-Plaza, E.; Navarrete, L.; Sánchez, M.J.; Escudero, A.; Hernanz, J.L.; Sánchez, A.M. Effects of no-tillage and non-inversion tillage on weed community diversity and crop yield over nine years in a Mediterranean cereal-legume cropland. Soil Tillage Res. 2018, 179, 54–62. [Google Scholar] [CrossRef]
  56. Winkler, J.; Dvořák, J.; Hosa, J.; Martínez Barroso, P.; Vaverková, M.D. Impact of conservation tillage technologies on the biological relevance of weeds. Land 2022, 12, 121. [Google Scholar] [CrossRef]
  57. Kutbay, H.G.; Sürmen, B. Ellenberg ecological indicator values, tolerance values, species niche models for soil nutrient availability, salinity, and pH in coastal dune vegetation along a landward gradient (Euxine, Turkey). Turk. J. Bot. 2022, 46, 346–360. [Google Scholar] [CrossRef]
  58. Avižienytė, D.; Romaneckas, K.; Pališkytė, R.; Bogužas, V.; Pilipavičius, V.; Šarauskis, E.; Vaiciukevičius, E. The impact of long-term reduced primary soil tillage on maize (Zea mays L.) productivity. Zemdirb.-Agric. 2013, 100, 377–382. [Google Scholar] [CrossRef]
  59. Wojciechowski, W.; Józef, S. Changes in the number of weed seeds in soil under different tillage systems of winter wheat. J. Plant Prot. Res. 2005, 83–92. Available online: https://journals.pan.pl/Content/118589/PDF-MASTER/083-092_Changes%20in%20the%20number%20of.pdf (accessed on 4 February 2007).
  60. Derksen, D.A.; Lafond, G.P.; Thomas, A.G.; Loeppky, H.A.; Swanton, C.J. Impact of agronomic practices on weed communities: Tillage systems. Weed Sci. 1993, 41, 409–417. [Google Scholar] [CrossRef]
  61. Pantović, J.G.; Sečanski, M. Weed Control in Organic Farming. Contemp. Agric. 2023, 72, 43–56. [Google Scholar] [CrossRef]
  62. Webber, C.L., III; White, P.M., Jr.; Boydston, R.A.; Shrefler, J.W. Impact of Mustard Seed Meal Applications on Direct Seeded Cucurbits and Weed Control. J. Agric. Sci. 2017, 9, 68–81. [Google Scholar] [CrossRef]
  63. Pedda Ghouse Peera, S.K.; Debnath, S.; Maitra, S. Mulching: Materials, Advantages and Crop Production. In Protected Cultivation and Smart Agriculture; Maitra, S., Gaikwad, D.J., Shankar, T., Eds.; New Delhi Publishers: New Delhi, India, 2020; pp. 55–66. [Google Scholar]
  64. Auškalnienė, O.; Kadžienė, G.; Janušauskaitė, D.; Supronienė, S. Changes in weed seed bank and flora as affected by soil tillage systems. Zemdirb.-Agric. 2018, 105, 221–226. [Google Scholar] [CrossRef]
  65. Scherner, A.; Melender, B.; Kudsk, P. Vertical distributions and composition of weed seeds within the plough layer after elever yers of contrasting crop rotation and tillage scheme. Soil Tillage Res. 2016, 161, 135–142. [Google Scholar] [CrossRef]
  66. Stancevičius, A.; Pupalienė, R. Įvairaus intensyvumo žemdirbystės sistemų liekamasis poveikis miežių pasėlio piktžolėtumui. Žemės Ūkio Moksl. 2003, 2, 3–14. [Google Scholar]
Figure 1. Average air temperature at the Kaunas Meteorological Station in 2019–2021.
Agronomy 15 01105 g001
Figure 2. Average precipitation at the Kaunas Meteorological Station in 2019–2021.
Agronomy 15 01105 g002
Figure 3. Weed density of annual weeds in the different crops before crop harvest, 2019–2021. Note: S0—without straw, S1—with straw; CP—conventional (deep) plowing, SP—shallow plowing, SC—shallow cultivation, SOW—stubble over winter, NTC—no till with cover crops, NT—no-till without cover crops. Differences significant at *—p ≤ 0.05 > 0.01, **—p ≤ 0.01 > 0.001, and ***—p ≤ 0.001. Whiskers indicate standard errors of the means.
Agronomy 15 01105 g003
Figure 4. Weed density of perennial weeds in the different crops before crop harvest, 2019–2021. Note: S0—without straw, S1—with straw; CP—conventional (deep) plowing, SP—shallow plowing, SC—shallow cultivation, SOW—stubble over winter, NTC—no till with cover crops, NT—no till without cover crops. Differences significant at ***—p ≤ 0.001. Whiskers indicate standard errors of the means.
Agronomy 15 01105 g004
Figure 5. Weed density of weeds in the different crops before crop harvest, 2019–2021. Note: S0—without straw, S1—with straw; CP—conventional (deep) plowing, SP—shallow plowing, SC—shallow cultivation, SOW—stubble over winter, NTC—no till with cover crops, NT—no till without cover crops. Differences significant at *—p ≤ 0.05 > 0.01, **—p ≤ 0.01 > 0.001, and ***—p ≤ 0.001. Whiskers indicate standard errors of the means.
Agronomy 15 01105 g005
Figure 6. Dry biomass of annual weeds in the different crops before crop harvest, 2019–2021. Note: S0—without straw, S1—with straw; CP—conventional (deep) plowing, SP—shallow plowing, SC—shallow cultivation, SOW—stubble over winter, NTC—no till with cover crops, NT—no till without cover crops. Differences significant at *—p ≤ 0.05 > 0.01 and **—p ≤ 0.01 > 0.001. Whiskers indicate standard errors of the means.
Agronomy 15 01105 g006
Figure 7. Dry biomass of perennial weeds in the different crops before crop harvest, 2019–2021. Note: S0—without straw, S1—with straw; CP—conventional (deep) plowing, SP—shallow plowing, SC—shallow cultivation, SOW—stubble over winter, NTC—no till with cover crops, NT—no till without cover crops. Differences significant at **—p ≤ 0.01 > 0.001 and ***—p ≤ 0.001. Whiskers indicate standard errors of the means.
Agronomy 15 01105 g007
Figure 8. Dry biomass of weeds in the different crops before crop harvest, 2019–2021. S0—without straw, S1—with straw; CP—conventional (deep) plowing, SP—shallow plowing, SC—shallow cultivation, SOW—stubble over winter, NTC—no till with cover crops, NT—no till without cover crops. Differences significant at *—p ≤ 0.05 > 0.01. Whiskers indicate standard errors of the means.
Agronomy 15 01105 g008
Figure 9. Weed density of annual weeds in the 0–10 cm soil layer after harvesting crops, 2019–2021. Note: Factor A: S0—without straw, S1—with straw; CP—conventional (deep) plowing, SP—shallow plowing, SC—shallow cultivation, SOW—stubble over winter, NTC—no till with cover crops, NT—no till without cover crops. Differences significant at *—p ≤ 0.05 > 0.01 and **—p ≤ 0.01 > 0.001. Whiskers indicate standard errors of the means.
Agronomy 15 01105 g009
Figure 10. Weed density of annual weeds in the 10–25 cm soil layer after harvesting crops, 2019–2021. Note: S0—without straw, S1—with straw; CP—conventional (deep) plowing, SP—shallow plowing, SC—shallow cultivation, SOW—stubble over winter, NTC—no till with cover crops, NT—no till without cover crops. Differences significant at **—p ≤ 0.01 > 0.001. Whiskers indicate standard errors of the means.
Agronomy 15 01105 g010
Figure 11. Weed density of perennial weeds in the 0–10 cm soil layer after harvesting crops, 2019–2021. Note: Factor A: S0—without straw, S1—with straw; CP—conventional (deep) plowing, SP—shallow plowing, SC—shallow cultivation, SOW—stubble over winter, NTC—no till with cover crops, NT—no till without cover crops. Differences significant at *—p ≤ 0.05 > 0.01 and ***—p ≤ 0.001. Whiskers indicate standard errors of the means.
Agronomy 15 01105 g011
Figure 12. Weed density of perennial weeds in the 10–25 cm soil layer after harvesting crops, 2019–2021. Note: Factor S0—without straw, S1—with straw; CP—conventional (deep) plowing, SP—shallow plowing, SC—shallow cultivation, SOW—stubble over winter, NTC—no till with cover crops, NT—no till without cover crops. No significant differences at p > 0.05; Fisher LSD test vs. control. Whiskers indicate standard errors of the means.
Agronomy 15 01105 g012
Figure 13. Weed density of weeds in the 0–10 cm soil layer after harvesting crops, 2019–2021. Note: Factor S0—without straw, S1—with straw; CP—conventional (deep) plowing, SP—shallow plowing, SC—shallow cultivation, SOW—stubble over winter, NTC—no till with cover crops, NT—no till without cover crops. Differences significant at *—p ≤ 0.05 > 0.01 and **—p ≤ 0.01 > 0.001. Whiskers indicate standard errors of the means.
Agronomy 15 01105 g013
Figure 14. Weed density of weeds in the 10–25 cm soil layer after harvesting crops, 2019–2021. S0—without straw, S1—with straw; CP—conventional (deep) plowing, SP—shallow plowing, SC—shallow cultivation, SOW—stubble over winter, NTC—no till with cover crops, NT—no till without cover crops. Differences significant at *—p ≤ 0.05 > 0.01 and **—p ≤ 0.01 > 0.001. Whiskers indicate standard errors of the means.
Agronomy 15 01105 g014
Figure 15. Complex assessment of different soil tillage systems and straw retention in the above-ground parts of weeds in the vegetation of cultivated plants in 2019–2021. Note: Factor A: S0—without straw, S1—with straw. Factor B: CP—conventional (deep) plowing, SP—shallow plowing, SC—shallow cultivation, SOW—stubble over winter, NTC—no till with cover crops, NT—no till without cover crops. CEI—complex evaluation index, *—an average of evaluation points (EPs), **—standard deviation of EP, ***—standard deviation of the average of the evaluation points below the evaluation threshold.
Agronomy 15 01105 g015
Figure 16. Complex assessment of different soil tillage systems and straw retention in the above-ground parts of weeds in the vegetation of cultivated plants in 2019–2021. Note: Factor A: S0—without straw, S1—with straw. Factor B: CP—conventional (deep) plowing, SP—shallow plowing, SC—shallow cultivation, SOW—stubble over winter, NTC—no till with cover crops, NT—no till without cover crops. CEI—complex evaluation index, *—an average of evaluation points (EPs), **—standard deviation of EP, ***—standard deviation of the average of the evaluation points below the evaluation threshold.
Agronomy 15 01105 g016
Figure 17. Complex assessment of different soil tillage systems and straw retention in the weed seed bank in the vegetation of cultivated plants in 2019–2021. Note: Factor A: S0—without straw, S1—with straw. Factor B: CP—conventional (deep) plowing, SP—shallow plowing, SC—shallow cultivation, SOW—stubble over winter, NTC—no till with cover crops, NT—no till without cover crops. CEI—complex evaluation index, *—an average of evaluation points (EPs), **—standard deviation of EP, ***—standard deviation of the average of the evaluation points below the evaluation threshold.
Agronomy 15 01105 g017
Figure 18. Complex assessment of different soil tillage systems and straw retention in the weed seed bank in the vegetation of cultivated plants in 2019–2021. Note: Factor A: S0—without straw, S1—with straw. Factor B: CP—conventional (deep) plowing, SP—shallow plowing, SC—shallow cultivation, SOW—stubble over winter, NTC—no till with cover crops, NT—no till without cover crops. CEI—complex evaluation index, *—an average of evaluation points (EPs), **—standard deviation of EP, ***—standard deviation of the average of the evaluation points below the evaluation threshold.
Agronomy 15 01105 g018
Disclaimer/Publisher’s Note: The statements, opinions and data contained in all publications are solely those of the individual author(s) and contributor(s) and not of MDPI and/or the editor(s). MDPI and/or the editor(s) disclaim responsibility for any injury to people or property resulting from any ideas, methods, instructions or products referred to in the content.

