Article

Planting Strategy Optimization Can Increase Maize Yield by Delaying Leaf Senescence and Improving Photosynthetic Capacity

College of Agriculture, Shanxi Agricultural University, Taigu 030801, China
*
Author to whom correspondence should be addressed.
Agronomy 2025, 15(5), 1099; https://doi.org/10.3390/agronomy15051099
Submission received: 17 March 2025 / Revised: 16 April 2025 / Accepted: 23 April 2025 / Published: 30 April 2025

Abstract

:
This study aimed to investigate the effects of different planting density and row spacing configurations on maize corn yield, leaf photosynthetic parameters, and senescence characteristics; to reveal the purpose of the physiological mechanism of row density interaction regulatsving maize yield; and to clarify the optimal planting combinations for optimizing population structure, delaying leaf senescence, and improving light energy utilization efficiency. In doing so, this study provides a theoretical basis and technical guidance for increasing corn yield, the sustainable development of the maize industry, and improved yield production in Shanxi Province. An experiment was conducted with a two-factor randomized block design, with three planting densities of 60,000 plants/hm2 (D1), 67,500 plants/hm2 (D2), and 75,000 plants/hm2 (D3) in the main area and four-row spacings of 40 + 40 cm, 40 + 80 cm, 50 + 50 cm, and 80 + 80 cm in the secondary area. The maize kernel yield, leaf photosynthetic parameters, malondialdehyde content, and anti-aging key enzyme activities were measured in 2023 and 2024. The results show that with the increase in planting density, the net photosynthetic rate of maize leaves gradually decreased, and the transpiration rate gradually increased. At the same time, too high or too low density will accelerate the aging of maize leaves, which is manifested by the increase in MDA (malondialdehyde) content and the decrease in SOD (superoxide dismutase) and CAT (catalase) activities. The best row spacing configuration performance is 40 + 80 cm, which is conducive to the ventilation and light transmission of maize plants, improves the efficiency of light energy utilization, slows down the aging of plant leaves, and thus promotes maize growth, development, and yield enhancement. The interaction effect between two intercropping maize factors significantly affects corn yield, with a medium density of 67,500, where 6000 is the most effective. Thus, 67,500 plants/hm2 combined with a row spacing of 40 + 80 cm significantly increases corn yield. This combination obtained the highest net photosynthesis, SOD, and CAT of 24.33 µmol·m−2·s−1, 32.54 U·mg−1 and 1038.99 U·g−1, and the lowest transpiration rate and MDA content of 3.47 mmo·m−2·s−1 and 108.95 µmo·L−1, resulting in the highest maize yield of 13,916.46 kg/hm2. In summary, a density of 67,500 plants/hm2 and 40 + 80 cm row spacing is the best combination, improving light energy utilization efficiency, delaying the leaf senescence process, and increasing the yield, which can provide a theoretical reference for the planting pattern of maize in Shanxi Province.

1. Introduction

As a critical crop, corn is used as food, feed, and industrial raw material globally. Its variety of traits (e.g., density tolerance, stress resistance) is useful in various applications in the context of ensuring global food security and fulfilling diverse needs (e.g., grain production, silage, fresh consumption) [1,2,3]. As carriers of genetic foundations, corn varieties directly dictate the growth and developmental trajectories of the plants, as well as their yield potential, making them the core starting point for modern maize cultivation. While factors in agricultural practices such as planting density and row spacing can modulate population structure and photosynthetic efficiency, their efficacy hinges on the variety’s characteristics. The misallocation of these technical measures may result in the failure to fully realize the potential of a given variety.
Shanxi Province is one of the primary corn-producing regions in China, with 70% of its planting area located in arid zones characterized by uneven precipitation and significant seasonal fluctuations. Long-standing issues, such as high planting density, lead to population closure, light energy waste, and improper row spacing configurations have resulted in low and unstable corn yields. Previous studies have demonstrated that planting density and row spacing are critical factors influencing maize growth [4,5]. Although high-density planting can increase the number of plants per unit area, too high a density will lead to increased competition between plants, especially in competition for light. Thus, lower leaves do not receive enough light, photosynthetic efficiency is reduced, leaf senescence is accelerated, and individual development is poor. Conversely, each plant can obtain more light resources with low density, which is conducive to improving the photosynthetic efficiency of the individual and slowing down leaf senescence, but the number of plants in the population is reduced, making it difficult to obtain high yields [6,7]. Liu et al. [8] concluded that high density is prone to cause irrational light distribution within the population, resulting in late-stage leaf senescence and reduced photosynthetic performance [9] and that the canopy structure is reasonable at medium and low densities, with higher canopy photosynthetic performance, which is more conducive to yield improvement. Wang et al. [10] concluded that dense planting with high-yield mode significantly slowed down the aging process of middle and lower leaves, improved the activity of protective enzymes, and facilitated the assimilation of photosynthetic substances after flowering to achieve high yields. Li et al. [11] pointed out that density had a significant effect on yield and spike traits. Bai et al. [12] found that dense planting can synergistically optimize the spatial distribution of light in the canopy, increase the amount of light energy intercepted in the middle and lower parts of the group after flowering, delay the aging of the group’s leaves, and promote the accumulation of dry matter in the group after flowering, which is conducive to obtaining a higher grain yield and light energy utilization.
The impact of the row spacing configuration on corn yield should not be ignored. A reasonable row spacing configuration determines the distribution of light between plants to ensure each corn plant can obtain sufficient light, delay leaf senescence, and thus improve yield. By increasing the distance between rows, Wang et al. [13] pointed out that a wide and narrow row planting pattern can significantly improve the distribution of light in the field and increase the amount of photosynthetically active radiation received by the leaves, thus improving the yield. Zhang et al. [14] showed that the same pattern can promote corn yield increase and improve water use efficiency, and Wang et al. [15] found that these row configurations can enhance SOD and POD enzyme activities and delay leaf senescence to increase yield. Li et al. [16] found that different cropping patterns can significantly alter leaf physiological activity. Fan et al. [17] pointed out that the wide and narrow row planting pattern improved the ventilation and light transmission conditions in the middle and lower part of the canopy, increased grain weight and the number of grains in the spike, and increased the biological yield and leaf area index. Tian et al. [18] found that this planting pattern can significantly enhance the photosynthetic capacity and soluble sugar content of spike leaves. Jin et al. [19] pointed out that the row spacing configuration is closely related to photosynthetic parameters, dry matter accumulation, and yield, and Gardner [20] found that it affects maize leaf senescence. However, current studies predominantly focus on density or single factors such as row spacing, targeting variety suitability within specific ecological regions (e.g., arid areas in Shanxi Province). Few systematic analyses have been conducted on the synergistic mechanisms underlying the interaction between density and row spacing to unlock the potential of dense-tolerant varieties, particularly regarding their effects on leaf photosynthetic characteristics, the aging process, and yield formation.
In this study, “Dafeng 1407”, the primary dense-tolerant maize variety in Shanxi Province, was selected as the experimental material. Field experiments were conducted to investigate the effects of different planting densities and line spacing configurations on the maize yield, leaf net photosynthetic rate, transpiration rate, and aging characteristics (malondialdehyde content, SOD and CAT activities). The aim was to identify the optimal combination and physiological mechanism underlying the interaction between density and row spacing. Based on the scientific principle that “variety characteristics determine the threshold of technical response”, the following research hypotheses were formulated: (1) The interaction between planting density and row spacing influences leaf photosynthetic efficiency by modifying the population microenvironment (light and ventilation), thereby regulating yield. (2) Moderate planting density combined with wide–narrow row configurations can enhance antioxidant enzyme activity, reduce membrane lipid peroxidation, delay leaf senescence, and improve grain-filling efficiency. (3) Excessive planting density or inappropriate row spacing exacerbates resource competition, leading to reduced photosynthetic performance and yield loss, with varying negative effects according to the density tolerance of the maize variety. The findings of this study are anticipated to provide a theoretical foundation and technical framework for the synergic adaptation of a “variety-density-row space” in regional high-yield and high-efficiency maize cultivation.

2. Materials and Methods

2.1. Experimental Materials

The maize variety selected was Dafeng 1407 (drought-resistant, high-yield, and dense-tolerant). It has a fertility period of about 126 days, neat spike position, strong resistance to downfall, stable yield, cylindrical cob, red rachis, yellow kernels, and resistance to Head Smut Disease, Northern Leaf Blight, and Ear Rot. Seed was provided by Shanxi Dafeng Seed Industry Co., Ltd., Taiyuan, China, and the germination rate exceeded 95%.

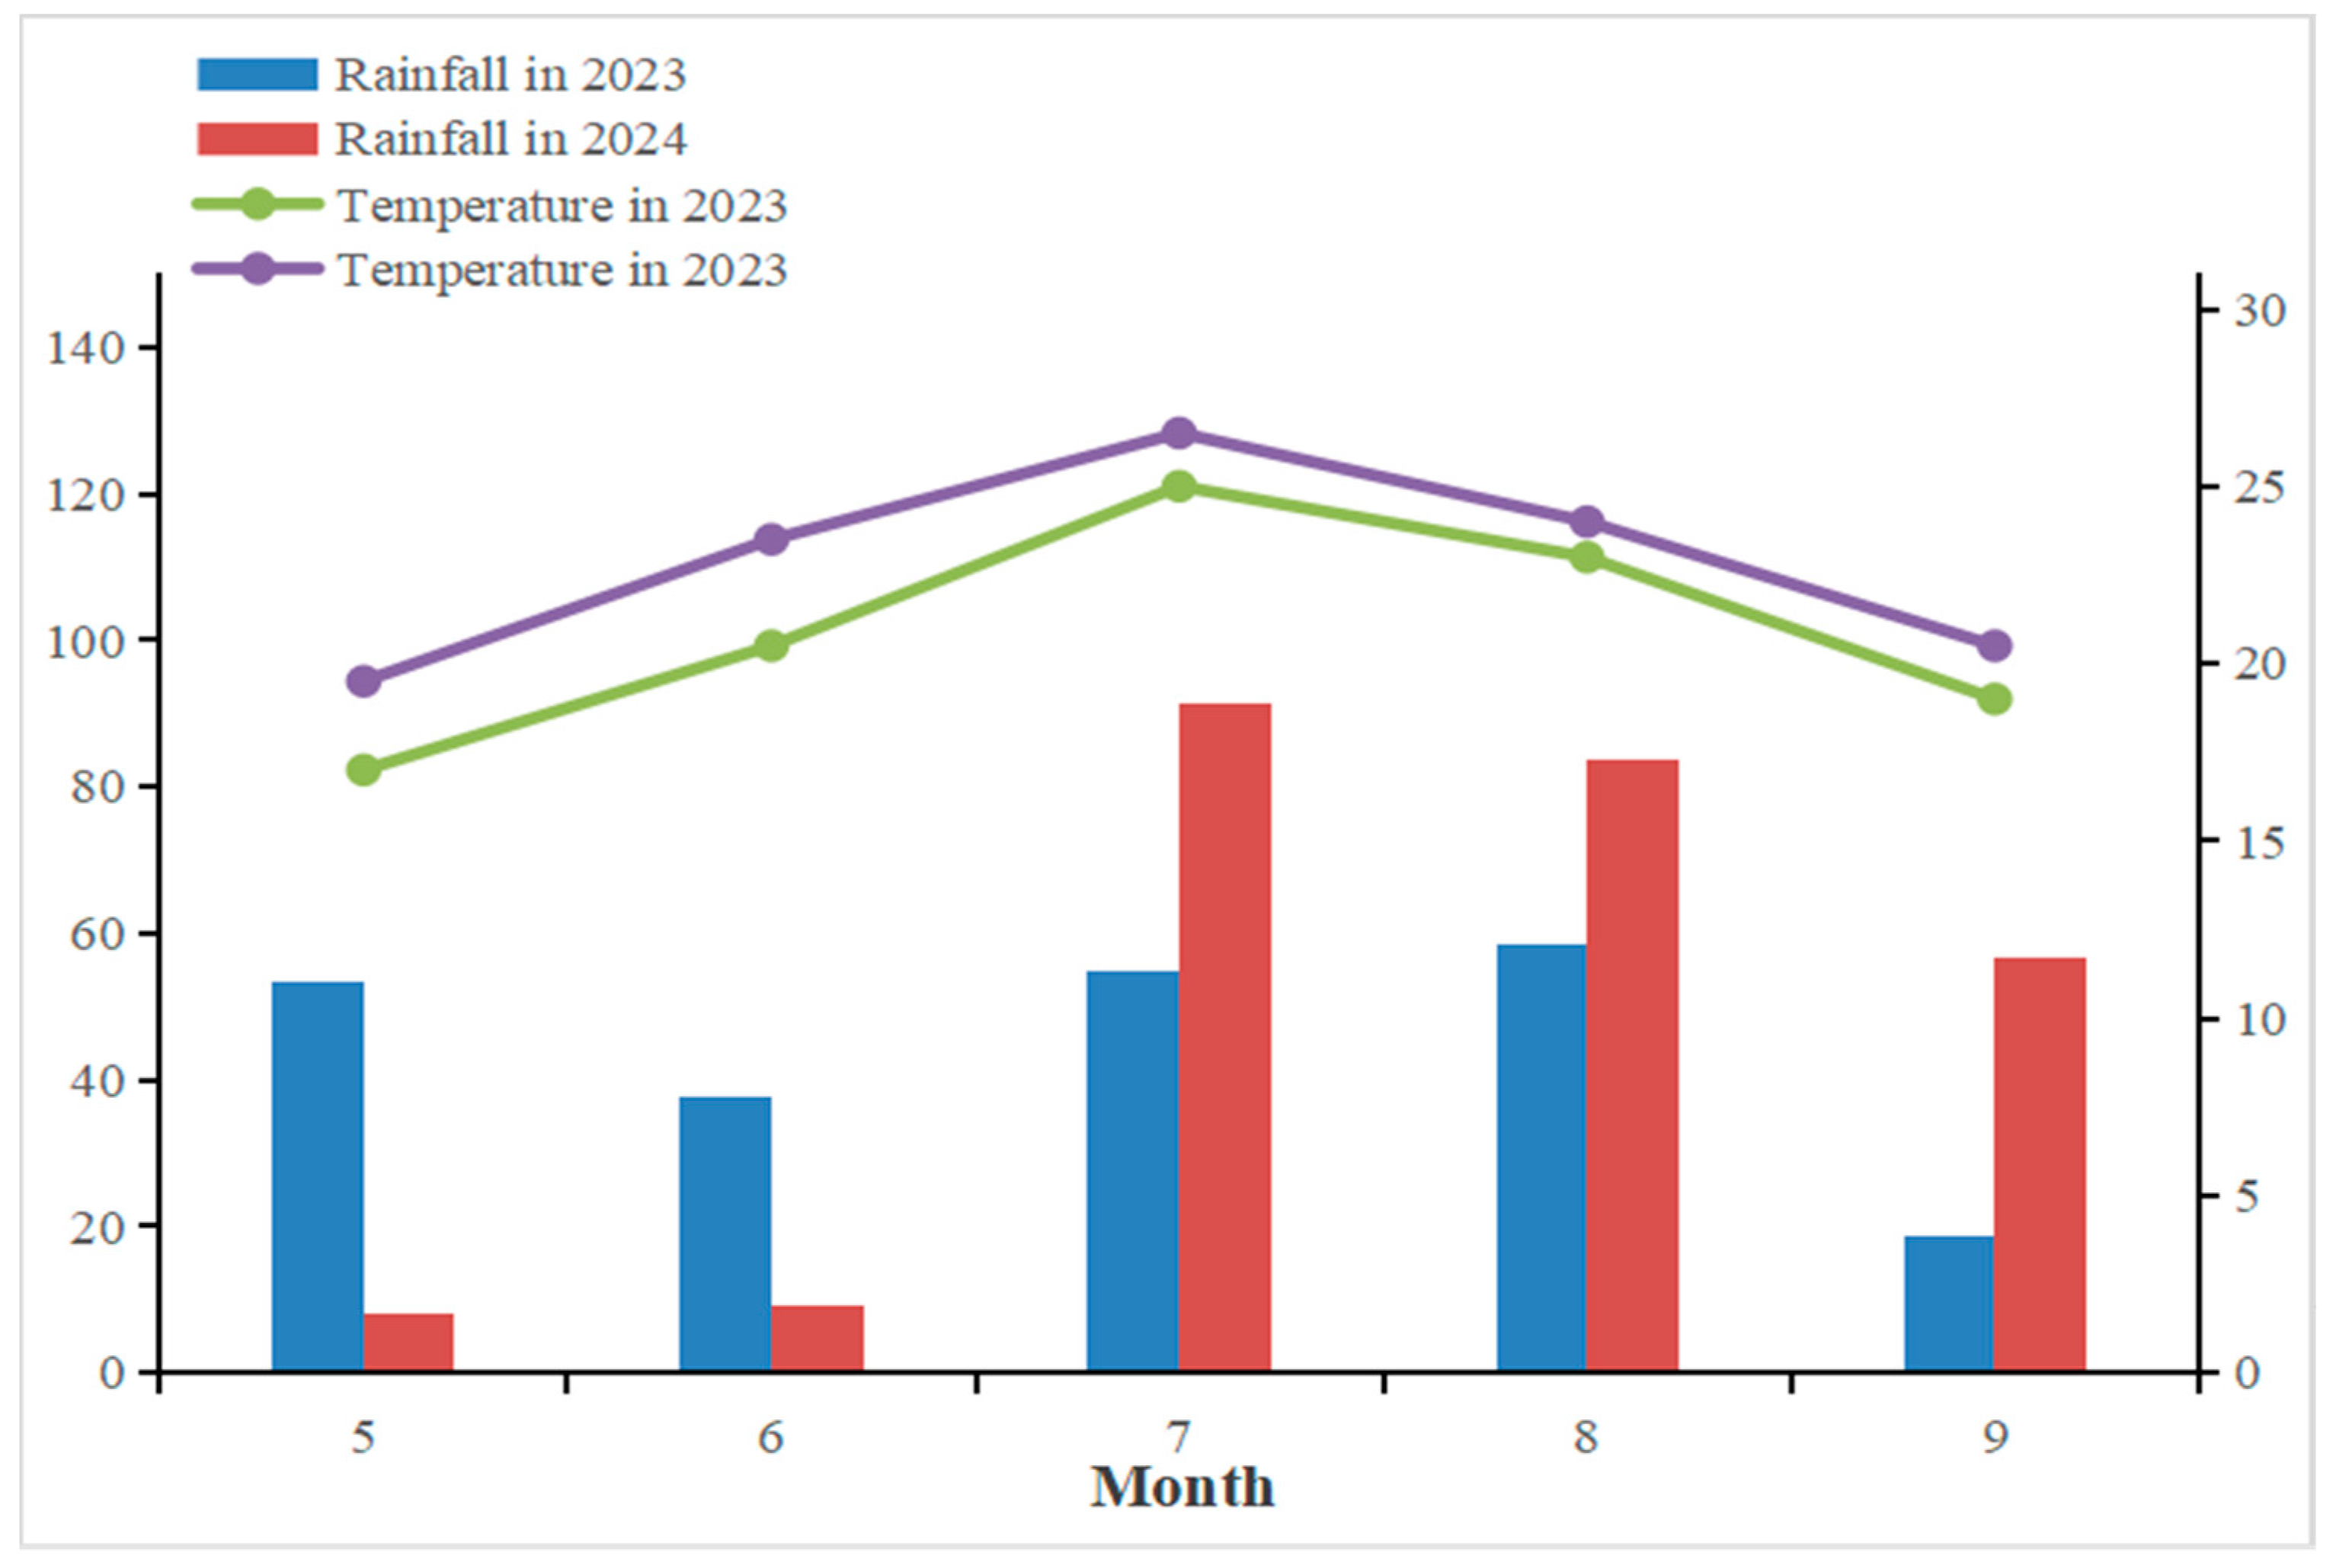
2.2. Overview of Test Site

The experiment was conducted from 2023 to 2024 at the Dongyang Experimental Base of Shanxi Agricultural University (112°40′34″ E, 37°32′55″ N), which has a warm-temperate semi-humid continental monsoon climate with an average annual frost-free period of 158 d. The average temperature in 2023 and 2024 was 10.7 °C and 11.9 °C, respectively, and the precipitation during the reproductive period was 222.9 mm and 248.9 mm, respectively. (Figure 1). The soil of the experimental site was yellow clay (Table 1).

2.3. Experimental Design

The experiment followed a two-factor randomized block design with three different planting densities (D1 60,000 plants/hm2, D2 67,500 plants/hm2, and D3 75,000 plants/hm2) and four different row spacing configurations (40 + 40 cm, 40 + 80 cm, 50 + 50 cm, and 80 + 80 cm), for a total of 12 treatment combinations, with each treatment replicated three times, totaling 36 Plots. Each plot was 10 m long and 5 m wide, with an area of 50 m2. Before seeding, compound fertilizer (N:P2O5:KO2 = 27:10:13) was applied to 750 kg/hm2 at the same time as rotary tillage and fertilization to ensure consistent nutrient supply among all treatments. The sowing time was from late April to early May. Within 3 days after seeding, acetochlor (90% emulsified oil, 1500 mL/hm2) + atrazine (40% suspended agent, 3000 mL/hm2) was sprayed for soil closure weeding, and the remaining weeds were pulled manually during the growing period. For disease and pest control, Carbofuran (3%) was applied to control corn borers in the heart leaf during the large-horn opening stage, imidacloprid (10% wettable powder, 150 g/hm2) was applied to control aphids during the germination stage, and carbendazim (50% wettable powder, 900 g/hm2) was applied to control large spot disease during the disease onset stage. Irrigation was carried out according to the soil moisture law and corn water requirements using a drip irrigation system. From the jointing stage to the filling stage, when the moisture content of 0–20 cm soil was lower than 60% of the field water capacity, the single irrigation amount was about 200 m3/hm2, and irrigation was stopped at the mature stage to ensure normal seed dehydration.

2.4. Measurement Items and Methods

2.4.1. Net Photosynthesis Rate (Pn) and Transpiration Rate (Tr)

At the jointing, trumpet, tasseling, grain-filling, and maturity stages of maize, representative functional corn leaves were selected at 9:00–11:00 a.m. on a sunny day, and their net photosynthesis rate and transpiration rate were measured using the portable infrared CO2 tester LI-6400 produced by the Beijing Laikuo Biotechnology Co., Ltd. (Beijing, China).

2.4.2. Physiological Indexes

At the jointing, trumpet, tasseling, grain-filling, and maturity stages of maize, representative maize leaves were randomly selected from 8:00 to 11:00 a.m. on a sunny day and put into ice pots to be brought back to the laboratory. The colorimetric methods of thiobarbituric acid and nitrogen blue tetrazolium were adopted to determine the malondialdehyde content and superoxide dismutase activity, respectively, while catalase activity was determined using the ultraviolet absorption method.
Enzyme solution preparation: First, clean the fresh sample to remove dust and debris from its surface. Carefully blot the surface water using absorbent paper, and then excise the midvein, leaf tip, and leaf edges. Subsequently, cut the remaining tissue into pieces smaller than 5 mm and mix thoroughly. Accurately weigh 0.5 g of the processed sample on an analytical balance and transfer it to a pre-cooled small mortar. Add 2 mL of the pre-cooled extraction medium, grind the sample to homogeneity in an ice bath, and transfer the resulting mixture to a 10 mL centrifuge tube. Rinse the mortar with the extraction medium 2–3 times (1–2 mL per rinse), pool all rinses into the centrifuge tube, and adjust the total volume to 10 mL with additional extraction medium. Centrifuge the suspension at 20,000× g for 20 min at 2 °C (prior to centrifugation, ensure tubes are balanced to protect the centrifuge). Collect the supernatant, which serves as the enzyme extract. Transfer the supernatant to a dry, pre-cooled stoppered test tube, seal it with the stopper, and store it in an ice bath until further analysis. Subsequently, store the samples in a refrigerator. Finally, determine the malondialdehyde content using the thiobarbiturate method [21], catalase activity via ultraviolet absorption [22], and superoxide dismutase activity through the nitrogen blue tetrazolium light method [21].

2.4.3. Yield Measurement in the Field and Indoor Seed Test

At harvest time, the middle two rows of each plot were taken for yield measurement. The bald tip length (cm), ear length (cm), and ear grain number (grains) were determined, the 100-grain weight (g) was determined after threshing and air-drying, the data from the seed test were combined with those from the field measurement, and the yield of the grains was calculated with a criterion of 14% for the water content of the grains.

2.5. Data Analysis

The statistical analysis of the experimental data was performed using DPS7.05, Microsoft Excel 2007, and Origin 2021 for ANOVA and graphing. A q-test was used to compare the significant differences between different treatments (p < 0.05).

3. Results and Analysis

3.1. Effects of Row Density Interaction on Corn Yield and Grain Composition Factors

Planting density, row spacing configuration, and their interactions all had significant effects on maize grain yield. As shown in Table 2, in 2023–2024, the medium-density D2 treatment had the highest ear length, ear grain number, 100-grain weight, and yield, followed by the low-density D1 and high-density D3 treatments. From highest to lowest, the bald tip length was ordered as follows: D3 > D1 > D2. Based on the ear length, ear grain number, 100-grain weight, and yield of the low-density D1 and high-density D3 treatments, the different row spacing treatments were as follows: 40 + 80 cm > 50 + 50 cm > 80 + 80 cm > 40 + 40 cm, where the opposite was true for the bald tip length. The row spacing configurations of the medium-density D2 treatment were 40 + 80 cm > 50 + 50 cm > 40 + 40 cm > 80 + 80 cm, and those based on the bald tip length were 80 + 80 cm > 40 + 40 cm > 50 + 50 cm > 40 + 80 cm. The interaction effect of the treatments showed that the yield of the D2 40 + 80 cm treatment was the highest in two consecutive years. In 2023, the average yield was 14,168.24 kg/hm2, which was 8.41% and 8.04% higher than that of D1 40 + 80 cm and D3 40 + 80 cm, respectively, and in 2024, the average yield was 13,664.68 kg/hm2, which was 13.4% and 8.61% higher than that of D1 40 + 80 cm and D3 40 + 80 cm, respectively. The yields of all treatments in 2023 were higher than those in 2024, which coincided with the previous rainfall data during the reproductive period.

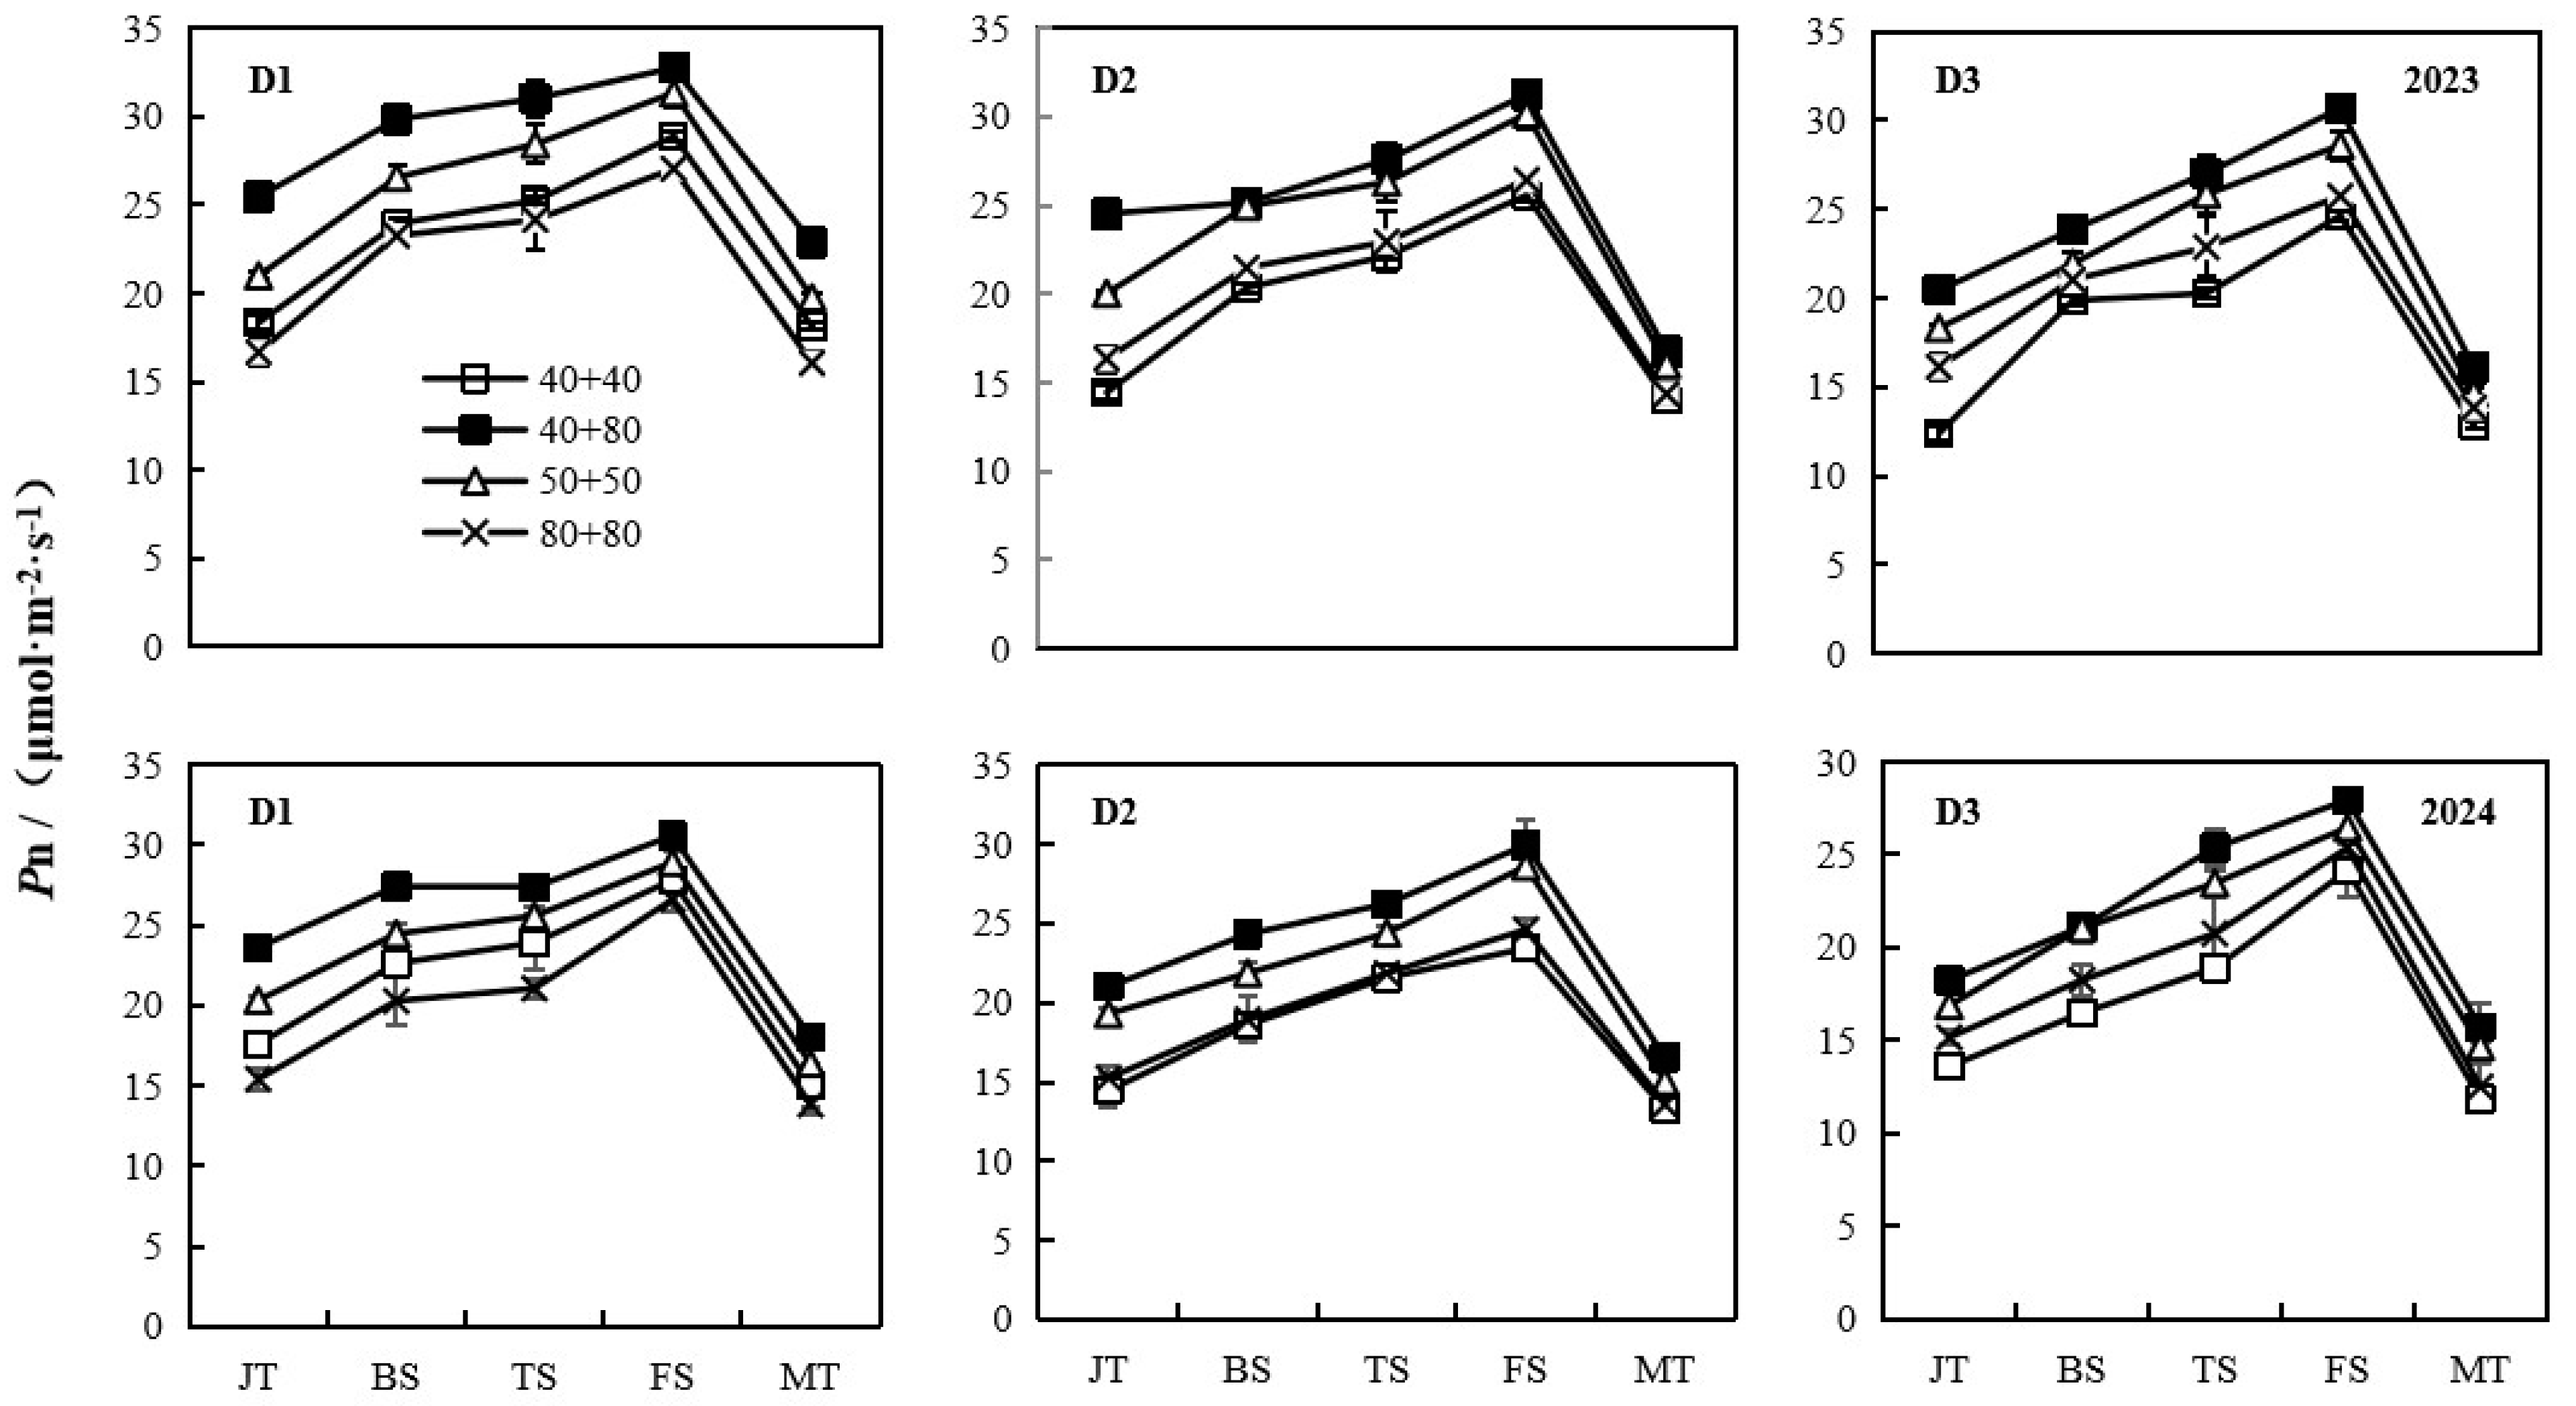
3.2. Effect of Row Density Interactions on Net Photosynthetic Rate of Maize Leaves

Rationalization of density and row spacing can significantly increase the net photosynthetic rate of maize leaves (Figure 2). The results of the two-year experiment show that under the row density interaction treatment, the net photosynthetic rate increased and then decreased as the fertility period progressed, reaching a peak at the filling stage and then decreasing rapidly; with the increase in planting density, the net photosynthetic rate decreased; between different row spacings, the net photosynthetic rate of the 40 + 80 cm planting pattern was optimal, indicating that this row spacing pattern has a strong photosynthetic capacity. This may be because it can ensure good ventilation and light transmission without wasting land resources by excessive thinning. Under the interaction of row spacing and density, the net photosynthetic rate of the D1 40 + 80 cm treatment was the highest, and the average Pn of maize leaves was 28.38 μmol·m−2·s−1 in 2023, which was 13.29 and 20.15% higher than that of the D2 and D3 40 + 80 cm treatments, respectively, and 7.59% and 17.21% higher in 2024, respectively. Pn was significantly higher in 2023 than in 2024, which coincided with the previous yield trend.

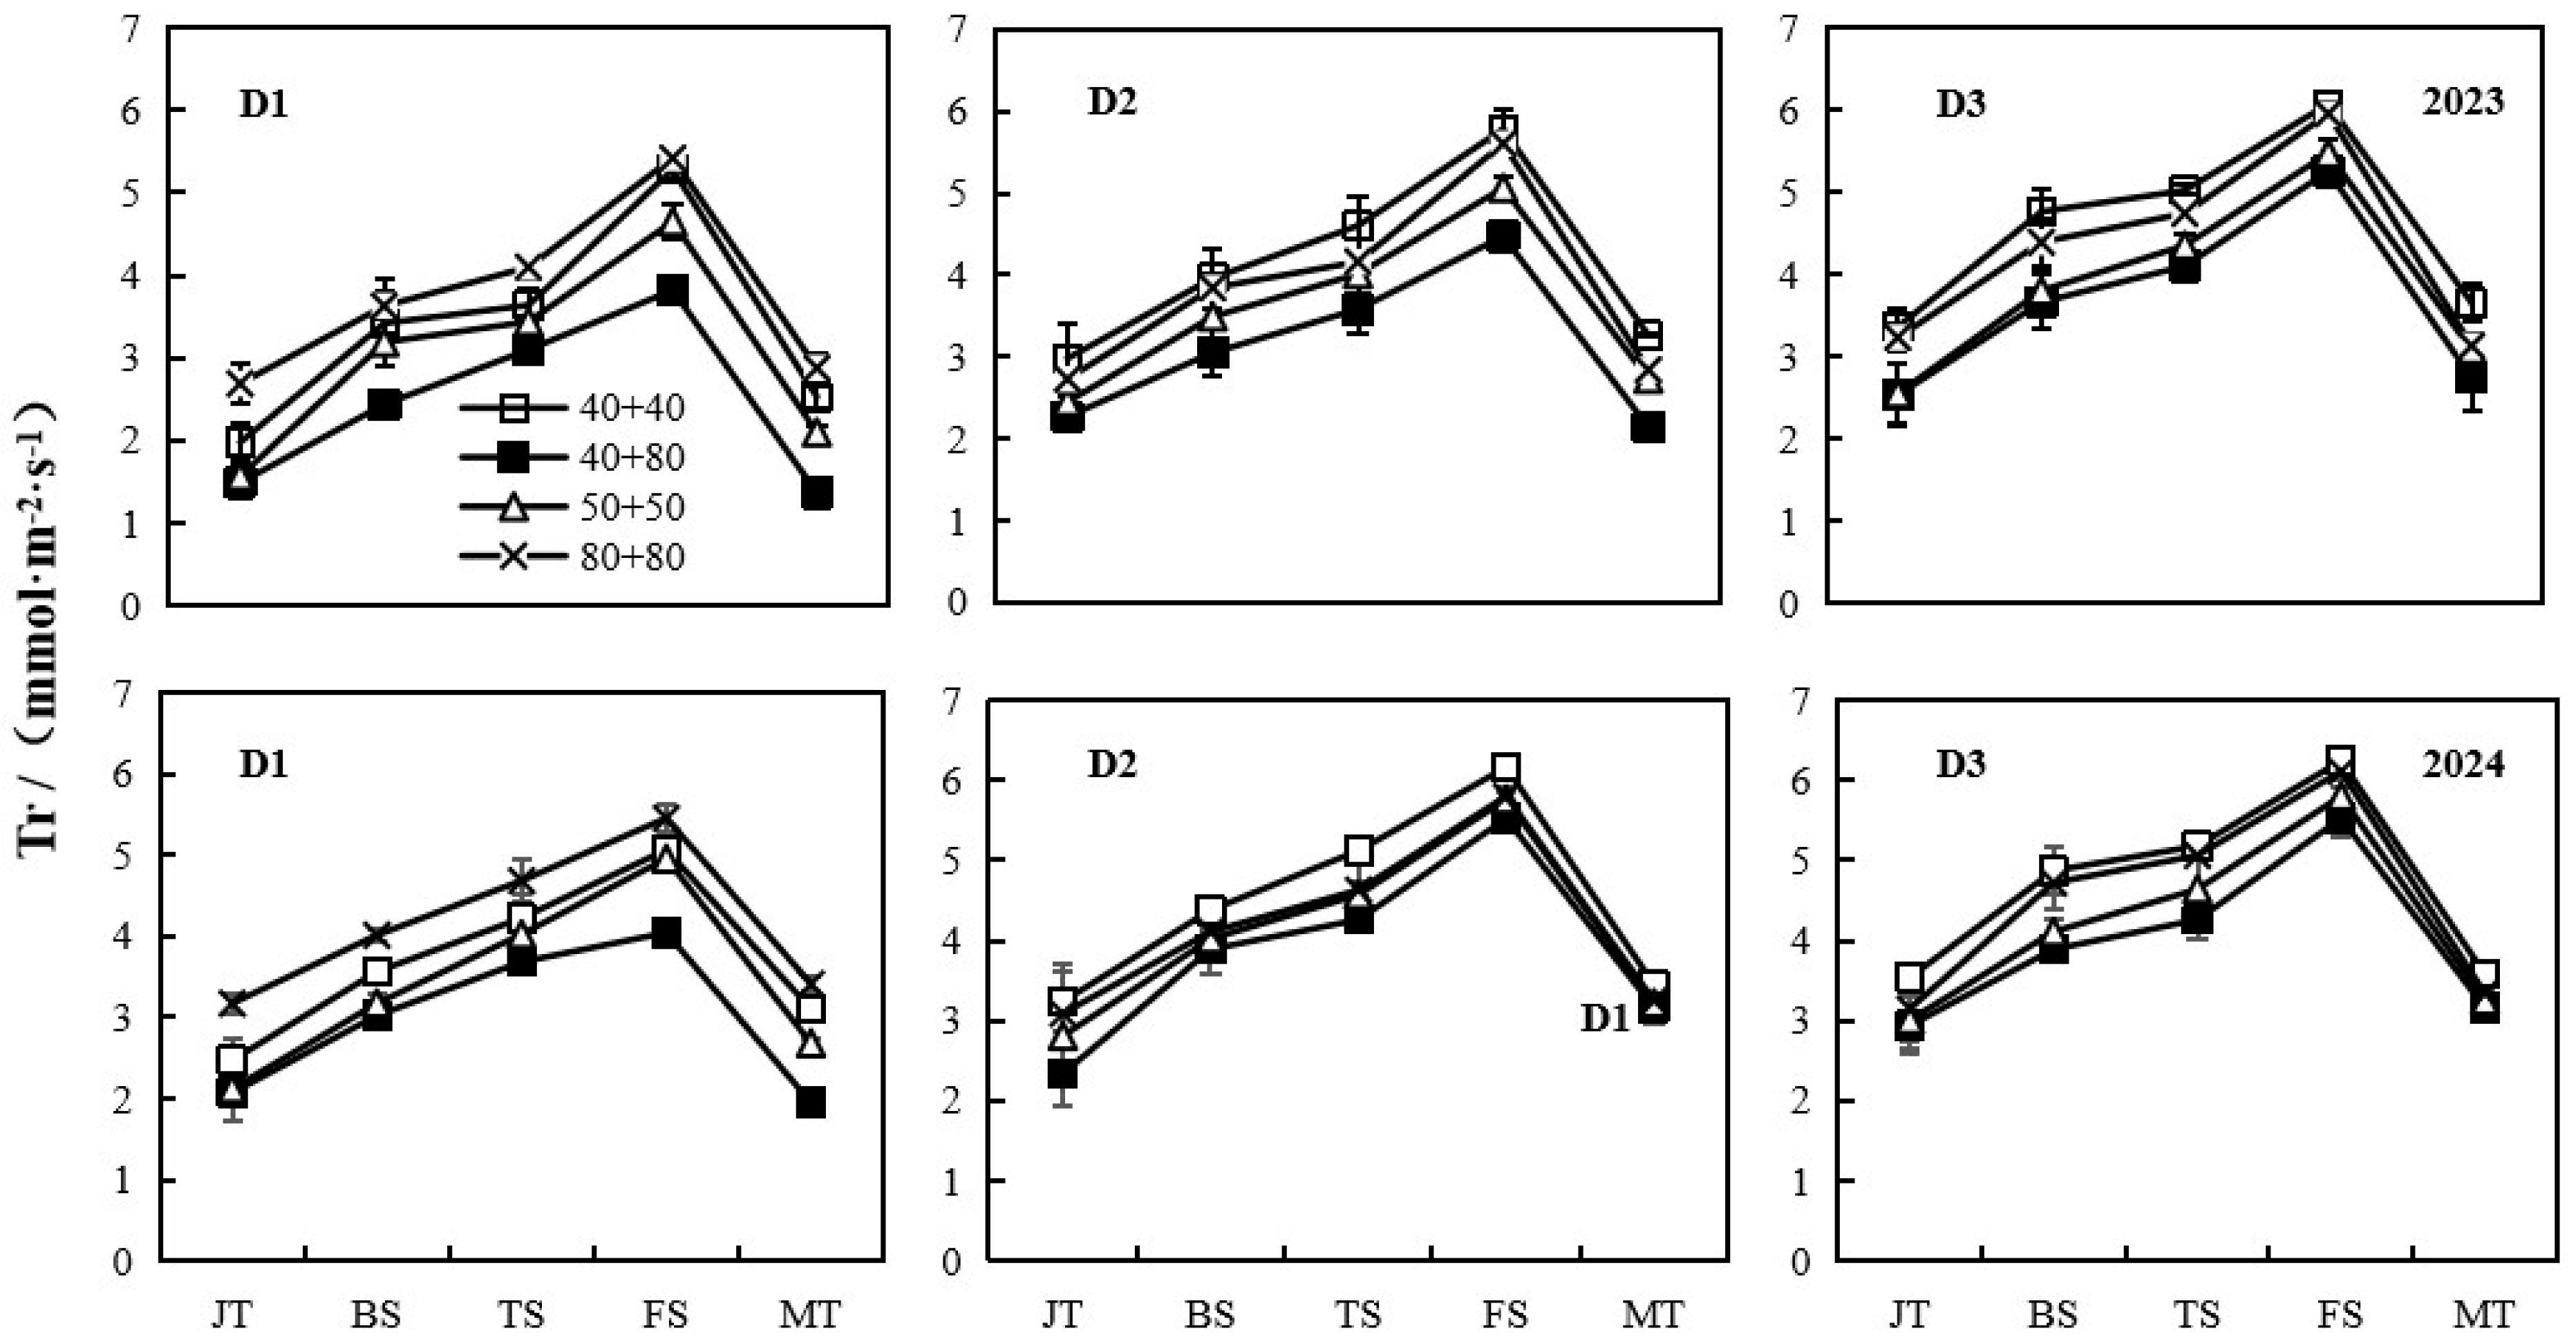
3.3. Effects of Row Density Interaction on Transpiration Rate of Maize Leaves

Planting density, row spacing configuration, and their interactions had significant effects on the transpiration rate of maize during the critical reproductive period (Figure 3). The results of the 2-year experiment show the following: The trend of the transpiration rate under row density interaction was consistent. Both increased and then decreased over the reproductive period, peaked at the filling stage, and then declined at the maturity stage. The Tr of the leaf blade was the smallest for two consecutive years with the D1 40 + 80 cm pattern and was only 2.44 mmol·m−2·s−1 in 2023, 1.83% lower than that in 2024. Between different planting densities, the transpiration rate gradually strengthened with the increase in the number of densities, D1 < D2 < D3. Among the different row spacing treatments, the transpiration rate was weakest and significantly reduced under the 40 + 80 cm treatment, thus providing stronger photosynthetic products for maize in the mid- to late-stage and then enhancing yield.

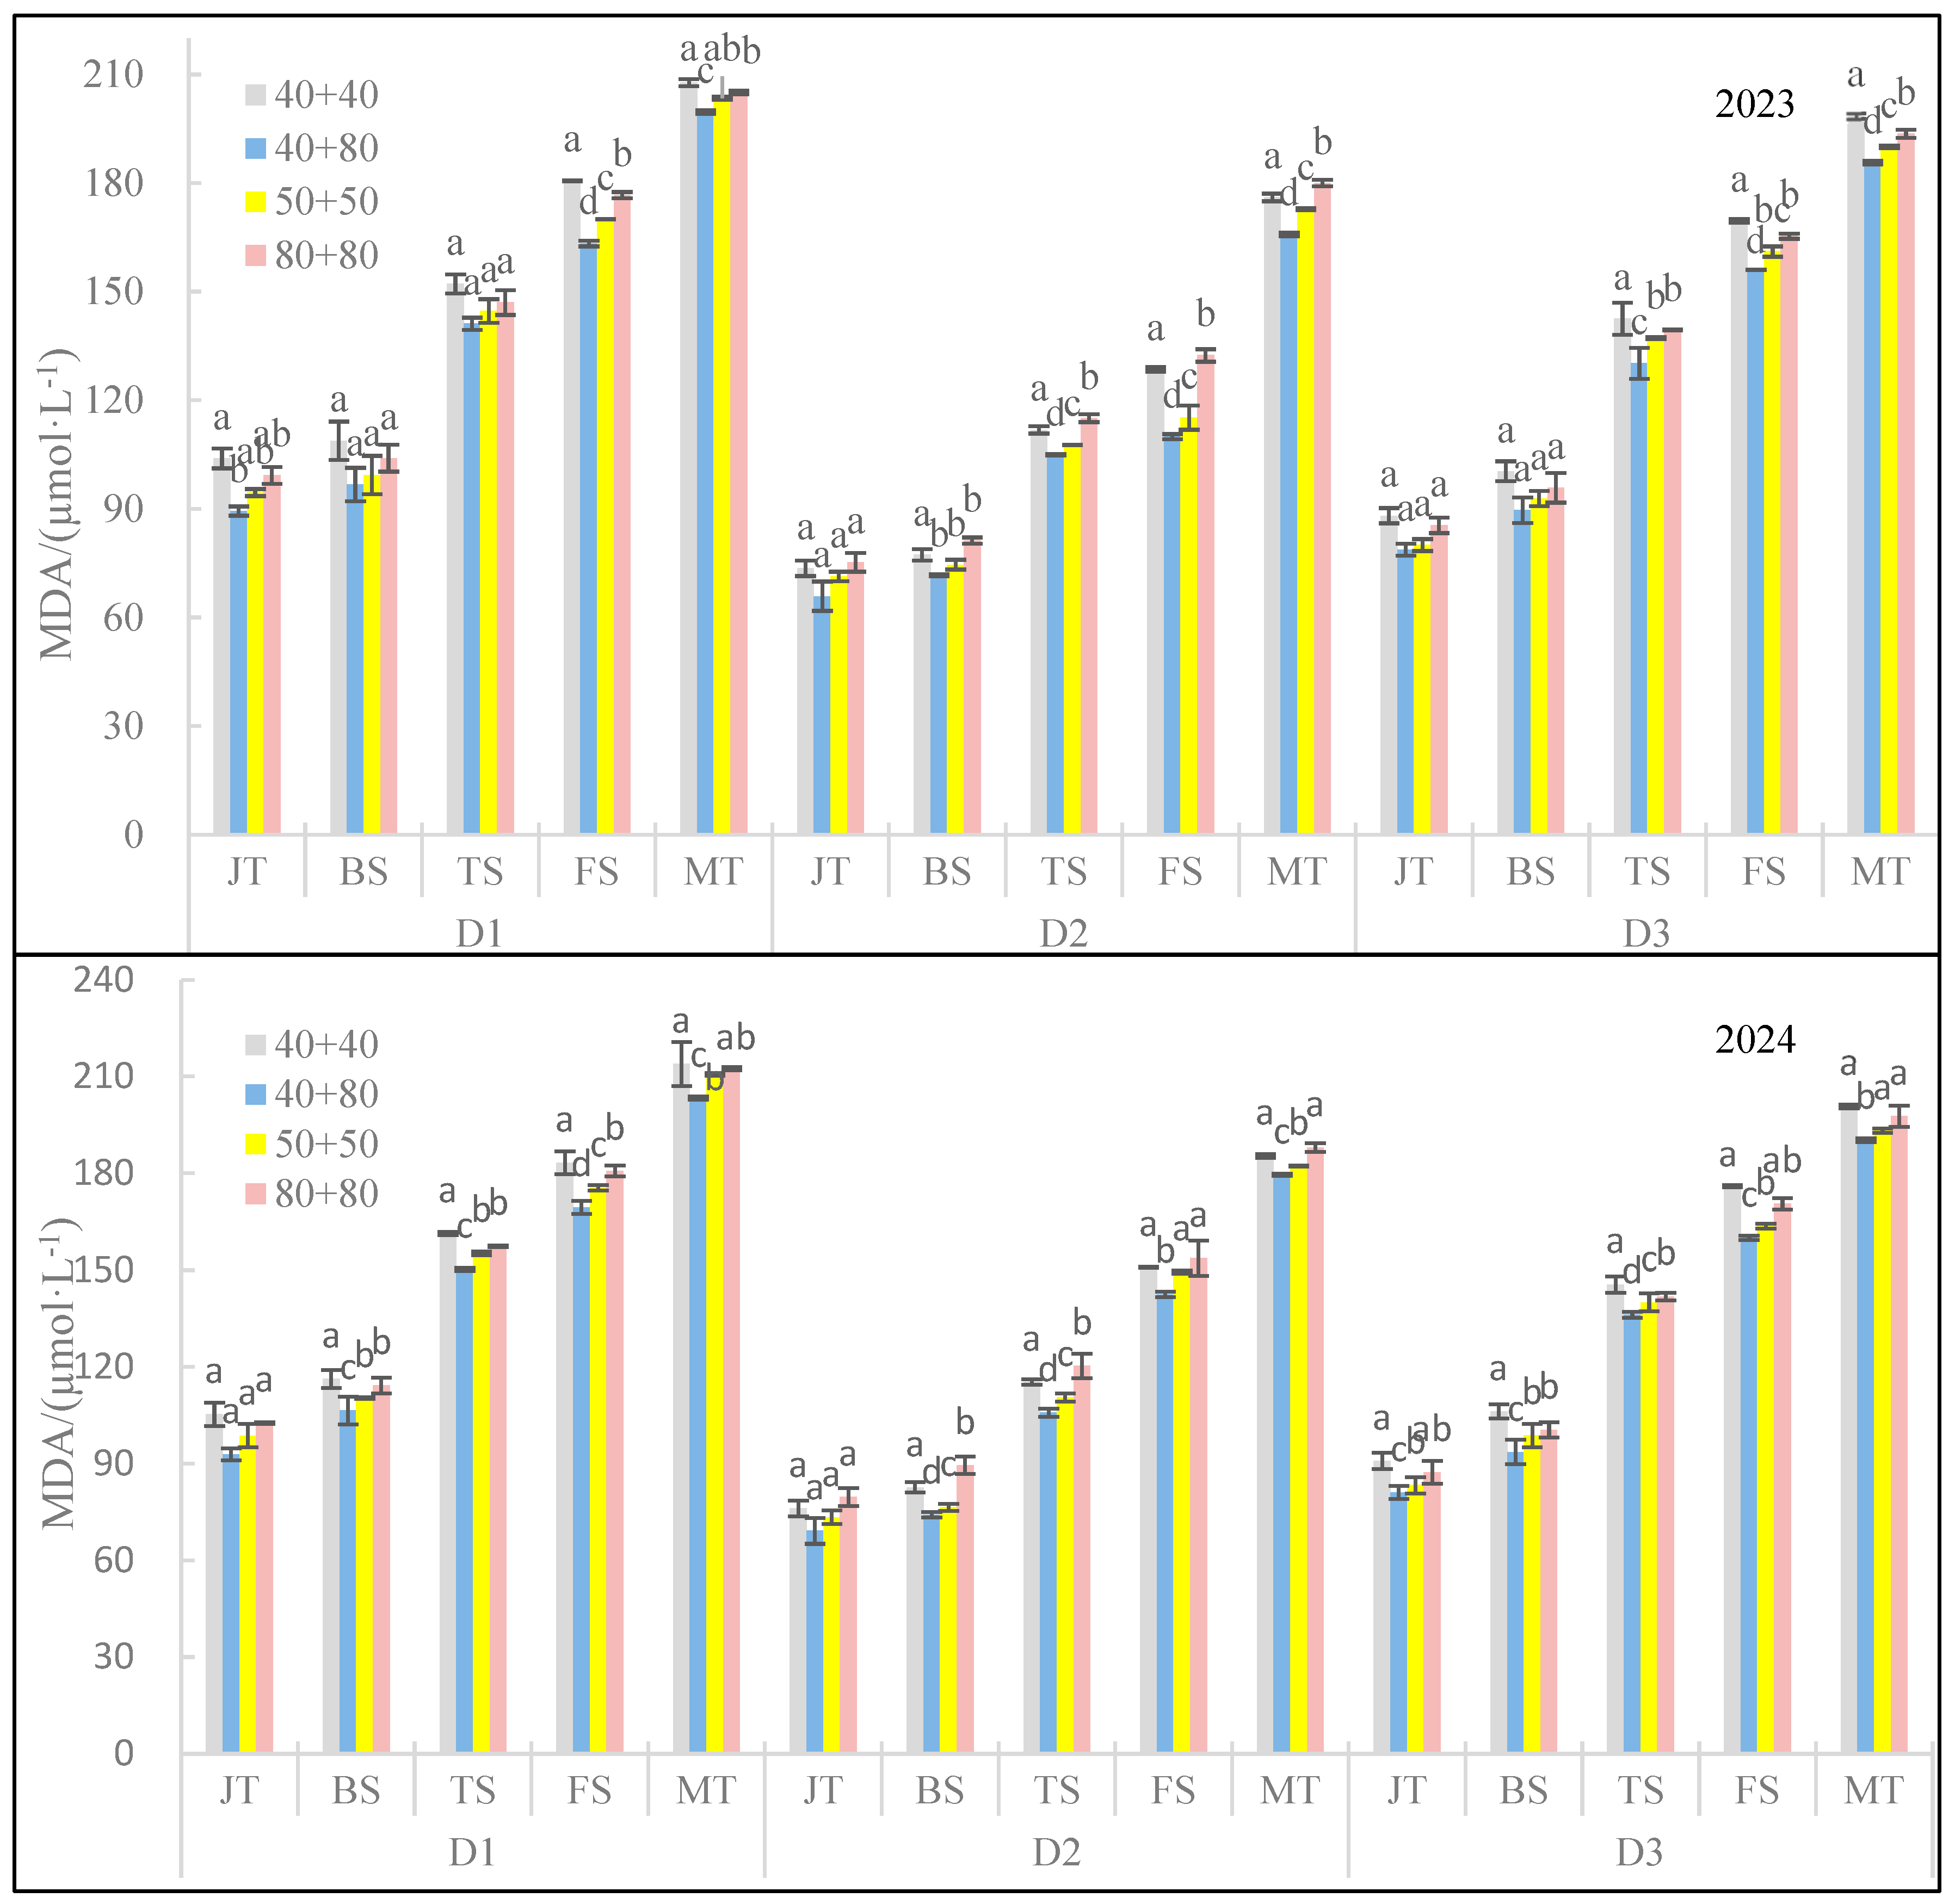
3.4. Effect of Row Density Interaction on Malondialdehyde (MDA) Content of Maize Leaves

The planting density and row spacing configuration showed significant regularity with the malondialdehyde (MDA) content of maize leaves (Figure 4). With the increase in planting density, the malondialdehyde content showed a decreasing and then increasing trend (D2 < D1 < D3), which reflects that the planting density is an important regulatory factor. The row spacing configuration also had a significant effect on malondialdehyde content; the 40 + 80 cm row spacing configuration was optimal at different densities. The malondialdehyde content of the D2 40 + 80 cm leaf mean was the lowest at 103.66 µmol·L−1 in 2023, which was 24.92% and 19.05% lower than that of 40 + 80 cm under the D1 and D3 treatments and 2024, the average malondialdehyde content of the D2 40 + 80 cm leaf mean was the lowest at 103.66 µmol·L−1, decreased by 19.05% and 24.92% compared with that of 40 + 80 cm under the D1 and D3 treatments. This indicates that planting in wide and narrow rows can effectively optimize the population structure and reduce the malondialdehyde content of leaves.

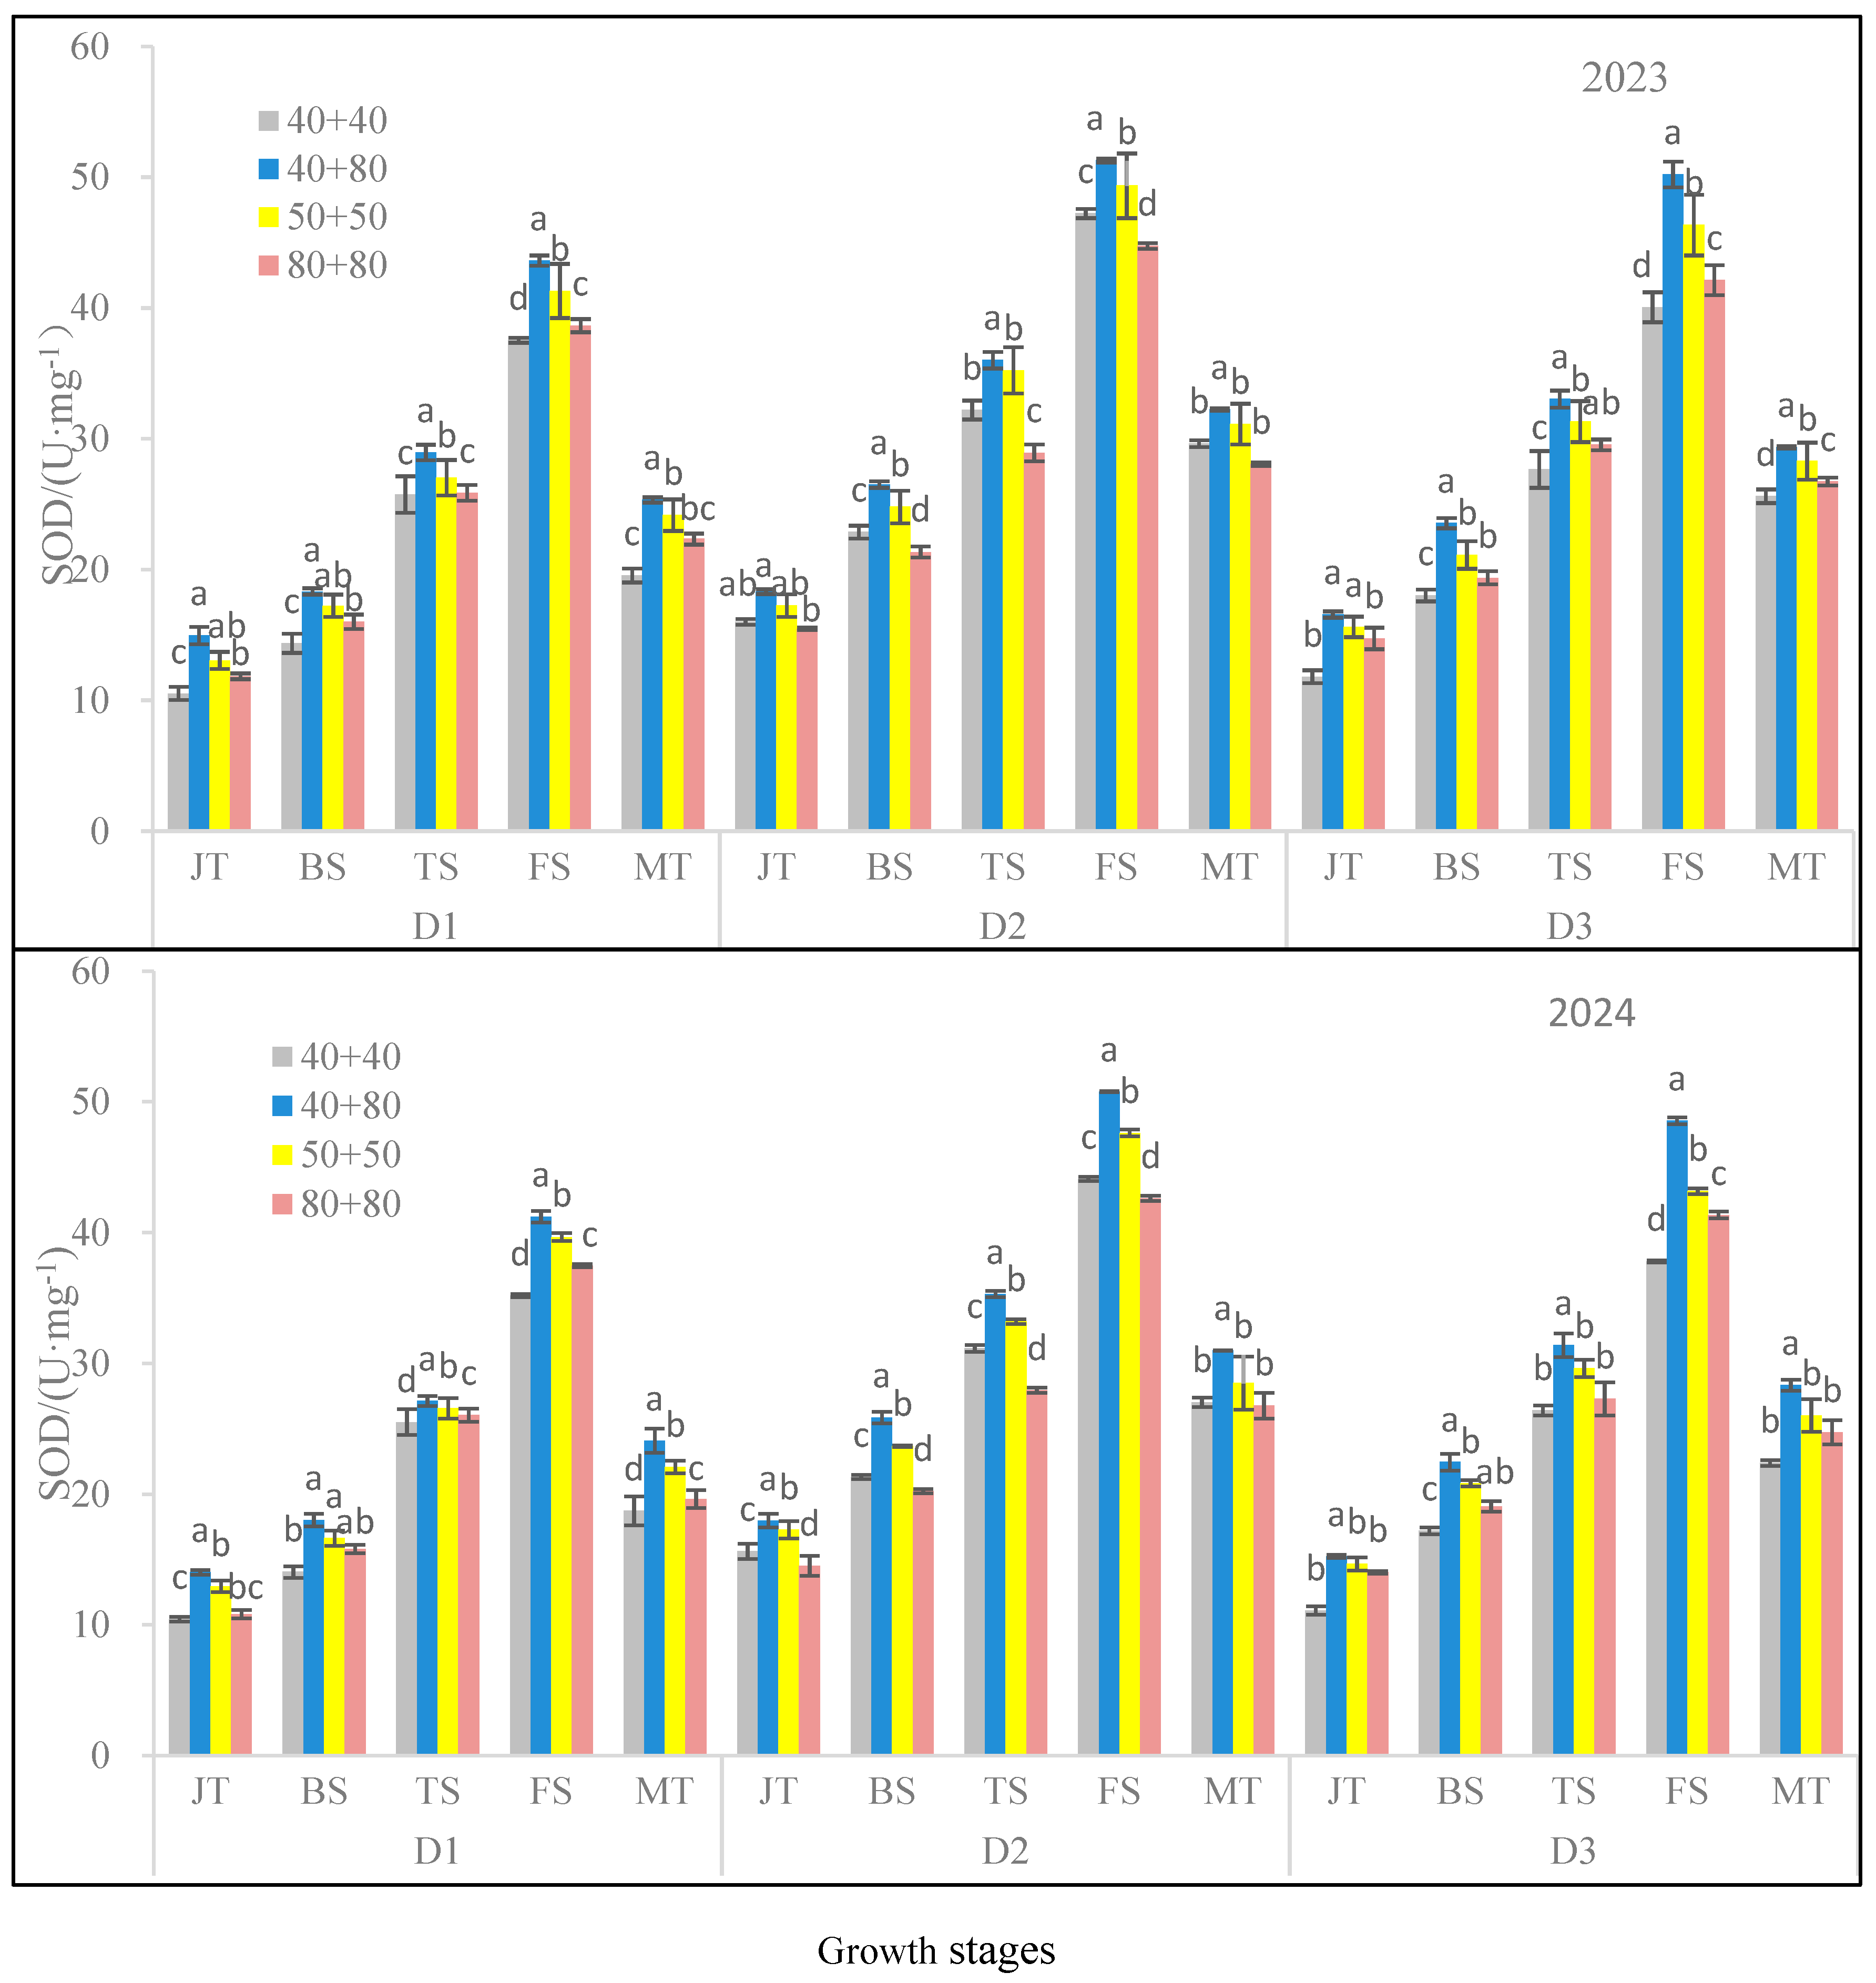
3.5. Effects of Row Density Interactions on Superoxide Dismutase (SOD) in Maize Leaves

As shown in Figure 5, in 2023–2024, SOD activity in maize leaves showed a trend of increasing and then decreasing over the reproductive period, reaching a peak at the filling stage, followed by a rapid decline. Among the different row spacing treatments, the 40 + 80 cm pattern had the strongest SOD activity and the best performance. With the increase in planting density, SOD activity increased and then decreased, showing D2 > D3 > D1 in both years. The interaction effect among treatments indicates that in 2023, the 40 + 80 cm SOD activity under D2 density was the largest, with an average of 32.88 U·mg−1, which was 25.30% and 7.63% higher than that of D1 40 + 80 cm and D3 40 + 80 cm, respectively; in 2024, the average was 32.20 U·mg−1, which was 27% and 10.24% higher, respectively. Thus, SOD activity was significantly higher in 2023 than in 2024.

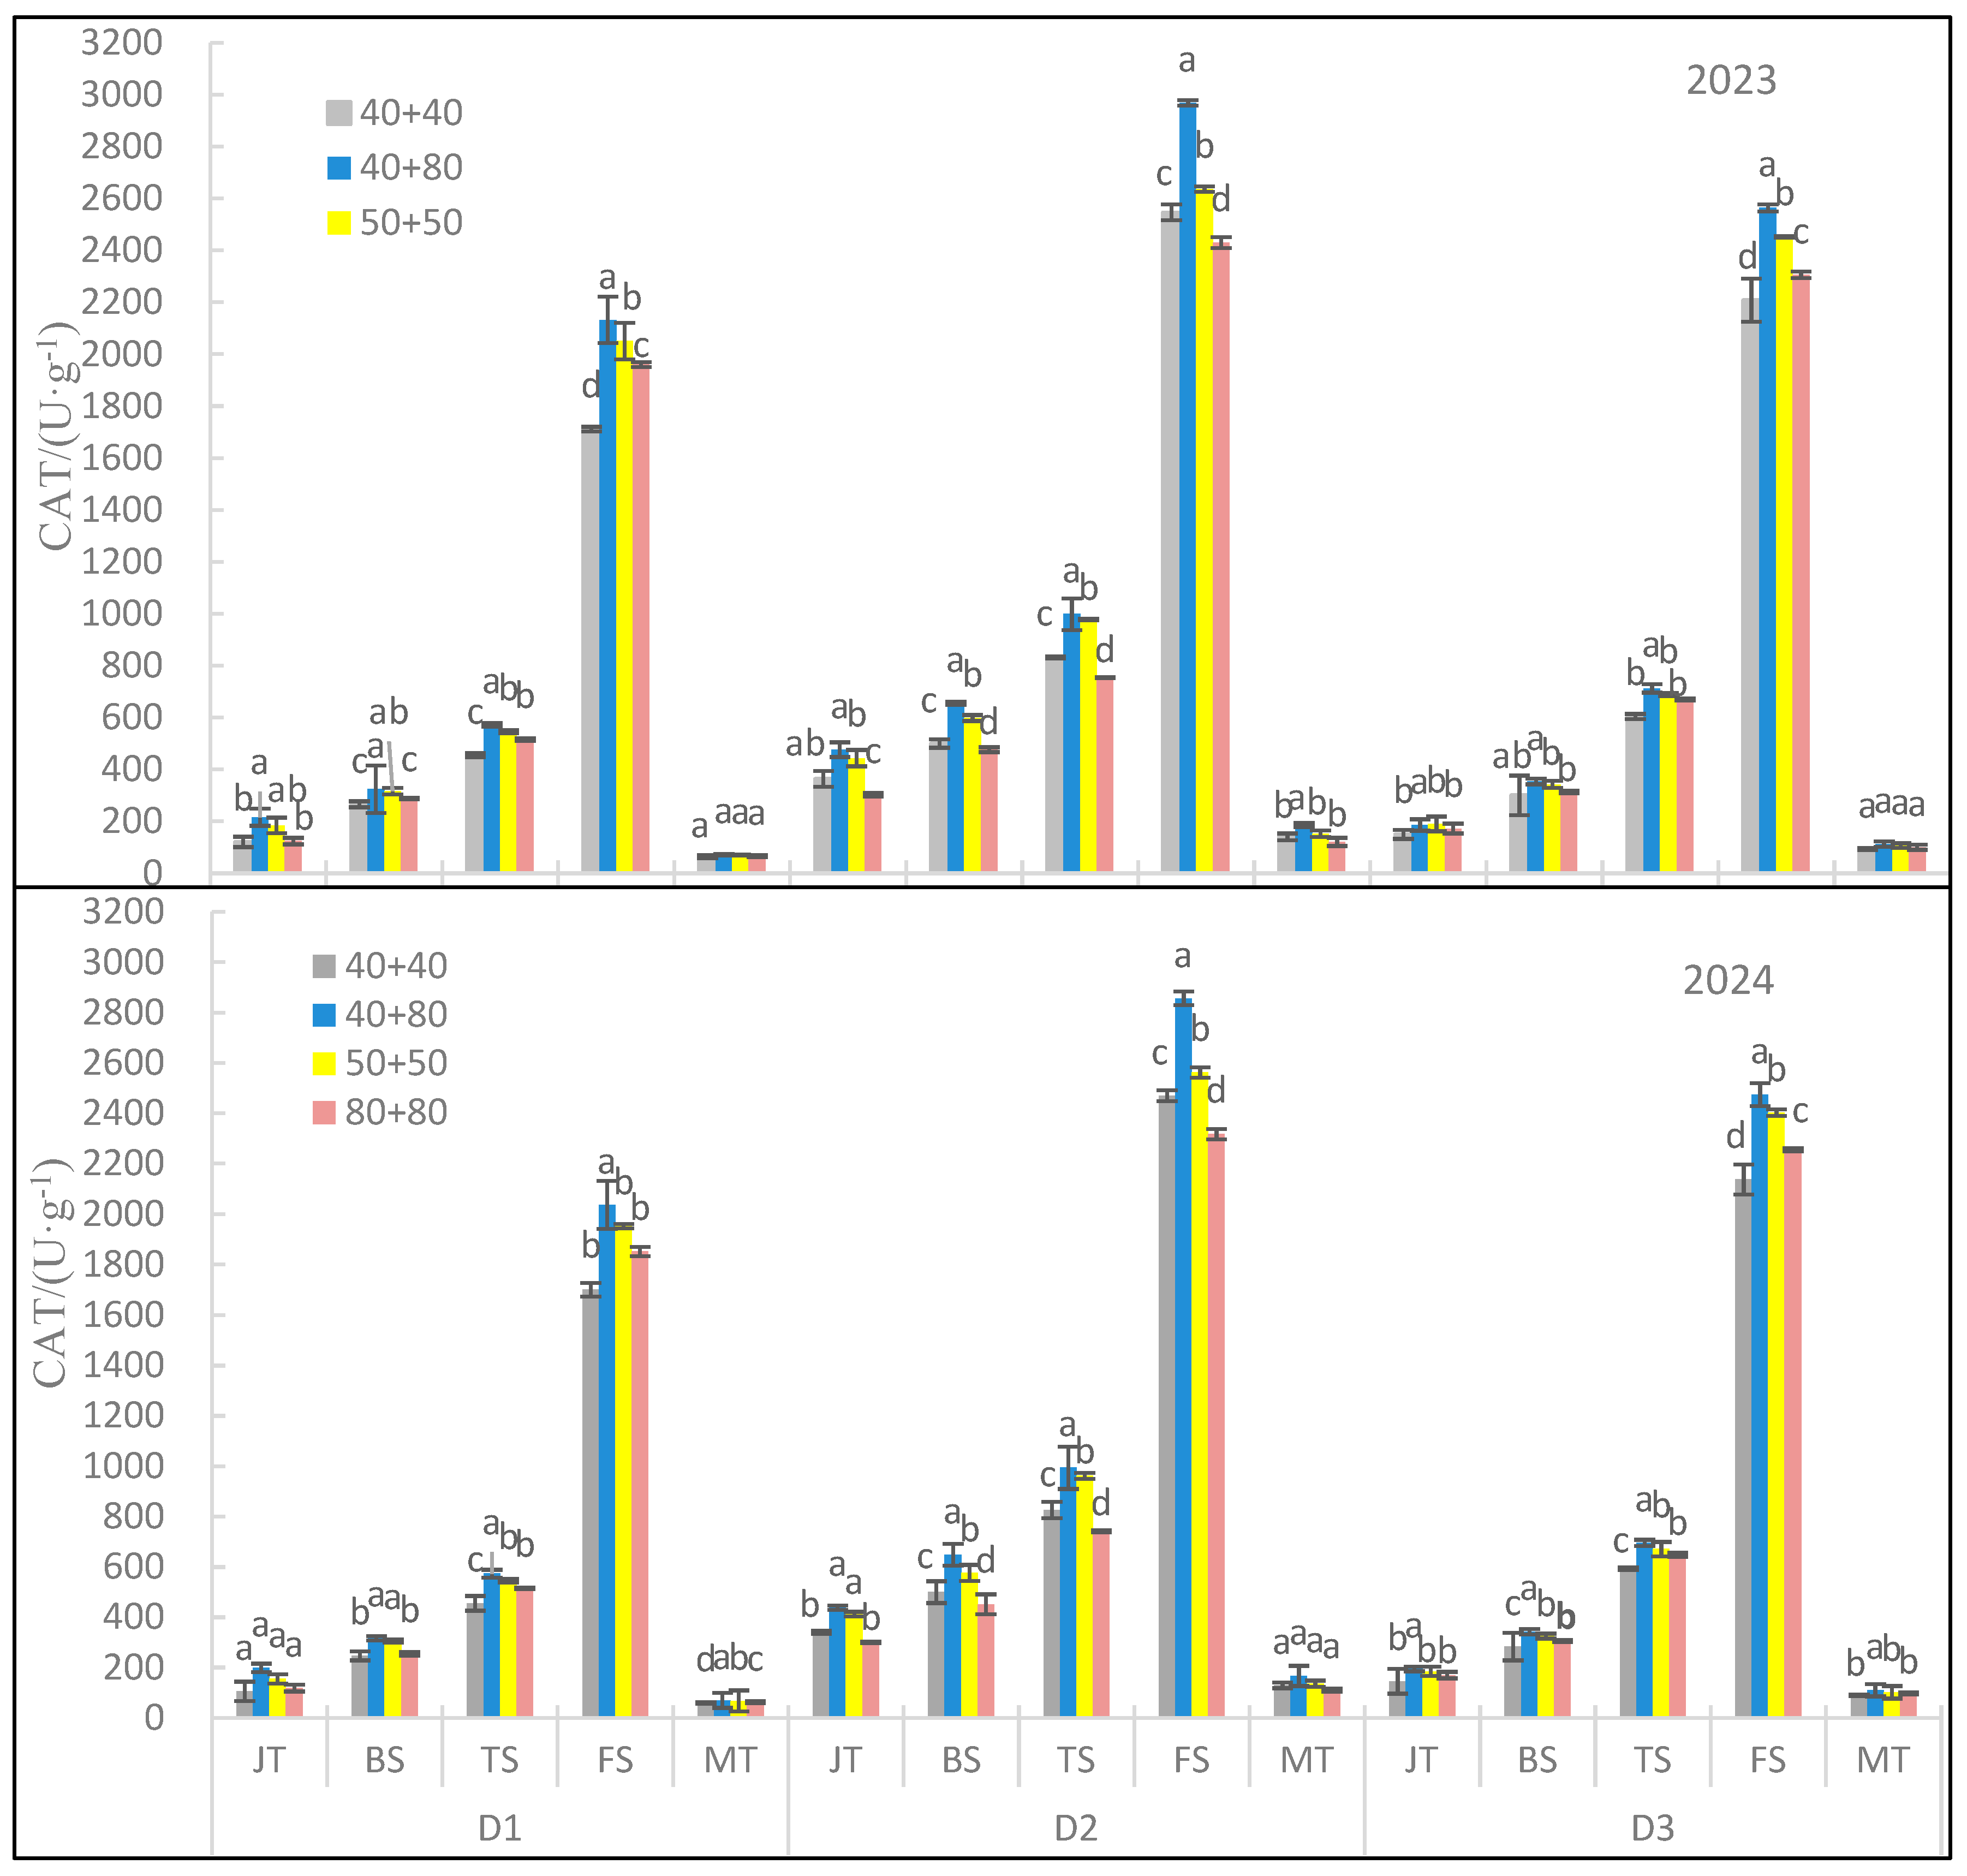
3.6. Effect of Row Density Interaction on Catalase (CAT) in Maize Leaves

The planting density, row spacing configuration, and their interactions had significant effects on CAT activity during the main reproductive period of maize (Figure 6). From 2023 to 2024, CAT activity in corn leaves initially increased and then decreased over the growth period and rapidly decreased after reaching a peak in the filling period. Among the different row spacing treatments, 40 + 80 cm wide and narrow rows showed the strongest CAT activity and the best antioxidant enzyme activity. With the increase in planting density, CAT activity first increased and then decreased, with D2 > D3 > D1 in two years. The interaction between treatments shows that in 2023, the CAT activity of the 40 + 80 cm pattern at D2 density was the highest, with an average of 1057.02 U·g−1, which was 59.30% and 34.50% higher than that of D1 40 + 80 cm and D3 40 + 80 cm, respectively; in 2024, the average CAT activity of 40 + 80 cm at D2 density was 1020.95 U·g−1, which was 59.70% and 33.70% higher, respectively. CAT activity in 2023 was significantly higher than in 2024, and the overall trend was completely consistent with SOD activity.

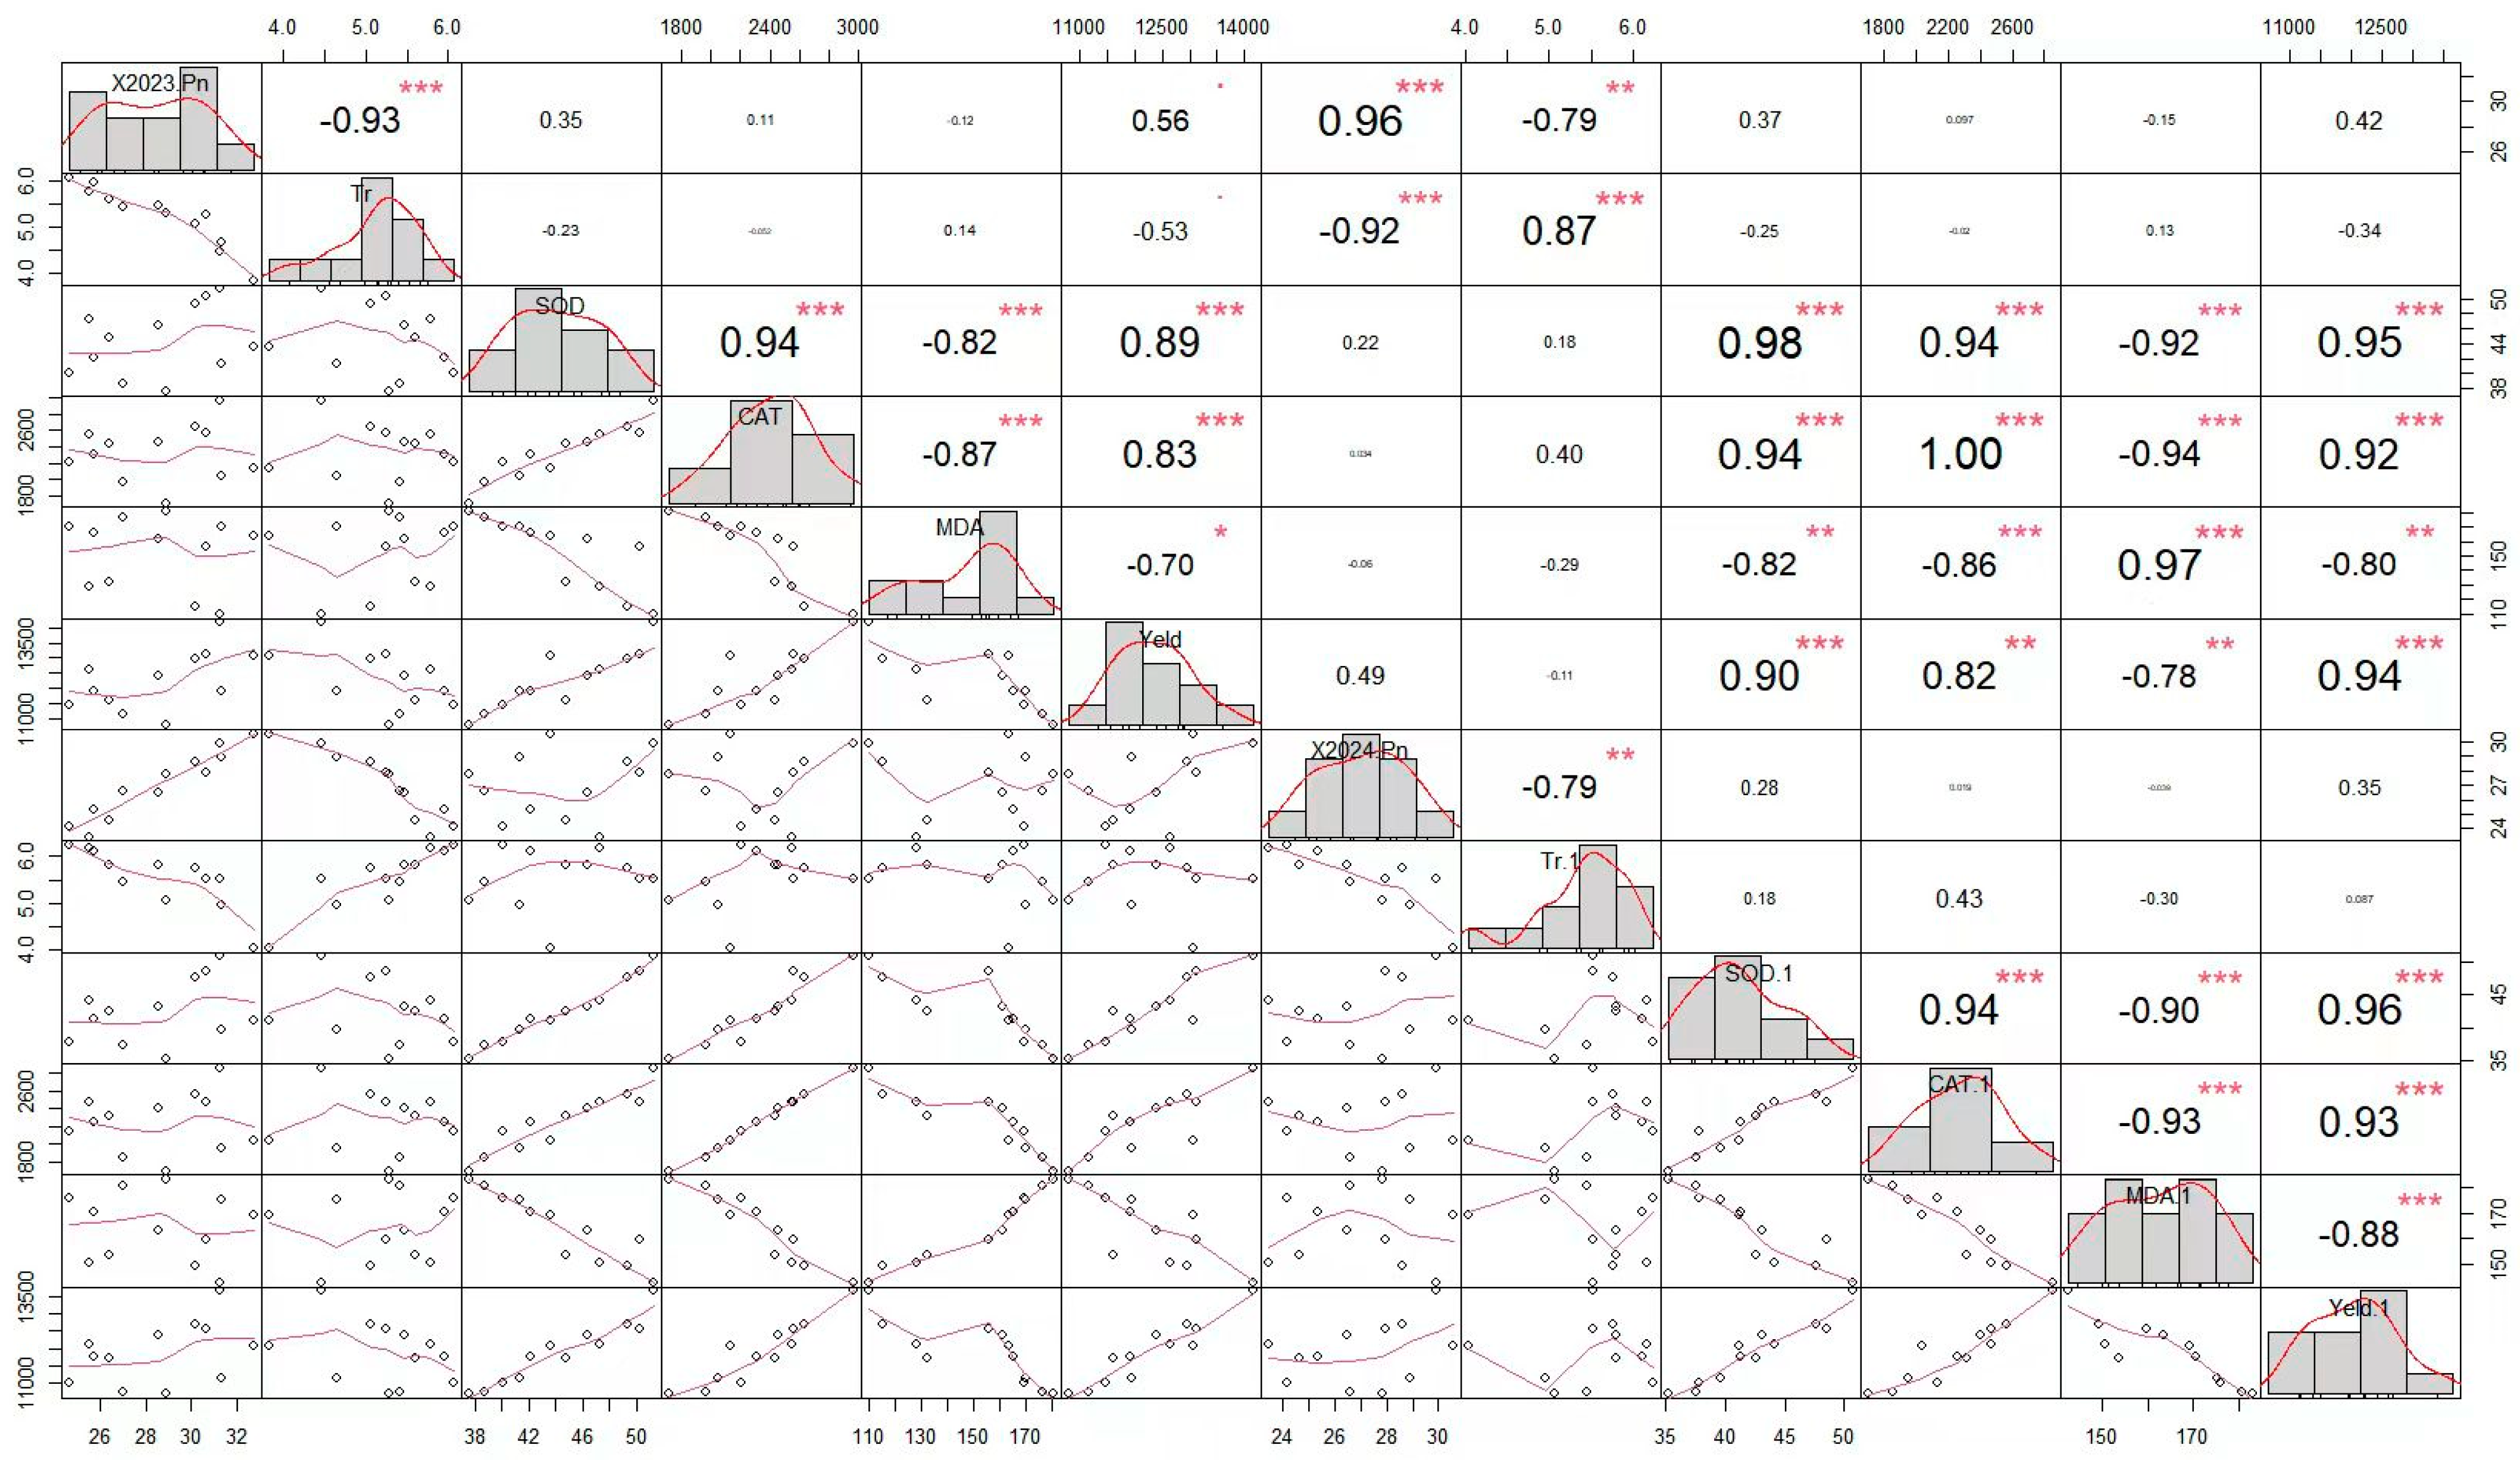
3.7. Correlation Analysis Between Physiological Activity and Yield During the Irrigation Period

As shown in Figure 7, the yield in 2023 was negatively correlated with the malondialdehyde content and transpiration rate. It reached a significant difference with malondialdehyde content, with a correlation coefficient * of −0.70 and a non-significant difference in its correlation with the transpiration rate. It was positively correlated with the net photosynthetic rate, SOD, and CAT, with correlation coefficients of 0.56, 0.89, and 0.83, and the differences in the enzyme activities of SOD and CAT were highly significant. The yield in 2024 was positively and negatively correlated with the physiological indicators during the grouting period, but the differences with malondialdehyde, SOD, and CAT enzyme activities were highly significant, with correlation coefficients of −0.88, 0.96, and 0.93, respectively. This suggests that the magnitude of leaf enzyme activities and malondialdehyde content determines the degree of leaf senescence, thus indirectly influencing the level of yield.

4. Discussions

4.1. Effects of Row Density Interactions on Photosynthetic and Senescence Characteristics of Maize Leaves

A reasonable configuration of density and row spacing can significantly improve the photosynthetic efficiency of maize leaves [23,24], which in turn affects the growth, development, and final yield of maize [25]. Specifically, as the planting density increases, the number of leaves per unit area increases, leading to increased competition between leaves and deterioration of light conditions, which reduces the photosynthetic rate of a single leaf [26]. However, within the appropriate density range, an appropriate increase in density can promote the photosynthetic efficiency of the population, as the mutual shading of leaves at high density reduces ineffective evaporation while increasing the CO2 concentration within the canopy, which is favorable to photosynthesis [27].
In terms of row spacing, larger row spacing is conducive to improving field ventilation and light transmission conditions, reducing the occurrence of pests and diseases, and improving the photosynthetic efficiency of leaves. Li et al. [28] found the highest photosynthetic rate of maize leaves under a 70–40 treatment, which may be because this row spacing can ensure good ventilation and light transmission without wasting land resources through excessive thinning. In contrast, either too narrow or too wide row spacing would lead to a decrease in photosynthetic efficiency, the former due to intense competition among leaves and the latter due to low land utilization, which affects the overall photosynthesis level [29]. The interaction between density and row spacing has an important effect on the photosynthetic characteristics of maize leaves. Under high-density conditions, appropriately wide row spacing can effectively alleviate the competitive pressure among leaves and improve photosynthetic efficiency, while under low-density conditions, appropriately reduced row spacing can help us fully utilize spatial resources and improve the photosynthetic efficiency of the population. This study found the optimal combination of a density of 67,500 plants/hm2 and a 40 + 80 cm row spacing, with which the net photosynthetic rate and transpiration rate of maize leaves reached their optimal state. Hence, this combination can maximize the photosynthetic potential of maize, which provides a theoretical basis for realizing high and stable yields.
In terms of leaf senescence characteristics, the combination of medium-density D2 with 40 + 80 cm significantly reduced malondialdehyde (MDA) content (108.95 µmol·L−1 averaged over the two years) and maintained high SOD (32.54 U·mg−1) and CAT (1038.99 U·g−1) activities. This indicates that the combination effectively scavenged reactive oxygen species (ROS) and slowed the process of membrane lipid peroxidation by enhancing the activity of the antioxidant enzyme system, thus maintaining the stability of leaf physiological functions, a result echoed in the study by Tian et al. [18]; a reasonable population configuration can slow leaf senescence by improving the microenvironment. Although the high-density (D3) configuration could enhance the potential yield by increasing the population size, the canopy depression triggered by it accelerated leaf senescence, leading to a decline in photosynthetic performance and yield loss, which further confirms the critical role of density–row spacing interactions in regulating population quality.

4.2. Effects of Row Density Intercropping on Yield and Grain Components of Maize

In terms of yield components, row density intercropping significantly affected the maize ear length, number of grains in the ear, and quality of 100 grains. Specifically, the medium density with wide and narrow rows exhibits significant advantages in increasing the number of grains on the ear and improving the quality of 100 grains, realizing a high yield of 13,916.46 kg/hm2 on average in two years. This indicates that a reasonable combination of planting density and row spacing can effectively promote yield improvement. Under medium-density conditions, the wide and narrow row configuration not only ensured the effective number of spikes per unit area but also improved the growing space of a single plant, enhanced light transmission in the field, promoted the development of spike traits, improved the photosynthetic capacity of spike leaves, promoted the absorption of water and nutrients through the root system, and provided an adequate supply of assimilates for the filling of grains, which is in line with the results of Zhang et al. [14] in a dry crop area. Under high-density conditions, competition among plants was more intense, and even increasing row spacing could not completely alleviate this competitive pressure but instead led to the weakening of the growth potential of individual plants, affecting the final yield. In addition, corn plants under high-density treatments were more susceptible to pests and diseases, which may also be an important cause of yield reduction. Although the combination of a high density (D3) with wide and narrow rows performed moderately well in terms of the number of grains in the ears, it exacerbated inter-individual competition, resulting in an increase in the bald tip length (0.57 cm), a decrease in the weight of one hundred kernels (37.92 g), and a reduction in the final yield by 8.32% compared to the D2combination. This indicates that it is difficult to break through the limitations of population structure simply by increasing density, and it is necessary to optimize row spacing for “increasing density without increasing consumption”. In summary, the optimization of density and row spacing is important for improving corn yield. In actual production, soil conditions, climatic factors, variety characteristics, and other factors should be taken into account to develop a scientific and reasonable planting program to achieve the efficient and sustainable development of corn production.

5. Conclusions

This study showed that wide and narrow row planting significantly increased the maize leaf net photosynthetic rate, SOD activity, and CAT activity compared to other row spacing treatments under medium-density D2 conditions. It also reduced the transpiration rate and malondialdehyde content, delayed leaf senescence, optimized leaf photosynthetic performance, and increased the number of grains per unit area of maize ears and the quality of one hundred kernels, which resulted in a yield increase, with a two-year yield increase ranging between 8% and 13%. Therefore, a 40 + 80 cm spacing pattern with a density of 67,500 plants/hm2 is an effective combination for improving maize yield.

Author Contributions

L.Z. and C.W. contributed to the study’s conception and design. The research was supervised by C.W.; X.D., who assisted with material preparation. X.Z. (Xinping Zhang), X.Z. (Xin Zhang), and L.S. were responsible for data collection. Analysis was performed by P.C., M.L. and C.Z.; L.Z. wrote the first draft of the manuscript. All authors have read and agreed to the published version of the manuscript.

Funding

This work was funded by the National Key Talent Expert Workstation (TYSGJZDRCGCZJGZZ202104); Shanxi Graduate Research Practice Innovation Project (2024SJ126); Shanxi Province Basic Research Program Project (202203021211277); and Academician Workstation Project (TYYSZ201707).

Data Availability Statement

The original contributions presented in this study are included in the article. Further inquiries can be directed to the corresponding authors.

Conflicts of Interest

The authors declare no conflicts of interest.

References

  1. Zhang, K.J.; Zheng, Y.Y.; Yu, F.W. Realistic value, major challenges and effective path of soil health cultivation in the perspective of food security. Chin. J. Eco-Agric. 2024, 32, 2129–2137. [Google Scholar] [CrossRef]
  2. He, Y.; Duan, S.C.; Xiao, H.M. Agricultural Land Transfer, “Non-Grain Conversion” of Cultivated Land, and Food Security—Also Discussing the Issue of “Who Will Grow Food”. J. Northwest AF Univ. (Soc. Sci. Ed.) 2024, 24, 74–82. [Google Scholar]
  3. Li, X.; Wang, H.Y.; Niu, W.H.; Zhang, Y.; Chen, G.; Zhao, M. Spatial-temporal evolution of cultivated land use transition and its impact on grain production in the Yellow River Basin. J. China Agric. Univ. 2024, 29, 85–96. [Google Scholar]
  4. Wang, H.Y.; Zhang, Y.J.; Jiang, X.F.; Li, C.; Zhao, M.; Chen, G. Effects of Plant and Row Spacing on the Root System and Nutrient Absorption of Dense Corn Planting Population. J. Maize Sci. 2024, 32, 74–80. [Google Scholar]
  5. Assefa, Y.; Vara Prasad, P.V.; Carter, P.; Hinds, M.; Paszkiewicz, S.; Ciampitti, I.A. Yield responses to planting density for United States modern maize hybrids: A Synthesis-Analysis. Crop Sci. 2016, 56, 2802–2817. [Google Scholar] [CrossRef]
  6. Tian, L.B.; Shen, Z.Y.; Zhao, X.T.; Wang, C.; Li, S.; Zhang, F.; Chen, X. Interactive Effects of Planting Density and Nitrogen Application Rate on Plant Grain Yield and Water Use Efficiency of Two Maize Cultivars. Sci. Agric. Sin. 2024, 57, 4221–4237. [Google Scholar]
  7. Xin, M.H.; Mi, Y.D.; Wang, G.P.; Li, X.; Li, Y.; Dong, H.; Han, Y.; Feng, L. Effect of row spacing configuration and density regulation on dry matter production and yield in cotton. Acta Agron. Sin. 2025, 51, 221–232. [Google Scholar]
  8. Liu, F.; Zhou, F.; Wang, X.L.; Li, G.; Zhang, J.; Zhao, B.; Ren, B.; Liu, P. Optimizing nitrogen management enhances stalk lodging resistance and grain yield in dense planting maize by improving canopy light distribution. Eur. J. Agron. 2023, 148, 126871. [Google Scholar] [CrossRef]
  9. Zhang, Y.; Xu, Z.; Li, J.; Wang, Z.; Liu, P.; Zhao, M.; Ren, X.; Sun, Z. Optimum planting density improves resource use efficiency and yield stability of rainfed maize in semiarid climate. Front. Plant Sci. 2021, 12, 752606. [Google Scholar] [CrossRef]
  10. Wang, D.; Lv, Y.J.; Yao, F.Y.; Zhang, J.; Ren, B.; Zhao, B.; Liu, P.; Li, S. Leaf senescence characteristics post anthesis at different positions of spring maize canopy under different cultivation models. Chin. J. Eco-Agric. 2022, 30, 1925–1937. [Google Scholar]
  11. Li, C.Q.; Cao, R.Y.; Zheng, H.M.; Wang, C.; Li, S.; Zhao, J.; Zhang, F. Effects of plan ting density on the development of maize tassel. J. Henan Agric. Univ. 2010, 44, 630–635. [Google Scholar]
  12. Bai, Y.W.; Zhang, H.J.; Zhu, Y.L.; Wang, Z.; Li, C.; Zhao, M.; Liu, P.; Dong, S. Responses of Canopy Radiation and Nitrogen Distribution, Leaf Senescence and Radiation Use Efficiency on Increased Planting Density of Different Variety Types of Maize. Sci. Agric. Sin. 2020, 53, 3059–3070. [Google Scholar]
  13. Wang, Y.; Zhao, C.; Fan, Z.L.; Liu, P.; Zhang, J.; Ren, B.; Zhao, B.; Li, S. Characteristics of dry matter accumulation and yield formation of dense planting maize in different row spacings. Chin. J. Eco-Agric. 2020, 28, 652–661. [Google Scholar]
  14. Zhang, Y.B.; Zhang, L.N.; Wang, J.D. Effects of full-film wide and narrow row planting of corn on soil moisture and yield in central Gansu dry farming area. Water Sav. Irrig. 2023, 12, 9–17. [Google Scholar]
  15. Wang, Y.; Qi, X.N.; Liu, S.Q.; Zhang, J.; Zhao, B.; Ren, B.; Liu, P.; Li, S. Effects of Wide-narrow Row Planting Pattern on Leaf Senescence During Seed Filling in Maize. Soils Crop. 2016, 5, 211–214. [Google Scholar]
  16. Li, F.H.; Fan, X.L.; Shi, Z.S.; Wang, F.; Liu, Y.; Zhang, J.; Wang, J. The influence of different planting methods on the morphological and physiological indicators and yield of maize. China Seed Ind. 2011, 38–40. [Google Scholar]
  17. Fan, X.L.; Li, F.H.; Shi, Z.S.; Wang, Z.; Zhang, F. Research on Yield Increasing Effect and Physiological Characteristics of Maize Planted in Partial Ridge-Narrow/wide Row. J. Maize Sci. 2010, 18, 108–111. [Google Scholar]
  18. Tian, C.; Wang, Y. Effects of Row and Planting Pattern on Senescence Physiological Characteristics of Maize Leaves at Mature Period. Acta Agric. Boreali-Sin. 2018, 33, 111–116. [Google Scholar]
  19. Jin, R.; Li, Z.; Wang, X.L.; Fan, L.; Kong, F.L.; Liu, Q.L.; Lan, T.Q.; Feng, D.J.; Yuan, J.C. Optimizing row spacing increases stalk lodging resistance by improving light distribution in dense maize populations. Agronomy 2023, 13, 462. [Google Scholar] [CrossRef]
  20. Gardner, F.P. Responses of maize to plant population density, I Canopy development, light relationships, and vegetative growth. Agron. J. 1988, 80, 930–935. [Google Scholar]
  21. Gao, J. Experimental Techniques in Plant Physiology; Xi’an World Book Publishing Company: Xi’an, China, 2000; pp. 196–197. [Google Scholar]
  22. Qian, J. Method for Determination of Enzymes; China Light Industry Press: Beijing, China, 1992; pp. 186–194. [Google Scholar]
  23. Zhao, J.H.; Lai, H.J.; Bi, C.; Zhao, M.; Liu, Y.; Li, X.; Yang, D. Effects of paclobutrazol application on plant architecture, lodging resistance, photosynthetic characteristics, and peanut yield at different single-seed precise sowing densities. Crop J. 2023, 11, 301–310. [Google Scholar] [CrossRef]
  24. Bernhard, B.J.; Below, F.E. Plant population and row spacing effects on corn: Plant growth, phenology, and grain yield. Agron. J. 2020, 112, 2456–2465. [Google Scholar] [CrossRef]
  25. Haarhoff, S.J.; Swanepoel, P.A. Plant population and row spacing affects growth and yield of rainfed maize in semi-arid environments. Front. Plant Sci. 2022, 13, 761121. [Google Scholar] [CrossRef] [PubMed]
  26. Zhao, L.; Xie, G.M.; Fan, M.Y.; Sumera, A.; Zhang, Q.; Lu, J.Y.; Zhang, L.G.; Gao, F.; Wang, C.Y. Mulching and planting density on photosynthesis, lodging resistance, and yield of maize. Int. J. Plant Prod. 2023, 17, 651–665. [Google Scholar] [CrossRef]
  27. Wang, C.Y.; Zhao, L.; Wang, L.J.; Hou, Y.; Wang, M. The effect of different planting densities on leaf photosynthetic performance and yield of corn. Crops 2013, 96–99. [Google Scholar]
  28. Li, R.F.; Zhang, G.Q.; Xie, R.Z.; Hou, P.; Bo, M.; Xue, J.; Wang, K.R.; Li, S.K. Optimizing row spacing increased radiation use efficiency and yield of maize. Agron. J. 2021, 113, 4806–4818. [Google Scholar] [CrossRef]
  29. Yu, N.N.; Ren, B.Z.; Zhao, B.; Liu, P.; Zhang, J.W. Optimized agronomic management practices narrow the yield gap of summer maize through regulating canopy light interception and nitrogen distribution. Eur. J. Agron. 2022, 137, 126520. [Google Scholar] [CrossRef]
Figure 1. Precipitation and temperature changes in the study area in 2023 and 2024.
Agronomy 15 01099 g001
Figure 2. Effect of row density interaction on net photosynthetic rate of maize leaves. D1, D2, and D3 represent planting densities of 60,000 plants/hm2, 67,500 plants/hm2, and 75,000 plants/hm2, respectively. JT: jointing; BS: big trumpet stage; TS: teaseling; FS: filling stage; MT: maturity.
Agronomy 15 01099 g002
Figure 3. Effect of row density interaction on the transpiration rate of maize leaves. D1, D2, and D3 represent planting densities of 60,000 plants/hm2, 67,500 plants/hm2, and 75,000 plants/hm2, respectively. JT: jointing; BS: big trumpet stage; TS: teaseling; FS: filling stage; MT: maturity.
Agronomy 15 01099 g003
Figure 4. Effect of row density interaction on MDA content in maize leaves. D1, D2, and D3 represent planting densities of 60,000 plants/hm2, 67,500 plants/hm2, and 75,000 plants/hm2, respectively. JT: jointing; BS: big trumpet stage; TS: teaseling; FS: filling stage; MT: maturity. a, b, c, and d represent different levels of significance. a indicates a higher level of significance, such as 0.01 or 0.05, b indicates a secondary level of significance, and c indicates a lower level of significance.
Agronomy 15 01099 g004
Figure 5. Effect of row density interaction on superoxide dismutase (SOD) in maize leaves. D1, D2, and D3 represent planting densities of 60,000 plants/hm2, 67,500 plants/hm2, and 75,000 plants/hm2, respectively. JT: jointing; BS: big trumpet stage; TS: teaseling; FS: filling stage; MT: maturity. a, b, c, and d represent different levels of significance. a indicates a higher level of significance, such as 0.01 or 0.05, b indicates a secondary level of significance, and c indicates a lower level of significance.
Agronomy 15 01099 g005
Figure 6. Effect of row density interaction on superoxide dismutase catalase (CAT) in maize leaves. D1, D2, and D3 represent planting densities of 60,000 plants/hm2, 67,500 plants/hm2, and 75,000 plants/hm2, respectively. JT: jointing; BS: big trumpet stage; TS: teaseling; FS: filling stage; MT: maturity. a, b, c, and d represent different levels of significance. a indicates a higher level of significance, such as 0.01 or 0.05, b indicates a secondary level of significance, and c indicates a lower level of significance.
Agronomy 15 01099 g006
Figure 7. Correlation analysis between physiological activity and yield during the grouting period and filling stage. Note: *, **, and *** represent a significant difference (p < 0.05, p < 0.01, p < 0.001, respectively).
Agronomy 15 01099 g007
Table 1. Soil nutrient content in 2023–2024.
YearTotal NitrogenAlkaline NitrogenTotal PhosphorusAvailable PhosphorusTotal PotassiumAvailable PotassiumSoil Organic MatterpH
20230.96 g/kg67.1 mg/kg0.78 g/kg17.9 mg/kg17.06 g/kg176 mg/kg14.09 g/kg8.55
20240.59 g/kg56.65 mg/kg1.20 g/kg28.79 mg/kg21.94 g/kg234.57 mg/kg14.85 g/kg8.26
Table 2. Effects of row density interaction on maize yield and grain composition factors in 2023–2024.
YearDensityRow Spacing/cmEar Length/cmBald Tip Long/cmEar Grain Number100-Grain Weight/gYield/(kg/hm2)
2023D140 + 4015.49 ± 0.06 b0.99 ± 0.24 a474.58 ± 3.29 c31.25 ± 0.22 b10785.60 ± 106.63 c
40 + 8017.97 ± 0.12 a0.57 ± 0.05 a601.12 ± 5.85 a36.89 ± 0.52 a13068.80 ± 726.76 a
50 + 5017.26 ± 0.04 a0.70 ± 0.04 a569.34 ± 0.78 b34.02 ± 0.57 b11936.59 ± 381.07 b
80 + 8015.83 ± 0.11 b0.81 ± 0.03 a488.99 ± 5.71 c32.76 ± 0.52 b11142.75 ± 129.74 bc
D240 + 4018.03 ± 0.48 c0.41 ± 0.07 b714.06 ± 0.76 c33.90 ± 0.04 c12634.48 ± 117.04 c
40 + 8020.44 ± 0.18 a0.07 ± 0.01 c811.00 ± 9.42 a40.70 ± 0.42 a14168.24 ± 61.94 a
50 + 5018.72 ± 0.23 b0.29 ± 0.08 b757.98 ± 5.85 b37.75 ± 0.27 b12955.80 ± 148.36 b
80 + 8016.89 ± 0.28 d0.62 ± 0.13 a712.44 ± 8.66 c33.85 ± 0.28 c11617.32 ± 45.21 c
D340 + 4016.19 ± 0.03 d0.85 ± 0.13 a598.72 ± 2.94 b33.42 ± 0.04 d11469.74 ± 126.18 d
40 + 8019.46 ± 0.16 a0.57 ± 0.01 a711.54 ± 34.37 a37.92 ± 0.51 a13114.14 ± 98.08 a
50 + 5018.14 ± 0.08 b0.70 ± 0.04 a619.04 ± 7.58 b36.11 ± 0.13 b12392.95 ± 107.89 b
80 + 8017.31 ± 0.18 c0.74 ± 0.20 a610.40 ± 2.04 b34.75 ± 0.06 c11926.20 ± 134.00 c
2024D140 + 4015.04 ± 0.27 c1.05 ± 0.42 a472.78 ± 10.10 c31.05 ± 0.27 c10656.36 ± 89.18 c
40 + 8017.11 ± 0.14 a0.68 ± 0.13 a588.00 ± 4.75 a35.11 ± 0.14 a12049.75 ± 189.19 a
50 + 5016.57 ± 0.01 b0.79 ± 0.10 a493.36 ± 4.36 b32.41 ± 0.57 b11123.11 ± 184.18 b
80 + 8015.29 ± 0.07 c0.98 ± 0.01 a477.68 ± 1.98 c31.21 ± 0.14 c10711.27 ± 212.76 c
D240 + 4017.58 ± 0.08 c0.45 ± 0.18 b674.46 ± 6.08 b35.24 ± 0.28 c12094.37 ± 130.71 c
40 + 8020.01 ± 0.28 a0.18 ± 0.11 c709.56 ± 22.32 a38.65 ± 0.93 a13664.68 ± 52.08 a
50 + 5018.34 ± 0.08 b0.37 ± 0.14 b688.14 ± 21.75 ab37.01 ± 0.17 b12701.83 ± 156.59 b
80 + 8016.22 ± 0.06 d0.64 ± 0.16 a594.88 ± 18.22 c34.18 ± 0.08 c11730.58 ± 99.98 c
D340 + 4015.89 ± 0.59 bc0.89 ± 0.10 a566.08 ± 3.85 c31.98 ± 0.58 d10975.54 ± 109.75 d
40 + 8018.97 ± 0.23 b0.61 ± 0.04 a611.36 ± 1.36 a37.24 ± 0.27 a12580.77 ± 117.47 a
50 + 5018.03 ± 0.08 a0.72 ± 0.16 a591.52 ± 15.47 ab36.06 ± 0.03 b12375.79 ± 141.37 b
80 + 8016.89 ± 0.14 c0.76 ± 0.03 a587.52 ± 14.37 bc34.25 ± 0.13 c11754.60 ± 241.33 c
Note: D1, D2, and D3 in the table represent planting densities of 60,000 plants/hm2, 67,500 plants/hm2, and 75,000 plants/hm2, respectively. In the same column, different lowercase letters indicate that the difference between different treatments is significant at the 0.05 level.
Disclaimer/Publisher’s Note: The statements, opinions and data contained in all publications are solely those of the individual author(s) and contributor(s) and not of MDPI and/or the editor(s). MDPI and/or the editor(s) disclaim responsibility for any injury to people or property resulting from any ideas, methods, instructions or products referred to in the content.

