Article

Phenotypic Plasticity of Maize Flowering Time and Plant Height Using the Interactions Between QTNs and Meteorological Factors

1
College of Plant Science and Technology, Huazhong Agricultural University, Wuhan 430070, China
2
LongPing Hightech (Henan) Maize Innovation Center, Zhengzhou 450041, China
*
Authors to whom correspondence should be addressed.
Agronomy 2025, 15(5), 1078; https://doi.org/10.3390/agronomy15051078
Submission received: 24 March 2025 / Revised: 23 April 2025 / Accepted: 23 April 2025 / Published: 29 April 2025
(This article belongs to the Special Issue Enhancing Crop Resilience: GWAS and Gene-by-Environment Interaction)

Abstract

:
Although phenotypic plasticity facilitates the understanding of trait variation, its study remains limited. To study phenotypic plasticity, in this study, 203 inbred maize lines were phenotyped for flowering time and plant height in Zhengzhou, Ningjin, Tieling, and Binxian and genotyped with 121,871 high-quality SNPs. The regression slopes and intercepts of flowering time and plant height on four meteorological factors in their corresponding, most significant correlation windows were used to estimate the phenotypic plasticity of the above traits and to further indirectly detect the interactions between quantitative trait nucleotides and meteorological factors. Of the two known and seven candidate genes identified in this study, ZmCCT, GRMZM2G035417, GRMZM2G069651, and GRMZM2G359322 can be used to explain why spring maize has a longer flowering time than summer maize, as these genes delay pollen development and flowering regulators under long day and low temperature; while ZmPIN1b, GRMZM2G062045, GRMZM2G370777, GRMZM2G077752, and GRMZM2G126397 can be used to explain why Tieling has higher plant height than other regions, as these genes enhance auxin transport and suppress dwarfing genes under increased precipitation and low temperature. This study explains the phenotypic plasticity of these traits.

1. Introduction

Phenotypic plasticity—the capacity of a single genotype to produce varying phenotypes across environments—has become central to understanding genotype-by-environment interactions and crop adaptation [1,2,3]. Unlike fixed genetic traits, plastic responses enable organisms to rapidly adjust to environmental fluctuations such as temperature shifts, resource availability, and biotic stresses. In the case of plants, this adaptability is exemplified by morphological adjustments, such as modulation of leaf area and plasticity in root allocation under varying nutrient and light conditions [4]. Similarly, animals have been observed to exhibit plasticity through behavioral, physiological, and developmental strategies to avoid predation and optimize reproductive success [5]. A seminal model employed for quantifying plasticity is the reaction norm model, which delineates the phenotypic trajectory of a genotype across environmental gradients [6]. This model simplifies complex environmental variables, thereby facilitating the identification of genetic mechanisms underlying phenotypic variation.
Recent methodological advances in genome-wide association studies (GWAS) have enabled the detection of quantitative trait nucleotide-by-environment interactions (QEIs). Initial approaches focused on multi-trait GWAS frameworks [7], while subsequent methodologies incorporated indirect indicators, such as genetic risk scores [8,9], environmental indices [10], regression parameters [11,12], and phenotypic variation indicators [12]. However, a critical gap remains in the literature, as most studies identify quantitative trait nucleotides (QTNs) with phenotypic outcomes, while neglecting direct associations between QTNs and specific environmental factors, such as meteorological factors and treatment levels. Addressing this limitation could enhance our understanding of genotype–environment interaction and inform climate-resilient crop breeding.
Maize (Zea mays L.), a short-day crop originating from Mexico, is a prime example of phenotypic plasticity—especially in photoperiod sensitivity [13,14]. Latitudinal clines are well documented, with tropical varieties growing up to a meter taller than temperate ones [15]. Similarly, flowering time tends to increase with latitude [16]. Notably, our preliminary data reveal a higher plant height of 203 inbred lines in Tieling than in other regions. However, further research is required to elucidate the genetic basis of phenological differences between spring and summer maize, particularly in relation to meteorological factors.
To address the aforementioned issue, the regression slopes and intercepts of flowering time and plant height phenotypes in different environments on four meteorological factors (growing degree days (GDD), photothermal time (PTT), photothermal ratio (PTR), and precipitation (PREC)) in their corresponding, most significant correlation windows were used to measure the change trend of trait phenotypes on environmental factors, called phenotypic plasticity [12]. 3VmrMLM [17] was employed to analyze the estimated regression slopes and intercepts for the indirect identification of QEIs for the above traits. The objective is to investigate phenotypic plasticity and to elucidate the reasons for the higher plant height in Tieling compared to other regions and the prolonged flowering time of spring maize relative to summer maize. The study identified two known and seven candidate genes that interact with meteorological factors and provided an example of explaining phenotypic plasticity and insights for breeding climate-resilient maize varieties.

2. Materials and Methods

2.1. Germplasm and Phenotype Evaluation

A total of 203 inbred maize lines were derived from Shu et al. [18]. Four representative sites covering the major maize production zones in China (>80% of national production) were selected. Spring maize was planted on 28 April 2013 in Tieling (42.55° N) and on 8 May 2013 in Bin County (45.76° N), while summer maize was planted on 10 June 2013 in Zhengzhou (34.86° N) and on 16 June 2013 in Ningjin (37.65° N). Phenotypic traits including days to anthesis (DTA), days to silk (DTS), plant height (PH), and ear height (EH) were measured.

2.2. Phenotype Data Analysis

The R package psych v2.4.1 was used to calculate the minimum, maximum, mean, standard deviation, kurtosis, skewness, and coefficient of variation for the three trait phenotypes in four sites. The ggplot2 v3.5.0 software was then employed to create boxplots, with Python’s pandas and seaborn libraries being used to calculate trait correlations. Broad-sense heritability (h2) was estimated as below:
h 2 = σ g 2 σ g 2 + σ e 2 / l
where σ g 2 is genetic variance, σ e 2 is residual error variance, and l is the number of environments. The variance components, namely, genotype (G), environment (E), and their interaction (G × E), were calculated by using the software lme4 v1.1-34 and subsequently visualized using the software ggplot2 v3.5.0.

2.3. Genomic Data Processing

A total of 876,297 SNPs from Shu et al. [18] were mapped to the B73 RefGen_v2 reference genome and filtered using PLINK v1.90 (--geno 0.2), resulting in the retention of 121,871 high-quality SNPs after imputation using BEAGLE v5.2 [19,20]. To control for population structure and polygenic background in GWAS, a Q matrix and a kinship (K) matrix were computed using 41,890 SNPs pruned from the above 121,871 SNPs. Population structure was assessed using three methods: (1) principal component analysis (PCA) using PLINK v1.9; (2) admixture analysis [21]; and (3) hierarchical clustering using hclusterpar() of the R package amp, with the subsequent visualization facilitated by iTOL. The K matrix was obtained using the IIIVmrMLM v1.0 software [22].

2.4. Meteorological Factors Processing

Meteorological data were obtained from the National Centers for Environmental Information (http://www.ncdc.noaa.gov, accessed on 28 December 2023) and the Astronomical Applications Department of the U.S. Naval Observatory (http://aa.usno.navy.mil/data/RS_OneYear, accessed on 28 December 2023). There were four meteorological factors: (1) growing degree days (GGD) [23], G D D = 1 L i = S S + L 1 2 T max + T min T base ; (2) photothermal time (PTT) [23], P T T = 1 L i = S S + L 1 2 T max + T min T base × D L ; (3) photothermal ratio (PTR) [11], P T R = 1 L i = S S + L 1 2 T max + T min T base ÷ D L ; and (4) precipitation (PREC) [24], daily amount of rainfall (mm), where Tmax and Tmin represent the daily maximum and daily minimum temperatures, respectively; Tbase is a certain threshold base temperature (50 ℉) accumulated on a daily basis; S is Sth the day after planting; and L represents the length of the window. The original measurements of meteorological variables were used in this study.

2.5. Critical Window Identification, Phenotypic Plasticity Analysis, and GWAS

A sliding window analysis, with a minimum span of five days, was performed over the 105-day growth period. The averaged meteorological factor in each environment between the ith day after planting (DAPi) and DAPj and its corresponding phenotype were used to calculate correlation coefficient. The phenotype (dependent variable) and the meteorological factor in the sliding window with the strongest correlation (independent variable) were used to perform regression analysis.
The slope and intercept were used to estimate phenotypic plasticity [12], and the phenotypes of phenotypic plasticity were used to indirectly identify the interaction between the quantitative trait nucleotide (QTN) and meteorological factor, named QMI, using the 3VmrMLM method [17], implemented by the IIIVmrMLM v1.0 and IIIVmrMLM.QEI v1.0 software packages [12,22]. The first two principal components were used to control for population structure, and the K matrix was calculated using the IIIVmrMLM v1.0 software. The software parameter ‘SearchRadius’ was set to 5, ‘svpal’ was set to 0.01, and the remaining parameters were default. The thresholds for significant and suggested QMIs were 4.10 × 10⁻⁷ (0.05/m) and LOD ≥ 3.0, respectively, where m is the number of SNP markers.

2.6. Identifying Known and Candidate Maize Flowering and Height Genes

Known and candidate genes for PH, EH, DTA, and DTS were identified around 500 kb upstream and downstream of each QMI. Known genes were obtained from previous studies, while candidate genes were determined as follows. A schematic overview of the technical workflow is depicted in Figure 1.
Furthermore, we performed the following:
  • Differential expression analysis: Transcriptome data were retrieved from the Gene Expression Omnibus database of NCBI for DTS and supplemented Dataset S4 in Stelpflug et al. [25] for PH, EH, and DTA. In detail, internode and root tissues were used for PH and EH, meiotic tassel and anther tissues for DTA (Dataset S4, Stelpflug et al. [25]), and ear primordium and silk tissues for DTS (GSE50191) [26]. Differentially expressed genes (DEGs) were identified using the R package limma [27], with significance determined by P-adjust < 0.05 and |log2FoldChange| > 1. To incorporate responses to abiotic stress, external datasets of stress-responsive DEGs were integrated, including 7272 DEGs for temperature [28], 11,426 DEGs for photoperiod [29], and 4611 DEGs for water stress [30].
  • GO annotation: Candidate DEG protein sequences were annotated via eggNOG-mapper using default parameters (http://eggnog-mapper.embl.de/, accessed on 6 August 2024) [31]. GO annotation results were extracted from eggNOG-mapper using AgBase [32], reserving the biological processes related to phenology, morphology, and abiotic stress.
  • Haplotype analysis: For each DEG, SNPs within coding regions and 2 kb promoter regions were used to construct gene haplotypes. Associations between intercept/slope and gene haplotypes were tested by one-way ANOVA in the R function aov(), with the p-value ≤ 0.05. Haplotype distributions were visualized using ggplot2 v3.5.0.
  • Homologous gene analysis: Candidate gene protein sequences were blasted against Arabidopsis and Oryza sativa using the TAIR (https://www.arabidopsis.org, accessed on 27 August 2024) and RGAP (https://rice.uga.edu/, accessed on 27 August 2024) databases. A gene was identified as a potential candidate gene if its homolog was implicated in regulatory pathways associated with the target traits and also showed evidence of gene-by-environment interactions.

3. Results

3.1. Phenotypic Plasticity of Flowering Time and Plant Height Across Latitudinal Gradients

Phenotypic plasticity allows maize to adapt to different environments, shaping flowering time and plant height across latitudinal gradients. Descriptive statistical analyses revealed phenotypic plasticity in flowering time and PH of 203 maize inbred lines at four latitudinal locations (Table S1; Figure 2A). DTA and DTS showed strong phenotypic plasticity across latitudinal gradients. Mean DTA increased from 60.25 days in Zhengzhou to 87.43 days in Binxian, while mean DTS increased from 61.15 days to 88.41 days. Mean PH and EH peaked at Tieling (209.28 cm and 85.10 cm) despite its lower latitude (42.55° N) compared to Binxian (169.65 cm and 59.43 cm; 45.76° N), indicating nonlinear responses to latitude and genotype-specific adaptation to the climatic environment of Tieling. The coefficient of variation (CV) for plant height (13.18~30.35%) was higher than that for flowering time (4.65~7.34%), indicating greater phenotypic plasticity of plant height over flowering time.
Within-location correlations between traits were significantly positive (0.64~1.00 for DTA and DTS, 0.51~0.75 for PH and EH, and p < 0.05), whereas between-location associations were negative (−0.13 for DTA at ZZ and TL; −0.06 for PH at NJ and BX; and p > 0.05). Environmental effects dominated the variation in flowering time (DTA: 89.02%; DTS: 88.97%), while genotype-by-environment (G × E) interactions explained 52.31% and 57.37% of the variation in PH and EH, respectively (Figure 2B,C). Heritability ranged from 40.55% (DTS) to 56.00% (PH), indicating a substantial genetic contribution and potential for selection in breeding programs (Table S1).

3.2. Determination of Population Structure

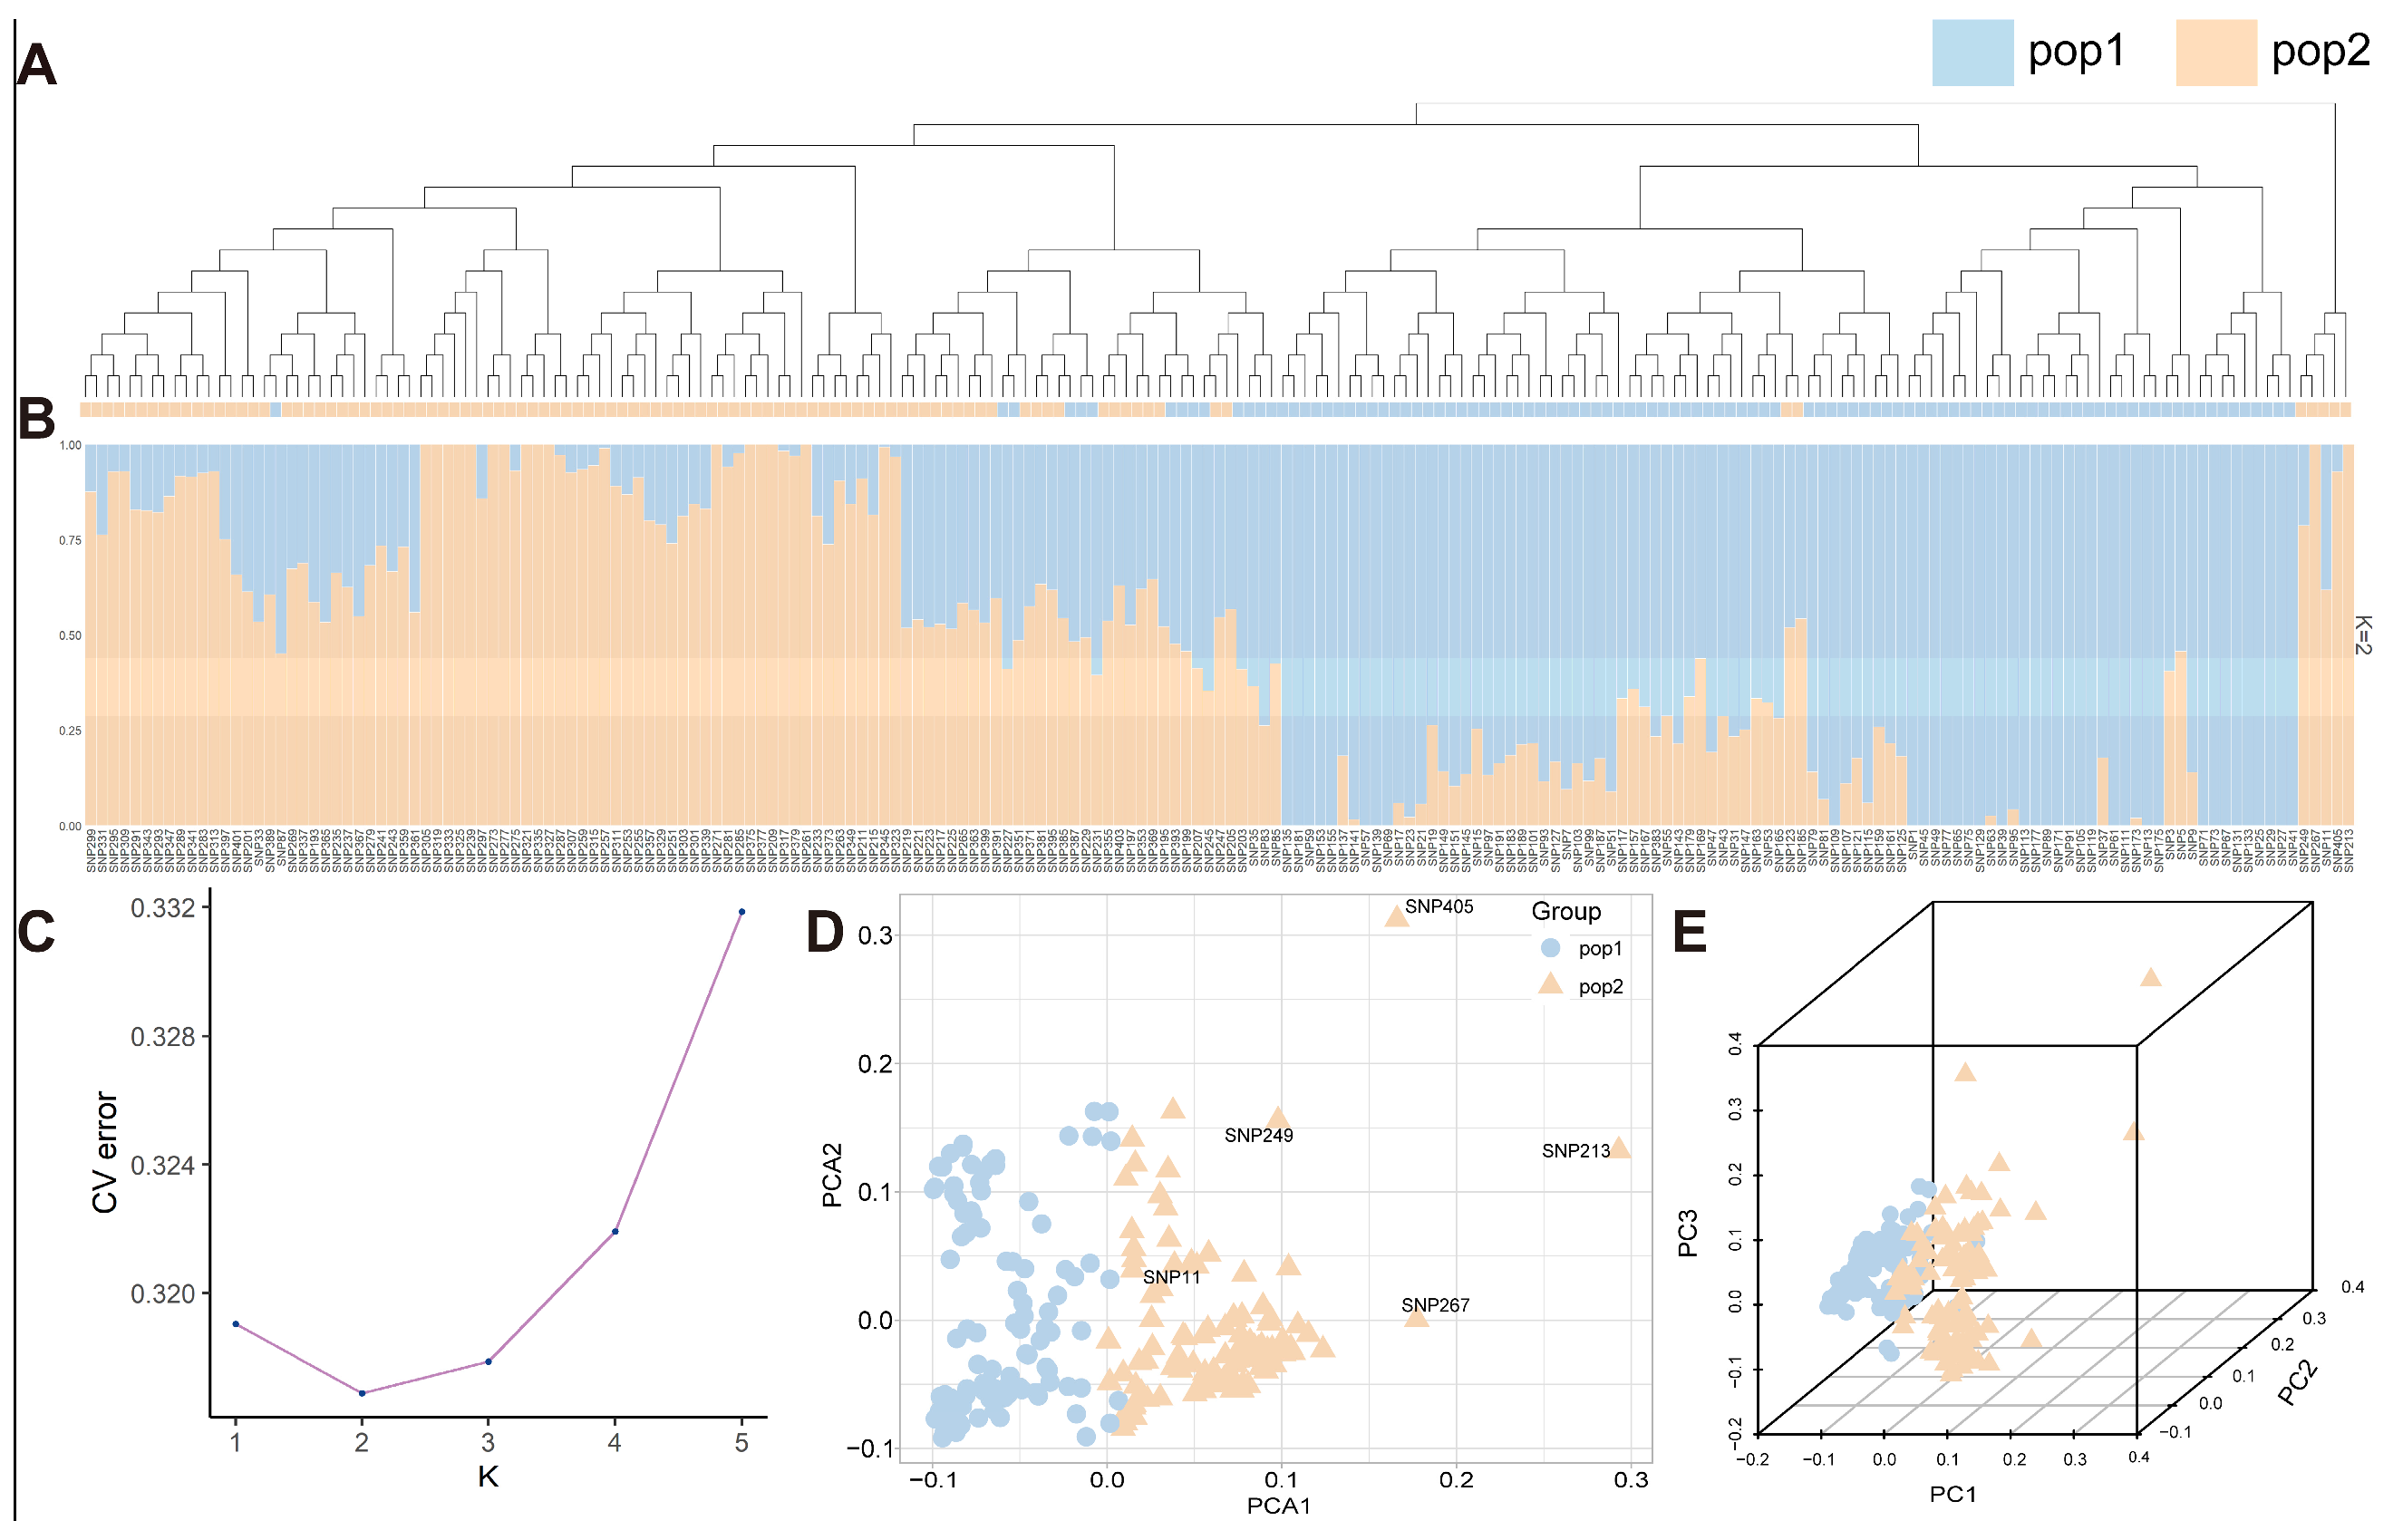
Population structure reveals maize genetic diversity and is used to improve GWAS accuracy. To characterize population stratification, 41,890 LD-pruned SNPs (r2 < 0.20 within 50-SNP sliding windows) were subjected to three analyses. ADMIXTURE analysis revealed optimal population partitioning at K = 2 based on cross-validation error minimization (0.32), two principal components showed clear separation (PC1: 18.3%, PC2: 12.2%), and neighbor-joining phylogeny further confirmed bipartite genetic structure, with 100% bootstrap support at major nodes (Figure 3).

3.3. Determination of Meteorological Factors and Their Critical Windows

Heatmap analysis identified stage-specific critical windows for meteorological factors influencing maize phenology and plant architecture (Figure 4 and Figure S1). Flowering time showed distinct temporal sensitivity patterns, and DTA was primarily regulated by PTT (51~57 days) and GDD (52~58 days) during the large trumpet stage, while PREC affected both small and large trumpet stages (45~79 days). DTS responded to GDD (6~13 days) and PTR (5~13 days) during germination, with later sensitivity to PTT (52~60 days) and PREC (47~80 days) during trumpet stages. PH showed differential regulation at different developmental stages and was influenced by GDD (79~94 days), PTT (46~60 days), PTR (83~87 days), and PREC (92~96 days). EH was sensitive to GDD (80~94 days) and PTT (80~85 days) during the reproductive transition, to PTR (83~87 days) during pre-tasseling, and to PREC (6~23 days) during early vegetative stages.
In the inbred lines, PH showed extreme sensitivity to PREC (r = 0.986, p = 0.014) and PTR (r = −0.980, p = 0.020), indicating key determinants of water availability and light- temperature balance for PH (Figure 4). Higher PREC promotes cell elongation, increasing PH, while high PTR limits growth, reducing PH. For maize breeding in Tieling with high PREC and/or low PTR, novel varieties with strong stems are recommended to reduce the risk of lodging from high PH. Latitudinal analysis revealed that longer day lengths and lower temperatures at higher latitudes linearly influenced phenotypic variation in DTA, DTS, PH, and EH (Figure S2).
The regression intercept (a) and slope (b) of trait phenotypes on meteorological factors effectively captured G × E interactions (Figure S3). This integrated analysis provides a quantitative framework for understanding phenotypic responses of maize to climate variability.

3.4. Indirect Identification of QMIs and Their Candidate Genes for Maize Flowering Time and Plant Height

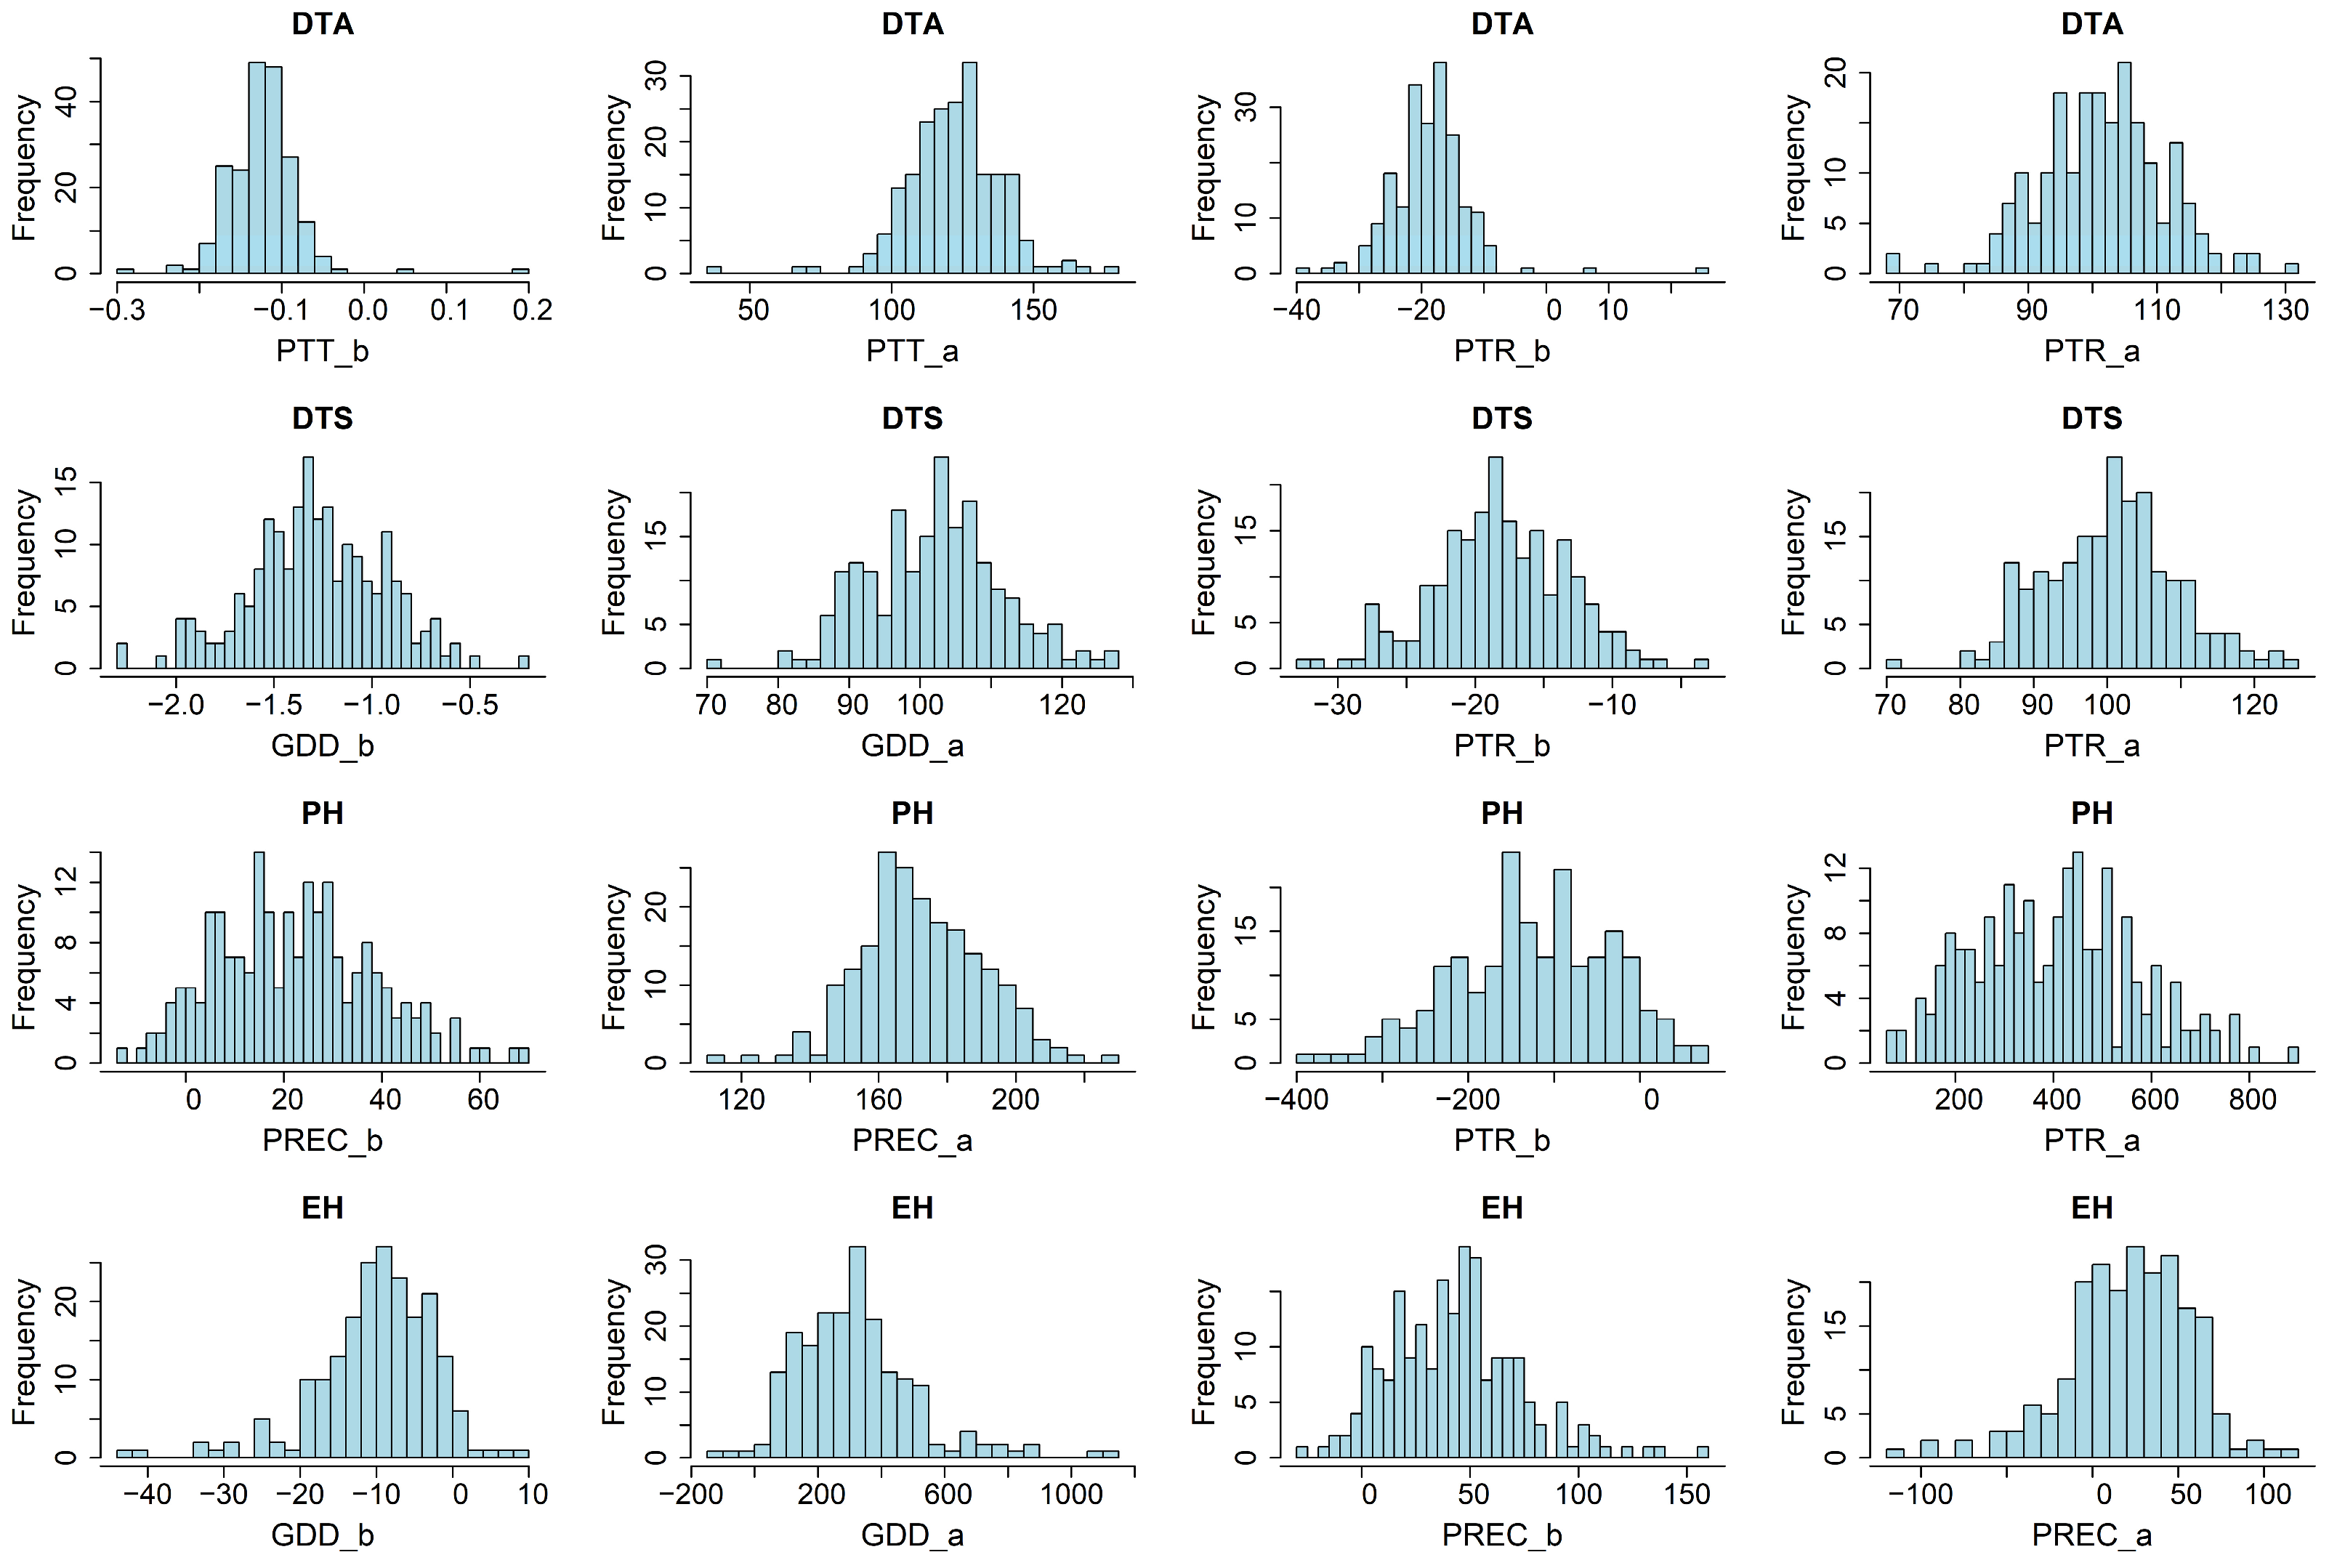
To dissect the genetic basis of flowering time plasticity, 3VmrMLM was used to associate the a and b between DTA and PTR, between DTA and PTT, between DTS and GDD, and between DTS and PTR with 121,871 high-quality SNPs in 203 inbred maize lines for indirect identification of QMIs. A total of 21, 19, 15, 19, 12, 23, 12, and 18 significant QMIs and 4, 3, 6, 3, 4, 0, 5, and 6 suggested QMIs were identified for the above eight regression parameters (Figure 5; Tables S2–S5).
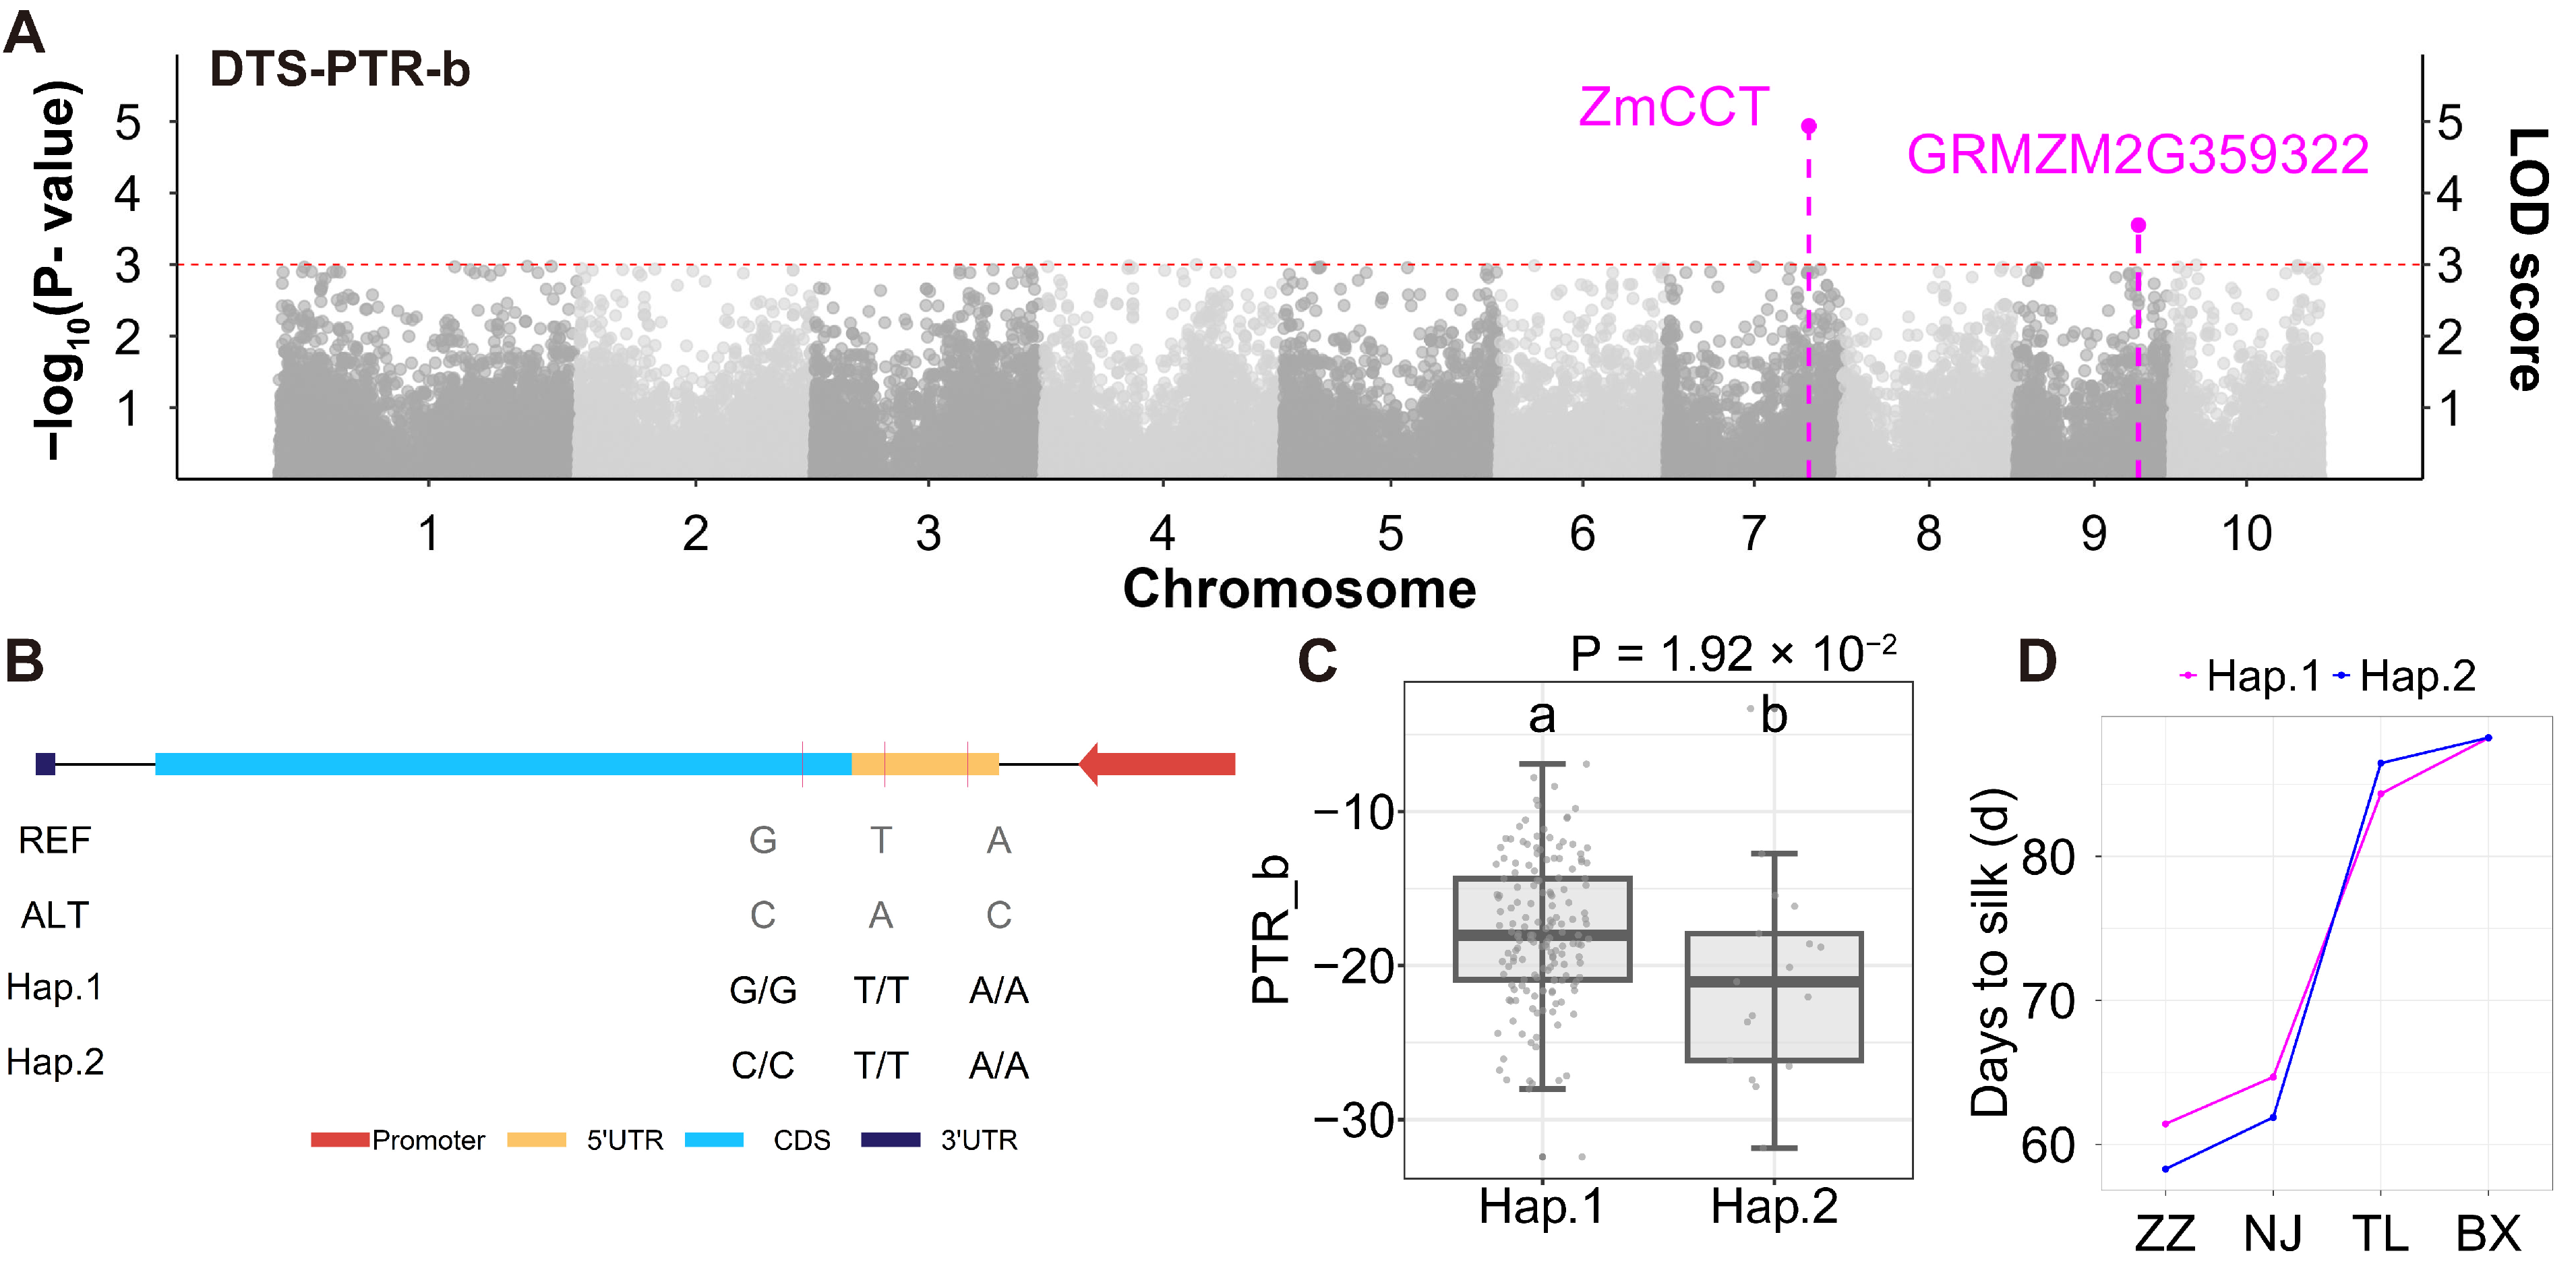
Of the genes around 74 significant and 16 suggested DTA QMIs, 541 were DEGs between meiotic tassel and anther tissues, in which 228 were photoperiod-sensitive DEGs in Fei et al. [29] and 127 were temperature-sensitive DEGs in Li et al. [28]. Of the genes around 65 significant and 15 suggested DTS QMIs, ZmCCT, modulated by photoperiod, was previously documented as a key regulator of flowering time (Table 1) [33], and 500 were DEGs between ear primordium and silk tissues, in which 180 were photoperiod-sensitive DEGs in Fei et al. [29] and 108 were temperature-sensitive DEGs in Li et al. [28]. Haplotype analysis identified 53 of the 541 DTA DEGs and 45 of the 500 DTS DEGs as associated with DTA and DTS, respectively. GO annotation analysis revealed that 10 of the above 53 genes and 5 of the above 45 genes were associated with DTA and DTS, respectively. Homology analysis revealed that significant genes GRMZM2G035417, GRMZM2G069651 (DTA), and GRMZM2G359322 (DTS) in the haplotype analysis were homologous to AT5G38470 (rad23), LOC4347402 (OsHSP82), and LOC4333090 (OsELF4-2), respectively, which are the major candidate genes (Figure 6, Figures S4 and S5; Table 2). The first two genes were identified as strong candidates for the following reasons. First, the two DTA genes were identified simultaneously by the above four types of analysis mentioned above. In the GO annotation analysis, GRMZM2G035417 is likely to affect DTA by responding to temperature stimulus (GO:0009266) and participating in ubiquitin-like protein binding (GO:0032182), while GRMZM2G069651 is likely to affect DTA by responding to heat (GO:0009408) and assisting protein folding in chloroplasts (GO:0009507). Finally, the Arabidopsis homolog rad23-4 of GRMZM2G035417 participates in ubiquitin-mediated protein degradation, potentially influencing flowering signal transduction and pollen development [34], while the Oryza sativa homolog OsHSP82 of GRMZM2G069651 collaborates with Osj10gBTF3 to protect chloroplast protein from degradation, and regulates pollen development, thereby influencing rice flowering [35].
To dissect the genetic basis of PH plasticity, 3VmrMLM was used to associate the a and b between PH and PREC, between PH and PTR, between EH and GDD, and between EH and PREC with 121,871 high-quality SNPs in 203 inbred maize lines for indirect identification of QMIs. A total of 11, 13, 10, 14, 17, 11, 13, and 12 significant QMIs and 4, 1, 5, 2, 7, 5, 3, and 4 suggested QMIs were identified for the above eight regression parameters (Tables S6–S9).
Of the genes around 53 significant and 19 suggested PH QMIs, ZmPIN1b, modulated by auxin polar transport, was previously documented as a key regulator of plant height (Table 1) [36], and 365 were DEGs between internode and root tissues and between the first and fourth internode issues, in which 88 were photoperiod-sensitive DEGs in Fei et al. [29], 67 were temperature-sensitive DEGs in Li et al. [28], and 55 were water-stress-sensitive DEGs in Kang et al. [30]. Of the genes around 48 significant and 12 suggested EH QMIs, 313 were DEGs in the above two tissue pairs, in which 50 were temperature-sensitive DEGs in Li et al. [28] and 63 were water-stress-sensitive DEGs in Kang et al. [30]. Haplotype analysis identified 54 of 365 PH DEGs and 18 of 313 EH DEGs as associated with PH and EH, respectively. GO annotation analysis revealed that 6 of the above 54 genes and 3 of the above 18 genes were associated with PH and EH, respectively. Homology analysis revealed that the haplotype-significant genes GRMZM2G062045, GRMZM2G370777 (PH), GRMZM2G077752, and GRMZM2G126397 (EH) were homologous to AT1G21980 (PIP5K1), LOC4330805 (MADS22), AT5G66350 (AtSHI), and LOC4327617 (OsPtd1), respectively (Table 2; Figures S6–S9), which are the major candidate genes. GRMZM2G370777 was identified as a strong candidate for the following reasons. First, it was identified simultaneously by the above four types of analysis mentioned above. In the GO annotation analysis, it is likely to affect PH by responding to temperature stimulus (GO:0009266) and assisting shoot system development (GO:0048367). Finally, its Oryza sativa homolog OsMADS22 negatively regulates brassinosteroid signaling, redundantly with OsMADS55, reducing PH by inhibiting cell elongation and altering leaf angle [37].
In summary, plant height exhibited the greatest phenotypic plasticity of all traits in the four locations. Among the meteorological factors analyzed, PREC and PTR emerged as the most influential meteorological factors for plant height and flowering time, respectively. By integrating GWAS signals, differential expression analysis, GO annotation, gene haplotype analyses, and homologous gene analysis, we identified two known and seven candidate genes underpinning environmental responsiveness, of which GRMZM2G035417, GRMZM2G069651, and GRMZM2G370777 were regarded as strong candidates.

4. Discussion

In this study, we performed regression analysis of trait phenotypes on key meteorological factors (GDD, PTT, PTR, and PREC) during the most correlated growth period, as described in Zhao et al. [38]. These regression slopes and intercepts were used as phenotypes to indirectly detect QMIs using 3VmrMLM. Around these QMIs, one DTS and one PH known genes were found, while three candidate flowering-time genes and four candidate plant height genes were identified using four types of analyses, including differential expression, GO annotation, haplotype, and homology analyses. More importantly, ZmCCT, GRMZM2G035417, GRMZM2G069651, and GRMZM2G359322 may provide insights into the differences in flowering time between the spring maize belt and the summer maize belt, while ZmPIN1b, GRMZM2G062045, GRMZM2G370777, GRMZM2G077752, and GRMZM2G126397 may explain why plant height is higher in Tieling than in other planting areas.

4.1. Stage-Dependent Climate Sensitivity

Here we observed that flowering time and plant height were significantly influenced by temperature, photoperiod, and precipitation at the large trumpet stage (V12-VT). This is because meteorological factors exert maximum influence on both reproductive (flowering time) and vegetative (plant height) traits at this phenological bottleneck stage. This conclusion is consistent with that of Ren et al. [39], who found that climate variability had the greatest effect on maize before and after the flowering period. At the V12-VT stage, flowering time was negatively correlated with temperature, suggesting that elevated temperatures may disrupt pollen development, thereby prolonging flowering time, which is consistent with the finding of Hatfield et al. [40] that temperatures above 35 °C reduce maize pollen viability, likely delaying pollination and anthesis. Plant height was positively correlated with precipitation, suggesting that increased rainfall may promote stem elongation, in agreement with Muhammad et al. [41] who found that abscisic acid regulates auxin, gibberellin, cytokinin, ethylene, salicylic acid, and jasmonic acid to balance vegetative and reproductive growth under drought stress. Conversely, plant height was negatively correlated with temperature, as high temperatures inhibit growth, particularly by reducing upper internode elongation and suppressing lower internodes after V12 [42].

4.2. Genetic Mechanism of Phenotypic Plasticity in Maize Flowering Time

In this study, we observed that the spring maize belts in Tieling and Binxian had longer flowering times than the summer maize belts in Zhengzhou and Ninjing, with strong phenotypic plasticity. Meanwhile, we observed significant differences in the main climatic factors affecting flowering time between the summer (higher temperature but shorter photoperiod) and spring (lower temperature but longer photoperiod) maize belts (Figure S2). This phenotypic plasticity in flowering time may be explained by the known and candidate genes identified in this study, the differences in the main climatic factors between the summer and spring maize belts, and the results of previous studies as follows.
First, ZmCCT under a higher PTR in the summer maize belt (2.075) than in the spring maize belt (0.774) may prolong the flowering time in the spring maize belt than in the summer maize belt (Figure 4 and Figure S3). This result is consistent with the molecular mechanism of Su et al. [33], i.e., ZmCCT may directly repress the expression of ZmPRR5 and ZmCOL9 and promote the expression of ZmRVE6 to delay flowering under long day (LD) conditions, while overexpression of ZmCCT may delay flowering time under LD conditions (Figure 7A). Consequently, the lower PTR in the spring maize belt is associated with a longer DTS, possibly due to the greater suppression of flowering signals by ZmCCT in the spring maize belt under LD conditions.
Then, GRMZM2G069651 under a higher PTT in the summer maize belt (485.184) than in the spring maize belt (297.820) may prolong the flowering time in the spring maize belt (Figure 4 and Figure S3). The evidence is as follows. GRMZM2G069651 is a DEG with a lower expression level at 16 °C than at 25 °C [28] and between meiotic tassel and anther issues and involves a heat stress response (GO:0009408) in GO annotation analysis, and its homolog, heat shock protein OsHSP82, in Oryza sativa cooperates with Osj10gBTF3 to regulate pollen development [35]. Thus, it is speculated that the lower PTT in the spring maize belt may suppress the expression of GRMZM2G069651, which may partially explain delayed flowering through compromised pollen development (Figure 7A).
Next, GRMZM2G035417 under a higher PTR in the summer maize belt (2.125) than in the spring maize belt (0.885) may prolong the flowering time in the spring maize belt than in the summer maize belt (Figure 4 and Figure S3). The evidence is as follows. GRMZM2G035417 is a DEG for photoperiod [29] and between meiotic tassels and anthers, in this study, and responds to temperature changes in GO annotation analysis (GO: 0009266), indicating GRMZM2G035417 likely delaying flowering time by responding to photoperiod and temperature changes. This is consistent with the result that its Arabidopsis homolog, rad23-4, had more number of collapsed pollen grains than its WT under UV-B treatment [34], likely impairing pollen development by altering ubiquitin-dependent protein degradation, which delays anthesis under long-day conditions. Consequently, lower PTR in the spring maize belt may promote the expression of GRMZM2G035417, thereby affecting pollen development and ultimately leading to a longer flowering time (Figure 7A).
Finally, GRMZM2G359322 under a higher PTR in the summer maize belt (2.075) than in the spring maize belt (0.774) may prolong the flowering time in the spring maize belt than in the summer maize belt (Figure 4 and Figure S3). The evidence is as follows. GRMZM2G359322 is a DEG for photoperiod [29] and between silks and ear primordia issues, and its rice homolog, oself4-2, delayed heading in LD and slightly later in SD compared to its WT [43], as OsELF4s forms the OsEC complex with OsLUX and OsELF3s, and the complex suppresses heading genes Hd1 and Ghd7, delaying flowering. Therefore, it is speculated that lower PTR in the spring maize belt may repress the expression of GRMZM2G359322, resulting in a longer flowering time (Figure 7A).

4.3. Genetic Mechanism of Phenotypic Plasticity in Maize Plant Height

In this study, we observed that Tieling had higher plant height than Zhengzhou, Ningjin, and Binxian, with strong phenotypic plasticity. Meanwhile, we observed significant differences in the main climatic factors affecting plant height between the Tieling (more precipitation, lower temperature, and longer photoperiod) and the other three planting areas (less precipitation, higher temperature, and shorter photoperiod; Figure S2). This phenotypic plasticity in plant height may be explained by the known and candidate genes identified in this study, the differences in the main climatic factors between Tieling and the other three planting areas, and the results of previous studies as follows.
First, ZmPIN1b under a lower PTR in Tieling (1.540) than in other areas (1.814) may lead to a higher plant height in Tieling (Figure 4 and Figure S3). This finding is supported by Yue et al. [44], i.e., ZmPIN1b facilitates polar auxin transport and affects stem and shoot growth, and its expression level increased in shoots and decreased in roots under a 4 °C treatment for 48 h [44]. Therefore, lower PTR in Tieling may induce ZmPIN1b expression, contributing to higher plant height in Tieling (Figure 7B).
Then, GRMZM2G062045 under a higher PREC in Tieling (1.676) than in other areas (0.135) may increase plant height in Tieling (Figure 4 and Figure S3). Further evidence is given next. GRMZM2G062045 showed significantly higher expression under water stress than the control [30] and significantly differential expression between internode and root issues, and its Arabidopsis homolog, AtPIP5K1, promoted growth via auxin transport and was induced by water stress [45,46]. Therefore, higher PREC in the Tieling may be consistent with elevated GRMZM2G062045 expression under water stress, potentially enhancing auxin-mediated stem elongation and contributing to higher plant height (Figure 7B), suggesting that GRMZM2G062045 acts as a key regulator in promoting growth under wetter conditions.
Next, GRMZM2G370777 under a lower PTR in Tieling (1.540) than in other areas (1.814) may increase plant height in Tieling than in the other three areas (Figure 4 and Figure S3). Further evidence is as follows. GRMZM2G370777 is a DEG for photoperiod [29] and between internode and root issues and responds to temperature changes (GO: 0009266) and stem development (GO: 0048367) in GO annotation analysis, and its homologue MADS22 in Oryza sativa was upregulated by more than twofold under cold treatment [47] and promoted stem elongation [37]. Therefore, lower PTR in the Tieling may increase the expression level of GRMZM2G370777, leading to higher plant height (Figure 7B).
Finally, GRMZM2G077752 and GRMZM2G126397 under a lower GDD in Tieling (23.657) than in other areas (25.301) may lead to a higher EH in Tieling (Figure 4 and Figure S3). GRMZM2G077752 and GRMZM2G126397 were DEGs for temperature [28] and between internode and root issues. In GO annotation analysis, GRMZM2G077752 responds to hormonal regulation (GO:0009725), while GRMZM2G126397 regulates root development (GO:0022622), stem development (GO:0048367), and auxin response (GO:0009733). Homology analysis revealed that GRMZM2G077752 is homologous to the Arabidopsis gene AtSHI, which inhibited plant height when overexpressed compared to control plants [48], while GRMZM2G12639 is homologous to the Oryza sativa gene Ptd1, which increased plant height under long days or low temperatures [49]. Thus, low GDD in Tieling may repress the expression of GRMZM2G077752, which reduced growth inhibition, and promote the expression of GRMZM2G12639 which promoted auxin-driven growth, collectively increasing EH (Figure 7B) possibly through balanced hormonal regulation and internode elongation as reported by Muhammad et al. [41] and Li et al. [42].
Although phenotypic observations of all the four traits in 203 inbred maize lines at four locations were only collected in a single year, the effect of meteorological factors on trait phenotypic observations was significant. Thus, the regression parameters of plant height and flowering time on meteorological factors could be used to indirectly detect QMIs. More importantly, there was evidence that two known and seven candidate genes, around these QMIs, that interact with meteorological factors could be used to explain the phenotypic plasticity of these traits in maize. Similar reports can be found in Zhao et al. [38] and Han et al. [50]. Although statistical associations alone cannot prove causality, gene differential expression analysis, GO annotation, gene haplotype analyses, and homologous gene analysis can be used to address this issue. As we know, transgenic or gene-editing experiments are required to prove the causality, and this will be addressed in the future.

5. Conclusions

The intercept and slope in the linear regression of maize flowering time or plant height on meteorological factors in four areas were used to indirectly identify QMIs. Around these QMIs, ZmCCT, GRMZM2G359322 (DTS), GRMZM2G035417, and GRMZM2G069651 (DTA) were identified as interacting with PTR, PTR, PTR, and PTT for flowering time, respectively, while ZmPIN1b, GRMZM2G062045, GRMZM2G370777 (PH), and GRMZM2G077752 and GRMZM2G126397 (EH) were identified as interacting with PTR, PREC, PTR, GDD, and GDD for plant height, respectively. The flowering-related genes ZmCCT and GRMZM2G069651 may explain why the spring maize belt has a longer flowering time than the summer maize belt, while the PH-related genes ZmPIN1b and GRMZM2G062045 may explain why Tieling has the highest plant height than the other three areas. GRMZM2G035417, GRMZM2G069651, GRMZM2G370777, and GRMZM2G062045 were key regulators.

Supplementary Materials

The following supporting information can be downloaded at https://www.mdpi.com/article/10.3390/agronomy15051078/s1; Figure S1: correlation heatmaps between meteorological factors (any time window within the time range of 0 to 105 days) and mean phenotypes of maize flowering time and plant height in 203 inbred maize lines, (A,B) correlation between DTA and meteorological factors (MFs) GDD and PREC, (C,D) correlation between DTS and MFs PREC and PTT, (E,F) correlation between PH and MFs GDD and PTT, (G, H) correlation between EH and MFs PTR and PTT; Figure S2: average day length, temperature, and precipitation in each week in 105 days after maize planting; Figure S3: the regression of trait phenotypes (DTA, DTS, PH, and EH) on meteorological factors (GDD, PREC, PTR, and PTT) during critical growth windows; Figure S4: identification of the interactions between GRMZM2G35417 and PTR-b using IIIVmrMLM (A) and its haplotype analysis (B–D); Figure S5: identification of the interactions between GRMZM2G069651 and PTT-a using IIIVmrMLM (A) and its haplotype analysis (B–D); Figure S6: identification of the interactions between GRMZM2G062045 and PREC-a using IIIVmrMLM (A) and its haplotype analysis (B–D); Figure S7: identification of the interactions between GRMZM2G370777 and PTR-b using IIIVmrMLM (A) and its haplotype analysis (B–D); Figure S8: identification of the interactions between GRMZM2G077752 and GDD-a/GDD-b using IIIVmrMLM (A) and its haplotype analysis (B–D); Figure S9: identification of the interactions between GRMZM2G126397 and GDD-a/GDD-b using IIIVmrMLM (A) and its haplotype analysis (B–D); Table S1: descriptive statistical analysis for flowering time and plant height phenotypes in 203 inbred maize lines; Table S2: identification of interactions between days to anthesis (DTA) and photothermal time (PTT) using the intercept (a) and slope (b) of DTA on PTT as phenotypes; Table S3: identification of interactions between days to anthesis (DTA) and photothermal ratio (PTR) using the intercept (a) and slope (b) of DTA on PTR as phenotypes; Table S4: identification of interactions between days to silk (DTS) and growing degree days (GDD) using the intercept (a) and slope (b) of DTS on GDD as phenotypes; Table S5: identification of interactions between days to silk (DTS) and photothermal ratio (PTR) using the intercept (a) and slope (b) of DTS on PTR as phenotypes; Table S6: identification of interactions between plant height (PH) and precipitation (PREC) using the intercept (a) and slope (b) of PH on PREC as phenotypes; Table S7: identification of interactions between plant height (PH) and photothermal ratio (PTR) using the intercept (a) and slope (b) of PH on PTR as phenotypes; Table S8: identification of interactions between ear height (EH) and growing degree days (GDD) using the intercept (a) and slope (b) of EH on GDD as phenotypes; Table S9: identification of interactions between ear height (EH) and precipitation (PREC) using the intercept (a) and slope (b) of EH on PREC as phenotypes.

Author Contributions

Conceptualization, research management, manuscript revision, Y.Z. and Y.W.; data measurement for trait phenotypes and the marker genotypes, G.S., A.W. and Y.W.; data analysis, writing (review and editing), visualization, X.H. and Y.L.; funding acquisition, Y.Z. All authors have read and agreed to the published version of the manuscript.

Funding

This research was funded by the National Natural Science Foundation of China (32470657; 32270673).

Data Availability Statement

Data are contained within the article and Supplementary Materials.

Conflicts of Interest

Authors Y.W., G.S. and A.W. were employed by the company LongPing Hightech (Henan) Maize Innovation Center. The remaining authors declare that the research was conducted in the absence of any commercial or financial relationships that could be construed as a potential conflict of interest.

References

  1. Bradshaw, A.D. Evolutionary significance of phenotypic plasticity in plants. Adv. Genet. 1965, 13, 115–155. [Google Scholar]
  2. Schlichting, C.D. The evolution of phenotypic plasticity in plants. Annu. Rev. Ecol. Syst. 1986, 17, 667–693. [Google Scholar] [CrossRef]
  3. Nicotra, A.B.; Atkin, O.K.; Bonser, S.P.; Davidson, A.M.; Finnegan, E.J.; Mathesius, U.; Poot, P.; Purugganan, M.D.; Richards, C.L.; Valladares, F.; et al. Plant phenotypic plasticity in a changing climate. Trends Plant Sci. 2010, 15, 684–692. [Google Scholar] [CrossRef] [PubMed]
  4. Sultan, S.E. Phenotypic plasticity for plant development, function and life history. Trends Plant Sci. 2000, 5, 537–542. [Google Scholar] [CrossRef]
  5. West-Eberhard, M.J. Developmental plasticity and the origin of species differences. Proc. Natl. Acad. Sci. USA 2005, 102 (Suppl. 1), 6543–6549. [Google Scholar] [CrossRef]
  6. Scheiner, S.M. Genetics and evolution of phenotypic plasticity. Annu. Rev. Ecol. Syst. 1993, 24, 35–68. [Google Scholar] [CrossRef]
  7. Korte, A.; Vilhjálmsson, B.J.; Segura, V.; Platt, A.; Long, Q.; Nordborg, M. A mixed-model approach for genome-wide association studies of correlated traits in structured populations. Nat. Genet. 2012, 44, 1066–1071. [Google Scholar] [CrossRef]
  8. Qi, Q.; Chu, A.Y.; Kang, J.H.; Jensen, M.K.; Curhan, G.C.; Pasquale, L.R.; Ridker, P.M.; Hunter, D.J.; Willett, W.C.; Rimm, E.B.; et al. Sugar-sweetened beverages and genetic risk of obesity. N. Engl. J. Med. 2012, 367, 1387–1396. [Google Scholar] [CrossRef]
  9. Huang, T.; Hu, F.B. Gene-environment interactions and obesity: Recent developments and future directions. BMC Med. Genom. 2015, 8 (Suppl. 1), S2. [Google Scholar] [CrossRef]
  10. Kerin, M.; Marchini, J. Inferring gene-by-environment interactions with a Bayesian whole-genome regression model. Am. J. Hum. Genet. 2020, 107, 698–713. [Google Scholar] [CrossRef]
  11. Li, X.; Guo, T.; Wang, J.; Bekele, W.A.; Sukumaran, S.; Vanous, A.E.; McNellie, J.P.; Tibbs-Cortes, L.E.; Lopes, M.S.; Lamkey, K.R.; et al. An integrated framework reinstating the environmental dimension for GWAS and genomic selection in crops. Mol. Plant 2021, 14, 874–887. [Google Scholar] [CrossRef] [PubMed]
  12. Zhang, Y.W.; Han, X.L.; Li, M.; Chen, Y.; Zhang, Y.M. IIIVmrMLM.QEI: An effective tool for indirect detection of QTN-by-environment interactions in genome-wide association studies. Comput. Struct. Biotechnol. J. 2024, 23, 4357–4368. [Google Scholar] [CrossRef] [PubMed]
  13. Ellis, R.H.; Summerfield, R.J.; Edmeades, G.O.; Roberts, E.H. Photoperiod, temperature, and the interval from sowing to tassel initiation in diverse cultivars of maize. Crop Sci. 1992, 32, 1225–1232. [Google Scholar] [CrossRef]
  14. Bonhomme, R.; Derieux, M.; Edmeades, G.O. Flowering of diverse maize cultivars in relation to temperature and photoperiod in multilocation field trials. Crop Sci. 1994, 34, 156–164. [Google Scholar] [CrossRef]
  15. Renfro, B.L.; Ullstrup, A.J. A comparison of maize diseases in temperate and in tropical environments. Proc. Natl. Acad. Sci. USA 1976, 22, 491–498. [Google Scholar] [CrossRef]
  16. Liu, Y.; Xie, R.; Hou, P.; Li, S.; Zhang, H.; Ming, B.; Long, H.; Liang, S. Phenological responses of maize to changes in environment when grown at different latitudes in China. Field Crops Res. 2013, 144, 192–199. [Google Scholar] [CrossRef]
  17. Li, M.; Zhang, Y.W.; Zhang, Z.C.; Xiang, Y.; Liu, M.H.; Zhou, Y.H.; Zuo, J.F.; Zhang, H.Q.; Chen, Y.; Zhang, Y.M. A compressed variance component mixed model for detecting QTNs and QTN-by-environment and QTN-by-QTN interactions in genome-wide association studies. Mol. Plant 2022, 15, 630–650. [Google Scholar] [CrossRef]
  18. Shu, G.; Wang, A.; Wang, X.; Chen, R.; Gao, F.; Wang, A.; Li, T.; Wang, Y. Identification of QTNs, QTN-by-environment interactions for plant height and ear height in maize multi-environment GWAS. Front. Plant Sci. 2023, 14, 1284403. [Google Scholar] [CrossRef]
  19. Chang, C.C.; Chow, C.C.; Tellier, L.C.; Vattikuti, S.; Purcell, S.M.; Lee, J.J. Second-generation PLINK: Rising to the challenge of larger and richer datasets. GigaScience 2015, 4, 7. [Google Scholar] [CrossRef]
  20. Browning, B.L.; Zhou, Y.; Browning, S.R. A One-Penny Imputed Genome from Next-Generation Reference Panels. Am. J. Hum. Genet. 2018, 103, 338–348. [Google Scholar] [CrossRef] [PubMed]
  21. Alexander, D.H.; Shringarpure, S.S.; Novembre, J.; Lange, K. Admixture 1.3 Software Manual; UCLA Human Genetics Software Distribution: Los Angeles, CA, USA, 2015. [Google Scholar]
  22. Li, M.; Zhang, Y.W.; Xiang, Y.; Liu, M.H.; Zhang, Y.M. IIIVmrMLM: The R and C++ tools associated with 3VmrMLM, a comprehensive GWAS method for dissecting quantitative traits. Mol. Plant 2022, 15, 1251–1253. [Google Scholar] [CrossRef] [PubMed]
  23. Masle, J.; Doussinault, G.; Farquhar, G.D.; Sun, B. Foliar stage in wheat correlates better to photothermal time than to thermal time. Plant Cell Environ. 1989, 12, 235–247. [Google Scholar] [CrossRef]
  24. Zhang, B.; Hautier, Y.; Tan, X.; You, C.; Cadotte, M.W.; Chu, C.; Jiang, L.; Sui, X.; Ren, T.; Han, X.; et al. Species responses to changing precipitation depend on trait plasticity rather than trait means and intraspecific variation. Funct. Ecol. 2020, 34, 2622–2633. [Google Scholar] [CrossRef]
  25. Stelpflug, S.C.; Sekhon, R.S.; Vaillancourt, B.; Hirsch, C.N.; Buell, C.R.; de Leon, N.; Kaeppler, S.M. An expanded maize gene expression atlas based on RNA sequencing and its use to explore root development. Plant Genome 2016, 9. [Google Scholar] [CrossRef]
  26. Walley, J.W.; Sartor, R.C.; Shen, Z.; Schmitz, R.J.; Wu, K.J.; Urich, M.A.; Nery, J.R.; Smith, L.G.; Schnable, J.C.; Ecker, J.R.; et al. Integration of omic networks in a developmental atlas of maize. Science 2016, 353, 814–818. [Google Scholar] [CrossRef]
  27. Ritchie, M.E.; Phipson, B.; Wu, D.I.; Hu, Y.; Law, C.W.; Shi, W.; Smyth, G.K. limma powers differential expression analyses for RNA-sequencing and microarray studies. Nucleic Acids Res. 2015, 43, e47. [Google Scholar] [CrossRef]
  28. Li, Y.; Wang, X.; Li, Y.; Zhang, Y.; Gou, Z.; Qi, X.; Zhang, J. Transcriptomic analysis revealed the common and divergent responses of maize seedling leaves to cold and heat stresses. Genes 2020, 11, 881. [Google Scholar] [CrossRef]
  29. Fei, J.; Jiang, Q.; Guo, M.; Lu, J.; Wang, P.; Liu, S.; Qu, J.; Ma, Y.; Guan, S. Fine mapping and functional research of key genes for photoperiod sensitivity in maize. Front. Plant Sci. 2022, 13, 890780. [Google Scholar] [CrossRef]
  30. Kang, J.; Sen, S.; Oliver, M.J.; Sharp, R.E. Comparative transcriptomics reveal metabolic rather than genetic control of divergent antioxidant metabolism in the primary root elongation zone of water-stressed cotton and maize. Antioxidants 2023, 12, 287. [Google Scholar] [CrossRef]
  31. Huerta-Cepas, J.; Szklarczyk, D.; Heller, D.; Hernández-Plaza, A.; Forslund, S.K.; Cook, H.; Mende, D.R.; Letunic, I.; Rattei, T.; Jensen, L.J.; et al. eggNOG 5.0: A hierarchical, functionally and phylogenetically annotated orthology resource based on 5090 organisms and 2502 viruses. Nucleic Acids Res. 2019, 47, D309–D314. [Google Scholar] [CrossRef]
  32. McCarthy, F.M.; Wang, N.; Magee, G.B.; Nanduri, B.; Lawrence, M.L.; Camon, E.B.; Barrell, D.G.; Hill, D.P.; Dolan, M.E.; Williams, W.P.; et al. AgBase: A functional genomics resource for agriculture. BMC Genom. 2006, 7, 229. [Google Scholar] [CrossRef] [PubMed]
  33. Su, H.; Liang, J.; Abou-Elwafa, S.F.; Cheng, H.; Dou, D.; Ren, Z.; Xie, J.; Chen, Z.; Gao, F.; Ku, L.; et al. ZmCCT regulates photoperiod-dependent flowering and response to stresses in maize. BMC Plant Biol. 2021, 21, 453. [Google Scholar] [CrossRef]
  34. Li, X.; Guo, X.; Zhao, L.; Zhang, J.; Tang, D.; Zhao, X.; Liu, X. Arabidopsis rad23-4 gene is required for pollen development under UV-B light. Afr. J. Biotechnol. 2012, 11, 10161–10169. [Google Scholar]
  35. Liu, X.J.; Sun, J.; Huang, Y.; Li, C.; Zheng, P.; Yuan, Y.; Chen, H.; Jan, M.; Zheng, H.; Du, H.; et al. Osj10gBTF3-Mediated import of chloroplast protein is essential for pollen development in rice. Front. Plant Sci. 2021, 12, 713544. [Google Scholar] [CrossRef]
  36. Li, Z.; Zhang, X.; Zhao, Y.; Li, Y.; Zhang, G.; Peng, Z.; Zhang, J. Enhancing auxin accumulation in maize root tips improves root growth and dwarfs plant height. Plant Biotechnol. J. 2018, 16, 86–99. [Google Scholar] [CrossRef]
  37. Lee, S.; Choi, S.C.; An, G. Rice SVP-group MADS-box proteins, OsMADS22 and OsMADS55, are negative regulators of brassinosteroid responses. Plant J. 2008, 54, 93–105. [Google Scholar] [CrossRef]
  38. Zhao, Q.; Wang, T.; Pei, F.J.; Chen, Y.; Chang, X.Y.; Mi, J.M.; Zhang, Y.M. Phenotypic plasticity of grain size-related traits in main-crop and ratoon rice. Plant Cell Environ. 2025. [Google Scholar] [CrossRef]
  39. Ren, H.; Liu, M.; Zhang, J.; Liu, P.; Liu, C. Effects of agronomic traits and climatic factors on yield and yield stability of summer maize (Zea mays L.) in the Huang-Huai-Hai Plain in China. Front. Plant Sci. 2022, 13, 1050064. [Google Scholar] [CrossRef]
  40. Hatfield, J.L.; Prueger, J.H. Temperature extremes: Effect on plant growth and development. Weather Clim. Extrem. 2015, 10, 4–10. [Google Scholar] [CrossRef]
  41. Muhammad Aslam, M.; Waseem, M.; Jakada, B.H.; Okal, E.J.; Lei, Z.; Saqib, H.S.A.; Yuan, W.; Xu, W.; Zhang, Q. Mechanisms of abscisic acid-mediated drought stress responses in plants. Int. J. Mol. Sci. 2022, 23, 1084. [Google Scholar] [CrossRef]
  42. Li, B.B.; Chen, X.M.; Deng, T.; Zhao, X.; Li, F.; Zhang, B.C.; Wang, X.; Shen, S.; Zhou, S.L. Timing effect of high temperature exposure on the plasticity of internode and plant architecture in maize. J. Integr. Agric. 2024, 23, 551–565. [Google Scholar] [CrossRef]
  43. Xu, P.; Zhang, Y.; Wen, X.; Yang, Q.; Liu, L.; Hao, S.; Li, J.; Wu, Z.; Shah, L.; Sohail, A.; et al. The clock component OsLUX regulates rice heading through recruiting OsELF3-1 and OsELF4s to repress Hd1 and Ghd7. J. Adv. Res. 2023, 48, 17–31. [Google Scholar] [CrossRef] [PubMed]
  44. Yue, R.; Tie, S.; Sun, T.; Zhang, L.; Yang, Y.; Qi, J.; Yan, S.; Han, X.; Wang, H.; Shen, C. Genome-wide identification and expression profiling analysis of ZmPIN, ZmPILS, ZmLAX and ZmABCB auxin transporter gene families in maize (Zea mays L.) under various abiotic stresses. PLoS ONE 2015, 10, e0118751. [Google Scholar] [CrossRef] [PubMed]
  45. Wang, Z.; Wang, Z.; Li, X.; Chen, Z.; Liu, Y.; Zhang, F.; Li, N. Identification and analysis of the expression of the PIP5K gene family in tomatoes. Int. J. Mol. Sci. 2023, 25, 159. [Google Scholar] [CrossRef]
  46. Mikami, K.; Katagiri, T.; Iuchi, S.; Yamaguchi-Shinozaki, K.; Shinozaki, K. A gene encoding phosphatidylinositol-4-phosphate 5-kinase is induced by water stress and abscisic acid in Arabidopsis thaliana. Plant J. 1998, 15, 563–568. [Google Scholar] [CrossRef]
  47. Arora, R.; Agarwal, P.; Ray, S.; Singh, A.K.; Singh, V.P.; Tyagi, A.K.; Kapoor, S. MADS-box gene family in rice: Genome-wide identification, organization and expression profiling during reproductive development and stress. BMC Genom. 2007, 8, 242. [Google Scholar] [CrossRef]
  48. Islam, M.A.; Lütken, H.; Haugslien, S.; Blystad, D.R.; Torre, S.; Rolcik, J.; Rasmussen, S.K.; Olsen, J.E.; Clarke, J.L. Overexpression of the AtSHI gene in poinsettia, Euphorbia pulcherrima, results in compact plants. PLoS ONE 2013, 8, e53377. [Google Scholar] [CrossRef]
  49. Deng, W.; Li, R.; Xu, Y.; Mao, R.; Chen, S.; Chen, L.; Chen, L.; Liu, Y.G.; Chen, Y. A lipid transfer protein variant with a mutant eight-cysteine motif causes photoperiod-and thermo-sensitive dwarfism in rice. J. Exp. Bot. 2020, 71, 1294–1305. [Google Scholar] [CrossRef]
  50. Han, X.; Wu, X.; Zhang, Y.; Tang, Q.; Zeng, L.; Liu, Y.; Xiang, Y.; Hou, K.; Fang, S.; Lei, W.; et al. Genetic and transcriptome analyses of the effect of genotype-by-environment interactions on Brassica napus seed oil content. Plant Cell 2025, 37, koaf062. [Google Scholar] [CrossRef]
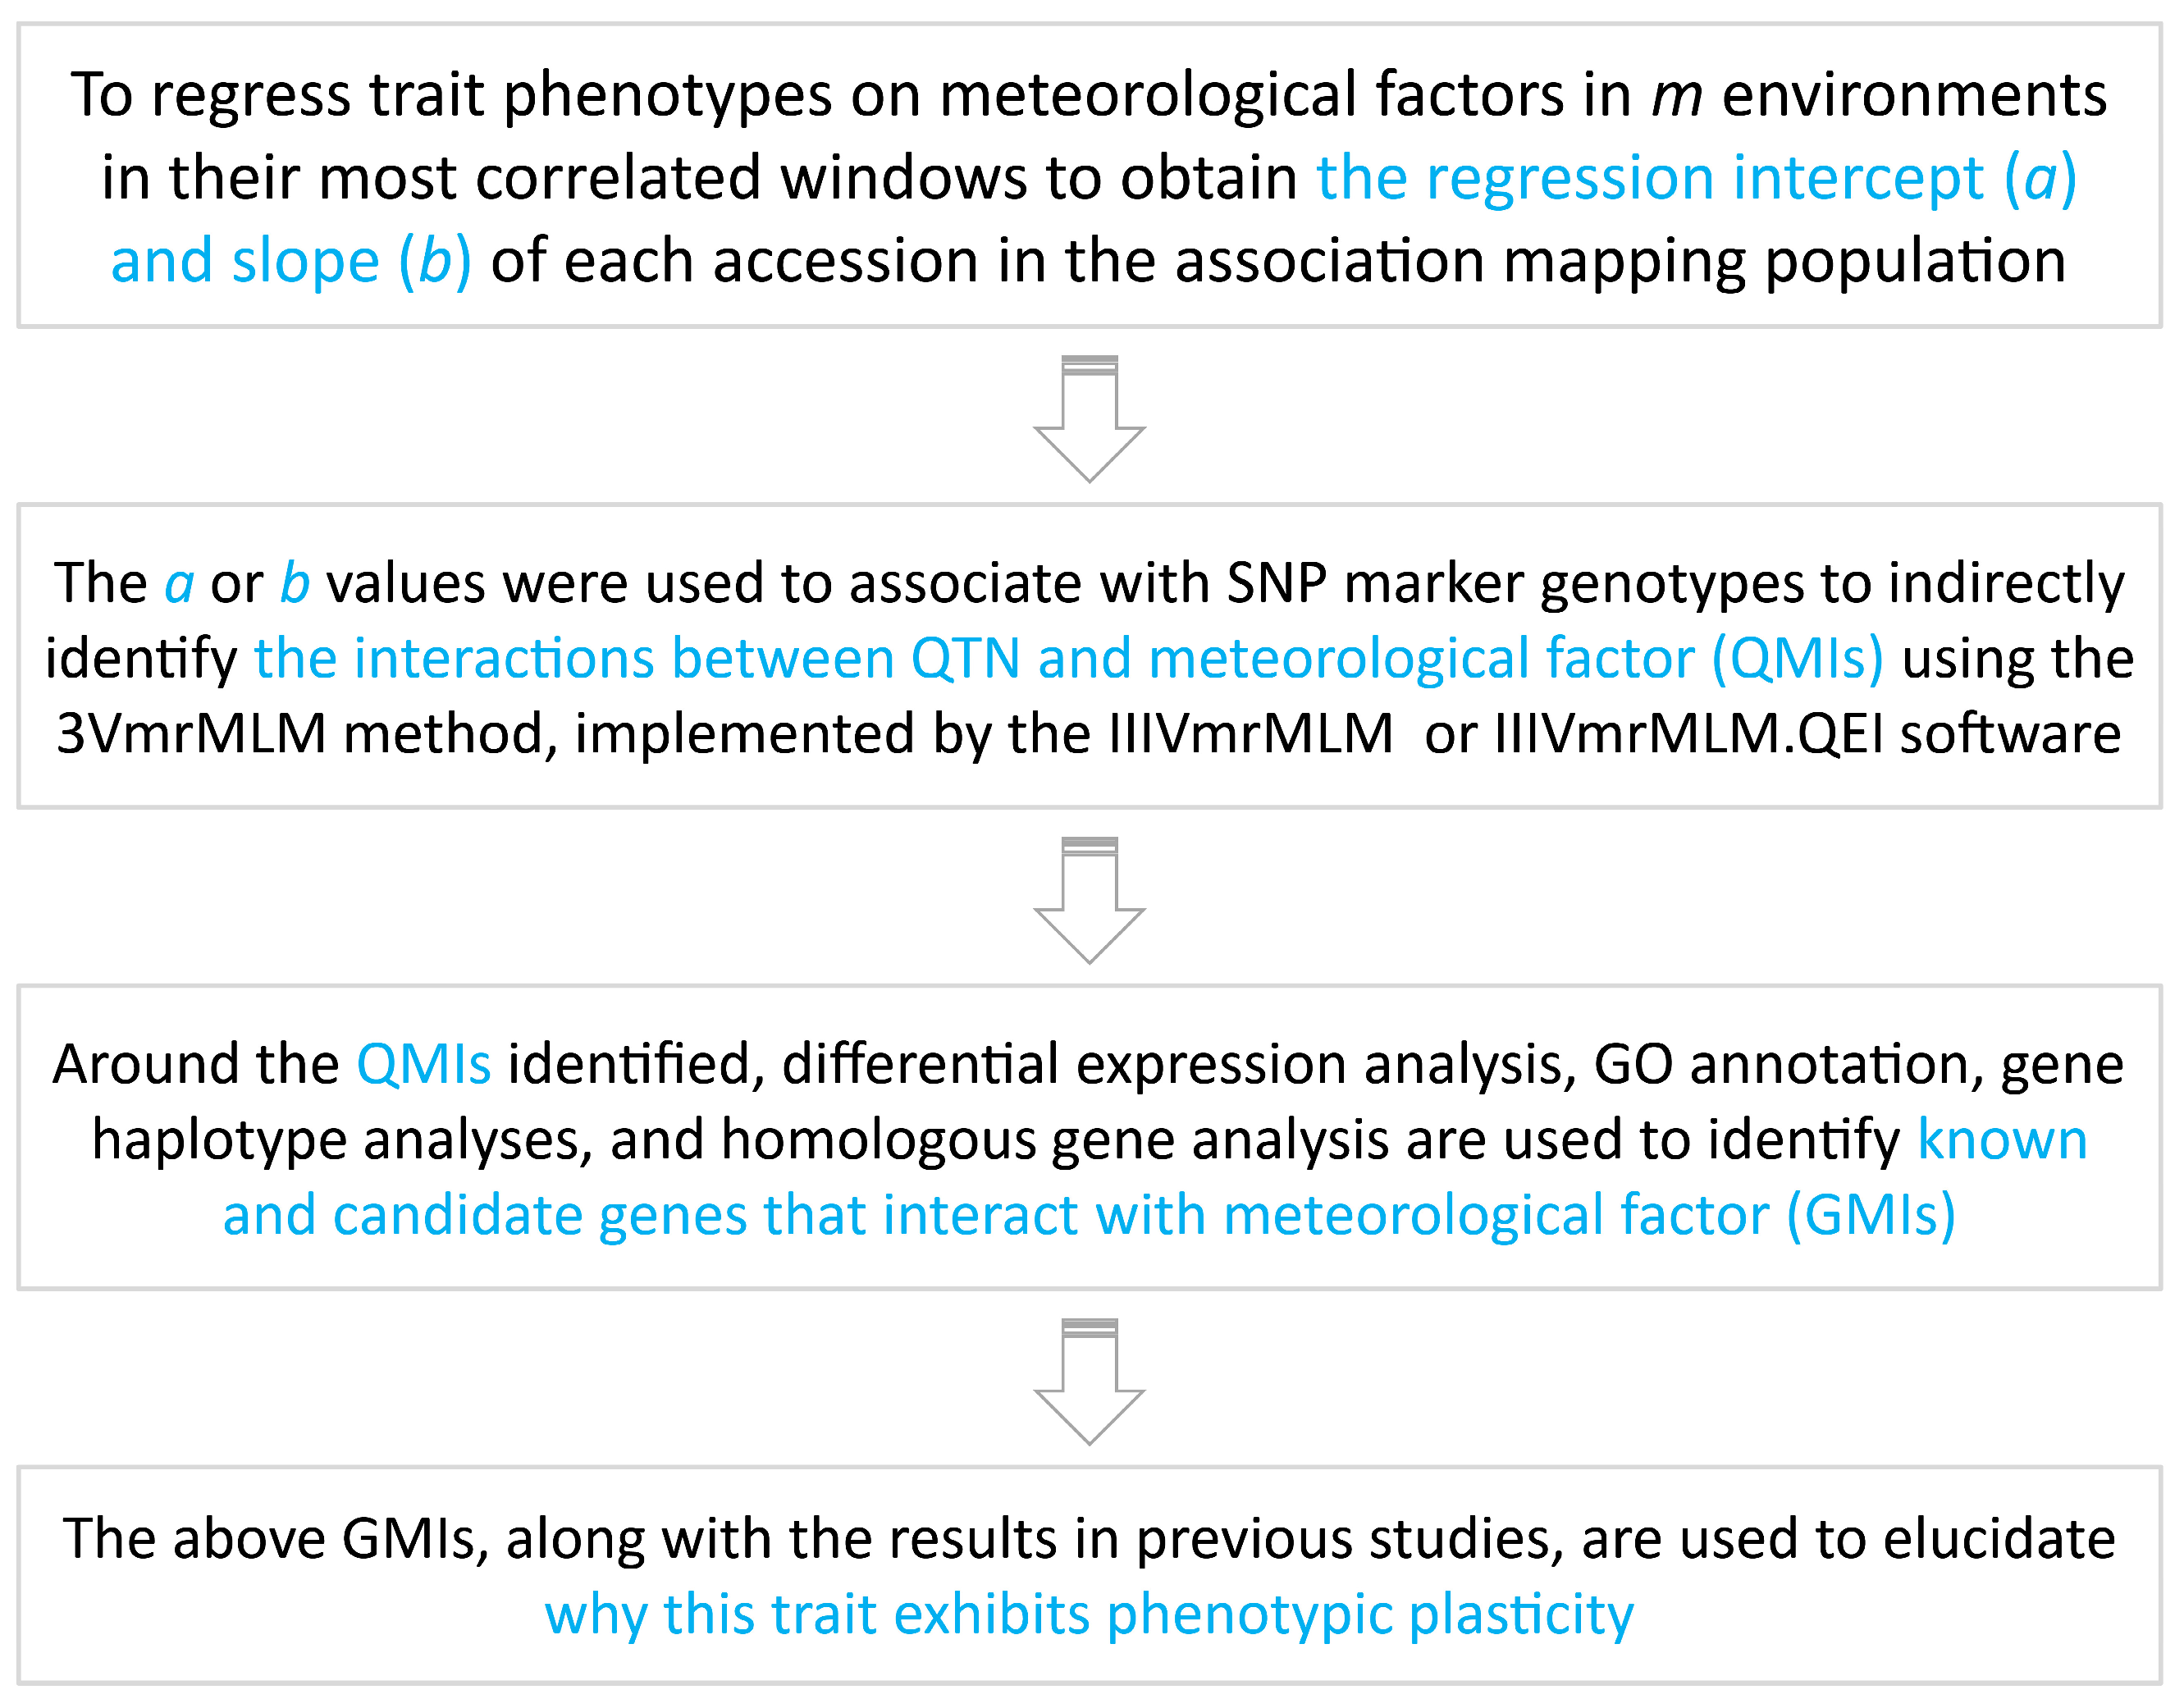
Figure 1. Technical workflow in this study.
Agronomy 15 01078 g001
Figure 2. Analysis of variance (A), correlation analysis (B), and genetic structure (C) for flowering time and plant height in four planting regions. DTA: days to anthesis; DTS: days to silk; PH: plant height; EH: ear height. Multiple comparisons were performed using LSD at 0.05 probability level and the results were indicated by “a” to “d” in (A). *, **, and ***: the 0.05, 0.01 and 0.001 probability levels, respectively.
Agronomy 15 01078 g002
Figure 3. Population structure analysis of 203 inbred maize lines using the R package amp (A), admixture (B,C), and PLINK v1.9 (D,E) software packages. (A) cluster analysis; (B) population structure analysis; (C) CV error in population structure analysis; (D) two-dimension plot in principal component analysis; (E) three-dimension plot in principal component analysis.
Agronomy 15 01078 g003
Figure 4. Correlation heatmaps between meteorological factors (any time windows between 0 and 105 days) and phenotypic means in 203 inbred maize lines at the 0.05 probability level. DTA: days to anthesis; DTS: days to silk; PH: plant height; EH: ear height; GDD: growing degree days; PTT: photothermal time; PTR: photothermal ratio; PREC: precipitation.
Agronomy 15 01078 g004
Figure 5. Frequency distributions of the intercept (a) and slope (b) (phenotypic plasticity) of flowering time (DTA and DTS) or plant height (PH and EH) on meteorological factors (GDD, PREC, PTT, and PTR). DTA: days to anthesis; DTS: days to silk; PH: plant height; EH: ear height; GDD: growing degree days; PTT: photothermal time; PTR: photothermal ratio; PREC: precipitation; a: regression intercept; b: regression slope.
Agronomy 15 01078 g005
Figure 6. Identification of the interactions between GRMZM2G359322 and photothermal ratio (PTR_b) using IIIVmrMLM (A) and its haplotype analysis (BD). a and b in (C) are the results of multiple comparisons, while b of PTR_b in (A) is regression slope.
Agronomy 15 01078 g006
Figure 7. Hypothetical molecular mechanisms underlying the regulation of delayed flowering time in the spring maize belts (A) and increased plant height in Tieling (B). DTA: days to anthesis; DTS: days to silking; PH: plant height; EH: ear height; genes in red: GWAS-identified genes; genes in black: experimentally validated genes in previously reported studies; dashed box: molecular network of candidate gene homologs.
Agronomy 15 01078 g007
Table 1. Known genes interacting with meteorological factors identified using the intercept (a) and slope (b) of maize flowering time and plant height on meteorological factor as phenotypes.
TraitGenome-Wide Association StudiesKnown GeneSymbolDistance to Gene (kb)Reference
Chr.Posi (bp)LODr2 (%)p-Value
DTS_PTR_b7143,109,3134.941.481.15 × 10−5GRMZM2G179024ZmCCT4.28Su et al. [33]
PH_PTR_b5206,273,47946.064.218.73 × 10−47GRMZM2G074267ZmPIN1b453.67Li et al. [34]
Chr.: chromosome; Posi.: position; DTS: days to silk; PH: plant height.
Table 2. Candidate genes interacting with meteorological factors identified using the intercept (a) and slope (b) of maize flowering time and plant height on meteorological factor as phenotypes.
TraitGWASGeneDifferential Expression AnalysisGO AnnotationHaplotype
Analysis
Chr.PositionLODr2 (%)EnvReferencelog2FCP-adj.TissueIDTerm
DTA-PTR-b9106,405,88013.724.23GRMZM2G035417Photo.Fei et al. [29]−1.013.49 × 10−3Tassel vs. AnthersGO:0009266
GO:0032182
Responding to temperature stimulus; ubiquitin-like protein binding2.77 × 10−2
DTA-PTT-a7131,784,0045.762.13GRMZM2G069651Photo.;
Temp.
Fei et al. [29];
Li et al. [28]
−4.541.75 × 10−5Tassel vs. AnthersGO:0009408
GO:0009507
Responding to heat; chloroplast4.83 × 10−3
DTS-PTR-b9122,920,7473.551.04GRMZM2G359322Photo.Fei et al. [29]1.771.63 × 10−3Silk vs. Ear
primordium
1.92 × 10⁻²
PH-PREC-a1265,522,1896.171.60GRMZM2G062045WaterKang et al. [30]1.002.74 × 10−3Internodes vs. RootsGO:0046488PI signaling
pathway
1.79 × 10⁻⁴
PH-PTR-b4178,674,28212.554.91GRMZM2G370777Photo.Fei et al. [29]1.534.67 × 10−4Internodes vs. RootsGO:0009266;
GO:0048367
Responding to temperature stimulus; shoot system development2.35 × 10−2
EH-GDD-a8158,116,0816.033.26GRMZM2G035417Temp.Li et al. [28]2.031.70 × 10−3First internode vs.
Fourth internode
GO:0009725Hormonal
regulation
2.43 × 10⁻²
EH-GDD-b8158,116,0818.915.561.80 × 10−2
EH-GDD-a3184,214,74037.364.60GRMZM2G126397Temp.Li et al. [28]5.544.65 × 10−5Internodes vs. RootsGO:0022622;
GO:0048367;
GO:0009733
Root development;
stem development;
responds to auxin
1.89 × 10⁻²
EH-GDD-b3184,214,74029.753.631.80 × 10−2
GWAS: genome-wide association studies; Chr.: chromosomes; Env: environment; log2FC: log2FoldChange; P-adj: adjusted probability; Photo: photoperiod; Temp: temperature. The abbreviations of DTA, DTS, PH, GDD, PTT, PTR, and PREC were found in Figure 3.
Disclaimer/Publisher’s Note: The statements, opinions and data contained in all publications are solely those of the individual author(s) and contributor(s) and not of MDPI and/or the editor(s). MDPI and/or the editor(s) disclaim responsibility for any injury to people or property resulting from any ideas, methods, instructions or products referred to in the content.