Abstract
To better understand the physiological mechanisms underlying the variation of Cadmium (Cd) accumulation in wheat, Cd absorption, translocation, and distribution in five low grain-Cd-accumulating wheat (LCA) and five high grain-Cd-accumulating wheat (HCA) were studied at four growth stages under three soil Cd concentrations. Grain Cd concentration of HCA was 2.92 times, 1.61 times, and 1.40 times more than that of LCA under the soil with 0.3 mg/kg,1.5 mg/kg, and 7.5 mg/kg Cd concentrations, respectively. LCA was more tolerant of Cd pollution than HCA. Consequently, dry matter in LCA roots, stems + leaves, glumes, grains, and the entire plant was significantly higher than that of HCA at all growth stages under all three soil Cd concentrations, and the most pronounced difference was observed during the maturity stage. The critical period governing the disparity in Cd uptake between LCA and HCA primarily occurred before jointing and the maturity stage. LCA absorbed more Cd than HCA under the three Cd soil concentrations before the jointing stage, during which Cd uptake of LCA was 1.92 times, 1.86 times, and 1.46 times that of HCA under 0.3, 1.5 and 7.5 Cd soil concentrations. But LCA absorbed less Cd than HCA at the maturity stage, during which Cd uptake of LCA was 50%, 50%, and 49% of HCA under 0.3,1.5 and 7.5 mg/kg soil Cd concentrations, respectively. Cd uptake or accumulation per plant in LCA was significantly lower than that of HCA throughout the entire growth period, but the difference between them becomes increasingly smaller as the concentration of Cd contamination increases. Early absorption and accumulation of Cd played a limited role in grain Cd accumulation, and Cd transport played a critical role in determining grain Cd content at maturity. In addition, tolerance to Cd was higher, and grain Cd concentration was lower.
Keywords:
grain cadmium; wheat; uptake; translocation; distribution; accumulation mechanism; tolerance 1. Introduction
Cadmium (Cd) is a non-essential element for animals and plants, but is among the most toxic heavy metals owing to its high mobility, widespread contamination, ease of accumulation, degradation resistance and severe toxicity [1,2]. In recent years, a substantial proportion of global farmlands (approximately 2.35 × 10⁸) have been contaminated by heavy metals worldwide [3], and approximately 7% of farmland (2.786 × 10⁵ hectares) is contaminated in China [4]. In the central and western provinces of China, such as Hunan, Guangxi, and Sichuan, the average Cd concentration in paddy soils is 0.73, 0.70, and 0.46 mg/kg, respectively [5].
Severe Cd pollution adversely affects plant growth, development, and physiological metabolism, and can readily lead to Cd concentration in edible parts of crops exceeding the maximum permissible limit for safe human consumption [6], which might be related to its Cd uptake, transport and distribution. Cd may negatively impact human health by entering the food chain or other pathways, and may cause renal dysfunction, bone demineralization, lung cancer, and impair fertility [7,8]. Therefore, it is important to minimize Cd accumulation in the edible parts of crops. Among the most cost-effective, feasible, and environmentally friendly strategies to reduce the risk of Cd contamination of wheat is to breed low grain-Cd-accumulating cultivars by exploiting genotypic differences [9,10].
Wheat is among the most important food crops worldwide, grown on 17% of the world’s arable land, feeding 35–40% of the global population, and providing 21% of energy and 20% of protein needs [11]. Cd is easily transferred from the soil to crops, and wheat grains accumulate Cd more readily than grains of other cereals [6], due to its efficient root uptake and transport facilitating Cd absorption and its cultivation in soils with elevated Cd bioavailability. Cd accumulation in wheat grains is genetically controlled and depends on Cd bioavailability in the rhizosphere, Cd uptake by roots from the soil, Cd translocation from roots to shoots, and remobilization from shoots to grains [12,13]. The bioavailability of Cd in the rhizosphere is affected by soil pH, mineral fertilization, redox potential, organic matter content, and organic acids secreted by roots [6,14,15]. Cd is mainly translocated in the xylem from roots to shoots [6]. In bread wheat, high Cd accumulation in grains is associated with an increase in Cd uptake during early growth and with high root-to-shoot translocation, whereas in durum wheat, it is associated with high translocation to the shoot but not with high uptake [16,17]. Cd accumulation in shoots solely reflects differences in the root-to-shoot translocation of Cd, because Cd uptake is similar among near-isogenic lines [18]. The uptake and transport of Cd in wheat is dependent on essential metal transporters, which include AtIRT1, TcZNT1, OsNRAMP1, OsNRAMP5, OsNRAMP6, TaLCT1, YSL, P1B-ATPases, the CNGC gene family, DACCs, HCACs, and VICCs [1,14]. Lu et al. screened wheat cultivars, such as ‘Bainong207’, ‘Aikang58’, ‘Huaimai23’, and ‘Yannong21’, that produce high biomass and show high Cd accumulation in the straw, but low Cd accumulation in the grains [19]. Thus, Cd uptake by roots, translocation in shoots, and accumulation in grains are controlled by genetic factors in addition to environmental factors. However, the Cd uptake, accumulation, and translocation mechanisms of wheat are not clear; we need to better understand the influence mechanism of Cd absorption and transport on Cd accumulation, which is of great significance for solving cadmium pollution.
In our previous study, 102 wheat cultivars or materials were screened for grain Cd accumulation, and five low grain-Cd-accumulating wheat (LCA) and five high grain-Cd-accumulating wheat (HCA) were identified [20]. However, the mechanisms responsible for the differential accumulation of Cd in wheat grains remain unclear. In the present study, we conducted a greenhouse pot experiment to investigate the reasons for varietal differences in the five LCA and the five HCA by measuring Cd uptake, translocation, and distribution under three soil Cd concentrations at four growth stages. The objectives were (i) to investigate differences of grain Cd accumulation between LCA and HCA under different soil Cd concentrations, (ii) to understand the difference of Cd uptake, translocation, and accumulation between LCA and HCA, (iii) to elucidate the mechanisms responsible for low and high Cd accumulation in wheat grains.
2. Materials and Methods
2.1. Plant Materials
The five LCA and five HCA wheat materials used in the present study were previously screened by evaluating grain Cd accumulation among 102 wheat materials with rich genetic variation [20]. The LCA materials were designated L1 to L5, and the HCA materials were designated H1 to H5 (Table 1). The Cd concentration of these materials was relatively stable in the same environment, although the concentration may vary with the environment, such as under different soil Cd concentrations [21,22].

Table 1.
Wheat materials and allocated code numbers used in the study.
2.2. Soil Preparation and Experimental Treatments
The experimental soil was collected from cultivated farmland in Cang-shan Town, Deyang City, Sichuan Province, China, from the uppermost 15 cm of the soil layer. The soil (8 kg) was cleaned of debris, air dried, crushed, passed through a 2 mm sieve, and packed into pots before use. The soil pH was 7.92, total nitrogen was 0.77 g/kg, soil organic matter was 11.4 g/kg, soil available nitrogen was 54 mg/kg, soil rapidly available phosphorus was 4.9 mg/kg, soil readily available potassium was 112 mg/kg, soil Cd concentration was 0.3 mg/kg, and soil cation exchange capacity was 19.7 cmol/kg.
The pot experiment was conducted in a greenhouse at the Sichuan Academy of Agricultural Sciences (SAAS). The five LCA and the five HCA were subjected to three Cd treatments, namely, 0.30 (no addition of Cd; control), 1.5, and 7.5 mg/kg, representing unstressed Cd condition, light pollution and severe contamination as defined by soil contamination criteria, respectively [23]. Cd chloride (CdCl2·2.5H2O) solution was applied before sowing to ensure that the Cd concentration in the soil was 1.5 and 7.5 mg/kg. Each treatment comprised 12 replications. Each pot (height 30 cm, diameter 25 cm) was filled with 8.0 kg of soil. All treatments were supplemented with urea, calcium phosphate monobasic (Ca(H2PO4)2·H2O), and potassium chloride (KCl), which were analytical reagents. The standard fertilizer application was 0.2 g N, 0.15 g P2O5, and 0.15 g K2O per kilogram of soil. Five individual wheat seedlings per pot were retained. Tap water was used for irrigation by hand throughout the growth period, and other management practices were consistent with local field production.
2.3. Sample Collection
Plant samples were collected at four growth stages: jointing, booting, flowering, and maturity. All plants of each treatment were examined in triplicate (three pots) at each growth stage. The samples collected at the jointing and booting stages were divided into two parts (roots and stems + leaves), those at the flowering stage into the three parts (roots, stems + leaves, and glumes), and those at maturity into four parts (roots, stems + leaves, glumes, and grains). All samples were oven dried to a constant weight at 75 °C after deactivation at 105 °C for 30 min in the dryer (WGL-125BE, Tianjin Test Instrument Co., Ltd., Tianjin, China), and thereafter the dry weight was measured. The weighed samples were crushed by a grinder (FZ102, Tianjin Test Instrument Co., Ltd., Tianjin, China) and sieved with a 0.149 mm screen for the determination of the Cd concentration.
2.4. Determination of Soil Basic Properties and Cd Concentration in Tissues13
Basic properties of the air-dried experimental soil sample before sowing were determined following the method described by Bao [24]. Samples were digested with mixed acid (HNO3/HClO4, 4:1 [v/v]), and the Cd concentration was determined by inductively coupled plasma–mass spectrometry (ICP-MS) with a Nexlon2000 instrument (PerkinElmer, Waltham, MA, USA).
2.5. Calculation of Cd Uptake, Translocation, and Accumulation
Uptake, distribution, translocation, and accumulation of Cd were evaluated using the following indicators. The phytoaccumulation factor (PAF) was used to evaluate the capability for Cd accumulation from the soil to the grain, and was derived by dividing the grain Cd content by the soil Cd concentration. The Cd accumulation was calculated by multiplying the dry weight by the Cd concentration. The Cd uptake capacity at different growth stages was evaluated by determining the increase in Cd accumulation during the specific growth stage, calculated by subtracting the Cd accumulation in the following growth stage from the Cd accumulation in the preceding growth period. The Cd distribution was assessed by measuring the Cd accumulation in different organs, and the percentage Cd accumulation was calculated. The Cd translocation capacity was evaluated using the translocation coefficient and translocation. The soil–root Cd translocation coefficient was evaluated using the root: soil Cd concentration ratio; the Cd translocation coefficient from roots to stems + leaves was evaluated using the stems + leaves: root Cd concentration ratio; the Cd translocation coefficient from stems + leaves to glumes was assessed the glume: stems + leaves Cd concentration ratio; and the Cd translocation coefficient from glumes to grains used the grain: glume Cd concentration ratio. The Cd translocation between different organs was evaluated using the sum of the increase in Cd accumulation in one organ and Cd transported to the other organ.
2.6. Data Analysis
Statistical analyses were performed using Excel 2019 and SPSS statistical software (version 26.0, IBM Corp., Armonk, NY, USA). Means were used to evaluate the difference between LCA and HCA. Student’s t-test was used to assess the significance of differences between LCA and HCA (p < 0.05).
3. Results
3.1. Grain Cd Concentration and PAF
The grain Cd concentrations of LCA and HCA remained relatively stable under the three soil Cd concentrations (Figure 1a). The grain Cd concentration of LCA was 0.163, 1.28 and 2.92 mg/kg under 0.3, 1.5 and 7.5 Cd soil concentrations, respectively. In contrast, the grain Cd concentration in HCA was 2.92 times (0.3 Cd soil), 1.61 times (1.5 Cd soil), and 1.40 times (7.5 Cd soil) more than that of LCA, and the corresponding grain Cd concentration in HCA was 0.478, 2.07, and 4.07 mg/kg, respectively. The grain Cd contents of LCA were significantly lower than those of HCA under the same soil Cd concentration, which was observed consistently for each soil Cd concentration.
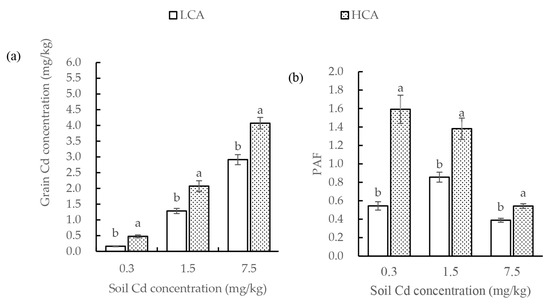
Figure 1.
(a) Grain Cd concentration and (b) Cd phytoaccumulation factor (PAF) of low grain-Cd-accumulating (LCA) and high grain-Cd-accumulating (HCA) wheat under three soil Cd concentrations. Bars represent the average, and error bars indicate the standard error (SE). Different lowercase letters above bars indicate a significant difference between LCA and HCA (p < 0.05).
Cd supply affected the grain Cd concentration (Figure 1a). With an increase in Cd concentration of the soil, the grain Cd concentration of LCA and HCA increased significantly. Based on the overall trend, the grain Cd content of HCA increased more significantly than that of LCA (Figure 1a). Some wheat readily accumulated Cd in the grains, such as HCA materials H1-H5. Even when grown in the non-contaminated soil containing 0.3 mg/mg Cd, the grain Cd concentration of HCA ranged from 0.401 to 0.625 mg/kg, and exceeded the Cd limits for the national food safety (0.2 mg/kg).
The PAF of LCA and HCA wheat differed significantly under the three soil Cd concentrations, with that of LCA significantly lower than that of HCA under the same soil Cd concentration (Figure 1b). The PAF of LCA was 0.545, 0.856 and 0.389 under 0.3, 1.5 and 7.5 Cd soil concentrations, respectively. In contrast, the PAF in HCA was 2.92 times (0.3 Cd soil), 1.61 times (1.5 Cd soil) and 1.40 times (7.5 Cd soil) that of LCA, and the corresponding PAF in HCA was 1.59, 1.38 and 0.543. The PAF of HCA was highest under the low-soil Cd treatment (0.3 mg/kg), and the value decreased significantly with an increase in soil Cd concentration. The PAF of LCA also showed a downward trend with an increase in soil Cd concentration, but the decline was much more gradual than that of HCA, and the highest PAF value of LCA was detected under the moderate soil Cd concentration (1.5 mg/kg).
3.2. Dry-Matter Accumulation
Compared with the average value of LCA and HCA, dry-matter accumulation and distribution differed significantly between LCA and HCA. The growth and dry-matter accumulation of LCA was significantly higher than that of HCA under each soil Cd concentration.
The dry weight per plant differed significantly between LCA and HCA, and the dry weight of entire plants of LCA was generally higher than that of HCA at the four growth stages under the three soil Cd concentrations (Figure 2a). As growth progressed, the difference in dry weight per plant between LCA and HCA increased. The greatest difference in whole-plant dry weight between LCA and HCA was observed at maturity under the three Cd concentrations, which were 6.54 g (0.3 Cd soil), 7.04 g (1.5 Cd soil) and 4.62 g (7.5 Cd soil). The dry matter per plant of LCA and HCA increased during each growth stage. The important periods for the difference in dry-matter accumulation between the two groups were at the seedling–jointing stage and the flowering–maturity stage, and the difference in dry-matter accumulation was most distinct at the flowering–maturity stage. The dry matter per plant of LCA increased 1.73 times (0.3 Cd soil), 1.70 times (1.50 Cd soil), and 1.60 times (7.5 Cd soil) more than that of HCA at the seedling–jointing stage, respectively. The dry matter per plant of LCA increased at the flowering–maturity stage 4.53 g (0.3 Cd soil), 5.99 g (1.5 Cd soil), and 3.37 g (7.5 Cd soil), which was more than that of HCA. In addition, the correlation analysis showed that grain Cd concentration was negatively correlated with the biomass per plant, with correlation coefficients of 0.71, 0.71, and 0.73 under 0.3, 1.5, and 7.5 mg/kg Cd soil concentrations, respectively.
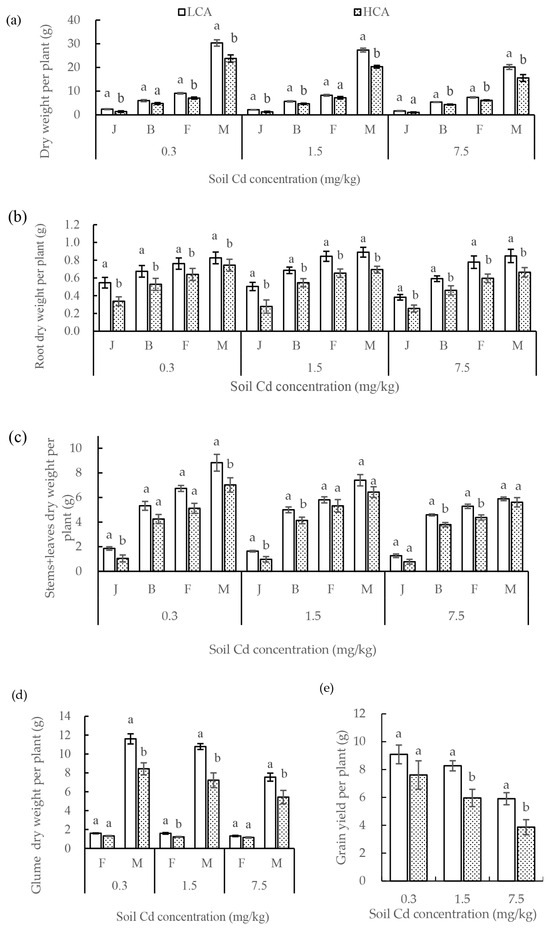
Figure 2.
(a) Dry weight per plant, (b) root dry weight per plant, (c) stems + leaves dry weight per plant, (d) glume dry weight per plant, and (e) grain yield per plant of low grain-Cd-accumulating wheat (LCA) and high grain-Cd-accumulating wheat (HCA) at four growth stages under three soil Cd concentrations. The growth stages are the jointing stage (J), booting stage (B), flowering stage (F), and maturity stage (M). Different lowercase letters above bars indicate a significant difference between LCA and HCA (p < 0.05).
Root growth of LCA and HCA differed significantly, and that of LCA was superior to that of HCA under each soil Cd concentration in each growth period (Figure 2b). As growth progressed, the difference of root dry weight per plant between LCA and HCA decreased, the greatest difference between LCA and HCA was observed during the jointing stage under the 0.3 and 1.5 mg/kg soil Cd concentrations. The root dry weight per plant of LCA was 1.62 times (0.3 Cd soil) and 1.81 times (1.5 Cd soil) more than that of HCA at the jointing stage, respectively. Under the highest soil Cd concentration (7.5 Cd soil), the difference in root dry weight between LCA and HCA increased with the progression of growth, which was the greatest at the maturity stage. The root dry weight per plant of LCA was 0.18 g more than that of HCA at the maturity stage under 7.5 mg/kg Cd soil concentrations. Root growth of LCA and HCA was concentrated before the jointing stage, during which their root dry weight per plant increased most significantly, and the difference in root weight between LCA and HCA was the most highly significant. Root dry weight per plant of LCA increased significantly higher than that of HCA at the seedling–jointing stage, and that of LCA was 1.62 times (0.3 Cd soil), 1.81 times (1.5 Cd soil), and 1.49 times (7.5 Cd soil) higher. Grain Cd concentration was negatively correlated with root dry weight per plant, with correlation coefficients of 0.42, 0.60, and 0.61 under 0.3, 1.5, and 7.5 Cd soil concentrations, respectively.
The shoot dry matter per plant of LCA was superior to that of HCA, including the stems + leaves, glumes, and grains, under each soil Cd concentration throughout the growth period (Figure 2c). In 0.3 and 1.5 Cd soil concentrations, the difference in stems + leaves dry matter accumulation between LCA and HCA increased with the progression of growth, with the most distinct difference detected at maturity, stems + leaves of LCA was 1.80 g (0.3 Cd soil) and 0.97 g (1.5 Cd soil) more than that of HCA. When soil Cd concentration was 7.5 mg/kg, the difference in stems + leaves per plant between LCA and HCA was the largest at the booting-flowering stage, with 0.91 g. Increase in stems + leaves dry weight per plant between LCA and HCA was most highly significant during the jointing–booting stages. When the soil Cd concentration exceeded the soil Cd safety standard, the difference in stems + leaves dry weight accumulation per plant showed a downward trend with the progression of growth. At the flowering stage, the difference in glume dry matter per plant was small, but thereafter the difference increased significantly at maturity (Figure 2d). The grain yield per plant of both LCA and HCA decreased with the increase in soil Cd concentration (Figure 2e). Compared with the control (0.3 mg/kg Cd), the grain yield per plant of LCA decreased to a lesser degree than that of HCA.
3.3. Cd Uptake
Cd was translocated from the soil to the grains through the roots. The Cd uptake capacity of LCA and HCA was evaluated by determining the increase in Cd accumulation during early and advanced growth stages. The influence of Cd absorption during each growth stage on Cd accumulation at maturity was evaluated by calculating the percentage contribution to Cd accumulation.
Comparison of the average Cd absorption per plant for LCA and HCA at the same growth stage revealed that Cd absorption by both LCA and HCA differed among the growth stages (Figure 3a). The average Cd absorption per plant for LCA under the three Cd concentrations was 1.60 times, 0.81 times, 1.02 times, and 0.50 times more than that of HCA before jointing, at the jointing–booting, booting–flowering, and flowering–maturity stages, respectively. The average Cd absorption per plant for LCA was higher than that for HCA before the jointing stage, and was lower than that for HCA after the jointing stage. The crucial periods determining the difference in Cd absorption between LCA and HCA were before the jointing and maturity stages. Cd absorbed by LCA was 1.92 times (0.3 mg/kg soil Cd), 1.86 times (1.5 mg/k soil Cd), and 1.46 times (7.5 mg/kg soil Cd) more than that absorbed by HCA before the jointing stage. Cd uptake per plant of LCA was 4.18, 6.82 and 11.50 µg, which were less than that of HCA under 0.3, 1.5 and 7.5 Cd soil concentrations, respectively.
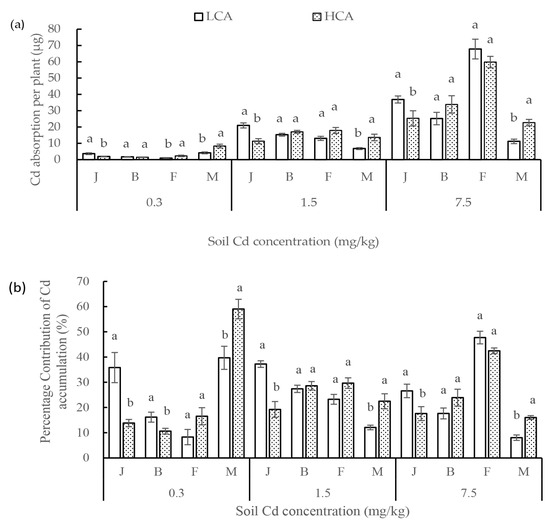
Figure 3.
(a) Cd absorption of low grain-Cd-accumulating wheat (LCA) and high grain-Cd-accumulating wheat (HCA) during four growth stages under three soil Cd concentrations. (b) Percentage contribution of Cd absorption during each growth stage to Cd accumulation at the maturity stage. The growth stages comprise emergence to the jointing stage (J), booting stage (B), flowering stage (F), and maturity stage (M). Different lowercase letters above bars indicate a significant difference between LCA and HCA (p < 0.05).
The contribution of Cd absorption to Cd accumulation at maturity differed between LCA and HCA in different growth stages, which was strongly associated with the amount of Cd absorbed (Figure 3b). In non-Cd-polluted soil, Cd absorption by LCA and HCA during flowering–maturity made the greatest contribution to Cd accumulation at maturity (39.71% and 59.01%, respectively). In moderately Cd-polluted soil (1.5 mg/kg), Cd absorption by LCA contributed the most to Cd accumulation (37.24%) before the jointing stage, whereas Cd absorption by HCA contributed the most to Cd accumulation during the booting–flowering stages (29.67%). Under strongly Cd-polluted soil (7.5 mg/kg), Cd uptake by LCA and HCA contributed most to Cd accumulation during the booting–flowering stages, during which the contributions of LCA and HCA were 47.75% and 42.48%, respectively. The average percentage contribution of Cd absorption per plant for LCA was significantly higher than that of HCA before the jointing stage, but was lower than that of HCA at flowering–maturity stage. The contribution rates of Cd absorption by LCA were 2.59 times (0.3 mg/kg soil Cd), 1.94 times (1.5 mg/kg soil Cd), and 1.51 times (7.5 mg/kg soil Cd) more than that of HCA before the jointing stage. The percentage contributions of Cd accumulation by LCA at the flowering–maturity stage was 67.26%, 53.80%, and 50.19% under 0.3, 1.5, and 7.5 mg/kg soil Cd concentrations. The critical periods for the difference in percentage contribution between LCA and HCA were before the jointing stage and the flowering–maturity stages.
3.4. Cd Distribution and Accumulation
The difference in grain Cd accumulation and the percentage distribution of Cd between LCA and HCA were related to soil Cd concentration (Figure 4a–f). Under non-Cd-polluted soil (0.3 mg/kg), grain Cd accumulation and the percentage distribution of Cd in LCA were significantly lower than those of HCA, grain Cd accumulation in LCA was 40.65% of that in HCA, and the percentage distribution of Cd in LCA grains was 54.87% of that in HCA. With the increase in soil Cd concentration, the difference in grain Cd accumulation and percentage distribution of Cd between LCA and HCA was not significant. Grain Cd accumulation in LCA was 86.67% (1.5 mg/kg soil Cd) and 110.57% (7.5 mg/kg soil Cd) of that in HCA. Distribution percentage of grain Cd in LCA was 93.41% (1.5 Cd soil) and 110.94% (7.5 Cd soil) of that in HCA. Grain Cd accumulation was calculated by multiplying the grain Cd concentration.
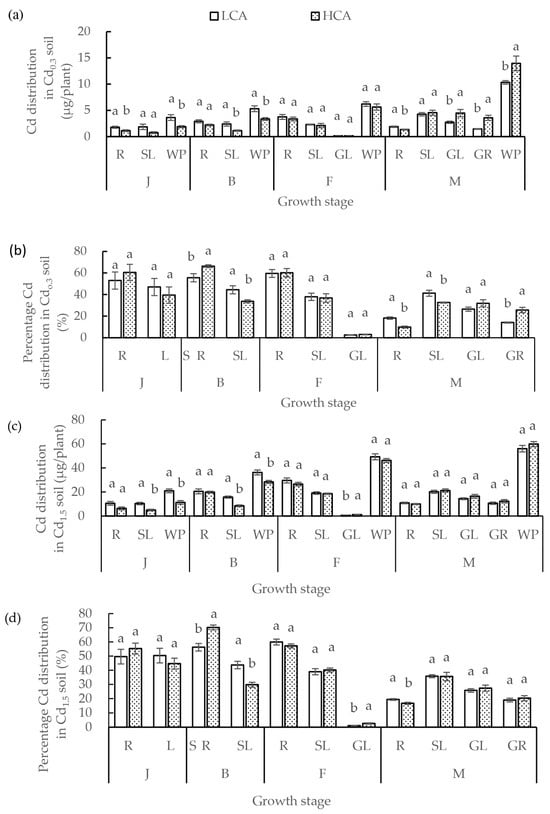
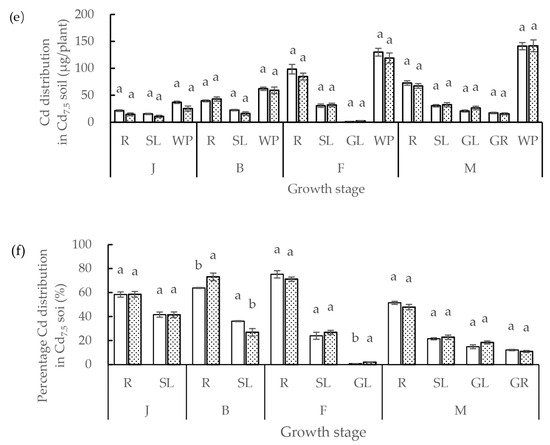
Figure 4.
(a) Cd distribution and (b) percentage distribution of Cd in different organs of low grain-Cd-accumulating wheat (LCA) and high grain-Cd-accumulating wheat (HCA) during different growth stages under 0.3 mg/kg soil Cd treatment. (c) Cd distribution and (d) percentage distribution of Cd in different organs of LCA and HCA during different growth stages under 1.5 mg/kg soil Cd treatment. (e) Cadmium distribution and (f) percentage distribution of Cd in different organs of LCA and HCA during different growth stages under 7.5 mg/kg soil Cd treatment. The Cd distributions of different organs were divided into the whole plant (WP), roots (R), stems + leaves (SL), glumes (GL), and grains (GR). The different growth stages are the jointing stage (J), booting stage (B), flowering stage (F) and maturity stage (M). Different lowercase letters above bars indicate a significant difference between LCA and HCA (p < 0.05).
The distribution of Cd accumulation differed significantly between LCA and HCA in different organs (Figure 4a–f). Under different Cd concentrations, about 50% Cd uptake by the roots from the soil accumulated in the roots. Before the flowering stage, Cd accumulation in LCA roots was higher than that in HCA roots, but the percentage distribution of Cd accumulation in LCA roots was lower than that in HCA roots. After the flowering stage, Cd accumulation and the percentage Cd distribution in the roots of LCA were higher than those of HCA. Under a high Cd concentration, most of the Cd absorbed remained in the roots. When soil Cd concentration was 7.5 mg/kg, the distribution percentage of root Cd between LCA and HCA was 51.48% and 47.86% at the maturity stage, root Cd accumulation in LCA was 1.08 times that of HCA, and root Cd distribution of LCA was 1.07 times that of HCA. In addition, under the three soil Cd concentrations, Cd accumulation and the percentage Cd distribution in LCA stems + leaves were higher than those of HCA before the flowering stage, whereas Cd accumulation in LCA stems + leaves was lower than that in HCA after the flowering stage. The stems + leaves Cd accumulation in LCA at the mature stage was 93.64% (0.3 mg/kg), 95.05% (1.5 mg/kg), and 93.90% (7.5 mg/kg) of that in HCA. The distribution ratio of Cd accumulation in LCA stems + leaves was 1.26 times (0.3 mg/kg), 1.01 times (1.5 mg/kg), and 0.94 times (7.5 mg/kg) that of HCA at the mature stage. Under each soil Cd concentration, the Cd accumulation and percentage Cd distribution in LCA glumes were lower than those of HCA. Furthermore, HCA accumulated a higher proportion of Cd in the glumes than LCA.
The Cd content in different organs of LCA and HCA differed at the four growth stages (Figure 4a–f). Most of the Cd absorbed per plant was accumulated during the seedling and jointing stages, and Cd accumulation by LCA was greater than that by HCA during these two growth stages. The Cd content in the stems + leaves was higher in the seedling, jointing, and maturity stages than in the booting and flowering stages. From the seedling stage to the maturity stage, root Cd accumulation and percentage Cd accumulation first increased and thereafter decreased; the peak root Cd accumulation was at the flowering stage, while the peak root percentage Cd accumulation was at the booting stage. As growth progressed, Cd accumulation in the stems + leaves decreased, and stem + leaves Cd accumulation of LCA was higher than that of HCA at the seedling, jointing, and maturity stages. With the progression of growth, Cd accumulation in the spike increased. The Cd accumulation amount and percentage Cd accumulation of HCA were higher than those of LCA during the entire growth period.
3.5. Cd Translocation
The differences in Cd transport coefficients between LCA and HCA were related to soil Cd concentration; the critical difference between LCA and HCA in Cd transport was at the maturity stage (Table 2). Under a low soil Cd concentration (0.3 mg/kg), the Cd transport coefficient was significantly different between LCA and HCA after the flowering stage, and the transport coefficient of LCA from the soil to the roots was significantly higher than that of HCA. The Cd transport coefficients for LCA and HCA from soil to root were 7.69 and 6.01, respectively. The transport coefficients of LCA from the roots to the stems + leaves, from the stems + leaves to the glumes, and from the glumes to the grains were significantly lower than those of HCA at the maturity stage. When the soil Cd concentration was 1.5 mg/kg, the differences in the transport coefficients between LCA and HCA were not significant throughout the growth stages. When the soil Cd concentration reached 7.5 mg/kg, the transport coefficient of LCA from the stems + leaves to the glumes was significantly lower than that of HCA, the transport coefficient of LCA from the glumes to the grains was significantly higher than that of HCA at the maturity stage. The transport coefficient was the target organ in the initial organ Cd concentration ratio. The Cd uptake by LCA was mainly stored in its roots, stems and leaves, and the Cd concentration of LCA in the stems + leaves was higher than that of HCA at maturity, while the Cd concentration of LCA in the glumes was lower than that of HCA. The transport coefficient from the stems + leaves to the glumes of LCA was lower than that of HCA.
Table 2.
Cd transport coefficient of LCA and HCA in different organs during different growth stages under different soil Cd treatments.
The difference between LCA and HCA in Cd transport was significant under the different soil Cd treatments throughout the entire growth period, especially in low soil Cd concentrations, such as 0.3 mg/kg and 1.5 mg/kg (Figure 5). The Cd transport difference between LCA and HCA was related to soil Cd concentration. When soil Cd concentration was 0.3 mg/kg, significant differences were observed between LCA and HCA at the jointing stage, flowering stage and maturity stage, especially the Cd transport differences from soil to roots. Cd transport of LCA from soil to roots before the jointing stage was significantly higher than that of HCA under soil Cd 0.3 mg/kg. Meanwhile, Cd transport of LCA from root to stems + leaves, from stems + leaves to glumes, and from glumes to grains was all significantly less than that of HCA at the maturity stage. When the soil Cd concentration was 1.5 mg/kg, the Cd transport differences between LCA and HCA were mainly in the transport from soil to roots, from roots to stems + leaves, and from stems + leaves to glumes. When the soil Cd concentration was 7.5 mg/kg, there was no significant difference in Cd transport between LCA and HCA.
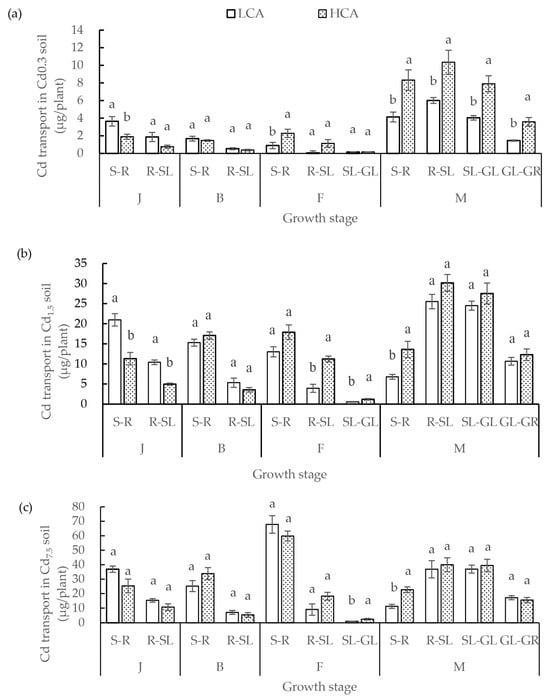
Figure 5.
(a) Cd transport of low grain-Cd-accumulating wheat (LCA) and high grain-Cd-accumulating wheat (HCA) in different organs during different growth stages under 0.3 mg/kg soil Cd treatment. (b) Cd transport of LCA and HCA in different organs during different growth stages under 1.5 mg/kg soil Cd treatment. (c) Cd transport of LCA and HCA in different organs during different growth stages under 7.5 mg/kg soil Cd treatment. Cd transport included transport from the soil to the roots (S-R), roots to stems + leaves (R-SL), stems + leaves to glumes (SL-GL), and glumes to grains (GL-GR). The different growth stages are the jointing stage (J), booting stage (B), flowering stage (F), and maturity stage (M). Different lowercase letters above bars indicate a significant difference between LCA and HCA (p < 0.05).
4. Discussion
Cd is harmful to many organisms. Its toxicity is 2–20 times higher than that of other metals. An excessive amount of Cd can harm plants and animals, and also threaten human health through the food chain [25]. In 2014, the Chinese former Ministry of Environmental Protection and the Ministry of Land and Resources jointly published the “National Soil Pollution Survey Communique”, which specified that a Cd concentration of 7% of the survey sites exceeded the national safety standard, and Cd pollution was the most serious [23]. Cd pollution is a major concern in China and numerous other countries in the world [25]. Solving Cd contamination is an important environmental objective. In 2022, following the decision and deployment of the Party Central Committee and the State Council, the third national soil survey in China was conducted to comprehensively document and understand the country’s soil resources, and soil Cd concentration was surveyed. Therefore, understanding Cd uptake, transport, distribution and accumulation is crucial for reducing the risk of Cd pollution.
The five HCA and five LCA wheat used in the present study were selected from among 102 wheat materials with high genetic diversity exposed to 0.4, 5, and 20 mg Cd/kg soil in 2007 [20]. The grain Cd concentration of the ten selected wheat cultivars was measured in plants grown under four soil Cd concentrations of 0.28, 5, 10, and 20 mg/kg, which yielded stable results in 2008 [21]. In the present study, the grain Cd concentration of LCA was lower than that of HCA under the same soil Cd concentration (0.3, 1.5, and 7.5 mg/kg). Meanwhile, the grain Cd concentration of LCA and HCA increased significantly with the increase in soil Cd concentration in this study. The present results and those of previous studies show that the Cd concentration in grains of HCA is stably high, whereas grains of LCA accumulate a consistently low Cd concentration under different soil Cd concentrations and at different times. Therefore, the grain Cd concentration in wheat may be controlled by genes, which may be inherited continuously. Therefore, selecting or breeding cultivars with a low grain-Cd concentration is feasible, which can reduce the influence of Cd pollution on food safety. This view has been widely recognized by many of my peers [9,10].
Grain Cd concentration was highly correlated with biomass, especially the early biomass. In this study, the growth of the wheat plants was an external response to the soil Cd concentration, the accumulation of roots, stems + leaves, and biomass of LCA was significantly higher than that of HCA before the jointing stage. However, the accumulation of stems + leaves and total dry weight per plant for LCA was less than that of HCA at the jointing–booting, booting–flowering, and flowering–maturity stages. These results indicated that vigorous early growth contributed importantly to the grain Cd concentration. In this study, grain Cd concentration was highly negatively correlated with biomass under Cd stress by correlation analysis. The biomass was higher, and the grain Cd content was lower. Growth and biomass of wheat were better under Cd stress, indicating Cd tolerance was stronger. Vigorous early growth improved the ability of the plant to tolerate an adverse environment. LCA produces more biomass than HCA in the early stage. LCA absorbs more nutrients and harmful substances, such as Cd, which are stored in the vegetative organs. The photosynthetic organs were less poisoned by Cd, the grain yield was less affected by Cd. On the other hand, under cadmium stress, the threshold of Cd capacity in plants is certain, so the larger the biomass, the higher the grain yield and the lower the grain Cd concentration. Therefore, biomass can reduce Cd toxicity, grain Cd concentration and the influence of Cd on reproductive growth. Previous studies on grain reported similar results [13]. High-yielding genotypes of spring wheat had low levels of Cd [26].
The difference in grain Cd concentration was associated with Cd uptake at the different growth stages. In this study, Cd uptake by the roots of LCA was greater than that by HCA at the jointing and flowering stages, was less than that of HCA at the booting and maturity stages and was less than that of HCA throughout the entire reproductive period. The most critical periods for the difference in Cd absorption between LCA and HCA were the jointing and maturity stages. The result indicated that LCA absorbs greater amounts of Cd during the vegetative growth period, but this did not affect its grain Cd concentration, grain accumulation, or dry matter per plant. Under Cd stress, LCA has a stronger tolerance to Cd than HCA. Even though it absorbed more Cd in its body, the impact on its vegetative growth and reproductive growth was less than that of HCA. The contribution of Cd absorbed at the flowering–maturity stages was greater than at other growth stages. Tang et al. reported that Cd absorbed by peanut plants during podding constituted 73.7% of the peanut kernel Cd content, whereas the contribution of absorption at the flowering and seedling stages was 22.2% and 4.1%, respectively [27]. These findings provide one explanation for why LCA absorbed greater amounts of Cd than HCA at the jointing stage and accumulated less Cd in the grain. These proved that early Cd uptake and accumulation played a limited role in grain Cd accumulation. In the study, LCA absorbed less Cd than HCA from germination to maturity. This seemed to indicate that LCA might also be due to their relatively low Cd uptake, as they had less Cd transported to grain, resulting in low Cd concentration in grain. Kubo et al. also proved that low-Cd varieties absorbed less Cd than the standard variety in the pot experiment [28]. However, Harris and Taylor showed that whole-plant Cd uptake among the durum wheat NILs with different grain Cd accumulations had no difference in cadmium absorption during the whole growth period [29]. In this study, Cd uptake of LCA was 3.62, 3.79 and 0.6 µg less than that of HCA under 0.3, 1.5 and 7.5 Cd soil concentrations, respectively. The difference between LCA and HCA became smaller with the increase in the soil Cd concentration. It can be inferred that there was a threshold for Cd absorption and Cd tolerance at the same concentration. According to various research results, it can be inferred that the research conditions vary, the thresholds will differ, and the trends will also vary, resulting in different research outcomes.
The difference in grain Cd accumulation was further associated with Cd translocation and distribution. Cd is absorbed by the roots and is transported in the xylem [30]. Harris and Taylor [18] suggested that Cd accumulation in durum wheat grains may be limited by direct control of root-to-shoot Cd translocation during grain filling, or by controlling the size of shoot Cd pools that can be remobilized into grains. Cd is transported into shoots and accumulates in stems or leaves and in grains through the phloem [31]. In the present study, the Cd concentration in the roots did not differ significantly between LCA and HCA during the four growth stages, whereas the Cd content translocated to the stem, leaves, spike, and grains was significantly different. Most of the Cd absorbed by the roots of LCA remained in the roots or was translocated to the stems + leaves, whereas in HCA, a greater amount of Cd was translocated to the glumes and grains in the ear. Arduini et al. suggested that high accumulation of Cd may also be attributable to active Cd translocation to the shoot and grains [32].
Many factors influence grain Cd accumulation in wheat, including genetic factors, environmental factors, such as soil Cd concentration, pH, climatic conditions, etc., and agricultural management and atmospheric subsidence [1,33]. The associated genes for Cd uptake, transport and accumulation have been reported. For example, TpNRAMP5 and Nramp5 increase the Cd content of roots and shoots in Polish wheat [34,35], and the knockout of TaNRAMP5 can reduce 33.36% grain Cd concentration [34]. OsNRAMP1 was able to transport Cd, and the knockout of OsNRAMP1 resulted in significant decreases in root Cd uptake of rice [36]. TpIRT1 was important in mediating the Cd uptake and translocation, with direct implications for wheat yield potential [37]. OsHMA3 also decreases grain Cd accumulation [38]. A total of 339 Cd-induced differentially expressed genes were found [39]. Grain Cd accumulation in wheat may be associated with atmospheric deposition, wheat leaves can directly absorb atmospheric Cd through the stomata. The flag leaf is the crucial leaf involved in grain Cd accumulation and controls Cd transport from leaves to grains during the early grain-filling period [40,41]. QCdc.4B-kita, QCdc.6B-kita1, and QCdc.6B-kita2 for low grain Cd concentration were detected [42]. OsABCC9, a C-type ABC transporter, mediates Cd tolerance and accumulation in rice [43].
Although the mechanisms of differences in grain Cd accumulation may differ, previous studies have varied owing to the use of different plant materials, different experimental environments, and other factors. Nevertheless, the foregoing results improved our knowledge of the mechanism of Cd accumulation in wheat grains.
5. Conclusions
Grain Cd concentration of HCA was significantly higher than that of LCA under different Cd concentrations, which can be used to breed low-Cd-accumulating wheat cultivars and analyze the mechanisms related to Cd accumulation. Grain Cd concentration was negatively correlated with the biomass; the biomass was greater under Cd stress, Cd tolerance was greater, and grain Cd concentration was lower. Early biomass can be used as a reference index for selecting Cd tolerance and low grain-Cd-accumulating materials.
The critical periods governing Cd uptake were at the jointing stage and the flowering–maturity stage. LCA absorbed greater amounts of Cd during the vegetative growth period, but absorbed less Cd during the reproductive growth period, and LCA absorbed less Cd than HCA from germination to maturity. More Cd absorbed by LCA was retained in the roots or stems + leaves, while more Cd absorbed by HCA was translated to grain and glums. LCA transferred more Cd from soil to plant in the early stage than HCA, but LCA transferred less Cd from soil to root in the later period.
Author Contributions
Conceptualization, Y.Y., H.W. (Huiting Wei) and H.W. (Hongshen Wan); methodology, Y.Y., H.L. and H.W. (Huiting Wei); software, Y.Y., H.L. and F.Y.; validation, F.Y.; formal analysis, H.L. and C.X.; investigation, H.L., C.X., W.H., M.Y., Q.X., H.W. (Huiting Wei)., J.H. and J.Y.; resources, Y.Y., J.H. and H.W. (Hongshen Wan).; data curation, Y.Y., H.L., C.X., W.H. and Q.X.; writing—original draft preparation, Y.Y.; writing—review and editing, Y.Y. and M.Y.; visualization, F.Y.; supervision, Y.Y. and H.W. (Hongshen Wan).; project administration, Y.Y. and J.Y.; funding acquisition, Y.Y. and H.W. (Hongshen Wan). All authors have read and agreed to the published version of the manuscript.
Funding
The study was supported by the Natural Science Foundation of Sichuan Province (no. 2024NSFSC0336; 2023NSFSC1925), the Open Foundation of the Education Ministry (no XNYB24-03), and a project of Sichuan Academy of Agricultural Sciences (no. 2025-11).
Institutional Review Board Statement
This article does not contain any studies with human participants or animals performed by any of the authors.
Data Availability Statement
The original data presented in the study are included in the article; further inquiries can be directed to the corresponding author.
Acknowledgments
We are grateful to Dinghui Liu and his team for providing the experimental site, Jun Li for providing the experimental plant materials, Wunyun Yang for technical guidance, and colleagues at the analytical testing center for testing the samples. We thank Robert McKenzie, from Edanz (https://jp.edanz.com/ac) access date on 1 April 2025 for editing the English text of a draft of this manuscript.
Conflicts of Interest
The authors declare no competing financial interests.
References
- Abedi, T.; Mojiri, A. Cadmium uptake by wheat (Triticum aestivum L.), an overview. Plants 2020, 9, 500. [Google Scholar] [CrossRef] [PubMed]
- Xu, J.; Wang, M.; Zhang, R.; Wu, L. Toxicity of cadmium pollution in soil to organisms, a review. Asian J. Ecotox. 2020, 15, 82–91. (In Chinese) [Google Scholar]
- Li, H.; Luo, N.; Li, Y.; Cai, Q.; Li, H.; Mo, C.; Wong, M. Cadmium in rice, transport mechanism, influencing factors, and minimizing measures. Environ. Pollut. 2017, 224, 622–630. [Google Scholar] [CrossRef]
- Cheng, Y.; Bao, Y.; Chen, X.; Yao, Q.; Wang, C.; Chai, S.; Zeng, J.; Fan, X.; Kang, H.; Sha, L.; et al. Different nitrogen forms differentially affect Cd uptake and accumulation in dwarf Polish wheat (Triticum polonicum L.) seedlings. J. Hazard. Mater. 2020, 400, 123209. [Google Scholar] [CrossRef]
- Liu, X.; Tian, G.; Jiang, D.; Zhang, C.; Kong, L. Cadmium (Cd) distribution and contamination in Chinese paddy soils on national scale. Environ. Sci. Pollut. Res. 2016, 23, 17941–17952. [Google Scholar] [CrossRef]
- Zhou, M.; Li, Z. Recent advances in minimizing cadmium in wheat. Toxics 2022, 10, 187. [Google Scholar] [CrossRef]
- Genchi, G.; Sinicropi, M.; Lauria, G.; Carocci, A.; Catalano, A. The effects of cadmium toxicity. Int. J. Environ. Res. Public Health 2020, 17, 3782. [Google Scholar] [CrossRef]
- Kumar, S.; Sharma, A. Cadmium toxicity, effects on human reproduction and fertility. Rev. Environ. Health 2019, 34, 327–338. [Google Scholar] [CrossRef]
- Bai, L.; Ding, S.; Li, X.; Ning, C.; Liu, H.; Sun, M.; Liu, D.; Zhang, K.; Li, S.; Yu, X.; et al. Low-Cadmium wheat cultivars limit the enrichment, transport and accumulation of cadmium. Agronomy 2024, 14, 1191. [Google Scholar] [CrossRef]
- Chi, Y.; Li, F.; Tam, N.; Liu, C.; Ouyang, Y.; Qi, X.; Li, W.; Ye, Z. Variations in grain cadmium and arsenic concentrations and screening for stable low-accumulation rice cultivars from multi-environment trials. Sci. Total. Environ. 2018, 643, 1314–1324. [Google Scholar] [CrossRef]
- He, Z.; Zhuang, Q.; Cheng, S.; Yu, Z.; Zhao, Z.; Liu, X. Wheat production and technology improvement in China. J. Agric. 2018, 8, 99–106. (In Chinese) [Google Scholar]
- Sterckman, T.; Thomine, S. Mechanisms of cadmium accumulation in plants. Crit. Rev. Plant Sci. 2020, 39, 322–359. [Google Scholar] [CrossRef]
- Liang, X.; Strawn, D.; Chen, J.; Marshall, J. Variation in cadmium accumulation in spring wheat cultivars: Uptake and redistribution to grain. Plant Soil 2017, 421, 219–231. [Google Scholar] [CrossRef]
- Hu, J.; Chen, G.; Xu, K.; Wang, J. Cadmium in cereal crops: Uptake and transport mechanisms and minimizing strategies. J. Agric. Food Chem. 2022, 70, 5961–5974. [Google Scholar] [CrossRef]
- Park, H.; Kim, S.; Jung, K.; Lee, S.; Choi, Y.; Owens, V.; Kumar, S.; Yun, S.; Hong, C. Cadmium phytoavailability from 1976 through, changes in soil amended with phosphate fertilizer and compost. Sci. Total Environ. 2021, 762, 143132. [Google Scholar] [CrossRef]
- Greger, M.; Löfstedt, M. Comparison of uptake and distribution of cadmium in different cultivars of bread and durum wheat. Crop Sci. 2004, 44, 501–507. [Google Scholar] [CrossRef]
- Zhang, D.; Zhou, H.; Shao, L.; Wang, H.; Zhang, Y.; Zhu, T.; Ma, L. Root characteristics critical for cadmium tolerance and reduced accumulation in wheat (Triticum aestivum L.). J. Environ. Manag. 2022, 305, 114365. [Google Scholar] [CrossRef]
- Harris, M.; Taylor, G. Cadmium uptake and translocation in seedlings of near isogenic lines of durum wheat that differ in grain cadmium accumulation. BMC Plant Biol. 2004, 4, 4. [Google Scholar] [CrossRef]
- Lu, M.; Cao, X.; Pan, J.; Li, T.; Khan, M.; Gurajala, H.; He, Z.; Yang, X. Identification of wheat (Triticum aestivum L.) genotypes for food safety on two different cadmium contaminated soils. Environ. Sci. Pollut. Res. 2020, 27, 7943–7956. [Google Scholar] [CrossRef]
- Yang, Y.; Zhang, Q.; Zhang, J.; Tian, L.; Lei, J.; Yu, H.; Yang, W. Genotypic differences of cadmium accumulation in Triticum aestivum and screening of low-accumulation material. Chin. Agric. Sci. Bull. 2010, 26, 342–346. (In Chinese) [Google Scholar]
- Yang, Y.; Zhang, Q.; Yang, W.; Tian, L.; Lei, J.; Zhang, J.; Li, J. Effect of cadmium stress on yield and yield components of different wheat genotypes. Plant Nutr. Fertil. Sci. 2011, 17, 532–538. (In Chinese) [Google Scholar]
- Yang, Y.; Wan, H.; Ye, M.; Hu, W.; Xiao, C.; Yang, F.; He, J.; Lei, J.; Yang, J.; Chen, C.; et al. Grain nutrient characteristics of different grain cadmium accumulation wheat under different cadmium environments. J. Sichuan Agric. Univ. 2024, 42, 762–770+799. (In Chinese) [Google Scholar]
- Ministry of Environmental Protection and Ministry of Land and Resources. Report on the National Soil Contamination Survey. China Environ. Prot. Ind. 2014, 5, 10–11. (In Chinese) [Google Scholar]
- Bao, S. Soil Agricultural Chemistry Analysis Method, 3rd ed.; China Agriculture Press: Beijing, China, 2008; pp. 264–268. (In Chinese) [Google Scholar]
- Sur, I.; Micle, V.; Polyak, E.; Gabor, T. Assessment of soil quality status and the ecological risk in the Baia Mare, Romania Area. Sustainability 2022, 14, 3739. [Google Scholar] [CrossRef]
- El-Soda, M.; Aljabri, M. Genome-wide association mapping of grain metal accumulation in wheat. Genes 2022, 13, 1052. [Google Scholar] [CrossRef]
- Tang, X.; Wang, Y.; Yin, Y.; Ding, C.; Zhou, Z.; He, L.; Li, L.; Guo, Z.; Li, Z.; Nie, M.; et al. Deciphering cadmium accumulation in peanut kernels through growth stages and source organs: A multi-stable isotope labeling study. J. Agric. Food Chem. 2024, 72, 24003–24012. [Google Scholar] [CrossRef]
- Kubo, K.; Kobayashi, H.; Fujita, M.; Ota, T.; Minamiyama, Y.; Watanabe, Y.; Nakajima, T.; Shinano, T. Varietal differences in the absorption and partitioning of cadmium in common wheat (Triticum aestivum L.). Environ. Exp. Bot. 2016, 124, 79–88. [Google Scholar] [CrossRef]
- Harris, N.; Taylor, G. Cadmium uptake and partitioning in durum wheat during grain filling. BMC Plant Biol. 2013, 13, 103. [Google Scholar] [CrossRef]
- Song, Y.; Jin, L.; Wang, X. Cadmium absorption and transportation pathways in plants. Int. J. Phytoremed. 2017, 19, 133–141. [Google Scholar] [CrossRef]
- Tao, Q.; Liu, Y.; Li, M.; Li, J.; Luo, J.; Lux, A.; Kovac, J.; Yuan, S.; Li, B.; Li, Q.; et al. Cd-induced difference in root characteristics along root apex contributes to variation in Cd uptake and accumulation between two contrasting ecotypes of Sedum alfredii. Chemosphere 2020, 243, 125290. [Google Scholar] [CrossRef]
- Arduini, I.; Masoni, A.; Mariotti, M.; Pampana, S.; Ercoli, L. Cadmium uptake and translocation in durum wheat varieties differing in grain-Cd accumulation. Plant Soil Environ. 2014, 60, 43–49. [Google Scholar] [CrossRef]
- Cheng, Y.; Liu, R.; Yang, T.; Yang, S.; Chen, J.; Huang, Y.; Long, D.; Zeng, J.; Wu, D.; Kang, H.; et al. Genetic factors of grain cadmium concentration in Polish wheat (Triticum polonicum L.). Plant Physiol. 2024, 196, 979–995. [Google Scholar] [CrossRef] [PubMed]
- Cheng, Z.; Wei, J.; Zhu, B.; Gu, L.; Zeng, T.; Wang, H.; Du, X. Mutation of TaNRAMP5 impacts cadmium transport in wheat. Plant Physiol. Biochem. 2025, 223, 109879. [Google Scholar] [CrossRef] [PubMed]
- Sui, F.; Chang, J.; Tang, Z.; Liu, W.; Huang, X.; Zhao, F. Nramp5 expression and functionality likely explain higher cadmium uptake in rice than in wheat and maize. Plant Soil 2018, 433, 377–389. [Google Scholar] [CrossRef]
- Chang, J.; Huang, S.; Yamaji, N.; Zhang, W.; Ma, J.; Zhao, F. OsNRAMP1 transporter contributes to cadmium and manganese uptake in rice. Plant Cell Environ. 2020, 43, 2476–2491. [Google Scholar] [CrossRef]
- Jiang, Y.; Chen, X.; Chai, S.; Sheng, H.; Sha, L.; Fan, X.; Zeng, J.; Kang, H.; Zhang, H.; Xiao, X. TpIRT1 from Polish wheat (Triticum polonicum L.) enhances the accumulation of Fe, Mn, Co and Cd in Arabidopsis. Plant Sci. 2021, 312, 111058. [Google Scholar] [CrossRef]
- Zhang, L.; Gao, C.; Chen, C.; Zhang, W.; Huang, X.; Zhao, F. Overexpression of rice OsHMA3 in wheat greatly decreases cadmium accumulation in wheat grains. Environ. Sci. Technol. 2020, 54, 10100–10108. [Google Scholar] [CrossRef]
- Zhou, M.; Zheng, S.; Liu, R.; Lu, J.; Lu, L.; Zhang, C.; Liu, Z.; Luo, C.; Zhang, L.; Wu, Y. Comparative analysis of root transcriptome profiles between low and high-cadmium-accumulating genotypes of wheat in response to cadmium stress. Funct. Integr. Genom. 2019, 19, 281–294. [Google Scholar] [CrossRef]
- Ma, C.; Lin, L.; Yang, J.; Zhang, H. The relative contributions of different wheat leaves to the grain cadmium accumulation. Toxics 2022, 10, 637. [Google Scholar] [CrossRef]
- Ma, C.; Xie, P.; Yang, J.; Lin, L.; Zhang, K.; Zhang, H. Evaluating the contributions of leaf organ to wheat grain cadmium at the filling stage. Sci. Total Environ. 2022, 833, 155217. [Google Scholar] [CrossRef]
- Ban, Y.; Ishikawa, G.; Ueda, H.; Ishikawa, N.; Kato, K.; Takata, K.; Matsuyama, M.; Handa, H.; Nakamura, T.; Yanaka, M. Novel quantitative trait loci for low grain cadmium concentration in common wheat (Triticum aestivum L.). Breed Sci. 2020, 70, 331–341. [Google Scholar] [CrossRef] [PubMed]
- Yang, G.; Fu, S.; Huang, J.; Li, L.; Long, Y.; Wei, Q.; Wang, Z.; Chen, Z.; Xia, J. The tonoplast-localized transporter OsABCC9 is involved in cadmium tolerance and accumulation in rice. Plant Sci. 2021, 307, 110894. [Google Scholar] [CrossRef] [PubMed]
Disclaimer/Publisher’s Note: The statements, opinions and data contained in all publications are solely those of the individual author(s) and contributor(s) and not of MDPI and/or the editor(s). MDPI and/or the editor(s) disclaim responsibility for any injury to people or property resulting from any ideas, methods, instructions or products referred to in the content. |
© 2025 by the authors. Licensee MDPI, Basel, Switzerland. This article is an open access article distributed under the terms and conditions of the Creative Commons Attribution (CC BY) license (https://creativecommons.org/licenses/by/4.0/).