Article

Transcriptomic Profiling of Heat-Treated Oriental Lily Reveals LhERF109 as a Positive Regulator of Anthocyanin Accumulation

1
College of Landscape Architecture, Sichuan Agricultural University, Chengdu 611130, China
2
Yunnan Seed Laboratory, Kunming 650500, China
3
Floriculture Research Institute, Yunnan Academy of Agricultural Sciences National Engineering Research Center for Ornamental Horticulture, Key Laboratory for Flower Breeding of Yunnan Province, Kunming 650500, China
4
Institute of Alpine Economics and Botany, Yunnan Academy of Agricultural Sciences, Lijiang 674100, China
5
College of Forestry, Sichuan Agricultural University, Chengdu 611130, China
*
Authors to whom correspondence should be addressed.
Agronomy 2025, 15(5), 1071; https://doi.org/10.3390/agronomy15051071
Submission received: 23 March 2025 / Revised: 21 April 2025 / Accepted: 25 April 2025 / Published: 28 April 2025

Abstract

:
Pink-flowered Oriental lily cultivars exhibit significant color fading under high temperatures, but the underlying regulatory mechanisms remain unclear. We subjected ‘Souvenir’ Oriental lily plants to temperature treatments (20 °C and 35 °C) and performed transcriptome sequencing and weighted gene co-expression network analysis (WGCNA). The high temperature (35 °C) significantly reduced the anthocyanin content in tepals. The transcriptome analysis identified 8354 differentially expressed genes, with the GO and KEGG analyses revealing a dynamic transition from early stress responses to metabolic adaptation. The WGCNA revealed a module strongly correlated with the anthocyanin content, from which we constructed a gene co-expression network using known anthocyanin-related genes, including the key transcription factor LhMYB12 and structural genes involved in the anthocyanin biosynthetic pathway (LhANS, LhDFR, LhUGT78, and LhF3′H). Through this comprehensive network analysis, we successfully identified and screened LhERF109 as a promising regulatory candidate. The transient overexpression of LhERF109 was found to enhance anthocyanin accumulation and upregulate biosynthetic genes including LhMYB12, while silencing LhERF109 expression produced the opposite effects. These findings identify LhERF109 as a positive regulator of anthocyanin biosynthesis under high temperatures, providing new targets for breeding heat-tolerant lilies with stable flower coloration.

1. Introduction

The suppression of anthocyanin biosynthesis under high temperatures is a widespread phenomenon observed across the plant kingdom, affecting both fruits and ornamental flowers [1]. This temperature-sensitive response has gained increasing research attention due to global climate warming and its significant impact on horticultural industries [2].
There is mounting evidence that high temperature can directly impact MYB transcription factors and influence anthocyanin accumulation through complex upstream regulatory pathways. In Oriental lilies, elevated temperatures disrupt the MYB transcription factor balance by suppressing R2R3-MYB activators (LhMYB12) while inducing MYB repressors (LhMYBC2), leading to reduced expression of anthocyanin biosynthetic genes including CHS, DFR, and ANS [3,4]. Similar direct effects on MYB regulation have been documented in other species: in grape berries, high temperatures significantly reduce the expression of VvMYBA1 and VvMYBA2 activators [5]; in apples, heat stress downregulates MdMYB10 [6]; and in Arabidopsis, elevated temperatures suppress AtPAP1/AtMYB75 activator expression while enhancing the repressive activity of AtMYBL2 [7]. In Malus profusion, high temperatures suppress R2R3-MYB activators (MpMYB10) while inducing MYB repressors (MpMYB15), reducing the expression of the key anthocyanin biosynthetic genes MpCHS, MpDFR, MpLDOX, and MpUFGT [8].These examples collectively demonstrate that temperature-induced modulation of the balance between MYB activators and repressors represents a conserved regulatory mechanism affecting anthocyanin biosynthesis across diverse plant species.
In fruits and Arabidopsis thaliana, the mechanisms through which high temperature inhibits anthocyanin accumulation have been extensively characterized. In Malus domestica (apple), MdCOL11, a B-box transcription factor, is typically upregulated under light conditions and activates MdMYB10, a key transcription factor for anthocyanin biosynthesis. However, under high-temperature stress, the expression of MdCOL11 is suppressed, which in turn leads to a reduction in MdMYB10 activation. This downregulation impairs the transcription of late-stage anthocyanin biosynthesis genes such as MdDFR (dihydroflavonol 4-reductase) and MdUFGT (UDP-glucose:flavonoid-3-O-glucosyltransferase), leading to decreased anthocyanin accumulation [9]. Similarly, in response to heat stress, MdCOL4, another B-box transcription factor, is upregulated through heat shock transcription factors (MdHSF3b and MdHSF4a). MdCOL4 then interacts with MdHY5, forming a complex that represses the expression of genes like MdMYB1, MdANS, and MdUFGT, further inhibiting anthocyanin production under high temperatures [10]. Similar upstream regulatory networks have been identified in Arabidopsis, and the same COP1-HY5-MYBL2 signaling module has been confirmed to regulate anthocyanin biosynthesis in response to high temperatures [11,12]. In contrast to fruits and model plants, ornamental flowering crops show diverse regulatory mechanisms for anthocyanin biosynthesis under high temperatures. Some heat-tolerant cultivars maintain stable pigmentation at elevated temperatures, suggesting that the HY5-COP1 module may not be the primary regulatory pathway in these species [6,13]. Instead, ornamental flowering crops exhibit more complex regulatory mechanisms involving multiple external cues (like light and hormones) that may dilute the influence of the HY5-COP1 module in controlling floral pigmentation [14,15,16]. Although research on the upstream mechanisms of high-temperature suppression of anthocyanin synthesis is limited, studies have shown that MYB transcription factors, key regulators of anthocyanin biosynthesis, are regulated by various upstream factors [17,18,19,20]. Among these, APETALA2/ETHYLENE RESPONSIVE FACTOR (AP2/ERF) family members may play important roles in integrating temperature and hormone signals to control floral pigmentation. For instance, in ‘Viviana’ lilies (Lilium spp.), LvERF113, induced by ethylene, promotes anthocyanin synthesis in tepals by repressing the negative regulator LvMYB1, forming the LvMYB5-LvERF113-LvMYB1 module under LvMYB5′s positive regulation [21]. Similarly, in apple (Malus domestica), MdERF109 enhances fruit anthocyanin biosynthesis via methyl jasmonate (MeJA) signals, interacting with MdWER [22]. These examples underscore ERF’s role in coordinating hormonal and environmental cues for pigmentation.
Oriental lily (Lilium spp., Oriental Group) is renowned for its exceptionally large, fragrant flowers with vibrant colors and distinctive recurved tepals [23]. These outstanding horticultural traits have helped establish its significant position in both the cut-flower industry and landscape applications [24]. As an important breeding parent, Oriental lily has been widely used in interspecific hybridization, resulting in series like LLO (Longiflorum × Oriental lily) [25] and AOA (Asiatic × Oriental lily) [26,27]. However, pink-flowered cultivars commonly exhibit heat sensitivity, with flower color fading under high-temperature stress [28]. This undesirable trait is often inherited by the progeny, significantly reducing the product’s quality and economic value. While research has established that MYB transcription factors, particularly LhMYB12 and LhMYBC2 [4,28], play key roles in regulating flower color fading in Oriental lilies under high temperatures, the upstream molecular networks controlling these MYB factors remain largely unexplored.
In this study, we performed transcriptome sequencing analysis of ‘Souvenir’ Oriental lily under control and high-temperature conditions, and conducted weighted gene co-expression network analysis (WGCNA) with known MYB transcription factors, anthocyanin biosynthesis structural genes, and related transcription factors to explore the upstream regulatory mechanisms underlying high-temperature-induced color fading.

2. Materials and Methods

2.1. Plant Materials and Temperature Treatments

The ‘Souvenir’ Oriental lily plants were maintained under standard greenhouse conditions (20 ± 2 °C, 65 ± 5% relative humidity, natural photoperiod supplemented with artificial lighting to maintain a minimum of 200 μmol m−2 s−1 PPFD for 16 h daily) from bulb sprouting until the designated developmental stages. Plants at developmental stages St2 (initial coloration stage) and St3 (partial coloration stage), as illustrated in Figure 1A, were selected for uniformity and transferred to incubators for controlled temperature treatments of 20 °C (control) and 35 °C (high temperature). The environmental conditions were standardized across both incubators (16 h light/8 h dark photoperiod, 70% relative humidity, 200 μmol m−2 s−1 PPFD). Tepal samples were systematically collected after 12 h, 24 h, 48 h, and 72 h of treatment (designated as T1, T2, T3, and T4, respectively). For each biological replicate, three inner tepals were collected from each of three individual flowers (nine inner tepals total per biological replicate), with three biological replicates per treatment combination. Immediately after collection, the samples were flash-frozen in liquid nitrogen and stored at −80 °C until further physiological and molecular analyses were performed.

2.2. Determination of Anthocyanin Content

The total anthocyanin content was measured using the pH differential method, with modifications based on Song et al. [29]. A total of 0.5 g of finely ground tepal tissue was extracted with 5 mL of acidified methanol (0.1% HCl, v/v) for 24 h at 4 °C in darkness. The extract was centrifuged at 12,000× g for 10 min at 4 °C, and the supernatant was collected. The absorbance was measured at 530 nm and 657 nm using a spectrophotometer (UV-1800, Shimadzu, Kyoto, Japan). The total anthocyanin content was calculated as X = (A530 − 0.25A657) × W · g 1 , where X is the total anthocyanin content (expressed as absorbance units per gram fresh weight), A530 and A645 are the absorbance values at 530 nm and 645 nm, respectively, and W is the sample weight (g). The measurements were performed in triplicate for each treatment.
For the specific anthocyanin analysis, the method proposed by Xia et al. [30] was adopted, and the determination was performed using a high-performance liquid chromatography (HPLC) instrument (Shimadzu Corporation, Japan). Anthocyanins were separated on a Shim-pack Scepter C18 column (4.6 mm × 250 mm, 5 μm) at 30 °C. The mobile phase consisted of (A) 0.1% formic acid and (B) acetonitrile. The gradient elution program was as follows: 0–18 min, 10–22.2% B; 18–25 min, 22.2–22.8% B; 25–28 min, 22.8–44% B; 28–45 min, 44–50% B; 45–50 min, 50–60% B; 50–70 min, 60–85% B. The flow rate was 1.0 mL/min, and the injection volume was 10 μL. Cyanidin 3-O-β-rutinoside was identified by comparing the retention times and spectral characteristics with authentic standards (Shanghai yuanye) and its content was quantified using standard curves. Each HPLC sample run was repeated three times under the same conditions.

2.3. Determination of Sugar Content

The samples preserved in the −80 °C freezer were retrieved for the determination of sugar content. The contents of sucrose, reducing sugars, and soluble sugars were determined according to the kit protocol (G0506W, G0502W, and G0501W; Grace Biotechnology, Suzhou, China).

2.4. RNA Extraction and Transcriptome Data Analysis

Total RNA was extracted from ‘Souvenir’ lily tepals using the Universal Plant Total RNA Extraction Kit (Vazyme, Nanjing, China). The RNA quality was verified by agarose gel electrophoresis and a NanoDrop 2000 spectrophotometer. High-quality RNA (OD260/280 between 1.8 and 2.0) was used to construct cDNA libraries, which were sequenced on the Illumina HiSeq 2000 platform (paired-end, 150 bp) by Biomarker Technologies (Beijing, China).
The raw reads were filtered using Trimmomatic [31] to remove adapters and low-quality sequences. Due to the lack of a reference genome for Oriental lily, the clean reads were assembled de novo using Trinity (v2.6.6) [32]. Coding sequences were predicted using TransDecoder [33], and unannotated transcripts were processed with ESTScan [34].
Unigene functional annotation was conducted using BLASTx [35] (E-value ≤ 1 × 10⁻⁵) against the NR, Swiss-Prot, Pfam, GO, KEGG, KOG, and TrEMBL databases. Bowtie2 [36] was used for read alignment, and transcript abundance was calculated as FPKM using RSEM [37]. Differentially expressed genes (DEGs) were identified using the DEGseq R package [38] with thresholds of |log2FoldChange| ≥ 1 and FDR < 0.01. DEGs were subjected to Gene Ontology (GO) annotation using the Blast2GO v5.2 software. The GO terms of the DEGs showing an adjusted p value < 0.05 were considered significant [39], and KEGG pathway analysis was performed using KOBAS 2.0 [40].

2.5. WGCNA and Correlation Analyses of Anthocyanin-Related Genes

Weighted gene co-expression network analysis (WGCNA) was performed using the WGCNA R package [41] based on differentially expressed genes (DEGs) identified from natural temperature (NT)- and high-temperature (HT)-treated samples. Expression profiles from all four time points were used to construct a signed co-expression network. A soft-thresholding power (β) of 12 was selected to approximate the scale-free topology. Modules were identified using dynamic tree cutting with a minimum module size of 30 genes and merged using a module similarity threshold of 0.25. Correlations between module eigengenes and anthocyanin traits (total anthocyanin and cyanidin 3-O-β-rutinoside contents) were calculated to identify anthocyanin-related modules. Within the most correlated module (black), transcription factors and anthocyanin biosynthetic genes were extracted and visualized using Cytoscape (v3.10.3) with a correlation weight threshold ≥ 0.95.

2.6. Phylogenetic Analysis

The full-length coding sequences of LhERF109 and other ERF transcription factors were obtained from the transcriptome assembly. All ERF sequences used in the phylogenetic analysis were obtained from the ‘black’ module identified in our WGCNA, which were the ERF transcription factors that were co-expressed with anthocyanin-related genes under heat stress conditions. Multiple sequence alignment (MSA) of the ERF protein sequences from Arabidopsis thaliana were retrieved from the TAIR database (https://www.arabidopsis.org/, accessed on 25 February 2025) [42] and aligned using MUSCLE (v3.8.31) [43] with the default parameters. The phylogenetic tree was constructed using the maximum likelihood method in MEGA 7.0 [44] with 1000 bootstrap replicates. The evolutionary distances were computed using the JTT matrix-based method [45]. The tree was visualized and annotated using iTOL (Interactive Tree of Life) [46].

2.7. Transient Transformation of Lily Tepals

For the transient transformation experiments, the full-length coding sequence of LhERF109 was amplified by PCR and cloned into the pS1300 expression vector under the control of the CaMV 35S promoter using the KpnI and SalI restriction sites. For virus-induced gene silencing (VIGS), a 300-bp fragment of LhERF109 was cloned into the pTRV2 vector. All constructs were verified by sequencing before use, and the sequences of the primers are given in Supplementary Table S2.
For both the transient expression and VIGS experiments, Agrobacterium tumefaciens strain GV3101 harboring the relevant constructs (pS1300-LhERF109 or empty pS1300 vector for transient expression; pTRV1, pTRV2, or pTRV2-LhERF109 for VIGS) were cultured in liquid LB medium containing 50 mg/L rifampicin and 50 mg/L kanamycin at 28 °C with shaking until the A600 reached 0.8–1.0. After centrifugation, the bacterial cells were resuspended in infiltration buffer (10 mM MES, 10 mM MgCl2, and 150 mM acetosyringone, pH 5.6) at an A600 of exactly 0.6 and incubated at room temperature for 3 h in darkness to activate the virulence genes. For the VIGS experiments specifically, equal volumes of a pTRV1-containing suspension were mixed with either pTRV2 or pTRV2-LhERF109 suspensions immediately before infiltration.
Due to the limited availability of the ‘Souvenir’ cultivar used for transcriptome analysis, the transient transformation and VIGS assays were performed using another pink-flowered Oriental lily cultivar, ‘Sorbonne’. Given the similar pigmentation phenotype and heat-induced fading behavior between these cultivars, ‘Sorbonne’ served as a representative model for functional validation under high-temperature conditions [4,28,47].
For both the transient overexpression and VIGS experiments, flower branches of Lilium ‘Sorbonne’ with buds at the St2 developmental stage were selected and maintained in fresh water for one day prior to experimentation. Following protocols adapted from Yin et al. (2021) [48], approximately 100 μL of an Agrobacterium suspension was injected into the abaxial side of each tepal using a 1 mL needleless syringe until the water-soaked area covered approximately 80% of the tepal surface, ensuring uniform distribution of the inoculum. Each treatment consisted of six biological replicates. After infiltration, the whole flower branches were placed in containers with their stems immersed in sterile distilled water to maintain hydration and support floral development throughout the experimental period. The setup was then transferred to a growth chamber under controlled conditions. The samples were initially subjected to a 12 h dark treatment at 20 °C to minimize stress, followed by culture at 20 °C under a 16 h light/8 h dark photoperiod with 60% humidity. Tepal samples were collected 72 h post-infiltration for phenotypic observation and gene expression analysis, including quantitative real-time PCR (qRT-PCR) to assess LhERF109 expression levels.

2.8. Quantitative Real-Time PCR (qRT-PCR)

Total RNA was extracted from ‘Souvenir’ and ‘Sorbonne’ lily tepal samples. First-strand cDNA was synthesized from 1 µg of total RNA using the PrimeScript™ RT reagent kit (Takara Bio Inc., Kusatsu, Shiga, Japan). qRT-PCR was performed with a 20 µL reaction volume in the iCycler iQ5 system (Bio-Rad, Hercules, CA, USA). The reaction mixture contained 10 µL SYBR Premix Ex Taq™ (Takara Bio Inc., Kusatsu, Shiga, Japan), 1 µL of each primer, and 1 µL of cDNA. Each sample was analyzed in triplicate with three biological replicates for each group. Relative gene expression levels were calculated using the 2–ΔΔCt method [49], with LhActin as the internal reference gene. The primer sequences are listed in Supplementary Table S1.

2.9. Statistical Analysis

All experiments were performed with at least three biological replicates. Statistical analysis was performed using SPSS software (version 25.0). The data were analyzed using Student’s t-test or one-way analysis of variance (ANOVA), followed by Tukey’s HSD test. Differences were considered statistically significant at p < 0.05. The data are presented as means ± standard deviation (SD).

3. Results

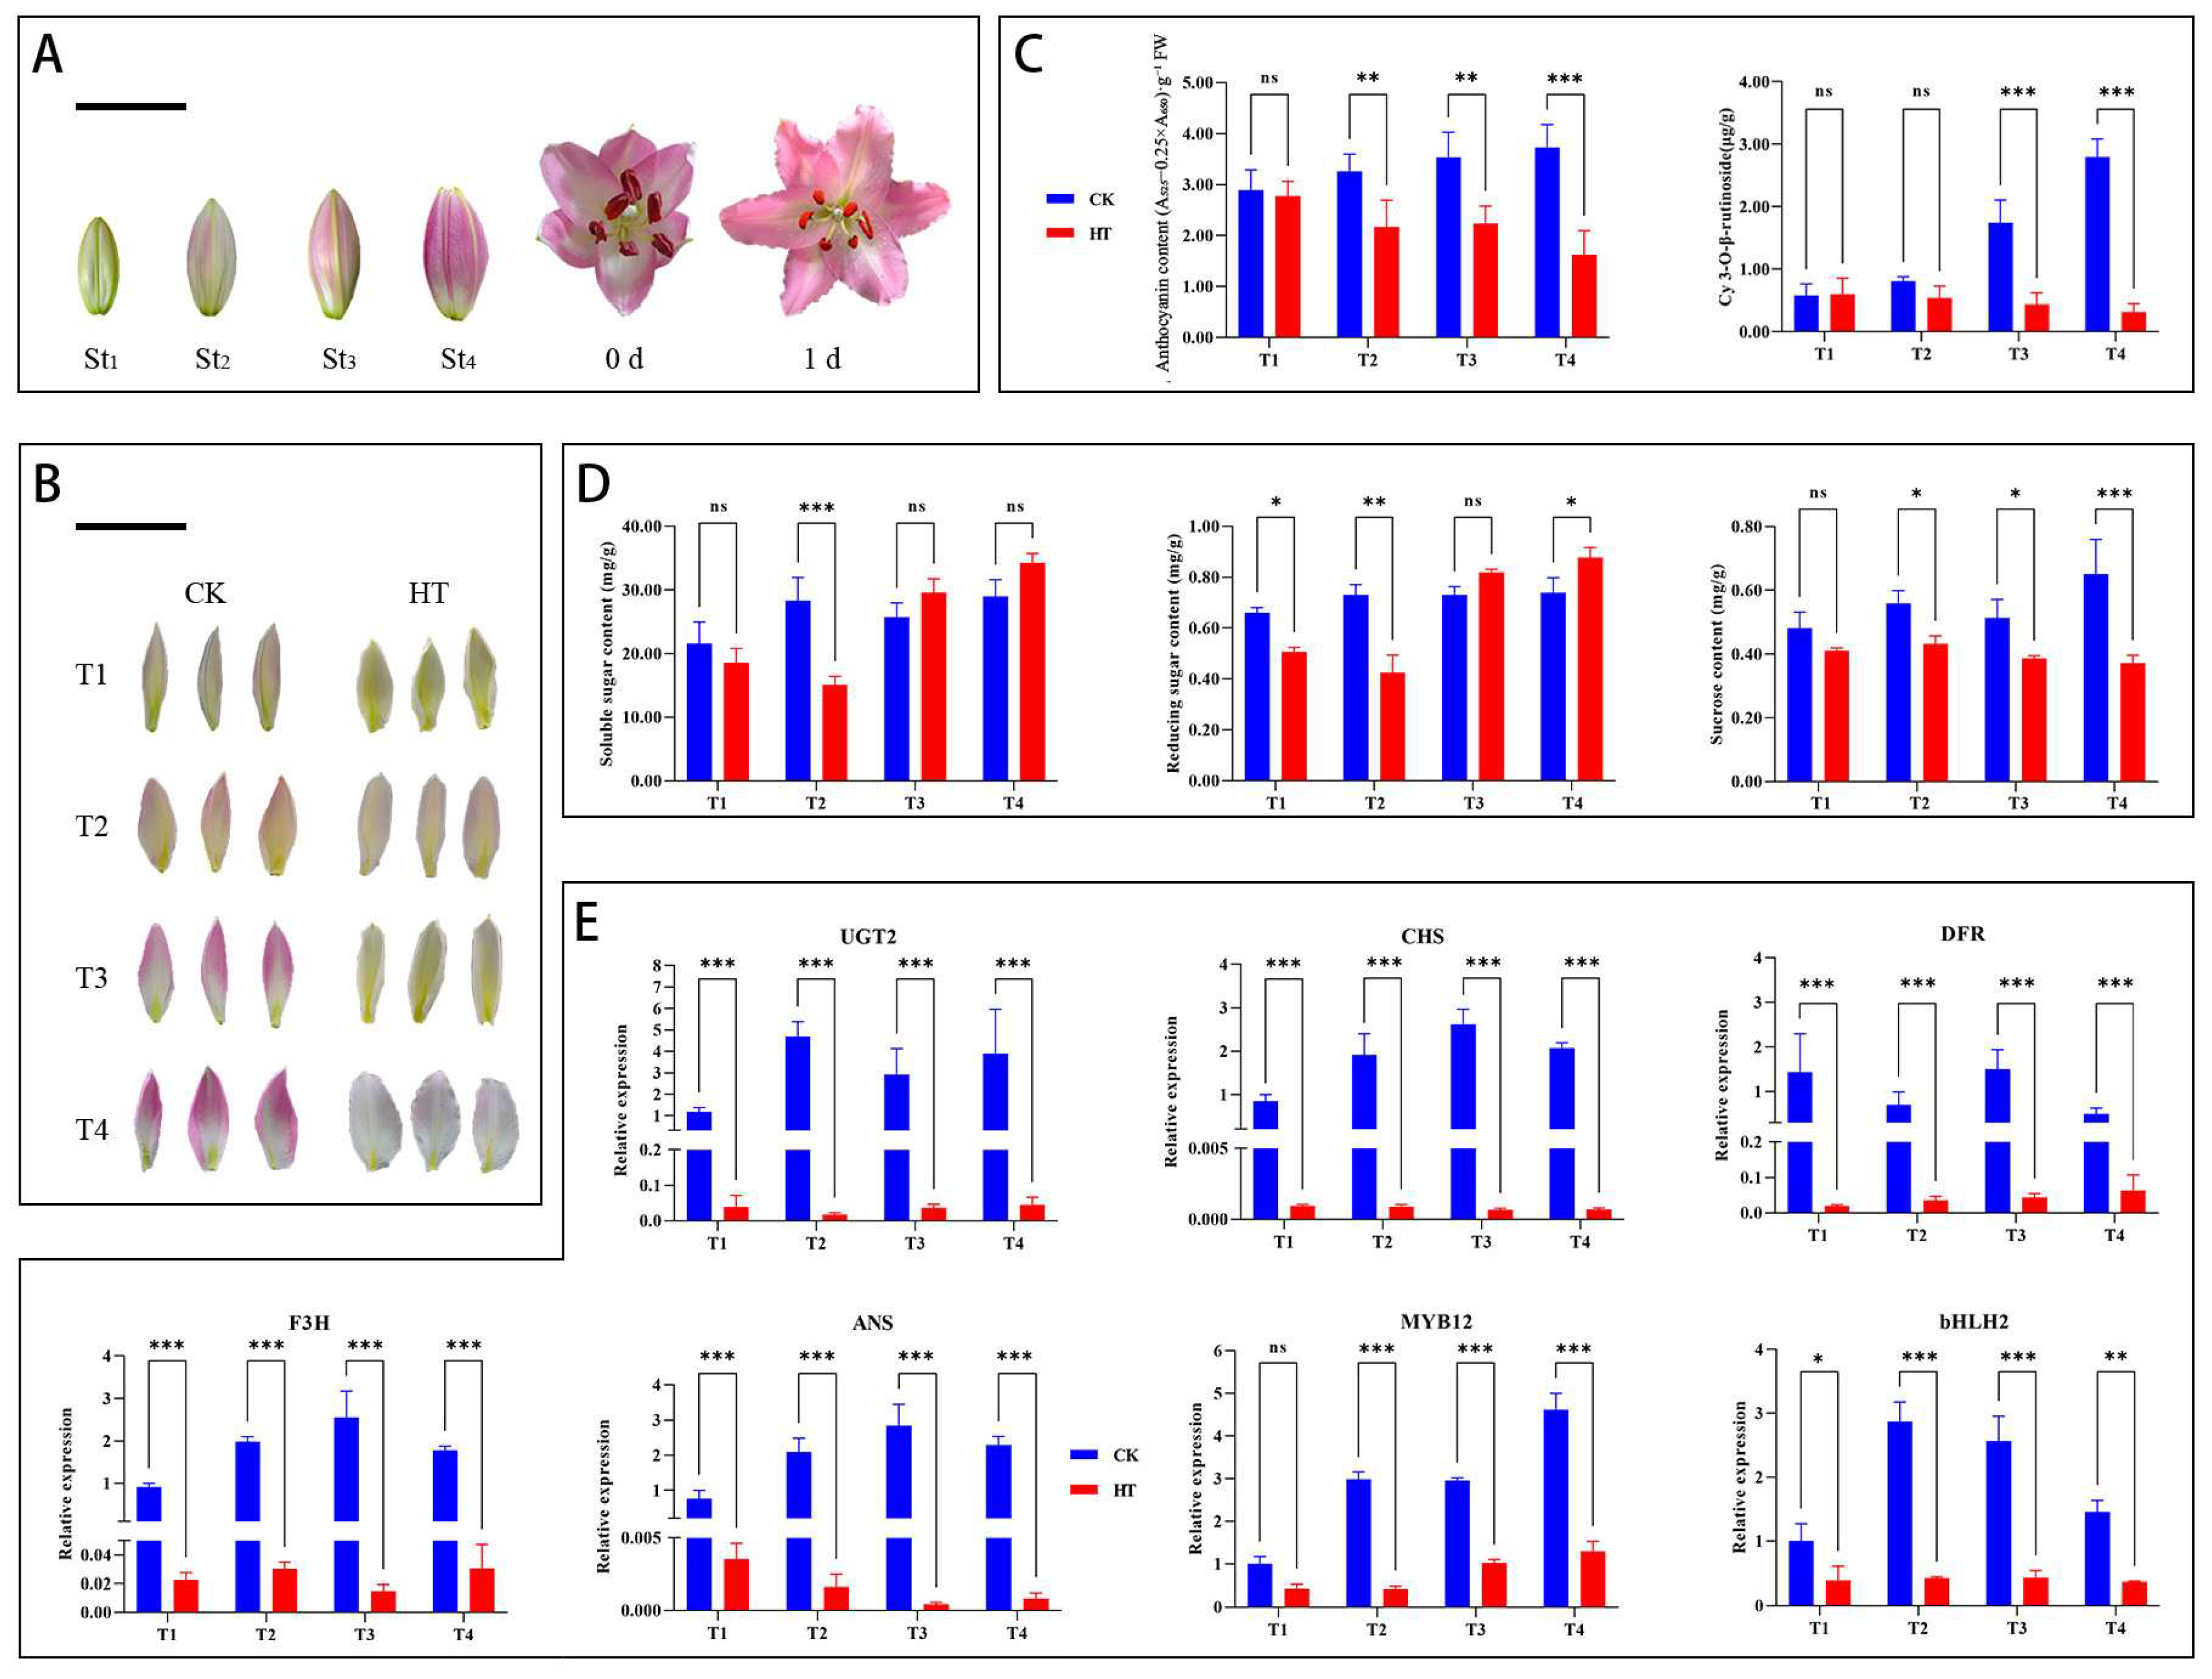
3.1. Effect of High Temperature on the Physiology and Biochemistry of ‘Souvenir’ Oriental Lily

Under the 20 °C treatment, the St2 of the ‘Souvenir’ lily exhibited a progressive change in tepal coloring (Figure 1A). In sharp contrast, upon initiating the 35 °C treatment, the red coloration of the lily tepal began to decline after 12 h of stress, and subsequently continued to fade, eventually approaching an almost white appearance (Figure 1B). Consistent with these visual observations, the total anthocyanin content and cyanidin 3-O-β-rutinoside content in the tepals under the 20 °C treatment showed a continuous increase, while both decreased steadily in tepals under the 35 °C treatment (Figure 1C).
The determination of the changes in the sugar content of ‘Souvenir’ Oriental lily flowers showed that over time, the sucrose content in the tepals generally increased under suitable temperature conditions (20 °C), while it generally decreased under the high-temperature conditions (35 °C). Although the soluble sugar and reducing sugar contents also varied between treatments, their relationship with the tepal color changes was not as pronounced as that of sucrose (Figure 1D).
To examine the expression patterns of the genes involved in anthocyanin biosynthesis under the different temperature conditions, this study conducted qPCR analysis of the key structural genes and transcription factors. The qPCR results (Figure 1E) demonstrated that the high-temperature (35 °C) treatment led to a dramatic downregulation of all six analyzed genes compared to the control conditions (20 °C). The expression levels of the structural genes UGT2, CHS, DFR, F3H, and ANS were severely suppressed by the high-temperature treatment across all time points (T1–T4), with expression reduced to nearly undetectable levels. Similarly, the transcription factors MYB12 and bHLH2 also exhibited significant downregulation under high-temperature stress. The subsequent transcriptomic analysis corroborated these qPCR findings, indicating that the sequencing results obtained in this study exhibit a high level of reliability.
Figure 1. Phenotypic, pigment, sugar content, and gene expression changes in ‘Souvenir’ lily tepals under control and high-temperature treatments. (A) Diagram of developmental stages of ‘Souvenir’ lily (St1: bud tight stage; St2: initial coloration stage; St3: partial coloration stage; St4: full coloration stage; 0 d: 0 day of flowering; 1 d: 1 day of flowering). Scale bar = 5 cm. (B) Comparison of ‘Souvenir’ lily tepal color under control (CK, 20 °C) and high-temperature (HT, 35 °C) treatments at different time points (T1: 12 h; T2: 24 h; T3: 48 h; and T4: 72 h). Scale bar = 5 cm. (C) Total anthocyanin content and cyanidin 3-O-β-rutinoside content in ‘Souvenir’ lily tepals under control (CK, 20 °C, blue) and high-temperature (HT, 35 °C, red) treatments at time points T1–T4. (D) Sugar content in ‘Souvenir’ lily tepals under control (CK, 20 °C, blue) and high-temperature (HT, 35 °C, red) treatments at time points T1–T4, including soluble sugar content (left), reducing sugar content (middle), and sucrose content (right). (E) Relative expression levels of structural genes and transcription factors from transcriptome analysis validated by qPCR in ‘Souvenir’ lily tepals under control (CK, 20 °C, blue) and high-temperature (HT, 35 °C, red) treatments at time points T1–T4 (* p < 0.1, ** p < 0.01, *** p < 0.001, ns = not significant, p > 0.1).
Agronomy 15 01071 g001

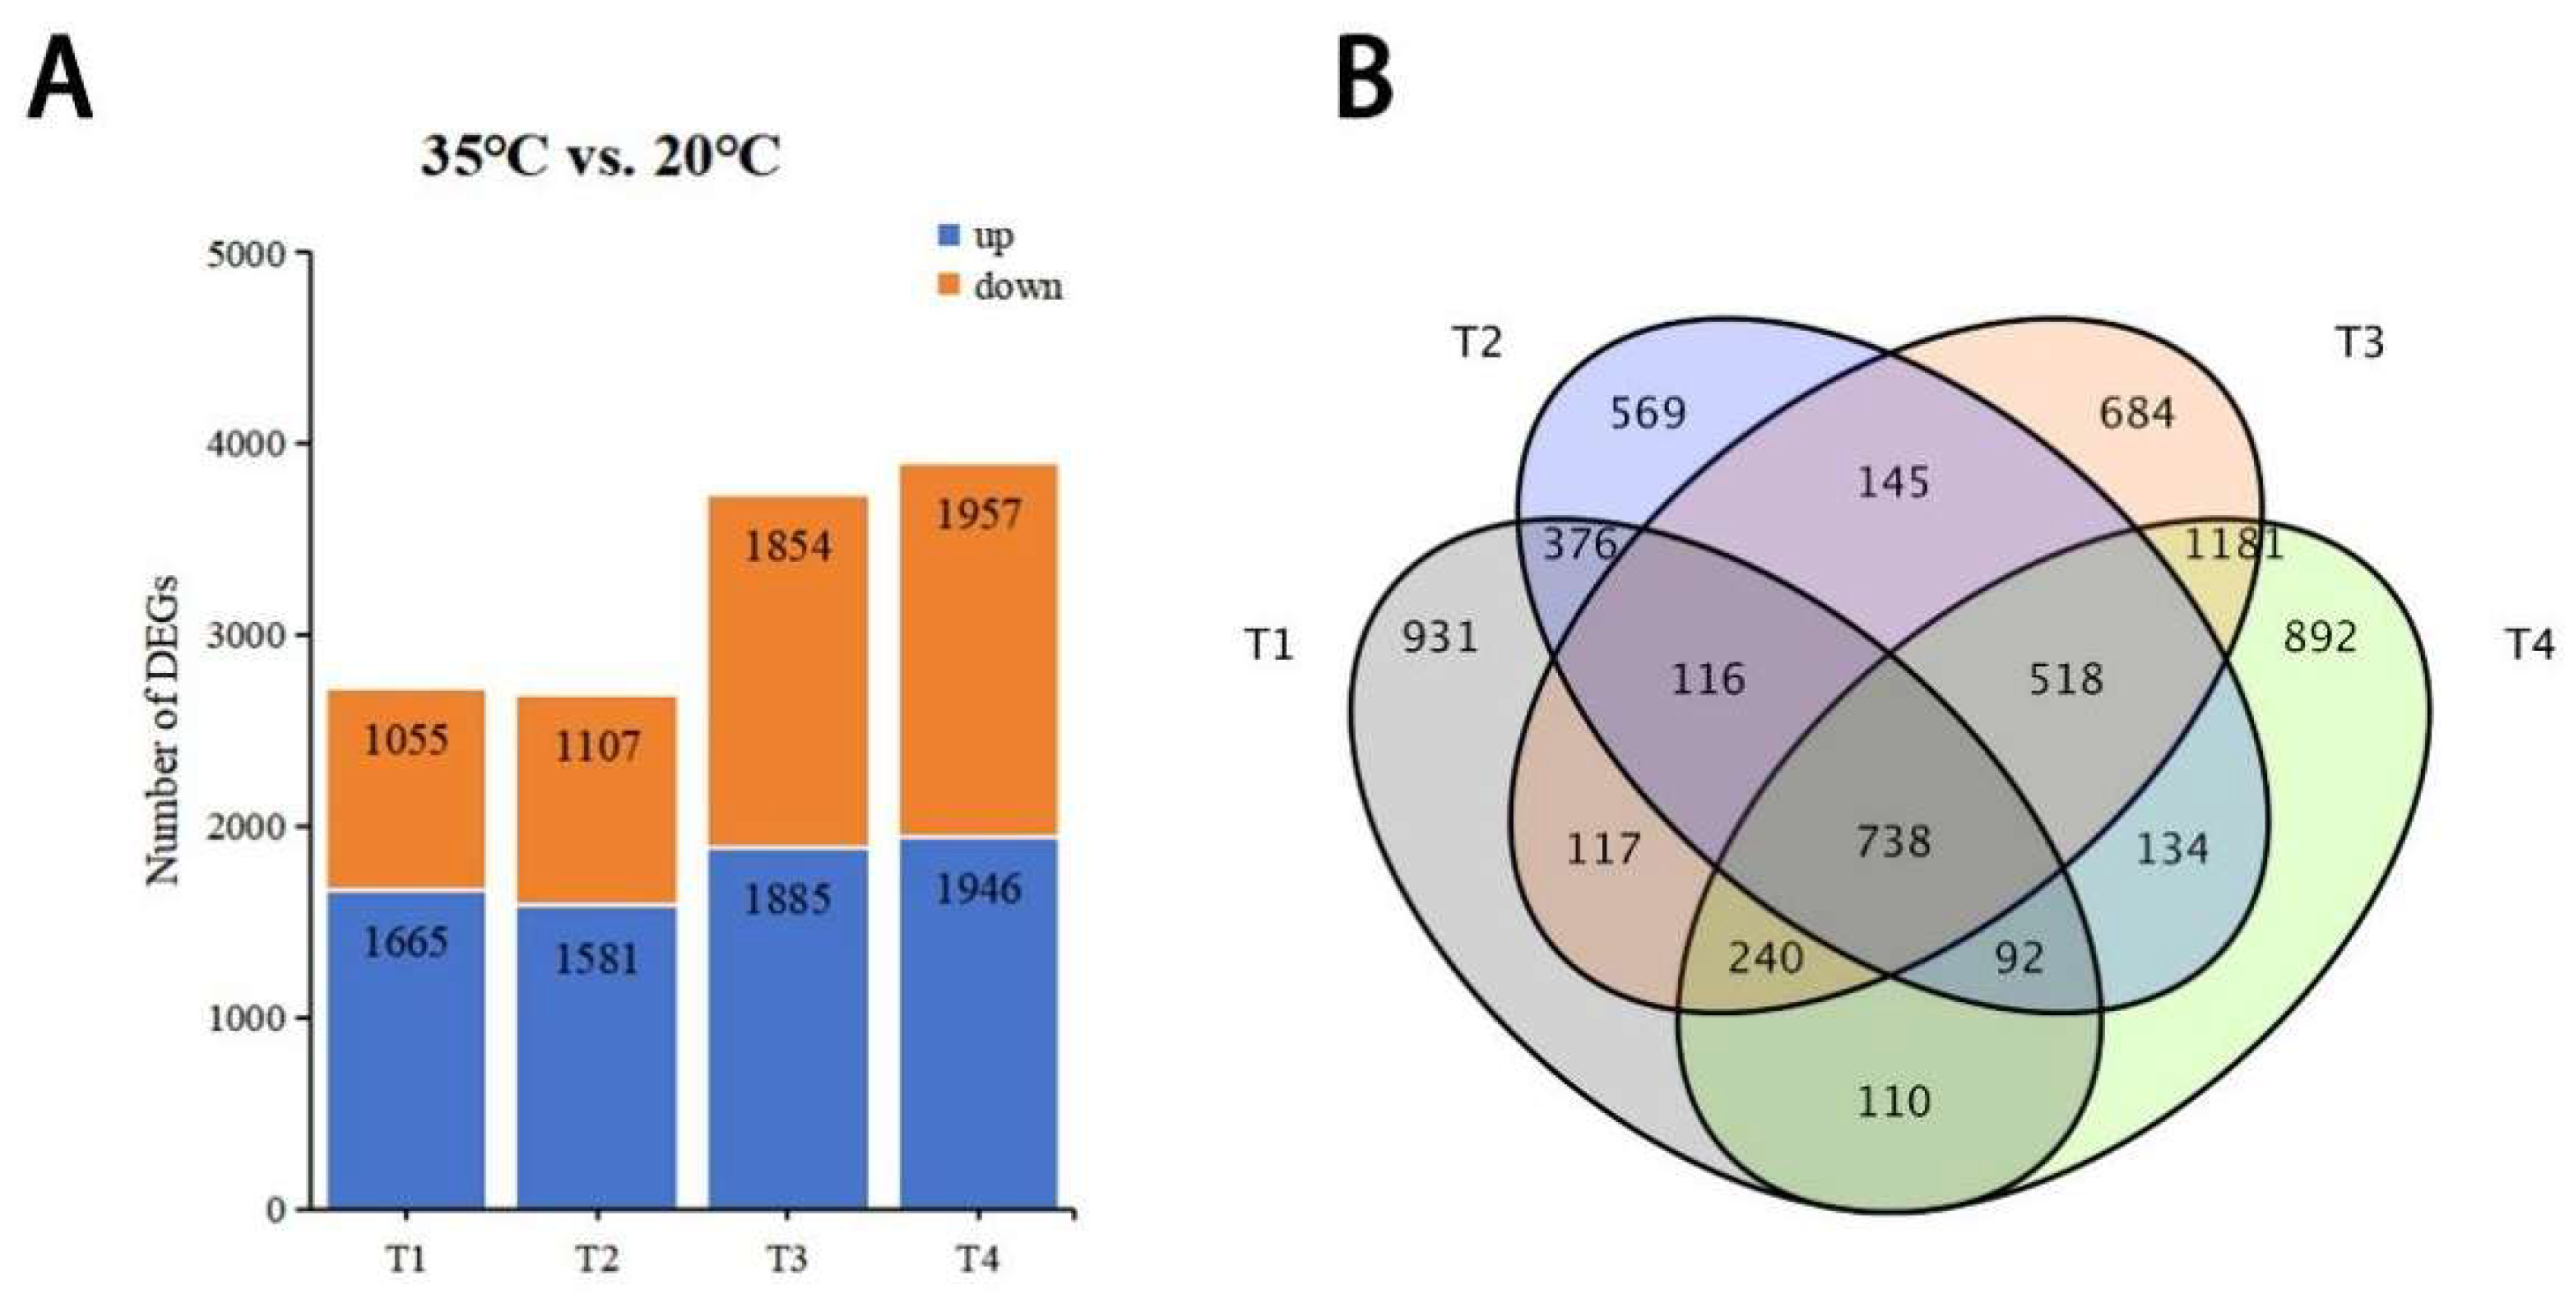
3.2. Gene Expression Differences Between NT- and HT-Treated Oriental Lily

The RNA-seq analysis of the ‘Souvenir’ Oriental lily flowers subjected to the 20 °C and 35 °C treatments (collected at four time points) generated 143.9 Gb of high-quality clean data, with a Q30 > 94.25%, indicating that over 94% of the bases had a Phred quality score ≥ 30 (i.e., a base call accuracy ≥ 99.9%). In the absence of a reference genome for Lilium Oriental, the clean reads were assembled de novo using Trinity software (v2.13.2), yielding 63,394 Unigenes with an N50 length of 1.58 kb (N50 refers to the contig length such that 50% of the total assembled sequence is contained in contigs of this length or longer). Among these, 18,504 Unigenes exceeded 1 kb in length. Comprehensive functional annotation against multiple databases successfully classified 31,101 Unigenes (49.06%), with the transcript abundance quantified using fragments per kilobase of transcript per million mapped reads (FPKM) values. The differential expression analysis identified 8354 DEGs across four pairwise comparisons (|log2FC| > 1, adjusted p < 0.01); the log2FC values were calculated using the MA-plot-based method in DEGseq. As illustrated in Figure 2A, the 35 °C vs. 20 °C comparison revealed distinct temporal expression patterns: at T1, 1665 genes were upregulated and 1055 were downregulated; at T2, 1581 genes showed upregulation while 1107 exhibited downregulation; at T3, 1885 genes were upregulated and 1854 were downregulated; and at T4, 1946 genes displayed increased expression while 1957 showed decreased expression. The Venn diagram analysis (Figure 2B) revealed 738 DEGs that were consistently differentially expressed across all four time points (T1, T2, T3, and T4; corresponding to 12, 24, 48, and 72 h of temperature treatment). Notable time-specific expression patterns were observed, with 931, 569, 684, and 892 unique DEGs identified at T1, T2, T3, and T4, respectively. This temporal diversity in transcriptional profiles indicates sophisticated and dynamic gene expression reprogramming in response to elevated-temperature stress over time.

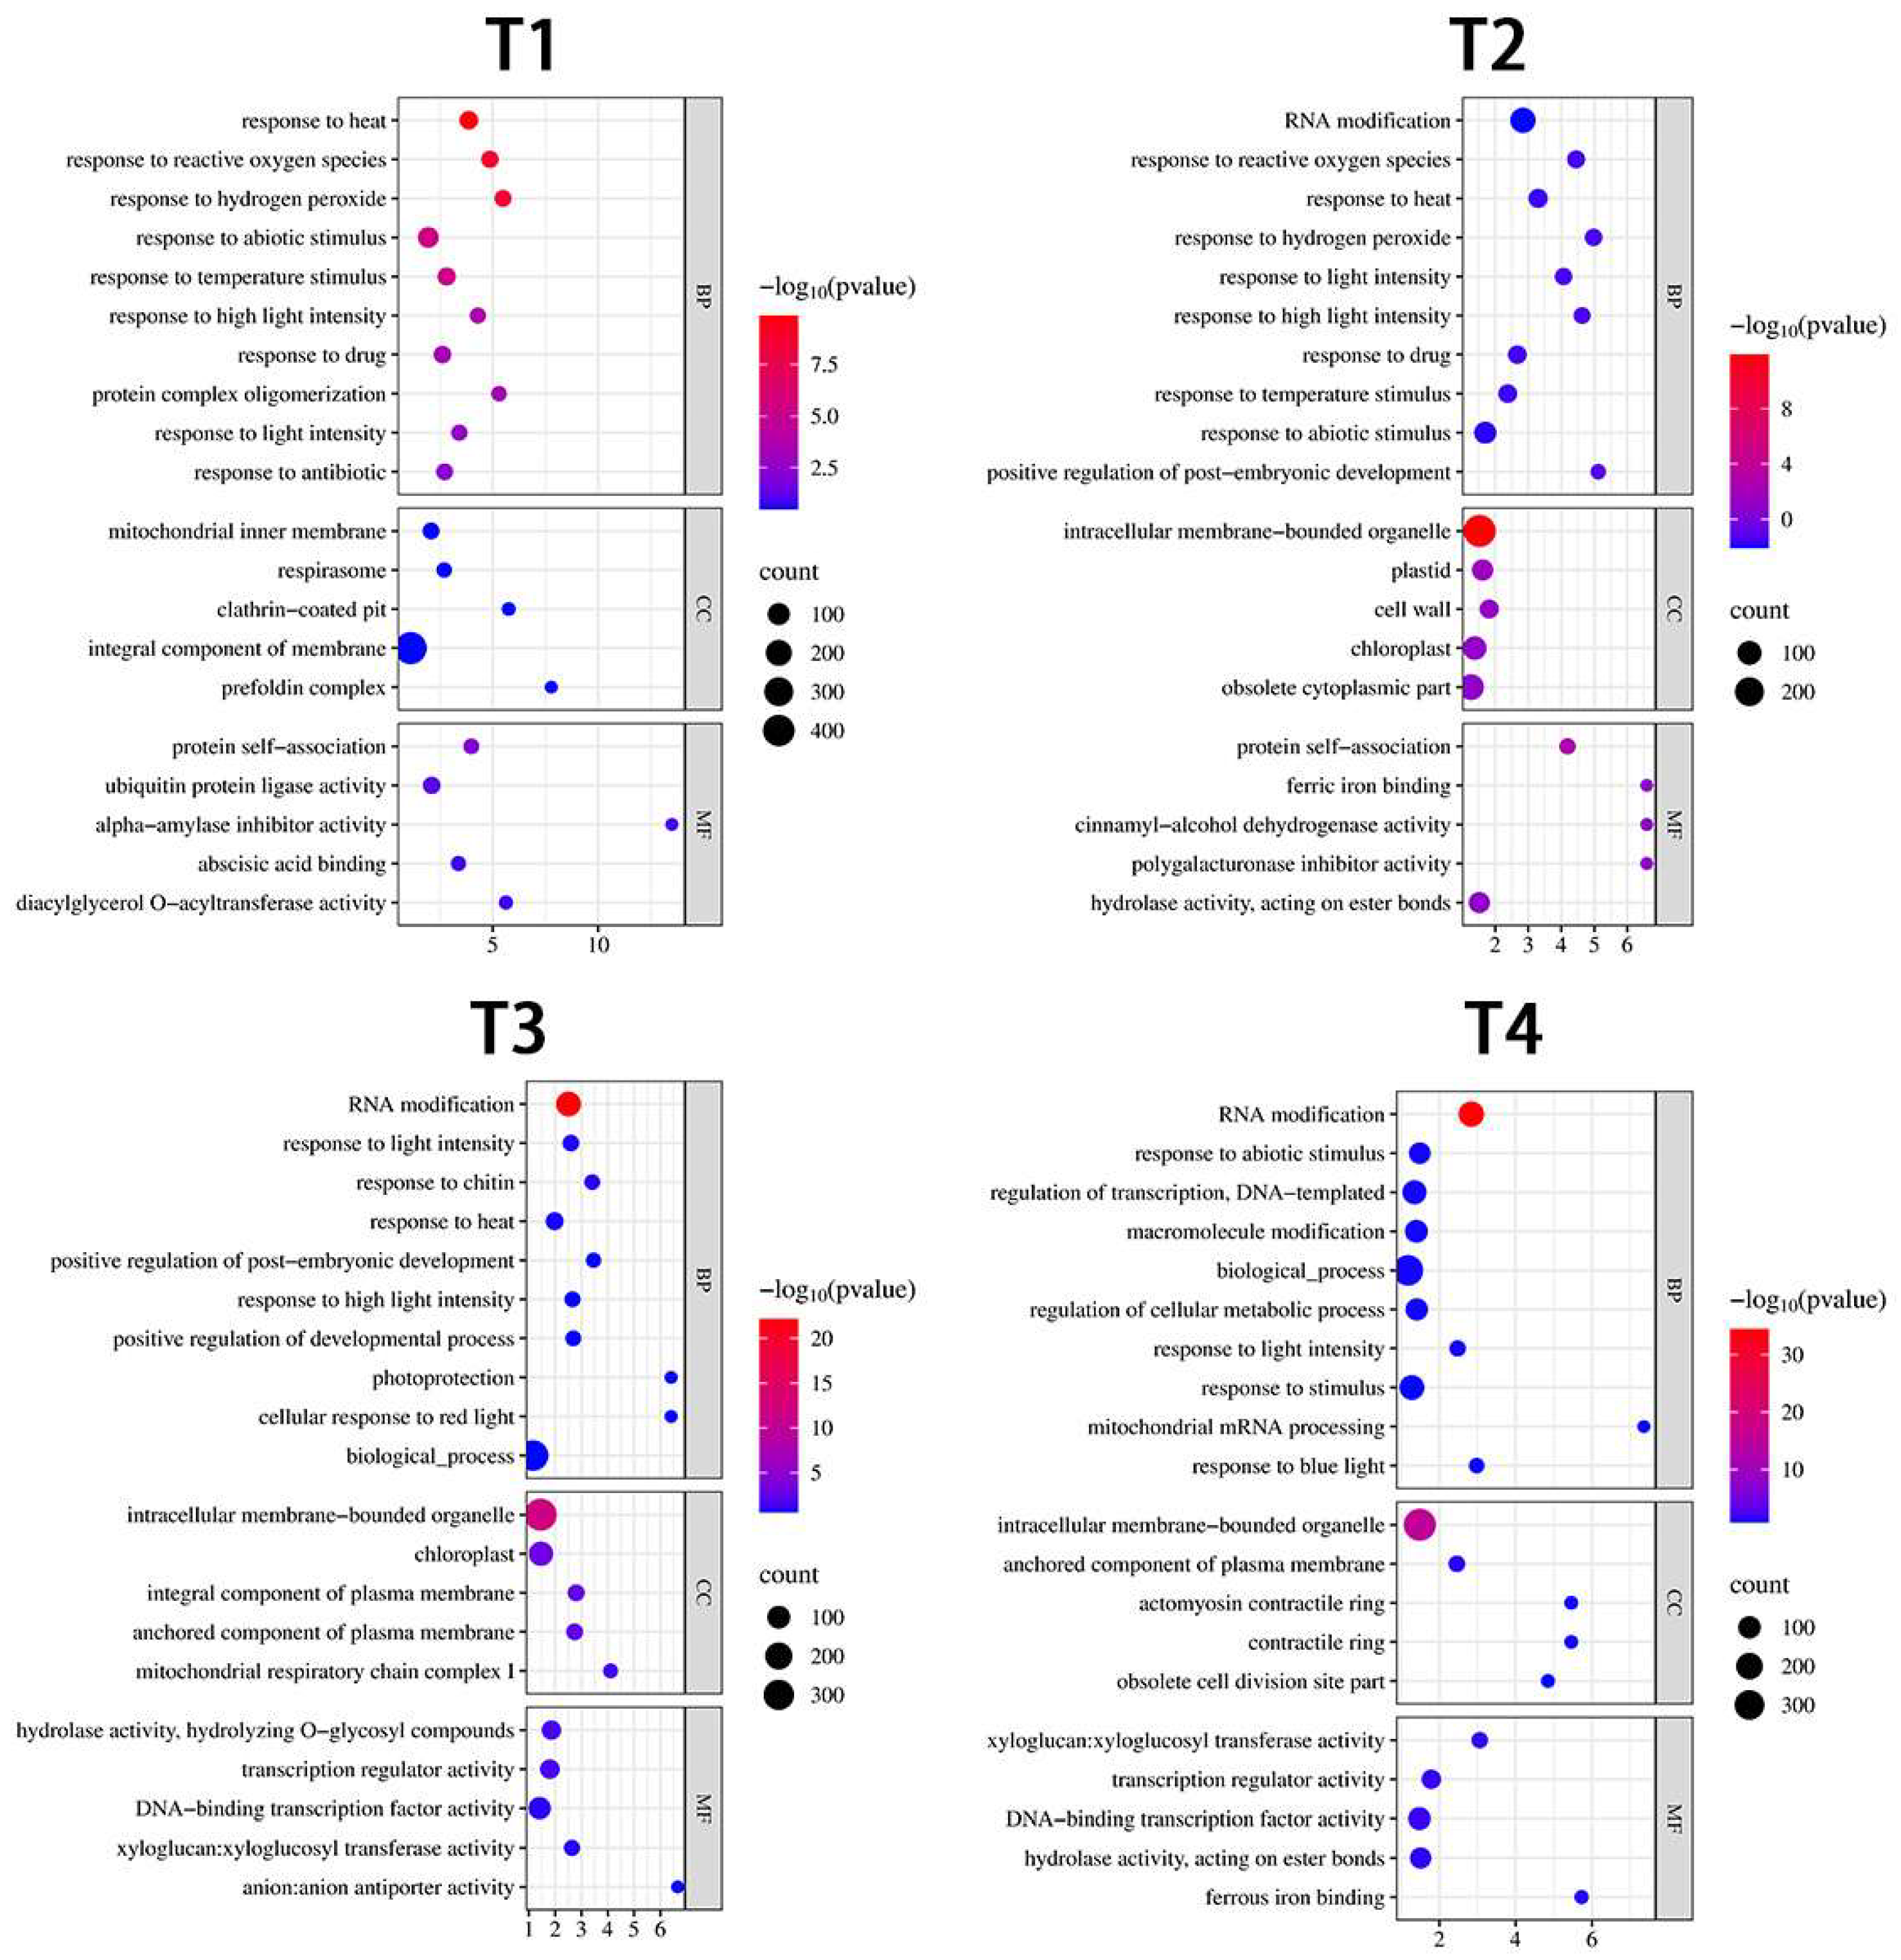
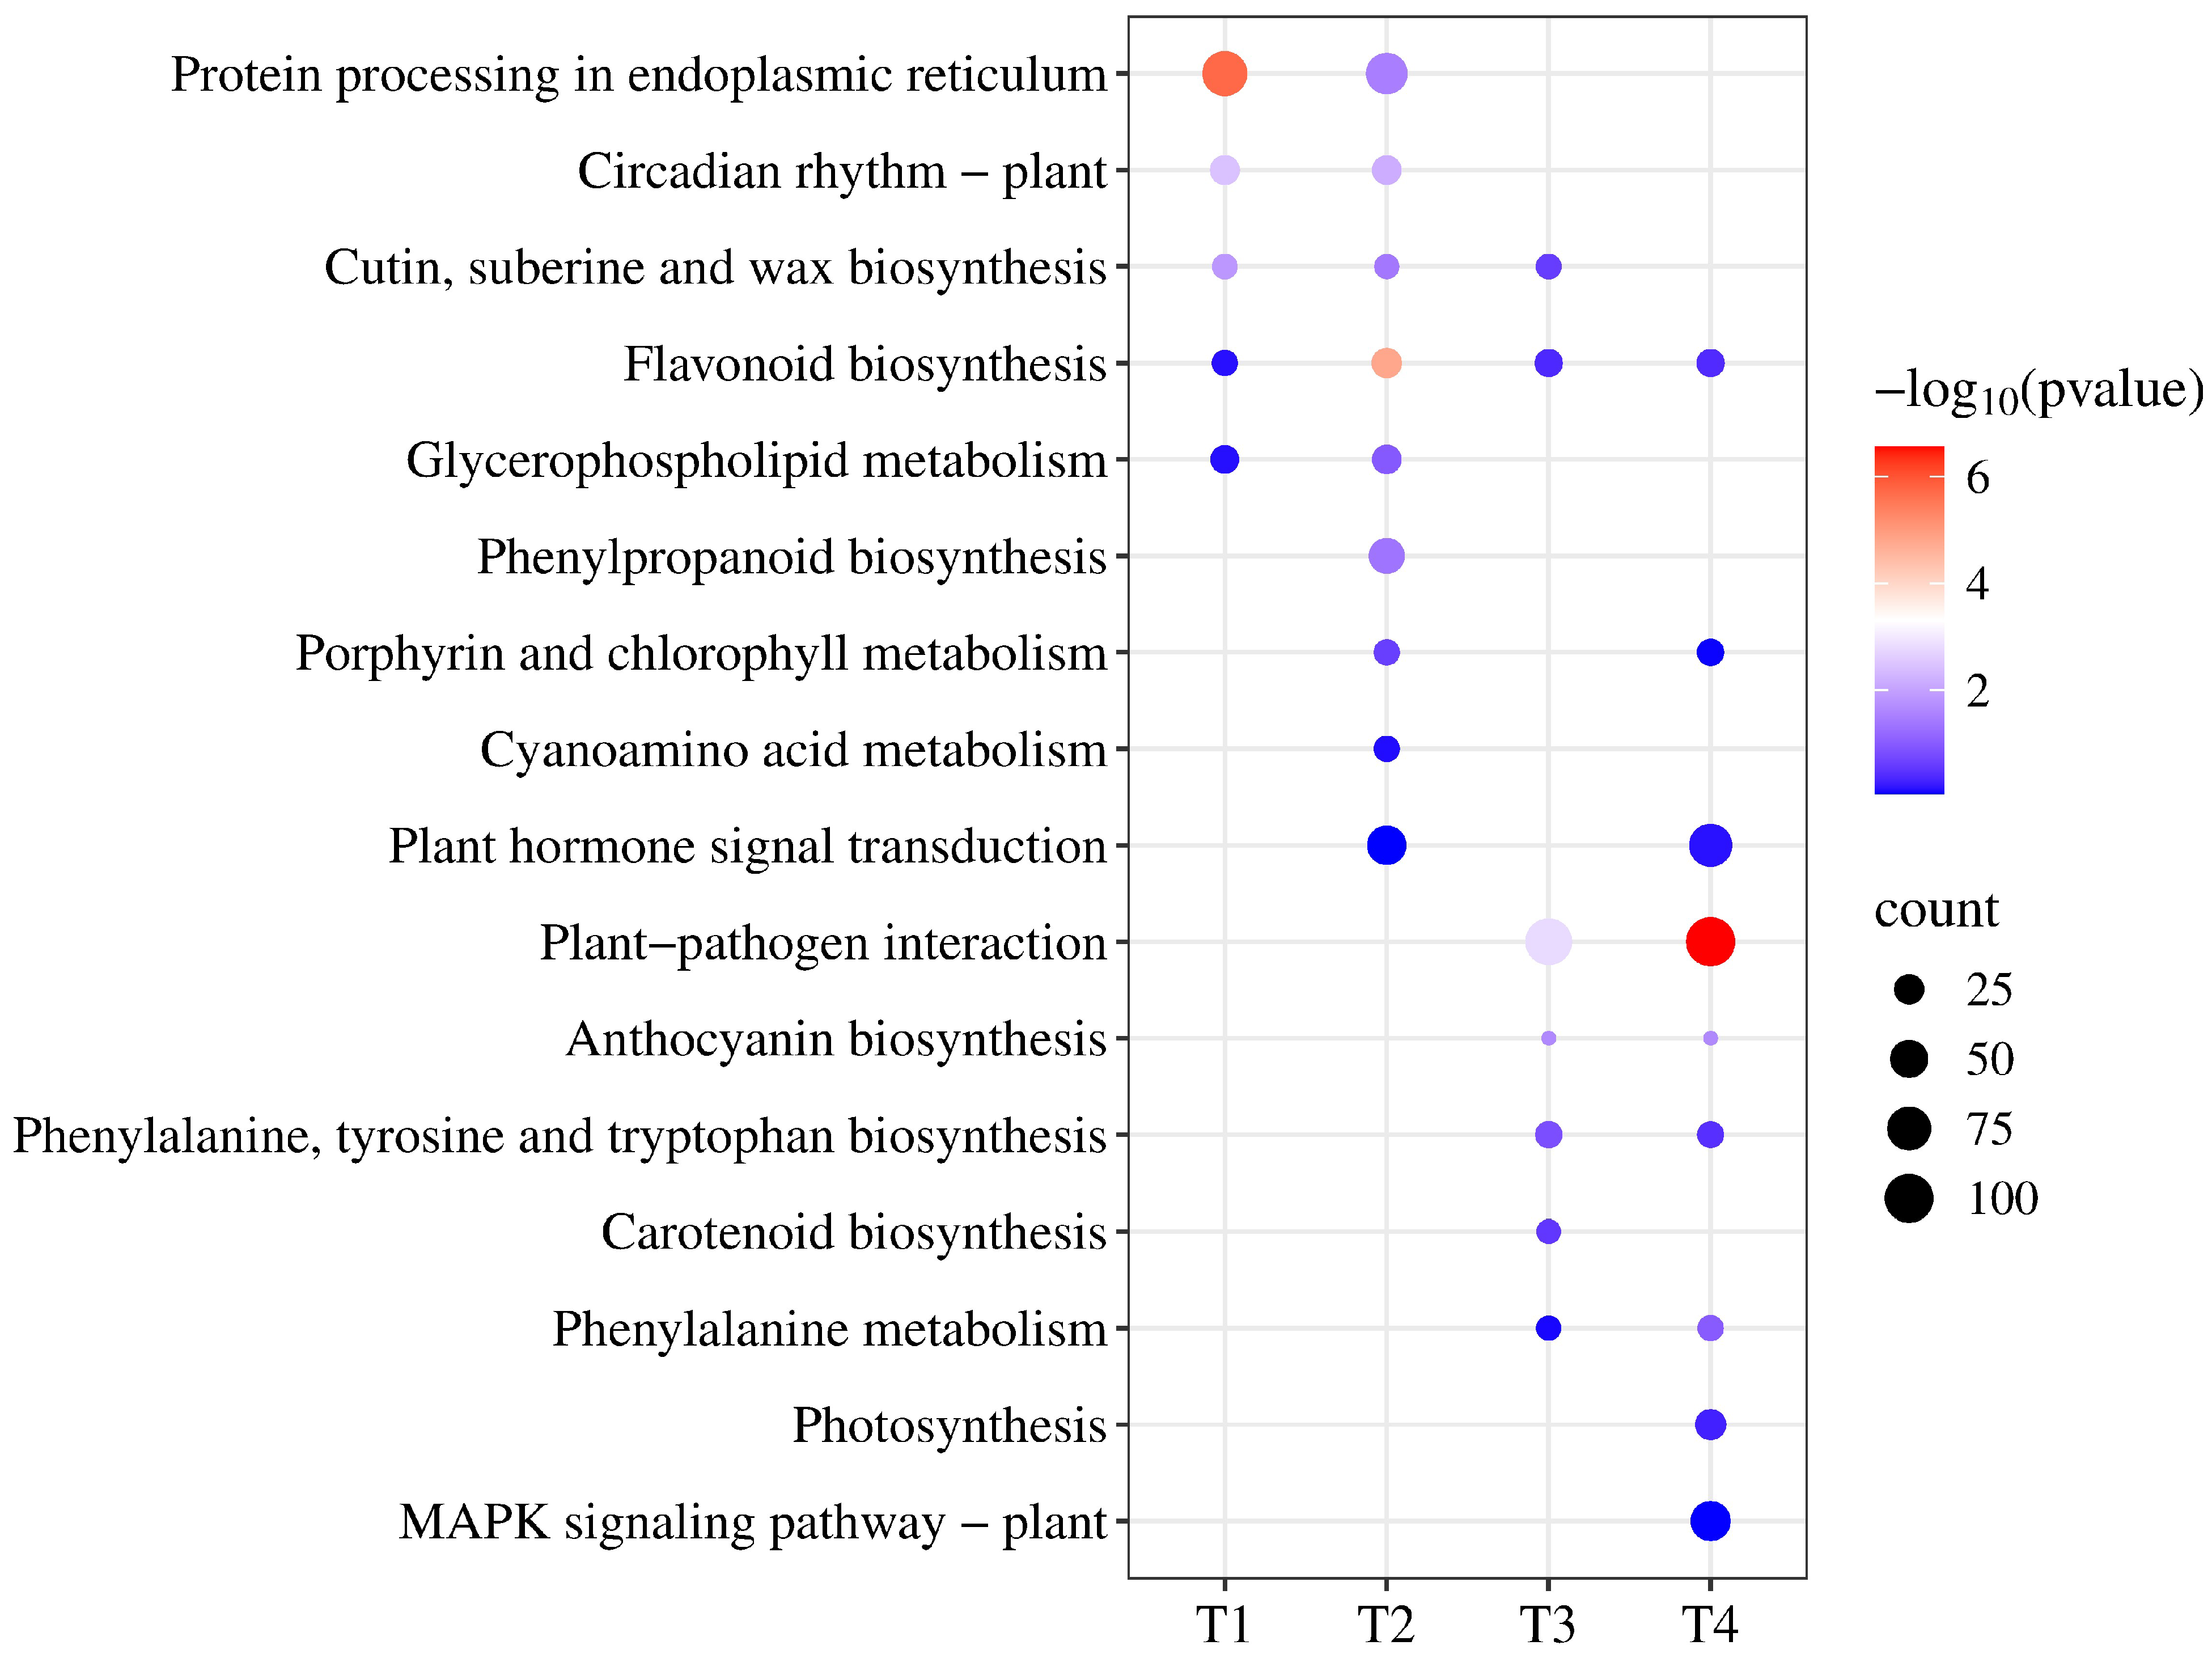
3.3. Functional Classification of DEGs

To elucidate the temporal dynamics of lily responses to high temperature, GO (Figure 3) and KEGG (Figure 4) enrichment analyses were performed for the four treatment time points (T1–T4). At T1, the majority of the functionally annotated DEGs were enriched in GO terms related to classical abiotic stress responses, such as response to heat, response to reactive oxygen species, and response to hydrogen peroxide. Additionally, terms related to membrane structure and function, including integral component of membrane and mitochondrial inner membrane, were also significantly enriched. These results indicate a rapid activation of stress perception and membrane-protective mechanisms in response to heat. At T2, the enrichment patterns shifted toward post-transcriptional regulation and organelle-associated processes. GO terms such as RNA modification, plastid, and chloroplast were significantly overrepresented, suggesting structural and functional adjustments in the plastid system under prolonged heat stress. At T3, the GO enrichment was dominated by terms associated with light signaling and developmental regulation, including photoprotection, response to red light, and positive regulation of development. These findings suggest a transition from acute stress response to modulation of photosynthetic activity and developmental processes. At T4, sustained transcriptional and metabolic adaptation was evident, as reflected by the enrichment of terms such as RNA modification, mitochondrial mRNA processing, and regulation of cellular metabolic processes. These suggest ongoing transcriptomic reprogramming aimed at maintaining energy homeostasis and cellular function during prolonged heat exposure.
The KEGG pathway analysis (Figure 4) revealed distinct temporal enrichment patterns. At T1, ‘protein processing in endoplasmic reticulum’ was significantly enriched, reflecting early stress responses. At T2, pathways such as ‘flavonoid biosynthesis’ and ‘phenylpropanoid biosynthesis’ were moderately enriched, and ‘plant hormone signal transduction’ appeared for the first time. At T3, the ‘anthocyanin biosynthesis’ pathway emerged with low significance, possibly reflecting transcriptional adjustment under pigment suppression. By T4, the ‘plant–pathogen interaction’ pathway became the most significantly enriched, along with re-enrichment of ‘plant hormone signal transduction’, suggesting active defense signaling and hormonal regulation in the late stage of stress adaptation.

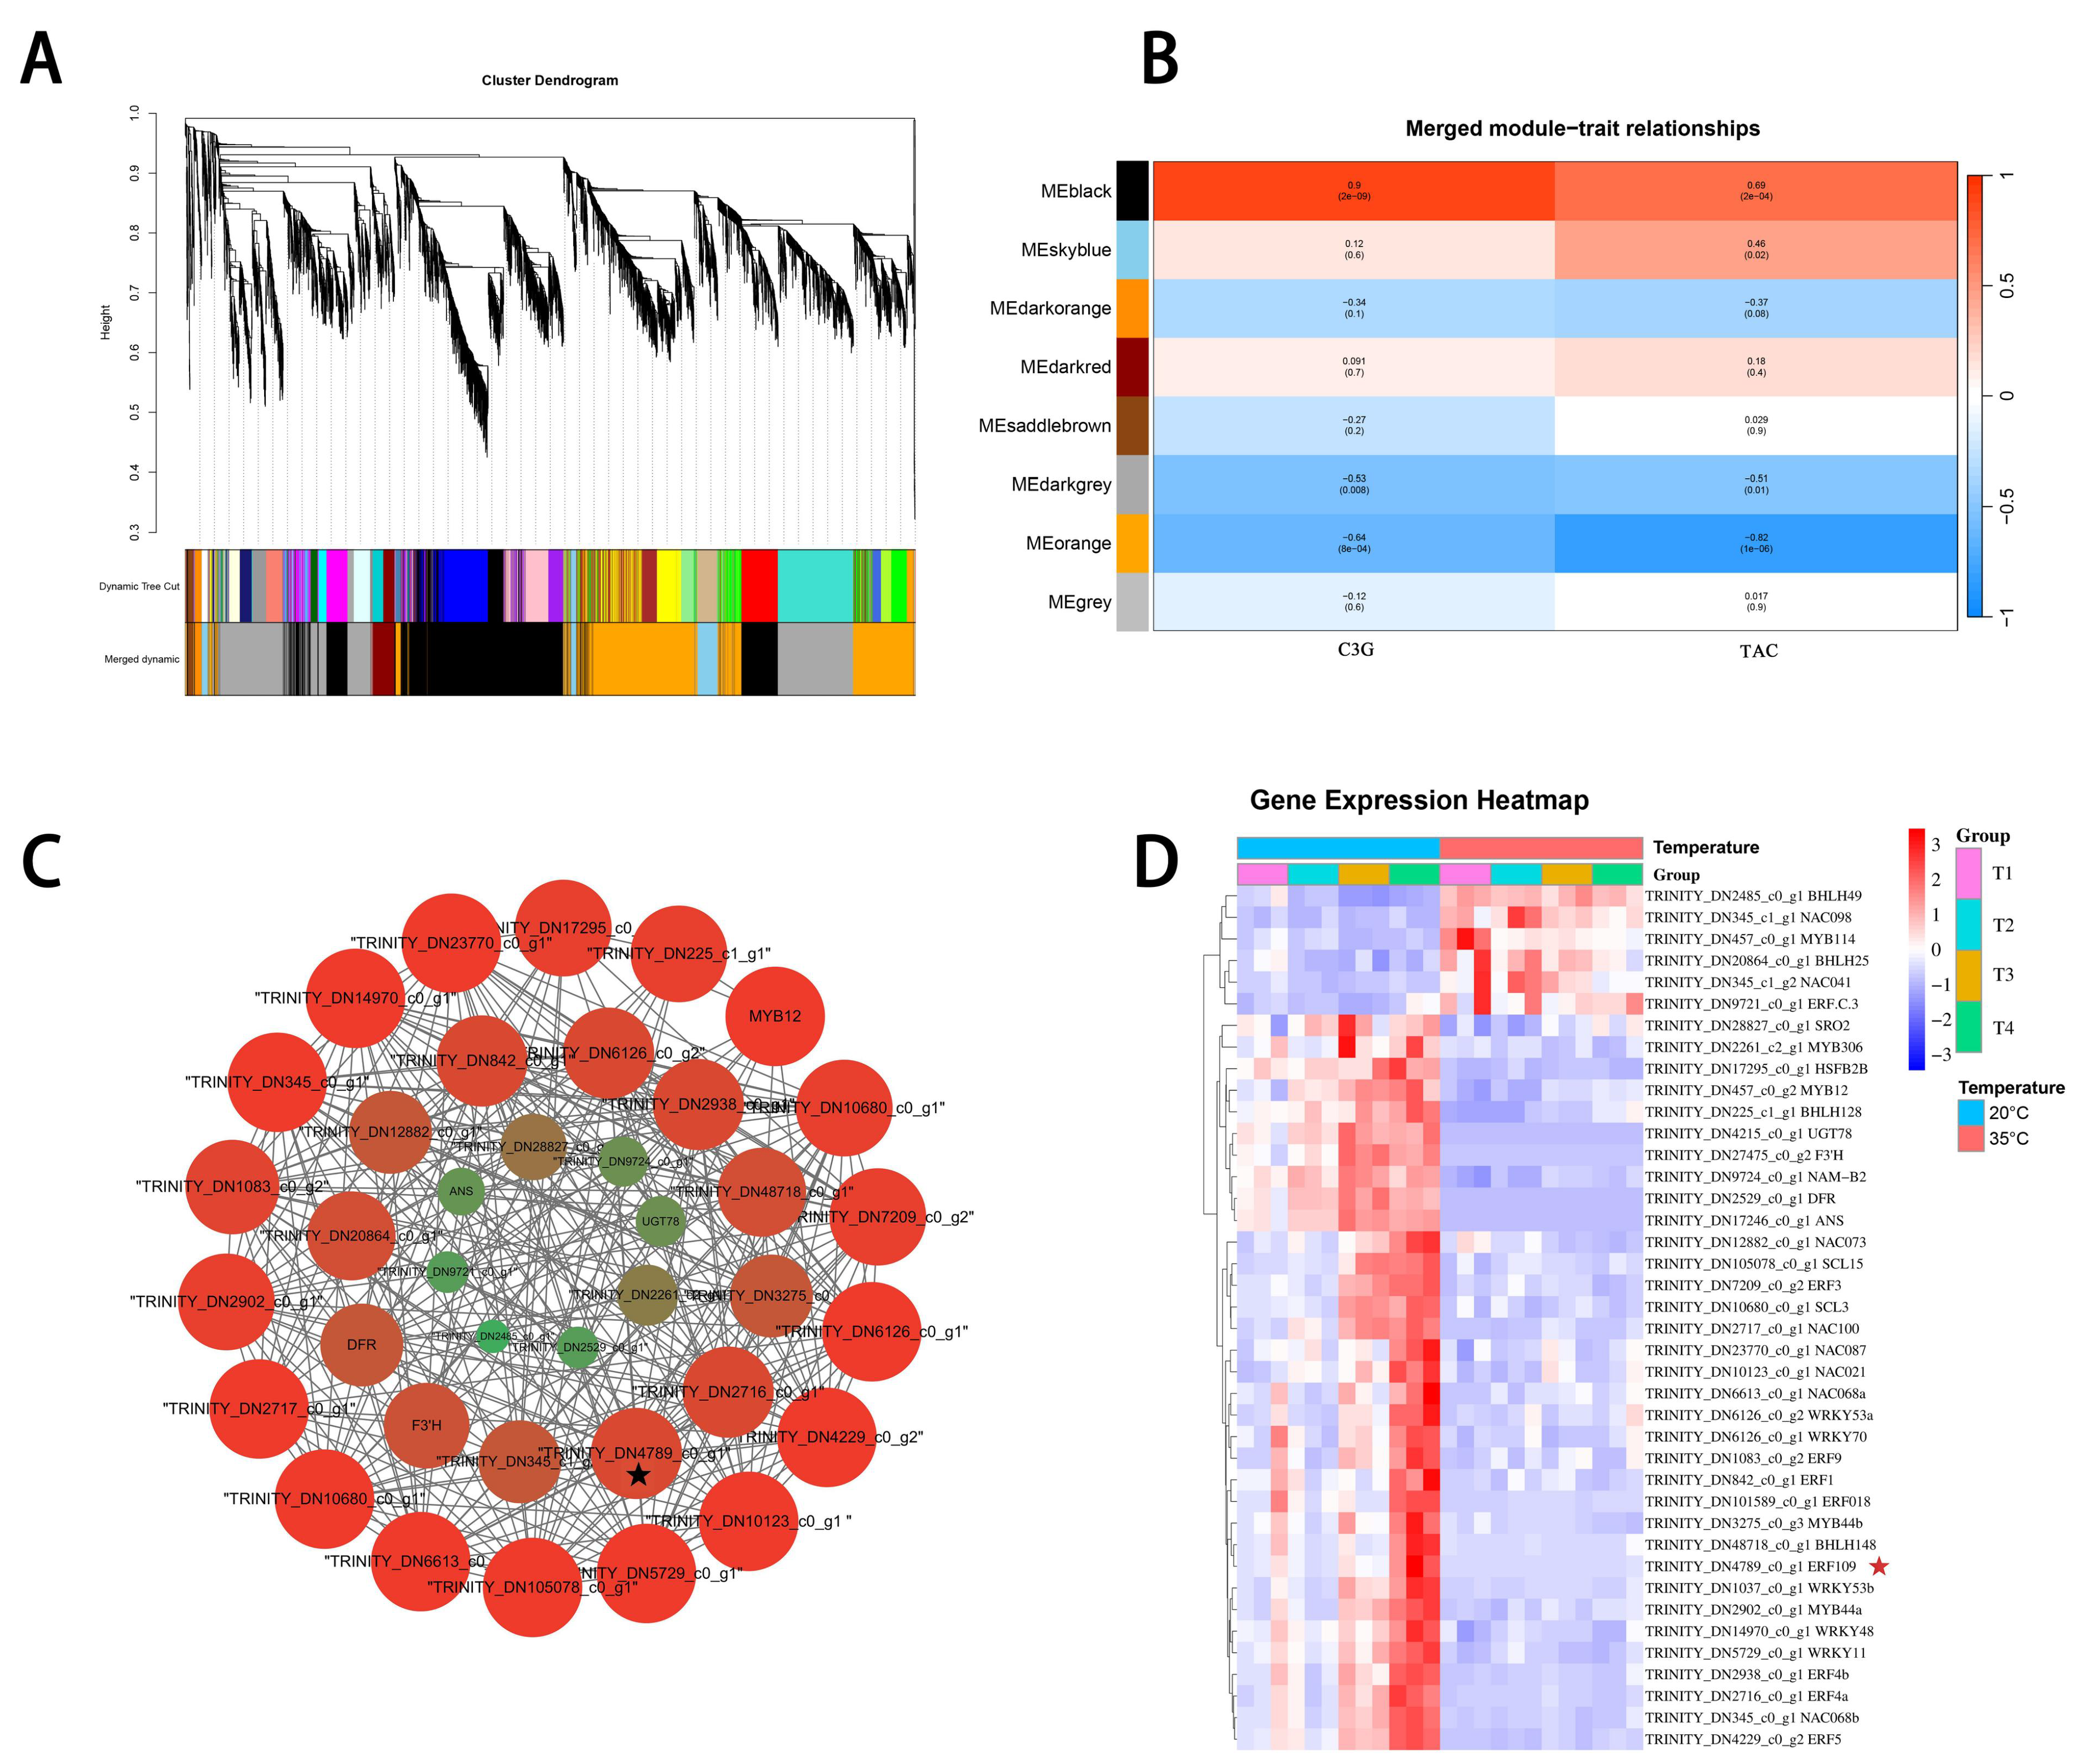
3.4. Anthocyanin-Related DEGs Revealed by Analysis of Co-Expression Networks

The weighted gene co-expression network analysis (WGCNA) resulted in the identification of eight distinct co-expression modules (Figure 5A,B). Among them, the black module (MEblack) showed the highest positive correlations with the cyanidin-3-O-rutinoside (C3G; r = 0.90, p < 0.01) and total anthocyanin contents (TAC; r = 0.69, p < 0.01), suggesting that the genes in this module may be key contributors to anthocyanin accumulation under thermal stress. The gene co-expression network was constructed using known anthocyanin-related genes, including the key transcription factor MYB12 and structural genes involved in the anthocyanin biosynthetic pathway (ANS, DFR, UGT78, and F3’H), along with potential regulatory transcription factors identified in the black module (Figure 5C). The network topology analysis revealed that MYB12 exhibited high connectivity with several structural genes and other transcription factors, making it a central hub gene in the network. The structural genes, particularly ANS and DFR, showed strong connections with multiple transcription factors, including members of the ERF, NAC, and BHLH families, suggesting complex regulatory mechanisms controlling anthocyanin biosynthesis under temperature stress. The network visualization was generated using Cytoscape with a weight threshold of 0.95.
The gene expression heatmap (Figure 5D) further corroborated these findings, showing significant differences in gene expression patterns between the 20 °C and 35 °C treatments. Most genes within the black module, including MYB12, ANS, DFR, and F3’H, were markedly upregulated under 20 °C and strongly repressed at 35 °C, consistent with the anthocyanin content reduction under heat stress. Notably, several transcription factors from the ERF, NAC, and WRKY families showed pronounced temperature sensitivity, reinforcing their potential regulatory roles in heat-induced anthocyanin suppression.
Overall, our WGCNA revealed a co-expression network that includes known anthocyanin biosynthetic genes and several transcription factors whose expression patterns are strongly correlated with temperature-dependent changes in anthocyanin accumulation. These transcription factors represent potential candidates for regulators of anthocyanin accumulation.

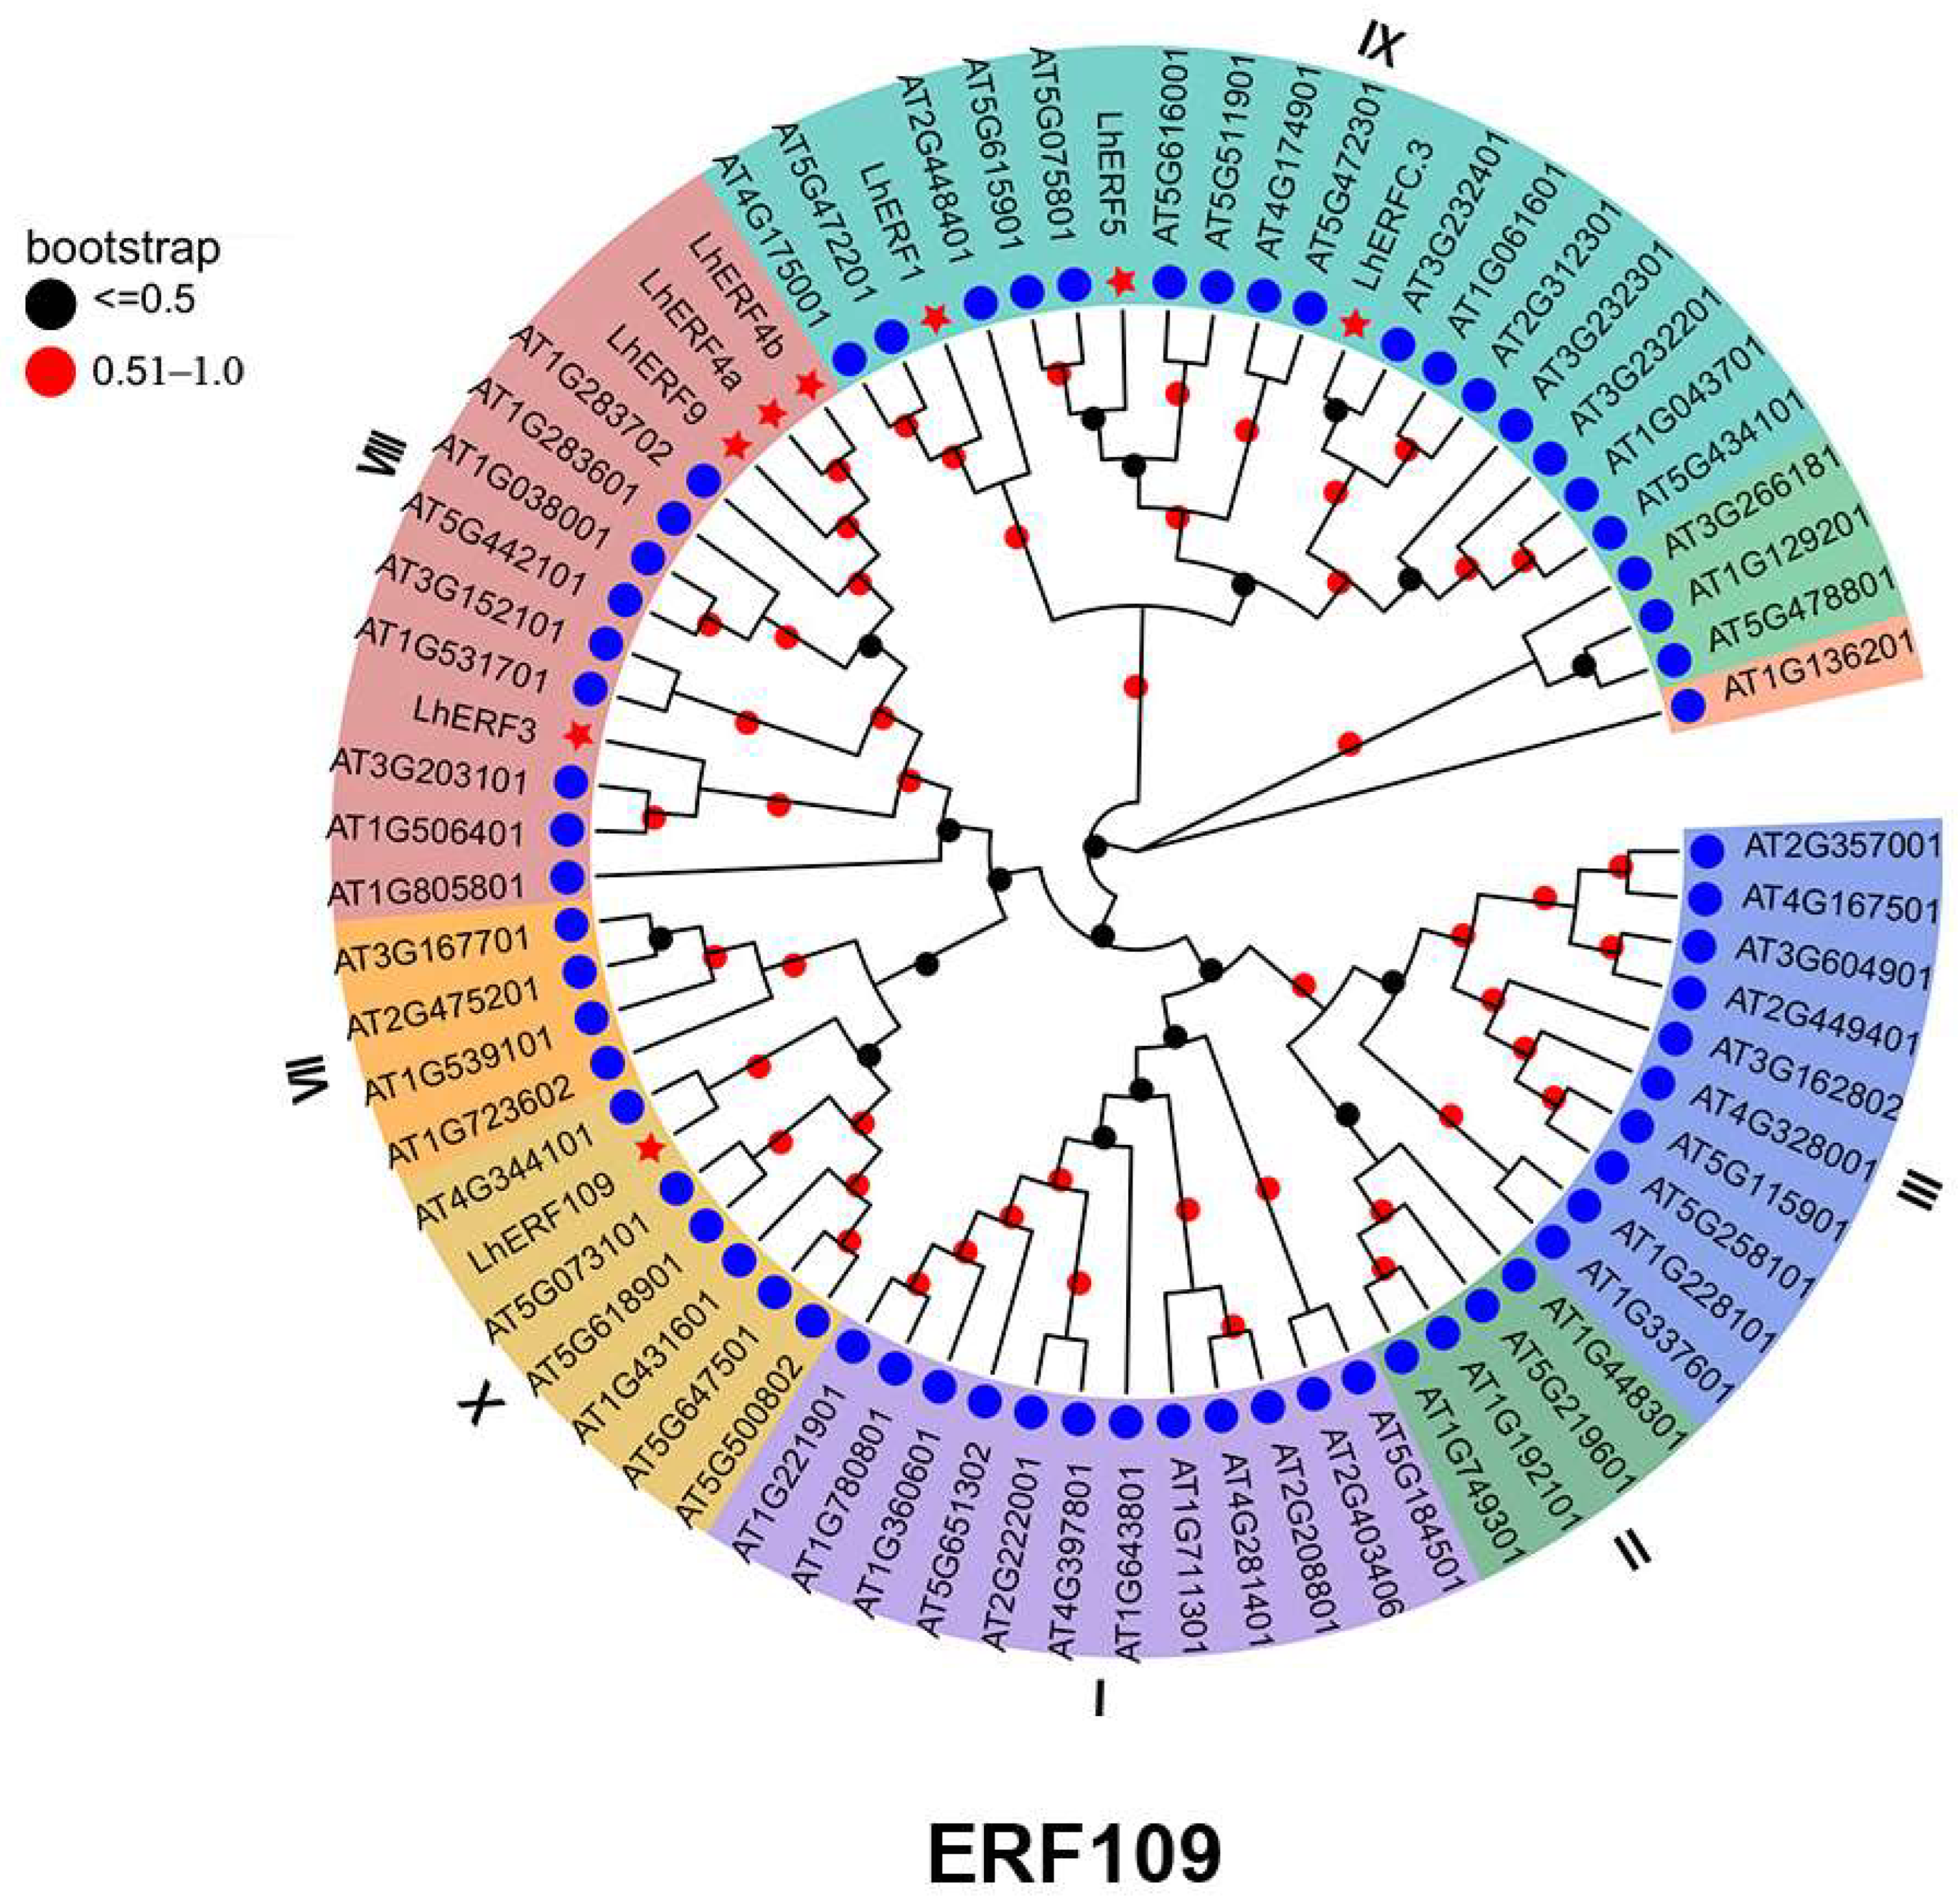
3.5. Phylogenetic and Functional Characterization of LhERF109 as a Positive Regulator of Anthocyanin Biosynthesis

To explore the evolutionary context of LhERF109 and guide our functional studies, a phylogenetic analysis was performed to compare it with ERF family members from Arabidopsis thaliana. Understanding the phylogenetic positioning of transcription factors is crucial for predicting their potential functions and integrating new findings with established knowledge across plant species. This approach is particularly useful for non-model plants, as functional predictions can be made based on well-characterized homologs in model species such as Arabidopsis thaliana.
The phylogenetic analysis revealed that LhERF109 belongs to the ERF subfamily Group X and clusters closely with AtERF109 (At4g34410) from Arabidopsis thaliana, with strong bootstrap support (92%) (Figure 6). This close evolutionary relationship provides essential context for interpreting our functional results and forming targeted hypotheses regarding the role of LhERF109 in stress response pathways.
LhERF109 plays a critical role in regulating anthocyanin biosynthesis, as demonstrated through the functional assays conducted in the Oriental lily cultivar ‘Sorbonne’, which was selected due to its pigmentation pattern and high-temperature response closely resembling those of ‘Souvenir’. Compared with the control (S1300), transient overexpression of LhERF109 (LhERF109-S1300) significantly enhanced anthocyanin accumulation in the tepals, resulting in deeper purple-red pigmentation (Figure 7A). Conversely, silencing of LhERF109 (LhERF109-TRV) markedly reduced anthocyanin accumulation, leading to lighter coloration compared to the TRV control (Figure 7A). Quantitative RT-PCR confirmed the successful overexpression and silencing of LhERF109 in the respective treatments (Figure 7B).
Consistent with the phenotypic changes, anthocyanin biosynthetic genes showed differential expression patterns across the treatments. Early- and middle-stage genes including LhMYB12, LhWD40a, LhCHSb, and LhANS were significantly upregulated in LhERF109-S1300 compared to the control, while they were downregulated in the LhERF109-TRV treatment (Figure 7C). Notably, LhBHLH2 expression remained relatively stable in the overexpression treatment but was significantly reduced in the silenced group.
For late-stage and transport-related genes, most followed a similar pattern, with LhUGT2, LhUGT3, and LhGSTF10 showing strong upregulation in LhERF109-S1300 and downregulation in LhERF109-TRV (Figure 7D). Interestingly, LhF3H displayed the opposite regulation pattern: downregulated in LhERF109-S1300 and upregulated in LhERF109-TRV. LhDFR exhibited unique behavior with upregulation in both the overexpression and silencing treatments, though through potentially different mechanisms. LhF3’H showed a minimal response to LhERF109 manipulation, suggesting a different regulatory control mechanism for this gene.
These results demonstrate that LhERF109 functions as a positive regulator of anthocyanin biosynthesis in Oriental lily by modulating the expression of key structural and regulatory genes in the anthocyanin pathway, with gene-specific regulatory patterns that suggest a complex control network.

4. Discussion

High temperature is widely recognized as a negative environmental factor that suppresses anthocyanin biosynthesis in various plant species [13], yet the underlying regulatory mechanisms can differ greatly between tissues and taxa. In this study, transcriptome profiling of Oriental lily (‘Souvenir’) tepals exposed to elevated temperatures revealed a multifaceted transcriptional response, encompassing oxidative stress responses, membrane stabilization, and regulation of metabolic processes. The GO and KEGG enrichment analyses indicated a time-resolved response to heat stress, shifting from early protein processing and ROS detoxification to hormone signaling and secondary metabolite reprogramming, including the anthocyanin biosynthetic pathway.
Compared to other species such as apple [50], grape [51] and chrysanthemum [52], where heat stress primarily modulates flavonoid pathways through carbohydrate metabolism or direct repression of structural genes, lilies exhibit a more integrated regulatory network. In Lilium, although the sucrose levels significantly declined under heat stress, the pattern of sucrose dynamics was not fully consistent with that of anthocyanin-related gene expression, suggesting that sugar depletion may contribute to, but does not solely determine, the pigment suppression [53,54]. Soluble sugars exhibited partial recovery at later time points, likely reflecting general osmotic adjustments rather than the direct restoration of pigmentation. Therefore, sugar metabolism likely plays a supportive rather than central role in the temperature-sensitive regulation of anthocyanin biosynthesis in lilies. Nonetheless, prior studies have shown that the exogenous application of sucrose can partially restore pigmentation under stress conditions [55,56,57,58].
This interpretation extends the recent findings by Yang et al. [4] who proposed that heat stress redirects flavonoid metabolism from anthocyanin to isoflavone synthesis. In our study, the total anthocyanin content was significantly reduced under the high-temperature treatment. Our transcriptomic data suggested a broader transcriptional repression rather than a targeted metabolic redirection. This pattern resembles the findings in cereal crops, where heat stress induces systemic reprogramming of primary metabolism, hormone signaling, and secondary metabolism [59]. These observations reinforce the view that anthocyanin suppression in lilies under heat stress is a multifactorial process and highlight the importance of species-specific regulatory strategies in maintaining flower color stability.
Using WGCNA, we identified the ‘black’ module as the one that was most significantly correlated with anthocyanin traits. This module contained a number of known structural and regulatory genes in the anthocyanin pathway. Among them, LhERF109 was strongly co-expressed with pigment-related genes, including MYB12, DFR, and ANS. Although LhERF109 did not exhibit the highest network centrality, its expression pattern and correlation with the anthocyanin content suggested a potential regulatory role. Functional validation using transient transformation in the heat-sensitive ‘Sorbonne’ cultivar confirmed this role: overexpression of LhERF109 enhanced tepal pigmentation and upregulated key regulatory and biosynthetic genes such as LhMYB12, LhCHSb, LhDFR, LhANS, and LhUGT2. In contrast, silencing LhERF109 reduced the anthocyanin content and downregulated these genes, establishing LhERF109 as a positive regulator of pigment biosynthesis under heat stress.
While our findings are rooted in Oriental lily, the regulatory model parallels broader insights from other plant systems. Notably, LhERF109 shares high sequence similarity with AtERF109, a Group X ERF transcription factor in Arabidopsis thaliana known to mediate jasmonic acid and auxin crosstalk and to function in stress-responsive developmental processes [60]. This homology suggests that LhERF109 may act as a lily-specific analog, integrating hormone signaling pathways into the transcriptional regulation of anthocyanin biosynthesis.
In conclusion, our results suggest that LhERF109 is a heat-responsive transcription factor associated with the regulation of anthocyanin biosynthesis in Oriental lily. The functional validation through qRT-PCR indicated that LhERF109 may influence both upstream regulatory and downstream structural genes involved in pigment formation under high temperatures. While its precise regulatory mode—whether direct or indirect—remains to be confirmed, these findings highlight LhERF109 as a gene of interest for future studies. Further investigation is needed to determine its potential interaction with components such as the MYB-bHLH-WD40 (MBW) complex and to explore its responsiveness to hormonal and thermal cues.

5. Conclusions

In this study, we explored the molecular response of Oriental lily to high-temperature stress, focusing on the transcriptional regulation of anthocyanin biosynthesis. Transcriptome analysis combined with WGCNA revealed that anthocyanin biosynthesis was significantly inhibited at elevated temperatures, primarily through downregulation of key structural and regulatory genes. Among the identified modules, the ‘black’ module exhibited the strongest correlation with anthocyanin traits, and LhERF109 emerged as a candidate regulator. The functional validation through transient overexpression and silencing suggested that LhERF109 may positively influence the expression of anthocyanin biosynthesis-related genes under heat stress. These findings provide important insights into the transcriptional control of anthocyanin synthesis in lilies and offer a potential molecular target for improving floral pigment stability under adverse temperature conditions. Future work will further investigate the regulatory mechanisms of LhERF109, including its downstream targets and possible interaction with hormone-responsive pathways or transcription factor complexes.

Supplementary Materials

The following supporting information can be downloaded at: https://www.mdpi.com/article/10.3390/agronomy15051071/s1, Table S1: Primer sequences for qRT-PCR of ‘Souvenir’ lily; Table S2: Primer sequences used for cloning of ‘Souvenir’ lily LhERF109.

Author Contributions

M.Z. and L.Z.: writing—original draft, visualization, data curation, writing—review and editing. F.L. and C.J.: resources, supervision, methodology, writing—review and editing. J.Z.: methodology. X.Y. and M.W.: validation, data curation, conceptualization. B.J. and Y.J.: supervision, investigation. H.Y.: resources. J.W.: conceptualization, supervision, funding acquisition. Y.P.: conceptualization, writing—review and editing, investigation, supervision, project administration, funding acquisition. All authors have read and agreed to the published version of the manuscript.

Funding

This work was supported by the Natural Science Foundation of Sichuan Province (grant number 2023NSFSC0139), Sichuan Province ‘14th Five-Year Plan’ Breeding Research Project (grant number 2021YFYZ0006), Yunnan Xingdian Talents Special Selection Project for High-Level Scientific and Technological Talents and Innovation Teams (202505AS350021), Industrial Talent Special Project of the High-Level Talent Introduction Program of Yunnan Province (YNQR-CYRC-2020-004), and Yunnan Xingdian Talents Youth Special Project (XDYC-QNRC-2022-0731).

Data Availability Statement

The raw data supporting the conclusions of this article will be made available by the authors on request.

Conflicts of Interest

The authors have no conflicts of interest to declare.

References

  1. Lu, Z.; Wang, X.; Lin, X.; Mostafa, S.; Zou, H.; Wang, L.; Jin, B. Plant anthocyanins: Classification, biosynthesis, regulation, bioactivity, and health benefits. Plant Physiol. Biochem. 2024, 217, 109268. [Google Scholar] [CrossRef] [PubMed]
  2. Manzoor, M.A.; Xu, Y.; Lv, Z.; Xu, J.; Shah, I.H.; Sabir, I.A.; Wang, Y.; Sun, W.; Liu, X.; Wang, L.; et al. Horticulture crop under pressure: Unraveling the impact of climate change on nutrition and fruit cracking. J. Environ. Manag. 2024, 357, 120759. [Google Scholar] [CrossRef]
  3. Yamagishi, M.; Nakatsuka, T. LhMYB12, Regulating Tepal Anthocyanin Pigmentation in Asiatic Hybrid Lilies, Is Derived from Lilium dauricum and L. bulbiferum. Hortic. J. 2017, 86, 528–533. [Google Scholar] [CrossRef]
  4. Yang, J.; Guo, C.; Chen, F.; Lv, B.; Song, J.; Ning, G.; He, Y.; Lin, J.; He, H.; Yang, Y.; et al. Heat-induced modulation of flavonoid biosynthesis via a LhMYBC2-Mediated regulatory network in oriental hybrid lily. Plant Physiol. Biochem. 2024, 214, 108966. [Google Scholar] [CrossRef]
  5. Mori, K.; Goto-Yamamoto, N.; Kitayama, M.; Hashizume, K. Loss of anthocyanins in red-wine grape under high temperature. J. Exp. Bot. 2007, 58, 1935–1945. [Google Scholar] [CrossRef]
  6. Lin-Wang, K.; Micheletti, D.; Palmer, J.; Volz, R.; Lozano, L.; Espley, R.; Hellens, R.P.; Chagnè, D.; Rowan, D.D.; Troggio, M.; et al. High temperature reduces apple fruit colour via modulation of the anthocyanin regulatory complex. Plant Cell Environ. 2011, 34, 1176–1190. [Google Scholar] [CrossRef]
  7. Rowan, D.D.; Cao, M.; Lin-Wang, K.; Cooney, J.M.; Jensen, D.J.; Austin, P.T.; Hunt, M.B.; Norling, C.; Hellens, R.P.; Schaffer, R.J.; et al. Environmental regulation of leaf colour in red 35S Arabidopsis thaliana. New Phytol. 2009, 182, 102–115. [Google Scholar] [CrossRef] [PubMed]
  8. Rehman, R.N.U.; You, Y.; Zhang, L.; Goudia, B.D.; Khan, A.R.; Li, P.; Ma, F. High Temperature Induced Anthocyanin Inhibition and Active Degradation in Malus profusion. Front. Plant Sci. 2017, 8, 1401. [Google Scholar] [CrossRef]
  9. Bai, S.; Saito, T.; Honda, C.; Hatsuyama, Y.; Ito, A.; Moriguchi, T. An apple B-box protein, MdCOL11, is involved in UV-B- and temperature-induced anthocyanin biosynthesis. Planta 2014, 240, 1051–1062. [Google Scholar] [CrossRef]
  10. Fang, H.; Dong, Y.; Yue, X.; Chen, X.; He, N.; Hu, J.; Jiang, S.; Xu, H.; Wang, Y.; Su, M.; et al. MdCOL4 interaction mediates crosstalk between UV-B and high temperature to control fruit coloration in apple. Plant Cell Physiol. 2019, 60, 1055–1066. [Google Scholar] [CrossRef]
  11. Kim, S.; Hwang, G.; Lee, S.; Zhu, J.-Y.; Paik, I.; Nguyen, T.T.; Kim, J.; Oh, E. High Ambient Temperature Represses Anthocyanin Biosynthesis through Degradation of HY5. Front. Plant Sci. 2017, 8, 1787. [Google Scholar]
  12. Nguyen, N.H. HY5, an integrator of light and temperature signals in the regulation of anthocyanins biosynthesis in Arabidopsis. Aimsmoles 2020, 7, 70–81. [Google Scholar] [CrossRef]
  13. Yamagishi, M. Mechanisms by Which High Temperatures Suppress Anthocyanin Coloration in Flowers and Fruits, and Discovery of Floricultural Crops that Exhibit High-temperature-tolerant Flower Pigmentation. Hortic. J. 2024, 93, 203–215. [Google Scholar] [CrossRef]
  14. Liu, Z.; Zhang, Y.; Wang, J.; Li, P.; Zhao, C.; Chen, Y.; Bi, Y. Phytochrome-interacting factors PIF4 and PIF5 negatively regulate anthocyanin biosynthesis under red light in Arabidopsis seedlings. Plant Sci. 2015, 238, 64–72. [Google Scholar] [CrossRef]
  15. Li, Y.; Shan, X.; Gao, R.; Han, T.; Zhang, J.; Wang, Y.; Kimani, S.; Wang, L.; Gao, X. MYB repressors and MBW activation complex collaborate to fine-tune flower coloration in Freesia hybrida. Commun. Biol. 2020, 3, 396. [Google Scholar] [CrossRef] [PubMed]
  16. Li, Z.; Zhou, H.; Chen, Y.; Chen, M.; Yao, Y.; Luo, H.; Wu, Q.; Wang, F.; Zhou, Y. Analysis of Transcriptional and Metabolic Differences in the Petal Color Change Response to High-Temperature Stress in Various Chrysanthemum Genotypes. Agronomy 2024, 14, 2863. [Google Scholar] [CrossRef]
  17. An, W.; Sun, Y.; Gao, Z.; Liu, X.; Guo, Q.; Sun, S.; Zhang, M.; Han, Y.; Irfan, M.; Chen, L.; et al. LvbHLH13 Regulates Anthocyanin Biosynthesis by Activating the LvMYB5 Promoter in Lily (Lilium ‘Viviana’). Horticulturae 2024, 10, 926. [Google Scholar] [CrossRef]
  18. Wang, N.; Song, G.; Zhang, F.; Shu, X.; Cheng, G.; Zhuang, W.; Wang, T.; Li, Y.; Wang, Z. Characterization of the WRKY Gene Family Related to Anthocyanin Biosynthesis and the Regulation Mechanism under Drought Stress and Methyl Jasmonate Treatment in Lycoris radiata. Int. J. Mol. Sci. 2023, 24, 2423. [Google Scholar] [CrossRef]
  19. Xie, Z.; Nolan, T.M.; Jiang, H.; Yin, Y. AP2/ERF Transcription Factor Regulatory Networks in Hormone and Abiotic Stress Responses in Arabidopsis. Front. Plant Sci. 2019, 10, 1177. [Google Scholar] [CrossRef]
  20. Zhang, S.; Chen, Y.; Zhao, L.; Li, C.; Yu, J.; Li, T.; Yang, W.; Zhang, S.; Su, H.; Wang, L. A novel NAC transcription factor, MdNAC42, regulates anthocyanin accumulation in red-fleshed apple by interacting with MdMYB10. Tree Physiol. 2020, 40, 413–423. [Google Scholar] [CrossRef]
  21. Zhang, Y.; Sun, Y.; Du, W.; Sun, S.; Zhang, S.; Nie, M.; Liu, Y.; Irfan, M.; Zhang, L.; Chen, L. Ethylene positively regulates anthocyanin synthesis in “Viviana” lily via the LvMYB5-LvERF113-LvMYB1 module. Hortic. Res. 2025, 12, uhaf059. [Google Scholar] [CrossRef]
  22. Zhang, X.; Yu, L.; Zhang, M.; Wu, T.; Song, T.; Yao, Y.; Zhang, J.; Tian, J. MdWER interacts with MdERF109 and MdJAZ2 to mediate methyl jasmonate- and light-induced anthocyanin biosynthesis in apple fruit. Plant J. 2024, 118, 1327–1342. [Google Scholar] [CrossRef] [PubMed]
  23. Grassotti, A.; Gimelli, F. Bulb and cut flower production in the genus Lilium: Current status and the future. Acta Hortic. 2011, 900, 21–35. [Google Scholar] [CrossRef]
  24. Van Tuyl, J.M.; Arens, P. Lilium: Breeding history of the modern cultivar assortment. Acta Hortic. 2011, 900, 223–230. [Google Scholar] [CrossRef]
  25. Natenapit, J.; Taketa, S.; Narumi, T.; Fukai, S. Crossing of Allotriploid LLO Hybrid and Asiatic Lilies (Lilium). Hortic. Environ. Biotechnol. 2010, 51, 426–430. [Google Scholar]
  26. Barba-Gonzalez, R.; Van Silfhout, A.A.; Visser, R.G.F.; Ramanna, M.S.; Van Tuyl, J.M. Progenies of allotriploids of Oriental × Asiatic lilies (Lilium) examined by GISH analysis. Euphytica 2006, 151, 243–250. [Google Scholar] [CrossRef]
  27. Zhou, M.; Yong, X.; Zhu, J.; Xu, Q.; Liu, X.; Zhang, L.; Mou, L.; Zeng, L.; Wu, M.; Jiang, B.; et al. Chromosomal analysis of progenies between Lilium intersectional hybrids and wild species using ND-FISH and GISH. Front. Plant Sci. 2024, 15, 1461798. [Google Scholar] [CrossRef]
  28. Lai, Y.-S.; Yamagishi, M.; Suzuki, T. Elevated temperature inhibits anthocyanin biosynthesis in the tepals of an Oriental hybrid lily via the suppression of LhMYB12 transcription. Sci. Hortic. 2011, 132, 59–65. [Google Scholar] [CrossRef]
  29. Song, X.; Yang, Q.; Liu, Y.; Li, J.; Chang, X.; Xian, L.; Zhang, J. Genome-wide identification of Pistacia R2R3-MYB gene family and function characterization of PcMYB113 during autumn leaf coloration in Pistacia chinensis. Int. J. Biol. Macromol. 2021, 192, 16–27. [Google Scholar] [CrossRef]
  30. Xia, H.; Liu, X.; Jiang, G.Z.; Liu, P.; Ji, L.X. Establishment of High Performance Liquid Chromatography Method for Determination of Cyanidin-3-O-glucoside in Black Rice Anthocyanins. Grain Food Ind. 2024, 31, 68–72. [Google Scholar]
  31. Bolger, A.M.; Lohse, M.; Usadel, B. Trimmomatic: A flexible trimmer for Illumina sequence data. Bioinformatics 2014, 30, 2114–2120. [Google Scholar] [CrossRef] [PubMed]
  32. Grabherr, M.G.; Haas, B.J.; Yassour, M.; Levin, J.Z.; Thompson, D.A.; Amit, I.; Adiconis, X.; Fan, L.; Raychowdhury, R.; Zeng, Q.D.; et al. Full-length transcriptome assembly from RNA-Seq data without a reference genome. Nat. Biotechnol. 2011, 29, 644–652. [Google Scholar] [CrossRef]
  33. Haas, B.J.; Delcher, A.L.; Mount, S.M.; Wortman, J.R.; Smith, R.K.; Hannick, L.I.; Maiti, R.; Ronning, C.M.; Rusch, D.B.; Town, C.D.; et al. Improving the Arabidopsis genome annotation using maximal transcript alignment assemblies. Nucleic Acids Res. 2003, 31, 5654–5666. [Google Scholar] [CrossRef]
  34. Iseli, C.; Jongeneel, C.V.; Bucher, P. ESTScan: A program for detecting, evaluating, and reconstructing potential coding regions in EST sequences. Proc. Int. Conf. Intell. Syst. Mol. Biol. 1999, 99, 138–148. [Google Scholar]
  35. Altschul, S.F.; Madden, T.L.; Schäffer, A.A.; Zhang, J.; Zhang, Z.; Miller, W.; Lipman, D.J. Gapped BLAST and PSI-BLAST: A new generation of protein database search programs. Nucleic Acids Res. 1997, 25, 3389–3402. [Google Scholar] [CrossRef] [PubMed]
  36. Langmead, B.; Salzberg, S.L. Fast gapped-read alignment with Bowtie 2. Nat. Methods 2012, 9, 357–359. [Google Scholar] [CrossRef]
  37. Li, B.; Dewey, C.N. RSEM: Accurate transcript quantification from RNA-Seq data with or without a reference genome. BMC Bioinform. 2011, 12, 323. [Google Scholar] [CrossRef]
  38. Wang, L.; Feng, Z.; Wang, X.; Zhang, X. DEGseq: An R package for identifying differentially expressed genes from RNA-seq data. Bioinformatics 2010, 26, 136–138. [Google Scholar] [CrossRef]
  39. Conesa, A.; Götz, S.; García-Gómez, J.M.; Terol, J.; Talón, M.; Robles, M. Blast2GO: A universal tool for annotation, visualization and analysis in functional genomics research. Bioinformatics 2005, 21, 3674–3676. [Google Scholar] [CrossRef]
  40. Xie, C.; Mao, X.; Huang, J.; Ding, Y.; Wu, J.; Dong, S.; Kong, L.; Gao, G.; Li, C.-Y.; Wei, L.; et al. KOBAS 2.0: A web server for annotation and identification of enriched pathways and diseases. Nucleic Acids Res. 2011, 39, W316–W322. [Google Scholar] [CrossRef]
  41. Langfelder, P.; Horvath, S. WGCNA: An R package for weighted correlation network analysis. BMC Bioinform. 2008, 9, 559. [Google Scholar] [CrossRef]
  42. Berardini, T.Z.; Reiser, L.; Li, D.; Mezheritsky, Y.; Muller, R.; Strait, E.; Huala, E. The Arabidopsis Information Resource: Making and Mining the “Gold Standard” Annotated Reference Plant Genome. Genesis 2015, 53, 474–485. [Google Scholar] [CrossRef] [PubMed]
  43. Edgar, R.C. MUSCLE: Multiple Sequence Alignment with High Accuracy and High Throughput. Nucleic Acids Res. 2004, 32, 1792–1797. [Google Scholar] [CrossRef] [PubMed]
  44. Kumar, S.; Stecher, G.; Tamura, K. MEGA7: Molecular Evolutionary Genetics Analysis Version 7.0 for Bigger Datasets. Mol. Biol. Evol. 2016, 33, 1870–1874. [Google Scholar] [CrossRef]
  45. Jones, D.T.; Taylor, W.R.; Thornton, J.M. The Rapid Generation of Mutation Data Matrices from Protein Sequences. Comput. Appl. Biosci. 1992, 8, 275–282. [Google Scholar] [CrossRef] [PubMed]
  46. Letunic, I.; Bork, P. Interactive Tree Of Life (iTOL) v5: An Online Tool for Phylogenetic Tree Display and Annotation. Nucleic Acids Res. 2021, 49, W293–W296. [Google Scholar] [CrossRef]
  47. Lv, S.-Q.; Duan, F.; Zhang, L.-X.; Ning, G.-G.; He, Y.-H. The effect of high-temperature stress on the flower color synthesis of ‘Sorbonne’ lily. J. Huazhong Agric. Univ. 2024, 43, 149–156. [Google Scholar]
  48. Yin, X.; Zhang, Y.; Zhang, L.; Wang, B.; Zhao, Y.; Irfan, M.; Chen, L.; Feng, Y. Regulation of MYB Transcription Factors of Anthocyanin Synthesis in Lily Flowers. Front. Plant Sci. 2021, 12, 761668. [Google Scholar] [CrossRef]
  49. Livak, K.J.; Schmittgen, T.D. Analysis of relative gene expression data using real-time quantitative PCR and the 2–ΔΔCT method. Methods. 2001, 25, 402–408. [Google Scholar] [CrossRef]
  50. Bu, Y.-F.; Wang, S.; Li, C.-Z.; Fang, Y.; Zhang, Y.; Li, Q.-Y.; Wang, H.-B.; Chen, X.-S.; Feng, S.-Q. Transcriptome Analysis of Apples in High-Temperature Treatments Reveals a Role of MdLBD37 in the Inhibition of Anthocyanin Accumulation. Int. J. Mol. Sci. 2022, 23, 3766. [Google Scholar] [CrossRef]
  51. Rienth, M.; Vigneron, N.; Darriet, P.; Sweetman, C.; Burbidge, C.; Bonghi, C.; Walker, R.P.; Famiani, F.; Castellarin, S.D. Grape Berry Secondary Metabolites and Their Modulation by Abiotic Factors in a Climate Change Scenario–A Review. Front. Plant Sci. 2021, 12, 643258. [Google Scholar] [CrossRef]
  52. Shi, Z.; Han, X.; Wang, G.; Qiu, J.; Zhou, L.; Chen, S.; Fang, W.; Chen, F.; Jiang, J. Transcriptome analysis reveals chrysanthemum flower discoloration under high-temperature stress. Front. Plant Sci. 2022, 13, 983292. [Google Scholar] [CrossRef]
  53. Solfanelli, C.; Poggi, A.; Loreti, E.; Alpi, A.; Perata, P. Sucrose-Specific Induction of the Anthocyanin Biosynthetic Pathway in Arabidopsis. Plant Physiol. 2006, 140, 637–646. [Google Scholar] [CrossRef] [PubMed]
  54. Liu, X.-J.; An, X.-H.; Liu, X.; Hu, D.-G.; Wang, X.-F.; You, C.-X.; Hao, Y.-J. MdSnRK1.1 interacts with MdJAZ18 to regulate sucrose-induced anthocyanin and proanthocyanidin accumulation in apple. J. Exp. Bot. 2017, 68, 2977–2990. [Google Scholar] [CrossRef] [PubMed]
  55. Yang, X.; Pang, X.; Xu, L.; Fang, R.; Huang, X.; Guan, P.; Lu, W.; Zhang, Z. Accumulation of soluble sugars in peel at high temperature leads to stay-green ripe banana fruit. J. Exp. Bot. 2009, 60, 4051–4062. [Google Scholar] [CrossRef] [PubMed]
  56. Tan, Y.; Wen, B.; Xu, L.; Zong, X.; Sun, Y.; Wei, G.; Wei, H. High temperature inhibited the accumulation of anthocyanin by promoting ABA catabolism in sweet cherry fruits. Front. Plant Sci. 2023, 14, 1079292. [Google Scholar] [CrossRef]
  57. Ichimura, K.; Niki, T.; Matoh, M.; Nakayama, M. High temperature under low light conditions suppresses anthocyanin biosynthesis in snapdragon petals associated with decreased sugar levels. Sci. Hortic. 2021, 290, 110510. [Google Scholar] [CrossRef]
  58. Liu, C.; Yu, H.; Liu, Y.; Zhang, L.; Li, D.; Zhao, X.; Zhang, J.; Sui, Y. Promoting Anthocyanin Biosynthesis in Purple Lettuce Through Sucrose Supplementation Under Nitrogen Limitation. Horticulturae 2024, 10, 838. [Google Scholar] [CrossRef]
  59. Zhao, P.; Sun, L.; Zhang, S.; Jiao, B.; Wang, J.; Ma, C. Integrated Transcriptomics and Metabolomics Analysis of Two Maize Hybrids (ZD309 and XY335) Under Heat Stress at the Flowering Stage. Genes 2024, 15, 189. [Google Scholar] [CrossRef]
  60. Cai, X.-T.; Xu, P.; Zhao, P.-X.; Liu, R.; Yu, L.-H.; Xiang, C.-B. Arabidopsis ERF109 mediates cross-talk between jasmonic acid and auxin biosynthesis during lateral root formation. Nat. Commun. 2014, 5, 5833. [Google Scholar] [CrossRef]
Figure 2. Histogram and Venn diagram showing numbers of differentially expressed genes (DEGs) in the comparison of 35 °C vs. 20 °C at T1, T2, T3, and T4. (A) Histogram showing numbers of up- and downregulated DEGs in the comparison of 35 °C vs. 20 °C at T1, T2, T3, and T4. (B) Venn diagram presenting the overlap of DEGs in the comparison of 35 °C vs. 20 °C at T1, T2, T3, and T4. T1, T2, T3, and T4 represent Oriental lily gene expression after 12, 24, 48, and 72 h of temperature treatment, respectively.
Agronomy 15 01071 g002
Figure 3. Gene Ontology (GO) enrichment analysis of differentially expressed genes (DEGs) in Oriental lily tepals under high-temperature stress. The DEGs were categorized into three main types: biological process (BP), cellular component (CC), and molecular function (MF). T1, T2, T3, and T4 represent the samples collected after 12 h, 24 h, 48 h, and 72 h of temperature treatment, respectively. The color scale indicates the −log10 p-value of the enriched GO terms, the dot size reflects the number of DEGs associated with each term, and the x-axis represents the DEG count per GO term.
Agronomy 15 01071 g003
Figure 4. KEGG pathway enrichment analysis of differentially expressed genes (DEGs) in Oriental lily tepals under high-temperature stress (35 °C vs. 20 °C). T1, T2, T3, and T4 represent the samples collected after 12, 24, 48, and 72 h of temperature treatment, respectively. The color scale indicates the statistical significance of the pathway enrichment (−log10 p-value) and the dot size corresponds to the number of DEGs mapped to each pathway.
Agronomy 15 01071 g004
Figure 5. Weighted gene co-expression network analysis (WGCNA) of DEGs in Lilium under 20 °C and 35 °C treatments. (A) Hierarchical cluster dendrogram showing the gene co-expression modules identified by the WGCNA. Each branch represents a gene, and the colors below the dendrogram indicate the module assignment. (B) Module–trait correlation heatmap displaying the relationships between the WGCNA modules and anthocyanin-related traits. “C3G” refers to the cyanidin 3-O-β-rutinoside content and “TAC” refers to the total anthocyanin content. The color scale on the right indicates the Pearson correlation coefficient (−1 to 1), with red representing positive correlations and blue representing negative correlations. (C) Gene co-expression network of 5 anthocyanin-related genes and 36 transcription factors (TFs) within the ‘black’ module. Genes with a correlation coefficient R2 > 0.95 were selected for network construction. LhERF109 is marked with a black star (✶). The network was visualized using Cytoscape (version 3.10.3). (D) Heat map for the expression of 5 anthocyanin-related genes and 36 TFs in the ‘black’ module. The numerical values for the blue-to-red gradient bar indicate the log2 fold change relative to the control sample (20 °C). The red star (✶) indicates LhERF109.
Agronomy 15 01071 g005
Figure 6. Phylogenetic analysis of ERF transcription factors from Lilium and Arabidopsis thaliana. The phylogenetic tree was constructed using the maximum likelihood method based on full-length protein sequences. Blue circles (●) indicate ERF genes from Arabidopsis. Red stars (★) highlight Lilium ERF genes. Bootstrap support values are color-coded: black dots represent values ≤ 0.5, while red dots represent values between 0.51 and 1.0. The Roman numerals (I–X) around the outer circle denote the different ERF subfamilies.
Agronomy 15 01071 g006
Figure 7. LhERF109-regulated anthocyanin biosynthesis in ‘Sorbonne’ Oriental lily. (A) The phenotypes of S1300, LhERF109-S1300, TRV, and LhERF109-TRV lily tepals. Scale bar = 2 cm. (B) The expression levels of LhERF109 in the S1300, LhERF109-S1300, TRV, and LhERF109-TRV treatments. (C) The expression levels of early- and middle-stage anthocyanin biosynthesis genes in the S1300, LhERF109-S1300, TRV, and LhERF109-TRV treatments. (D) The expression levels of late-stage anthocyanin biosynthesis and transport-related genes in the S1300, LhERF109-S1300, TRV, and LhERF109-TRV treatments. Values represent the mean ± SD of three independent biological replicates. Statistical significance was computed with the use of Student’s t-test (* p < 0.1, ** p < 0.01, *** p < 0.001).
Agronomy 15 01071 g007
Disclaimer/Publisher’s Note: The statements, opinions and data contained in all publications are solely those of the individual author(s) and contributor(s) and not of MDPI and/or the editor(s). MDPI and/or the editor(s) disclaim responsibility for any injury to people or property resulting from any ideas, methods, instructions or products referred to in the content.

