Article

Relationships Between Carbon Fractions and Soil Nutrients in Organic Cassava Cultivation in the Sandy Soil of Northeastern Thailand

by
Suphathida Aumtong
1,*,
Chanitra Somyo
1,
Kanokorn Kanchai
1,
Thoranin Chuephudee
2 and
Chakrit Chotamonsak
3,4
1
Soil Science Program, Faculty of Agricultural Production, Maejo University, Chiang Mai 50290, Thailand
2
Business Administration, Maejo University, Chiang Mai 50290, Thailand
3
Department of Geography, Faculty of Social Sciences, Chiang Mai University, Chiang Mai 50200, Thailand
4
Environmental Science Research Center, Faculty of Science, Chiang Mai University, Chiang Mai 50200, Thailand
*
Author to whom correspondence should be addressed.
Agronomy 2025, 15(5), 1069; https://doi.org/10.3390/agronomy15051069
Submission received: 19 March 2025 / Revised: 18 April 2025 / Accepted: 27 April 2025 / Published: 28 April 2025

Abstract

:
This research investigated the interaction between the labile and stable fractions of soil organic carbon (SOC) during the cultivation of organic cassava in sandy soil in northeastern Thailand over a period of five years. We collected surface soil samples (0–30 cm) from this sandy region, utilizing a combination of cow and chicken manure along with dried distilled grains (DDGs) from cassava fermentation for ethanol production, to monitor and compare the effects of continuous mixed organic fertilization on SOC, carbon fractions, soil pH, and nitrogen and phosphorus levels throughout a five-year period of varying land use ages (LUA) to the pre-fertilization state. This study proposed that the use of a combination of organic fertilizers could increase soil organic carbon levels. This study indicates that the continuous application of organic fertilizers over five years does not lead to a significant increase in soil carbon; however, it may result in temporary alterations in different organic carbon fractions. The study showed that the mixed organic fertilization could the increase carbon fractions. Labile carbon (LBC) fraction was at its lowest before fertilization, peaking at LUA 3 and increasing by 5.44–25.50% after organic fertilizer addition. The first year revealed high non labile carbon (NLBC) levels, exceeding 60%, in comparison to the pre-fertilizer period. In the second year, NLBC levels declined to LUA 5, a change that was not statistically significant. After pre-fertilization, the concentration of recalcitrant carbon (REC) did not significantly decrease. Nitrate (NO3-N) concentrations exhibited no significant fluctuation pre-and post-fertilization. Furthermore, the Bray II-extractable phosphorus (P(B)) decreased (i.e., LUA 1 and 4). The pH levels dropped after the addition of organic fertilizer, particularly in the second year. We found strong positive links between SOC and carbon fractions such as NLBC (r = 0.54 ***) and POXC (r = 0.49 ***). However, neither LBC nor less labile carbon fraction (LLBC) showed any significant correlations with SOC. The negative correlations were observed between ammonium (NH4+-N) and NO3-N with labile carbon types, such as LBC, LLBC, and POXC, while positive correlations were noted with stable carbon fractions, such as NLBC, and REC. From the application of this organic fertilizer, there are various amounts of organic carbon which cause the following effects: The inclusion of LBC from mixed organic fertilization seems to enhance SOC decomposition rather than accumulation. NLCB may persist in sandy soil for a longer duration than LBC, resulting in the retention of SOC in sandy soil. Our results suggested the implementation of a systematic soil testing strategy to monitor temporal variations in carbon fractions and nutrient levels. Using the right amounts of both LBC and NLBC would improve soil health and help store carbon through organic fertilizers.

1. Introduction

Sandy soils cover approximately 31% of the global land area, spanning around 900 million hectares, primarily in arid and semi-arid regions such as the Sahara, Saudi Arabia, Turkey, northwest China, and western Australia [1,2]. In northeastern Thailand, sandy soils typically consist of a sandy surface layer overlying a loamy to clayey substratum, a stratification caused by mass movement processes that transport clay particles downward, leaving coarser and sandier materials at shallower depths [3]. These soils have inherently low fertility and rely heavily on soil organic carbon (SOC) for nutrient cycling and soil health maintenance [1,2]. Cassava cultivation in such soils benefits from organic amendments such as compost and cassava residue, which have been shown to enhance yield [4]. Proper management of nitrogen, phosphorus, and potassium is essential for maintaining soil fertility and productivity [5]. Organic fertilizers, including manure and crop residues, enhance soil fertility by increasing SOC and total nitrogen, both of which are critical for plant growth [6]. The decomposition of high-quality organic inputs such as groundnut stover occurs rapidly in sandy soils, significantly influencing nutrient cycling [7]. Organic amendments may also induce a priming effect, accelerating the decomposition of native SOC, particularly when high-quality organic matter is added [8,9].
The application of organic fertilizers significantly enhances labile carbon fractions in soil, increasing carbon mineralization and turnover rates [10,11]. Long-term application of organic fertilizers, such as farmyard manure, promotes soil health and fertility by increasing labile carbon pools and improving carbon sequestration [11]. The rate of organic fertilizer application influences the size of these labile carbon pools, with higher application rates leading to greater increases in labile carbon [11,12]. Labile carbon fractions, including dissolved organic carbon (DOC), microbial biomass carbon (MBC), and oxidizable organic carbon (KMnO4C), are readily available for microbial activity [13]. Before fertilization, labile carbon levels in soil are generally low but increase as organic amendments decompose and release carbon. Soil labile carbon can be stabilized through its integration into stable organic matter, which is facilitated by compost and humic acids [14]. Studies have shown that farmyard manure significantly enhances labile carbon fractions compared with chemical fertilizers alone [11]. Over time, the decomposition of organic matter contributes to increases in labile carbon content [15,16]. The addition of labile organic substrates, such as 13C-glucose, can stimulate microbial activity, enhancing SOC mineralization through a positive priming effect [17]. Organic amendments, including manure and crop residues, increase microbial and enzyme activities, leading to higher labile carbon content [11,16]. However, labile carbon is more susceptible to microbial decomposition, resulting in a relative decline in non-labile carbon content [11,18]. While organic fertilization enhances SOC, the increased presence of labile carbon may pose challenges for long-term carbon sequestration due to its rapid decomposition [19]. Environmental changes, such as rising temperatures and fresh carbon inputs, can trigger the priming effect, making stable carbon more vulnerable to decomposition [20].
Intensive agricultural practices often lead to SOC depletion in sandy soils, whereas sustainable management can enhance SOC sequestration [21]. Monoculture systems in northeastern Thailand accelerate soil organic matter degradation and weaken soil aggregation, but continuous recycling of organic residues can restore soil quality [22]. Organic amendments such as manure and biochar can improve SOC levels in sandy soils, but they may also increase CO2 emissions, which could counteract some carbon storage benefits [23,24]. The quality of organic fertilizers significantly influences soil carbon storage, with high-quality amendments generally enhancing labile carbon fractions, potentially decreasing SOC stability [25]. Pig manure, for example, enhances SOC accumulation but may also reduce stability due to increased labile carbon fractions [25,26]. Organic fertilizers stimulate microbial biomass and activity, accelerating labile carbon decomposition and transformation [15,27]. Additionally, they improve the availability of nutrients, including nitrogen, phosphorus, and potassium, which are essential for plant growth [20]. The soil carbon–nitrogen–phosphorus (C/N/P) stoichiometry plays a key role in nutrient availability and SOC stabilization. Long-term organic fertilization alters these ratios, particularly in topsoil layers, improving SOC sequestration [28]. Distilled dried grains (DDGs) are a valuable nutrient source, providing nitrogen, phosphorus, and potassium [29], as well as magnesium, zinc, and sulfur [30]. DDG amendments can improve microbial respiration by lowering the C:N ratio [31] and, when combined with cattle manure, enhance soil fertility and structure [29,32]. Therefore, integrating organic fertilizers such as chicken and cow manure with DDGs could influence soil carbon dynamics and sequestration in sandy soils.
Soil nitrogen availability, a key factor in crop uptake [33], is largely regulated by nitrogen mineralization, which follows distinct patterns in sandy soils [34,35]. Labile and non-labile carbon fractions respond differently to nitrogen inputs, with labile fractions increasing significantly and promoting nitrogen mineralization by providing more carbon for microbial activity [36]. However, nitrogen mineralization can be decoupled from carbon availability in some fractions, suggesting that nitrogen availability does not always directly correlate with SOC content [37]. Labile carbon inputs can enhance SOC mineralization, which is closely linked to nitrogen availability [38]. Nitrification, a microbial process, can also influence SOC mineralization by altering nitrogen availability and stimulating microbial communities [39].
While organic fertilizers improve fertility, their impact on soil carbon fractions and SOC stability must be carefully managed. Effective organic matter management is crucial for maximizing benefits while minimizing environmental risks. Integrating organic fertilizers with soil amendments tailored for sandy soils and carbon sequestration could enhance soil quality. Therefore, investigating the combined use of organic fertilizers (e.g., chicken and cow manure) with DDGs is essential for understanding their effects on soil carbon dynamics and sequestration in sandy soils, an area that remains underexplored.
This study aims to evaluate the effects of combining organic manure fertilizers with DDGs on SOC content and sequestration in sandy soils. Specifically, it examines SOC fractionation, microbial activity, and soil physicochemical properties before and after fertilization. The research hypothesizes that using a mix of organic fertilizers would raise SOC levels. By stabilizing SOC in sandy soil from an organic cassava plantation, this study explores the mechanisms of SOC stabilization, carbon fractionation, and their interactions with nitrogen and phosphorus availability in sandy soil. Understanding these interconnections is crucial for improving soil carbon stability and fertility in sandy soils.

2. Materials and Methods

2.1. Study Site

The study was carried out on an organic cassava (Manihot esculenta) plantation located in Ubonrachathani (UBR), Amnat Charoen (AMC), and Yasothon (YST) provinces in northeastern Thailand. The age of this land use was between 0 and 5 years old. Ubon Ratchathani (at coordinates 15.2490° N, 104.8521° E), Yasothon (at coordinates 15.8025° N, 104.4770° E), and Amnat Charoen (at coordinates 15.43° N, 104.67° E) are in the northeastern region of Thailand, which is part of the Khorat Plateau, with an elevation of 116 m above sea level (Figure 1). The landscape is influenced by past tectonism, with variations in bedrock and fault characteristics affecting the topography and channel profiles [40]. This region features gently rolling low hills, which contribute to its unique topography [41]. The precipitation and relative humidity significantly influence tree growth, particularly during the dry-to-wet transition season from April to June [42].
Weather: From January to April, precipitation is modest; it then rises steadily in May, peaks in September, and then drops dramatically from October to December. The difference is most noticeable between September and May. The average annual temperature is 27–28 °C. The average minimum and maximum temperatures are 22.5–22.8 °C and 33.2–33.5 °C. April has the highest summer temperatures of up to 40 °C. June–October rains lower the temperatures to 25–33 °C and increase the humidity. Winter is from November to February. Some areas may fall as low as 14–18 °C in the mornings [43]. Heat waves prompted record April temperatures of 41 °C in all three provinces in 2019, according to Climate Highlights (2017–2023) [43]. Historically of this study soil, all farmers cultivated crops, including cassava, rice, and garlic, using traditional methods with chemical fertilizers. To cultivate organic monoculture cassava, farmers must restore soil previously treated with pesticides by allowing it to remain fallow for a minimum of one year. Upon the farmer’s readiness, they should begin planting using chemical-free cuttings, organic fertilizers, biological pest and disease control measures, and chemical-free weed management. This process guarantees that cassava production adheres to 100 percent organic agricultural requirements. Maintenance while planting includes organic fertilization during the first 30 days, the use of mixed organic fertilizers at three months, weed management by weeding and mulching, and regular plot inspections to avert insect-borne illnesses such as cassava mosaic disease or mealybugs. The cassava tubers may be harvested when they reach 8 to 12 months in age.
The quantity of organic fertilizer and soil amendment usage: This study collected historical data on the amount of fertilizer application through the lens of organic fertilization. The main organic fertilizers are animal manure, such as chicken manure, cow manure, and dried distilled grains (DDGs), which are mixed together. The amount of these organic fertilizers varies, and the quantities are different. The fertilization pattern comprised a combination of DDGs and local animal dung, including cow and chicken manure, applied continuously for a duration of 1 to 5 years, in contrast to the absence of organic fertilization. The DDGs used in this area come from the use of cassava for ethanol production. It is a material left over from the ethanol production process, especially in the step of removing water from the waste after fermentation of ethanol from cassava. Then, it is dried in the open air to reduce the amount of toxic substances before being added to the organic cassava plantation of this area. While the animal manure used by farmers is chicken manure and cow manure, both of which are available for sale in the area and nearby. Local livestock raisers provide these manures.
We collected data concerning the intensity of organic fertilization according to certain management strategies. The variability in organic fertilization practices among farmers highlights the diverse land-use age (LUA). Collectively, these data only illustrate the average amount of organic fertilizer practices. For a more precise study, the quality of local farmers’ practices was also addressed. Individual farmers always mixed chicken manure and cow manure as nutrient sources for cassava plantations and used DDGs to amend the soil with the same amount every year. We conducted a survey and interviewed local farmers who cultivated cassava in a contract farming system to gather information about the land-use history for the soil and site studies. We then combined this information with secondary data, such as the land-use area and soil type, to facilitate soil sampling. Data on the combinations of organic fertilizer management in the study area were collected to determine the patterns of mixed organic fertilizer application from interviews with the farmers who owned the plots (totaling 168 plots) where we collected soil samples. The details of the organic fertilizer management in the different periods of organic fertilizer application are presented in terms of the average amount of organic fertilizer. It was observed that the pattern of organic fertilizer application was similar in each year of organic fertilizer application in each area (Table 1). It is also clear that LUA5 only used DDG. The rates of organic fertilizer application depend on the experiences from previous times that were recommended by government and non-government organizations and mainly on the budgets of their farmers. Moreover, these organic fertilizers (i.e., cow and chicken manure and DDG) are necessary purchases from various nearby sources within this area.

2.2. The Study’s Experimental Design

The study’s experimental design aimed to assess how using continuous organic fertilizer impacts soil carbon fractions and their connections with nitrogen (N) and phosphorus (P), and in turn, the soil organic carbon (SOC) content across six different land-use ages (Table 1). After continuously applying organic fertilizer mixtures, we evaluated the carbon fractions and nutrient levels in the soils and compared them to pre-fertilization.
We also determined how these soil properties changed over time. The study covered a period from pre-organic fertilization (zero) to five years. The study examined 251 plots that were used at the beginning of organic cassava cultivation and during the transition phase LUA0). These plots were then compared with those that were utilized before converting to organic fertilizer for one year (LUA1), followed by two, three, four, and five years (LUA2,3,4 and 5), in that sequence (Table 1). These land-use measures were implemented since 2018.

2.3. Soil Sampling and Sample Distribution

The soil sampling procedure was planned by examining the number of years that the cassava plantation had been organically farmed and by using soil series maps, along with other supported soil classifications. The soil samples collected in April 2024 from representatives of each land-use age were samples that had been continuously fertilized with organic fertilizers. Soil samples were collected using an auger at a depth of 0–30 cm from study sites with different durations of organic fertilization (0–5 years). The numbers of samples per land-use age were as follows: 0 years (36 samples), 1 year (60 samples), 2 years (58 samples), 3 years (56 samples), 4 years (28 samples), and 5 years (13 samples) (Table 1, Figure 1). The number of samples varies depending on the number of farmer plots. Samples were air-dried, sieved, and underwent chemical and soil particle analysis.

2.4. Methodology for Soil and Organic Fertilizer Analysis

2.4.1. Soil Organic Carbon (SOC)

Soil organic carbon (SOC) was assessed by sieving 2 mm of dry soil combined with K2Cr2O7, heating the mixture to 130 °C for 30 min, and permitting it to rest overnight [44]. An FeSO4 solution was utilized for titration, following the procedure established in [45].

2.4.2. Permanganate Oxidizable Carbon (POXC)

POXC, or “active carbon”, was extracted by following the method in [46] and spectrophotometrically analyzed at 550 nm. We introduced 3 g of air-dried soil into a 50 mL centrifuge tube and subjected it to a 0.5 mm sieve using 20 mL of 0.02 M KMnO4. We rapidly agitated the tubes for 30 min at a rate of 120 revolutions per minute using a reciprocating shaker (HERMEL, HERMLE Labortechnik GmbH, Wehingen (Baden-Württemberg), Germany), and thereafter promoted the oxidation process and sedimentation of particulate matter via centrifugation (HERMEL Z 206 A, HERMLE Labortechnik GmbH, Wehingen (Baden-Württemberg), Germany) for 5 min. Subsequently, 0.1 mL of the sample solution was transferred from the tube to another tube containing 9.9 mL of deionized water to halt the reaction. We used a spectrophotometer (Cecil Aurius Series CE 2021, Cecil Instruments Limited, Cambridge (Cambridgeshire), UK) to measure the absorbance of each sample at 550 nm and calculated the POXC (mg kg−1 soil) [47] correspondingly.
POXC = [0.02 (mol L−1) − (a+ b Abs)] × (9000 mg C mol−1) × (0.02)
where, 0.02 mol L−1 represents the initial concentration of the KMnO4 solution, a represents the standard curve’s beginning point, and b represents its steepness. Abs represents the soil sample absorbance, 1 mol of MnO4 changes 9000 mg of carbon when Mn7+ becomes Mn4+, 0.02 L of KMnO4 solution reacts with the soil, and Wt is the soil weight (kg) employed in the reaction.

2.4.3. Different Concentrations of H2SO4 Were Used to Chemically Oxidize Carbon [48] Using an Oxidizable Carbon Fraction Technique

We mixed the soil sample contained in acidic solutions with potassium dichromate according to C content (Yeomans and Bremner, 1988; Maia et al., 2007 [49,50]). The solution employed high H2SO4 concentrations and needed no external heating [50]. The dichromate content was consistent as the concentration of H2SO4 increased to maximum levels of 9, 12, 18, and 24 mol L−1. According to Chan et al. (2001) [48], the ratios of 0.5:1, 1:1, 2:1 and 4:1 correspond to 18 M H2SO4 and 0.167 M K2Cr2O7. LBC (labile carbon fractions), LLBC (less labile carbon fractions), NLBC (Non labile carbon fractions), and REC (Recalcitrant carbon) denote the ratios in Equations (2), (3), (4) and (5), respectively.
Labile carbon; LBC = 6 M − 9 M H2SO4 oxidizable C
Less labile carbon; LLBC = 12 M − 9 M H2SO4 oxidizable C
Non labile carbon; NLBC = 18 M − 12 M H2SO4 oxidizable C
Recalcitrant carbon; REC = 24 M − 18 M H2SO4 oxidizable C

2.4.4. Nutrient Analysis (NH4+, NO3, Available Phosphorus), pH, and Particle Distribution

Available phosphorus was extracted via the Bray (II) method by utilizing a 0.1 M HCl and 0.03 M NH4F solution, followed by quantification through spectrophotometry using a Thermo Spectronic Genesys 20 spectrophotometer, Thermo Fisher Scientific Inc., Rochester (New York), NY, USA) [51]. NH4+ and NO3 content: NH4+ was extracted by 2 M potassium chloride, and measured by observing the color formed when ammonium, chlorine, and Na salicylate reacted. NO3 was extracted from soil samples using potassium sulfate at a concentration of 0.5 M, and NO3 determined using Na-nitroprusside to intensify the green hue using a spectrophotometer (Thermo Spectronic Genesys 20) [52]. The P malachite green method was used to determine the phosphorus concentration in new soil by combining sulfuric acid, ammonium molybdate tetrahydrate, malachite green, and polyvinyl alcohol. The absorbance was quantified using a double-beam spectrophotometer (Thermo Spectronic Genesys 20) at a wavelength of 630 nm after 30 min. This method’s sensitivity is enhanced by its ability to detect phosphorus concentrations that are too low for standard methods like the Murphy–Riley method [53], while the pH was determined using diluted water with a 1:2 ratio (Consort C3210 pH meter, Consort bvba, Turnhout, Belgium) [54]. The soil particle size distribution was determined using the hydrometer method [55].

2.4.5. Organic Fertilizer and DDG Analysis

Samples of organic fertilizer were desiccated at 65 °C and taken for further analysis. Carbon was determined through dry combustion using a muffle furnace (Thermolyne Type 4800 Furnace; Barnstead international, Boulevard, CA, USA) at 550–600 °C for 24 h [44], while the pH was determined using deionized water with a ratio of 1:10 (Consort C3210 pH meter) [54]. The percentage of nitrogen content was determined using the Kjeldahl method [54,56], while the determination of P and K was carried out using the wet digestion method based on the mixing of HNO3, H2SO4, and HClO4 acids [57]. Potassium was quantified using an atomic absorption spectrophotometer (SavantAA GBC, Cecil Instrumentation Services Ltd., Cambridge, UK). The phosphorus concentrations were quantified using a spectrophotometer (Thermo Spectronic Genesys 20). The C/N ratio was determined by dividing %C by %N.

2.4.6. Nutrients in Organic Fertilizer and DDGs via Water Extraction

A subsample of dried solid manure was assessed with a 1:5 water extract (w:v) for organic amendments and shaken for 30 min. We used a paper filter Whatman No. 5 to eliminate the particles, and the residual solution was diluted as necessary for the colorimetric analysis of NH4+ and NO3 [58,59] and of soluble organic carbon with heat and a dicromate reagent [60]. Phosphorus concentrations were quantified using a spectrophotometer (Thermo Spectronic Genesys 20) [61].

2.5. Statistical Analysis

Statistical analyses were performed using JASP 0.19.3. One-way ANOVA was conducted to evaluate the effects of organic fertilizer according to age (LUA) on soil nutrients and carbon fractions. The results were compared using the Tukey HSD (honestly significant difference) method, and the reported format for homogenous groups was used; the averages and standard errors are presented. Pearson’s correlation was calculated and illustrated, with differences in the heatmaps being considered significant at p < 0.05, <0.01, and <0.001; then, a heatmap diagram was created to illustrate the relationships.

2.6. Writing the Manuscript by Generative AI

We use generative AI to support the writing of this manuscript for grammar checkers, paraphrasers, summaries, and searches for relevant references.

3. Results

3.1. The Nutrient Content of Organic Fertilizer and DDGs as Soil Amendments

Chicken manure exhibited a neutral to slightly alkaline pH, with a statistically significant difference among treatments (p = 0.037) (Table 2). For carbon content, chicken manure had the highest average, followed by cow manure and DDG. These differences were highly significant (p < 0.001), indicating that chicken manure contains much more carbon than the other two amendments. In terms of nitrogen, chicken manure again had the highest, while both cow manure and DDGs had almost the same very low values, with significant differences confirmed by a p-value of less than 0.001 (Table 2). The C/N ratio significantly differed among the amendments (p = 0.002), with cow manure having the highest ratio, followed by DDGs and chicken manure. Phosphorus content also showed highly significant differences (p < 0.001), with chicken manure containing much more phosphorus than cow manure and DDGs. However, potassium content did not differ significantly among the amendments (p = 0.052) (Table 2).
Nutrient and chemical properties of water extraction from organic fertilizers: The results showed significant differences in soluble carbon content among amendments, with chicken manure having a higher mean value of 613.13 mg kg−1 compared to cow and DDG. Chicken manure also had the highest mean value of 50.04 mg kg−1 (Table 3), suggesting it is a richer immediate source of plant-available phosphorus. Ammonium content showed a reversed trend, with cow manure having the highest value at 61.25 mg kg−1. Nitrate content did not differ significantly among the three treatments, with mean values around 338 to 351 mg kg−1 (Table 3). pH values showed no statistically significant differences between amendments, with chicken manure at 7.055, cow manure at 7.16, and DDG at 7.08b (Table 3).

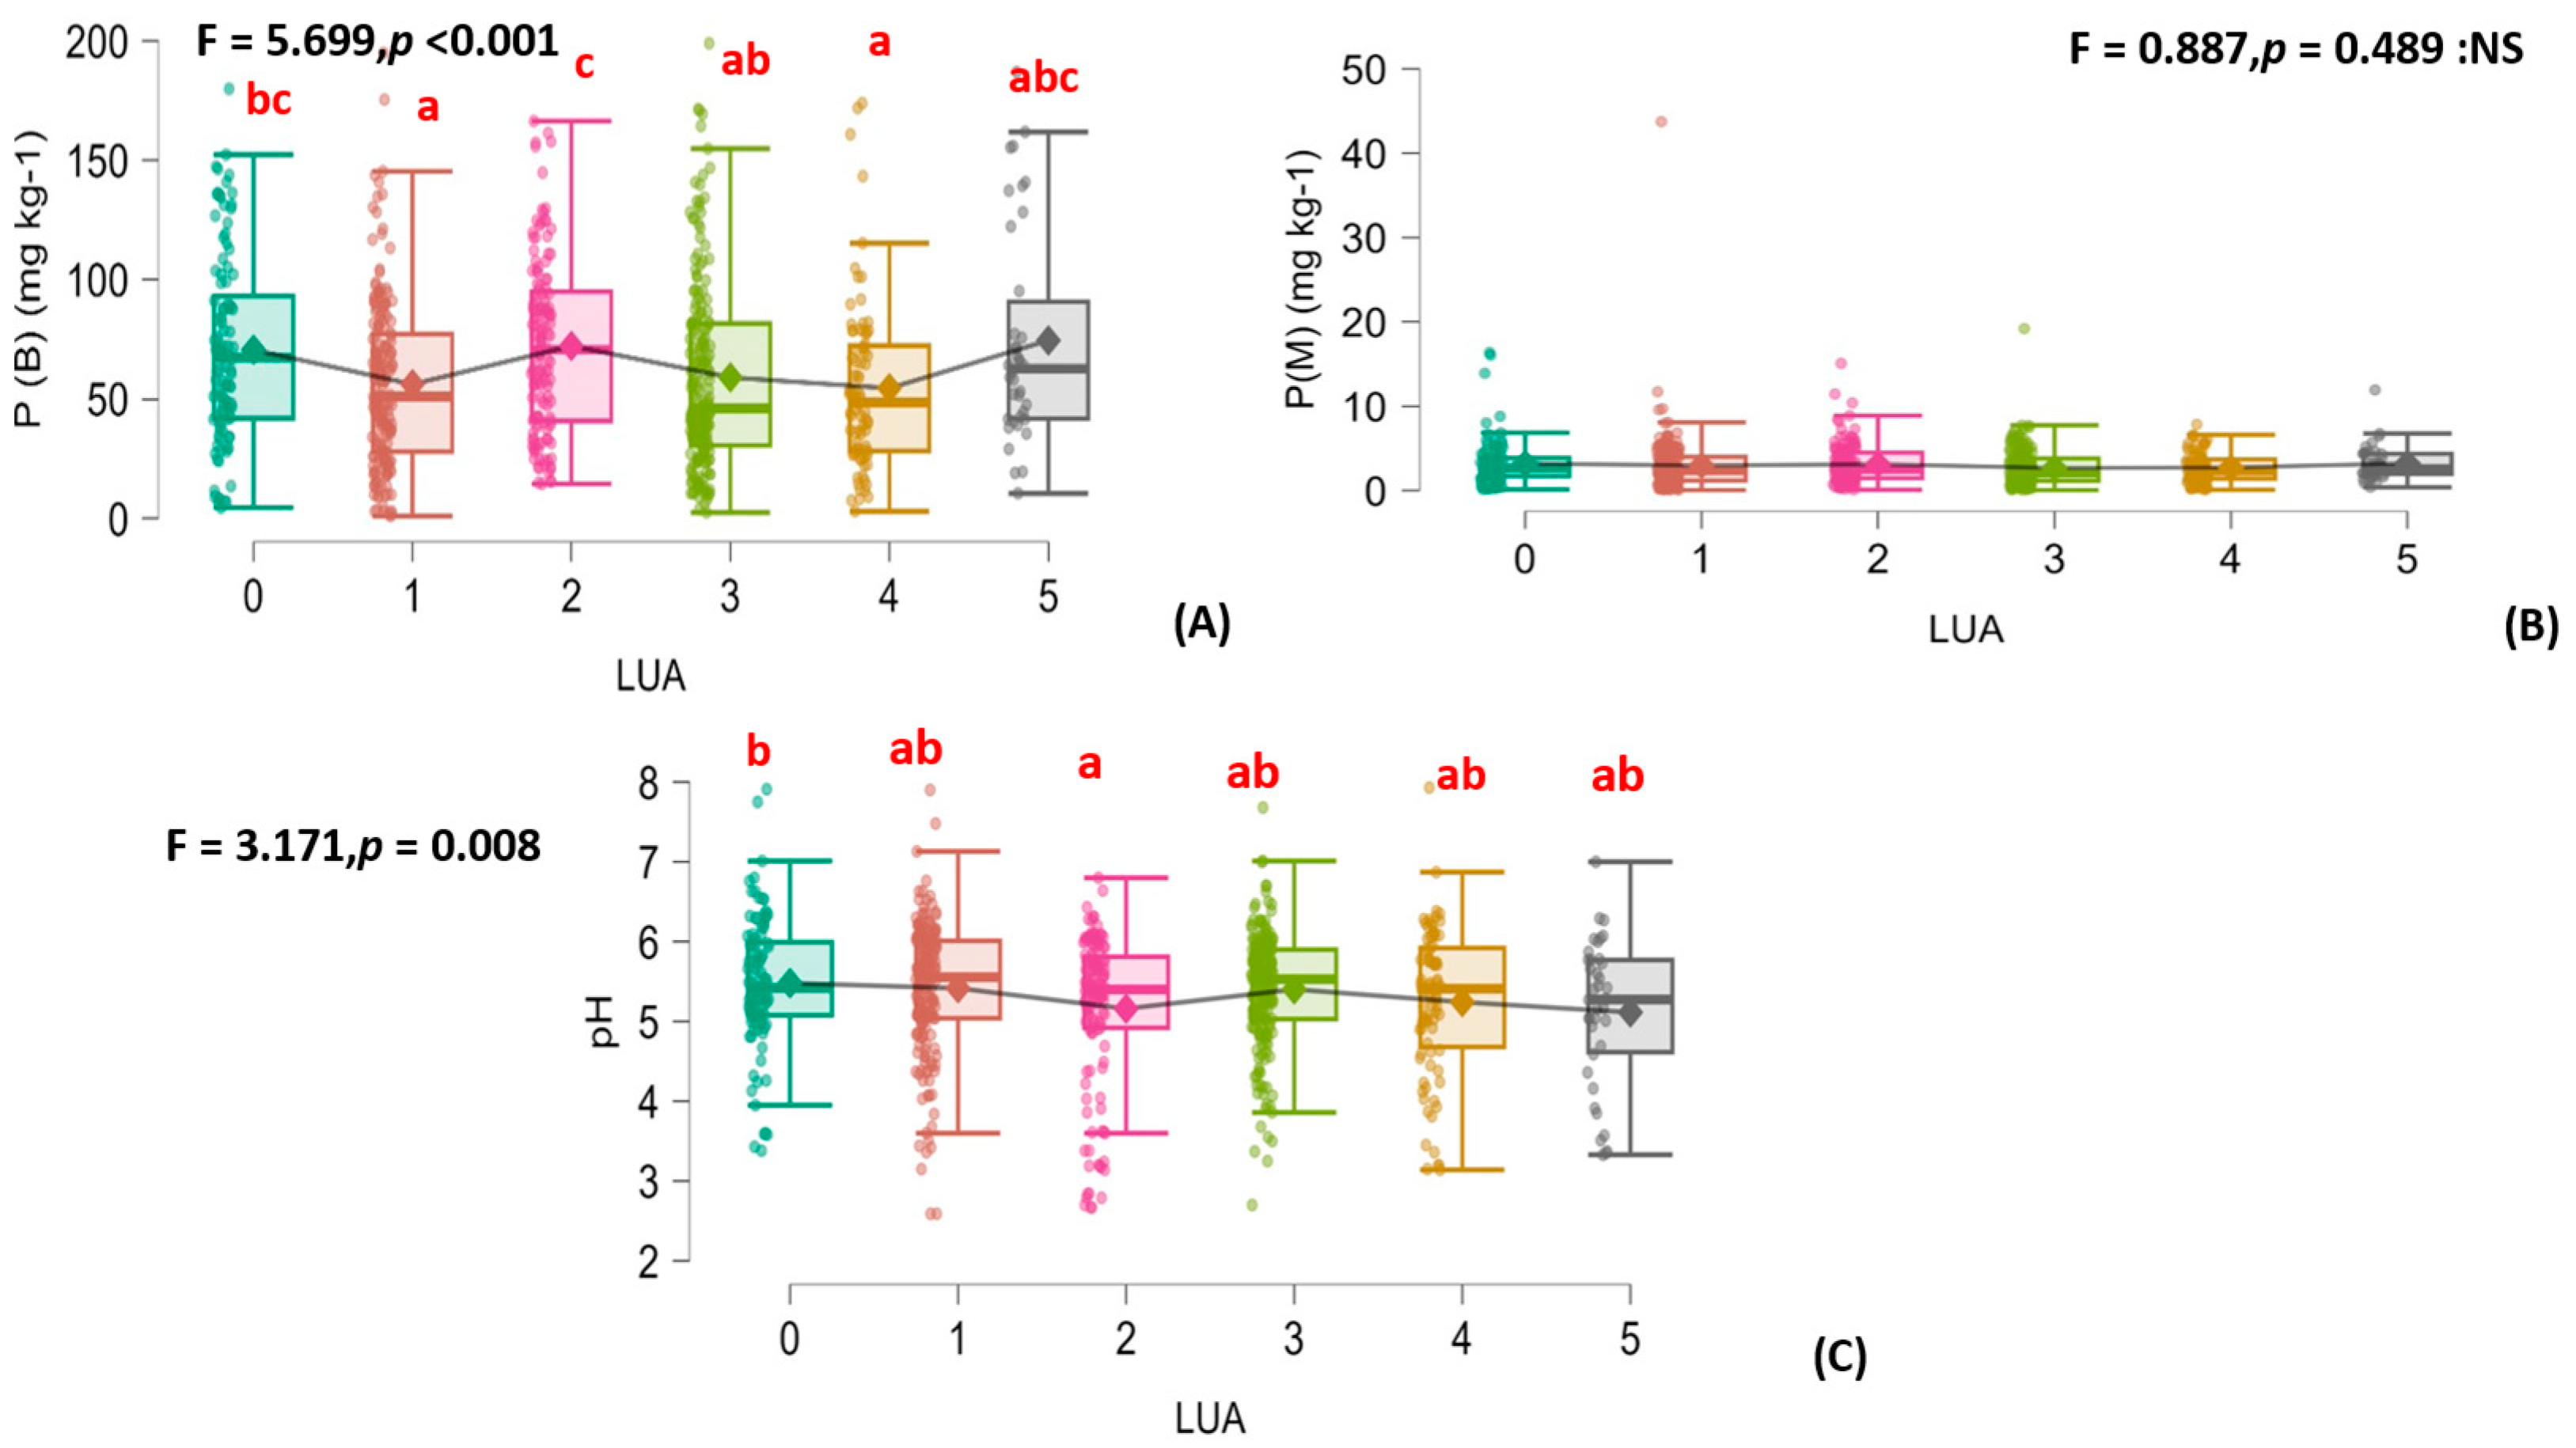
3.2. Organic Fertilization’s Effects on the Soil’s Physical Properties, Various Carbon Fractions, and N and P Changes

The distribution of soil texture components—sand, silt, and clay—varied across different land-use ages (LUAs), indicating changes in land-use intensity over time. Sand content varies across different LUAs, with LUA 4 having the highest sand content (858.708 g kg−1), followed by LUA 3 and LUA 5 (Table 4). The lowest sand content was 817.896 g kg−1. Silt content also varies, with LUA 2 having the highest mean value (85.240 g kg−1), while LUA 5 has the lowest (81.916 g kg−1). Clay content also varies across LUA ages, with the highest recorded at LUA 0 (79.467 g kg−1). This meant that sand dominated the soil composition or coarse soil (Table 4).
The soil organic carbon (SOC) content significantly increased after one year of organic fertilizer application, rising from 20.24 g kg−1 (pre-fertilization) to 25.49 g kg−1 (F = 2.599, p = 0.026). However, continued organic fertilizer application resulted in a gradual decline in SOC levels, though they remained higher than the initial values. SOC peaked in the first year, increasing by 25.93% compared with the pre-fertilization levels, followed by a slight decline in subsequent years. However, these were not significant compared with pre-fertilization (Figure 2).
Carbon fractions: The water-soluble carbon (WSC) content varied significantly across LUAs (F = 2.468, p = 0.031), with the highest levels being observed in LUA 3. WSC increased by 12.01–22.64% but showed no significant differences compared with the pre-fertilization soil levels. Apart from the fifth year, the WSC content remained consistently higher than the pre-fertilization levels (Figure 3A). Permanganate-oxidizable carbon (POXC) also exhibited notable changes over time (F = 3.807, p = 0.002). Initially, POXC significantly increased in response to organic fertilizer application but began to non-significantly decline in the second year compared with LUA 0 (Figure 3B).
The labile carbon (LBC) fraction was at its lowest before fertilization, significantly peaked at LUA 3 (F = 3.913, p = 0.002), and did not significantly decrease at LUA 4–5 compared with LUA 0. The amount of less labile carbon (LLBC) showed significant differences (F = 4.011, p = 0.001) and increased by 4.30–12.67% after adding organic fertilizer, peaking at an LUA 3–4 before decreasing at an LUA 5; however, it was still about 5.09% higher than LUA 0 (Figure 4A,B).
The non-labile carbon (NLBC) fraction varied significantly across LUAs (F = 3.468, p = 0.004). The highest NLBC levels were recorded in the first year, showing an increase of over 60% compared with pre-fertilization. However, from the second year onward, the NLBC levels gradually declined (31.57–179.52%) (Figure 5A). Recalcitrant carbon (REC) exhibited significant variations (F = 3.003, p = 0.011), with the concentrations steadily decreasing (32.83–224.71%) following organic fertilization (Figure 5B). However, these were not significant compared with pre-fertilization.
Availability of nitrogen: Following organic fertilizer application, the soil ammonium (NH4+) concentrations initially decreased, showing a downward trend in the first two years but with no significant recovery by the fifth year. Nitrate (NO3) levels declined significantly across LUAs (F = 2.677, p = 0.021), particularly in the last three years, remaining lower than the pre-fertilization levels (Figure 6A,B). The NO3 levels originally peaked during the second year of organic fertilizer treatment but exhibited a declining trend thereafter, whereas the NH4+ concentrations remained comparatively steady. While NH4+ concentrations remained relatively low, NO3 levels fell following the third year of organic fertilizer application and exhibited a declining trend thereafter (Figure 6A,B). The NH4+-N levels dropped by 3.15–4.94% after LUA 0. However, all the NH4+-N concentrations after fertilizer addition did not differ from NH4+-N in LUA 0. After applying organic fertilizer, the amount of NO3-N in the soil went down (1.45–18.27%) in most LUAs, but it went up in LUA 2 (2.30%) (Figure 6A,B). However, our results did not show a significant difference before and after fertilization.
pH and availability of and P: Figure 7A Bray-extractable phosphorus (P(B)) showed a significant difference among the different LUAs (F = 5.699, p < 0.001), At LUA 1, 3, and 4, P(B) concentrations were lower (16.38–22.77%) compared with pre-fertilizer. Figure 7B shows the malachite-extractable phosphorus (P(M)), which did not show significant differences among the different LUAs (F = 0.887, p = 0.489), and the trend of P(M) compared with pre-fertilization is demonstrated. Figure 7C indicates that soil pH also showed significant variation among the different LUAs (F = 3.171, p = 0.008). Therefore, the pH levels fell (1.17–6.68%) after the application of organic fertilizer, particularly in the second year.

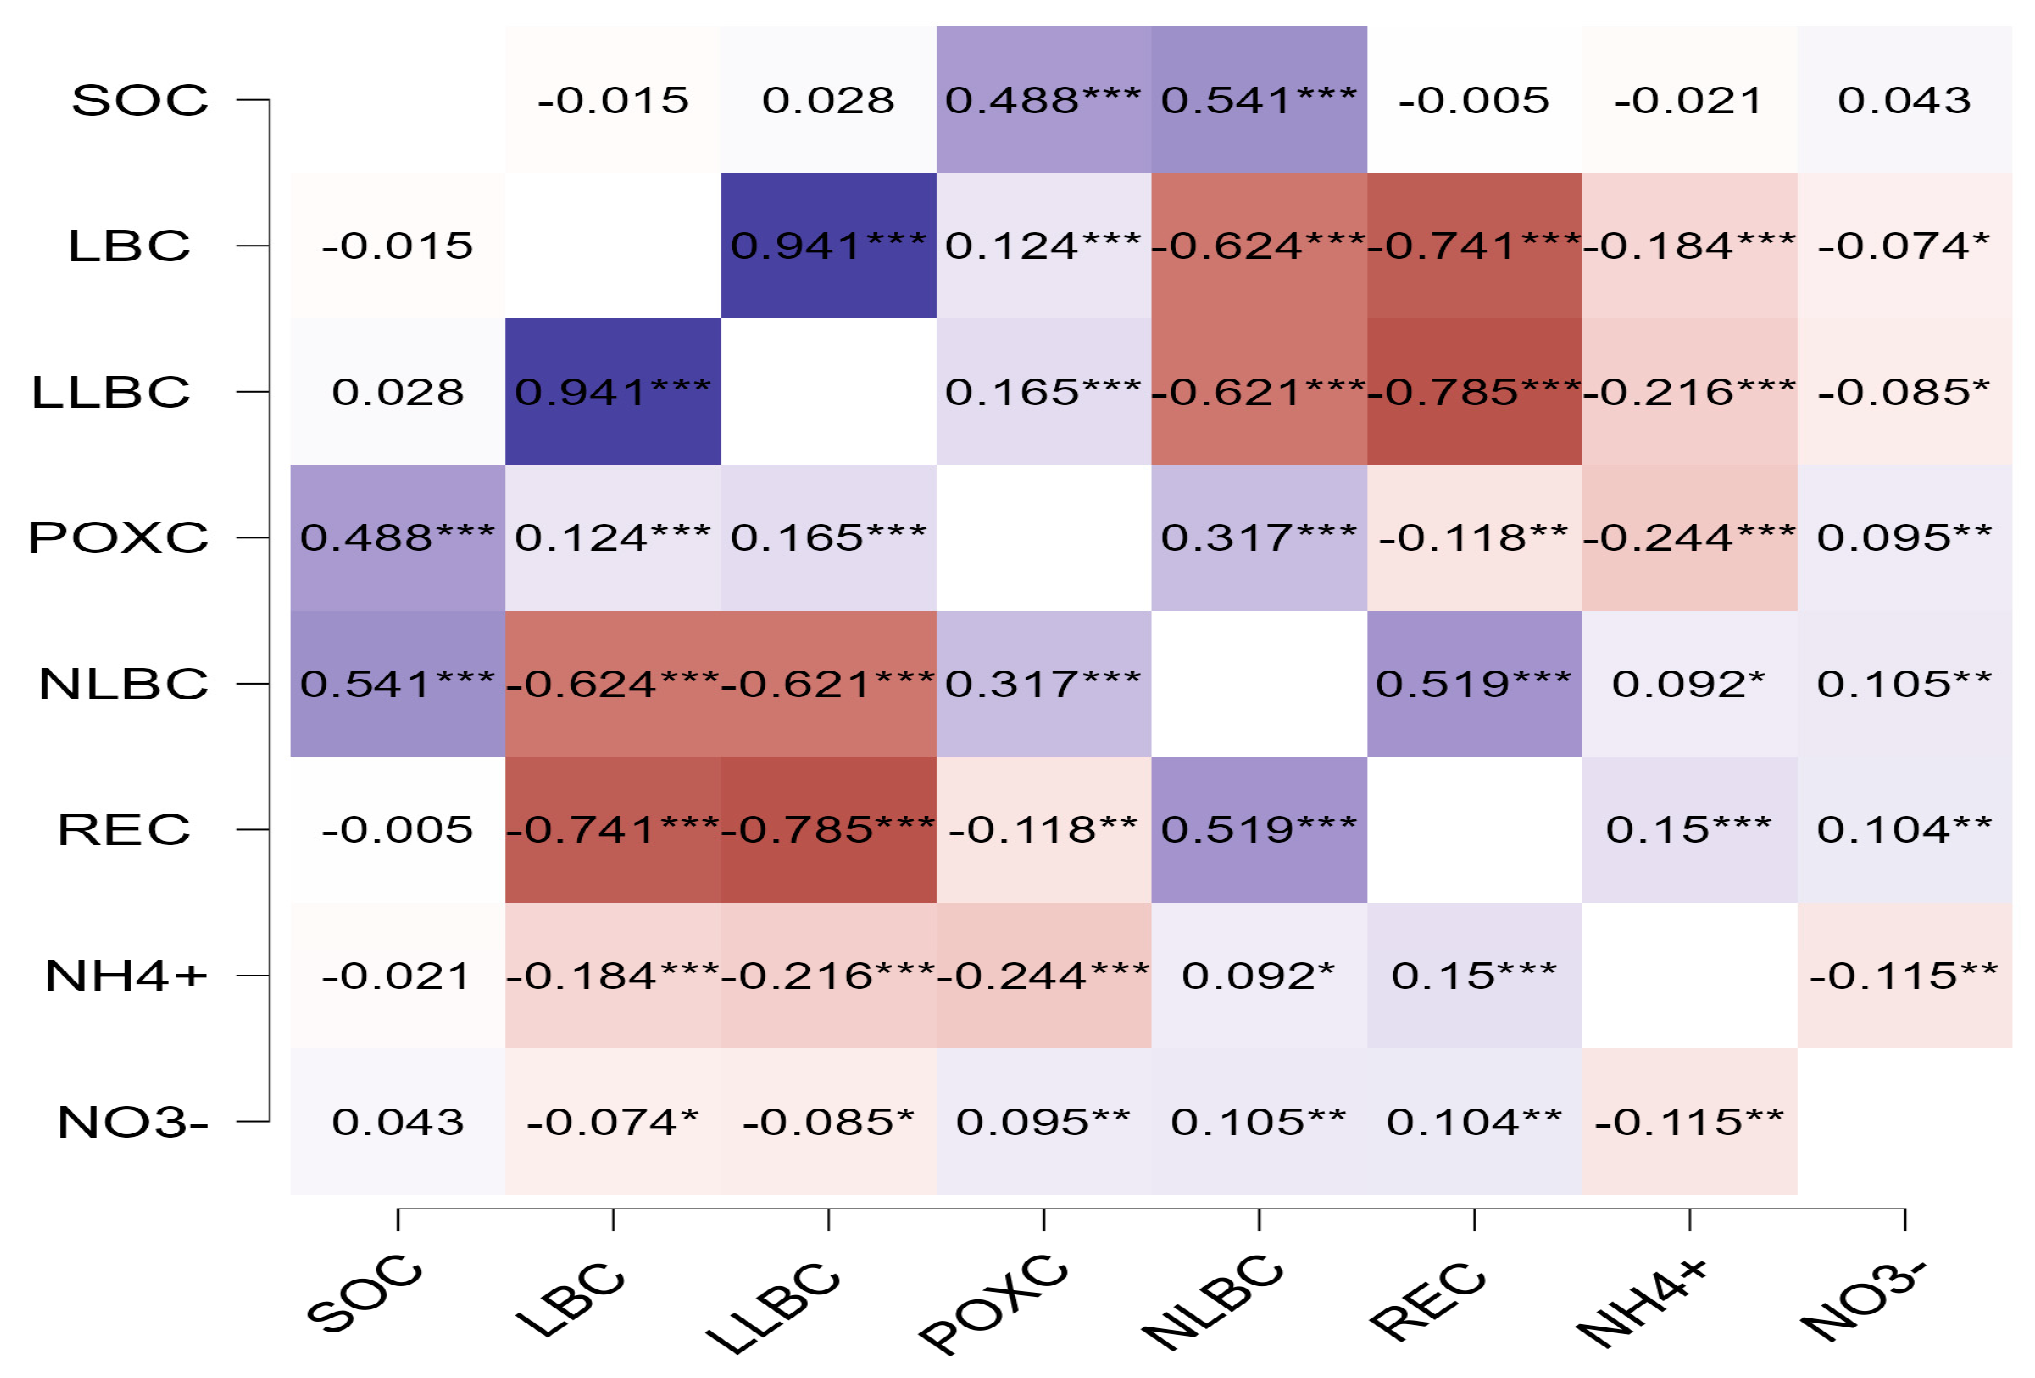
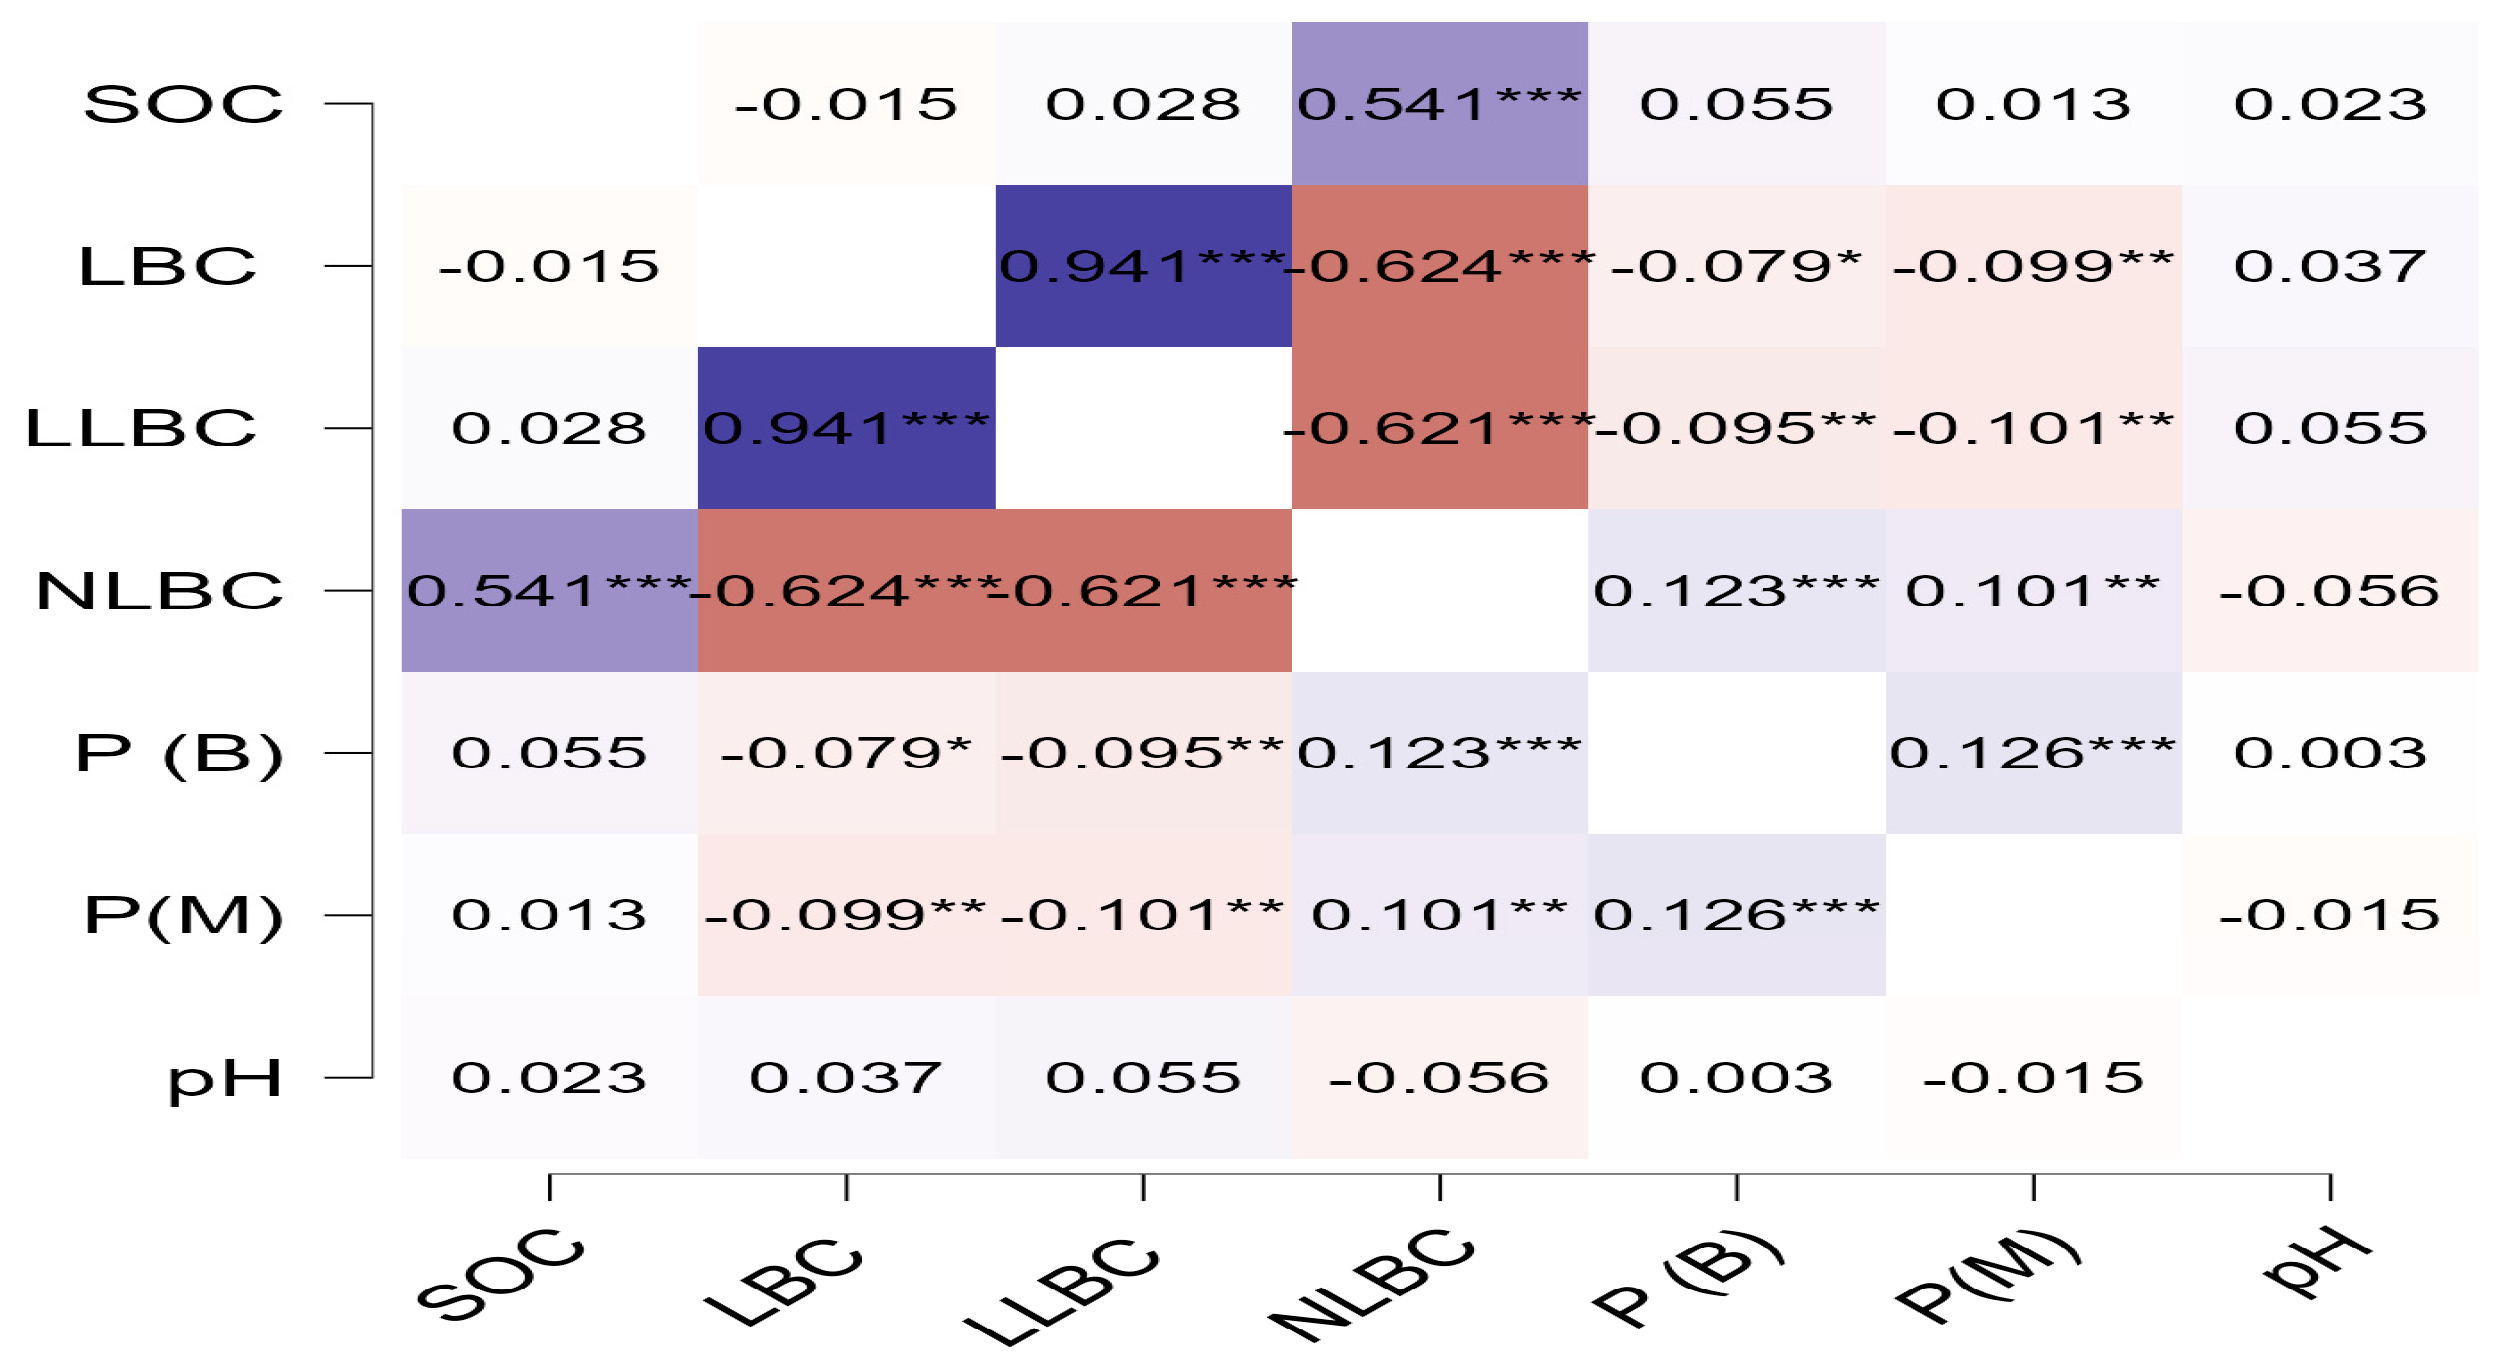
3.3. The Relationship Between Soil Carbon Fractions and Some of the Effects of the Availability of Nutrients on Carbon Stability

The relationships between labile and stable carbon fractions and SOC:
The relationships between carbon fractions (Figure 8) showed that NLBC and POXC were positively related to SOC. This was demonstrated by Pearson’s (r) coefficients of 0.54 *** and 0.49 ***, respectively. However, neither LBC nor LLBC showed any significant correlations with SOC. We found strong positive links between SOC and carbon fractions such as NLBC (r = 0.54 ***) and POXC (r = 0.49 ***), as well as positive correlations between POXC and NLBC (r = 0.32 ***). Additionally, we observed strong positive correlations between LBC and LLBC (r = 0.94 ***). There were negative correlations between LBC, LLBC, and NLBC (r = −0.62 *** and −0.62 ***, respectively) and between LBC, LLBC, and REC (r = −0.74 *** and −0.79 ***, respectively) (Figure 8). Together, these images show how different parts of the soil carbon interact with each other. They show how different parts affect soil fertility and soil organic carbon cycling. They also show different trends in soil organic carbon.
The relationships between the labile and stable carbon fractions with NH4+, and NO3: The strongest positive correlation was observed between POXC and SOC (r = 0.488 ***), reinforcing POXC as a key indicator of organic matter content. Conversely, a negative correlation was observed between POXC and NH4+ (r = −0.244 ***) and a positive correlation between POXC and NO3 (r = 0.095 **), suggesting that microbial activity led to a reduction in ammonium (Figure 8). Similarly, LBC showed negative correlations with NH4+ (r = −0.184 ***) and NO3 (r = −0.074 *), while LLBC showed negative correlations with NH4+ and NLBC at −0.216 *** and −0.621 ***, respectively. On the other hand, NLBC showed positive correlations with NH4+ (r = 0.092 **) and NO3 (r = 0.105 **), and REC showed positive correlations with NH4+ (r = 0.15 ***) and NO3- (r = 0.104 **) (Figure 8). These results underscore the significance of labile carbon (as LBC, LLBC, and POXC) and recalcitrant carbon fractions (as NLBC) in monitoring alterations in soil organic matter, as they are associated with the concentrations of NH4+ and NO3 (Figure 8). Negative correlations were observed between NH4+ and NO3 with labile carbon types, such as LBC, LLBC, and POXC, while positive correlations were noted with stable carbon fractions, such as NLBC, and REC.
The relationships between the carbon fractions and availability of P and pH in relation to SOC content: A correlation matrix illustrating the relationships among soil chemical properties, including the labile carbon fractions, phosphorus (P), and pH, is presented. The correlation matrix presents pairwise correlation coefficients, with blue indicating positive and red indicating negative correlations. Negative correlations were observed for LBC with P (B) and P(M) (r = −0.079 * and r = −0.099 **, respectively), while LLBC was negatively correlated with P(B) and P(M) (r = −0.095 ** and r = −0.101 **, respectively) (Figure 9). The findings indicate a relationship between LBC and LLBC, since both represent significant forms of labile carbon that have access to phosphorus. Comprehending these interactions is essential for regulating soil organic matter and nutrient cycling in the organic fertilization of sandy soil.

4. Discussion

4.1. The Carbon Fractions with the Combinations of Animal Manure with DDGs

Soil carbon is a crucial component of soil health that influences fertility, structure, and water retention. In organic farming systems, particularly in cassava (Manihot esculenta) cultivation in tropical sandy soils, the use of cassava ethanol residue (DDGs) as a soil amendment has gained interest due to its potential benefits for soil quality and agricultural productivity. Our results indicate that a combination of organic fertilizer and DDGs provided essential soil nutrients, particularly NH4+, NO3, H2PO4, while maintaining a neutral pH, which is beneficial for organic cassava cultivation in low-yield environments such as tropical sandy soils [32]. DDG amendments also significantly affected soil carbon concentrations in sandy soils, with higher carbon accumulation being observed in the studied soils following supplementation with DDG [62]. Furthermore, the addition of 20% DDGS from corn reduced the C:N ratio of potting mix from 90:1 to 24:1 and soil from 23:1 to 10:1. Microbial respiration doubled in potting mix and soil at 3 and 14 days due to the lower C:N ratio [31]. Our study found that the soil carbon content was 43.6 g kg−1, while the water-soluble carbon content was 0.113 g kg−1. Zhang et al. [63] reported a much higher carbon content in DDGs, reaching up to 470 g kg−1. The lower carbon content in our study may be attributed to the reduction in volatile organic compounds under open-field conditions.
The use of organic fertilizer, such as composted materials or high-quality organic amendments, typically results in more stable soil carbon levels [64,65]. Various organic amendments, such as pig manure and corn straw, have different impacts on soil organic carbon (SOC) stability, with higher-quality materials generally leading to increased SOC accumulation [25]. These effects are particularly pronounced in systems receiving high-nitrogen inputs from organic amendments [66]. Manure and other organic amendments significantly enhance SOC, including various carbon fractions such as loss-on-ignition carbon, Walkley–Black carbon, permanganate-oxidizable carbon (POXC), and microbial biomass carbon (MBC) [18]. Additionally, manure improves specific forms of soil carbon, including cold- and hot-water-extractable carbon, microbial biomass carbon, and dissolved organic carbon [67]. Doubling the application rate of organic fertilizers increases different carbon fractions, including light-fraction carbon, particulate organic matter, and mobile humic acid [18]. These fractions are more sensitive to changes in soil management practices compared with total organic carbon [11]. Manure, in particular, has been shown to be more effective than chemical fertilizers in maintaining and enhancing labile carbon pools [68]. The application of organic fertilizers also boosts soil enzyme activities, which are linked to the decomposition of organic matter and nutrient cycling. This rise in enzyme activity further helps to improve labile carbon fractions [15,69]. Farmyard manure, in particular, significantly increases labile carbon in soils, enhancing microbial biomass and enzyme activities, with application rates influencing the size of labile carbon pools [15,16].
According to other studies, long-term organic farming has been shown to promote carbon stabilization, with increases in both labile and recalcitrant SOC pools [70]. The presence of stable and labile fractions in soil is closely linked to the ability of organic fertilizers to retain and regulate carbon [71]. Organic additives such as farmyard manure and compost enhance soil fertility by maintaining a balance between labile and recalcitrant carbon pools [69]. The progressive decomposition of organic materials, which is facilitated by enzymatic activity, enables prolonged carbon sequestration over time [72] and influences the soil structure, increasing macroaggregate formation and improving overall soil stability [18]. The ability of organic fertilizers to improve SOC stabilization is particularly relevant in sandy soils, where organic matter is more susceptible to decomposition and loss [11]. A significant increase in SOC levels within only the first year suggests that organic fertilizers’ initial benefits may diminish without continuous management [20]. Therefore, using a mix of organic materials like chicken and cow manure and DDG could boost the labile and stable carbon fractions in sandy soils, and the presence and alternation of the stable and labile fractions in soil are closely linked to the ability of organic fertilizers to retain and regulate carbon in soil [71], especially within the first year.

4.2. Relationship Between the Soil Carbon Fraction and SOC According to the Mechanisms of Decomposition and Stabilization

Our research showed that there was not much labile carbon at first before applying organic fertilizer. This study demonstrated that the application of mixed organic fertilizer and DDGs initially increased both the labile and stable carbon fractions within the first one to three years LUA3, but a decline was observed in the fourth and fifth years, suggesting that the fertility boost may have been temporary. We showed that there were strong positive links between SOC and carbon fractions such as NLBC. However, neither LBC nor LLBC demonstrated any significant correlations with SOC.
Carbon mineralization in agricultural soils is significantly accelerated by the introduction of exogenous organic carbon. Organic fertilizers promote microbial biomass growth, enhancing carbon mineralization and turnover rates [8]. This microbial activity is crucial for maintaining soil fertility [73], with the presence of non-dominant bacterial species influencing carbon mineralization processes [73]. The labile carbon fraction is essential in enhancing microbial activity, enzyme production, and carbon turnover [11,16]. According to Bongiorno [74] et al. (2019), permanganate-oxidizable carbon (POXC), a type of labile carbon, changed the most quickly in the first year. The addition of labile carbon from organic fertilization can stimulate the decomposition of more stable soil organic carbon (SOC) by enhancing microbial activity. This is because labile carbon serves as an energy source for microbes, which in turn accelerates the breakdown of more resistant carbon compounds in the soil [75]. Labile carbon inputs from mixed organic fertilization could alter the composition and activity of soil microbial communities. For instance, they can increase the abundance and activity of bacteria and fungi, which are crucial for the decomposition process. This microbial response is often independent of microbial growth dynamics, suggesting that extracellular enzyme activity plays a significant role in priming [76]. The priming effect and subsequent mineralization can be influenced by temperature. The impact of labile carbon on decomposition varies with its concentration. Low concentrations can stimulate decomposition, while high concentrations may inhibit it due to microbial substrate preference or negative priming effects [77]. Frequent inputs of labile carbon can lead to stronger priming effects compared to infrequent inputs. This is due to continuous stimulation of microbial activity and enzyme production, which enhances SOM decomposition [76]. Moreover, in our study of tropical soil, the high temperatures could enhance the priming effect, leading to increased CO2 production from SOC decomposition [77]. However, other types, such as water-soluble carbon (WSC), the labile carbon fraction (LBC), and the less labile carbon fraction (LLBC), changed more slowly and over time from this study. This also triggers catabolic responses in microbial communities, shifting soil organic matter decomposition towards nitrogen-rich components [78]. In addition, in our study, adding labile carbon from organic fertilization over and over again in sandy soils (figuratively, more than once) because there might be fewer priming effects than adding it all at once, especially in soils that were not very fertile [79], which showed that this effect led to a trend in higher SOC compared with the pre-fertilization level that found in the LUA 5.
These more labile carbon fractions are preferentially decomposed by soil microbes in the beginning, leaving behind more recalcitrant carbon [11,18]. Conversely, organic fertilizers also improve the protection of labile carbon against biodegradation by integrating it into stable humic substances, particularly when mature compost or humic acids are applied [14]. This stabilization process further enhances long-term soil carbon retention. However, the sensitivity of this effect varies among different soils and is influenced by factors such as soil fertility and microbial biomass [80]. We would like to consider that the magnitude of the priming effect can vary depending on factors such as the type of labile carbon, the presence of other organic inputs, and environmental conditions [81].
While organic fertilization can enhance SOC accumulation in the short term, it may also decrease the stability of SOC over time, particularly in surface soil layers [67]. Although organic fertilization can improve carbon stocks in the soil, the reduction in recalcitrant carbon fractions may affect the long-term carbon sequestration potential [82]. However, the type and quantity of organic fertilizers should be carefully managed to avoid potential negative impacts on soil carbon stability [16]. According to the decrease in recalcitrant carbon and the type organic fertilizer [83,84], continuous application without proper practices may decrease the recalcitrant fractions due to increased microbial activity and organic matter turnover [82].
Although our study observed a small increase in non-labile carbon (NLBC) after only one year, the contents then non significantly decreased over 3–4 years later. This reduction in recalcitrant carbon fractions due to organic fertilization leads to increased soil respiration rates, as more carbon is mineralized and released as CO2 [15]. The increased microbial activity enhances the breakdown of stable carbon compounds, thereby reducing the recalcitrance of soil organic carbon [25], such as cellulase and β-glucosidase, facilitating the decomposition of complex carbon compounds, and leading to a decrease in recalcitrant carbon fractions [79]. Organic fertilization alters the chemical composition of SOC by increasing labile carbon fractions (e.g., O-alkyl C) and reducing stable carbon fractions (e.g., aromatic C). This shift in carbon chemistry makes the carbon more accessible to microbial degradation [67]. Therefore, organic fertilization could increase soil microbial activity, leading to soil decomposition and mineralization. This reduces recalcitrant carbon pools, converting more carbon into labile forms [83,84]. Our research showed that organic fertilizers, such as manure mixed with DGG, did not significantly change stable carbon fractions, but increased soil microbial activity via these carbon fractions.
Our results showed positive relationships of POXC with LBC and NLBC, which is considered the most sensitive labile carbon fraction in organic fertilizer in sandy soil. POXC provides insights into the total organic matter content, nutrient availability, soil structure, and microbial biomass activity [74]. POXC is used to measure labile carbon in soils, as it is more sensitive to management practices and environmental changes than recalcitrant carbon [85]. It is closely related to other labile carbon fractions, such as particulate organic carbon (POC) and microbial biomass carbon [74]. POXC is not a purely labile carbon fraction, as it shows high reactivity with lignin, a more complex and less labile compound, challenging the assumption that it only measures labile carbon [86]. POXC’s composition aligns with that of labile carbon [86], challenging the assumption that it only measures it. This study shows that using mixed organic fertilizers greatly affected soil carbon types, especially by boosting soil microbes’ activities due to the presence of easily available carbon while keeping the amount of stable carbon the same. From this study, LUA 5 shows that the accumulation of both labile and recalcitrant carbon pools enhances soil carbon content. The impact of labile carbon on decomposition varies with its concentration. Low concentrations could stimulate decomposition, as mentioned previously, while high concentrations may inhibit it due to microbial substrate preference or negative priming effects [77]. While NLBC is recalcitrant organic carbon, characterized by its resistance to decomposition, it contributes to long-term carbon storage in soils. This part includes substances like alkyl carbon, which are stable and do not break down easily because of their chemical structure [87]. Moreover, the presence of recalcitrant carbon enhances soil aggregation, particularly macro-aggregation, which is vital for SOC stabilization. This is because recalcitrant carbon parts, like methoxyl/N-alkyl C, help create stable soil clumps, which protect SOC from being broken down by microbes [88]. Therefore, using a mix of organic materials from this study could increase both of the carbon fractions, especially LBC and NLBC components, in sandy soils. These amendments boost/maintain the amount of SOC by helping to build up stable carbon parts, which are important for storing carbon over a long time. We observed shifts in the labile and non-labile carbon fractions, highlighting the need for strategic organic fertilizer application to sustain soil health and carbon sequestration. We suggested that the addition of LBC from mixed organic fertilization seems to enhance SOC decomposition more than accumulation. NLCB may persist in sandy soil for a longer duration than LBC, resulting in the retention of SOC in the sandy soil of this study.

4.3. The Relationship Between Carbon Fractions and Available Nitrogen and Its Effect on Soil Carbon in Sandy Soil

Sandy soils, owing to their unique texture and structure, exhibit distinct patterns of nitrogen mineralization compared with other soil types [34,35]. Soil organic matter serves as a primary nitrogen reservoir, releasing nitrogen through mineralization, which is essential for plant uptake. The conversion of NH4+ into NO3 via nitrification is enhanced by organic fertilizers, leading to an initial increase in NO3 levels [89,90]. After adding organic fertilizer, there were NH4+ and NO3 received from direct organic fertilization (Table 2 and Table 3), and NH4+ might be rapidly converted into NO3 through nitrification, a process that was often more pronounced with organic fertilizer application [9]. However, there was no significant difference between before and after fertilization, and the addition of fertilizer caused a decrease in NH4+ and NO3 levels from this.
On the other hand, adding labile carbon speeds the breakdown of SOM [91]. Depending on microbial community responses and nitrogen availability, labile carbon can either enhance or inhibit SOM mineralization [92]. We considered that organic fertilizers may not have significantly high NH4+ levels if the mineralization of organic matter primarily results in NO3 production rather than NH4+ accumulation [93]. The negative correlation between labile carbon fractions (LBC and LLBC) and NH4+ in our study further supports the negative correlation between NH4+ and NO3 levels (Figure 8), and shows how the levels of NH4+ and NO3 interact with these labile carbon fractions, which then affect SOC (Figure 8). The mineralization of organic nitrogen is often decoupled from carbon in these fractions, meaning that nitrogen availability does not always correlate directly with carbon content [37]. The addition of labile carbon through organic fertilizer applications significantly alters nitrification and nitrogen mineralization. Labile carbon sources, such as glucose, can significantly reduce NH4+-N and NO3-N concentrations in soils due to increased microbial activity [94]. The presence of labile organic carbon can regulate nitrification rates. High-quality labile carbon sources, such as glucose, can inhibit nitrification by outcompeting nitrifiers for NH4+, thereby reducing nitrogen availability for nitrification [95]. Furthermore, labile carbon can induce priming effects, altering organic matter decomposition rates. These effects depend on the carbon-to-nitrogen (C:N) ratio of inputs and vary depending on whether NO3 or NH4+ is the dominant nitrogen form [91]. Our study found a negative relationship between labile carbon fractions (e.g., LBC and POXC) and NH4+, as well as between NH4+ and NO3. This suggests that nitrifying bacteria utilize labile carbon as an energy source, independently of soil nitrogen availability [94]. This research has demonstrated that increasing labile carbon levels can reduce the concentrations of NH4+ and NO3 in soils, indicating a crucial threshold at which nitrogen transformations shift [38,94]. The priming effect can vary based on the quality of the carbon added [96]. However, labile fractions are more readily available to microbial communities, stimulating nitrogen mineralization [36]. This is because these fractions serve as a substrate for microbial activity, accelerating nitrogen cycling [37,97]. Therefore, the amount of labile carbon fractions might be a partial factor controlling the nitrogen mineralization in this study.
We observed a positive relationship between NH4+ and NLBC. (Figure 8). The presence of recalcitrant carbon can lead to shifts in microbial community composition, favoring organisms capable of utilizing these carbon sources. This adaptation can enhance nitrification processes by maintaining microbial activity and enzyme production [20]. We agree that nitrifiers can modify the composition of organic matter by breaking down recalcitrant compounds. This is facilitated by the production of organic compounds, as this helps degrade stable materials, particularly in carbon-limited environments [98]. Low-quality recalcitrant carbon leads to a delayed effect [96]. This delayed effect is associated with the decomposition of recalcitrant carbon compounds, which can influence microbial strategies and enzyme activities [96]. Moreover, the recalcitrant carbon fraction can stimulate heterotrophic nitrification in soils [20], which is consistent with our results (Figure 8). This is because recalcitrant carbon fractions, such as carbonyl and aromatic carbon, are positively correlated with nitrification rates, especially in acidic soils [20]. The presence of recalcitrant carbon can sustain microbial activity over longer periods, potentially enhancing nitrification [20]. Recalcitrant carbon influences the microbial community composition, which, in turn, affects nitrification. It has been shown that adding biochar to soil can increase the number of heterotrophic nitrifiers, such as Trichoderma, Aspergillus, and Penicillium. These organisms are known to help with the nitrification process [99]. Nitrifiers can change the constituents of organic matter by helping to break down aromatic compounds that are difficult to break down. This process is important because nitrifiers help the cycling of organic carbon and nitrogenous compounds in places such as the aphotic ocean layer, where energy and carbon sources are limited [98]. While recalcitrant carbon can initially boost nitrification rates, the long-term sustainability of this effect is uncertain. The stimulatory impact of carbon amendments tends to decrease as the availability of labile carbon declines. In the future, scientists should investigate ways to keep nitrification rates high for long periods of time and how microbial communities might change over time [100]. Conversely, Aumtong [101] et al. (2024) assessed that when soil had low nitrogen input, it led to less nitrogen being available; the scarcity of soil N would hasten the breakdown of recalcitrant C. However, the labile carbon fractions (as LBC) would not break down as fast through “nitrogen mining”.
The availability of these nutrients can modulate the intensity of the priming effect and the rate of nitrification [102]. The priming effect via recalcitrant carbon fraction and subsequent nitrification is also influenced by nutrient availability, particularly that of N. This study highlights the negative relationship between labile carbon fractions and nitrification processes in sandy soils with the application of organic fertilizer by altering the balance of NO3 and NH4+, while there is a positive relationship between the recalcitrant carbon fraction and the availability of nitrogen. Then, the recalcitrant carbon fraction can be changed by the activity of microbes and the production of enzymes, which, in turn, changes the priming effect [91], i.e., the amounts of NLBC and REC would be decreased, and they might be converted into the LBC fraction later, as mentioned previously in this study.

4.4. The Relationship Between the Carbon Fraction and P in Sandy Soil

Following organic fertilization, the soil’s availability of P in both methods changed because it changes the organic carbon content [103]. This raises the soil’s Olsen–P and biological-based P fractions, making it easier for plants to take up [104]. Organic fertilizers also change the physical and chemical properties of the soil and organic carbon levels [105] and increase the number of microbes in the soil [106]. The availability and transformation of P in sandy soils are influenced by factors such as soil pH, organic carbon content, and the presence of basic cations. These factors play a critical role in determining the lability of P and its interactions with labile carbon fractions [107]. Certainly, increased soil organic matter from organic fertilization can reduce P fixation by blocking P sorption sites on soil minerals, thus, enhancing long-term P availability [108]. Additionally, the presence of labile carbon can influence soil pH, which, in turn, affects P solubility. Our study showed that P availability varied with the application of organic fertilizer, but the P levels in fresh soil (i.e., Malachite method) remained constant. This leads to enhanced growth and activity of P-solubilizing microorganisms, thereby improving soil P availability [85]. This may indicate heterogeneity in the availability or retention of P in the soil after a combination of organic fertilizers. Our study demonstrates that organic fertilization leads to a decrease in soil pH, especially in LUA 2, primarily due to the acidifying effects of organic matter decomposition and the release of organic acids.
Changes in soil pH due to organic fertilization can further affect soil microbial community composition, impacting nutrient cycling and overall soil health [109]. Organic fertilizers typically involve nitrogen inputs that undergo nitrification, converting ammonium into nitrate, releasing hydrogen ions, and gradually lowering soil pH over time [110]. The decomposition of organic matter by soil microorganisms results in the production of organic acids, which contribute to soil acidification. This effect is particularly pronounced in soils with high microbial activity, where the breakdown of organic fertilizers leads to the release of acids that lower soil pH [111]. The relationship between soil organic carbon and pH is complex, as organic fertilizers increase SOC levels, which, in turn, influence soil pH. The interaction between SOC and microbial communities has been reported to drive pH fluctuations, as organic amendments alter bacterial community structures and soil biochemical processes [109]. Over time, mixed continuous organic fertilizer application, particularly when combined with other fertilization strategies, can lead to substantial alterations in soil chemical properties, including persistent pH reduction [112], which would be a concern, particularly in sandy soil. However, this study found that higher LBC and NLBC are linked to more phosphorus being available in sandy soil, highlighting how important phosphorus is in this soil, as it slows down the breakdown of soil carbon fraction (i.e., LBC), lowers phosphorus fixation, and might improve long-term phosphorus availability.
Figure 10 illustrates the complex interactions between different forms of soil carbon, nutrient cycling, and the organic fertilizer application of this study. When mixing organic fertilizer is applied, it can lead to an increase and retention of NLBCs, which are a more stable form of carbon that remains in the soil longer. The presence of NLBC contributes to an increase in SOC, which is essential for soil structure, fertility, and microbial activity. NLBC also plays a crucial role in enhancing nitrification—the biological process that converts ammonium (NH4+) into nitrate (NO3) by supporting microbial communities through the provision of carbon sources and stimulating enzyme production. Furthermore, NLBC helps increase phosphorus (P) availability by reducing its fixation, making it more accessible to plants. As a result, NLBC promotes both nutrient availability and microbial efficiency (Figure 10).
When mixing organic fertilizer is applied, it can lead to an increase of LBC. Labile carbon can enhance microbial activity, accelerating the breakdown of SOC and NLBC and affecting soil microbial dynamics. It can increase the abundance of bacteria and fungi, crucial for decomposition, and can influence temperature sensitivity. This suggests that extracellular enzyme activity plays a significant role in priming. However, problems arise when the level of LBC becomes too high. LBC, being a more reactive and short-lived carbon source, could enhance or inhibit nitrification by creating conditions that reduce the transformation of NH4+ and NO3. However, the inhibition of nitrification slows down microbial processing and might induce the more decomposition of NLBC, which is counterproductive to soil carbon retention.
Moreover, in the acidic soil, reduced nitrification also contributes to lower available phosphorus and increases soil acidity due to shifts in microbial activity and chemical balances. However, the presence of LBC might prevent phosphorus fixation in acidic soils (Figure 10). To sustain soil fertility and carbon stocks, a balanced approach is required, mixing organic fertilizers in a way that promotes NLBC buildup while preventing the inhibitory effects of too much LBC. We must carefully manage the organic fertilization approach (i.e., timing, organic fertilizer quality, and environmental conditions) to support a healthy carbon-nutrient cycle in these agroecosystems.
This study showed that organic fertilizers, such as combinations of compost, local manure, and DDGs, have a significant effect on both the quantity and stability of SOC. The implications of this study are as follows: Our findings indicate that a routine soil testing framework should be implemented to monitor changes in carbon fractions and nutrient levels over time. Using the right mix of both labile and stable carbon types, along with enough nutrients like NH4+-N, NO3-N, and P, makes the soil healthier and helps it hold carbon better when using the right organic fertilizers. This method works especially well in sandy soils. We consider complementing this with other mechanisms, such as cations (i.e., Ca2+, Mg2+, K+), and enhancing the soil structure in these situations. According to Jiang [113] et al. (2019), soil organic carbon pools generally show stable characteristics, including reduced carbon emissions and enhanced sequestration. Notably, the NRLB and REC fractions, which are stable carbon components, exhibited the opposite trend in comparison with the labile carbon fractions (i.e., ratio between stable and labile carbon). This study demonstrated that soil texture could explain the lack of an increase in soil carbon after applying organic fertilizer in sandy soils. The sandy soils (Table 4) have a low carbon storage potential due to their coarse texture [114], which could offset the gains in SOC from organic amendments [115]. Understanding the long-term effects of these organic amendments on the stable fraction and SOC stability will be crucial for developing sustainable soil management strategies.
In the future, these relationships should be used to develop organic fertilizer management strategies and to balance soil carbon and nitrogen dynamics. Thus, additional research should focus on optimizing the application rates and combinations of organic amendments to maximize soil health and agricultural productivity. Understanding these interactions is essential for predicting soil carbon fractions, SOC turnover, and nitrogen transformation, all of which have significant implications for organic fertilization in sandy soil. This will help maximize nitrogen availability, thus, ultimately improving soil sustainability in sandy environments. Moreover, other key factors, including cations such as Ca and Mg, are likely involved in explaining soil carbon stabilization in this soil.

5. Conclusions

This research has shown that using organic fertilizers, like local manure (such as chicken and cow) and DDGs, greatly affects the quantity and stability of soil organic carbon fractions, and as a result, the overall SOC was compared between before and after using. The ramifications of this research are as follows: The SOC level did not change with time, as these results found that over the year, the application of organic fertilizer significantly increased SOC, reaching a peak of 25.93% in only the first year LUA 3 showed the highest in WSC; POXC went up in the first year after adding organic fertilizer but started to drop in the second year, and then their amounts decreased in the other LUAs. The LBC fraction was at its lowest before fertilization, peaking at LUA 3 and increasing by 5.44–25.50% after organic fertilizer addition, and then decreasing for LBC and LLBC at LUA 4 and 5. Notably, these labile carbon fractions were significantly higher than pre-fertilization. However, there were no significant differences at other times. The first year revealed high NLBC levels, exceeded 60% in comparison to the pre-fertilizer period. In the second year, NLBC levels declined to LUA 5, a change that was not statistically significant. After pre-fertilization, the concentration of REC did not significantly decrease. Organic fertilization decreased NO3-N concentrations; nevertheless, no significant variation was seen before and after fertilization. Moreover, the Bray-extractable phosphorus (P(B)) was reduced (i.e., LUA 1 and 4). The pH levels decreased (1.17–6.68%) after the application of organic fertilizer, especially in the second year. Strong positive correlations were identified between SOC and carbon fractions, specifically NLBC with a correlation coefficient of r = 0.54 *** and POXC with r = 0.49 ***. Neither LBC nor LLBC exhibited significant correlations with SOC. Negative correlations were observed between NH4+ and NO3 with labile carbon types, including LBC, LLBC, and POXC. In contrast, positive correlations were noted with stable carbon fractions, such as NLBC and REC. This study showed that continuous five-year application of organic fertilizers did not significantly increase soil carbon; however, it was able to cause changes in various organic carbon fractions. The presence of both LBC and NLBC fractions would support microbial communities by providing carbon sources and stimulating enzyme production. In particular, NLBC, a stable form of soil carbon, contributes to SOC content and enhances nitrification. However, we suggest that the addition of LBC from mixed organic fertilization appears to increase SOC decomposition more than accumulation. While NLCB may remain in sandy soil longer than LBC, it leads to the remainder of SOC in sandy soil. Moreover, using mixed organic fertilization might enhance the acidity of sandy soils.

Author Contributions

Conceptualization, S.A. and C.C.; methodology, S.A.; software, C.C.; validation, S.A.; formal analysis, S.A. and C.C.; investigation, S.A. and C.C.; resources, C.S., K.K. and T.C.; data curation, C.S., K.K. and T.C.; writing—original draft preparation, S.A., C.S., K.K. and T.C.; writing—review and editing, S.A.; visualization, S.A. and T.C.; supervision, S.A.; project administration, S.A.; funding acquisition, S.A. and C.C. All authors have read and agreed to the published version of the manuscript.

Funding

This research was funded by the Agricultural Research Development Agency of Thailand, grant number PRP6707031410, and it was partially supported by Maejo University (MJU) and Chiang Mai University (CMU).

Data Availability Statement

The original contributions presented in this study are included in the article. Further inquiries can be directed to the corresponding author.

Acknowledgments

We appreciate all farmers, UBON SUNFLOWER COMPANY LIMITED and the Ubon Bio Ethanol Public Company Limited for all their support.

Conflicts of Interest

The authors declare no conflicts of interest.

References

  1. Yost, J.L.; Hartemink, A.E. Chapter Four—Soil organic carbon in sandy soils: A review. In Advances in Agronomy; Sparks, D.L., Ed.; Academic Press: Cambridge, MA, USA, 2019; Volume 158, pp. 217–310. [Google Scholar]
  2. Huang, J.; Hartemink, A.E. Soil and environmental issues in sandy soils. Earth-Sci. Rev. 2020, 208, 103295. [Google Scholar] [CrossRef]
  3. Miura, K.; Tulaphitak, T.; Kyuma, K. Pedogenetic studies on some selected soils in Northeast Thailand. Soil Sci. Plant Nutr. 1992, 38, 485–493. [Google Scholar] [CrossRef]
  4. Tancharoen, S.; Iwasaki, S.; Watanabe, T.; Luanmanee, S.; Nobuntou, W.; Amonpon, W.; Chumsuwan, N.; Paisancharoen, K.; Bumrung, S.; Matsumoto, N. Carbon Sequestration and Soil Fertility Management in Sandy and Clayey Soils Revealed by Over Four Decades of Long-Term Field Experiments in Thailand. Land Degrad. Dev. 2024, 35, 5488–5503. [Google Scholar] [CrossRef]
  5. Putthacharoen, S.; Howeler, R.H.; Jantawat, S.; Vichukit, V. Nutrient uptake and soil erosion losses in cassava and six other crops in a Psamment in eastern Thailand. Field Crops Res. 1998, 57, 113–126. [Google Scholar] [CrossRef]
  6. Bhunia, S.; Bhowmik, A.; Mallick, R.; Mukherjee, J. Agronomic Efficiency of Animal-Derived Organic Fertilizers and Their Effects on Biology and Fertility of Soil: A Review. Agronomy 2021, 11, 823. [Google Scholar] [CrossRef]
  7. Puttaso, A.; Vityakon, P.; Saenjan, P.; Trelo-ges, V.; Cadisch, G. Relationship between residue quality, decomposition patterns, and soil organic matter accumulation in a tropical sandy soil after 13 years. Nutr. Cycl. Agroecosystems 2011, 89, 159–174. [Google Scholar] [CrossRef]
  8. Sun, Z.; Liu, S.; Zhang, T.; Zhao, X.; Chen, S.; Wang, Q. Priming of soil organic carbon decomposition induced by exogenous organic carbon input: A meta-analysis. Plant Soil 2019, 443, 463–471. [Google Scholar] [CrossRef]
  9. Zhang, Y.; Xu, Z.; Jiang, D. Soil exchangeable base cations along a chronosequence of Caragana microphylla plantation in a semi-arid sandy land, China. J. Arid. Land 2012, 5, 42–50. [Google Scholar] [CrossRef]
  10. Šimanský, V.; Juriga, M.; Jonczak, J.; Uzarowicz, Ł.; Stępień, W. How relationships between soil organic matter parameters and soil structure characteristics are affected by the long-term fertilization of a sandy soil. Geoderma 2019, 342, 75–84. [Google Scholar] [CrossRef]
  11. Li, T.; Zhang, Y.; Bei, S.; Li, X.; Reinsch, S.; Zhang, H.; Zhang, J. Contrasting impacts of manure and inorganic fertilizer applications for nine years on soil organic carbon and its labile fractions in bulk soil and soil aggregates. CATENA 2020, 194, 104739. [Google Scholar] [CrossRef]
  12. Heitkamp, F.; Raup, J.; Ludwig, B. Impact of fertilizer type and rate on carbon and nitrogen pools in a sandy Cambisol. Plant Soil 2009, 319, 259–275. [Google Scholar] [CrossRef]
  13. Banger, K.; Toor, G.; Biswas, A.; Sidhu, S.; Sudhir, A. Soil organic carbon fractions after 16-years of applications of fertilizers and organic manure in a Typic Rhodalfs in semi-arid tropics. Nutr. Cycl. Agroecosystems 2010, 86, 391–399. [Google Scholar] [CrossRef]
  14. Piccolo, A.; Spaccini, R.; Nieder, R.; Richter, J. Sequestration of a Biologically Labile Organic Carbon in Soils by Humified Organic Matter. Clim. Change 2004, 67, 329–343. [Google Scholar] [CrossRef]
  15. Zhang, L.; Chen, X.; Xu, Y.; Jin, M.; Ye, X.; Gao, H.; Chu, W.; Mao, J.; Thompson, M.L. Soil labile organic carbon fractions and soil enzyme activities after 10 years of continuous fertilization and wheat residue incorporation. Sci. Rep. 2020, 10, 11318. [Google Scholar] [CrossRef] [PubMed]
  16. Benbi, D.K.; Brar, K.; Toor, A.S.; Sharma, S. Sensitivity of Labile Soil Organic Carbon Pools to Long-Term Fertilizer, Straw and Manure Management in Rice-Wheat System. Pedosphere 2015, 25, 534–545. [Google Scholar] [CrossRef]
  17. Zhang, H.; Ding, W.; Luo, J.; Bolan, N.; Yu, H.; Zhu, J. Temporal responses of microorganisms and native organic carbon mineralization to 13C-glucose addition in a sandy loam soil with long-term fertilization. Eur. J. Soil Biol. 2016, 74, 16–22. [Google Scholar] [CrossRef]
  18. Kim, Y.-N.; Cho, Y.-S.; Lee, J.-H.; Seo, H.-R.; Kim, B.-H.; Lee, D.-B.; Lee, Y.B.; Kim, K.-H. Short-Term Responses of Soil Organic Carbon Pool and Crop Performance to Different Fertilizer Applications. Agronomy 2022, 12, 1106. [Google Scholar] [CrossRef]
  19. Mustafa, A.; Xu, H.; Sun, N.; Liu, K.; Huang, Q.; Nezhad, M.T.; Xu, M. Long-Term Fertilization Alters the Storage and Stability of Soil Organic Carbon in Chinese Paddy Soil. Agronomy 2023, 13, 1463. [Google Scholar] [CrossRef]
  20. Zhang, Q.; Feng, J.; Li, J.; Huang, C.-Y.; Shen, Y.; Cheng, W.; Zhu, B. A distinct sensitivity to the priming effect between labile and stable soil organic carbon. New Phytol. 2023, 237, 88–99. [Google Scholar] [CrossRef]
  21. Aguilera-Huertas, J.; Parras-Alcántara, L.; González-Rosado, M.; Lozano-García, B. What Influence Does Conventional Tillage Have on the Ability of Soils to Sequester Carbon, Stabilise It and Become Saturated in the Medium Term? A Case Study in a Traditional Rainfed Olive Grove. Sustainability 2022, 14, 7097. [Google Scholar] [CrossRef]
  22. Vityakon, P. Degradation and restoration of sandy soils under different agricultural land uses in northeast Thailand: A review. Land Degrad. Dev. 2007, 18, 567–577. [Google Scholar] [CrossRef]
  23. de Alencar, G.V.; Gomes, L.C.; Barros, V.M.d.S.; Ortiz Escobar, M.E.; de Oliveira, T.S.; Mendonça, E.d.S. Organic farming improves soil carbon pools and aggregation of sandy soils in the Brazilian semi-arid region. Soil Use Manag. 2024, 40, e13097. [Google Scholar] [CrossRef]
  24. Amoakwah, E.; Frimpong, K.A.; Arthur, E. Corn Cob Biochar Improves Aggregate Characteristics of a Tropical Sandy Loam. Soil Sci. Soc. Am. J. 2017, 81, 1054–1063. [Google Scholar] [CrossRef]
  25. Luan, H.; Gao, W.; Huang, S.; Tang, J.; Li, M.; Zhang, H.; Chen, X. Partial substitution of chemical fertilizer with organic amendments affects soil organic carbon composition and stability in a greenhouse vegetable production system. Soil Tillage Res. 2019, 191, 185–196. [Google Scholar] [CrossRef]
  26. Sedlář, O.; Balík, J.; Černý, J.; Kulhánek, M.; Smatanová, M. Long-Term Application of Organic Fertilizers in Relation to Soil Organic Matter Quality. Agronomy 2023, 13, 175. [Google Scholar] [CrossRef]
  27. Wang, J.; Xiong, Z.; Kuzyakov, Y. Biochar stability in soil: Meta-analysis of decomposition and priming effects. GCB Bioenergy 2016, 8, 512–523. [Google Scholar] [CrossRef]
  28. Abrar, M.M.; Xu, H.; Aziz, T.; Sun, N.; Mustafa, A.; Aslam, M.W.; Shah, S.A.A.; Mehmood, K.; Zhou, B.; Ma, X.; et al. Carbon, nitrogen, and phosphorus stoichiometry mediate sensitivity of carbon stabilization mechanisms along with surface layers of a Mollisol after long-term fertilization in Northeast China. J. Soils Sediments 2021, 21, 705–723. [Google Scholar] [CrossRef]
  29. Qian, P.; Schoenau, J.J.; King, T.; Fatteicher, C. Effect of Soil Amendment with Alfalfa Powders and Distillers Grains on Nutrition and Growth of Canola. J. Plant Nutr. 2011, 34, 1403–1417. [Google Scholar] [CrossRef]
  30. He, L.; Wu, H.; Chen, W.; Meng, Q.; Zhou, Z. Influence of sulfur on the fermentation characteristics of corn distiller’s dried grains with solubles in in vitro culture. Czech J. Anim. Sci. 2017, 62, 417–425. [Google Scholar] [CrossRef]
  31. Boydston, R.A.; Collins, H.P.; Vaughn, S.F. Response of Weeds and Ornamental Plants to Potting Soil Amended with Dried Distillers Grains. HortScience 2008, 43, 191–195. [Google Scholar] [CrossRef]
  32. Nelson, K.; Motavalli, P.; Smoot, R. Utility of Dried Distillers Grain as a Fertilizer Source for Corn. J. Agric. Sci. 2009, 1, 1–3. [Google Scholar] [CrossRef]
  33. Kader, M.A.; Sleutel, S.; Begum, S.A.; D’Haene, K.; Jegajeevagan, K.; De Neve, S. Soil organic matter fractionation as a tool for predicting nitrogen mineralization in silty arable soils. Soil Use Manag. 2010, 26, 494–507. [Google Scholar] [CrossRef]
  34. Elrys, A.S.; Wang, J.; Metwally, M.A.S.; Cheng, Y.; Zhang, J.-B.; Cai, Z.-C.; Chang, S.X.; Müller, C. Global gross nitrification rates are dominantly driven by soil carbon-to-nitrogen stoichiometry and total nitrogen. Glob. Change Biol. 2021, 27, 6512–6524. [Google Scholar] [CrossRef]
  35. Iqbal, S.; Xu, J.; Arif, M.S.; Worthy, F.R.; Jones, D.L.; Khan, S.; Alharbi, S.A.; Filimonenko, E.; Nadir, S.; Bu, D.; et al. Do Added Microplastics, Native Soil Properties, and Prevailing Climatic Conditions Have Consequences for Carbon and Nitrogen Contents in Soil? A Global Data Synthesis of Pot and Greenhouse Studies. Environ. Sci. Technol. 2024, 58, 8464–8479. [Google Scholar] [CrossRef]
  36. Chen, Y.; Camps-Arbestain, M.; Shen, Q.; Singh, B.; Cayuela, M.L. The long-term role of organic amendments in building soil nutrient fertility: A meta-analysis and review. Nutr. Cycl. Agroecosyst. 2018, 111, 103–125. [Google Scholar] [CrossRef]
  37. Bimüller, C.; Mueller, C.W.; von Lützow, M.; Kreyling, O.; Kölbl, A.; Haug, S.; Schloter, M.; Kögel-Knabner, I. Decoupled carbon and nitrogen mineralization in soil particle size fractions of a forest topsoil. Soil Biol. Biochem. 2014, 78, 263–273. [Google Scholar] [CrossRef]
  38. Tian, Q.; Yang, X.; Wang, X.; Liao, C.; Li, Q.; Wang, M.; Wu, Y.; Liu, F. Microbial community mediated response of organic carbon mineralization to labile carbon and nitrogen addition in topsoil and subsoil. Biogeochemistry 2016, 128, 125–139. [Google Scholar] [CrossRef]
  39. Sorrenti, G.; Buriani, G.; Gaggìa, F.; Baffoni, L.; Spinelli, F.; Di Gioia, D.; Toselli, M. Soil CO2 emission partitioning, bacterial community profile and gene expression of Nitrosomonas spp. and Nitrobacter spp. of a sandy soil amended with biochar and compost. Appl. Soil Ecol. 2017, 112, 79–89. [Google Scholar] [CrossRef]
  40. Manopkawee, P.; Mankhemthong, N.; Pattarakamolsen, C. Tectonic and lithologic controls on the landscape adjustment along the eastern terrain of the Mae Tha fault, northern Thailand. Geologica Acta 2023, 21, 1–21. [Google Scholar] [CrossRef]
  41. Cao, H.-b.; Xie, J.-y.; Hong, J.; Wang, X.; Hu, W.; Hong, J.-p. Organic matter fractions within macroaggregates in response to long-term fertilization in calcareous soil after reclamation. J. Integr. Agric. 2021, 20, 1636–1648. [Google Scholar] [CrossRef]
  42. Rakthai, S.; Fu, P.-L.; Fan, Z.-X.; Gaire, N.P.; Pumijumnong, N.; Eiadthong, W.; Tangmitcharoen, S. Increased Drought Sensitivity Results in a Declining Tree Growth of Pinus latteri in Northeastern Thailand. Forests 2020, 11, 361. [Google Scholar] [CrossRef]
  43. Department, T.M. Monthly Weather Summary in Thailand, January 2024. Available online: https://www.tmd.go.th/en/climate/summarymonthly/012024 (accessed on 19 March 2025).
  44. Nelson, D.W.; Sommers, L.E. Total Carbon, Organic Carbon, and Organic Matter. In Methods of Soil Analysis; SSSA Book Series; Wiley: Hoboken, NJ, USA, 1996; pp. 961–1010. [Google Scholar]
  45. Walkley, A.; Black, I.A. An Examination of the Degtjareff Method for Determining Soil Organic Matter, and a Proposed Modification of the Chromic Acid Titration Method. Soil Sci. 1934, 37, 29–38. [Google Scholar] [CrossRef]
  46. Weil, R.; Stine, M.; Gruver, J.; Samson-Liebig, S. Estimating active carbon for soil quality assessment: A simplified method for laboratory and field use. Am. J. Altern. Agric. 2003, 18, 3–17. [Google Scholar] [CrossRef]
  47. Culman, S.; Snapp, S.; Schipanski, M.; Freeman, M.; Beniston, J.; Drinkwater, L.; Franzluebbers, A.; Glover, J.; Grandy, S.; Lal, R.; et al. Permanganate Oxidizable Carbon Reflects a Processed Soil Fraction that is Sensitive to Management. Soil Sci. Soc. Am. J. 2012, 76, 494–504. [Google Scholar] [CrossRef]
  48. Chan, K.; Bowman, A.; Oates, A. Oxidizible Organic Carbon Fractions and Soil Quality Changes in An Oxic Paleustalf Under Different Pasture Leys. Soil Sci. 2001, 166, 61–67. [Google Scholar] [CrossRef]
  49. Yeomans, J.C.; Bremner, J.M. A rapid and precise method for routine determination of organic carbon in soil. Commun. Soil Sci. Plant Anal. 1988, 19, 1467–1476. [Google Scholar] [CrossRef]
  50. Maia, S.M.F.; Xavier, F.A.S.; Oliveira, T.S.; Mendonça, E.S.; Araújo Filho, J.A. Organic carbon pools in a Luvisol under agroforestry and conventional farming systems in the semi-arid region of Ceará, Brazil. Agrofor. Syst. 2007, 71, 127–138. [Google Scholar] [CrossRef]
  51. Miller, A.P.; Arai, Y. Comparative Evaluation of Phosphate Spectrophotometric Methods in Soil Test Phosphorus Extracting Solutions. Soil Sci. Soc. Am. J. 2016, 80, 1543–1550. [Google Scholar] [CrossRef]
  52. Keeney, D.R.; Nelson, D.W. Nitrogen—Inorganic Forms. In Methods of Soil Analysis; Agronomy Monographs; Wiley: Hoboken, NJ, USA, 1982; pp. 643–698. [Google Scholar]
  53. Ohno, T.; Zibilske, L.M. Determination of Low Concentrations of Phosphorus in Soil Extracts Using Malachite Green. Soil Sci. Soc. Am. J. 1991, 55, 892–895. [Google Scholar] [CrossRef]
  54. Jackson, M.L. Soil Chemical Analysis; Prentice Hall, Inc.: Englewood Cliffs, NJ, USA, 1964. [Google Scholar]
  55. Bouyoucos, G.J. A Recalibration of the Hydrometer Method for Making Mechanical Analysis of Soils. Agron. J. 1951, 43, 434–438. [Google Scholar] [CrossRef]
  56. Bremner, J.M. Total Nitrogen. In Methods of Soil Analysis; Agronomy Monographs; Wiley: Hoboken, NJ, USA, 1965; pp. 1149–1178. [Google Scholar]
  57. Hoffman, W.M. AOAC Methods for the Determination of Phosphorus in Fertilizers. J. Assoc. Off. Agric. Chem. 1964, 47, 420–428. [Google Scholar] [CrossRef]
  58. Doane, T.A.; Horwáth, W.R. Spectrophotometric Determination of Nitrate with a Single Reagent. Anal. Lett. 2003, 36, 2713–2722. [Google Scholar] [CrossRef]
  59. Verdouw, H.; Van Echteld, C.J.A.; Dekkers, E.M.J. Ammonia determination based on indophenol formation with sodium salicylate. Water Res. 1978, 12, 399–402. [Google Scholar] [CrossRef]
  60. Walkley, A. A Critical Examination of a Rapid Method for Determining Organic Carbon in Soils: Effect of Variations in Digestion Conditions and of Inorganic Soil Constituents. Soil Sci. 1947, 63, 251–264. [Google Scholar] [CrossRef]
  61. Murphy, J.; Riley, J.P. A modified single solution method for the determination of phosphate in natural waters. Anal. Chim. Acta 1962, 27, 31–36. [Google Scholar] [CrossRef]
  62. Hines, A.R.; Gray, K.; Muir, J.P.; Bellows, B.; Rouquette, F.; Smith, W.B. PSIII-19 Soil nutrient profile from cool-season forages fertilized with manure from steers supplemented with titrated levels of dried distillers grains. J. Anim. Sci. 2021, 99, 340–341. [Google Scholar] [CrossRef]
  63. Zhang, Y.; Huang, G.; Yu, S.; Gu, X.; Cai, J.; Zhang, X. Physicochemical characterization and pyrolysis kinetic analysis of Moutai-flavored dried distiller’s grains towards its thermochemical conversion for potential applications. J. Anal. Appl. Pyrolysis 2021, 155, 105046. [Google Scholar] [CrossRef]
  64. Das, R.; Purakayastha, T.J.; Das, D.; Ahmed, N.; Kumar, R.; Biswas, S.; Walia, S.S.; Singh, R.; Shukla, V.K.; Yadava, M.S.; et al. Long-term fertilization and manuring with different organics alter stability of carbon in colloidal organo-mineral fraction in soils of varying clay mineralogy. Sci. Total Environ. 2019, 684, 682–693. [Google Scholar] [CrossRef]
  65. Diacono, M.; Montemurro, F. Long-term effects of organic amendments on soil fertility. A review. Agron. Sustain. Dev. 2010, 30, 401–422. [Google Scholar] [CrossRef]
  66. Escanhoela, A.S.B.; Pitombo, L.M.; Brandani, C.B.; Navarrete, A.A.; Bento, C.B.; do Carmo, J.B. Organic management increases soil nitrogen but not carbon content in a tropical citrus orchard with pronounced N2O emissions. J. Environ. Manag. 2019, 234, 326–335. [Google Scholar] [CrossRef] [PubMed]
  67. Liu, H.; Zhang, J.; Ai, Z.; Wu, Y.; Xu, H.; Li, Q.; Xue, S.; Liu, G. 16-Year fertilization changes the dynamics of soil oxidizable organic carbon fractions and the stability of soil organic carbon in soybean-corn agroecosystem. Agric. Ecosyst. Environ. 2018, 265, 320–330. [Google Scholar] [CrossRef]
  68. Zhang, Y.; Li, Y.; Liu, Y.; Huang, X.; Zhang, W.; Jiang, T. Responses of Soil Labile Organic Carbon and Carbon Management Index to Different Long-Term Fertilization Treatments in a Typical Yellow Soil Region. Eurasian Soil Sci. 2021, 54, 605–618. [Google Scholar] [CrossRef]
  69. Shi, L.H.; Li, C.; Tang, H.M.; Cheng, K.K.; Li, W.Y.; Wen, L.; Xiao, X.P. Effects of long-term fertilizer management on soil labile organic carbon fractions and hydrolytic enzyme activity under a double-cropping rice system of southern China. Ying Yong Sheng Tai Xue Bao 2021, 32, 921–930. [Google Scholar] [CrossRef]
  70. Bhattacharyya, R.; Kundu, S.; Srivastva, A.K.; Gupta, H.S.; Prakash, V.; Bhatt, J.C. Long term fertilization effects on soil organic carbon pools in a sandy loam soil of the Indian sub-Himalayas. Plant Soil 2011, 341, 109–124. [Google Scholar] [CrossRef]
  71. Karabcová, H.; Pospíšilová, L.; Mrak-Fiala, P.; Škarpa, P.; Bjelková, M. Effect of Organic Fertilizers on Soil Organic Carbon and Risk Trace Elements Content in Soil under Permanent Grassland. Soil Water Res. 2015, 10, 2015–2228. [Google Scholar] [CrossRef]
  72. Shi, J.; Song, M.; Yang, L.; Zhao, F.; Wu, J.; Li, J.; Yu, Z.; Li, A.; Shangguan, Z.; Deng, L. Recalcitrant organic carbon plays a key role in soil carbon sequestration along a long-term vegetation succession on the Loess Plateau. CATENA 2023, 233, 107528. [Google Scholar] [CrossRef]
  73. Guo, Z.; Han, J.; Li, J.; Xu, Y.; Wang, X. Effects of long-term fertilization on soil organic carbon mineralization and microbial community structure. PLoS ONE 2019, 14, e0211163. [Google Scholar] [CrossRef]
  74. Bongiorno, G.; Bünemann, E.K.; Oguejiofor, C.U.; Meier, J.; Gort, G.; Comans, R.; Mäder, P.; Brussaard, L.; de Goede, R. Sensitivity of labile carbon fractions to tillage and organic matter management and their potential as comprehensive soil quality indicators across pedoclimatic conditions in Europe. Ecol. Indic. 2019, 99, 38–50. [Google Scholar] [CrossRef]
  75. Rousk, J.; Hill, P.W.; Jones, D.L. Priming of the decomposition of ageing soil organic matter: Concentration dependence and microbial control. Funct. Ecol. 2015, 29, 285–296. [Google Scholar] [CrossRef]
  76. Zhou, J.; Wen, Y.; Shi, L.; Marshall, M.R.; Kuzyakov, Y.; Blagodatskaya, E.; Zang, H. Strong priming of soil organic matter induced by frequent input of labile carbon. Soil Biol. Biochem. 2021, 152, 108069. [Google Scholar] [CrossRef]
  77. Zhang, D.; Gong, C.; Zhang, W.; Zhang, H.; Zhang, J.; Song, C. Labile carbon addition alters soil organic carbon mineralization but not its temperature sensitivity in a freshwater marsh of Northeast China. Appl. Soil Ecol. 2021, 160, 103844. [Google Scholar] [CrossRef]
  78. Rousk, K.; Michelsen, A.; Rousk, J. Microbial control of soil organic matter mineralization responses to labile carbon in subarctic climate change treatments. Glob. Change Biol. 2016, 22, 4150–4161. [Google Scholar] [CrossRef]
  79. Wu, H.; Cai, A.; Xing, T.; Huai, S.; Zhu, P.; Xu, M.; Lu, C. Fertilization enhances mineralization of soil carbon and nitrogen pools by regulating the bacterial community and biomass. J. Soils Sediments 2021, 21, 1633–1643. [Google Scholar] [CrossRef]
  80. Liu, G.; Xie, M.; Zhang, S. Effect of organic fraction of municipal solid waste (OFMSW)-based biochar on organic carbon mineralization in a dry land soil. J. Mater. Cycles Waste Manag. 2017, 19, 473–482. [Google Scholar] [CrossRef]
  81. Xiao, L.; Zhang, W.; Hu, P.; Xiao, D.; Yang, R.; Ye, Y.; Wang, K. The formation of large macroaggregates induces soil organic carbon sequestration in short-term cropland restoration in a typical karst area. Sci. Total Environ. 2021, 801, 149588. [Google Scholar] [CrossRef]
  82. Mikhael, J.; Ferraz-Almeida, R.; Franco, F.; Camargo, R.; Wendling, B. Recalcitrant carbon and nitrogen in agriculture soils with residue accumulation and fertilization under tropical conditions. Biosci. J. 2019, 35, 732–740. [Google Scholar] [CrossRef]
  83. Ye, G.; Lin, Y.; Liu, D.; Chen, Z.; Luo, J.; Bolan, N.; Fan, J.; Ding, W. Long-term application of manure over plant residues mitigates acidification, builds soil organic carbon and shifts prokaryotic diversity in acidic Ultisols. Appl. Soil Ecol. 2019, 133, 24–33. [Google Scholar] [CrossRef]
  84. Ye, G.; Lin, Y.; Kuzyakov, Y.; Liu, D.; Luo, J.; Lindsey, S.; Wang, W.; Fan, J.; Ding, W. Manure over crop residues increases soil organic matter but decreases microbial necromass relative contribution in upland Ultisols: Results of a 27-year field experiment. Soil Biol. Biochem. 2019, 134, 15–24. [Google Scholar] [CrossRef]
  85. Huang, J.; Rinnan, Å.; Bruun, T.B.; Engedal, T.; Bruun, S. Identifying the fingerprint of permanganate oxidizable carbon as a measure of labile soil organic carbon using Fourier transform mid-infrared photoacoustic spectroscopy. Eur. J. Soil Sci. 2021, 72, 1831–1841. [Google Scholar] [CrossRef]
  86. Thapa, B.; Mowrer, J. Soil carbon and aggregate stability are positively related and increased under combined soil amendment, tillage, and cover cropping practices. Soil Sci. Soc. Am. J. 2024, 88, 730–744. [Google Scholar] [CrossRef]
  87. Dou, X.; He, P.; Cheng, X.; Zhou, W. Long-term fertilization alters chemically-separated soil organic carbon pools: Based on stable C isotope analyses. Sci. Rep. 2016, 6, 19061. [Google Scholar] [CrossRef]
  88. Yu, H.; Ding, W.; Chen, Z.; Zhang, H.; Luo, J.; Bolan, N. Accumulation of organic C components in soil and aggregates. Sci. Rep. 2015, 5, 13804. [Google Scholar] [CrossRef]
  89. Quan, Z.; Huang, B.; Lu, C.; Shi, Y.; Chen, X.; Zhang, H.; Fang, Y. The fate of fertilizer nitrogen in a high nitrate accumulated agricultural soil. Sci. Rep. 2016, 6, 21539. [Google Scholar] [CrossRef]
  90. Mousavi, H.; Cottis, T.; Solberg, S.Ø. Nitrogen Enriched Organic fertilizer (NEO) elevates nitrification rates shortly after application but has no lasting effect on nitrification in agricultural soils. Agric. Food Sci. 2023, 32, 179–194. [Google Scholar] [CrossRef]
  91. Liu, X.; Chen, D.; Yang, T.; Huang, F.; Fu, S.; Li, L. Changes in soil labile and recalcitrant carbon pools after land-use change in a semi-arid agro-pastoral ecotone in Central Asia. Ecol. Indic. 2020, 110, 105925. [Google Scholar] [CrossRef]
  92. Zang, H.; Mehmood, I.; Kuzyakov, Y.; Jia, R.; Gui, H.; Blagodatskaya, E.; Xu, X.; Smith, P.; Chen, H.; Zeng, Z.; et al. Not all soil carbon is created equal: Labile and stable pools under nitrogen input. Glob. Change Biol. 2024, 30, e17405. [Google Scholar] [CrossRef]
  93. Deng, Y.Q.; Xu, Z.; Zhang, Y.; Wang, Y.Y. Responses of soil microbial biomass nitrogen to organic fertilizer with different degrees of maturity and regulation to soil mineral nitrogen. Ying Yong Sheng Tai Xue Bao 2023, 34, 137–144. [Google Scholar] [CrossRef]
  94. Ma, H.; Yin, Y.; Gao, R.; Taqi, R.; He, X. Response of nitrogen transformation to glucose additions in soils at two subtropical forest types subjected to simulated nitrogen deposition. J. Soils Sediments 2019, 19, 2166–2175. [Google Scholar] [CrossRef]
  95. Strauss, E.A.; Lamberti, G.A. Regulation of nitrification in aquatic sediments by organic carbon. Limnol. Oceanogr. 2000, 45, 1854–1859. [Google Scholar] [CrossRef]
  96. Fanin, N.; Alavoine, G.; Bertrand, I. Temporal dynamics of litter quality, soil properties and microbial strategies as main drivers of the priming effect. Geoderma 2020, 377, 114576. [Google Scholar] [CrossRef]
  97. Jegajeevagan, K.; Sleutel, S.; Ameloot, N.; Kader, M.A.; De Neve, S. Organic matter fractions and N mineralization in vegetable-cropped sandy soils. Soil Use Manag. 2013, 29, 333–343. [Google Scholar] [CrossRef]
  98. Zhang, L.; Chen, M.; Chen, X.; Wang, J.; Zhang, Y.; Xiao, X.; Hu, C.; Liu, J.; Zhang, R.; Xu, D.; et al. Nitrifiers drive successions of particulate organic matter and microbial community composition in a starved macrocosm. Environ. Int. 2021, 157, 106776. [Google Scholar] [CrossRef] [PubMed]
  99. Zhang, H.-Q.; Qin, Y.; Li, Z.-Z.; Song, Z.-Z. Mixed application of biochar, maize straw, and nitrogen can improve organic carbon fractions and available nutrients of a sandy soil. Arid Land Res. Manag. 2023, 37, 115–133. [Google Scholar] [CrossRef]
  100. Zhang, K.; Shi, Y.; Cui, X.; Yue, P.; Li, K.; Liu, X.; Tripathi Binu, M.; Chu, H. Salinity Is a Key Determinant for Soil Microbial Communities in a Desert Ecosystem. mSystems 2019, 4, e00225-18. [Google Scholar] [CrossRef]
  101. Aumtong, S.; Foungyen, P.; Kanchai, K.; Chuephudee, T.; Chotamonsak, C.; Lapyai, D. Impact of Reduced Nitrogen Inputs on Soil Organic Carbon and Nutrient Dynamics in Arable Soil, Northern Thailand: Short-Term Evaluation. Agronomy 2024, 14, 2587. [Google Scholar] [CrossRef]
  102. Mehnaz, K.R.; Corneo, P.E.; Keitel, C.; Dijkstra, F.A. Carbon and phosphorus addition effects on microbial carbon use efficiency, soil organic matter priming, gross nitrogen mineralization and nitrous oxide emission from soil. Soil Biol. Biochem. 2019, 134, 175–186. [Google Scholar] [CrossRef]
  103. Cheng, Y.; Elrys, A.S.; Merwad, A.-R.M.; Zhang, H.; Chen, Z.; Zhang, J.; Cai, Z.; Müller, C. Global Patterns and Drivers of Soil Dissimilatory Nitrate Reduction to Ammonium. Environ. Sci. Technol. 2022, 56, 3791–3800. [Google Scholar] [CrossRef] [PubMed]
  104. Zhu, W.; Zhao, H.; Wang, Y.; Butterly, C.R.; Chen, H.; Yuan, J.; Liu, M.; Chen, Q.; Zhang, L.; Wang, L. Optimal organic fertilization enhances the phytoavailability of phosphorus in the root zone of rice. Eur. J. Soil Sci. 2024, 75, e13588. [Google Scholar] [CrossRef]
  105. Mengmeng, C.; Shirong, Z.; Lipeng, W.; Chao, F.; Xiaodong, D. Organic Fertilization Improves the Availability and Adsorptive Capacity of Phosphorus in Saline-Alkaline Soils. J. Soil Sci. Plant Nutr. 2021, 21, 487–496. [Google Scholar] [CrossRef]
  106. Khan, K.; Ali, M.M.; Naveed, M.; Rehmani, M.I.A.; Shafique, M.; Ali, H.; Abdelsalam, N.; Ghareeb, Y.; Feng, G. Co-application of organic amendments and inorganic P increase maize growth and soil carbon, phosphorus availability in calcareous soil. Front. Environ. Sci. 2022, 10, 949371. [Google Scholar] [CrossRef]
  107. Guera, K.C.S.; da Fonseca, A.F. Phosphorus fractions and their relationships with soil chemical attributes in an integrated crop-livestock system under annual phosphates fertilization. Front. Sustain. Food Syst. 2022, 6, 1–22. [Google Scholar] [CrossRef]
  108. Vermeiren, C.; Kerckhof, P.; Reheul, D.; Smolders, E. Increasing soil organic carbon content can enhance the long-term availability of phosphorus in agricultural soils. Eur. J. Soil Sci. 2022, 73, e13191. [Google Scholar] [CrossRef]
  109. Shu, X.; Liu, W.; Huang, H.; Ye, Q.; Zhu, S.; Peng, Z.; Li, Y.; Deng, L.; Yang, Z.; Chen, H.; et al. Meta-Analysis of Organic Fertilization Effects on Soil Bacterial Diversity and Community Composition in Agroecosystems. Plants 2023, 12, 3801. [Google Scholar] [CrossRef] [PubMed]
  110. Wang, C.; Kuzyakov, Y. Soil organic matter priming: The pH effects. Glob. Change Biol. 2024, 30, e17349. [Google Scholar] [CrossRef]
  111. Dai, H.; Chen, Y.; Yang, X.; Cui, J.; Sui, P. The effect of different organic materials amendment on soil bacteria communities in barren sandy loam soil. Environ. Sci. Pollut. Res. 2017, 24, 24019–24028. [Google Scholar] [CrossRef] [PubMed]
  112. Jia, S.; Yuan, D.; Li, W.; He, W.; Raza, S.; Kuzyakov, Y.; Zamanian, K.; Zhao, X. Soil Chemical Properties Depending on Fertilization and Management in China: A Meta-Analysis. Agronomy 2022, 12, 2501. [Google Scholar] [CrossRef]
  113. Jiang, X.-D.; Zheng, S.-R.; Yang, M.-M.; Wan, J.-M.; Huang, Y.; Yu, K.; Tong, X.-G. Stability characteristics of soil organic carbon pool following development of sand-fixing forest in Mu Us sandy land, China. Chin. J. Appl. Ecol. 2019, 30, 2567–2574. [Google Scholar] [CrossRef]
  114. Sosulski, T.; Srivastava, A.K.; Ahrends, H.E.; Smreczak, B.; Szymańska, M. Carbon Storage Potential and Carbon Dioxide Emissions from Mineral-Fertilized and Manured Soil. Appl. Sci. 2023, 13, 4620. [Google Scholar] [CrossRef]
  115. Gross, A.; Glaser, B. Meta-analysis on how manure application changes soil organic carbon storage. Sci. Rep. 2021, 11, 5516. [Google Scholar] [CrossRef]
Figure 1. A map of the study site depicting soil sample locations in northeast Thailand. Note: The yellow circle represented the study area and the blue areas are other areas of Thailand that were not included in this study. The brown area is the northeastern region of Thailand.
Agronomy 15 01069 g001
Figure 2. Effects of organic fertilizer on the soil organic carbon (SOC) across various land-use ages (LUAs). Note: The same red lower letters on the individual LUA boxes were not significantly different. Dot connections are indicated by gray lines; the lines within and across each LUA represent the median values, and the lines above and below each box represent the largest and smallest sample values, respectively.
Agronomy 15 01069 g002
Figure 3. Effects of organic fertilizer on the labile organic carbon as water-soluble carbon (WSC) (A) and permanganate-oxidized organic carbon (POXC) (B) across various land-use ages (LUAs). Note: The same red lower letters on the individual LUA boxes were not significantly different. Dot connections are indicated using gray lines; the lines within and across each LUA represent the median values, and the lines above and below each box represent the largest and smallest sample values, respectively.
Agronomy 15 01069 g003
Figure 4. Effects of organic fertilizer on the labile organic carbon (LBC) (A) and less labile organic carbon (LLBC) (B) across various land-use ages (LUAs). Note: The same red lower letters on the individual LUA boxes were not significantly different. Dot connections are indicated using gray lines; the lines within and across each LUA represent the median values, and the lines above and below each box represent the largest and smallest sample values, respectively.
Agronomy 15 01069 g004
Figure 5. Effects of organic fertilizer on non-labile carbon (NLBC) (A) and recalcitrant carbon (REC) (B) across various land-use ages (LUAs). Note: The same red lower letters on the individual LUA boxes were not significantly different. Dot connections are indicated using gray lines; the lines within and across each LUA represent the median values, and the lines above and below each box represent the largest and smallest sample values, respectively.
Agronomy 15 01069 g005
Figure 6. Effects of organic fertilizer with different land-use ages on the four measured parameters of the soil properties according to NH4+-N (A) and NO3-N (B). Note: The same red lower letters on the individual LUA boxes were not significantly different. Dot connections are indicated using gray lines; the lines within and across each LUA represent the median values, and the lines above and below each box represent the largest and smallest sample values, respectively. The NS indicated that there was no statistical significance.
Agronomy 15 01069 g006
Figure 7. Effects of organic fertilizer with different land-use ages on three measured parameters of the soil properties: Bray-extractable phosphorus (P(B)) (A), malachite-extractable phosphorus (P(M)) (B), and soil pH (C). Note: The same red lower letters on the individual LUA boxes were not significantly different. Dot connections are indicated using gray lines; the lines within and across each LUA represent the median values, and the lines above and below each box represent the largest and smallest sample values, respectively. The NS indicated that there was no statistical significance.
Agronomy 15 01069 g007
Figure 8. The Pearson’s r heatmap diagram illustrates the relationships between various forms of carbon in the soil and soil organic carbon (SOC) and the relationship between the labile carbon fraction (LBC) and NH4+ and NO3 in the soil in sandy soil treated with organic fertilizer. Note: blue and brown boxes represent the positive and negative correlations, respectively; numbers in boxes represent Pearson’s coefficients numbers, and are shown with * p < 0.05, ** p< 0.01, and *** p < 0.001.
Agronomy 15 01069 g008
Figure 9. A Pearson’s rho heatmap illustrating the relationships between carbon fractions (i.e., LBC, LLBC and NLBC), available P, and pH. Note: P (B) was determined using the Bray II method, and P (M) was determined using the malachite method. * p < 0.05, ** p < 0.01, and *** p < 0.001; blue—positive correlation; brown—negative with the Pearson correlation coefficients values.
Agronomy 15 01069 g009
Figure 10. This figure highlights the intricate interactions and effects of carbon fractions in sandy soil affected by mixing organic fertilizers for five years in sandy soil.
Agronomy 15 01069 g010
Table 1. Information on the combinations used in organic fertilizer management.
Land-Use Age (Year)Information on the Combinations Used in Organic Fertilizer Management
LUA5These soils only received DDGs, varying, on average, 811, 681, 594, 4420, and 4351 kg ha−1 year−1 from 2018 to 2022.
LUA4These soils received an average combination of cow manure, chicken manure, and DDGs (i.e., 1389, 3125, and 4410 kg ha−1 year−1, respectively) from 2019 to 2022.
LUA3These soils received an average combination of chicken manure and DDGs (i.e., 2500 and 625–833 kg ha−1 year−1, respectively) from 2020 to 2022.
LUA2These soils received an average combination of cow manure, chicken manure, and DDGs (i.e., 13,021, 2600, and 572 kg ha−1 year−1, respectively) from 2021 to 2022.
LUA1These soils received an average combination of chicken manure and DDGs (i.e., 888 and 636 kg ha−1 year−1, respectively) in 2022.
LUA0The soil and land underwent pre-organic fertilization and entered a period of transition.
Table 2. The nutrient content and chemical properties of organic fertilizers made of chicken and cow manure, and dried distilled gains (DDGs).
IndicatorAmendments.Number of SamplesMedianMeanF-Valuep-ValueStd. DeviationMinimumMaximum
pHChicken107.257.14 a4.390.0370.426.497.63
pHCow27.917.91 ab 0.097.847.98
pHDDF38.58.11 b 1.016.978.87
C (%)Chicken1030.5029.80 b40.20<0.0014.8019.0036.00
C (%)Cow210.5010.50 a 7.775.0016.00
C (%)DDF34.394.35 a 0.863.485.20
N (%)Chicken103.383.49 b17.17<0.0011.121.735.10
N (%)Cow20.360.37 a 0.050.340.41
N (%)DDF30.310.37 a 0.120.300.51
C/N ratioChicken108.859.05 a10.820.0021.896.511.5
C/N ratioCow227.9027.90 b 16.9715.939.9
C/N ratioDDF311.6011.98 a 2.0110.1914.16
P (%)Chicken101.211.22 b70.02<0.0010.180.971.56
P (%)Cow20.1050.11 a 0.040.080.13
P (%)DDF30.160.20 a 0.080.150.3
K (%)Chicken103.713.82 ns3.820.0521.432.226.98
K (%)Cow20.390.39 ns 0.230.230.55
K (%)DDF30.582.13 ns 2.930.305.50
Note: The same lower letters in the mean of individual organic amendments were not significantly different with various p values. The ns indicated that there was no statistical significance.
Table 3. The nutrient concentration and chemical properties of chicken manure, cow manure, and dried distilled grains (DDG) via water extraction.
IndicatorOrganic AmendmentsNumber of
Sample
MeanF-Valuep-ValueSDSEMinimumMaximum
soluble C (mg kg−1)Chicken4613.13 b12,134.89<0.0019.444.72600.00622.50
Cow416.88 a 3.751.8815.0022.50
DDG416.88 a 3.751.8815.0022.50
H2PO4 (mg kg−1)Chicken450.04 c12,425.43<0.0010.740.3749.1850.97
Cow47.69 b 0.200.107.457.93
DDG45.38 a 0.160.085.185.56
NH4+ (mg kg−1)Chicken425.93 a29.51<0.0017.753.8716.3035.20
Cow461.25 b 10.005.0048.6071.00
DDG425.83 a 3.101.5521.4028.50
NO3 (mg kg−1)Chicken4338.10 ns0.840.46119.039.52321.29364.87
Cow4351.18 ns 9.274.63338.72361.14
DDG4338.10 ns 19.039.52321.29364.87
pHChicken47.06 ns0.680.5280.020.017.037.08
Cow47.16 ns 0.230.117.037.50
DDG47.08 ns 0.030.017.057.11
Note: The same lower letters in the mean of individual organic amendments were not significantly different with various p values. SE and SD were represented as standard errors and standard deviations, respectively. The ns indicated that there was no statistical significance.
Table 4. The distribution of sand, silt, and clay particles measured in grams per kilogram (g kg−1) across different land-use ages.
Particle Size
(g kg−1)
LUAValidMeanF-Valuep-ValueStd. ErrorStd. DeviationMinimumMaximum
Sand0108821.6 a6.576<0.0016.163.4661.6921.6
Sand1192836.7 ab 5.372.9661.6961.6
Sand2135817.9 a 5.563.6681.6921.6
Sand3197845.9 b 3.955.4681.6981.6
Sand483858.7 b 5.954.1741.6961.6
Sand538845.4 ab 10.464.2721.6941.6
Silt010898.9 abF = 3.690 p = 0.0035.455.85.6245.6
Silt119297.7 a 4.257.725.6245.6
Silt2135105.3 b 4.450.825.6225.6
Silt319790.0 ab 3.345.95.6205.6
Silt48378.4 a 6.055.05.6205.6
Silt53881.9 ab 8.351.325.6185.6
Clay010879.5 bF = 3.422 p = 0.0044.546.912.8172.8
Clay119265.6 ab 3.244.012.8192.8
Clay213576.8 ab 3.540.712.8152.8
Clay319764.2 a 2.838.912.8132.8
Clay48362.9 a 3.632.812.8132.8
Clay53872.8 ab 6.741.112.8132.8
Note: The same lower letters on the individual organic amendment were not significantly different with various p values.
Disclaimer/Publisher’s Note: The statements, opinions and data contained in all publications are solely those of the individual author(s) and contributor(s) and not of MDPI and/or the editor(s). MDPI and/or the editor(s) disclaim responsibility for any injury to people or property resulting from any ideas, methods, instructions or products referred to in the content.

