Article

Transcriptomic Regulatory Mechanisms of Isoflavone Biosynthesis in Trifolium pratense

1
College of Grassland Science/Key Laboratory of Grassland Resources of Ministry of Education, Inner Mongolia Agricultural University, Hohhot 010018, China
2
Yinshanbeilu Grassland Eco-Hydrology National Observation and Research Station, China Institute of Water Resources and Hydropower Research, Beijing 100038, China
3
Institute of Grassland Research, Chinese Academy of Agricultural Science, 120 Wulanchabu East Street, Saihan District, Hohhot 010010, China
*
Authors to whom correspondence should be addressed.
Agronomy 2025, 15(5), 1061; https://doi.org/10.3390/agronomy15051061
Submission received: 17 March 2025 / Revised: 18 April 2025 / Accepted: 25 April 2025 / Published: 27 April 2025
(This article belongs to the Section Plant-Crop Biology and Biochemistry)

Abstract

:
Isoflavones are important secondary metabolites in leguminous plants with significant physiological functions and economic value. However, the genetic variation, transcriptional regulation, and metabolic pathways governing isoflavone biosynthesis in Trifolium pratense remain largely unexplored. In this study, we systematically analyzed 500 accessions of T. pratense for isoflavone content and performed RNA-seq-based transcriptomic profiling to investigate the molecular mechanisms underlying isoflavone biosynthesis. Cluster analysis revealed significant genetic variation, with distinct transcriptional profiles between high- (H1, H2, H3) and low-isoflavone (L1, L2, L3) groups. GO and KEGG pathway enrichment analyses identified key metabolic pathways, including phenylpropanoid metabolism, flavonoid biosynthesis, carbohydrate metabolism, and hormone signaling, which play crucial roles in isoflavone regulation. Weighted gene co-expression network analysis (WGCNA) identified three key gene modules—MEblue, MEturquoise, and MEyellow—strongly correlated with isoflavone content. The MEturquoise and MEyellow modules were upregulated in high-isoflavone groups and were enriched in phenylpropanoid biosynthesis, lipid metabolism, and transcriptional regulation, suggesting that these pathways actively promote isoflavone accumulation. Conversely, the MEblue module, highly expressed in low-isoflavone groups, was enriched in sugar metabolism and MAPK signaling, indicating a potential metabolic flux shift away from secondary metabolism. Moreover, key rate-limiting enzymes (PAL, C4H, 4CL, CHS, and IFS) exhibited higher expression in high-isoflavone groups, highlighting their importance in precursor supply and enzymatic catalysis. Additionally, transcription factors such as MYB, WRKY, and NAC were identified as potential regulators of isoflavone biosynthesis, indicating a complex interplay between hormonal, circadian, and environmental signals. This study provides a comprehensive molecular framework for understanding isoflavone biosynthesis in T. pratense and identifies key regulatory genes and metabolic pathways that could be targeted for genetic improvement, metabolic engineering, and molecular breeding. The findings offer valuable insights into enhancing isoflavone production in legumes for agricultural, nutritional, and pharmaceutical applications.

1. Introduction

Isoflavones represent an important class of plant secondary metabolites widely distributed in leguminous species, and exhibit a wide range of biological functions, including antioxidant, anti-inflammatory, antibacterial, and estrogen-like effects [1,2]. In agricultural production, isoflavones not only enhance plant stress resistance but also improve tolerance to pathogens, ultraviolet radiation, and environmental stresses [3]. Moreover, isoflavones have been extensively utilized in human and animal health sectors, contributing to the prevention of osteoporosis, maintenance of endocrine balance, and reduction in cardiovascular disease risk [4,5]. Therefore, an in-depth investigation into the biosynthesis and regulatory mechanisms of isoflavones holds significant value for agricultural sciences, food technology, and pharmaceutical research.
Red clover (Trifolium pratense), a perennial leguminous forage crop, has gained increasing attention due to its high natural isoflavone content, particularly genistein, daidzein, formononetin, and biochanin A [6,7]. These compounds not only contribute to its nutritional and medicinal value but also enhance its functional properties as a livestock feed, particularly in ruminants [8,9,10]. T. pratense has also been extensively used in herbal medicine and functional foods for managing menopausal symptoms and hormone-related disorders [11,12]. Compared with model legume species such as Medicago truncatula or Glycine max, red clover possesses unique advantages as a naturally high-isoflavone species; however, the molecular basis underlying its isoflavone accumulation remains largely unexplored.
Recent studies have revealed considerable variation in isoflavone accumulation across different T. pratense accessions, indicating strong genetic diversity [13,14]. Nevertheless, there is currently a lack of comprehensive understanding of the transcriptional regulation and biosynthetic pathways of isoflavones in T. pratense While previous studies have identified core enzymes in the general phenylpropanoid and flavonoid biosynthesis pathways, such as phenylalanine ammonia-lyase (PAL), cinnamate 4-hydroxylase (C4H), 4-coumarate-CoA ligase (4CL), chalcone synthase (CHS), and isoflavone synthase (IFS), their differential expression patterns in high- and low-isoflavone accessions of T. pratense have not been systematically investigated [15,16]. Moreover, methyltransferases (IOMT) and oxidative enzymes such as isoflavone dehydratase (HIDH) further modify and stabilize isoflavones, enhancing their biological activity [17].
The advent of high-throughput sequencing technologies, particularly RNA sequencing (RNA-seq), has enabled genome-wide transcriptomic profiling and identification of key genes involved in specialized metabolic pathways under different developmental stages or stress conditions. Meanwhile, weighted gene co-expression network analysis (WGCNA) offers a systems-level approach to identify gene modules and hub genes that are highly correlated with specific traits. This approach has been successfully applied to study the regulation of isoflavone biosynthesis in Glycine max [2], Medicago sativa [18], and other legumes, but its application in red clover is still lacking.
Therefore, this study aims to explore the molecular regulation of isoflavone biosynthesis in T. pratense by integrating RNA-seq and WGCNA to identify differentially expressed genes and co-expression modules associated with high and low isoflavone accumulation. The results will provide new insights into the genetic basis of secondary metabolism in red clover and offer valuable targets for future molecular breeding and metabolic engineering to improve its forage quality and nutraceutical value.

2. Materials and Methods

2.1. Plant Materials and Experimental Design

In this study, a total of 500 red clover germplasm resources were cultivated under controlled greenhouse conditions to minimize environmental influences on isoflavone accumulation. These accessions were primarily collected from natural populations across northern and western China, encompassing diverse ecological habitats. All collected materials were authenticated and propagated prior to experimentation to ensure genetic integrity and comparability. The greenhouse environment was maintained at 25 °C with a relative humidity of 70% and a 16 h/8 h light/dark photoperiod. Standard irrigation and nutrient supply protocols were followed throughout the experiment. The growth cycle of red clover was categorized into three stages: vegetative growth stage, flowering stage, and seed-maturation stage. To investigate the transcriptional differences in high- and low-isoflavone-accumulating groups across different growth stages, isoflavone content was first measured in all 500 accessions during the vegetative growth stage (H1/L1). Based on these results, plants with the highest and lowest isoflavone levels were selected as the high-isoflavone group (H) and low-isoflavone group (L), respectively. Each selected group consisted of three biological replicates. The selected plants were then cultivated until the flowering (H2/L2) and seed-maturation (H3/L3) stages, during which samples were collected to analyze the dynamic changes in isoflavone biosynthesis and its molecular regulatory mechanisms.

2.2. Isoflavone Content Measurement and Sample Grouping

Isoflavone content was quantified during the vegetative growth stage (H1/L1) to select representative high- and low-isoflavone genotypes for further analysis. High-performance liquid chromatography (HPLC) was employed for isoflavone quantification following a standardized protocol. Specifically, 0.1 g of dried leaf powder was extracted with 80% methanol solution under ultrasonic conditions for 30 min, followed by centrifugation at 12,000× g for 10 min. The supernatant was collected for HPLC detection under the following chromatographic conditions: a C18 reversed-phase column (4.6 × 250 mm, 5 μm) was used, with mobile phase A consisting of 0.1% formic acid aqueous solution and mobile phase B consisting of methanol, using a gradient elution method. The detection wavelength was set at 260 nm, column temperature at 30 °C, and flow rate at 1.0 mL·min−1. The total isoflavone content (mg·g−1) was calculated based on the chromatographic results. K-means clustering analysis was performed on all 500 samples with K = 6, determined based on the elbow method and silhouette score to balance inter-cluster distance and intra-cluster compactness.
The selected high- and low-isoflavone plants were further cultivated until the flowering (H2/L2) and seed-maturation (H3/L3) stages, during which leaf samples were collected at each growth stage. The final sample groups included high-isoflavone samples (H1: vegetative stage, H2: flowering stage, H3: seed-maturation stage) and low-isoflavone samples (L1: vegetative stage, L2: flowering stage, L3: seed-maturation stage). All samples were collected simultaneously, and young leaves were immediately frozen in liquid nitrogen and stored at −80 °C for subsequent analysis.

2.3. RNA Extraction and Transcriptome Sequencing (RNA-Seq)

To analyze the gene expression patterns associated with isoflavone biosynthesis at different growth stages, total RNA was extracted from leaf samples of H1, H2, H3 (high-isoflavone group) and L1, L2, L3 (low-isoflavone group) using Trizol reagent (Invitrogen, Waltham, MA, USA). The RNA purity was assessed using Nanodrop 2000 (Thermo Scientific, Waltham, MA, USA) (OD260/280 ratio between 1.8 and 2.0), while RNA integrity was evaluated using an Agilent 2100 Bioanalyzer (Agilent Technologies, Santa Clara, CA, USA) (RNA Integrity Number, RIN > 7.0). RNA samples that met quality standards were used for library construction and subsequently subjected to paired-end sequencing (PE150) on an Illumina NovaSeq 6000 platform.
The raw sequencing data underwent quality control using Trimmomatic (version 0.39), where adapter sequences and low-quality reads were removed. The cleaned reads were then mapped to the red clover reference genome using HISAT2. The average mapping rate across samples was 85.7%, and the mean genome coverage exceeded 88%, indicating high-quality sequencing results. Gene expression levels were quantified using the Fragments Per Kilobase per Million (FPKM) method, and differentially expressed genes (DEGs) were identified based on the following criteria: |log2Fold Change| ≥ 1, false discovery rate (FDR) < 0.05, using DESeq2 for statistical analysis.

2.4. Weighted Gene Co-Expression Network Analysis (WGCNA)

To identify gene modules closely related to isoflavone biosynthesis, Weighted Gene Co-expression Network Analysis (WGCNA) was performed. Genes with an FPKM > 1 were selected to construct the expression matrix. A soft threshold power (β value) was chosen based on scale-free topology criteria to compute the weighted correlation between genes. The Dynamic Tree Cut algorithm was employed to detect co-expression modules, followed by the calculation of module eigengenes (MEs) to assess their correlation with isoflavone content.

2.5. Functional Enrichment Analysis of Differentially Expressed Genes (DEGs)

GO functional annotation and KEGG pathway enrichment analysis were conducted to explore the biological functions and metabolic pathways of the identified DEGs. GO analysis covered three major categories: cellular component (CC), molecular function (MF), and biological process (BP), with gene annotation performed using Blast2GO. Fisher’s Exact Test was applied to assess enrichment significance (p < 0.05). KEGG pathway enrichment analysis was conducted using KOBAS 3.0, with a particular focus on pathways related to isoflavone biosynthesis (ko00943) and phenylpropanoid metabolism (ko00940).

2.6. qRT-PCR Validation of Differentially Expressed Genes

To validate the reliability of RNA-seq data, 15 differentially expressed genes (DEGs) were randomly selected for quantitative real-time PCR (qRT-PCR) analysis (Table 1). Gene selection was based on a combination of high log2Fold Change and high module membership (kME) values from WGCNA, prioritizing hub genes within modules significantly correlated with isoflavone content. cDNA synthesis was performed using HiScript II Q RT SuperMix (Vazyme, Nanjing, China), and qRT-PCR reactions were conducted using ChamQ SYBR qPCR Master Mix (Vazyme, China) on an ABI QuantStudio 6 Flex system. Gene expression levels were calculated using the 2−ΔΔCt method, with RCD1 (RADICAL-INDUCED CELL DEATH1) serving as the internal reference gene. RCD1 was selected based on its stable and consistent expression across all developmental stages and treatment groups, as verified by transcriptome data. Primers for all selected genes were designed using Primer3Plus and verified for specificity before the experiments. Each sample was analyzed in three biological replicates, and statistical significance of expression differences was determined using one-way ANOVA (GraphPad Prism 9.0) [19].

3. Results

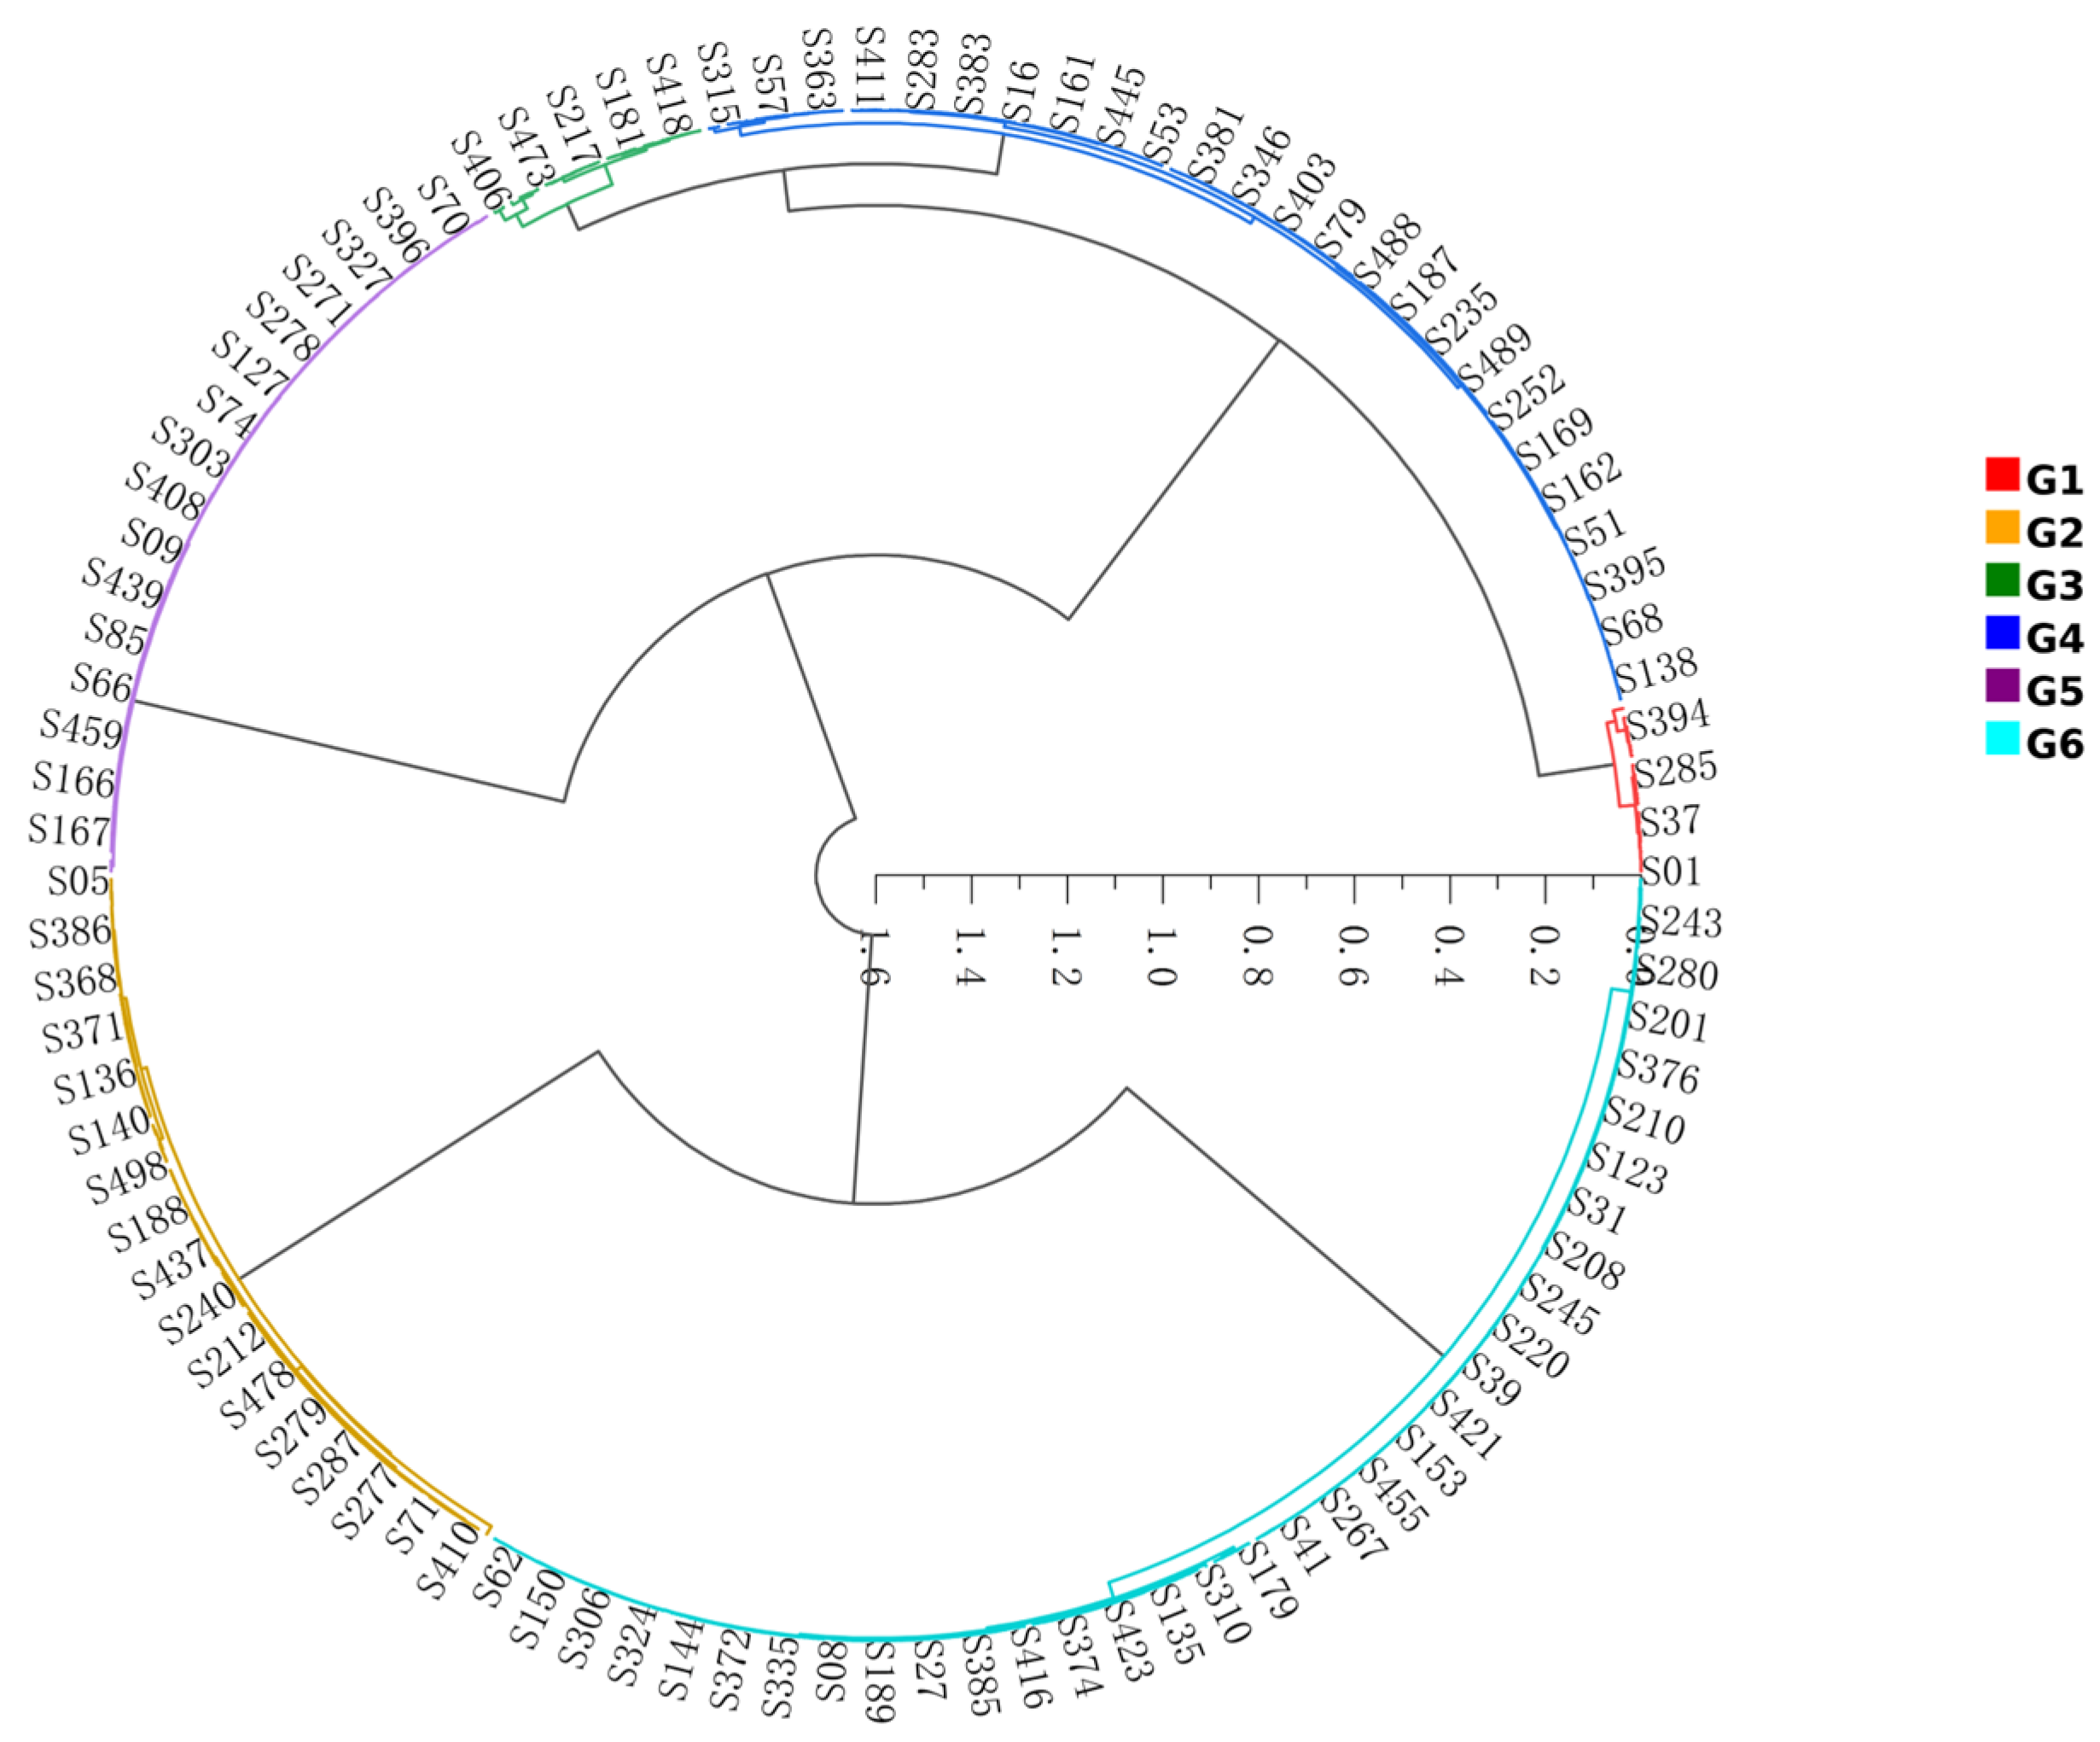
3.1. Clustering Analysis and Selection of Red Clover Isoflavone Accumulation Groups

To investigate the variation in isoflavone accumulation among different germplasm resources, the isoflavone content of 500 red clover accessions was quantified and subjected to hierarchical clustering analysis (Figure 1). The clustering results classified these accessions into six distinct groups (G1, G2, G3, G4, G5, G6), among which G1, G2, and G3 were identified as high-isoflavone groups, while G4, G5, and G6 were classified as low-isoflavone groups. Phylogenetic tree analysis further revealed a clear differentiation between high- and low-isoflavone groups, with H1 and H6 positioned at opposite ends of the clustering tree, indicating the most pronounced differences in isoflavone content between these two groups.
Further statistical analysis demonstrated that the G1 group exhibited the highest isoflavone content, ranging from 29.99 to 36.33 mg·g−1, with an average content of 33.16 mg·g−1, which was significantly higher than that of other groups. The G2 and G3 groups displayed slightly lower isoflavone contents, measuring 28.18 mg·g−1 and 25.76 mg·g−1, respectively, but remained substantially above the overall mean (25.21 mg·g−1). In contrast, the G4, G5, and G6 groups exhibited markedly lower isoflavone levels, particularly in G6, where the isoflavone content ranged from 21.94 to 23.46 mg·g−1, with an average of 22.70 mg·g−1, representing a 31.5% decrease compared to G1 (Table 2).
These findings indicate substantial genetic variation in isoflavone accumulation among red clover germplasms, suggesting that different groups may possess distinct metabolic regulation mechanisms governing isoflavone biosynthesis. Based on this classification, we selected G1 (high-isoflavone group) and G6 (low-isoflavone group) as representative samples for further investigation. To analyze transcriptional regulation underlying isoflavone biosynthesis, we collected samples from these groups at three different growth stages—vegetative growth stage (H1 vs. L1), flowering stage (H2 vs. L2), and seed-maturation stage (H3 vs. L3)—for transcriptome sequencing and comparative analysis.

3.2. Quality Assessment of Transcriptome Sequencing Data

In this study, transcriptome sequencing was performed on red clover samples from high-isoflavone content groups (H1, H2, H3) and low-isoflavone content groups (L1, L2, L3) at the vegetative growth, flowering, and seed-maturation stages, followed by a comprehensive data quality evaluation (Table 3). The total number of reads (ReadSum) ranged from 18.13 million to 26.23 million, with a total base count (BaseSum) exceeding 5.4 Gb for all samples, indicating that the sequencing depth was sufficient to support subsequent transcriptomic analyses. The GC content (GC%) ranged from 41.51% to 42.30%, displaying a uniform distribution that aligns with the typical GC content characteristics observed in plant transcriptome sequencing. No extreme GC bias was detected, confirming the stability of the sequencing process. The quality assessment parameters showed that Q20 values (the percentage of bases with a sequencing error rate below 1%) exceeded 97.69% across all samples, while Q30 values (the percentage of bases with a sequencing error rate below 0.1%) were above 93.37%, reflecting the high reliability of the sequencing data. Additionally, the CycleQ20 percentage, which measures Q20 across sequencing cycles, remained consistently at 100%, further validating the sequencing quality and indicating the absence of significant sequencing biases.

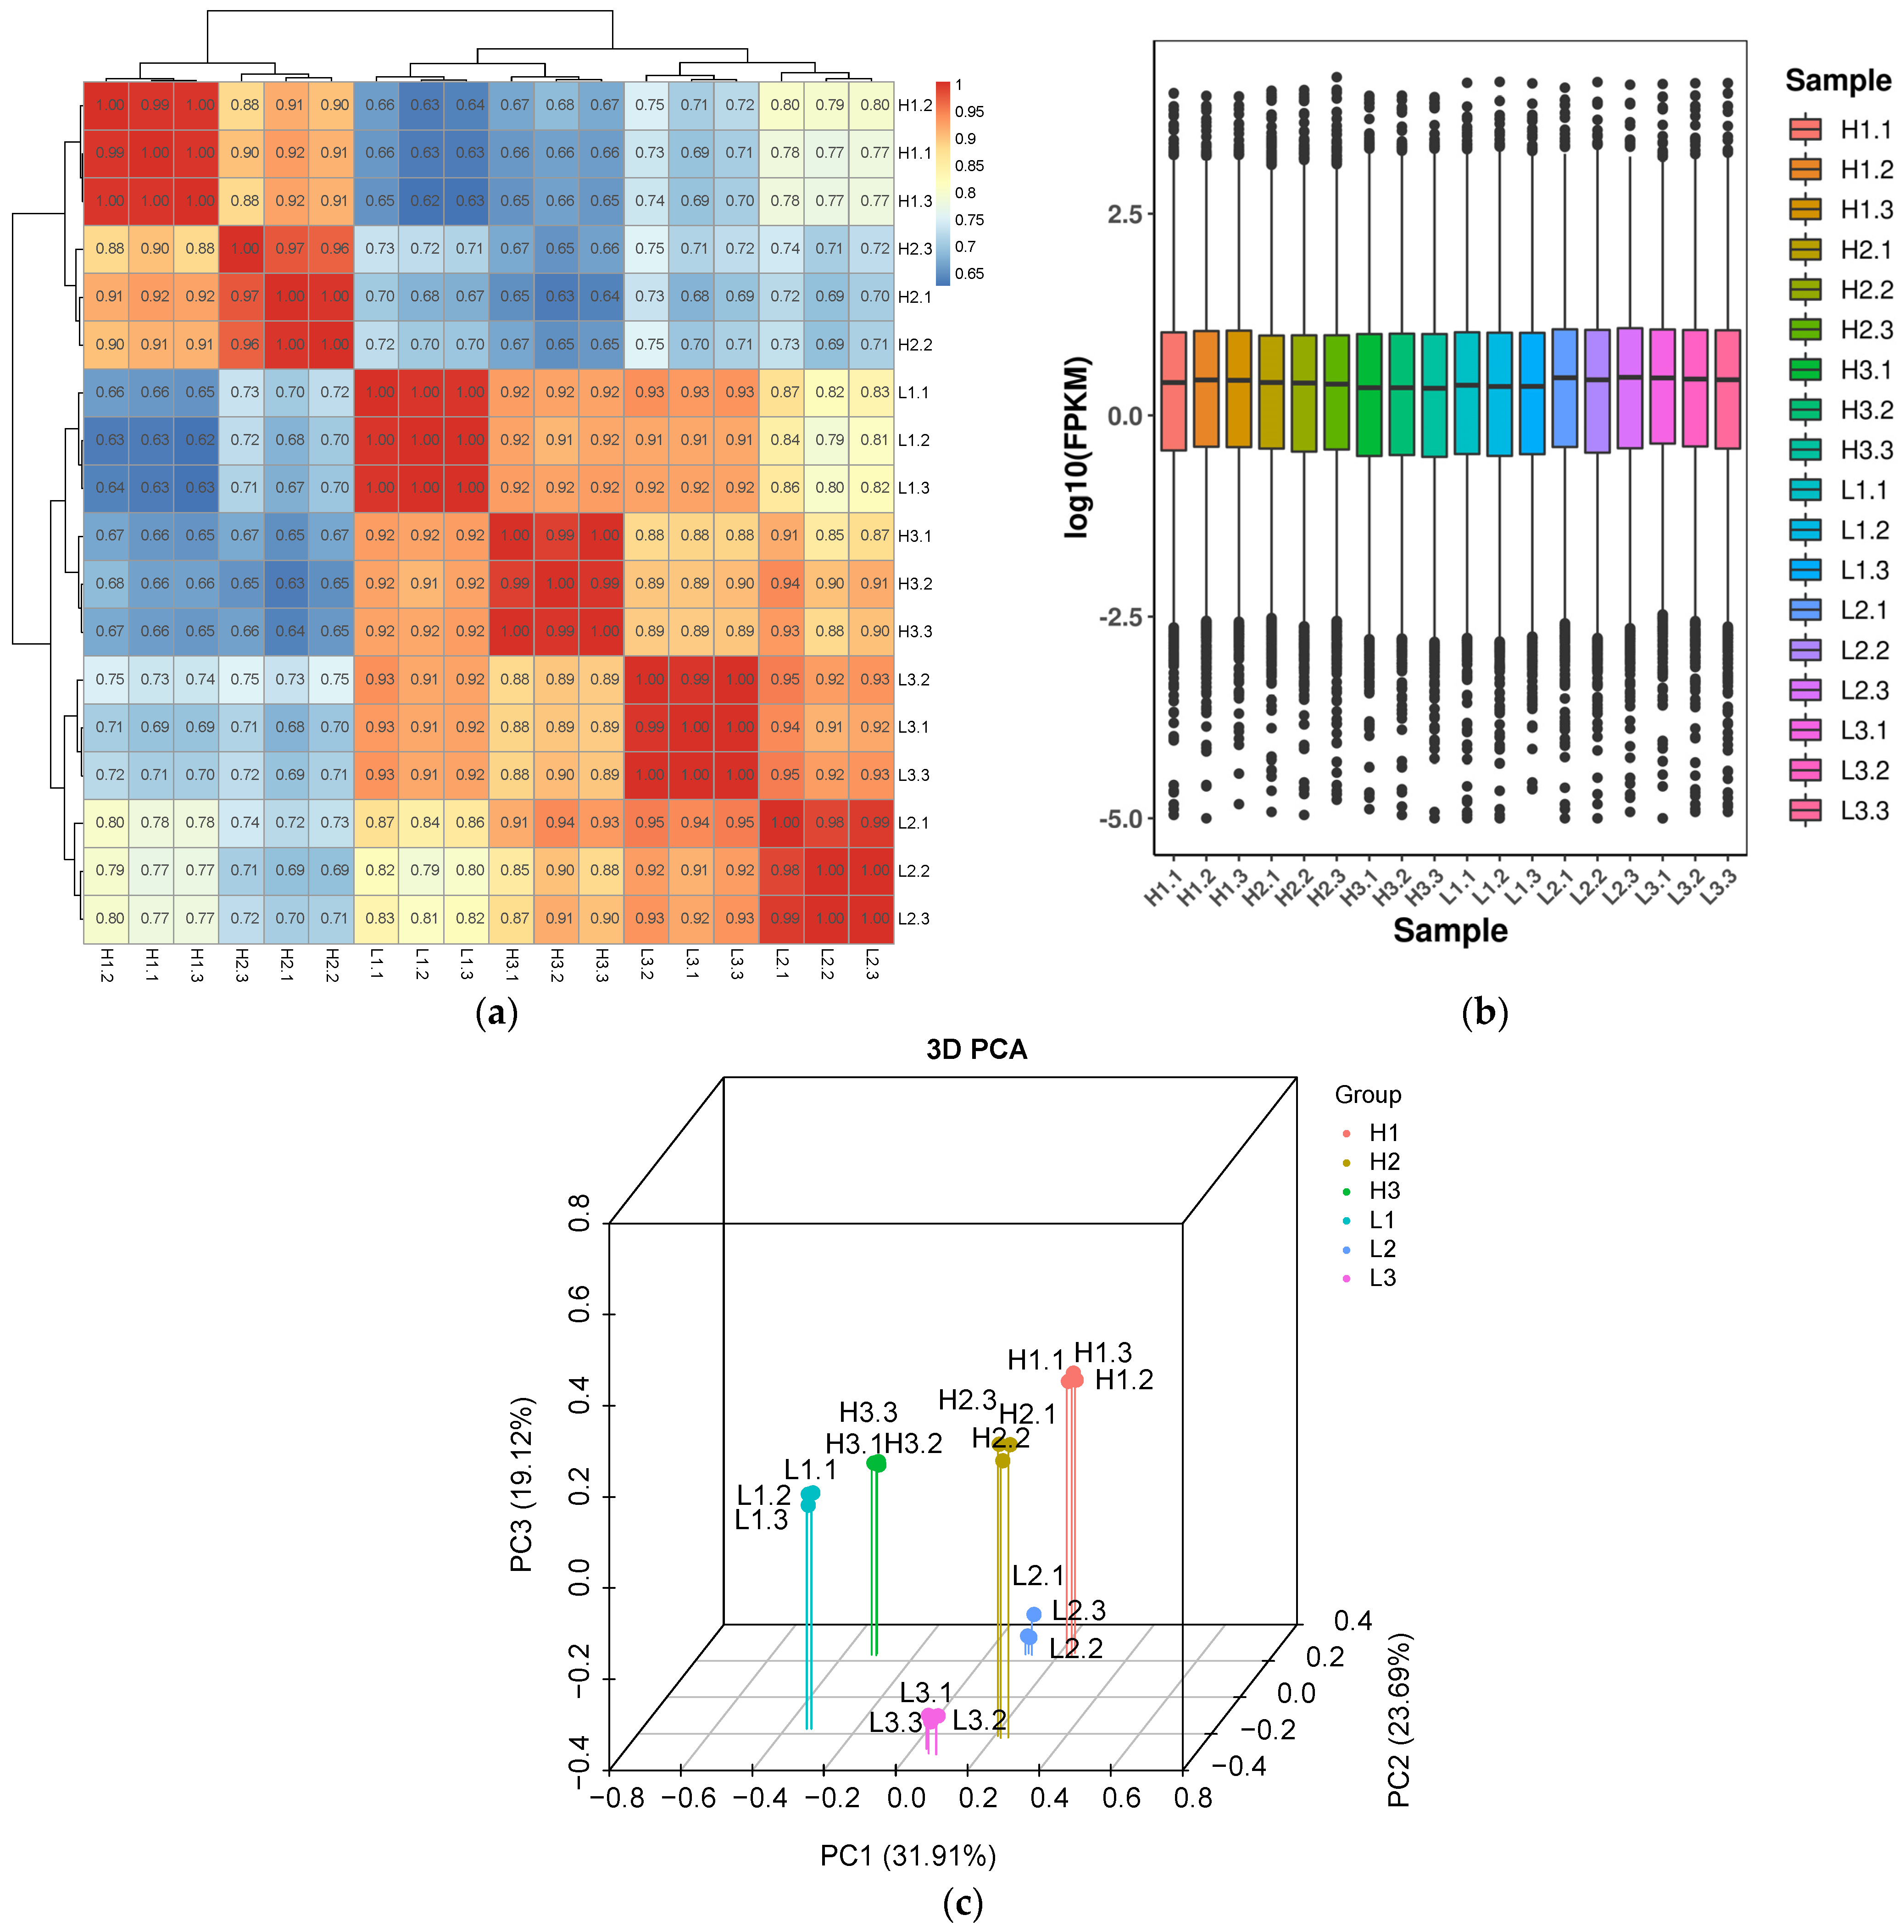
3.3. Correlation Analysis and Sample Clustering Evaluation of Transcriptome Data

To evaluate the reproducibility of transcriptome sequencing data and the distribution of samples, we conducted a comprehensive quality assessment using sample correlation analysis, gene expression boxplots, and principal component analysis (PCA) (Figure 2a–c). The heatmap of sample correlations revealed that Pearson correlation coefficients between biological replicates were all above 0.9, indicating high consistency in gene expression patterns among replicates and demonstrating the reliability of the data. Moreover, distinct clustering patterns were observed for high- and low-isoflavone content groups across different growth stages. The samples from high-isoflavone groups (H1, H2, H3) exhibited strong internal correlations, while samples from low-isoflavone groups (L1, L2, L3) clustered within their respective branches, suggesting significant transcriptomic differences between these groups (Figure 2a).
To further assess the data quality and comparability, gene expression boxplots were generated. The results showed that the fragments per kilobase per million (FPKM) values were consistently distributed on a log10 scale across samples, with highly similar median values and interquartile ranges. This uniformity indicates that the data normalization process was effective, with no apparent outliers or extreme biases. Additionally, the overall distribution pattern of FPKM values confirmed the absence of systematic deviations in gene expression levels among samples, ensuring that the data were well balanced and suitable for subsequent differential gene expression analysis (Figure 2b).
To analyze the overall differences in expression patterns among samples, PCA was performed. The results demonstrated that the first principal component (PC1) accounted for 31.91% of the total variance, while the second (PC2) and third (PC3) principal components explained 22.87% and 19.12% of the variance, respectively. This suggests that PC1 and PC2 primarily drive the variations in gene expression across samples. In the three-dimensional PCA plot, samples from different groups were distinctly separated according to their isoflavone content levels. High-isoflavone content samples (H1, H2, H3) were tightly clustered on one side, while low-isoflavone content samples (L1, L2, L3) clustered separately on the other side. These findings further validate the transcriptomic differentiation between high- and low-isoflavone groups, aligning well with the results from sample correlation analysis and boxplots. Collectively, these analyses confirm the rationality of sample grouping and the reliability of sequencing data, supporting its suitability for subsequent differential gene expression analysis and functional enrichment studies (Figure 2c).

3.4. Differentially Expressed Gene (DEG) Analysis

To investigate the transcriptional differences between high-isoflavone groups (H1, H2, H3) and low-isoflavone groups (L1, L2, L3) at different growth stages, differentially expressed gene (DEG) analysis was performed for three comparison groups: L1 vs. H1, L2 vs. H2, and L3 vs. H3. The number of upregulated and downregulated genes was statistically analyzed (Figure 3). The results showed that the most DEGs were detected in the L1 vs. H1 comparison, with a total of 10,617 DEGs, including 5772 upregulated genes and 4845 downregulated genes. This indicates that the transcriptional differences between high- and low-isoflavone groups were most pronounced during the vegetative growth stage.
As plant development progressed, the number of DEGs gradually decreased. In the L2 vs. H2 comparison, 7588 DEGs were identified, of which 3855 genes were upregulated and 3733 genes were downregulated. This reduction in DEGs suggests that during the flowering stage, the transcriptomic differences between high- and low-isoflavone groups became relatively smaller, possibly due to a shift in metabolic priorities toward reproductive growth. Interestingly, in the L3 vs. H3 comparison, the number of DEGs slightly increased to 8882, with 4150 genes upregulated and 4732 genes downregulated. This resurgence of DEGs during the seed-maturation stage suggests that significant transcriptional changes continue to occur, potentially related to processes such as secondary metabolite accumulation, seed development, and storage metabolism. These findings highlight the dynamic regulation of gene expression across different growth stages and suggest that the transcriptional basis of isoflavone biosynthesis may vary significantly throughout plant development.

3.5. Analysis of Differentially Expressed Genes (DEGs)

To further investigate gene expression variations between the high-isoflavone group (H1, H2, H3) and the low-isoflavone group (L1, L2, L3) at different growth stages, volcano plots were generated for three comparisons: L1 vs. H1, L2 vs. H2, and L3 vs. H3 (Figure 4a–c). In the L1 vs. H1 comparison, a total of 10,617 DEGs were identified, including 5772 upregulated genes and 4845 downregulated genes, indicating a significant transcriptional divergence between high- and low-isoflavone groups during the vegetative growth stage. The substantial number of upregulated genes suggests that the high-isoflavone group may enhance the activity of specific metabolic pathways, thereby promoting isoflavone biosynthesis and accumulation.
In the L2 vs. H2 comparison, 7588 DEGs were detected, comprising 3855 upregulated and 3733 downregulated genes. Compared to the vegetative growth stage (L1 vs. H1), the number of DEGs decreased during flowering, implying that transcriptional differences between the high- and low-isoflavone groups became less pronounced. This reduction might be attributed to the plant’s transition to reproductive growth, during which metabolic processes tend to stabilize.
Notably, in the L3 vs. H3 comparison, the number of DEGs increased again to 8882, with 4150 genes upregulated and 4732 genes downregulated. This result suggests that significant gene expression differences persist during the seed-maturation stage. The resurgence of DEGs at this stage may be associated with seed development and the transformation of secondary metabolites. This phase likely involves regulatory networks related to isoflavone degradation, transport, or storage, ensuring the allocation of metabolic resources for seed maturation and physiological adaptation.

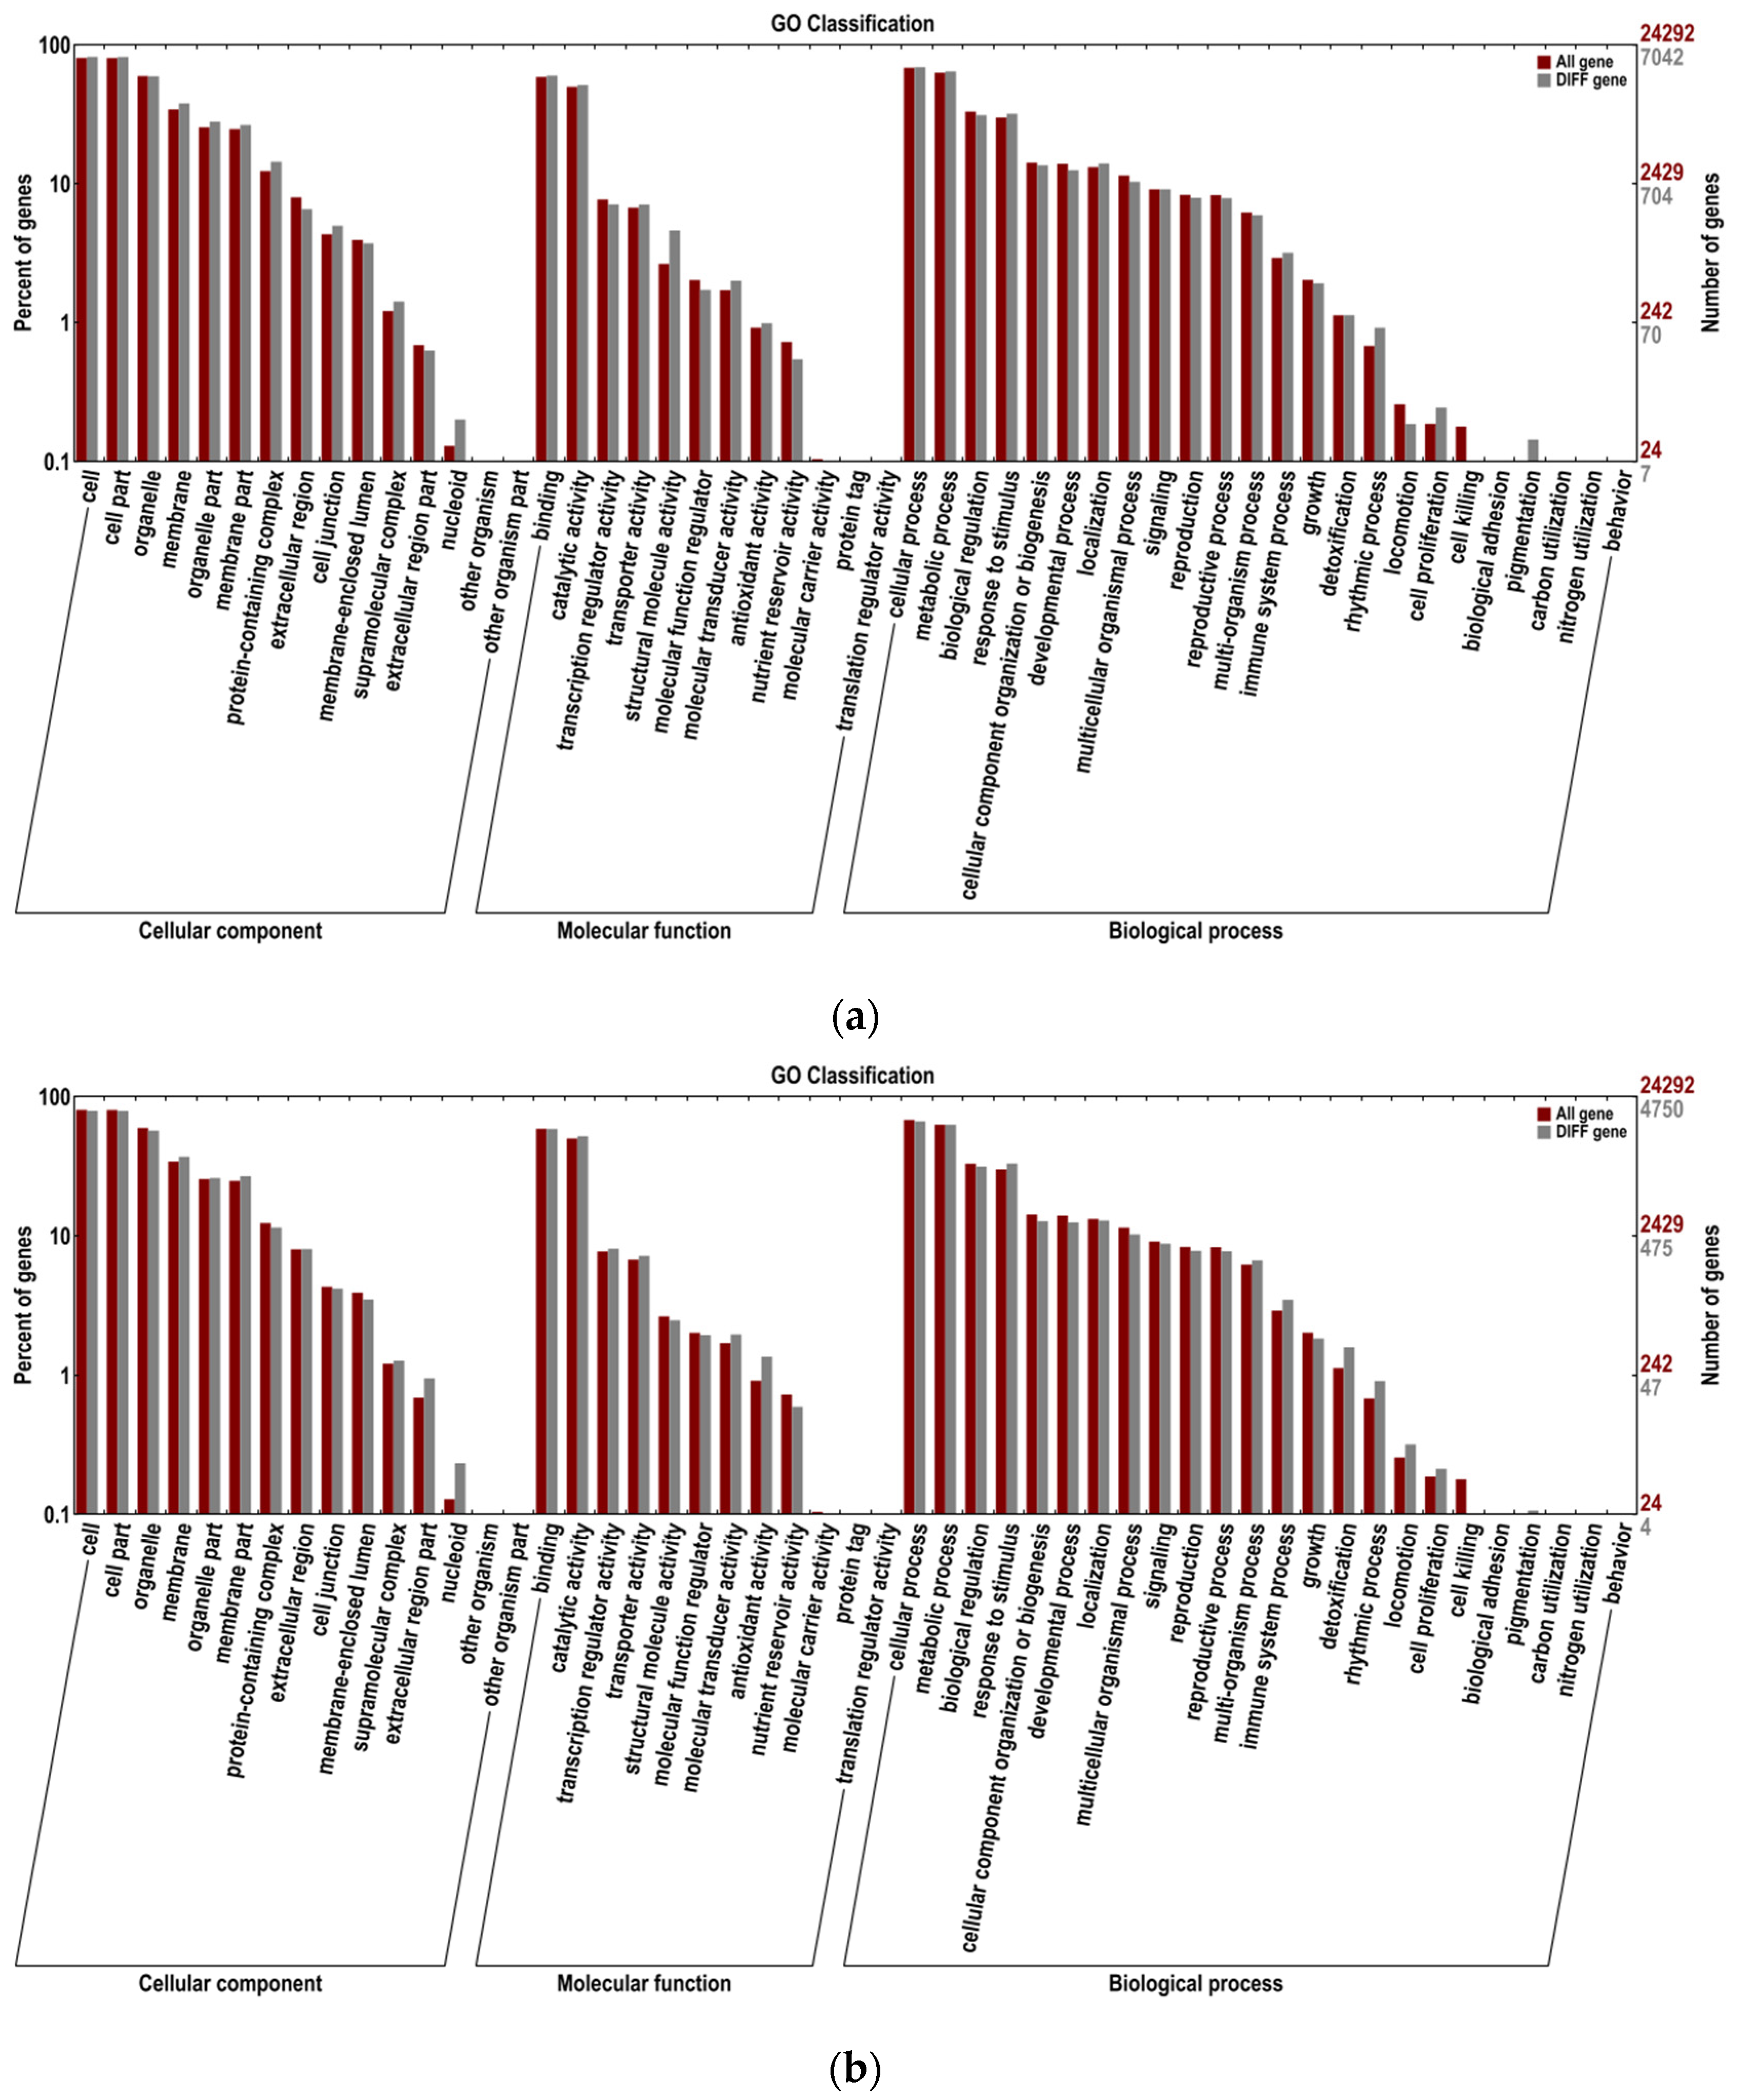
3.6. GO Functional Classification Analysis of Differentially Expressed Genes (DEGs)

To explore the biological function distribution and potential metabolic regulatory mechanisms of DEGs at different growth stages, GO functional classification analysis was performed on transcriptome data from the high-isoflavone group (H1, H2, H3) and the low-isoflavone group (L1, L2, L3).
GO enrichment analysis in the vegetative growth stage (L1 vs. H1) revealed that DEGs were mainly enriched in biological process (BP) terms, including metabolic processes, secondary metabolite biosynthesis, and oxidation-reduction processes, suggesting that the high-isoflavone group may enhance metabolic activity to promote isoflavone accumulation. Notably, genes involved in the phenylpropanoid biosynthetic pathway (e.g., PAL, C4H, 4CL) were significantly upregulated, indicating a more active phenylpropanoid pathway in the high-isoflavone group. Additionally, transcription factors such as MYB and bHLH were also enriched at this stage, suggesting their involvement in regulating the phenylpropanoid pathway to facilitate isoflavone biosynthesis. In the molecular function (MF) category, DEGs were significantly enriched in catalytic activity, binding, and oxidoreductase activity, highlighting the role of enzymatic reactions in metabolic regulation at this stage. Furthermore, the enrichment of antioxidant-related genes suggests that the high-isoflavone group may regulate the antioxidant system to enhance secondary metabolite stability. In the cellular component (CC) category, the major enriched terms included membrane, organelle, and cytoplasm, indicating that isoflavone biosynthesis and transport involve multiple subcellular compartments. The high expression of ABC transporter genes in the high-isoflavone group suggests that isoflavones may be accumulated or secreted through transmembrane transport mechanisms (Figure 5a).
During the flowering stage (L2 vs. H2), DEGs were significantly enriched in BP terms related to flower development, signal transduction, and cell cycle regulation, indicating that metabolic activities at this stage were more oriented toward reproductive growth, while the expression of secondary metabolism-related genes was relatively reduced. GO analysis revealed that multiple genes involved in auxin, gibberellin, and abscisic acid signaling pathways were enriched at this stage, suggesting that isoflavone accumulation might be regulated by plant hormones. In the MF category, genes associated with hormone binding, transcription regulator activity, and signal transduction protein activity were significantly enriched, indicating that isoflavone biosynthesis at this stage is controlled by complex signaling networks. Additionally, the upregulation of transcription factors such as WRKY and NAC in the high-isoflavone group suggests that they may regulate key metabolic genes by activating or repressing their expression. In the CC category, DEGs were mainly enriched in cell wall and extracellular region, likely related to the development of floral organs and hormone signaling transduction. Moreover, genes encoding transmembrane receptors were significantly enriched in the high-isoflavone group, indicating that isoflavone metabolism at this stage may be influenced by environmental factors (Figure 5b).
At the seed-maturation stage (L3 vs. H3), GO enrichment analysis showed that DEGs were primarily involved in seed development, carbohydrate metabolic processes, and nutrient reservoir activity in the BP category. The metabolic pattern at this stage shifted towards storage metabolism, suggesting that secondary metabolic activities were adjusted to meet the developmental needs of seeds. The enriched GO terms related to carbon metabolism indicated that isoflavone accumulation and transformation might be regulated through carbohydrate metabolism. In the MF category, transporter activity and membrane-binding proteins were significantly enriched, with a notable upregulation of ABC transporters and MATE transporters, suggesting that isoflavones might be transported to seeds or other storage tissues (Figure 5c). Additionally, multiple enzyme-coding genes associated with secondary metabolism were significantly upregulated at the seed-maturation stage, possibly contributing to isoflavone degradation or transport processes. In the CC category, genes related to vacuole, plasma membrane, and cell wall were significantly enriched, indicating that isoflavones may be accumulated through vacuolar storage mechanisms and released under specific physiological conditions to support seed development and maturation. Furthermore, several genes involved in protein degradation and modification were upregulated in the low-isoflavone group, suggesting that plants may regulate the degradation of secondary metabolites at this stage to facilitate seed maturation and nutrient redistribution.

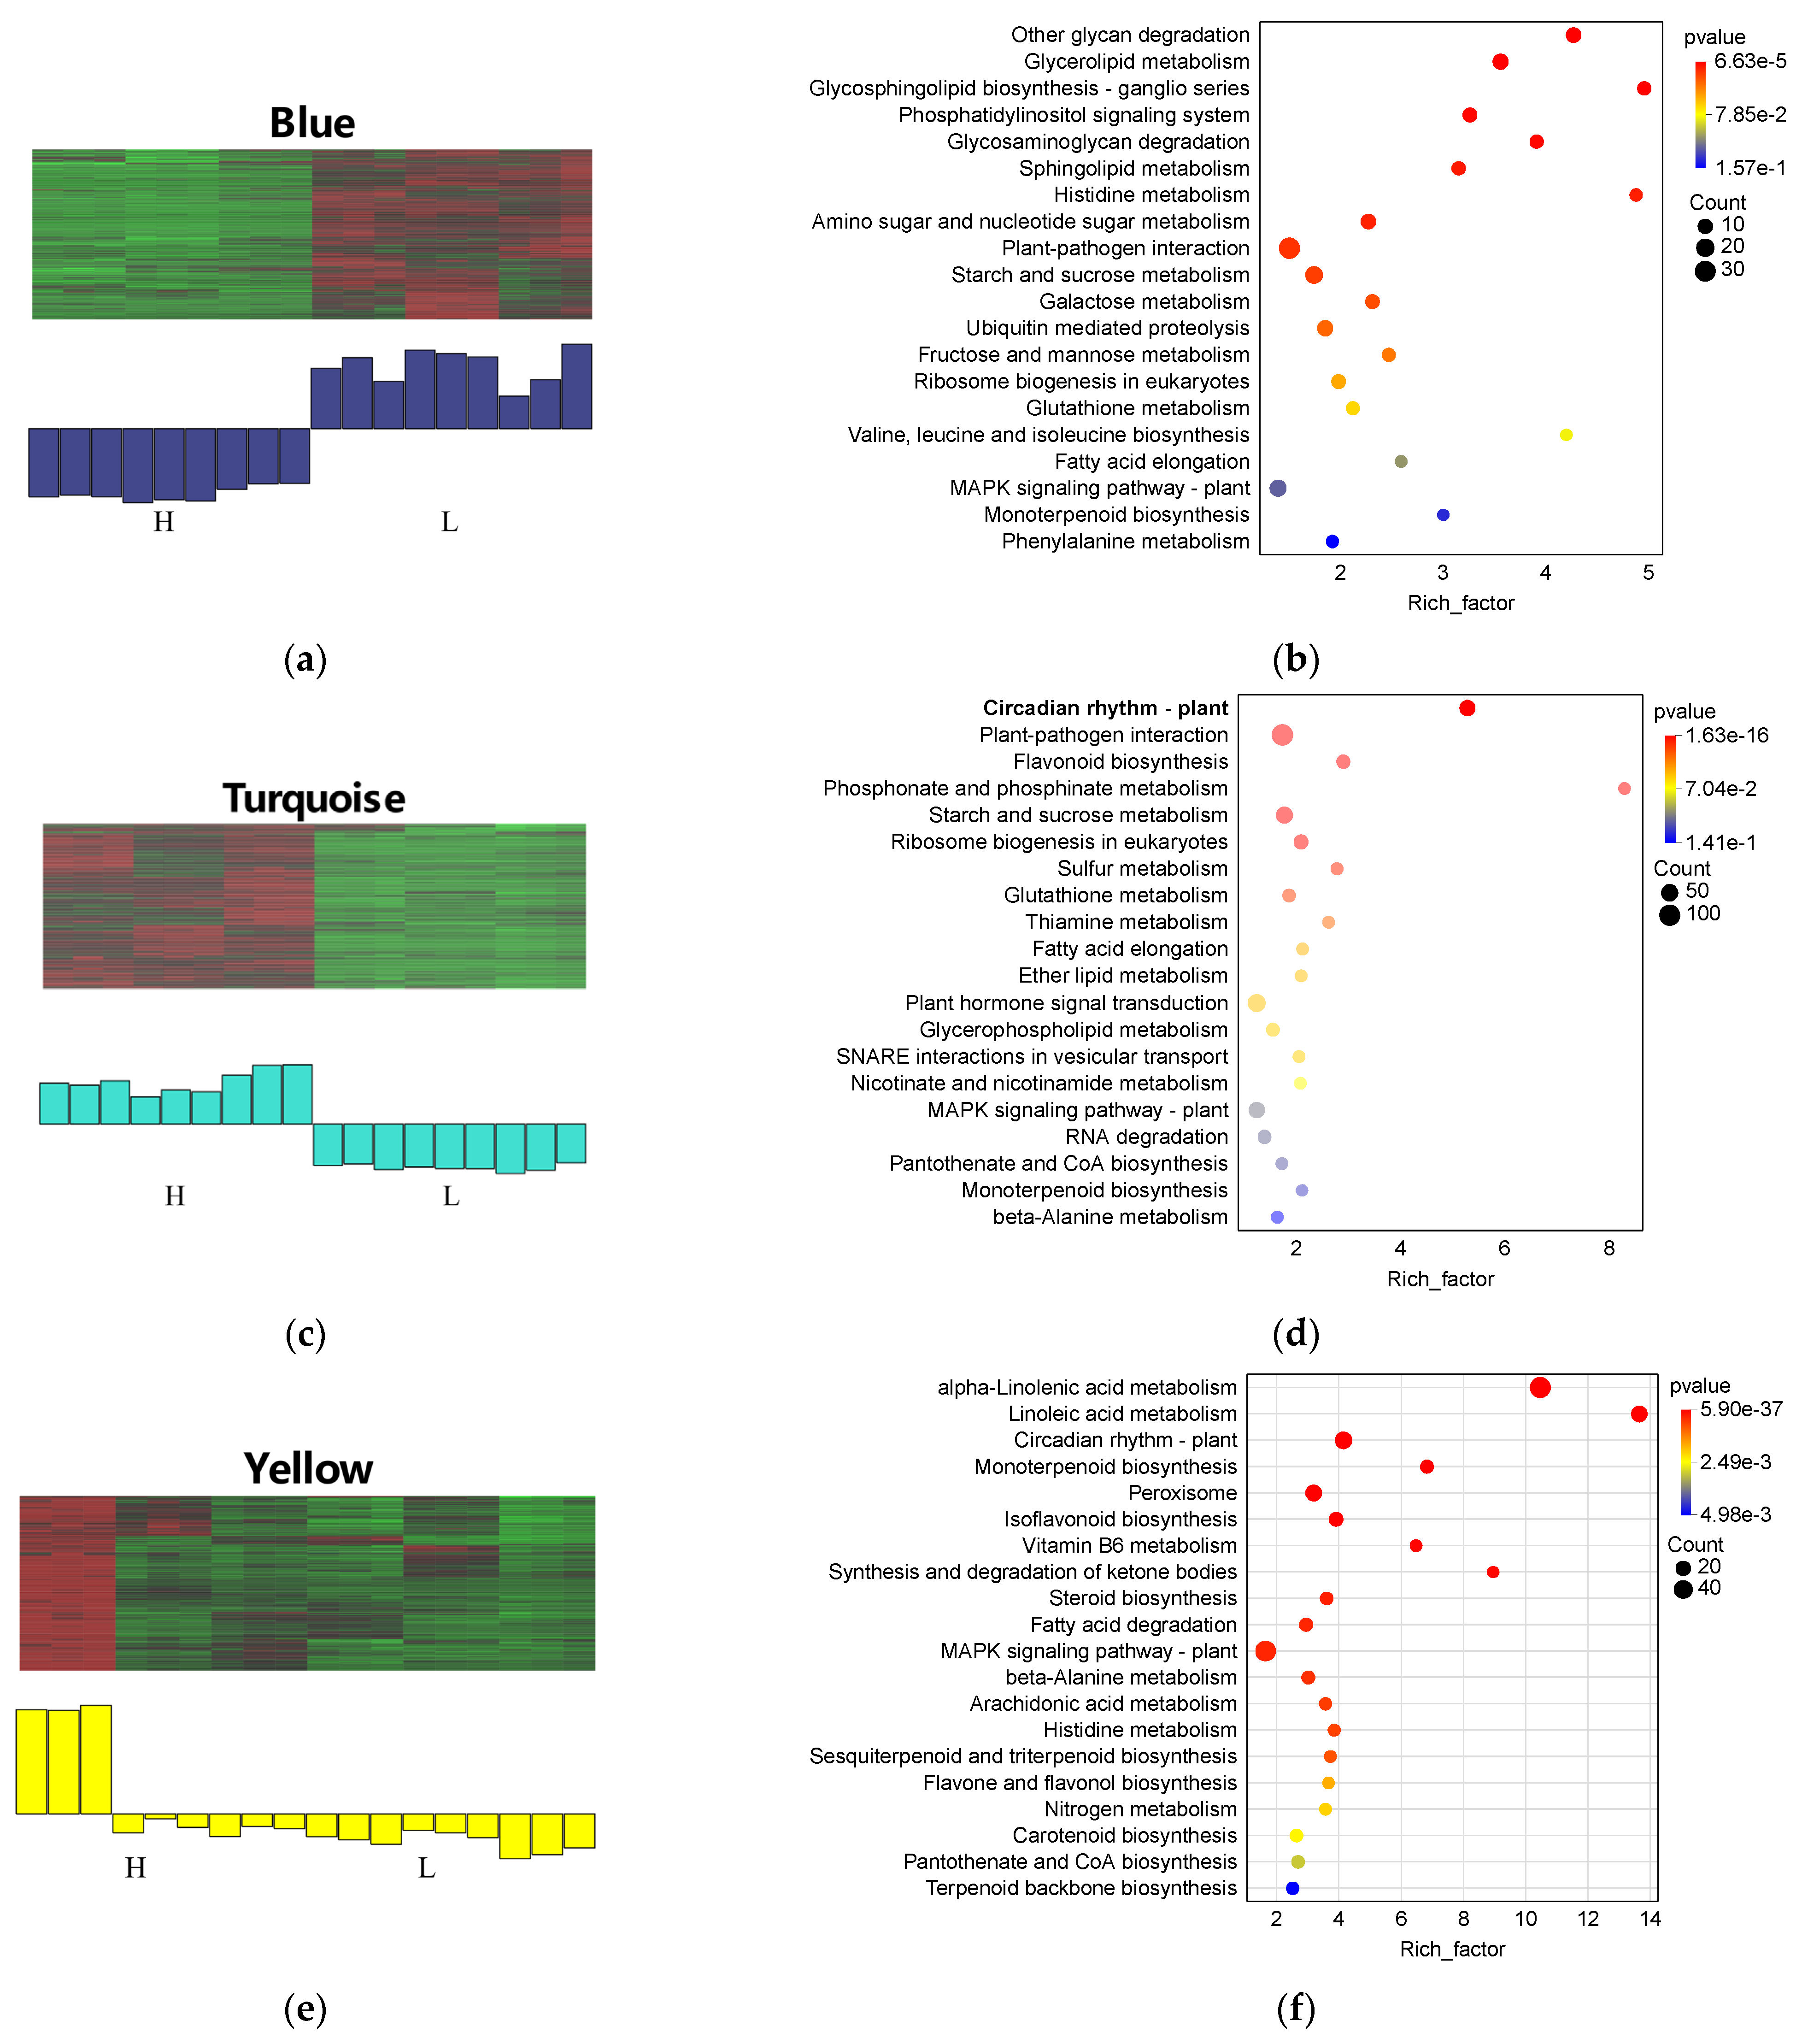
3.7. KEGG Pathway Enrichment Analysis of Differentially Expressed Genes (DEGs)

To further investigate the metabolic pathway differences between high-isoflavone groups (H1, H2, H3) and low-isoflavone groups (L1, L2, L3) at different growth stages, KEGG pathway enrichment analysis was conducted for the three comparison groups: L1 vs. H1, L2 vs. H2, and L3 vs. H3 (Figure 6a–c). The results revealed significant enrichment of DEGs in multiple metabolic and signaling pathways across different growth stages, involving primary metabolism, secondary metabolism, and plant signal transduction processes.
In the L1 vs. H1 comparison, enriched pathways were primarily associated with primary and secondary metabolism, including pyruvate metabolism, tricarboxylic acid (TCA) cycle, and isoflavonoid biosynthesis. The enrichment of the TCA cycle and pyruvate metabolism indicates that the high-isoflavone group exhibited an elevated energy metabolism level during the vegetative stage, providing sufficient ATP and precursor metabolites to promote growth and secondary metabolite synthesis. Furthermore, the significant enrichment of the isoflavonoid biosynthesis pathway suggests that the enzymatic reactions related to isoflavone synthesis were already activated in the H1 group during the vegetative growth stage, laying the foundation for subsequent high-level accumulation (Figure 6a).
In the L2 vs. H2 comparison, DEGs were predominantly enriched in pathways related to plant growth, development, and carbon metabolism, including photosynthesis, pentose phosphate pathway, and phenylpropanoid biosynthesis. The significant enrichment of the photosynthesis pathway suggests that the high-isoflavone group may enhance photosynthetic capacity and improve carbon assimilation efficiency during flowering, providing energy and precursors for subsequent isoflavone synthesis. Moreover, the phenylpropanoid biosynthesis pathway, an upstream metabolic route of isoflavonoid biosynthesis, was significantly enriched, further confirming that the high-isoflavone group may promote isoflavone synthesis by regulating the expression of genes in this pathway. Additionally, the significant enrichment of the starch and sucrose metabolism pathway suggests that the high-isoflavone group might regulate carbohydrate metabolism to ensure sufficient precursor supply for secondary metabolism (Figure 6b).
In the L3 vs. H3 comparison, the enriched pathways were mainly involved in the accumulation and transport of secondary metabolites, including protein processing in the endoplasmic reticulum, ribosome biogenesis in eukaryotes, and isoflavonoid biosynthesis. The continued enrichment of the isoflavonoid biosynthesis pathway at this stage indicates that the high-isoflavone group maintained a high metabolic activity level to promote isoflavone accumulation even during seed maturation. Furthermore, the enrichment of the ribosome biogenesis pathway suggests that the high-isoflavone group maintained an elevated protein synthesis capacity, supporting cellular function maintenance and sustained secondary metabolism. Additionally, the significant enrichment of the protein processing pathway may reflect the dynamic balance of protein synthesis and degradation at this stage, providing the necessary regulatory proteins and enzymes for isoflavone metabolism (Figure 6c).

3.8. Construction and Analysis of Weighted Gene Co-Expression Network (WGCNA)

3.8.1. Construction of Gene Co-Expression Network and Its Correlation with Isoflavone Content

To elucidate the potential relationship between gene expression patterns and isoflavone accumulation in T. pratense, a Weighted Gene Co-expression Network Analysis (WGCNA) was performed to construct a gene co-expression network. Hierarchical clustering analysis was utilized to divide the co-expression modules (Figure 7a). To determine whether these gene modules were associated with isoflavone accumulation levels, the module eigengene (ME) values were calculated and correlated with different isoflavone content groups: high-isoflavone groups (H1, H2, H3) and low-isoflavone groups (L1, L2, L3) (Figure 7b).
The analysis revealed significant expression differences across gene modules between high- and low-isoflavone groups. Among them, the MEblue module (r = −0.867, p < 0.001) and the MEturquoise module (r = 0.867, p < 0.001) showed the most pronounced negative and positive correlations, respectively. This indicates that the MEblue module was highly expressed in the low-isoflavone group, whereas the MEturquoise module was upregulated in the high-isoflavone group. Additionally, the MEyellow module (r = 0.825, p < 0.001) was also significantly positively correlated with high isoflavone content, suggesting that genes in this module might play a crucial role in promoting isoflavone biosynthesis and accumulation.
Conversely, some modules, such as MEsalmon (r = −0.482, p = 0.0428) and MEmagenta (r = −0.482, p = 0.0428), were highly expressed in the low-isoflavone group. This implies that genes within these modules might be involved in inhibiting isoflavone biosynthesis or enhancing alternative metabolic pathways. Furthermore, some modules (MEblack, MEbrown, MEgreen) exhibited weak correlations with isoflavone content (p > 0.05), suggesting that their gene expression was either independent of isoflavone levels or played a minor regulatory role. Overall, MEblue, MEturquoise, and MEyellow modules showed the strongest correlation with isoflavone accumulation, highlighting their potential involvement in isoflavone biosynthesis, accumulation, and regulatory processes. These findings provide valuable targets for further functional characterization and metabolic engineering.

3.8.2. Expression Patterns of Key Modules in WGCNA

In this study, three key modules (Blue, Turquoise, and Yellow) that exhibited strong correlations with isoflavone accumulation were identified using Weighted Gene Co-expression Network Analysis (WGCNA). The gene expression patterns and pathway enrichment of these modules were further analyzed in detail (Figure 8a–f).
In the Blue module, heatmap analysis revealed a downregulation of genes in the high-isoflavone group (H group), whereas these genes were significantly upregulated in the low-isoflavone group (L group). KEGG enrichment analysis indicated that genes within this module were primarily involved in carbohydrate metabolism pathways, including starch and sucrose metabolism, fructose and mannose metabolism, and ribosome biogenesis in eukaryotes. Additionally, several pathways related to amino acid metabolism, such as valine, leucine, and isoleucine biosynthesis, were significantly enriched, suggesting a potential role in coordinated regulation of carbon and nitrogen metabolism that might impact isoflavone accumulation. Furthermore, the enrichment of the MAPK signaling pathway in plants suggests that this module may be involved in plant stress responses, which could indirectly influence isoflavone metabolism (Figure 8a,b).
In the Turquoise module, heatmap analysis demonstrated that genes were significantly upregulated in the H group, while their expression was downregulated in the L group, indicating that this module might play a crucial role in promoting isoflavone biosynthesis. KEGG enrichment analysis showed that genes in this module were highly enriched in pathways closely related to secondary metabolism, including isoflavonoid biosynthesis, flavonoid biosynthesis, and phenylpropanoid metabolism. Moreover, this module was significantly enriched in the circadian rhythm pathway in plants and plant hormone signal transduction, indicating that isoflavone biosynthesis may be regulated by circadian rhythms and endogenous plant hormones. The enrichment of additional pathways such as MAPK signaling, sulfur metabolism, and RNA degradation suggests that this module might function in both transcriptional regulation and signal transduction to modulate isoflavone accumulation (Figure 8c,d).
For the Yellow module, heatmap analysis showed that its genes were highly upregulated in the H group but markedly downregulated in the L group, indicating its potential role in the key regulatory processes of isoflavone biosynthesis. KEGG pathway analysis revealed that genes in this module were significantly enriched in α-linolenic acid metabolism, linoleic acid metabolism, fatty acid degradation, and steroid biosynthesis, suggesting that lipid metabolism may play a role in isoflavone accumulation. Additionally, genes in this module were enriched in isoflavonoid biosynthesis, flavone and flavonol biosynthesis, monoterpenoid biosynthesis, and carotenoid biosynthesis, further supporting its critical involvement in secondary metabolic regulation. The enrichment of MAPK signaling pathways, circadian rhythm regulation, and pantothenate and CoA biosynthesis suggests that isoflavone biosynthesis is likely regulated by multiple signal transduction pathways and may be closely linked to photoperiod and energy metabolism (Figure 8e,f). Overall, these findings indicate that the Blue, Turquoise, and Yellow modules play distinct yet interconnected roles in regulating isoflavone biosynthesis, accumulation, and metabolic coordination in T. pratense.

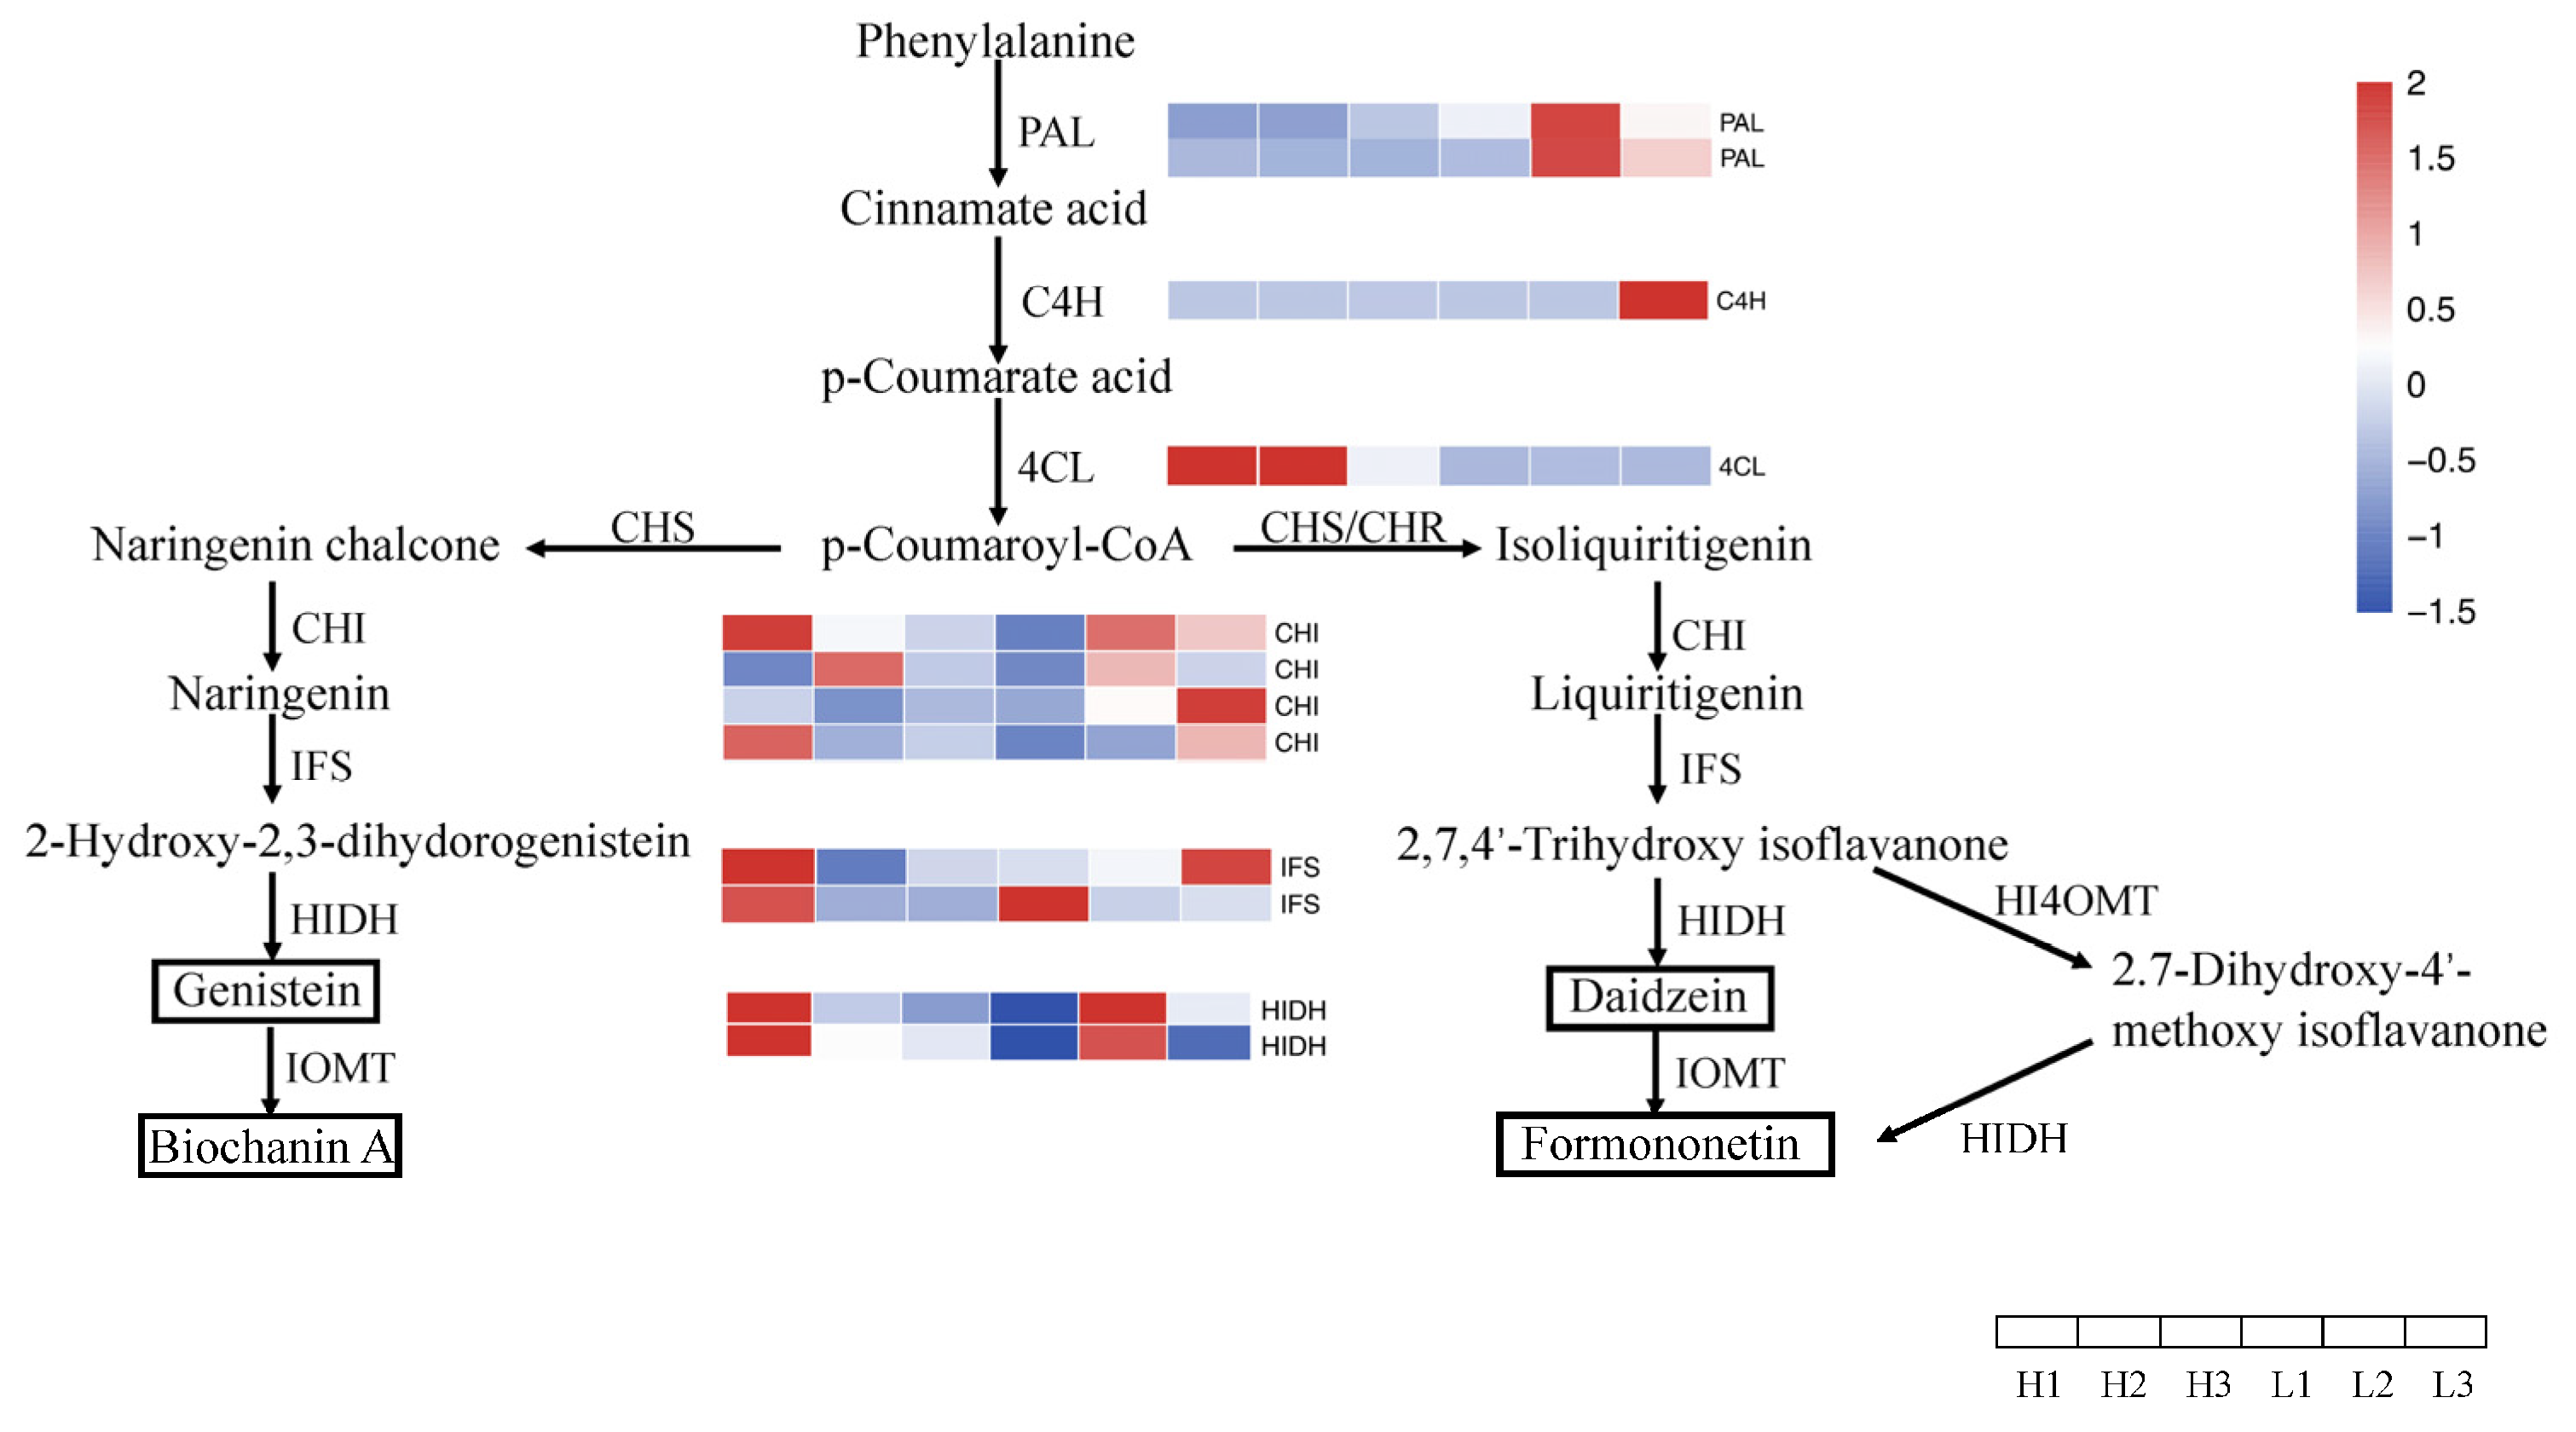
3.9. Expression Analysis of Key Genes in the Isoflavone Biosynthesis Pathway

To investigate the expression patterns of key genes involved in isoflavone biosynthesis in high (H1, H2, H3) and low (L1, L2, L3) isoflavone content groups, this study performed heatmap annotation analysis on the Phenylpropanoid Pathway and Flavonoid Biosynthesis Pathway (Figure 9). These pathways encompass multiple crucial steps in isoflavone biosynthesis, including the production of precursors, the synthesis of flavonoid compounds, and the modification of final isoflavone products.
The analysis revealed that, in the upstream stage of isoflavone biosynthesis, the genes encoding phenylalanine ammonia-lyase (PAL), cinnamate-4-hydroxylase (C4H), and 4-coumarate-CoA ligase (4CL) exhibited significantly higher expression levels in the high-isoflavone content group (H1, H2, H3) compared to the low-isoflavone group (L1, L2, L3). This suggests that the high-isoflavone group may enhance phenylpropanoid metabolism, providing a greater supply of precursors for downstream isoflavone synthesis.
In the midstream metabolic process, genes involved in chalcone synthesis (CHS), chalcone isomerization (CHI), and isoflavone synthesis (IFS) also displayed notable differences in expression. Specifically, CHS and CHI genes were significantly upregulated in the high-isoflavone group, indicating their potential role in promoting the accumulation of chalcones and their derivatives, thereby providing substrates for isoflavone biosynthesis. Notably, isoflavone synthase (IFS), the key enzyme responsible for isoflavone biosynthesis, exhibited markedly higher expression levels in the H group compared to the L group, suggesting that IFS acts as a rate-limiting step in the pathway. Its high expression level likely facilitates the accumulation of genistein and daidzein, two major isoflavone compounds.
Additionally, in the modification and transformation phase of isoflavone biosynthesis, the expression levels of isoflavone 2′-hydroxylase (HIDH) and isoflavone O-methyltransferase (IOMT) showed significant differences between groups. Both HIDH and IOMT exhibited higher expression in the high-isoflavone group, suggesting that these modification enzymes may enhance isoflavone structural modification and stability in these plants. This could promote the accumulation of final isoflavone products such as genistin, daidzin, and formononetin. Notably, the high expression of IOMT suggests an increased methylation modification, leading to the formation of more methylated isoflavone compounds, which are more stable and biologically active secondary metabolites.
Overall, these findings indicate that upregulated expression of key biosynthetic and modification genes in the high-isoflavone group contributes to increased isoflavone accumulation, potentially offering molecular targets for future metabolic engineering and genetic improvement of T. pratense.

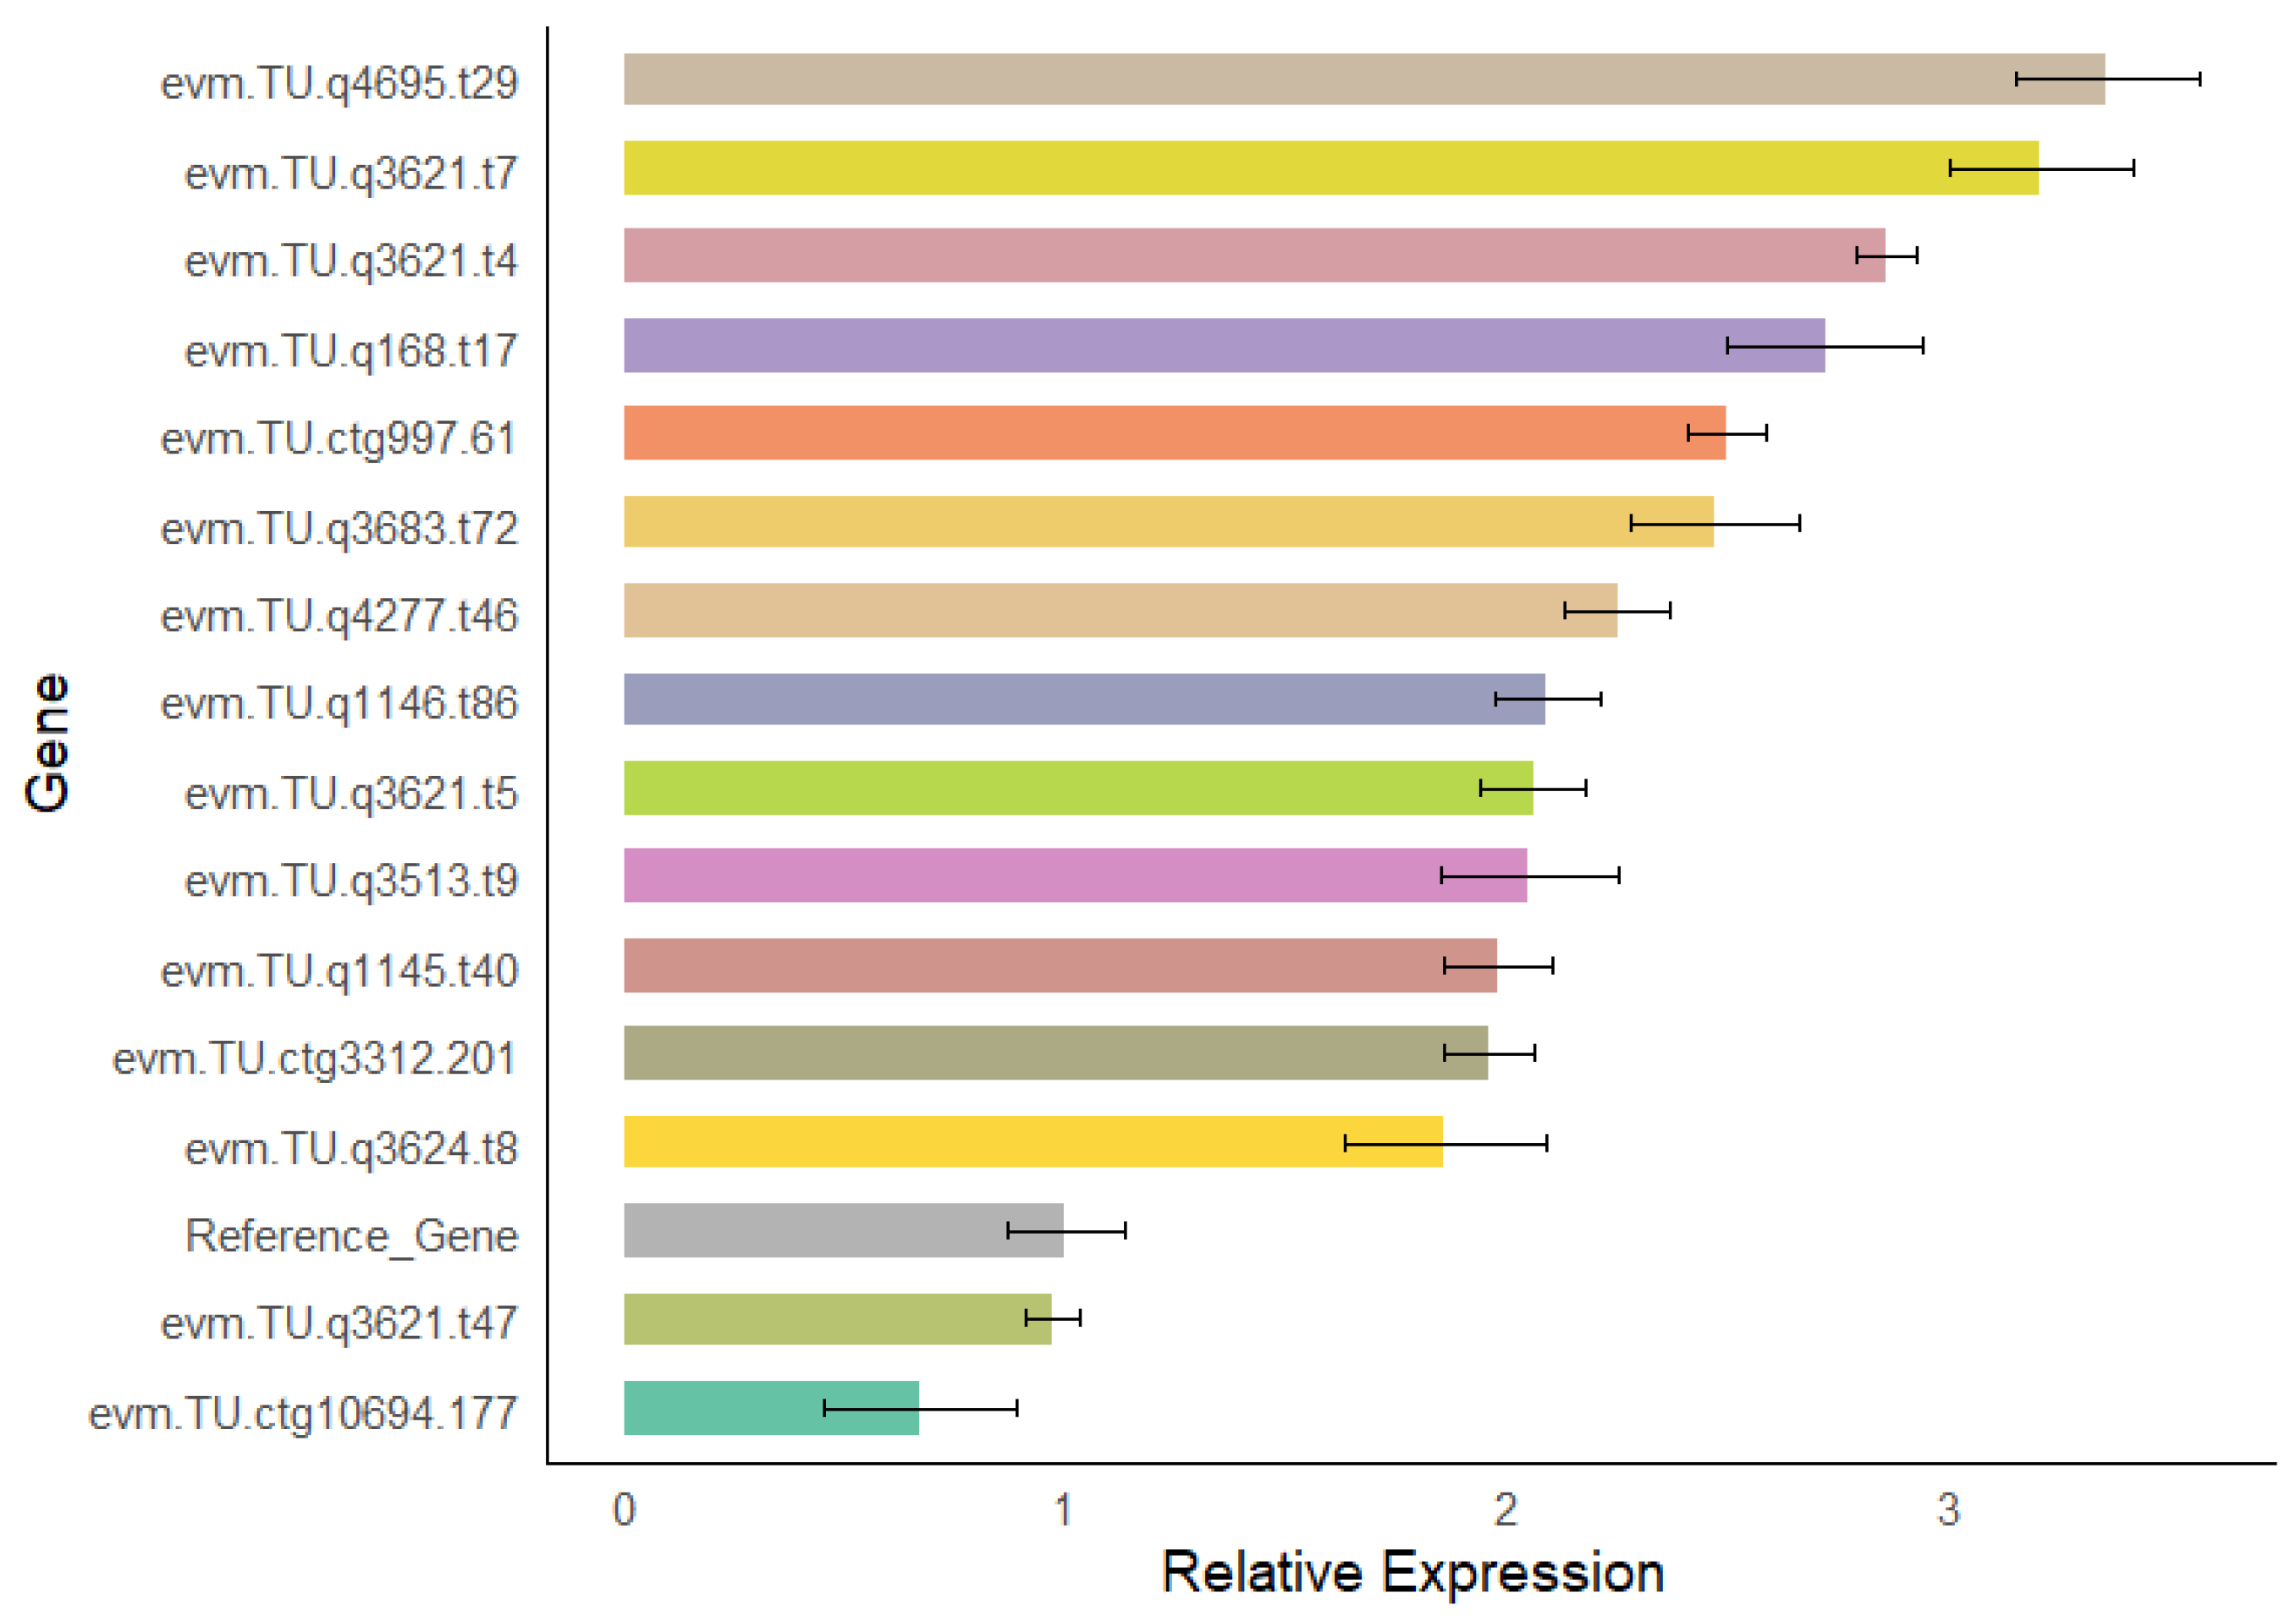
3.10. Validation of Differentially Expressed Genes in the Isoflavone Biosynthesis Pathway

To validate the accuracy of the RNA-seq data, quantitative real-time PCR (qRT-PCR) analysis was performed on 15 differentially expressed genes (DEGs) selected based on high|log2Fold Change| and strong module membership (kME) values from WGCNA. As shown in Figure 10, the qRT-PCR results were consistent with RNA-seq expression trends, confirming the reliability of transcriptomic analysis.
Among the tested genes, evm.TU.q4695.t29, evm.TU.q3621.t7, and evm.TU.q3621.t4 exhibited the highest relative expression levels, all exceeding a value of 3. These results align with their high expression observed in RNA-seq and suggest their potential involvement in isoflavone biosynthesis or regulation. Conversely, genes such as evm.TU.q3621.t47 and evm.TU.ctg10694.177 showed the lowest relative expression, consistent with their downregulation in the transcriptome data. The overall agreement between RNA-seq and qRT-PCR results validates the transcriptome dataset and supports the functional relevance of the selected DEGs in the isoflavone biosynthetic pathway.
These findings not only reinforce the robustness of the transcriptomic dataset but also identify several genes as promising molecular targets for further investigation into the regulatory mechanisms of isoflavone metabolism in T. pratense.

4. Discussion

4.1. Genotypic Variation and Cluster Analysis of Isoflavone Accumulation in T. pratense

In this study, isoflavone content was measured in 500 accessions of T. pratense, followed by systematic cluster analysis to investigate the genetic variation in isoflavone accumulation among different germplasms. The results revealed significant genetic variation in isoflavone content, suggesting that the metabolic levels of different groups may be influenced by distinct molecular regulatory mechanisms. The G1, G2, and G3 groups exhibited significantly higher isoflavone contents compared to the overall average, whereas the G5 group had the lowest content. This divergence was clearly reflected in the clustering tree, indicating possible genetic differences between high- and low-isoflavone groups. These results corroborate the metabolic heterogeneity reported in prior red clover studies, where isoflavone content was shown to vary widely across accessions due to genotypic background [17].
This finding is consistent with isoflavone accumulation patterns observed in soybean [2] and alfalfa [18], where studies have demonstrated that isoflavone content variability may result from the combined effects of genotype differences, environmental factors, and metabolic regulatory networks [20]. In the phenylpropanoid metabolic pathway, the expression levels of upstream genes such as phenylalanine ammonia-lyase (PAL), cinnamate-4-hydroxylase (C4H), and 4-coumarate-CoA ligase (4CL) directly influence the biosynthetic capacity of secondary metabolites. Meanwhile, the expression levels of chalcone synthase (CHS) and isoflavone synthase (IFS), which act as rate-limiting enzymes, ultimately determine isoflavone accumulation [21].
Previous studies have shown that in soybean (Glycine max), transcription factors such as MYB and bHLH can regulate IFS expression to promote isoflavone biosynthesis [2]. The high-isoflavone groups identified in this study may follow a similar regulatory mechanism. Conversely, the low-isoflavone groups may employ a metabolic flux redirection mechanism, diverting a portion of the precursors into alternative secondary metabolic pathways, such as lignin or anthocyanin biosynthesis, thereby reducing isoflavone accumulation [22].
The systematic clustering analysis employed in this study provides a novel approach for the classification of T. pratense germplasm resources. Similar clustering methodologies have been applied in secondary metabolite studies in alfalfa and soybean, demonstrating the applicability of this approach in plant metabolic research.

4.2. Quality Assessment of Transcriptome Sequencing Data and Sample Clustering Analysis

Transcriptome sequencing was performed on samples from high- and low-isoflavone content groups of T. pratense at the vegetative growth, flowering, and seed-maturation stages, followed by a systematic evaluation of sequencing data quality. The results demonstrated that all sequencing quality parameters were within optimal ranges, including the total number of reads (18.13–26.23 million), total bases (>5.4 Gb), GC content (41.51–42.30%), Q20 (>97.69%), and Q30 (>93.37%), confirming that the data were of high quality and suitable for subsequent gene expression analysis. These quality parameters meet the technical standards of plant RNA sequencing and are consistent with previous transcriptomic studies in leguminous species such as soybean (Glycine max) [2]. The GC content displayed a stable and uniform distribution without significant bias, which is particularly important, as deviations in GC content can result in sequencing biases and impair the comparability of transcriptomic data. Furthermore, the CycleQ20 value was consistently 100%, demonstrating high sequencing accuracy and the absence of cumulative sequencing errors, further validating the reliability of the sequencing strategy employed in this study.
Following quality assessment, sample correlation analysis, gene expression boxplot analysis, and principal component analysis (PCA) were conducted to ensure data reproducibility and rational sample distribution. Pearson correlation analysis showed that biological replicates had correlation coefficients exceeding 0.9, indicating high consistency in gene expression data, aligning with existing literature on plant transcriptome quality control. Boxplot analysis demonstrated that FPKM values across all samples exhibited a uniform log10-scale distribution, without the presence of outliers or systematic bias, indicating effective normalization. This result is in agreement with transcriptomic studies in Camellia species [19], supporting that FPKM normalization effectively minimizes the impact of sequencing depth variations and sample heterogeneity on gene expression data.
Additionally, PCA showed that PC1 (31.91%), PC2 (22.87%), and PC3 (19.12%) accounted for most of the variance in gene expression. The high- and low-isoflavone content groups were clearly separated in PCA space, reflecting distinct transcriptional profiles. The H1, H2, and H3 groups clustered closely, indicating high consistency in gene expression patterns among high-isoflavone accessions, while the L1, L2, and L3 groups also formed a distinct cluster, further confirming that transcriptome-level differentiation aligns with the classification based on isoflavone content. This finding is consistent with PCA results observed in other plant studies, such as Rhododendron species [23], where transcriptomic profiles successfully distinguished plant groups with different metabolic characteristics, demonstrating that gene expression patterns can effectively differentiate metabolic phenotypes. Although the large number of DEGs detected in L1 vs. H1 raises the possibility of transcriptional noise, the absence of batch effects and the consistency among biological replicates suggest that the observed differences likely reflect true biological variation.

4.3. GO Functional Classification and KEGG Pathway Enrichment Analysis of Differentially Expressed Genes (DEGs)

To systematically analyze the transcriptional differences between high-isoflavone (H1, H2, H3) and low-isoflavone (L1, L2, L3) groups at different growth stages, GO functional classification and KEGG pathway enrichment analyses were performed. The results revealed that DEGs exhibited stage-specific variations in metabolic activity, signal transduction, and biosynthesis, reflecting the dynamic regulatory mechanisms underlying isoflavone biosynthesis and accumulation.
During the vegetative growth stage (L1 vs. H1), DEGs were significantly enriched in metabolic processes, secondary metabolite biosynthesis, and oxidation-reduction processes, suggesting that the high-isoflavone group may enhance secondary metabolism to promote isoflavone accumulation. KEGG enrichment analysis revealed significant enrichment in pyruvate metabolism, the tricarboxylic acid (TCA) cycle, and isoflavonoid biosynthesis, indicating that the high-isoflavone group exhibited higher energy metabolism, providing ATP and carbon sources for secondary metabolite biosynthesis. Moreover, the phenylpropanoid biosynthesis pathway, the upstream pathway of isoflavone synthesis, was significantly enriched in both GO and KEGG analyses, with PAL, C4H, and 4CL showing upregulated expression in the high-isoflavone group, suggesting transcriptional activation of this pathway. These findings are consistent with studies in Cynomorium songaricum [24] and Populus species [25], which reported that an enhanced phenylpropanoid pathway significantly increased isoflavone biosynthesis.
During the flowering stage (L2 vs. H2), DEGs were predominantly enriched in flower development, cell cycle regulation, and signal transduction GO terms, indicating that metabolic priorities shifted towards reproductive growth, leading to a reduced expression of secondary metabolism-related genes. KEGG enrichment further revealed significant enrichment in photosynthesis, the pentose phosphate pathway, and phenylpropanoid biosynthesis, suggesting that increased photosynthetic efficiency in the high-isoflavone group provided greater carbon assimilation, supporting secondary metabolism [26]. Additionally, genes involved in plant hormone signal transduction, particularly auxin, gibberellin, and abscisic acid pathways, were upregulated in the high-isoflavone group, suggesting that hormonal regulation may coordinate isoflavone biosynthesis [20]. These results align with studies in jute (Corchorus capsularis) and licorice (Glycyrrhiza uralensis), where hormonal signaling was found to regulate secondary metabolite accumulation, particularly auxin and jasmonic acid pathways [27,28]. Moreover, GO enrichment analysis revealed that MYB, WRKY, and NAC transcription factors were highly expressed in the high-isoflavone group at this stage, suggesting that they may target phenylpropanoid pathway genes, further promoting isoflavone biosynthesis [27,29].
During the seed-maturation stage (L3 vs. H3), GO enrichment analysis showed that DEGs were mainly involved in seed development, carbohydrate metabolism, and nutrient reservoir activity, indicating that metabolic processes were adjusted towards storage metabolism. KEGG analysis further revealed that DEGs were enriched in ribosome biogenesis in eukaryotes, protein processing in the endoplasmic reticulum, and isoflavonoid biosynthesis, suggesting that isoflavone accumulation remains tightly regulated at this stage. Notably, ABC and MATE transporters were significantly upregulated in the high-isoflavone group, indicating that isoflavones may be transported to seeds or other storage tissues [30,31]. Additionally, multiple genes involved in carbon metabolism were upregulated in the high-isoflavone group, suggesting that plants might redirect carbon flux into secondary metabolism to enhance isoflavone accumulation [26,28]. These findings are consistent with transcriptomic studies in Panax notoginseng flowers [32] and purple tea (Camellia sinensis var. purpurea) [33], where isoflavone biosynthesis during seed development was found to be regulated by carbohydrate metabolism and accumulated through vacuolar storage mechanisms [34].
GO functional classification and KEGG pathway enrichment analyses revealed distinct metabolic regulatory patterns between high- and low-isoflavone groups at different growth stages. During the vegetative growth stage, the high-isoflavone group exhibited enhanced energy metabolism and phenylpropanoid biosynthesis, laying the foundation for isoflavone accumulation. In the flowering stage, isoflavone synthesis appeared to be regulated by hormonal signaling, alongside photosynthetic and carbohydrate metabolism processes. In the seed-maturation stage, isoflavones were likely transported and stored in seeds, with metabolism regulated by carbon flux and protein processing pathways. These findings provide new insights into the regulatory mechanisms of isoflavone metabolism and offer potential targets for molecular breeding or metabolic engineering to enhance isoflavone content in T. pratense.

4.4. WGCNA and Regulatory Mechanisms of Isoflavone Accumulation

In this study, WGCNA was employed to construct a gene co-expression network of T. pratense, identifying multiple gene modules significantly associated with isoflavone accumulation. Among them, three key modules—MEblue, MEturquoise, and MEyellow—were further analyzed to explore their potential regulatory roles in isoflavone metabolism. Correlation analysis revealed that MEblue was highly expressed in the low-isoflavone group, whereas MEturquoise and MEyellow were significantly upregulated in the high-isoflavone group, suggesting distinct regulatory functions. This pattern indicates that MEblue may play a role in suppressing isoflavone biosynthesis or redirecting carbon flux toward primary metabolism, while MEturquoise and MEyellow may promote isoflavone biosynthesis and accumulation through secondary metabolic pathways. Similar WGCNA studies in Medicago sativa [17] and Carthamus tinctorius [35] have demonstrated that specific gene modules are crucial for elucidating secondary metabolism regulatory networks.
KEGG enrichment analysis of the MEblue module revealed its involvement in starch and sucrose metabolism, fructose and mannose metabolism, ribosome biogenesis, and the MAPK signaling pathway, suggesting a preferential allocation of carbon resources to primary metabolism rather than secondary metabolite biosynthesis in low-isoflavone groups. Previous studies have shown that secondary metabolism is closely linked to carbon metabolism, and an increased rate of sugar metabolism may redirect metabolic flux away from secondary metabolites by regulating key enzymes such as phosphoenolpyruvate carboxylase (PEPC) [36]. Additionally, enrichment in the MAPK signaling pathway suggests a potential regulatory role in gene expression, aligning with existing findings that MAPK cascades regulate transcription factors such as MYB, bHLH, and WRKY, which are known to influence phenylpropanoid and flavonoid biosynthesis [37].
In contrast, the MEturquoise module, which was highly expressed in the high-isoflavone group, was significantly enriched in phenylpropanoid metabolism, flavonoid biosynthesis, and isoflavone biosynthesis pathways, suggesting that this module plays a central role in enhancing the production of key isoflavone precursors. The upregulation of PAL, C4H, and 4CL in high-isoflavone groups further supports this role, consistent with previous studies on Camellia sinensis, where GmMYB176 was identified as a key regulator that enhances IFS (isoflavone synthase) expression, directly promoting isoflavone biosynthesis [38,39]. Furthermore, genes in this module were also enriched in circadian rhythm and plant hormone signal transduction pathways, suggesting that isoflavone biosynthesis may be regulated by photoperiod and endogenous hormone signaling. Prior research has demonstrated that auxin can regulate flavonoid accumulation by modulating NAC and WRKY transcription factors, further supporting the involvement of hormonal regulation in isoflavone metabolism [40].
KEGG enrichment analysis of the MEyellow module revealed significant enrichment in α-linolenic acid metabolism, linoleic acid metabolism, fatty acid degradation, and steroid biosynthesis, suggesting a potential role of lipid metabolism in isoflavone biosynthesis and accumulation. Recent studies have found that lipid metabolism not only provides energy and carbon skeletons for secondary metabolism but also affects membrane permeability, influencing metabolite transport and storage. In Solanum tuberosum, fatty acid metabolites were identified as signaling molecules that regulate flavonoid biosynthesis [41]. Additionally, genes in the MEyellow module were enriched in MAPK signaling and transcription factor regulation pathways, further supporting the hypothesis that MAPK cascades modulate key transcription factors such as GmMYB12 and GmNAC3, impacting flavonoid and isoflavone metabolism [42].
Overall, WGCNA revealed a complex regulatory network underlying isoflavone biosynthesis in T. pratense. The MEturquoise and MEyellow modules appear to enhance phenylpropanoid metabolism, flavonoid biosynthesis, and lipid metabolism, promoting isoflavone accumulation. In contrast, the MEblue module appears to be more involved in regulating carbon metabolism and MAPK signaling cascades, potentially suppressing secondary metabolite biosynthesis. These findings provide new insights into the multi-level regulatory mechanisms governing isoflavone biosynthesis and suggest potential gene targets and metabolic pathways for future genetic improvement of red clover. This study establishes a fundamental framework for further investigations into the role of isoflavones in plant stress adaptation and functional metabolite accumulation.

5. Conclusions

This study comprehensively analyzed the genotypic variation, transcriptomic regulation, and metabolic pathways associated with isoflavone biosynthesis in T. pratense through systematic clustering analysis, RNA-seq-based differential expression profiling, and weighted gene co-expression network analysis (WGCNA). The results revealed significant genetic variation in isoflavone accumulation, with high-isoflavone groups (H1, H2, H3) exhibiting distinct transcriptional patterns compared to low-isoflavone groups (L1, L2, L3). GO functional classification and KEGG pathway enrichment analyses indicated that genes involved in phenylpropanoid metabolism, flavonoid biosynthesis, and carbohydrate metabolism played crucial roles in regulating isoflavone biosynthesis.
WGCNA identified three key gene modules—MEblue, MEturquoise, and MEyellow—that exhibited strong correlations with isoflavone content. The MEturquoise and MEyellow modules were highly expressed in high-isoflavone groups, with enrichment in phenylpropanoid biosynthesis, flavonoid biosynthesis, lipid metabolism, and hormonal signaling pathways, suggesting that these modules actively promote isoflavone accumulation. Conversely, the MEblue module, which was highly expressed in low-isoflavone groups, was enriched in sugar metabolism and MAPK signaling, indicating a potential role in redirecting metabolic flux away from secondary metabolism.
Furthermore, key rate-limiting enzymes in the isoflavone biosynthetic pathway, such as PAL, C4H, 4CL, CHS, and IFS, were significantly upregulated in high-isoflavone groups, reinforcing their importance in precursor supply and enzymatic catalysis. The role of transcription factors (MYB, WRKY, and NAC) in regulating these biosynthetic genes was also highlighted, suggesting a complex network of hormonal, circadian, and environmental regulation underlying isoflavone metabolism.
In conclusion, this study provides a comprehensive molecular framework for understanding the transcriptional regulation and metabolic dynamics of isoflavone biosynthesis in T. pratense. The findings offer novel insights into key regulatory genes and metabolic pathways, paving the way for genetic improvement, metabolic engineering, and molecular breeding strategies aimed at enhancing isoflavone content in T. pratense and other leguminous plants. Future research should focus on functional validation of candidate genes, environmental interactions, and biotechnological applications to optimize isoflavone production for agricultural and pharmaceutical applications.

Author Contributions

K.C. was responsible for data collection and analysis, resource provision, drafting the initial version of the paper, and revising the paper. S.W. was in charge of experimental methods, resource provision, and drafting the initial version of the paper. H.Z. was responsible for data collection and analysis and drafting the initial version of the paper. Y.M. was responsible for data collection and analysis and drafting the initial version of the paper. Q.W. was responsible for data collection and analysis and drafting the initial version of the paper. M.W. was responsible for conceiving the paper, experimental methods, resource provision, revising the paper, obtaining project funding, and supervising the implementation of the research. F.H. was responsible for research design and methods, revising and improving the paper. All authors have read and agreed to the published version of the manuscript.

Funding

Science and Technology planning of Hohhot (2022-social-great-1-1), Natural Science Foundation of Inner Mongolia, (2022MS03010), National Natural Science Foundation of China (31901385).

Data Availability Statement

The datasets generated for this study can be found in the NCBI sequence reads archive (SRA) database under BioProject No. PRJNA1232370.

Conflicts of Interest

The authors declare no conflicts of interest.

References

  1. Huang, X.; Chu, G.; Wang, J.; Luo, H.; Yang, Z.; Sun, L.; Rong, W.; Wang, M. Integrated Metabolomic and Transcriptomic Analysis of Specialized Metabolites and Isoflavonoid Biosynthesis in Sophora alopecuroides L. under Different Degrees of Drought Stress. Ind. Crops Prod. 2023, 197, 116595. [Google Scholar] [CrossRef]
  2. Kim, J.M.; Lee, J.W.; Seo, J.S.; Ha, B.-K.; Kwon, S.-J. Differentially Expressed Genes Related to Isoflavone Biosynthesis in a Soybean Mutant Revealed by a Comparative Transcriptomic Analysis. Plants 2024, 13, 584. [Google Scholar] [CrossRef]
  3. Li, Z.; Geng, G.; Xie, H.; Zhou, L.; Wang, L.; Qiao, F. Metabolomic and Transcriptomic Reveal Flavonoid Biosynthesis and Regulation Mechanism in Phlomoides Rotata from Different Habitats. Genomics 2024, 116, 110850. [Google Scholar] [CrossRef]
  4. Liu, Y.; Zhang, S.; Li, J.; Muhammad, A.; Feng, Y.; Qi, J.; Sha, D.; Hao, Y.; Li, B.; Sun, J. An R2R3-type MYB Transcription Factor, GMMYB77, Negatively Regulates Isoflavone Accumulation in Soybean [Glycine max (L.) Merr.]. Plant Biotechnol. J. 2025, 23, 824–838. [Google Scholar] [CrossRef]
  5. Polturak, G.; Misra, R.C.; El-Demerdash, A.; Owen, C.; Steed, A.; McDonald, H.P.; Wang, J.; Saalbach, G.; Martins, C.; Chartrain, L.; et al. Discovery of Isoflavone Phytoalexins in Wheat Reveals an Alternative Route to Isoflavonoid Biosynthesis. Nat. Commun. 2023, 14, 6977. [Google Scholar] [CrossRef]
  6. Mandal, P.; Mortensen, D.A.; Brito, A.F.; Wallingford, A.K.; Lima, M.R.M.; Warren, N.D.; Smith, R.G. Water Stress Influences Phytoestrogen Levels in Red Clover (Trifolium pratense) but Not Kura Clover (T. ambiguum). J. Agric. Food Chem. 2024, 72, 10247–10256. [Google Scholar] [CrossRef]
  7. Meng, L.; Yang, Y.; Ma, Z.; Jiang, J.; Zhang, X.; Chen, Z.; Cui, G.; Yin, X. Integrated Physiological, Transcriptomic and Metabolomic Analysis of the Response of Trifolium pratense L. to Pb Toxicity. J. Hazard. Mater. 2022, 436, 129128. [Google Scholar] [CrossRef]
  8. Somasiri, S.C.; Kenyon, P.R.; Morel, P.C.H.; Morris, S.T.; Kemp, P.D. Selection by Lambs Grazing Plantain (Plantago lanceolata L.), Chicory (Cichorium intybus L.), White Clover (Trifolium repens L.), Red Clover (Trifolium pratense L.) and Perennial Ryegrass (Lolium perenne L.) across Seasons. Animals 2020, 10, 2292. [Google Scholar] [CrossRef]
  9. Wang, S.; Shao, T.; Li, J.; Zhao, J.; Dong, Z. Dynamics of Fermentation Profile, Bacterial Communities and Their Functional Characteristics in Red Clover. J. Agric. Sci. 2022, 160, 535–544. [Google Scholar] [CrossRef]
  10. Wang, Z.; Chen, Z.; Wu, Y.; Mu, M.; Jiang, J.; Nie, W.; Zhao, S.; Cui, G.; Yin, X. Genome-Wide Identification and Characterization of NAC Transcription Factor Family Members in Trifolium Pratense and Expression Analysis under Lead Stress. BMC Genomics 2024, 25, 128. [Google Scholar] [CrossRef]
  11. Vleugels, T.; Ruttink, T.; Ariza-Suarez, D.; Dubey, R.; Saleem, A.; Roldán-Ruiz, I.; Muylle, H. GWAS for Drought Resilience Traits in Red Clover (Trifolium pratense L.). Genes 2024, 15, 1347. [Google Scholar] [CrossRef]
  12. Vleugels, T.; Saleem, A.; Dubey, R.; Muylle, H.; Borra-Serrano, I.; Lootens, P.; De Swaef, T.; Roldán-Ruiz, I. Phenotypic Characterization of Drought Responses in Red Clover (Trifolium pratense L.). Front. Plant Sci. 2024, 14, 1304411. [Google Scholar] [CrossRef]
  13. Song, Z.; Zhao, F.; Chu, L.; Lin, H.; Xiao, Y.; Fang, Z.; Wang, X.; Dong, J.; Lyu, X.; Yu, D.; et al. The GmSTF1/2–GmBBX4 Negative Feedback Loop Acts Downstream of Blue-Light Photoreceptors to Regulate Isoflavonoid Biosynthesis in Soybean. Plant Commun. 2024, 5, 100730. [Google Scholar] [CrossRef] [PubMed]
  14. Xu, Z.; Li, J.; Zhang, Y.; Wang, Y.; Zhu, Y.; Liu, T.; Song, X.; He, Y.; Liu, Y.; Wang, Q.; et al. Overexpression of the R2R3-MYB Transcription Factor GmMYB3a Improves Isoflavone Accumulation in Soybean. Physiol. Plant. 2025, 177, e70120. [Google Scholar] [CrossRef] [PubMed]
  15. Yang, Z.; Wu, X.; Zhu, Y.; Qu, Y.; Zhou, C.; Yuan, M.; Zhan, Y.; Li, Y.; Teng, W.; Zhao, X.; et al. Joint GWAS and WGCNA Identify Genes Regulating the Isoflavone Content in Soybean Seeds. J. Agric. Food Chem. 2024, 72, 18573–18584. [Google Scholar] [CrossRef]
  16. Zhan, Q.; Thakur, K.; Zhang, W.-W.; Feng, J.-Y.; Zhang, J.-G.; Khan, M.R.; Wei, Z.-J. Metabolic Changes and Isoflavone Biotransformation in Natto for Improved Nutritional Distribution and Bioavailability. Food Biosci. 2024, 59, 103937. [Google Scholar] [CrossRef]
  17. Dong, X.; Han, B.; Chen, J.; Luo, D.; Zhou, Q.; Liu, Z. Multiomics Analyses Reveal MsC3H29 Positively Regulates Flavonoid Biosynthesis to Improve Drought Resistance of Autotetraploid Cultivated Alfalfa (Medicago sativa L.). J. Agric. Food Chem. 2024, 72, 14448–14465. [Google Scholar] [CrossRef]
  18. Chen, S.; Li, X.; Liu, X.; Wang, N.; An, Q.; Ye, X.M.; Zhao, Z.T.; Zhao, M.; Han, Y.; Ouyang, K.H.; et al. Investigation of Chemical Composition, Antioxidant Activity, and the Effects of Alfalfa Flavonoids on Growth Performance. Oxidative Med. Cell. Longev. 2020, 2020, 8569237. [Google Scholar] [CrossRef]
  19. Liu, H.; Liu, Q.; Chen, Y.; Zhu, Y.; Zhou, X.; Li, B. Full-Length Transcriptome Sequencing Provides Insights into Flavonoid Biosynthesis in Camellia Nitidissima Petals. Gene 2023, 850, 146924. [Google Scholar] [CrossRef]
  20. Yang, Q.; Wang, G. Isoflavonoid Metabolism in Leguminous Plants: An Update and Perspectives. Front. Plant Sci. 2024, 15, 1368870. [Google Scholar] [CrossRef]
  21. Naik, J.; Misra, P.; Trivedi, P.K.; Pandey, A. Molecular Components Associated with the Regulation of Flavonoid Biosynthesis. Plant Sci. 2022, 317, 111196. [Google Scholar] [CrossRef] [PubMed]
  22. Muhammad, N.; Luo, Z.; Zhao, X.; Yang, M.; Liu, Z.; Liu, M. Transcriptome-Wide Expression Analysis of MYB Gene Family Leads to Functional Characterization of Flavonoid Biosynthesis in Fruit Coloration of Ziziphus Mill. Front. Plant Sci. 2023, 14, 1171288. [Google Scholar] [CrossRef]
  23. Xia, X.; Gong, R.; Zhang, C. Integrative Analysis of Transcriptome and Metabolome Reveals Flavonoid Biosynthesis Regulation in Rhododendron Pulchrum Petals. BMC Plant Biol. 2022, 22, 401. [Google Scholar] [CrossRef]
  24. Wang, J.; Su, H.; Wu, Z.; Wang, W.; Zhou, Y.; Li, M. Integrated Metabolites and Transcriptomics at Different Growth Stages Reveal Polysaccharide and Flavonoid Biosynthesis in Cynomorium Songaricum. IJMS 2022, 23, 10675. [Google Scholar] [CrossRef] [PubMed]
  25. Tian, Y.; Li, Q.; Rao, S.; Wang, A.; Zhang, H.; Wang, L.; Li, Y.; Chen, J. Metabolic Profiling and Gene Expression Analysis Provides Insights into Flavonoid and Anthocyanin Metabolism in Poplar. Tree Physiol. 2021, 41, 1046–1064. [Google Scholar] [CrossRef]
  26. Yao, D.; Xing, J.; Tang, Q.; Hou, Y.; Chen, B.; Yao, W.; Li, Z.; Wang, J.; Niu, Y.; Wang, D. Flavonoid Biosynthesis in Scutellaria Baicalensis Georgi: Metabolomics and Transcriptomics Analysis. Agronomy 2024, 14, 1494. [Google Scholar] [CrossRef]
  27. Yang, Z.; Wu, Y.; Dai, Z.; Chen, X.; Wangb, H.; Yang, S.; Xie, D.; Tang, Q.; Cheng, C.; Xu, Y.; et al. Comprehensive Transcriptome Analysis and Tissue-Specific Profiling of Gene Expression in Jute (Corchorus olitorius L.). Ind. Crops Prod. 2020, 146, 112101. [Google Scholar] [CrossRef]
  28. Li, X.; Xu, Y.; Zhang, J.; Xu, K.; Zheng, X.; Luo, J.; Lu, J. Integrative Physiology and Transcriptome Reveal Salt-Tolerance Differences between Two Licorice Species: Ion Transport, Casparian Strip Formation and Flavonoids Biosynthesis. BMC Plant Biol. 2024, 24, 272. [Google Scholar] [CrossRef] [PubMed]
  29. Yang, L.; Yang, Q.; Zhang, L.; Ren, F.; Zhang, Z.; Jia, Q. Integrated Metabolomics and Transcriptomics Analysis of Flavonoid Biosynthesis Pathway in Polygonatum Cyrtonema Hua. Molecules 2024, 29, 2248. [Google Scholar] [CrossRef]
  30. Zhou, X.; Wang, X.; Wei, H.; Zhang, H.; Wu, Q.; Wang, L. Integrative Analysis of Transcriptome and Target Metabolites Uncovering Flavonoid Biosynthesis Regulation of Changing Petal Colors in Nymphaea ‘Feitian 2’. BMC Plant Biol. 2024, 24, 370. [Google Scholar] [CrossRef]
  31. Feng, Y.; Zhao, K.; Li, J.; Wang, M.; Yin, H.; Fan, Z.; Li, X.; Liu, W. Transcriptome and Pigment Analyses Provide Insights into Carotenoids and Flavonoids Biosynthesis in Camellia Nitidissima Stamens. Horticulturae 2024, 10, 420. [Google Scholar] [CrossRef]
  32. Li, Y.; Hei, J.; Wang, B.; Wang, S.; He, X. Unraveling the Molecular Mechanisms of Flavonoid Biosynthesis in Panax Notoginseng Flowers across Planting Patterns and Developmental Stages Using Integrated Metabolomics and Transcriptomics Analyses. Sci. Hortic. 2024, 335, 113362. [Google Scholar] [CrossRef]
  33. Song, S.; Tao, Y.; Gao, L.; Liang, H.; Tang, D.; Lin, J.; Wang, Y.; Gmitter, F.G.; Li, C. An Integrated Metabolome and Transcriptome Analysis Reveal the Regulation Mechanisms of Flavonoid Biosynthesis in a Purple Tea Plant Cultivar. Front. Plant Sci. 2022, 13, 880227. [Google Scholar] [CrossRef]
  34. Yuan, L.; Pan, K.; Li, Y.; Yi, B.; Gao, B. Comparative Transcriptome Analysis of Alpinia Oxyphylla Miq. Reveals Tissue-Specific Expression of Flavonoid Biosynthesis Genes. BMC Genom. Data 2021, 22, 19. [Google Scholar] [CrossRef]
  35. Tan, Z.; Lu, D.; Li, L.; Su, X.; Sun, Y.; Wang, L.; Yu, Y.; Wan, X.; Xu, L.; Li, C.; et al. Comprehensive Analysis of Safflower R2R3-MYBs Reveals the Regulation Mechanism of CtMYB76 on Flavonol Biosynthesis. Ind. Crops Prod. 2025, 227, 120795. [Google Scholar] [CrossRef]
  36. Du, Y.; Ma, H.; Liu, Y.; Gong, R.; Lan, Y.; Zhao, J.; Liu, G.; Lu, Y.; Wang, S.; Jia, H.; et al. Major Quality Regulation Network of Flavonoid Synthesis Governing the Bioactivity of Black Wolfberry. New Phytol. 2024, 242, 558–575. [Google Scholar] [CrossRef] [PubMed]
  37. Kicel, A.; Olszewska, M.A. Evaluation of Antioxidant Activity, and Quantitative Estimation of Flavonoids, Saponins and Phenols in Crude Extract and Dry Fractions of Medicago Lupulina Aerial Parts. Nat. Prod. Commun. 2015, 10, 1934578X1501000326. [Google Scholar] [CrossRef]
  38. Shan, R.; Zhang, Y.; You, X.; Kong, X.; Zhang, Y.; Li, X.; Wang, L.; Wang, X.; Chen, C. Revealing the Molecular Regulatory Mechanism of Flavonoid Accumulation in Tender Leaves of Tea Plants by Transcriptomic and Metabolomic Analyses. Plants 2025, 14, 625. [Google Scholar] [CrossRef]
  39. Huang, X.; He, Y.; Zhang, K.; Shi, Y.; Zhao, H.; Lai, D.; Lin, H.; Wang, X.; Yang, Z.; Xiao, Y.; et al. Evolution and Domestication of a Novel Biosynthetic Gene Cluster Contributing to the Flavonoid Metabolism and High-Altitude Adaptability of Plants in the Fagopyrum Genus. Adv. Sci. 2024, 11, 2403603. [Google Scholar] [CrossRef]
  40. Xie, N.; Guo, Q.; Li, H.; Yuan, G.; Gui, Q.; Xiao, Y.; Liao, M.; Yang, L. Integrated Transcriptomic and WGCNA Analyses Reveal Candidate Genes Regulating Mainly Flavonoid Biosynthesis in Litsea Coreana Var. Sinensis. BMC Plant Biol. 2024, 24, 231. [Google Scholar]
  41. Liu, Y.; Li, Y.; Liu, Z.; Wang, L.; Bi, Z.; Sun, C.; Yao, P.; Zhang, J.; Bai, J.; Zeng, Y. Integrated Transcriptomic and Metabolomic Analysis Revealed Altitude-Related Regulatory Mechanisms on Flavonoid Accumulation in Potato Tubers. Food Res. Int. 2023, 170, 112997. [Google Scholar] [CrossRef] [PubMed]
  42. Lai, J.; Li, C.; Zhang, Y.; Wu, Z.; Li, W.; Zhang, Z.; Ye, W.; Guo, H.; Wang, C.; Long, T.; et al. Integrated Transcriptomic and Metabolomic Analyses Reveal the Molecular and Metabolic Basis of Flavonoids in Areca catechu L. J. Agric. Food Chem. 2023, 71, 4851–4862. [Google Scholar] [CrossRef] [PubMed]
Figure 1. Phylogenetic Clustering of Red Clover Germplasm Based on Isoflavone Content.
Agronomy 15 01061 g001
Figure 2. Transcriptome data quality analysis of red clover under different conditions: (a) Correlation analysis heatmap showing the similarity between biological replicates in each group (H1, H2, H3, L1, L2, L3); (b) Box plot of log10(FPKM) values for transcript abundance distribution across different samples; (c) 3D Principal Component Analysis (PCA) plot illustrating the clustering of samples based on gene expression profiles.
Agronomy 15 01061 g002
Figure 3. Number of differentially expressed genes (DEGs) in different growth stage comparisons.
Agronomy 15 01061 g003
Figure 4. Volcano plots of differentially expressed genes (DEGs) in different growth stage comparisons: (a) L1 vs. H1; (b) L2 vs. H2; (c) L3 vs. H3.
Agronomy 15 01061 g004
Figure 5. Gene Ontology (GO) classification of differentially expressed genes (DEGs) in different comparisons: (a) L1 vs. H1; (b) L2 vs. H2; (c) L3 vs. H3.
Agronomy 15 01061 g005aAgronomy 15 01061 g005b
Figure 6. KEGG pathway enrichment analysis of differentially expressed genes (DEGs) in different comparisons: (a) L1 vs. H1; (b) L2 vs. H2; (c) L3 vs. H3.
Agronomy 15 01061 g006aAgronomy 15 01061 g006b
Figure 7. Weighted Gene Co-expression Network Analysis (WGCNA) results: (a) Cluster dendrogram of gene modules, showing hierarchical clustering of genes based on co-expression patterns. The dynamic tree cut method is used to detect initial modules, which are then merged into final modules based on similarity; (b) Module-trait correlation heatmap, illustrating the correlation between different gene modules and sample groups (H and L). The color scale represents the strength and direction of the correlation.
Agronomy 15 01061 g007
Figure 8. Key gene modules and their KEGG pathway enrichment analysis in Weighted Gene Co-expression Network Analysis (WGCNA): (a,c,e) Expression heatmaps and module eigengene bar plots for the Blue, Turquoise, and Yellow modules, showing expression differences between H and L groups; (b,d,f) KEGG pathway enrichment analysis of genes in the Blue, Turquoise, and Yellow modules, with pathway names, enrichment factors, gene counts, and p-values visualized.
Agronomy 15 01061 g008
Figure 9. Isoflavone biosynthesis pathway and gene expression patterns in different samples.
Agronomy 15 01061 g009
Figure 10. Relative expression levels of selected genes.
Agronomy 15 01061 g010
Table 1. qRT-PCR primer information.
NO.Gene IDForward PrimerReverse Primer
1evm.TU.q168.t17TTTCAATTCACAAATTGGGTTGGAGCATTCTCAGCTCTTT
2evm.TU.q1145.t40ATGAGTTACTATAACCAACAGCTGCTTGGCTGCTCTTT
3evm.TU.q1146.t86TCCATCCACTTGTTTCCACGAGGTGAACTCTTCGCCAA
4evm.TU.q3513.t9ATGAGTGTAGATCTGAAGAATGGTTTATTGTTCTGACGCA
5evm.TU.q3621.t4ATGTCTTTGACAAATACAATTGAGTCATTGATGACCATATGG
6evm.TU.q3621.t5ATGTTTTGGCATATGATGCAGCAGGAAGCGCTGCCGCCACC
7evm.TU.q3621.t7ATGAGTTACTATAACCAACAGCTGCTTGGCTGCTCTTT
8evm.TU.q3621.t47ATGTCTTTGACAAATACAATTGACGACTGAATTTTACTTTT
9evm.TU.q3683.t72GTGCAAGTCAGCTTCAAACTTTGAGGCCAACAGACCAAA
10evm.TU.q4277.t46ATGAATATGCATACCGGTCCAAAGTGGTTGCCTAAAGGGAGTG
11evm.TU.q3624.t8ATGTTTTGGCATATGATGCAGGCAAGGATTCTATATGCAAC
12evm.TU.q4695.t29ATGAAAATTCAGTGTGATGTGTTAACTCGGTTAGTTCTTGAG
13evm.TU.ctg997.61GCGATATTAATTAAACCAACATTGATGGTGGATCTGGA
14evm.TU.ctg10694.177ATGGGCGATGGAGGTGTCGCTGCTTCTGGATGGGGAAG
15evm.TU.ctg3312.201GTTTTCGTGTCAAAATCTCACTGTTGGGAGCTATAGTTGACT
Table 2. Isoflavone Content of Six Red Clover Populations.
Population
Number
Isoflavone ContentAverage Isoflavone ContentTotal Average
Content
G129.99~36.33 mg·g−133.16 mg·g−125.21 mg·g−1
G226.53~29.82 mg·g−128.18 mg·g−1
G325.14~26.38 mg·g−125.76 mg·g−1
G423.54~24.99 mg·g−124.27 mg·g−1
G515.65~18.77 mg·g−117.21 mg·g−1
G621.94~23.46 mg·g−122.70 mg·g−1
Table 3. Quality Statistics of Transcriptome Sequencing Data.
SampleReadSumBaseSumGC (%)Q20 (%)CycleQ20 (%)Q30 (%)
H1.118,987,2425,734,147,08441.7697.9410093.99
H1.218,652,8095,633,148,31841.6297.8410093.76
H1.318,135,2145,476,834,62841.6997.710093.37
H2.118,690,5485,644,545,49642.1497.9410093.94
H2.222,605,5556,826,877,61042.397.7610093.42
H2.319,742,1075,962,116,31441.9697.8910093.81
H3.121,591,4806,520,626,96041.9197.9110093.84
H3.220,697,0966,250,522,99241.8397.7610093.46
H3.320,878,0936,305,184,08641.8797.810093.56
L1.120,462,8706,179,786,74041.8697.8110093.53
L1.222,673,4466,847,380,69241.8397.8710093.66
L1.318,840,5345,689,841,26841.8697.8910093.82
L2.119,637,0055,930,375,51041.5797.9510093.88
L2.226,238,6057,924,058,71041.5197.910093.72
L2.320,577,3556,214,361,21041.5898.0110094.03
L3.120,599,1396,220,939,97841.6497.7310093.48
L3.221,322,1096,439,276,91841.7897.6910093.45
L3.319,404,4855,860,154,47041.697.9310093.84
Disclaimer/Publisher’s Note: The statements, opinions and data contained in all publications are solely those of the individual author(s) and contributor(s) and not of MDPI and/or the editor(s). MDPI and/or the editor(s) disclaim responsibility for any injury to people or property resulting from any ideas, methods, instructions or products referred to in the content.

