Article

The Effect of Pesticide Formulation on the Characteristics of Air-Induction Sprays

1
School of Agricultural Engineering, Jiangsu University, Zhenjiang 212013, China
2
School of Energy and Power Engineering, Jiangsu University, Zhenjiang 212013, China
*
Authors to whom correspondence should be addressed.
Agronomy 2025, 15(4), 979; https://doi.org/10.3390/agronomy15040979
Submission received: 23 March 2025 / Revised: 16 April 2025 / Accepted: 17 April 2025 / Published: 18 April 2025
(This article belongs to the Special Issue Advances in Precision Pesticide Spraying Technology and Equipment)

Abstract

:
Air-induction sprays are widely used for drift control; however, their disintegration mechanism is not yet fully understood. After exiting the nozzle, the liquid typically first forms a liquid sheet, which then breaks up into droplets. Therefore, a deep understanding of the liquid sheet of air-induction sprays is essential for elucidating its disintegration mechanism. In this study, high-speed photography and image processing methods were employed to capture and measure the structure of the liquid sheet of air-induction sprays under different pesticide formulations. The effects of different pesticide formulations on the liquid sheet’s spreading angle, breakup length, and the behavior of bubbles within the liquid sheet were analyzed. The results indicate that compared to pure water, pesticide solutions significantly alter the liquid sheet’s spreading angle, length, and bubble size. Under oil-based emulsion conditions, the sheet length and bubble size decrease with increasing concentration, while the spreading angle is less affected. The oil phase in emulsions exhibits defoaming properties, reducing the number of large bubbles. Additionally, oil droplets contribute to the formation of perforations in the liquid sheet, leading to earlier breakup and shortening the sheet length. For suspensions, the variation in liquid sheet behavior is similar to that observed in oil-based emulsions, but its effect on bubble size is less pronounced. In aqueous solutions, bubble size decreases with increasing concentration, but the number of bubbles significantly increases. Moreover, the liquid sheet length and spreading angle increase markedly with concentration. Unlike oil-based emulsions and suspensions, which contain hydrophobic dispersed phases, aqueous solutions do not exhibit significant defoaming properties. Our work can provide a theoretical reference for the applications of air-induction sprays.

1. Introduction

Currently, spraying remains the primary method of pesticide application in plant protection [1,2,3]. Spray drift, a major factor in pesticide loss and environmental pollution, has gained significant attention [4,5,6,7]. The air-induction nozzle is an important anti-drift technology that has been widely used in agricultural spraying [8,9,10,11]. However, the disintegration mechanism of air-induction sprays, especially when the pesticides are used, has not been well understood.
Air-induction nozzles have a Venturi element inside [12]. When high-speed liquid passes through the term venturi, a low-pressure area draws external air into the nozzle, and forms an air–liquid mixed flow in the mixing chamber [13]. Some of the spray droplets of air–liquid mixed flow are supposed to contain air bubbles inside [14,15]. These bubble-containing droplets have a relatively large size, contributing to reducing spray drift [16]. Moreover, the deposition of the bubble-containing droplet may cause secondary disintegration, enhancing the deposition and coverage of the spray droplet [17,18]. Evidently, the premise for air-induction sprays to reduce spray drift and enhance deposition is the generation of bubble-containing droplets.
After the spray liquid exits the nozzle, it initially forms a liquid sheet; then, the sheet becomes wavy and subsequently disintegrates into droplets. Therefore, a thorough study of the liquid sheet is the foundation for unveiling the disintegration mechanism of air-induction sprays. The most distinct feature of the liquid sheet of the air-induction spray is the air bubbles [19]. Some of these air bubbles rupture prior to the fragmentation of the liquid sheet. The breakup of air bubbles in the spray sheet may generate ripples or stimulate the generation of perforations [20,21]. The development of the perforations causes the earlier breakup of the liquid sheet [20]. Some other air bubbles are supposed to enter the droplets during the breakup of the liquid sheet. In some studies, the droplets of air-induction sprays were collected with silicone oil, and the air bubbles in the droplets can be directly visualized in the captured images [22]. Some researchers found that the droplets of air-induction sprays may not always contain air bubbles; it depends on the properties of the spray liquid and the size of the spray droplets [23]. Small droplets seldom have bubbles inside, while the droplets with diameters bigger than 120 μm are more likely to catch bubbles [17]. When the spray liquid is pure water, few bubbles are involved in the droplets; however, when a surfactant is added to the spray liquid, the number of bubbles within the droplets significantly increases [24]. It is evident that the properties of the spray liquid have a significant impact on air-induction spraying. In fact, some studies have demonstrated that the formulation of pesticides, such as oil-based emulsions, exerts a notable influence on the disintegration mechanisms of agricultural sprays [25,26].
The presented study aims to explore the effect of different pesticide formulations on the characteristics of air-induction sprays. The spray angle, breakup length, and air bubble size of the spray sheet were quantitatively measured. The influence of pesticide formulations on these parameters was discussed. And a theoretical hypothesis was proposed to explain these phenomena. The research presented in this study contributes to a deeper understanding of the air-induction spray under the influence of pesticide formulations. The findings of this study can provide a theoretical reference for the applications of air-induction sprays.

2. Materials and Methods

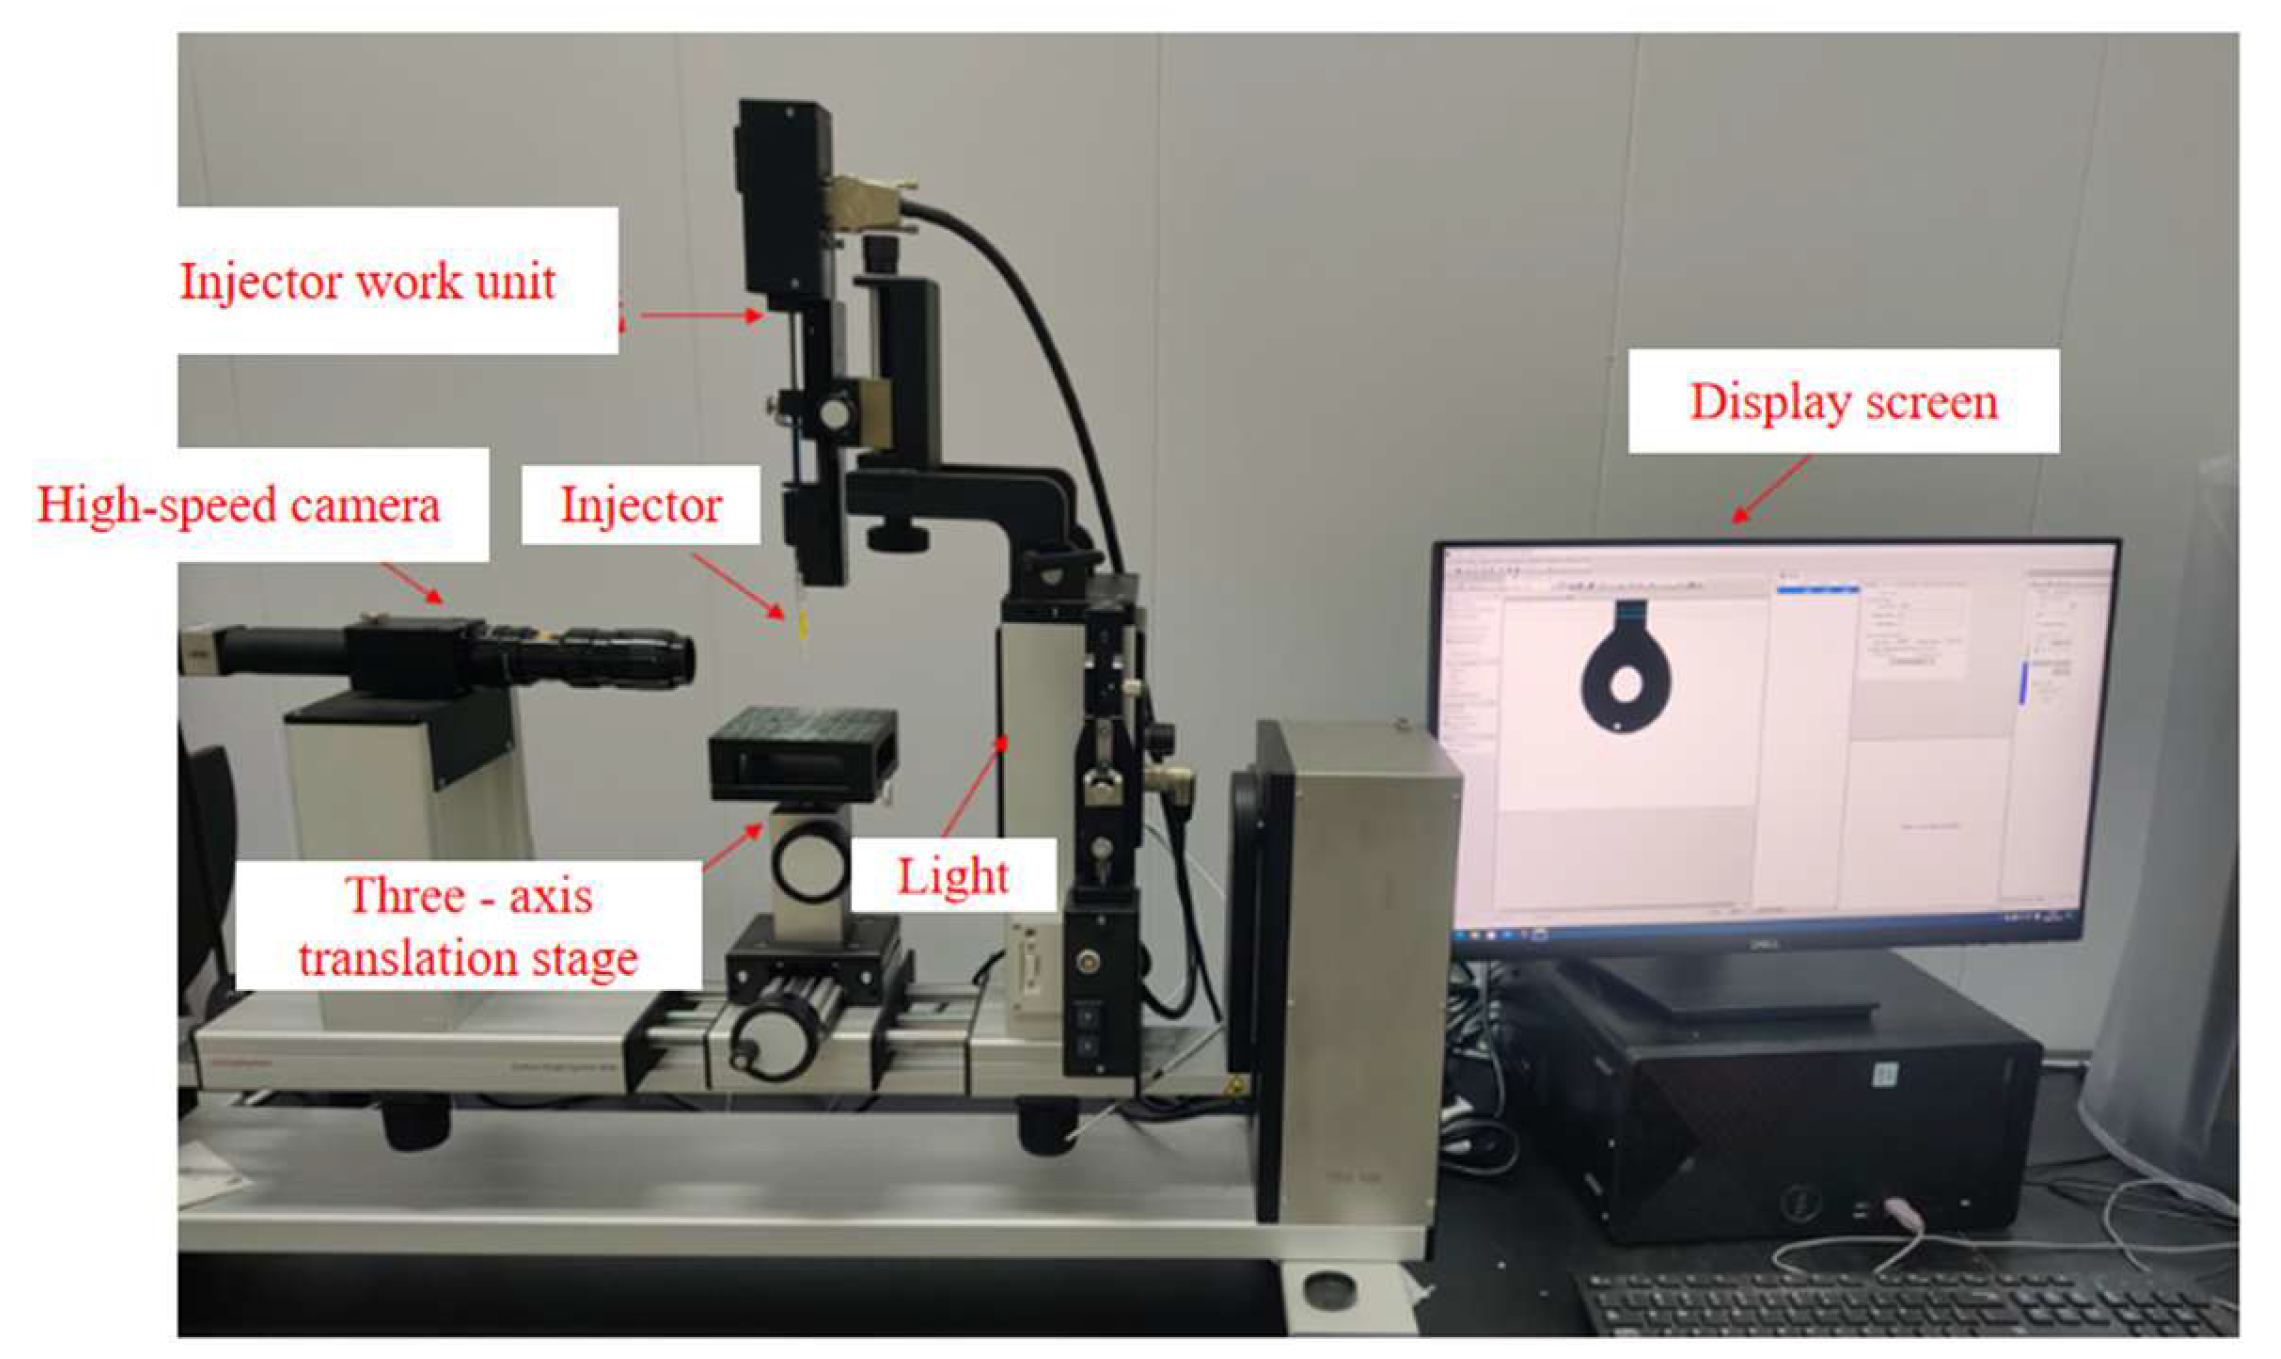
2.1. Experimental Facilities and Materials

Figure 1 illustrates the experimental setup, which integrates an air compressor (OTS-550 × 2, Taizhou Outstanding Industry and Trade Co., Ltd., Taizhou, Zhejiang, China) and a pressure vessel (ESS-XT, Spraying System Spray Systems Company, Shanghai, China) from the ESS XT spray system (with-standing 130 psi (0.896 MPa), including one-way liquid flow tubes. Pressure was controlled by a regulator valve (SMC AR-3000, SMC China Co., Shanghai, China; the precision of the regulator valve is 0.02 MPa). A high-speed camera (Olympus Co., Shinjuku-ku, Tokyo, Japan) and a macro-lens (Tokina Macro 100 F2.8 D, Olympus Co., Shinjuku-ku, Tokyo, Japan) were employed for visualization experiments. To achieve uniform illumination, an OSRAM64575 background light source (max. 33,000 lm) was positioned behind the measurement plane, coupled with a diffuser to transform the point source into a homogeneous surface source. A handheld computer display interfaced with the camera facilitated parameter adjustments and real-time image preview.
The air-induction nozzle (ID-120-03, Lechler Inc., Metzinge, Germany) was selected to produce an air-induction spray are shown in Table 1. Three commonly used pesticide formulations, namely, an oil-based emulsion, suspension, and aqueous solution, were selected as the spraying liquids. The concentrations of the pesticide formulation were set as 0.02%, 0.1%, and 0.5%, respectively. These concentrations reflect common agricultural spraying practices.
In the experiments, three typical pesticide preparations were utilized: oil-based emulsion, suspension, and aqueous solutions. The oil-based emulsion was formulated using water and Butachlor (Jiangsu Lvlai Co., Ltd., Suzhou, Jiangsu, China), a commonly employed emulsifiable herbicide for weed control. The suspension preparation was created with water and Atrazine (Qiaochang Modern Agriculture Co., Ltd., Binzhou, Shandong, China), a widely used suspension herbicide. The aqueous solution was made by combining water and Glufosinate (Hebei Zhongbao Lvnong Crop Technology Co., Ltd., Langfang, Hebei, China), which is a selective systemic herbicide.
To correspond with the typical concentration range (≤1%) in agricultural spraying, the pesticide preparations were formulated at concentrations of 0.02%, 0.1%, and 0.5%. The surface tensions of these solutions were determined using the pendant drop method with an OCA optical contact angle goniometer (Model OCA25, Dataphysics GmbH, Stuttgart, Germany) are shown in Figure 2. For each liquid preparation, multiple measurements were carried out, and the average value was utilized as the final surface tension, which is shown in Table 2.

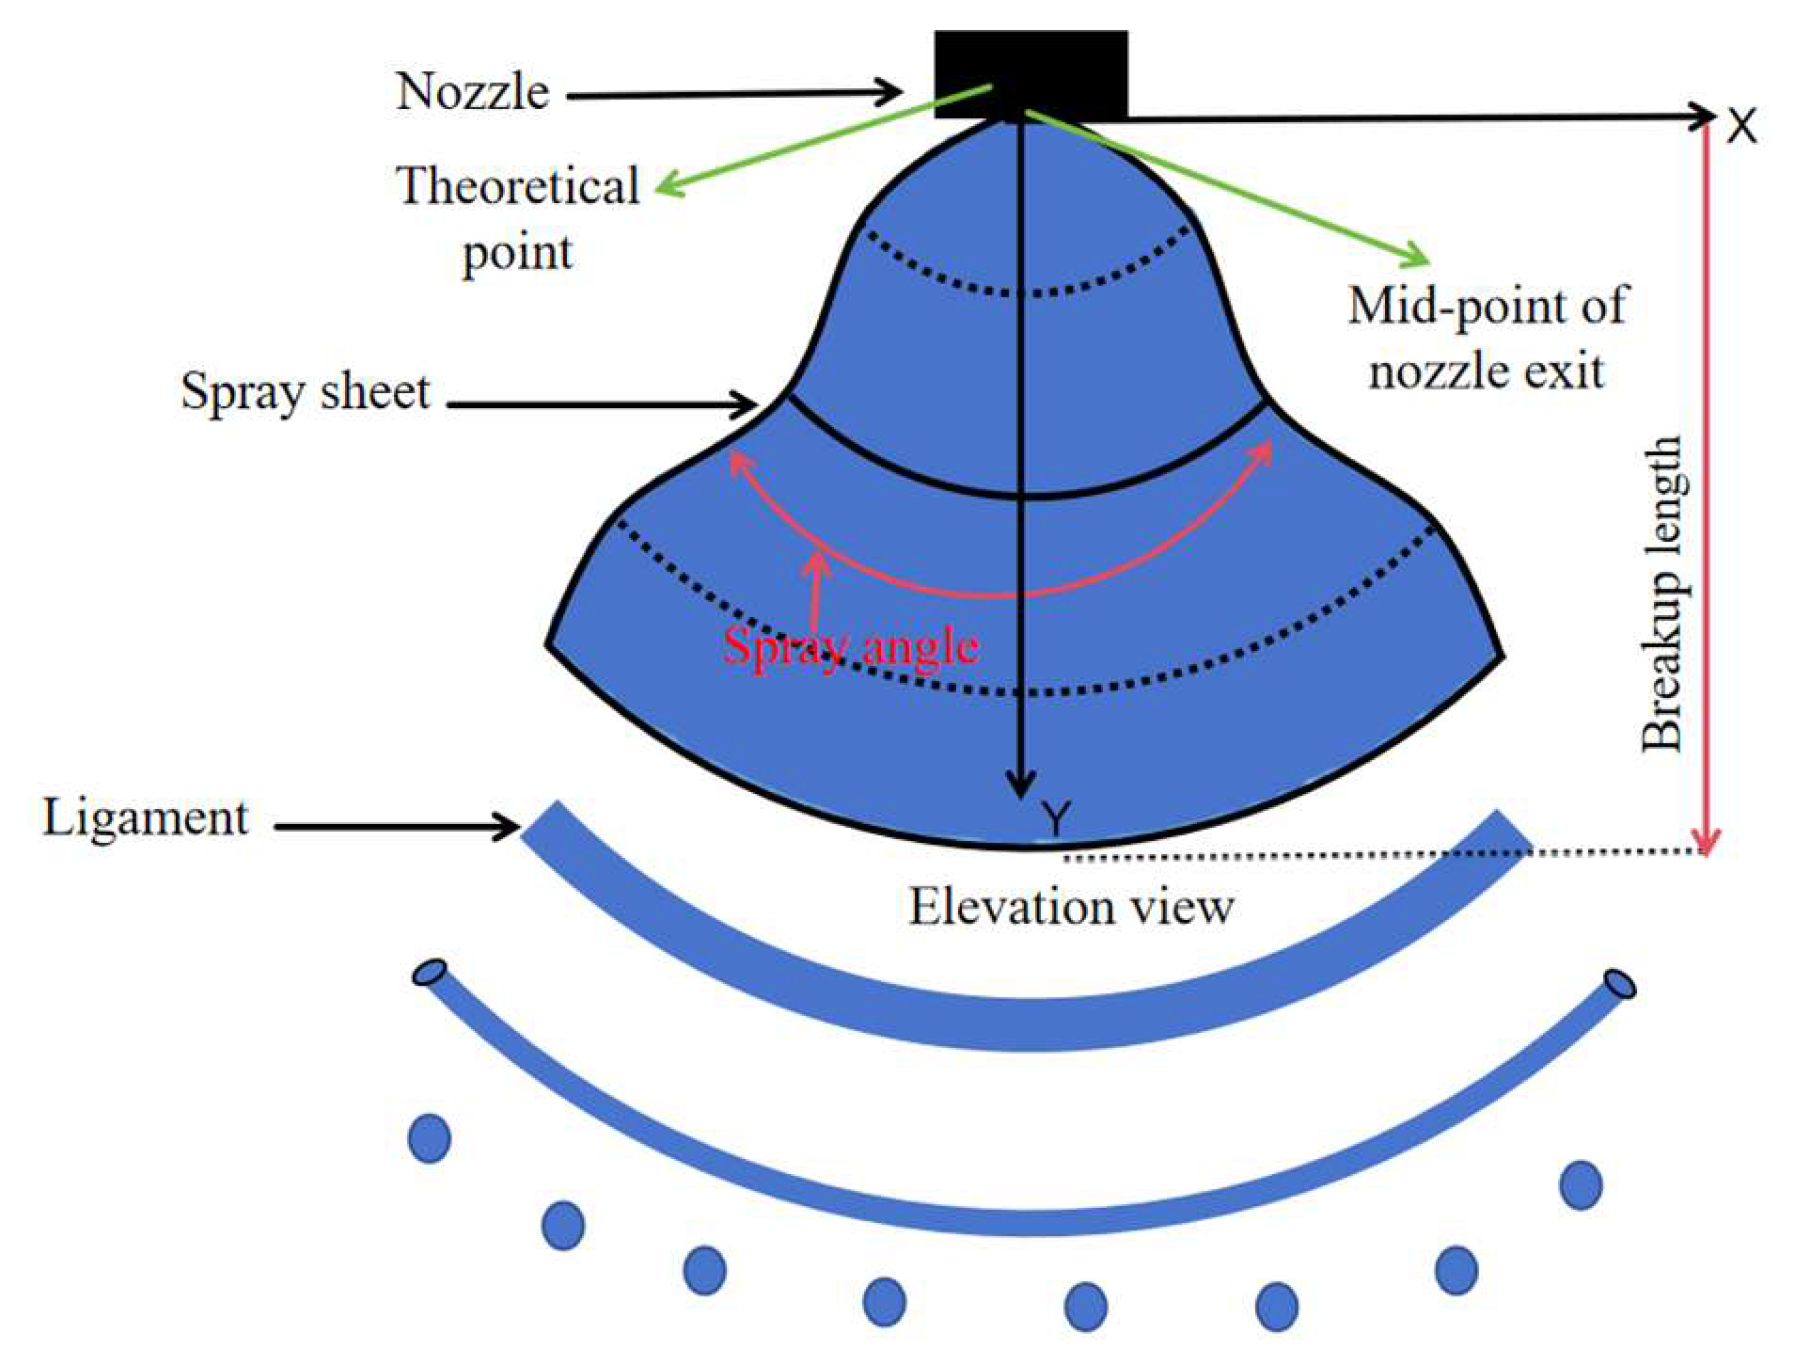
2.2. Capturing of Liquid Sheet

As shown in Figure 3, the nozzle outlet center is defined as the origin of all coordinates, with the horizontal direction (lateral) as the X-direction and the vertical downward direction (flow) as the Y-direction. High-speed photography is used to capture spray images at different Y distances to analyze droplet size and spray angle. To capture clear transient spray structures, camera parameters are adjusted based on preliminary experiments: exposure time is set to 2.16 μs, aperture to F2.8, lens focal length to 100 mm, frame rate to 2000 f/s, and the time interval between frames is 0.5 ms. The image resolution is 1280 × 1024 pixels. Before the experiment, the actual length of the nozzle was measured with a ruler. The pixel length of the nozzle in the images is measured using the commercial image analysis software Image Pro Plus 8.0 (Meyer Instruments, Houston, TX, USA). The ratio of the actual length to the pixel length is defined as the scale factor. Spray angle, a key factor in deposition and spray area, determines the efficiency. As Figure 3 shows, this angle is measured by drawing two green lines along the spray sheet edges, with their included angle defined as the spray angle, originating from a theoretical source point. Given the transient nature of atomization, to minimize measurement errors, 100 spray images, spaced 10 frames apart, are captured under different conditions. The average of these angles is taken as the spray angle for each condition.

3. Results and Discussion

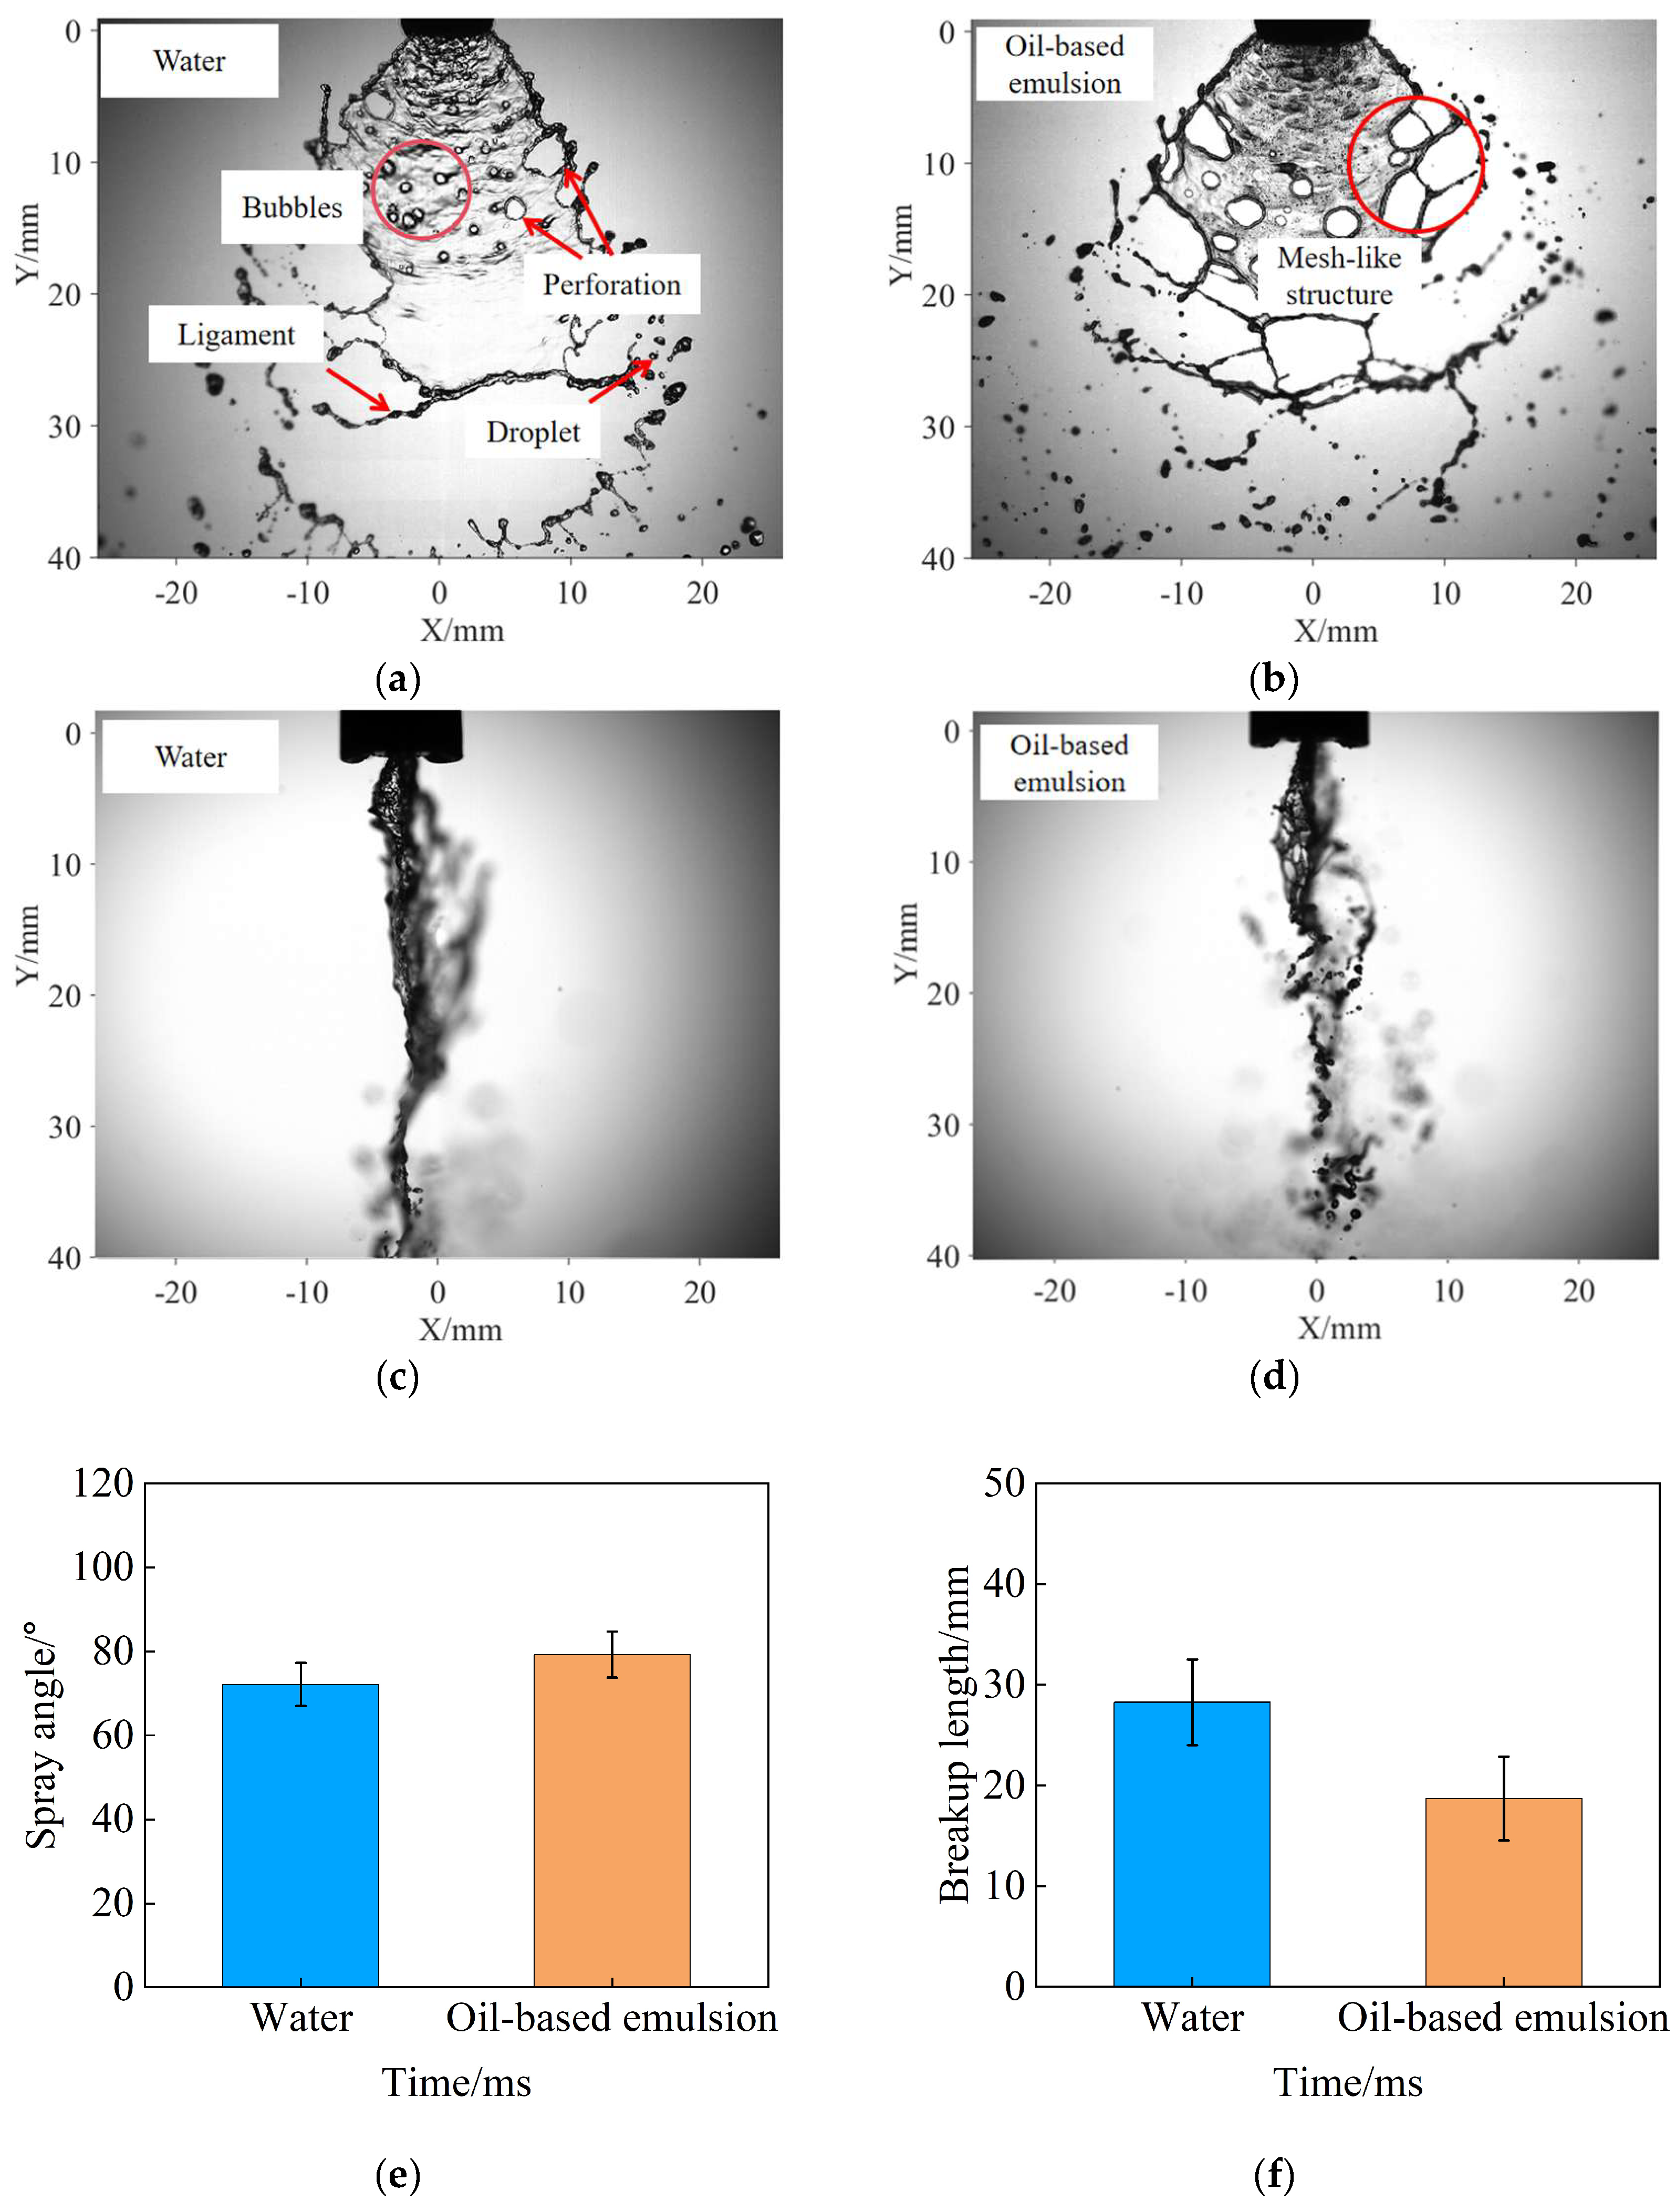
3.1. Spray Angle and BREAKUP Characteristics of Air-Induction Sprays Under Oil-Based Emulsion Conditions

Figure 4a,b shows typical liquid sheet images for both water and oil-based emulsion sprays. For water sprays, bubbles are noticeably present on the liquid sheet, accompanied by the formation of large-sized perforation structures, which further atomize into ligaments or droplets of varying sizes. “Thick finger-like” structures appear at the edges of the liquid sheet. In contrast, the oil-based emulsion spray exhibits much smaller bubbles on the liquid sheet, along with many black spots and perforation structures. However, the perforations are smaller than those in water sprays. Unlike water sprays, a mesh-like structure is the main breakup mode for oil-based emulsion sprays, and no “finger-like” structures form at the edges of the liquid sheet.
From the spray images, it is evident that the length of the oil-based emulsion liquid sheet is shorter than that of the water spray, indicating earlier breakup of the oil-based emulsion spray and droplet formation closer to the nozzle outlet. The spray angles (Figure 4c,d) and breakup lengths (Figure 4e,f) of the water and oil-based emulsion sprays were measured based on the liquid sheet images. The average spray angles for water and oil-based emulsion sprays were 72.17°and 79.19° (with standard deviations of 5.06 and 5.54, respectively). The average breakup lengths were 28.25 mm and 18.71 mm (with standard deviations of 2.77 and 1.63, respectively). During the atomization process, fluctuations in spray angles and breakup lengths occurred within a certain range. Compared with the water spray, the spray angle of the oil-based emulsion spray increased by about 9.73%. The breakup length of the oil-based emulsion liquid sheet was significantly reduced by about 33.77%. The addition of butachlor emulsifiable oil significantly altered the properties of the spray solution, reducing the surface tension by 40.68%. The presence of oil droplets in the emulsion significantly reduced the bubble size, and the liquid sheet breakup was mainly characterized by a mesh-like structure. Similar to the breakup of a standard flat-fan liquid sheet, oil-based emulsion sprays tend to break up earlier than water sprays.
Under the test conditions, small bubbles (with a diameter < 100 μm) became more prominent. At all oil-based emulsion concentrations, perforations and mesh-like structures existed on the liquid sheet. The average bubble sizes were 113.98 μm, 102.03 μm, and 87.02 μm for concentrations of 0.02%, 0.1%, and 0.5%, respectively. The bubble size decreased as the oil-based emulsion concentration increased, as shown in Figure 5. This was mainly because the number of oil droplets per unit in the spray solution increased with concentration, enhancing the rupture of bubbles. The oil-based droplets in the emulsion have a significant ability to destroy bubbles and are also known as antifoaming agents.
Figure 6 shows the spray angles and breakup lengths of oil-based emulsion spray sheets at different concentrations. At a spray pressure of 0.1 MPa and oil-based emulsion concentrations of 0.02%, 0.1%, and 0.5%, the spray angles were 77.41°, 79.19°, and 79.87°, respectively (with standard deviations of 4.92, 5.54, and 4.25). The increase in oil-based emulsion concentration did not significantly increase the spray angle. However, the decreased surface tension due to higher emulsion concentration allowed for greater lateral sheet extension, thus slightly increasing the spray angle. The breakup lengths of the oil-based emulsion liquid sheet were measured as 21.29 mm, 18.71 mm, and 17.47 mm for concentrations of 0.02%, 0.1%, and 0.5%, respectively (with standard deviations of 1.83, 1.63, and 1.69). Unlike the spray angle, the breakup length significantly decreased with increasing emulsion concentration. As the emulsion concentration increased, so did the number of oil droplets in the spray solution, causing earlier sheet breakup and reducing the breakup length.
Based on the experimental results, it is found that oil-based emulsion sprays have distinct spray angle traits compared to water sprays. Under the same spray pressure, oil-based emulsion sprays have shorter liquid sheet breakup lengths and larger spray angles than water sprays. We believed that the presence of oil droplets in the emulsion solution was responsible for the difference in atomization characteristics. As shown in Figure 7, a hypothesis is proposed here. The side-view image of a liquid sheet was illustrated.
Figure 7a shows the process of oil drops acting on bubbles. In the liquid sheet, a local thin liquid layer between the bubble and the sheet boundary. This thin layer facilitates the oil drops within the layer to reach the gas–liquid interface more easily. After reaching this interface, oil drops spread due to the Marangoni effect, caused by a surface tension gradient between two fluid interfaces. Here, the driving force for this spread comes from the surface tension gradient at the gas–liquid interface, related to the presence of oil drops. As shown in process ① of Figure 7b, this driving force creates a viscous shear stress, causing local flow of liquid. As the liquid flows, the sheet layer in contact with the oil drops gradually thins, pulling the bubbles toward the gas–liquid interface. The diffusion of oil drops can lead to two outcomes, depending on the strength of the Marangoni effect. The first occurs when the Marangoni effect is strong enough.
As shown in process ② in Figure 7b, when bubbles reach the liquid sheet boundary layer, they may be torn. Note that multiple oil drops may exist in the layer between the bubble and the liquid sheet interface. Consequently, the diffusion process of oil drops may repeat several cycles until the layer is torn. Second, if the Marangoni effect is limited and cannot trigger the collapse and rupture of the liquid layer, the diffusion of oil drops can still drive the movement of bubbles towards the gas–liquid interface. As indicated in process ③ in Figure 7b, when the bubble moves to the liquid sheet interface, the tiny oil drops in the spray solution also move and form a thin layer containing oil drops. Eventually, due to the gradual thinning of the thin layer, its thickness will decrease until it is minimized, and rupture may occur in this case.
Oil drops not only affect bubble size but also directly impact liquid sheet breakup. Figure 7c illustrates the direct effect of oil drops on the liquid sheet, excluding bubble involvement. Initially, oil drops in the spray solution enter the gas–liquid interface as the liquid sheet thins during the expansion of the liquid sheet (process ① to ②). Once an oil droplet reaches the interface, the oil drops spread due to the Marangoni effect, caused by surface tension gradients. This spreading induces a viscous shear stress, leading to liquid flow and further thinning of the liquid layer.
At process ③, two scenarios may occur. In the first scenario (process ④), oil drop deformation and hydrophobic surfaces create inward-facing “oil bridges” at the thinnest part of the liquid sheet. These bridges generate capillary pressure imbalances, leading to radial stretching and the formation of an unstable oil-based sheet. The rupture of these sheets causes overall liquid sheet breakup or perforation, known as the “bridging-stretching” mechanism [27]. This mechanism hinges on oil drop deformation. The second scenario (process ⑤) involves the formation of “oil bridges” between liquid sheets, where oil drops’ hydrophobic surfaces cause dewetting. Deformed oil drops take on a convex lens shape. During “bridging-dewetting”, oil drops must deform upon entering the first interface but not during dewetting. If deformation occurs during dewetting, the “bridging-stretching” process (process ④) happens instead. The specific process depends on oil drop deformation and dewetting rates.

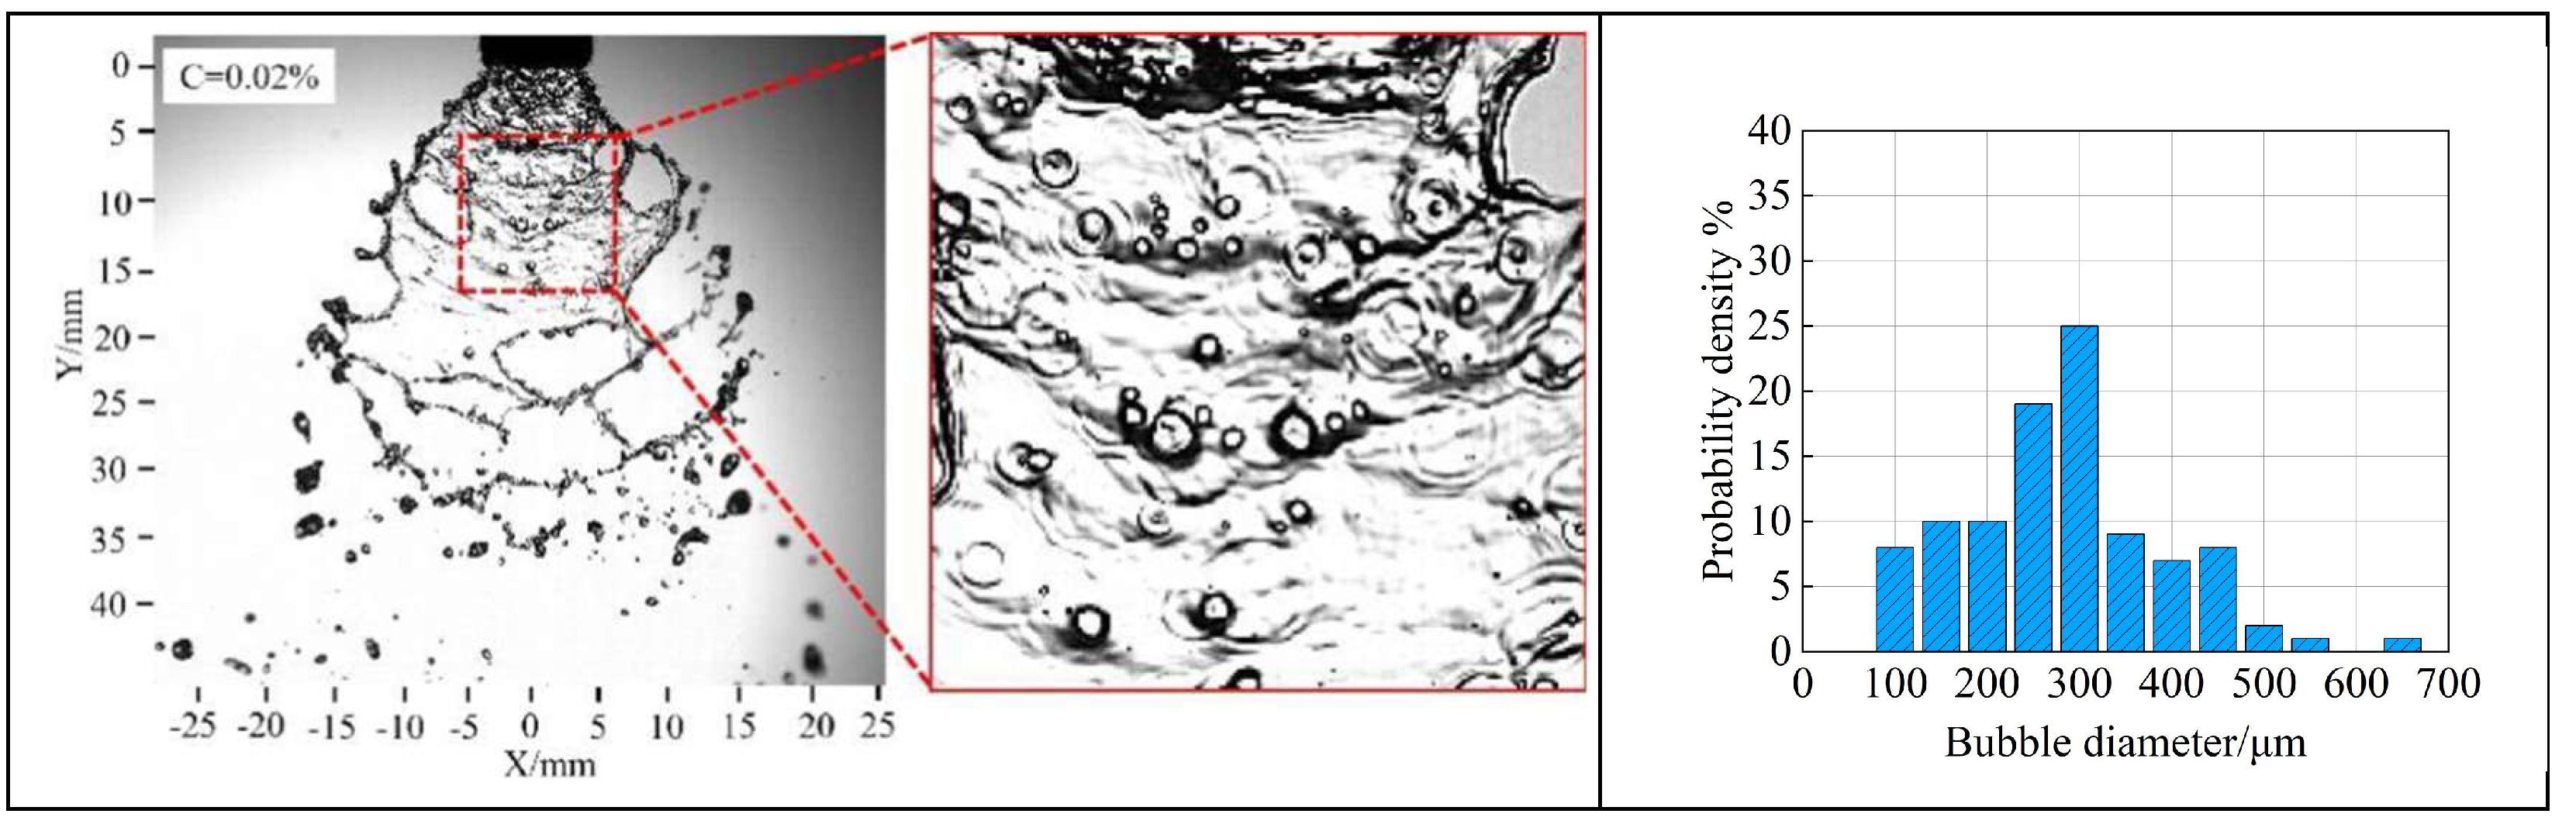
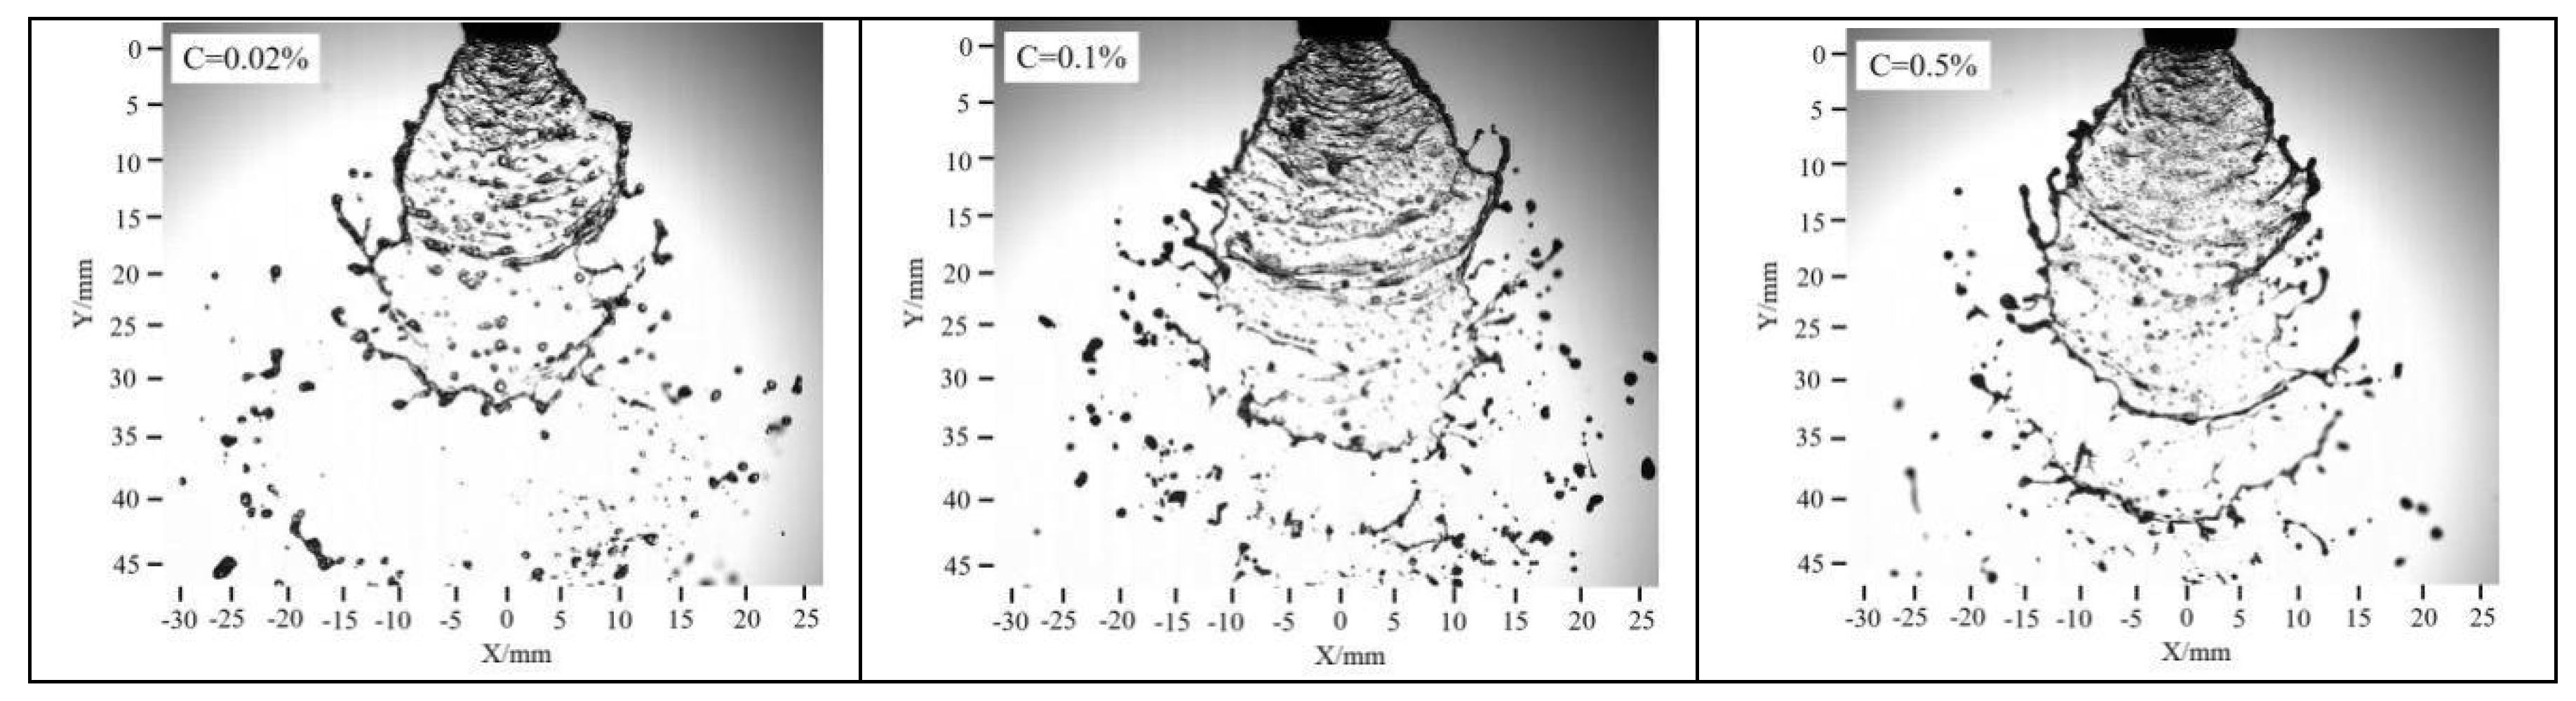
3.2. Spray Angle and Breakup Characteristics of Air-Induction Sprays Under Suspension Agent Conditions

Figure 8 presents the liquid sheet atomization images and bubble size distributions of the suspension solution. First, the small particles in the suspension solution do not alter the spray breakup pattern. By comparing and analyzing the atomization images captured via high-speed photography, the liquid sheet atomization and breakup structure of the suspension solution resembles that of water sprays but is significantly different from oil-based emulsion sprays. The presence of solid particles in the solution also causes the rupture of bubbles in the liquid sheet and leads to the formation of perforations. At the three concentrations of 0.02%, 0.1%, and 0.5%, the average bubble sizes on the liquid sheet are 259.56 μm, 210.05 μm, and 179.79 μm, respectively. As shown in Table 2, when the concentration of suspension solution increases from 0.02% to 0.1% and 0.5%, there is no significant change in surface tension. The existence of solid particles in the solution may lead to the rupture of bigger bubbles. An increase in suspension concentration results in more solid particles in the solution. Both the liquid sheet images and the measurement results indicate that the increase in the number of solid particles enhances bubble rupture in the liquid sheet.
Figure 9 shows the spray angles and breakup lengths of liquid sheets at different suspension concentrations. At the concentrations of 0.02%, 0.1%, and 0.5%, the liquid sheet spray angles were 70.58°, 73.44°, and 78.13°, respectively (with standard deviations of 3.53, 3.32, and 3.72). The spray angle of the liquid sheet increases with the concentration of the suspension solution, but the rate of increase varies. When the concentration increases from 0.02% to 0.1% and 0.5%, the decrease in surface tension becomes more significant (51.04, 42.35, and 32.43), and so does the increase in spray angle (70.58°, 73.44°, and 78.13°). The change in surface tension is positively correlated with the change in spray angle. However, under a certain spray pressure and given nozzle, the increase in spray angle with solution concentration is also limited.
At concentrations of 0.02%, 0.1%, and 0.5%, the measured breakup lengths of the liquid sheet were 30.50 mm, 27.98 mm, and 26.43 mm, respectively (with standard deviations of 1.81, 1.39, and 1.11). The breakup length decreases as the solution concentration increases, consistent with the changes in the oil-based emulsion liquid sheet breakup length. As the suspension concentration increases, the content of solid particles in the solution also increases, intensifying the effects on the rupture of bubbles and liquid sheet breakup, ultimately causing an earlier breakup of the liquid sheet.
The solid particles in the suspension solution are hydrophobic solids that will not deform under the shear of atomization in this experiment. Their mechanism of action on the liquid sheet is similar to that of oil drops in the process ⑤ of Figure 7c but with differences. The hydrophobic particles do not deform when diffusing to the interface during atomization. On one hand, the squeeze of the hydrophobic particles on the liquid thin layer between bubbles thins the layer and causes the rupture of bubbles. On the other hand, the “bridging-dewetting” mechanism leads to liquid sheet breakup, consistent with the mechanism of hydrophobic solid particles causing bubble liquid sheet rupture. This ultimately reduces bubble size and causes earlier liquid sheet breakup.

3.3. Spray Angle and Breakup Characteristics of Air-Induction Sprays Under Aqueous Solution Conditions

Figure 10 presents the liquid sheet atomization images and bubble size distribution of the aqueous solutions. The liquid sheet appears smooth without perforations, and breakage occurs mainly at the edges, differing from water sprays, oil-based emulsion sprays, and suspension sprays. High-speed photography shows that most bubbles on the liquid sheet are stable, with some coalescence and rupture, but without causing liquid sheet breakage or perforation. This is closely related to the physicochemical properties of the spray solution.
At concentrations of 0.02%, 0.1%, and 0.5%, the average bubble sizes on the liquid sheet are 238.68 μm, 144.90 μm, and 123.02 μm, respectively. As shown in Table 2, the concentration changes in the aqueous solutions have a significant impact on the surface tension. As the concentration increases, the surface tension decreases, leading to smaller bubble sizes and more bubbles. When the concentration is 0.02%, the higher surface tension results in larger bubbles, with some small bubbles also present, leading to a wider bubble size distribution. As the concentration increases, the surface tension decreases, resulting in smaller bubbles, more bubbles, and a narrower bubble size distribution.
Figure 11 shows the spray angles and breakup lengths of liquid sheets at different aqueous solutions. At the concentrations of 0.02%, 0.1%, and 0.5%, the spray angles were 70.68°, 76.35°, and 79.74°, respectively (with standard deviations of 3.95°, 4.14°, and 4.09°). As the spray solution concentration increased (and surface tension decreased), the spray angle also increased under a certain spray pressure. The decrease in surface tension was consistent with the increase in spray angle.
At the concentrations of 0.02%, 0.1%, and 0.5%, the measured breakup lengths of the liquid sheet were 34.06 mm, 37.70 mm, and 40.70 mm, respectively (with standard deviations of 2.16 mm, 1.98 mm, and 2.14 mm). The breakup length increased as the solution concentration increased, which was opposite to the trends observed for oil-based emulsion and suspension sprays. This was mainly due to the different physicochemical properties of the solutions. Aqueous solutions contain no oil droplets or solid particles that can destroy bubbles and cause liquid sheet breakup. It is miscible with surfactants, which significantly reduce surface tension, and it stabilizes bubbles [28]. Surfactants form adsorbed monolayers at interfaces, reducing interfacial tension and creating surface tension gradients that induce Gibbs–Marangoni effects. This repairs locally thinned liquid sheets and stabilizes bubbles.

4. Conclusions

In this study, the characteristics of air-induction sprays under different pesticide formulations were investigated. The breakup length, spray angle, and bubble size of the spray sheet of different pesticide formulations were measured and discussed. The main conclusions are as follows:
(1)
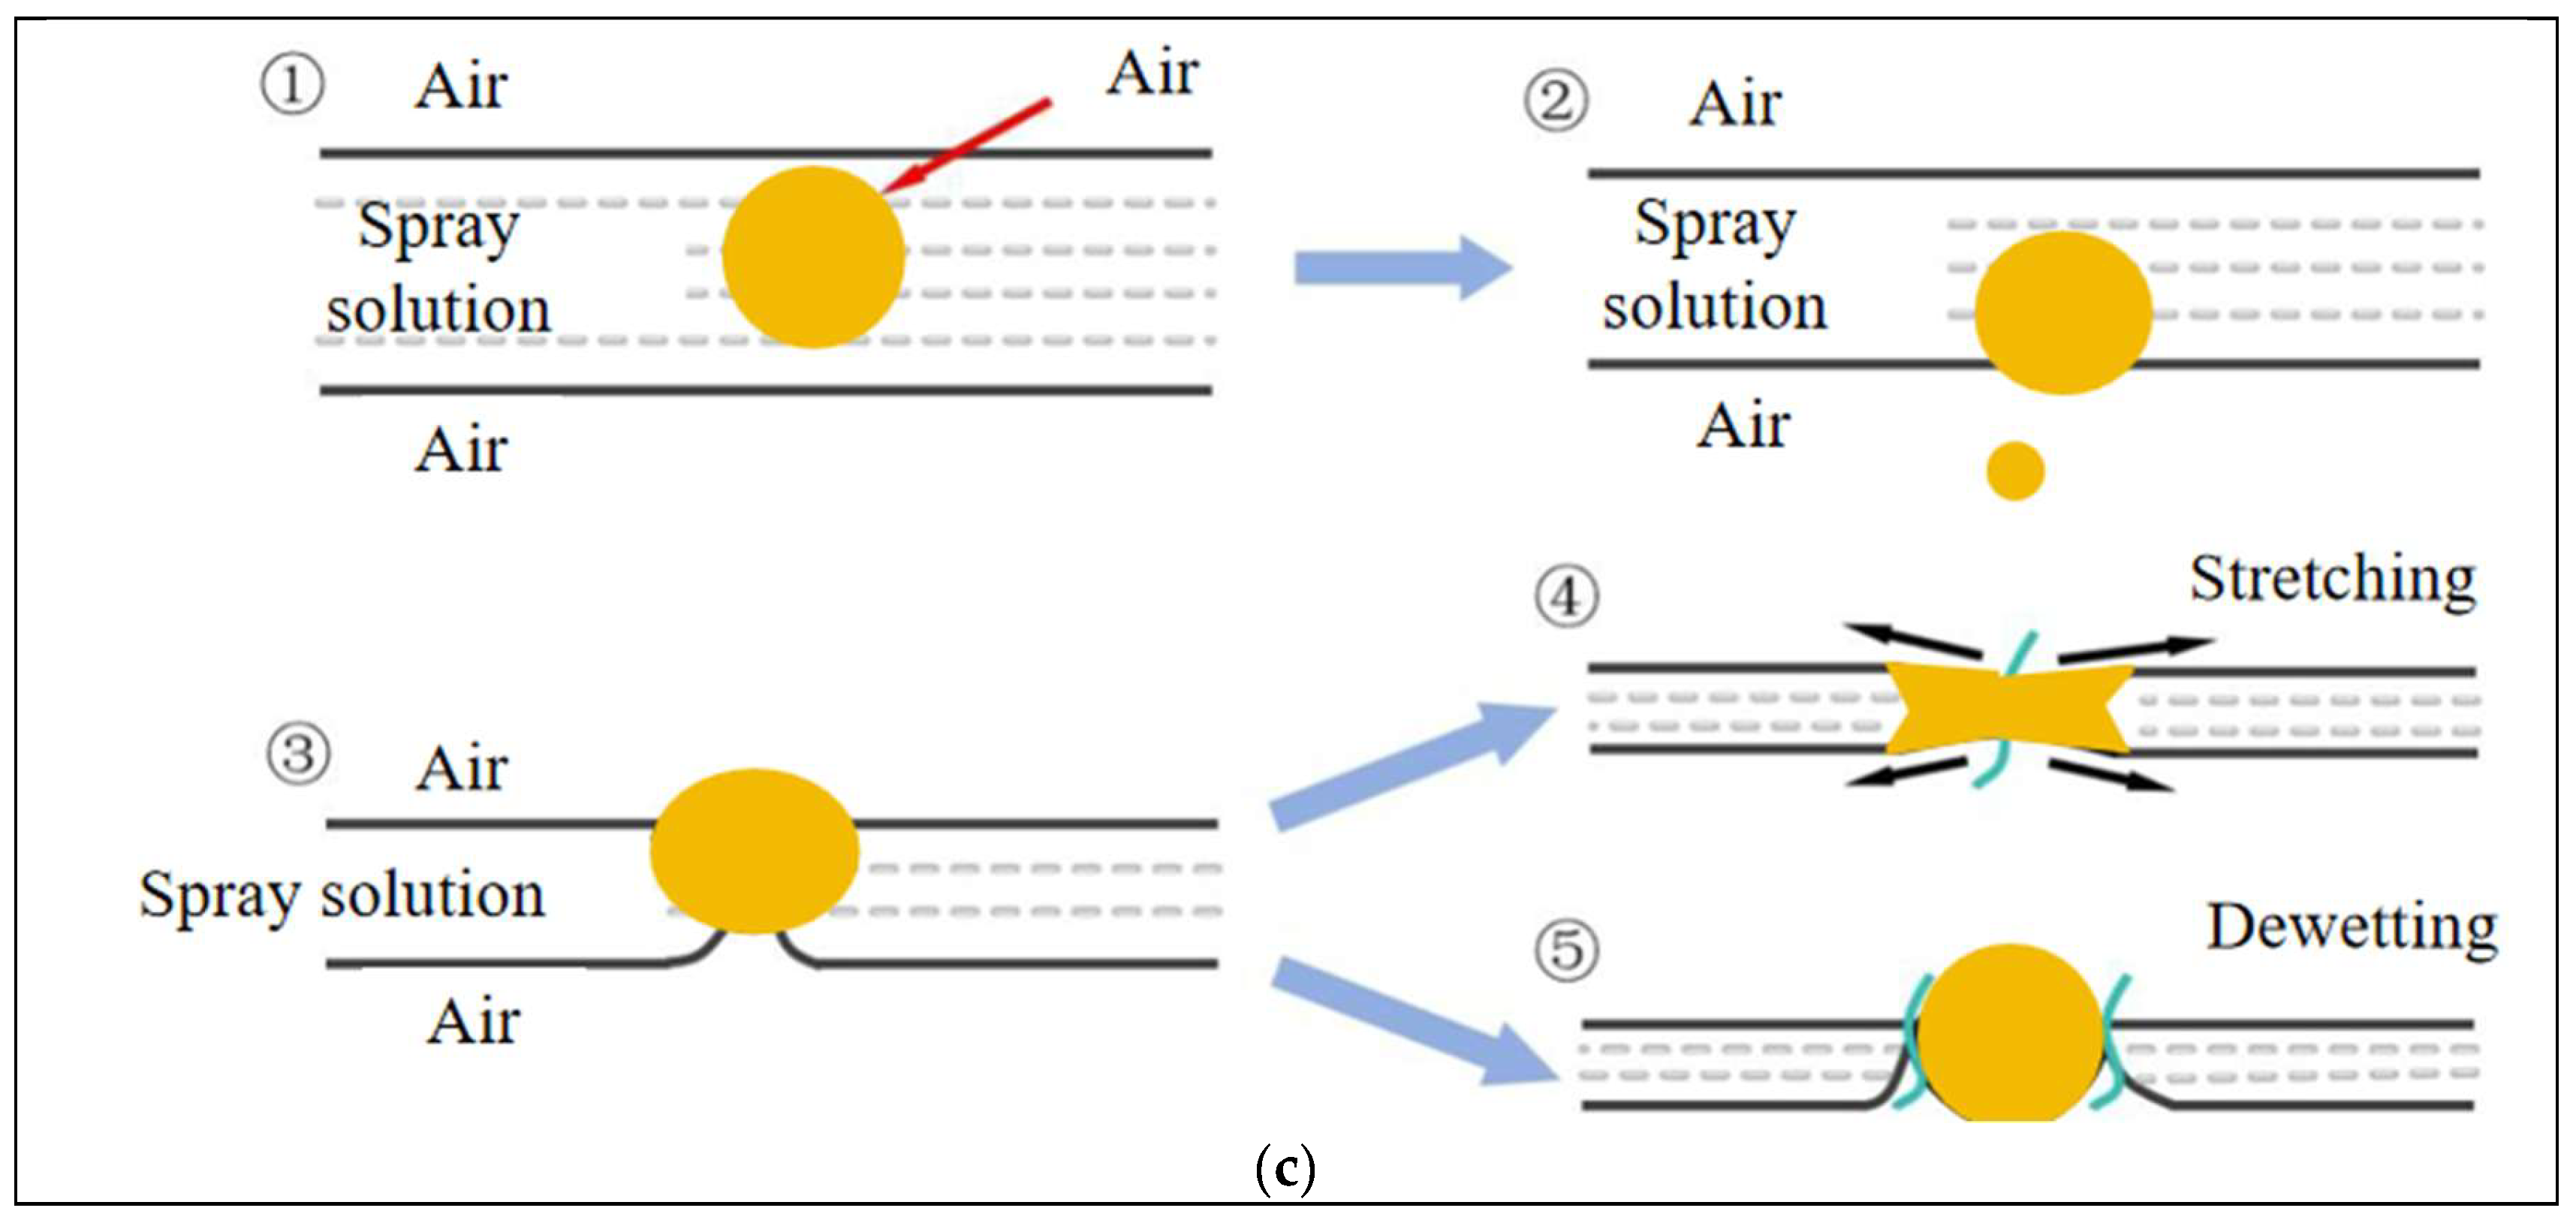
Oil-based emulsion solution reduces breakup length by about 33.77% compared to that of water air-induction spray. Oil-based emulsion also decreases the surface tension of the solution, increasing the spray angle by approximately 9.73%. We proposed that the oil drop in the oil-based emulsion contributes to the rupture of bubbles in the liquid sheet by tearing bubbles or moving them to the gas–liquid interface. Moreover, oil drops directly impact liquid sheet breakup through “bridging-stretching” or “bridging-dewetting” mechanisms.
(2)
For suspension sprays, surface tension decreases slightly with concentration, showing little difference from water at 0.02% and 0.1%. As the suspension concentration increases, more solid particles enhance rupture of bubbles and liquid sheet breakup, reducing average bubble size and breakup length while increasing small bubble count. The surface tension reduction also enlarges the spray liquid spray angle.
(3)
The surface tension of aqueous solutions decreases with concentration. This reduces average bubble size and increases bubble count. Surfactants in the solution lower surface tension, stabilize bubbles, and increase gas bubble formation. In aqueous solutions sprays, both the liquid sheet spray angle and breakup length increase with solution concentration.
(4)
Currently, our research on the characteristics of air-induction spray primarily relies on image-based methods. However, due to limitations in measurement accuracy and the limited number of images, certain measurement errors may occur. To address this issue, we believe future studies can focus on two aspects. The first is adopting more advanced high-speed imaging equipment to improve image resolution and increase the number of captured images. The second is employing alternative methods beyond image-based techniques to measure the characteristics of aspirated sprays.

Author Contributions

Methodology, C.G.; data acquisition, F.C.; writing—original draft preparation, M.Y.; writing—review and editing, C.K. All authors have read and agreed to the published version of the manuscript.

Funding

This research was funded by the National Natural Science Foundation of China (Nos. 51905220, 52311540154); Natural Science Foundation of Jiangsu Province, China (No. BK20231325); and A Project Funded by the Priority Academic Program Development of Jiangsu Higher Education Institutions (No. PAPD-2023-87).

Data Availability Statement

Data will be made available on request.

Acknowledgments

The authors thank the College of Agricultural Engineering of Jiangsu University for the experimental equipment.

Conflicts of Interest

The authors declare no conflicts of interest.

References

  1. Ma, J.; Liu, K.; Dong, X.; Huang, X.; Ahmad, F.; Qiu, B. Force and motion behaviour of crop leaves during spraying. Biosyst. Eng. 2023, 235, 83–99. [Google Scholar] [CrossRef]
  2. Qin, W.-C.; Qiu, B.-J.; Xue, X.-Y.; Chen, C.; Xu, Z.-F.; Zhou, Q.-Q. Droplet deposition and control effect of insecticides sprayed with an unmanned aerial vehicle against plant hoppers. Crop Prot. 2016, 85, 79–88. [Google Scholar] [CrossRef]
  3. Shen, Y.; Zhu, H.; Liu, H.; Chen, Y.; Ozkan, E. Development of a laser-guided, embedded-computer-controlled, air-assisted precision sprayer. Trans. ASABE 2017, 60, 1827–1838. [Google Scholar] [CrossRef]
  4. Ahmad, F.; Zhang, S.; Qiu, B.; Ma, J.; Xin, H.; Qiu, W.; Ahmed, S.; Chandio, F.A.; Khaliq, A. Comparison of Water Sensitive Paper and Glass Strip Sampling Approaches to Access Spray Deposit by UAV Sprayers. Agronomy 2022, 12, 1302. [Google Scholar] [CrossRef]
  5. Li, J.; Nie, Z.; Chen, Y.; Ge, D.; Li, M. Development of Boom Posture Adjustment and Control System for Wide Spray Boom. Agriculture 2023, 13, 2162. [Google Scholar] [CrossRef]
  6. Shi, Q.; Mao, H.; Guan, X. Numerical simulation and experimental verification of the deposition concentration of an unmanned aerial vehicle. Appl. Eng. Agric. 2019, 35, 367–376. [Google Scholar] [CrossRef]
  7. Zhang, C.; Zhai, C.; Zhang, M.; Zhang, C.; Zou, W.; Zhao, C. Staggered-Phase Spray Control: A Method for Eliminating the Inhomogeneity of Deposition in Low-Frequency Pulse-Width Modulation (PWM) Variable Spray. Agriculture 2024, 14, 465. [Google Scholar] [CrossRef]
  8. Ferguson, J.C.; Chechetto, R.G.; Adkins, S.W.; Hewitt, A.J.; Chauhan, B.S.; Kruger, G.R.; O’Donnell, C.C. Effect of spray droplet size on herbicide efficacy on four winter annual grasses. Crop Prot. 2018, 112, 118–124. [Google Scholar] [CrossRef]
  9. Liao, J.; Hewitt, A.J.; Wang, P.; Luo, X.; Zang, Y.; Zhou, Z.; Lan, Y.; O’Donnell, C. Development of droplet characteristics prediction models for air induction nozzles based on wind tunnel tests. Int. J. Agric. Biol. Eng. 2019, 12, 1–6. [Google Scholar] [CrossRef]
  10. Liao, J.; Luo, X.; Wang, P.; Zhou, Z.; O’Donnell, C.C.; Zang, Y.; Hewitt, A.J. Analysis of the Influence of Different Parameters on Droplet Characteristics and Droplet Size Classification Categories for Air Induction Nozzle. Agronomy 2020, 10, 256. [Google Scholar] [CrossRef]
  11. Wang, C.; Zeng, A.; He, X.; Song, J.; Herbst, A.; Gao, W. Spray drift characteristics test of unmanned aerial vehicle spray unit under wind tunnel conditions. Int. J. Agric. Biol. Eng. 2020, 13, 13–21. [Google Scholar] [CrossRef]
  12. Gong, C.; Li, D.; Yan, S.; Kang, C.; Ding, K. Relation between bubble behaviors in spray sheet and bubbly flow inside an air-induction fan nozzle: A visualization study. Phys. Fluids 2024, 36, 103362. [Google Scholar] [CrossRef]
  13. Abdelmotalib, H.M.; Dafsari, R.A.; Seung-Hwa, Y.; Lee, J. Computational study of internal flow characteristics of the air induction nozzle. Int. J. Mech. Sci. 2021, 204, 106578. [Google Scholar] [CrossRef]
  14. Butts, T.R.; Luck, J.D.; Fritz, B.K.; Hoffmann, W.C.; Kruger, G.R. Evaluation of spray pattern uniformity using three unique analyses as impacted by nozzle, pressure, and pulse-width modulation duty cycle. Pest Manag. Sci. 2019, 75, 1875–1886. [Google Scholar] [CrossRef] [PubMed]
  15. Post, S.L.; Hewitt, A.J. Flat-Fan Spray Atomization Model. Trans. ASABE 2018, 61, 1249–1256. [Google Scholar] [CrossRef]
  16. Post, S.L. Drift of Droplets from Air-Induction Nozzles. Trans. ASABE 2019, 62, 1683–1687. [Google Scholar] [CrossRef]
  17. Dafsari, R.A.; Yu, S.; Choi, Y.; Lee, J. Effect of geometrical parameters of air-induction nozzles on droplet characteristics and behaviour. Biosyst. Eng. 2021, 209, 14–29. [Google Scholar] [CrossRef]
  18. McArtney, S.J.; Obermiller, J.D. Comparative performance of air-induction and conventional nozzles on an axial fan sprayer in medium density apple orchards. Horttechnology 2008, 18, 365–371. [Google Scholar] [CrossRef]
  19. Miller, P.C.H.; Ellis, M.C.B. Effects of formulation on spray nozzle performance for applications from ground-based boom sprayers. Crop Prot. 2000, 19, 609–615. [Google Scholar] [CrossRef]
  20. Gong, C.; Li, D.; Kang, C. Visualization of the evolution of bubbles in the spray sheet discharged from the air-induction nozzle. Pest Manag. Sci. 2022, 78, 1850–1860. [Google Scholar] [CrossRef]
  21. Gong, C.; Li, D.; Kang, C.; Wang, Y. Visualisation of the evolution of perforations in oil-based emulsion sheets formed by flat-fan spray nozzles. Biosyst. Eng. 2021, 207, 68–80. [Google Scholar] [CrossRef]
  22. Hu, J.; Liu, C.; Wang, Z.; Li, Y.; Song, J.; Liu, Y.; Chu, X. Motion model for describing the quantity of air in droplets through changing the structure of air induction nozzle. Int. J. Agric. Biol. Eng. 2021, 14, 35–40. [Google Scholar] [CrossRef]
  23. Dorr, G.J.; Hewitt, A.J.; Adkins, S.W.; Hanan, J.; Zhang, H.; Noller, B. A comparison of initial spray characteristics produced by agricultural nozzles. Crop Prot. 2013, 53, 109–117. [Google Scholar] [CrossRef]
  24. Combellack, J.H.; Westen, N.M.; Richardson, R.G. A comparison of the drift potential of a novel twin fluid nozzle with conventional low volume flat fan nozzles when using a range of adjuvants. Crop Prot. 1996, 15, 147–152. [Google Scholar] [CrossRef]
  25. Yang, W.; Jia, W.; Ou, M.; Zhong, W.; Jiang, L.; Wang, X. Effect of Physical Properties of an Emulsion Pesticide on the Atomisation Process and the Spatial Distribution of Droplet Size. Agriculture 2022, 12, 949. [Google Scholar] [CrossRef]
  26. Yang, W.; Zhong, W.; Jia, W.; Ou, M.; Dong, X.; Zhang, T.; Ding, S.; Yu, P. The effect of oil-in-water emulsion pesticide on the evolution of liquid sheet rim disintegration and the spraying distribution. Crop Prot. 2024, 177, 106547. [Google Scholar] [CrossRef]
  27. Denkov, N.D.; Marinova, K.G.; Tcholakova, S.S. Mechanistic understanding of the modes of action of foam control agents. Adv. Colloid Interface Sci. 2014, 206, 57–67. [Google Scholar] [CrossRef]
  28. Ni, R. Deformation and Breakup of Bubbles and Drops in Turbulence. Annu. Rev. Fluid Mech. 2024, 56, 319–347. [Google Scholar] [CrossRef]
Figure 1. Schematic diagram of the experimental device and the actual nozzle.
Agronomy 15 00979 g001
Figure 2. Contact angle measuring device.
Agronomy 15 00979 g002
Figure 3. Schematic diagram of image capture.
Agronomy 15 00979 g003
Figure 4. Spray angle measurement schematic: (a) typical liquid sheet images for water; (b) typical liquid sheet images for oil-based emulsion; (c) side view of the liquid sheet for water; (d) side view of the liquid sheet for oil-based emulsion; (e) spray angle; (f) liquid sheet breakup lengths.
Agronomy 15 00979 g004
Figure 5. Image and size distribution of bubbles on the liquid sheet under different concentrations.
Agronomy 15 00979 g005
Figure 6. Spray angle and breakup length of liquid sheet under different concentrations.
Agronomy 15 00979 g006
Figure 7. Schematic diagram of action mechanism of oil droplets on atomized liquid sheet: (a) Oil droplet distribution schematic; (b) Bubble bursting schematic; (c) Schematic of liquid spray rupture;.
Agronomy 15 00979 g007aAgronomy 15 00979 g007b
Figure 8. Image and size distribution of bubbles on liquid sheet under different suspension concentrations.
Agronomy 15 00979 g008aAgronomy 15 00979 g008b
Figure 9. Spray angle and breakup length of liquid sheet under different oil-based emulsion concentrations.
Agronomy 15 00979 g009
Figure 10. Image and size distribution of bubbles on liquid sheet under different aqueous solution concentrations.
Agronomy 15 00979 g010aAgronomy 15 00979 g010b
Figure 11. The spray angles and breakup lengths of liquid sheets at different concentrations of aqueous solutions.
Agronomy 15 00979 g011aAgronomy 15 00979 g011b
Table 1. Main parameters of air induction nozzle.
Nozzle TypeLiquid Inlet Diameter
Dl/mm
Air Inlet
Diameter
Da/mm
V-Notch
Angle
a
Long Axis Diameter of Nozzle Outlet
DL/mm
Short Axis Diameter of Nozzle Outlet
DS/mm
ID120-031.291.54312.980.99
Table 2. Surface tension of different solutions.
Concentration/%0.02%0.1%0.5%
Butachlor51.04 ± 0.8542.35 ± 0.9832.43 ± 0.443
Atrazine69.43 ± 0.2464.22 ± 0.7848.78 ± 0.78
Glufosinate ammonium63.64 ± 1.7238.82 ± 0.6729.75 ± 0.25
Disclaimer/Publisher’s Note: The statements, opinions and data contained in all publications are solely those of the individual author(s) and contributor(s) and not of MDPI and/or the editor(s). MDPI and/or the editor(s) disclaim responsibility for any injury to people or property resulting from any ideas, methods, instructions or products referred to in the content.

