Article

Prediction of Drought Thresholds Triggering Winter Wheat Yield Losses in the Future Based on the CNN-LSTM Model and Copula Theory: A Case Study of Henan Province

1
School of Water Conservancy, North China University of Water Resources and Electric Power, Zhengzhou 450045, China
2
Henan Key Laboratory of Water Pollution Control and Rehabilitation Technology, Henan University of Urban Construction, Pingdingshan 467036, China
3
Zhengzhou Nongren Irrigation Technology Company Ltd., Zhengzhou 450045, China
*
Author to whom correspondence should be addressed.
Agronomy 2025, 15(4), 954; https://doi.org/10.3390/agronomy15040954
Submission received: 9 March 2025 / Revised: 9 April 2025 / Accepted: 11 April 2025 / Published: 14 April 2025
(This article belongs to the Section Water Use and Irrigation)

Abstract

:
As global warming progresses, quantifying drought thresholds for crop yield losses is crucial for food security and sustainable agriculture. Based on the CNN-LSTM model and Copula function, this study constructs a conditional probability framework for yield losses under future climate change. It analyzes the relationship between the Standardized Precipitation–Evapotranspiration Index (SPEI) and winter wheat yield, assesses the vulnerability of winter wheat in various regions to drought stress, and quantifies the drought thresholds under climate change. The results showed that (1) SPEI in Zhoukou, Sanmenxia, and Nanyang was significantly correlated with yield; (2) the drought vulnerability of southern and eastern was higher than that of center, western, and northern in the past (2000–2023) and future (2024–2047); (3) there were significant differences in drought thresholds. The yield loss of winter wheat below 30, 50, and 70 percentiles in southern and eastern (past/future) were −1.86/−2.47, −0.85/−1.39, and 0.60/0.35 (Xinyang); −1.45/−2.16, −0.75/−1.34, −0.17/−0.43 (Nanyang); −1.47/−2.24, −0.97/−1.61, 0.69/0.28 (Zhoukou); −2.18/−2.86, −1.80/−2.36, −0.75/−1.08 (Kaifeng), indicating that the drought threshold will reduce in the future. This is mainly due to the different climate and soil conditions in different regions of Henan Province. In the context of future climate change, droughts will be more frequent. Hence, the research results provide a valuable reference for the efficient utilization of agricultural water resources and the prevention and control of drought risk under climate change in the future.

1. Introduction

Climate change has profoundly influenced the environment [1], agriculture [2], and economy [3], making it a pivotal research subject in recent years [4,5,6,7]. This change has increased many drought parts [8]. As a complex global disaster, drought significantly threatens world food security [9]. Although some breakthroughs have been made in crop varieties [10] and irrigation management [11], the production and safety of crops are still highly dependent on climate change [12]. Therefore, it is essential to study the response of crop yield to climate change.
Numerous studies have revealed that drought influences crop growth [13,14], physiology [15], and structure [16], resulting in wheat yield loss. For example, drought can instigate alterations in temperature, while high temperature can destroy the cells of crop roots [17]. This disruption impairs the crop’s ability to allocate soil moisture effectively to counteract drought-induced water stress, thereby having a detrimental impact on crop yield. Although existing studies have explored the negative effects of drought on crop yield [18,19], there are still limitations in the potential relationship and predicting future risks of crop yield losses.
The relationship is multivariate, and most are nonlinear [20]. In order to clarify the potential relationship, the SPEI can assess the degree of drought, which has been widely applied [21,22,23,24]. In addition, as a large agricultural country [25], Henan Province is the main production area of winter wheat [26]. Therefore, this study will focus on the drought situation in Henan.
As we all know, the impact of drought on crops does not occur overnight but accumulates [27]. When the degree of drought reaches a particular critical value, crop yield will be lost. The critical value of drought degree corresponds to the level of crop yield loss called the drought threshold [28,29,30,31]. Some studies analyze the drought threshold and its impact on crops in different regions based on field experimental data [32,33,34]. These results have proved the practicability and reliability of the drought threshold in agricultural production. For example, Guo et al. (2023) [35] calculated the drought trigger thresholds of different vegetation losses in different regions of China during the growing season (May–September) to help study the response of terrestrial ecosystems to drought. Veettil et al. (2023) [36] also quantified South Carolina’s weekly drought thresholds based on classification and regression tree models, and the results revealed differences in drought thresholds in different climate zones. Most of the existing studies use historical data to evaluate the yield loss of crops under different drought levels at the county level [37]. However, few studies on the drought threshold at the provincial level accurately predict the future yield of crops and quantify the future drought-induced crop yield reduction. Therefore, future research on drought thresholds will help to adjust agricultural drought risk management measures promptly and increase crop yield.
The premise of quantifying the drought threshold is to predict winter wheat yield under future climate change accurately [38]. Existing approaches in drought-yield modeling rely heavily on manual field surveys, which are labor-intensive and limited in scale. For example, crop growth models such as DSSAT, APSIM, WOFOST, and PCSE, which depend on extensive crop growth data [39], can accurately simulate crop growth and interactions between climate and soil factors at the field scale. These models provide valuable guidance for production management and risk assessments. However, their application at larger scales is constrained by the spatial heterogeneity of soil properties, climate factors, crop parameters, and field management strategies, making large-scale deployment challenging [40,41]. Deep learning models are the most effective techniques compared to existing drought-yield modeling techniques and have been widely used in climate change analysis, land use and land cover change detection, and drought monitoring [42]. For example, recurrent neural network (RNN) [43], convolutional neural network (CNN) [44], and long short-term memory (LSTM) [45]. CNN can deeply identify the features of time series data and compress the features to improve the generalization ability and learning efficiency of the model. RNN has been used for yield prediction, but it is not enough to deal with long-interval time series data [46], while the LSTM model has long-term memory ability for time series prediction. Therefore, scholars have combined CNN and LSTM to extract spatio-temporal features in input data more effectively. The coupling model has been widely used, for example, the CNN-LSTM-SA model proposed by Pan et al. [47], which accurately mines the internal correlation in oil healthy production data; Zha et al. [48] used a combined CNN-LSTM model to predict gas field production effectively; Agga et al. [49] predicted short-term photovoltaic power generation using CNN-LSTM; Saini et al. [50] used this coupling model to predict sugarcane yield. These results show that the prediction accuracy of the CNN-LSTM combined model is better than that of the independent LSTM and CNN models. However, the idea of combining the model with the climate model [51,52] to simulate different climates in the future is novel. This study combines CNN-LSTM with Copula theory to accurately calculate the probability of drought occurrence in large-scale regions. This study will improve the accuracy of quantifying future drought thresholds through conditional probability. As one of the newer theories, the Copula conditional probability framework [53,54,55,56] helps capture multivariate characteristics in the meteorological field, especially in the nonlinear relationship between different random variables [57]. This method significantly improves the limitations of traditional techniques in representing nonlinear processes and adds a threshold to the drought index to distinguish the level of drought severity. The hybrid model, which is constructed by integrating the two elements of CNN and LSTM, can handle the complex process of drought occurrence. This method comprehensively solves most of the inherent problems in the process of drought occurrence, can accurately predict the probability of drought occurrence, and quantitatively analyzes various influencing factors.
Therefore, the climate data from 2024 to 2047 in the fully coupled atmosphere-ocean general circulation model (CMIP6-1) were input into the CNN-LSTM coupled model to simulate the winter wheat yield in each region of Henan Province in the future period (2024–2047) (SSP1-2.6). Then, a conditional probability framework was developed based on the Copula joint distribution function to quantify the drought trigger threshold of winter wheat yield loss under future climate change. In short, there are few articles on combining the CNN-LSTM deep learning model and the Copula conditional probability framework, and the ideas are relatively new. The objectives of this study are: (1) clarify the response relationship between winter wheat yield loss and drought; (2) comparing the drought vulnerability of winter wheat under different drought scenarios in different regions of Henan Province in historical and future periods; (3) quantify the drought threshold and its changes in winter wheat under different yield loss levels in various regions of Henan Province in the future. Significant differences in climate and soil characteristics in different regions may affect the study results. Therefore, the promotion and application of this study need to be adapted to local conditions, combined with local climate characteristics and agricultural practices to expand the scope of research, and finally, targeted promotion and application.

2. Materials and Methods
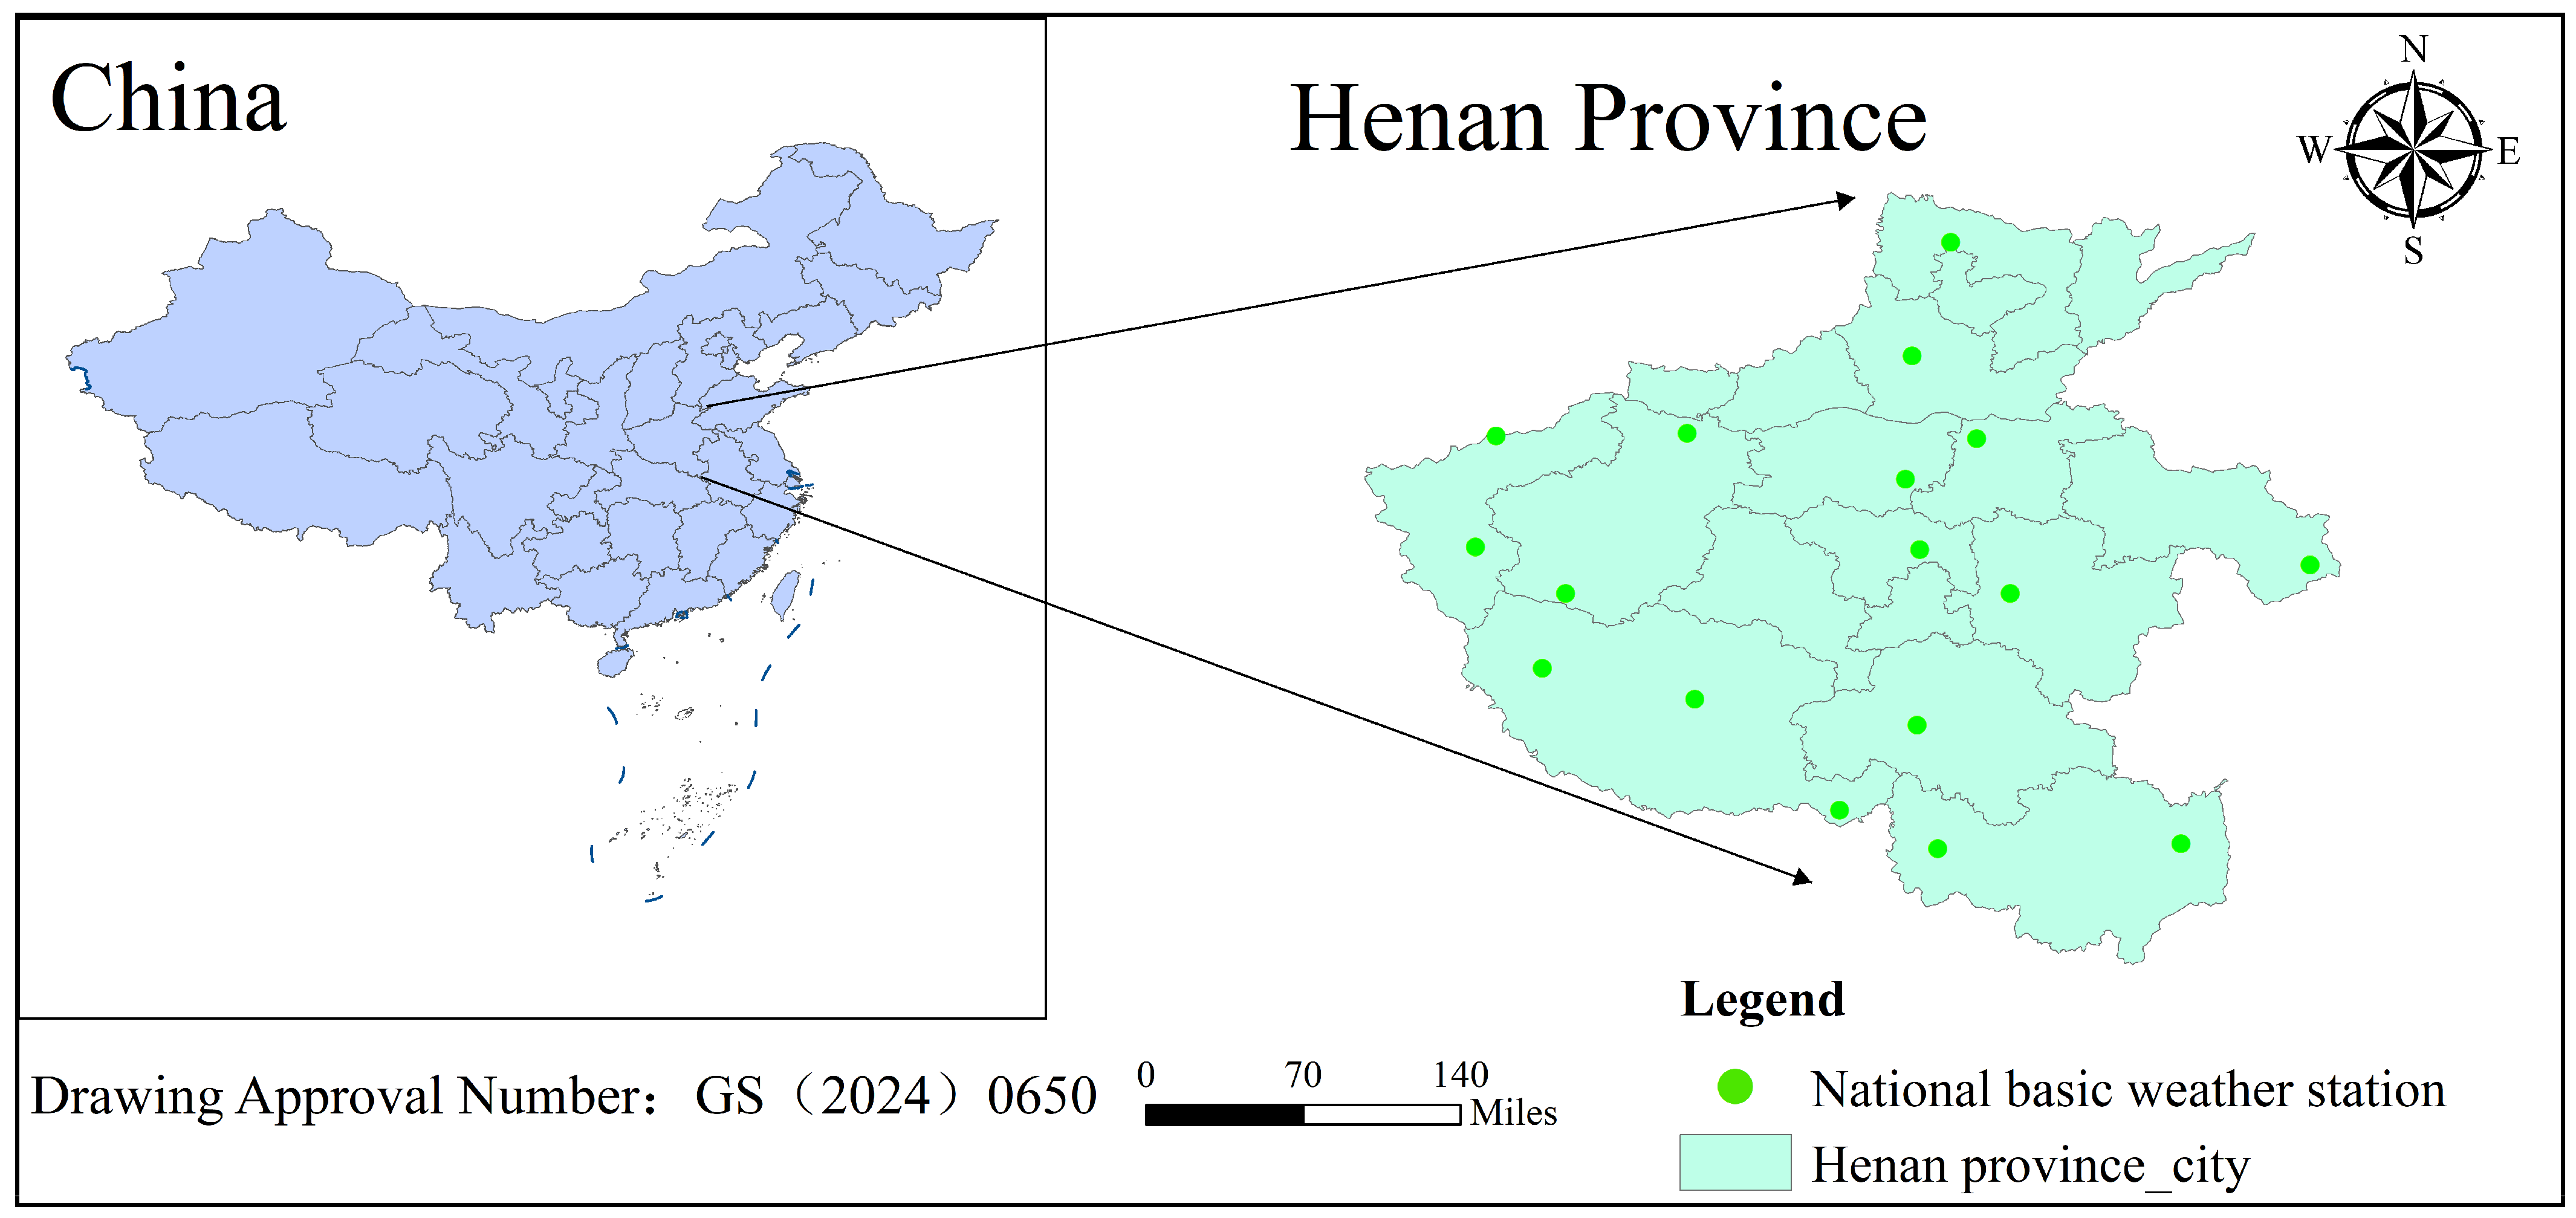
2.1. Study Area

The study selected the Henan Province of China as the research area (Figure 1). As a prominent grain-producing province, a central grain-producing area, and a core grain production area in China, Henan has a high grain output and a significant contribution to the country. It is crucial in the national grain production and supply and demand. Among them, wheat yield accounts for one-quarter of the country and is the main wheat-producing area in China. The wheat planting area is divided into the center, eastern, western, southern, and northern areas.

2.2. Data

2.2.1. Historical Climate Data

The meteorological element station observation data set of Henan Province includes the daily observation data of temperature, precipitation, relative humidity, wind speed, and sunshine hours of 18 national basic meteorological stations in Henan Province. The temperature includes average temperature, daily maximum temperature, and daily minimum temperature. Relative humidity includes average relative humidity and minimum relative humidity. The precipitation includes 20–8 o’clock precipitation (night), 8–20 o’clock precipitation (daytime), and 20–20 o’clock cumulative precipitation. Wind direction and wind speed include an average of 2 min wind speed, an average of 10 min wind speed, maximum wind speed, and maximum wind direction. Sunshine hours include sunshine hours and total solar radiation (calculated based on sunshine hours). The data set is from the National Meteorological Information Center of China Meteorological Administration (http://data.cma.cn, accessed on 20 July 2024). The statistical methods used in the development generally follow the national standard GB/T 34412-2017 [58]. The data used in this study are distributed in various prefecture-level cities in Henan Province from 1 January 2000 to 31 December 2023. The data format is CSV format, of which 32766 and 99999X represent data missing or no observation tasks. The key parameters, such as precipitation (mm), relative humidity (%), wind speed (m/s), maximum wind speed (m/s), average temperature (°C), maximum temperature (°C), minimum temperature (°C), and sunshine time, were selected in this study. This study uses data from 10 meteorological stations in five regions of Henan (Table S1). Two meteorological stations are selected in each region to represent two prefecture-level cities. Sites with missing data and no observation tasks should be replaced with adjacent site data in prefecture-level cities. Five adjacent national-level ground general meteorological observation stations with missing data were selected, and the inverse distance weighting method was used for interpolation to obtain missing data.

2.2.2. Future Climate Data

CMIP6 [59,60] is the sixth coupled model comparison program, a large-scale climate research project worldwide. It aims to coordinate and improve climate models and provide a scientific basis for predicting future climate change. In this study, the CNRM-CM6-1 model (Table S2), one of the core models of CMIP6, is selected. The Centre National de Recherches Météorologiques (CNRM) and the European Centre for Medium-Range Weather Forecasts (ECMWF) jointly developed the sixth-generation global climate system model. It aims to simulate the Earth’s climate system’s physical, chemical, and biological processes and provide scientific support for the IPCC Sixth Assessment Report (AR6). Based on the model, a shared socio-economic path (SSP) [61,62] scenario is selected, and the SSP1-2.6 (Table S3) represents the global assessment model that actively adopts climate policies to achieve low emissions and future sustainable development. This model obtains the daily meteorological observation data set of Henan Province for the period 2024–2047. The data set includes daily precipitation, maximum temperature, minimum temperature, and average wind speed, and multivariate deviation correction and downscaling are used. The process mainly involves spatial downscaling, distribution bias correction, and time downscaling. The specific processing method can be seen in Li and Babovic [63]. This method has been widely used in meteorological research.

2.2.3. Soil Data

Soil hydrological and characterization data were from the National Tibetan Plateau Scientific Data Center (https://data.tpdc.ac.cn, accessed on 24 July 2024). Soil hydrological data sets include soil type, temperature, water content, and field capacity. The data set is named A China Dataset of soil hydraulic parameters pedotransfer functions for land surface modeling (1980). These data use the soil conversion function to estimate soil hydrological parameters with sand, silt, clay, organic matter, and bulk density as input, including the parameters of the Clapp and Hornberger function and van Genuchten and Mualem function, field capacity, and wilting coefficient. Median and coefficient of variation (CV) provided estimates. The data set is a grid format with a resolution of 30 arc s. The vertical stratification of the soil is 7 layers, and the maximum thickness is 1.38 m (0–0.045, 0.045–0.091, 0.091–0.166, 0.166–0.289, 0.289–0.493, 0.493–0.829, 0.829–1.383) [64]. The time range of the data set is 18 December 1980–18 January 1981, and the geographical range is China. The data are stored in NetCDF format and can be viewed by Arcgis version 10.8.2.

2.2.4. Yield Data of Winter Wheat

The winter wheat yield data and sown area were derived from the statistical yearbook of the Henan Provincial Bureau of Statistics (https://tjj.henan.gov.cn/tjfw/tjcbw/tjnj/, accessed on 11 August 2024) from 2001 to 2024, based on the prefecture-level cities where the 10 national basic meteorological stations in this study are located. The data set of winter wheat production is provided by the Agricultural Survey Office and the Rural Survey Office of the Henan Investigation Corps of the National Bureau of Statistics, according to the relevant data of the Agriculture, Forestry, Animal Husbandry and Fisheries Statistical Reporting System. The crop planting area comes from the Henan Provincial Department of Natural Resources. The statistical yearbook yields data in units of 10,000 tons, and the planting area is in thousands of hectares. Based on the different planting areas of winter wheat in various regions of Henan Province, this study uses kg/ha to represent crop production. Winter wheat yield in each prefecture-level city may be affected by many factors, mainly climatic factors (precipitation, temperature, and other factors) and agronomic factors (irrigation, fertilization, pest management, and other factors). In this study, detrended yield was used to exclude the influence of long-term non-climatic factors (such as key agricultural factors, such as variety renewal, irrigation technology progress, fertilization, and pest management measures) from actual yield data to focus more on the analysis of the relationship between meteorological conditions and yield. Winter wheat is generally harvested from October of the current year to early June of the following year. Its growth period is divided into three processes: sowing to tillering, overwintering, and maturing.

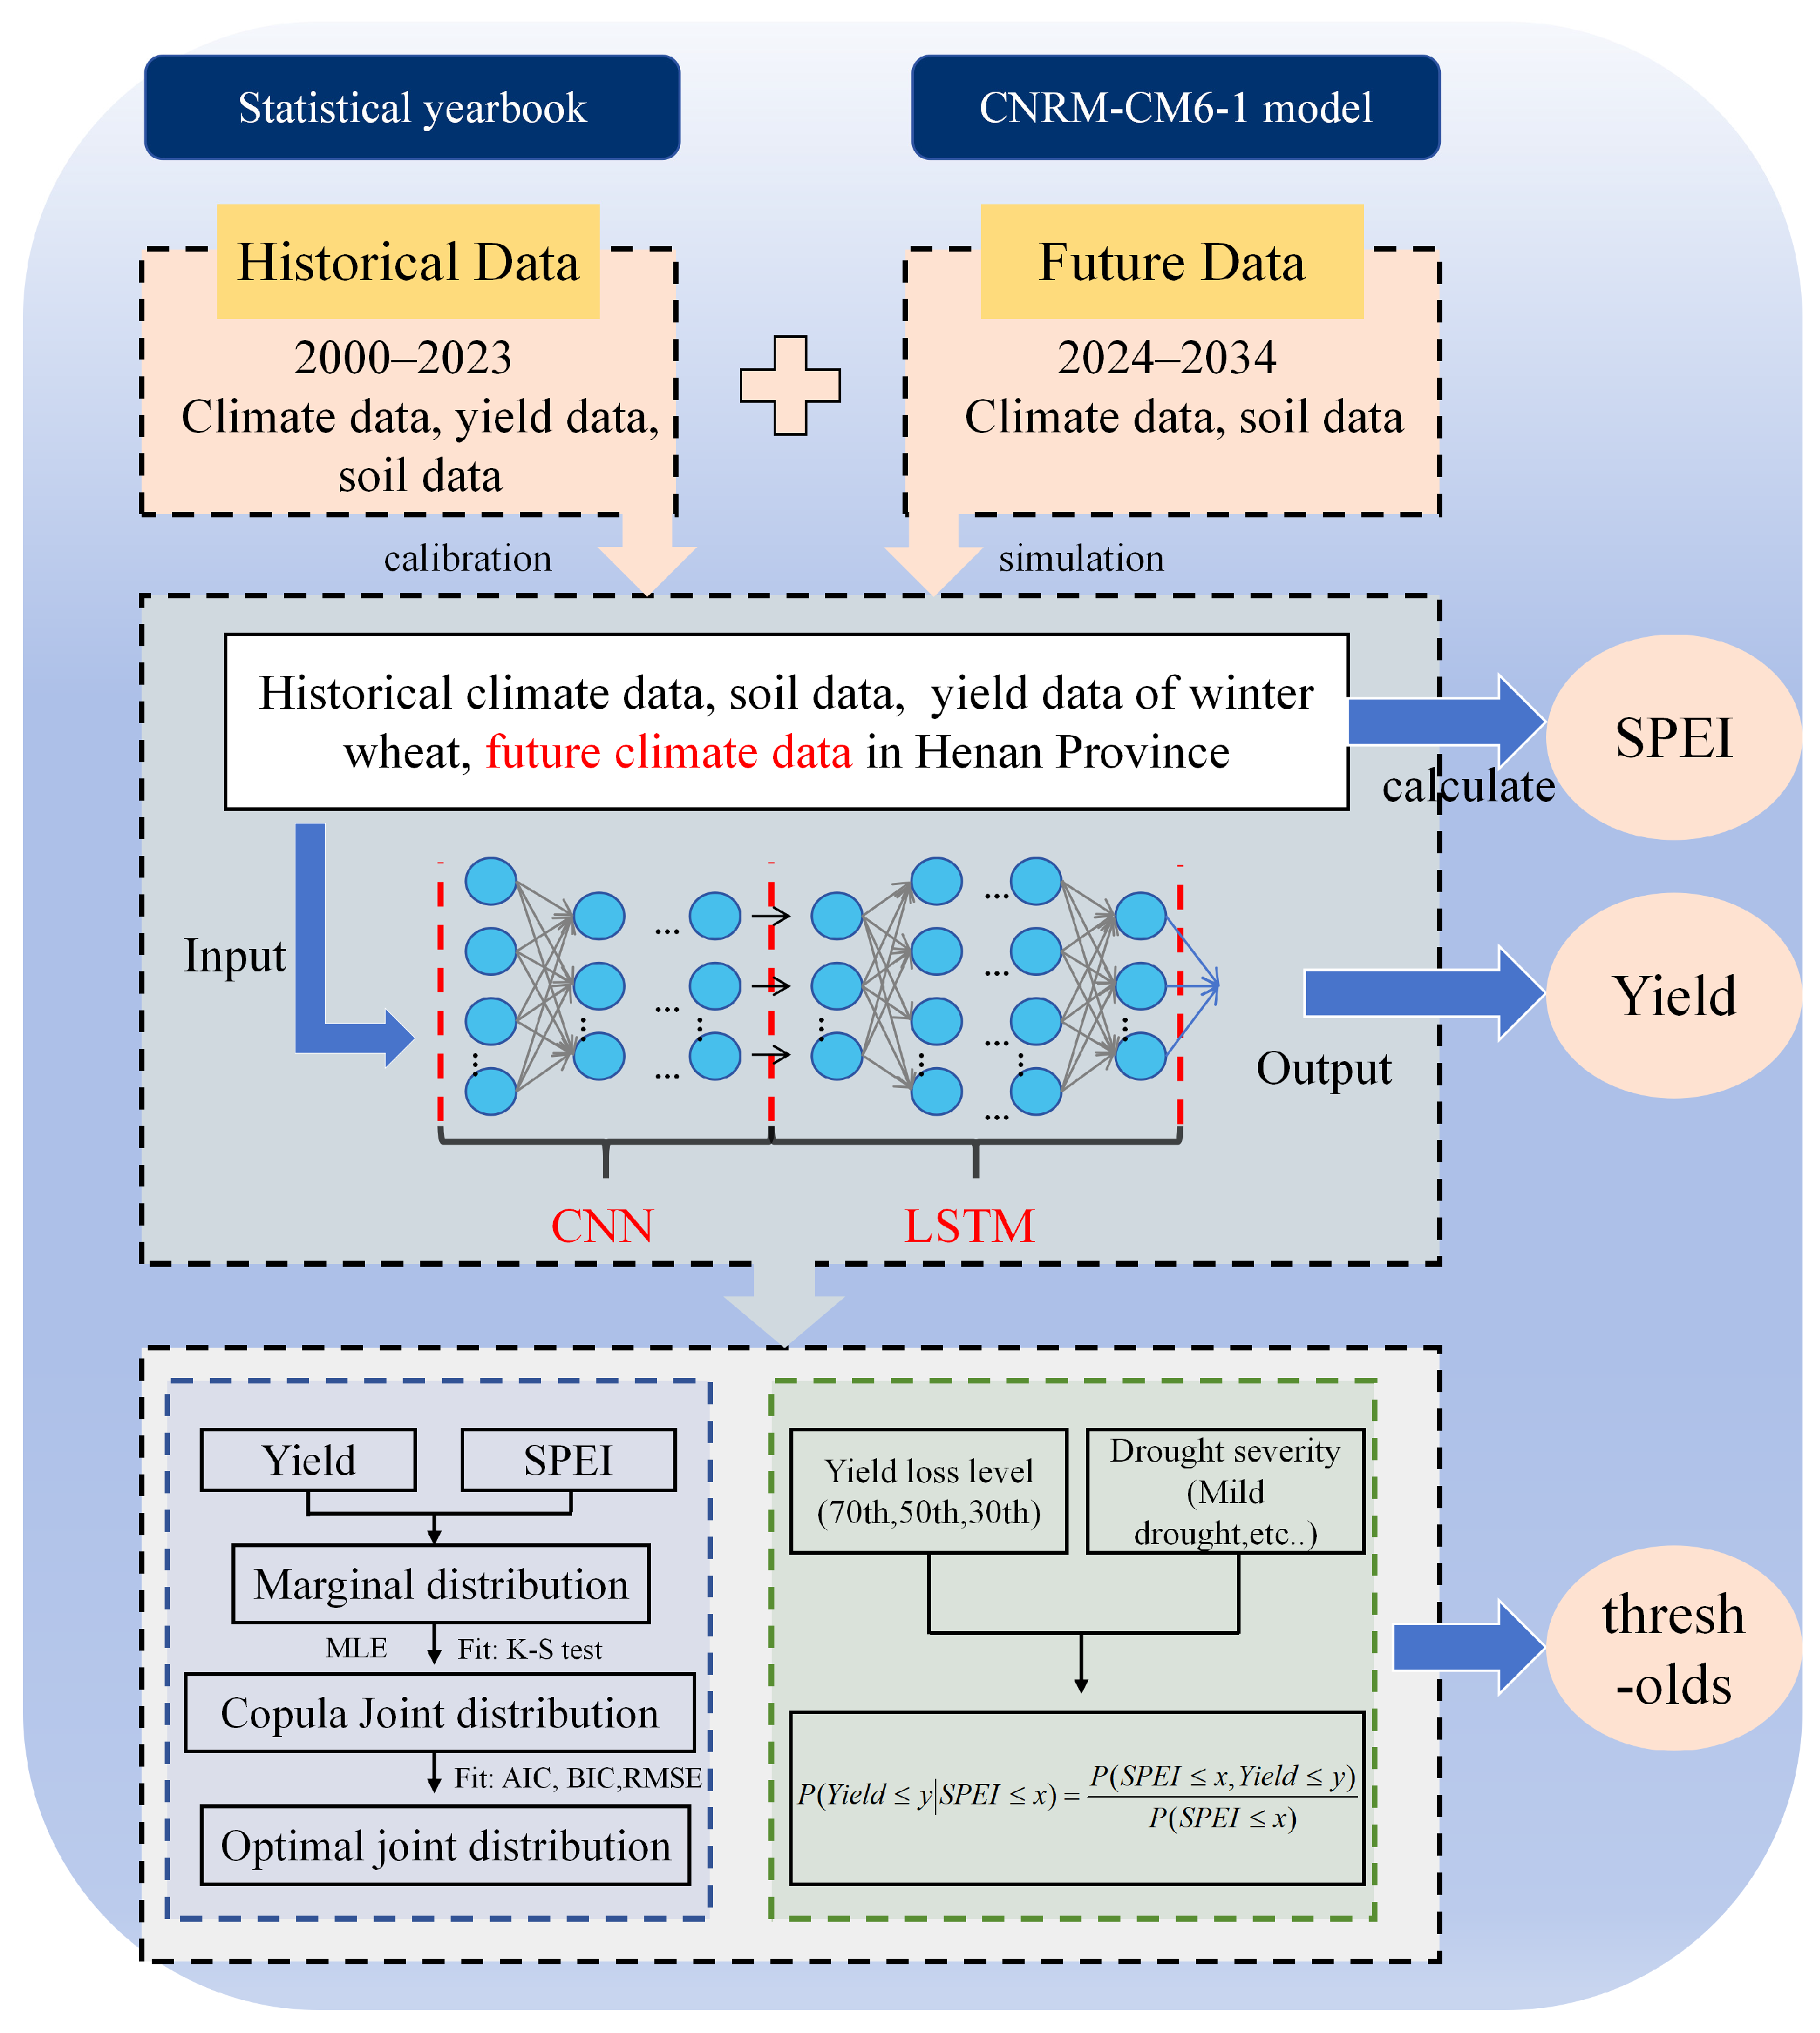
2.3. CNN-LSTM Yield Prediction Model

2.3.1. Models and Inputs

CNN is a deep learning model specially used to process data with a grid structure, extract local features, combine and make high-level decisions on the extracted features, and give the final prediction results. It is one of the representative algorithms of deep learning, composed of a convolution layer, an activation function, a pooling layer, a fully connected layer, and an output layer. LSTM is an improved version of the Recurrent Neural Network (RNN), which reduces the possibility of gradient disappearance. The core of LSTM is to mine the potential relationship between the previous data point and the following data point through the forgetting gate, input gate, and output gate. The CNN-LSEM model is composed of two parts. The CNN model extracts the deep features of the multi-dimensional time series data set and saves the training time of the LSTM. In the second part, LSTM is used for time series prediction. The data set that has extracted deep features is trained and tested to predict the extracted features. The schematic diagram of the coupling model is shown in Figure S1.
In this study, Python (3.11) was used to screen the meteorological data during the growth period of winter wheat, and the Seasonal-Trend decomposition (STL) method was used to decompose the time series data seasonally. The data were decomposed into three parts: trend, seasonality, and residual, revealing the long-term trend and periodic fluctuation. Due to the extensive research area and meteorological data, only the precipitation (mm) and temperature (°C) data of the Zhengzhou area from 2000 to 2023 are visualized, and the results are shown in Figure S2. The results showed that the temperature and precipitation showed apparent seasonal fluctuations, which were consistent with the demand for temperature and precipitation during winter wheat growth. Specifically, temperature seasonality directly regulates crop phenology, while precipitation seasonality dictates water availability during critical growth stages. Given the dominance of seasonal signals in meteorological data, linear models often fail to capture their nonlinear interactions with crop responses. Therefore, this study employed LSTM to model these complex temporal dependencies and analyzes the seasonal trends of meteorological data (precipitation, temperature, relative humidity, sunshine hours, and average wind speed) in various regions of Henan Province from 2000 to 2023 in detail and uses the LSTM model to process these time series data (meteorological data) with prominent seasonal characteristics. Effectively capture seasonal information so that the LSTM model shows good prediction performance in different seasons in the future.
In addition, before inputting the CNN-LSTM model, the min-max method is also needed to scale the data to the [0, 1] interval. Then, the parameters required for normalization (such as minimum, maximum, mean, standard deviation, etc.) are calculated by the fit method, and the training set and test set data are normalized based on the obtained parameters. Finally, the normalized data are directly input into the CNN-LSTM model. In this study, a recursive prediction strategy was used to construct a sliding window set to 15 years. After each prediction of the following year’s output with the data in the window, the first year’s data were removed, and the latest measured values were added to the rolling update window to realize the dynamic adaptation of the model to climate trends. For example, the data from 2000 to 2015 can be used to predict the data for 2016, and then the data from 2001 to 2016 can be used to predict the production data for 2017, and so on. The schematic diagram of the sliding window and recursive strategy is shown in Figure S3. Multiple parameters, such as soil temperature, soil moisture, saturated water content, field capacity, and soil type, were input as soil data sets. The model’s output was winter wheat yield, which was used to evaluate the change in drought threshold under future climate change.

2.3.2. Calibration and Verification

The model uses 80% of the measured data as the training set (2000–2017) and the other 20% as the test set (2018–2022). Before using the CNN-LSTM model to predict the future yield of winter wheat, the model parameters must be calibrated. Hyperparameters are an indispensable part of deep learning. Reasonable selection and adjustment of hyperparameters can significantly improve the performance and training efficiency of the model [65]. Previous study [66] have shown that hyperparameter selection has a decisive influence on the performance of machine learning models. Hyperparameter tuning aims to identify the hyperparameter values that produce the best-performing model for various input data problems. Based on this, this study selected key hyperparameters such as the number of filters, Dropout rate, Batch size, epochs, and learning rate, and systematically explored the influence of hyperparameter adjustment on the model. In order to determine the optimal parameter combination, this study uses the Grid Search method. The algorithm trains the candidate hyperparameter combinations individually by exhausting all preset hyperparameter combinations. It evaluates the performance based on the mean square error (MSE) of cross-validation. Finally, the hyperparameter combination configuration with the smallest MSE is selected as the optimal hyperparameter configuration. Compared with random search, grid search can ensure complete coverage of the parameter space. Although the computational cost is high, it can provide reliable benchmark parameters for subsequent research.
The best CNN-LSTM model proposed in this study was determined by filter (32, 64, 96), Dropout rate (0, 0.1, 0.2), Batch-size (2, 4, 8), epochs (50, 100, 150) and learning rate (0.0001, 0.01) (Table S4). In the parameter calibration process, the time step is set to 15 years, and there are 162 different model parameter settings. After inputting the set parameters into the model, the yield simulated by 162 different parameter models was compared with the measured yield data of the training set (2000–2017), and the parameters of the CNN-LSTM model were calibrated. The optimal parameter setting of the model is shown in Table 1. Subsequently, the calibrated optimal model parameters were input into the CNN-LSTM model to simulate the yield of the test set (2018–2022). The simulated yield was compared with the measured data to verify the model’s reliability.
Indicators for calibration and validation of the model include mean square error (MSE), Equation (1), determination coefficient (R2), Equation (2), and root mean square error (RMSE), Equation (3), to evaluate the prediction performance of the model. The principle and flow chart of this study are shown in Figure 2. The calculation formula is as follows:
M S E = 1 n i = 1 n ( Y r Y s ) 2
R 2 = i = 1 n ( Y r Y s ) 2 i = 1 n ( Y r Y ¯ ) 2
R M S E = 1 n i = 1 n ( Y r Y s ) 2
Y r is the measured value of the model, and Y s is the predicted value of the model. The smaller the MSE value is, the more accurate the fitting degree of the prediction model is. The closer R2 is to 1, the higher the consistency between the simulated and observed values, and the better the model simulation performance. In contrast, the closer the RMSE value is to 0, the higher the simulation accuracy.

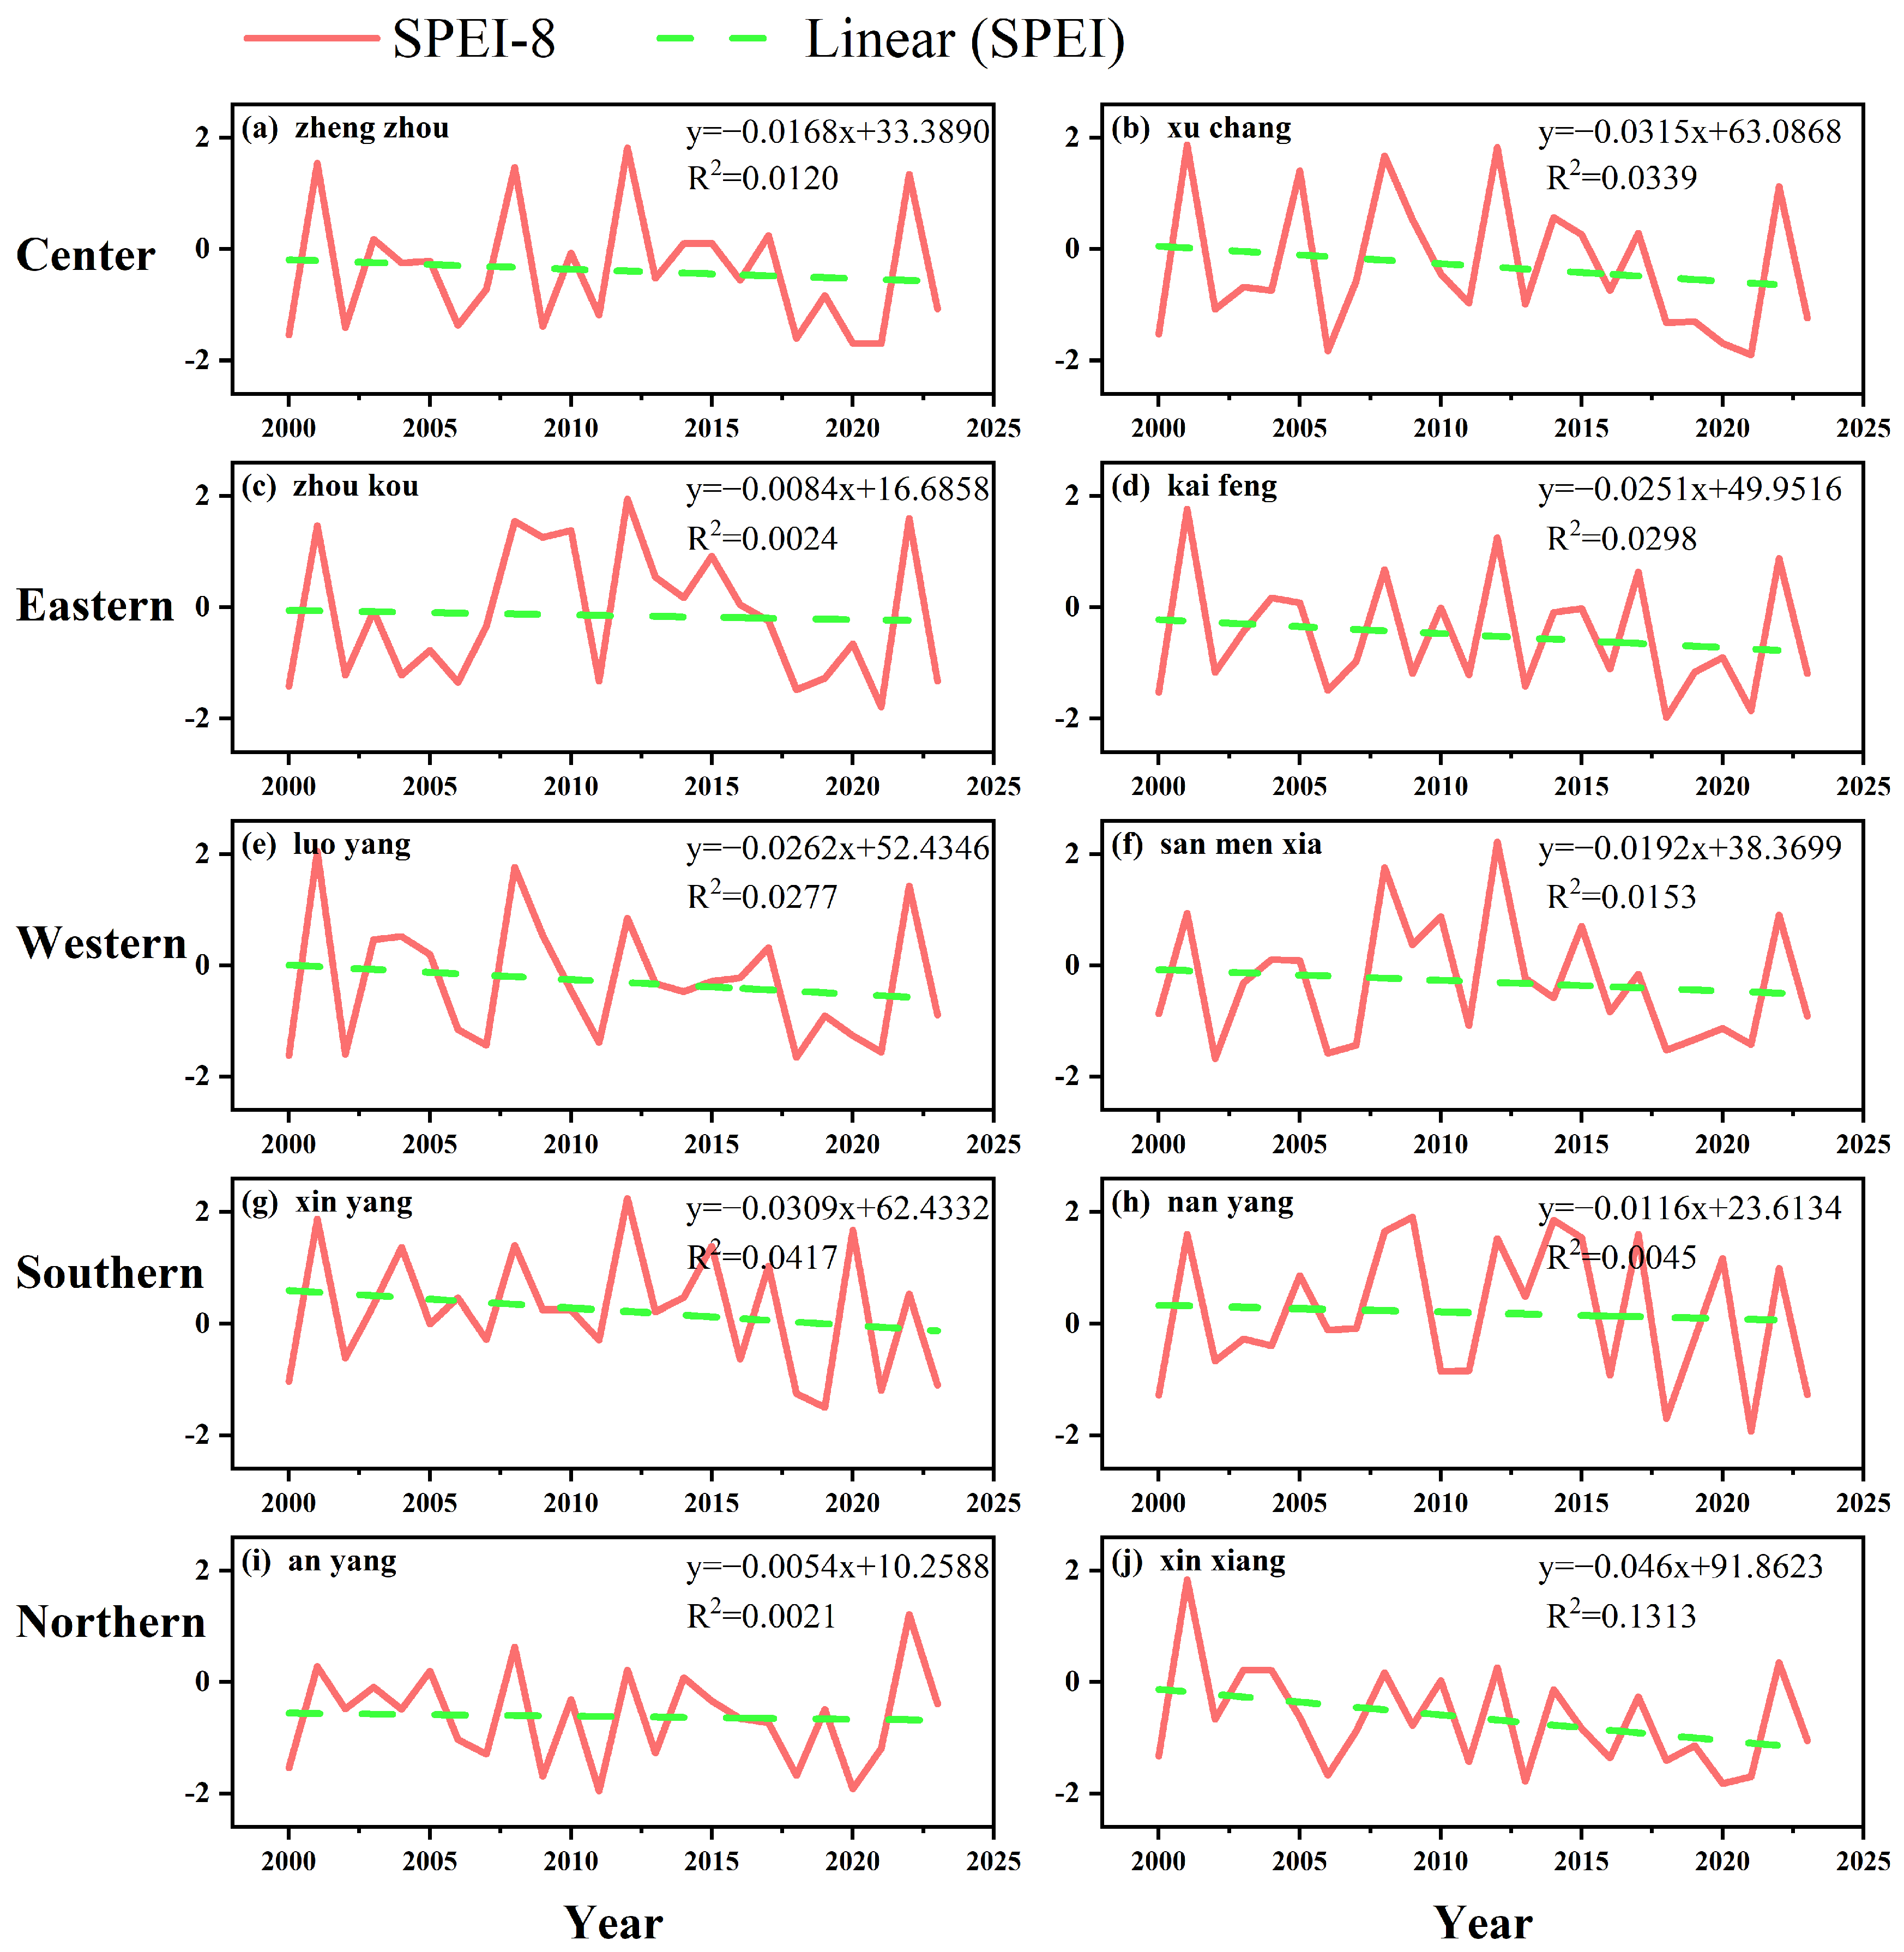
2.4. Calculation of SPEI

This study calculated the SPEI [67] based on the meteorological data of the winter wheat growth period from 2000 to 2023. The detailed steps of SPEI calculation are as follows: (i) The monthly potential evapotranspiration (PET) of winter wheat is usually affected by climatic factors. In this study, the FAO-56 Penman–Monteith Equation (4) was used for calculation; (ii) the monthly actual evapotranspiration (ETa) Equation (5) of winter wheat was calculated based on the growth coefficient (Kc) of the three growth stages of winter wheat. In this study, the Kc values of winter wheat at three growth stages in Henan Province were 0.7,1.15 and 0.25, respectively. The three growth stages were Kc ini = 0.7 in the early stage, Kc mid = 1.15 in the middle stage, and Kc end = 0.25 in the late stage. The growth stage of the early stage was sowing-greening, and the corresponding date was October 10 of the current year-February 18 of the following year. The growth stage of the middle stage is regreening-heading, and the corresponding date is February 19-April 25; the early growth stage is heading-maturity, and the corresponding date is April 26 to June 3. (iii) Calculate the difference between monthly precipitation (PRE) and PET to represent water deficit, Equation (6); (iv) according to the monthly water profit and loss data of all sites ( Δ s ). Vicente-Serrano et al. [67] showed that choosing a log-logistic distribution to standardize the calculation of SPEI values yielded a more consistent probability. Therefore, this study normalized the cumulative probability density function, Equation (7), by logarithmic Logistic distribution fitting accumulation. SPEI8 Equation (8) [68] represents the SPEI value of the winter wheat growth period. For example, the time range of the SPEI8 value in 2000 was 1 October 2000–31 May 2001. The degree of drought is divided according to the SPEI. For example, when the SPEI value is in the interval of (−1, −0.5], it is defined as Mild drought. By analogy, the SPEI-based drought classification results are shown in Table 2.
P E T = 0.408 Δ ( R n G ) + γ 900 T + 273 u 2 ( e s e a ) Δ + γ ( 1 + 0.34 u 2 )
E T a = K c × P E T
Δ s = P R E E T a
f ( x ) = e ( x μ ) / s s   ( 1 + e ( x μ ) / s ) 2
S P E I i = W i 2.515517 + 0.802853 W i + 0.010328 W i 2 1 + 1.432788 W i + 0.189269 W i 2 + 0.001308 W i 3
W i = 2 ln p for   p 0.5
W i = 2 ln ( 1 p ) for   p 0.5
where Rn is the net radiation (MJ m−2 day−1); g is soil heat flux (MJ m−2 day−1); Δ is the slope of the saturated vapor pressure curve (kPa °C−1); PET is potential evapotranspiration (mm); Kc is the growth coefficient; ETa is the actual evapotranspiration of winter wheat (mm); Δs is the water profit and loss data; f(x) is the log-Logistic cumulative probability density function; P is the probability of exceeding a determined D value, p = 1 − F(x). If p > 0.5, then p is replaced by 1 − p and the sign of the resultant SPEI is reversed. The SPEI is a standardized variable, and it can therefore be compared with other SPEI values over time and space.

2.5. Conditional Probability Framework

2.5.1. Copula Theory

With the improvement of climate change, planting technology, field agronomic management technology, crop varieties, and irrigation technology, crop yield has changed. In this study, the linear trend processing of winter wheat yield from 2000 to 2023 was carried out to eliminate the influence of non-climatic factors, which was the detrended yield [69,70]. Subsequently, 10 distribution functions (Table S5) (Normal, Exponential, Beta, Gamma, Uniform, Weibull, General Extreme Value, Rayleigh, Log-normal, and Log-logistic) were used to fit the detrended yield and SPEI data series. Maximum likelihood estimation (MLE) is used to estimate the parameters of the distribution function. MLE is a statistical method used to estimate the model parameters, so that the probability of the observed data appearing under this parameter is the largest. The larger the value of the likelihood function, the greater the possibility that the event occurs under the corresponding conditions. The K-S test is used to obtain the statistics of each marginal distribution and the corresponding p-value. The K-S statistic is the maximum vertical distance, Equation (11), between the empirical distribution function (EDF) and the theoretical distribution function (CDF) of the sample data. The p-value determines that the sample data obeys the marginal distribution (if p ≥ 0.05, accept the null hypothesis and believe that it conforms to the distribution; otherwise, reject). Finally, the cumulative probability difference between EDF and CDF is calculated by RMSE. The smaller the RMSE, the smaller the overall fitting error between the theoretical distribution and the empirical distribution.
D = max 1 i n F ( x i ) i n
where F ( x i ) is the cumulative probability of the theoretical distribution; i n is the probability of empirical distribution.
The Copula can connect multiple marginal distributions. Based on five Copula joint distribution functions (Table S6), the optimal marginal distribution joint function of SPEI and crop yield is constructed. The AIC and BIC are used to test the goodness of fit of the fitted function to determine the optimal Copula two-dimensional joint distribution. AIC Equation (12) and BIC Equation (13) are two kinds of information criteria for model selection in statistics, aiming to balance the model’s goodness of fit and complexity and avoid overfitting. Both are based on the likelihood function. The smaller the value of the two, the better, indicating that the model achieves a better balance between goodness of fit and complexity, and the better the model performance.
A I C = 2 ln ( L ) + 2 k
B I C = 2 ln ( L ) + k ln ( n )
where ln ( L ) is the logarithmic likelihood value of the model; k is the number of model parameters.

2.5.2. Conditional Probability of Yield Losses

The conditional probability of yield reduction under different drought conditions is calculated based on the optimal Copula function. In this study, the conditional probabilities Equation (14) of winter wheat yield loss below 30, 50, and 70 percentiles were calculated for historical data (2000–2023) and future data (2024–2047), respectively. The higher percentile indicates that drought has less of an effect on yield loss. For example, winter wheat yield below the 70th percentile indicates a 30% yield loss. When the conditional probability value exceeds 60%, the corresponding drought index value is used as the threshold to trigger the yield reduction level of winter wheat. This formula calculates the probability that the winter wheat yield is less than or equal to y under the condition that SPEI is less than or equal to x.
P ( Y i e l d y S P E I x ) = P ( S P E I x , Y i e l d y ) P ( S P E I x )
where y is a specific level or threshold of winter wheat yield; x is a specific level or threshold of the SPEI.

3. Results

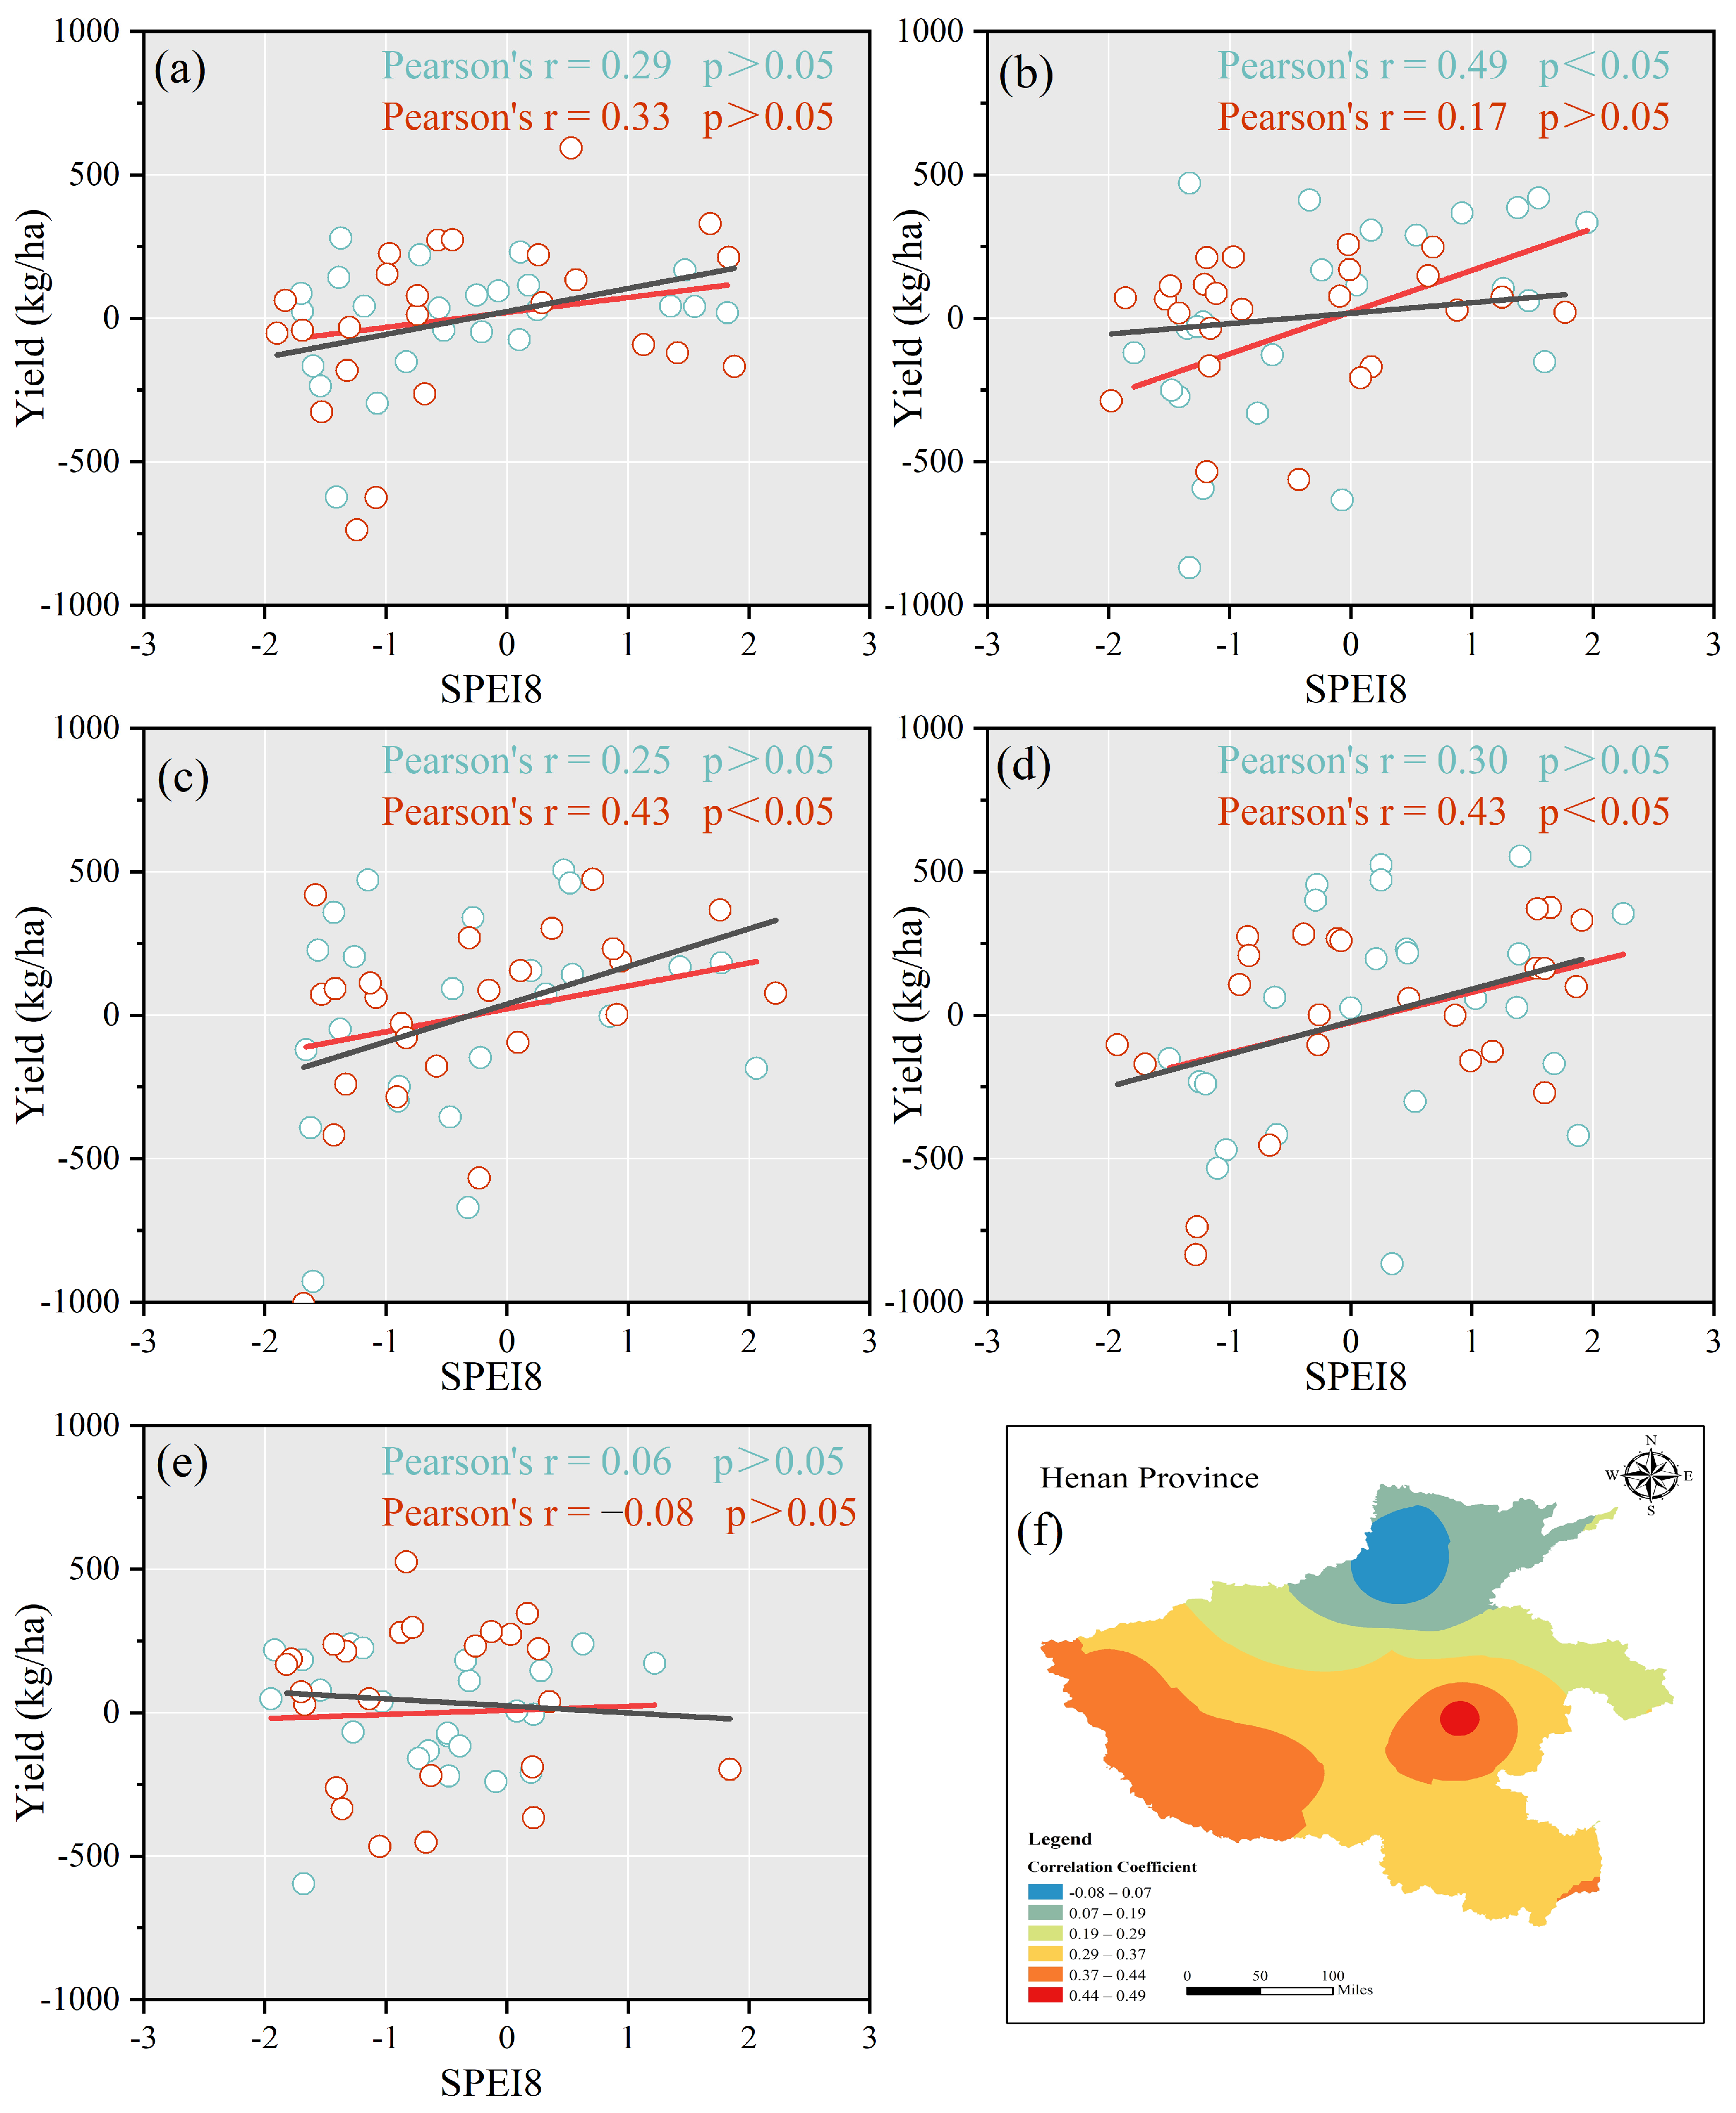
3.1. Response of Winter Wheat Yield Loss to SPEI

In order to study the response relationship between winter wheat yield loss and drought, the value of SPEI8 was calculated using the meteorological data of 24 years (2000–2023), and the drought degree in different regions was analyzed by the linear method. The results are shown in Figure 3. With the change in time, the trend of SPEI8 showed apparent periodic oscillation, and the positive and negative fluctuations were significant, indicating that SPEI8 was sensitive to daily-scale meteorological changes and could reflect drought characteristics in a growth period. The linear regression slopes of each region in Figure 3 were negative, indicating that SPEI8 decreased with time. The drought degree of winter wheat increased, reflecting that the growth period of winter wheat showed a drought trend in the past 24 years, which may be due to the significant global warming trend in recent years. The temperature change has aggravated the degree of drought for winter wheat in various regions. Comparing the SPEI8 values of each region from 2000 to 2023, the proportion of drought years is as high as 67%, and the drought degree of the five regions is in the order of center > eastern > northern > western > southern.
Winter wheat yield is affected by many factors, including climate, field management measures, irrigation methods, fertilizer application, wheat varieties, irrigation facilities, and planting area. With time, the progressive upgrading of agricultural technologies in Henan Province drives an upward trend in the crop yield per unit area. In order to eliminate the influence of non-climatic factors on yield, the detrended yield was obtained by subtracting the trend yield from the actual yield. Figure 4 shows the comparison between winter wheat yield and SPEI8 in the central Henan region from 2000 to 2023. In severe drought years, winter wheat yield has a significant downward trend (shown in the gray vertical shadow in the figure). Similarly, the other four regions showed the same trend (Figures S4–S7). The extreme negative values of SPEI between 2000 and 2023 usually represent extreme drought events. For example, from October 2023 to May 2024, Henan suffered extreme drought events, and the temperature in the province was higher than that in the same period, resulting in lower SPEI8 and severe loss of winter wheat yield.
The relationship between climate and yield is usually evaluated by the correlation coefficient. Some scholars have found [71,72] that precipitation and crop yield have a close relationship in most countries. The more precipitation, the higher the yield and the favorable the correlation distribution. The study used Pearson’s correlation coefficient to analyze the linear relationship between detrended yield and SPEI8. The results are shown in Figure 5 and Table 3. Correlation analysis shows that only Xinxiang City is negatively related to the ten regions of Henan Province, and the other regions are positively correlated, corresponding to [71]. However, due to the different climatic conditions and soil types in different regions of Henan Province, the linear correlation coefficients of the ten regions are different. Further analysis found that the Pearson correlation coefficient r values of detrended yield and SPEI8 in Zhoukou City, Sanmenxia City, and Nanyang City were more than 0.4, and the correlation intensity was moderately correlated. The correlation passed the 95% confidence test (p < 0.05), which proved that the study of the relationship between the two had practical significance. Zhoukou City has the most considerable r value (p < 0.05) in all regions of Henan Province (Table 3). Compared with other regions, the winter wheat yield in Zhoukou City may be more easily reduced under the influence of drought. The correlation coefficient r value analyzes the linear relationship between SPRI8 and detrended yield, and the low r-value may be due to the nonlinear relationship between the two. Figure 5f is the spatial distribution of the correlation trend between the detrended yield and SPEI8 in ten regions of Henan Province, indicating that the production structure in the east is more fragile and more sensitive to drought stress; that is, the stronger the correlation, the more vulnerable to drought. These results suggest that SPEI8 can be used as an effective tool for predicting crop yield changes, which is critical for agricultural planning and risk management.

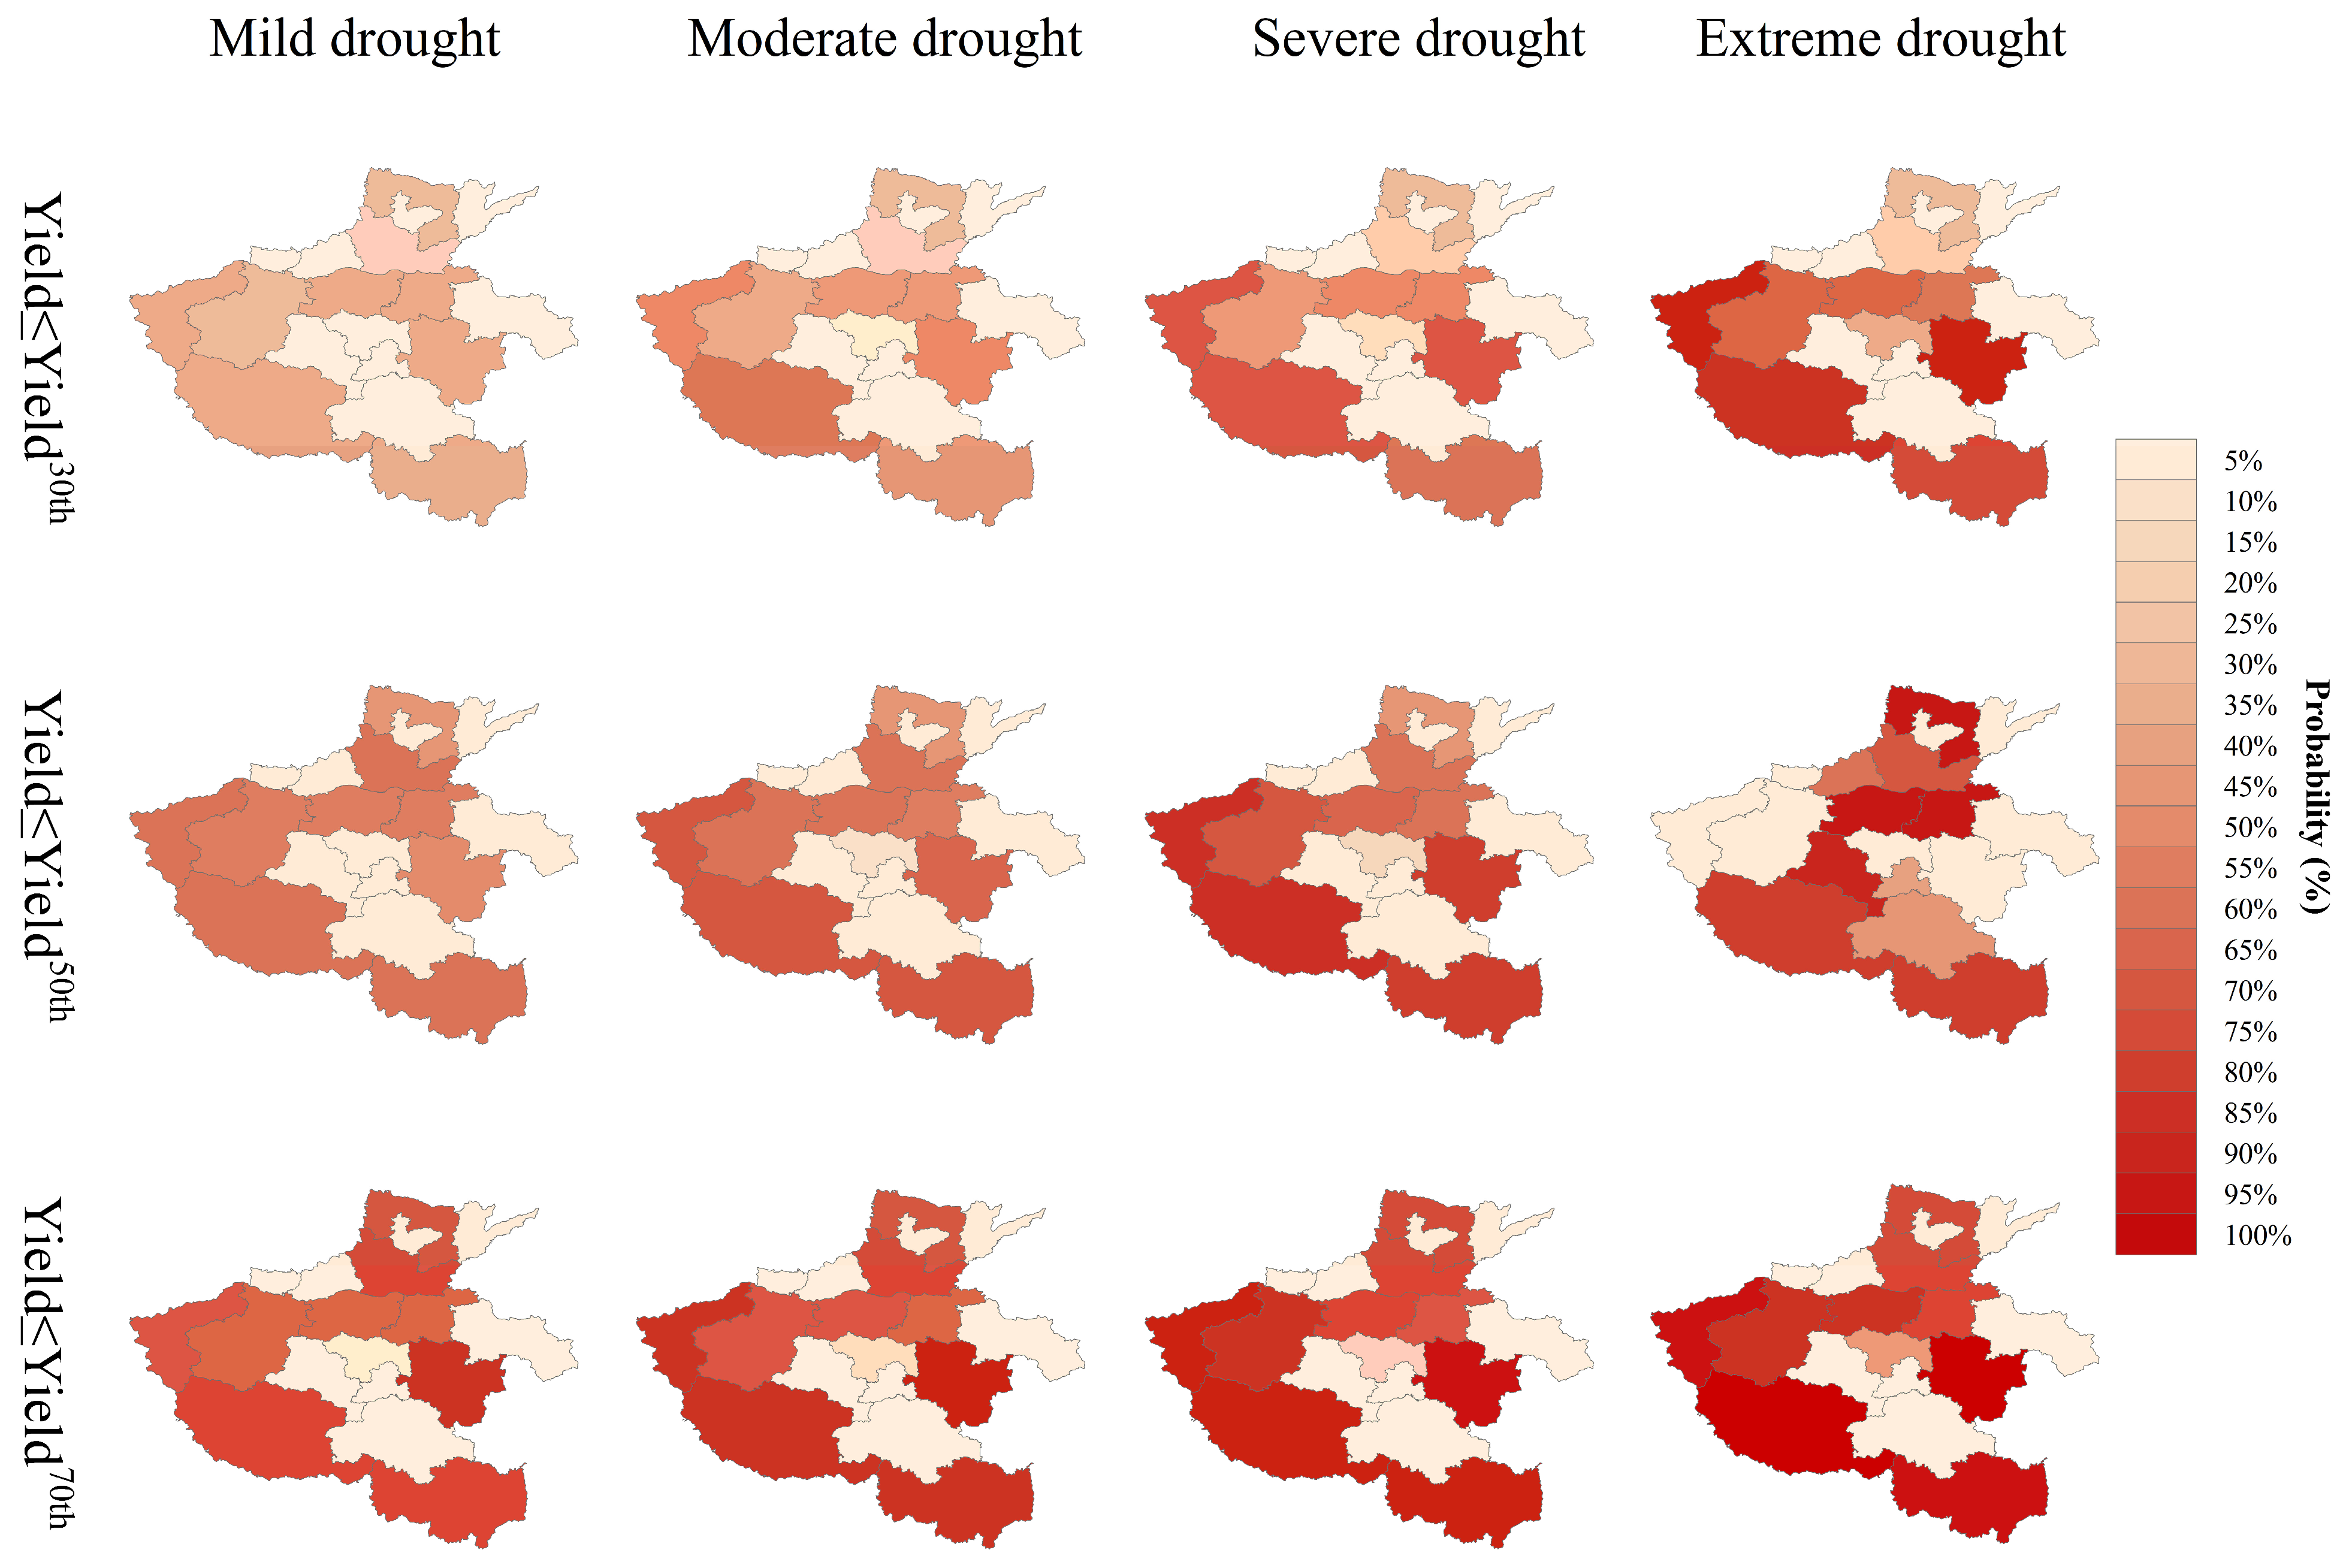
3.2. Probability of Winter Wheat Yield Losses Under Different Drought Conditions

There is a significant correlation between the SPEI and the detrended yield in the Zhoukou, Sanmenxia, and Nanyang regions. Using the dependence between the two in the Copula function, the conditional probabilities of winter wheat yield loss below 30,50, and 70 percentiles under different drought conditions from 2000 to 2023 were simulated. The results are shown in Figure 6. When the loss is below the 30th percentile, the yield is reduced by 70%. The lower the percentile, the more significant the proportion of yield loss. Under mild drought conditions, the conditional probability of yield loss below 30% was 33%, 37%, and 38%, respectively. Under 50%: 49%, 57%, and 58%; below 70% are 82%, 68%, and 75%; the probability of loss level below 30 percentile < below 50 percentile < below 70 percentile, and the rules under other drought conditions are also consistent. With the increase in winter wheat yield loss (Figure 6), the probability of yield loss under the same drought condition decreased. In addition, from mild drought to extreme drought, the higher the degree of drought, the higher the probability of yield loss. For example, the probability value of Zhoukou below the 30th percentile increased from 33% to 87%.
The spatial distribution of the conditional probability of winter wheat under different drought conditions is shown in Figure 7. Different regions show apparent spatial heterogeneity. It can be found that the conditional probability of the same yield loss in southern and eastern Henan is more significant than that in central, western, and northern Henan. Further analysis showed that the conditional probability mean of yield level loss in the five regions at 30, 50 and 70 percentiles were 31.1–46.3%, 53.3–78.7%, 51.4–77.9%, 56.0–84.5%, and 24.5–72.1%, respectively (Figure 7). Under different conditions, the five regions showed the same spatial probability distribution. Combined with the above analysis, the southern and eastern parts of Henan Province are more vulnerable to drought. At the same time, SPEI8 in Zhoukou and Nanyang in the two regions is significantly related to the detrended yield. It faces a higher risk of yield loss than other prefecture-level cities, which needs to be focused.

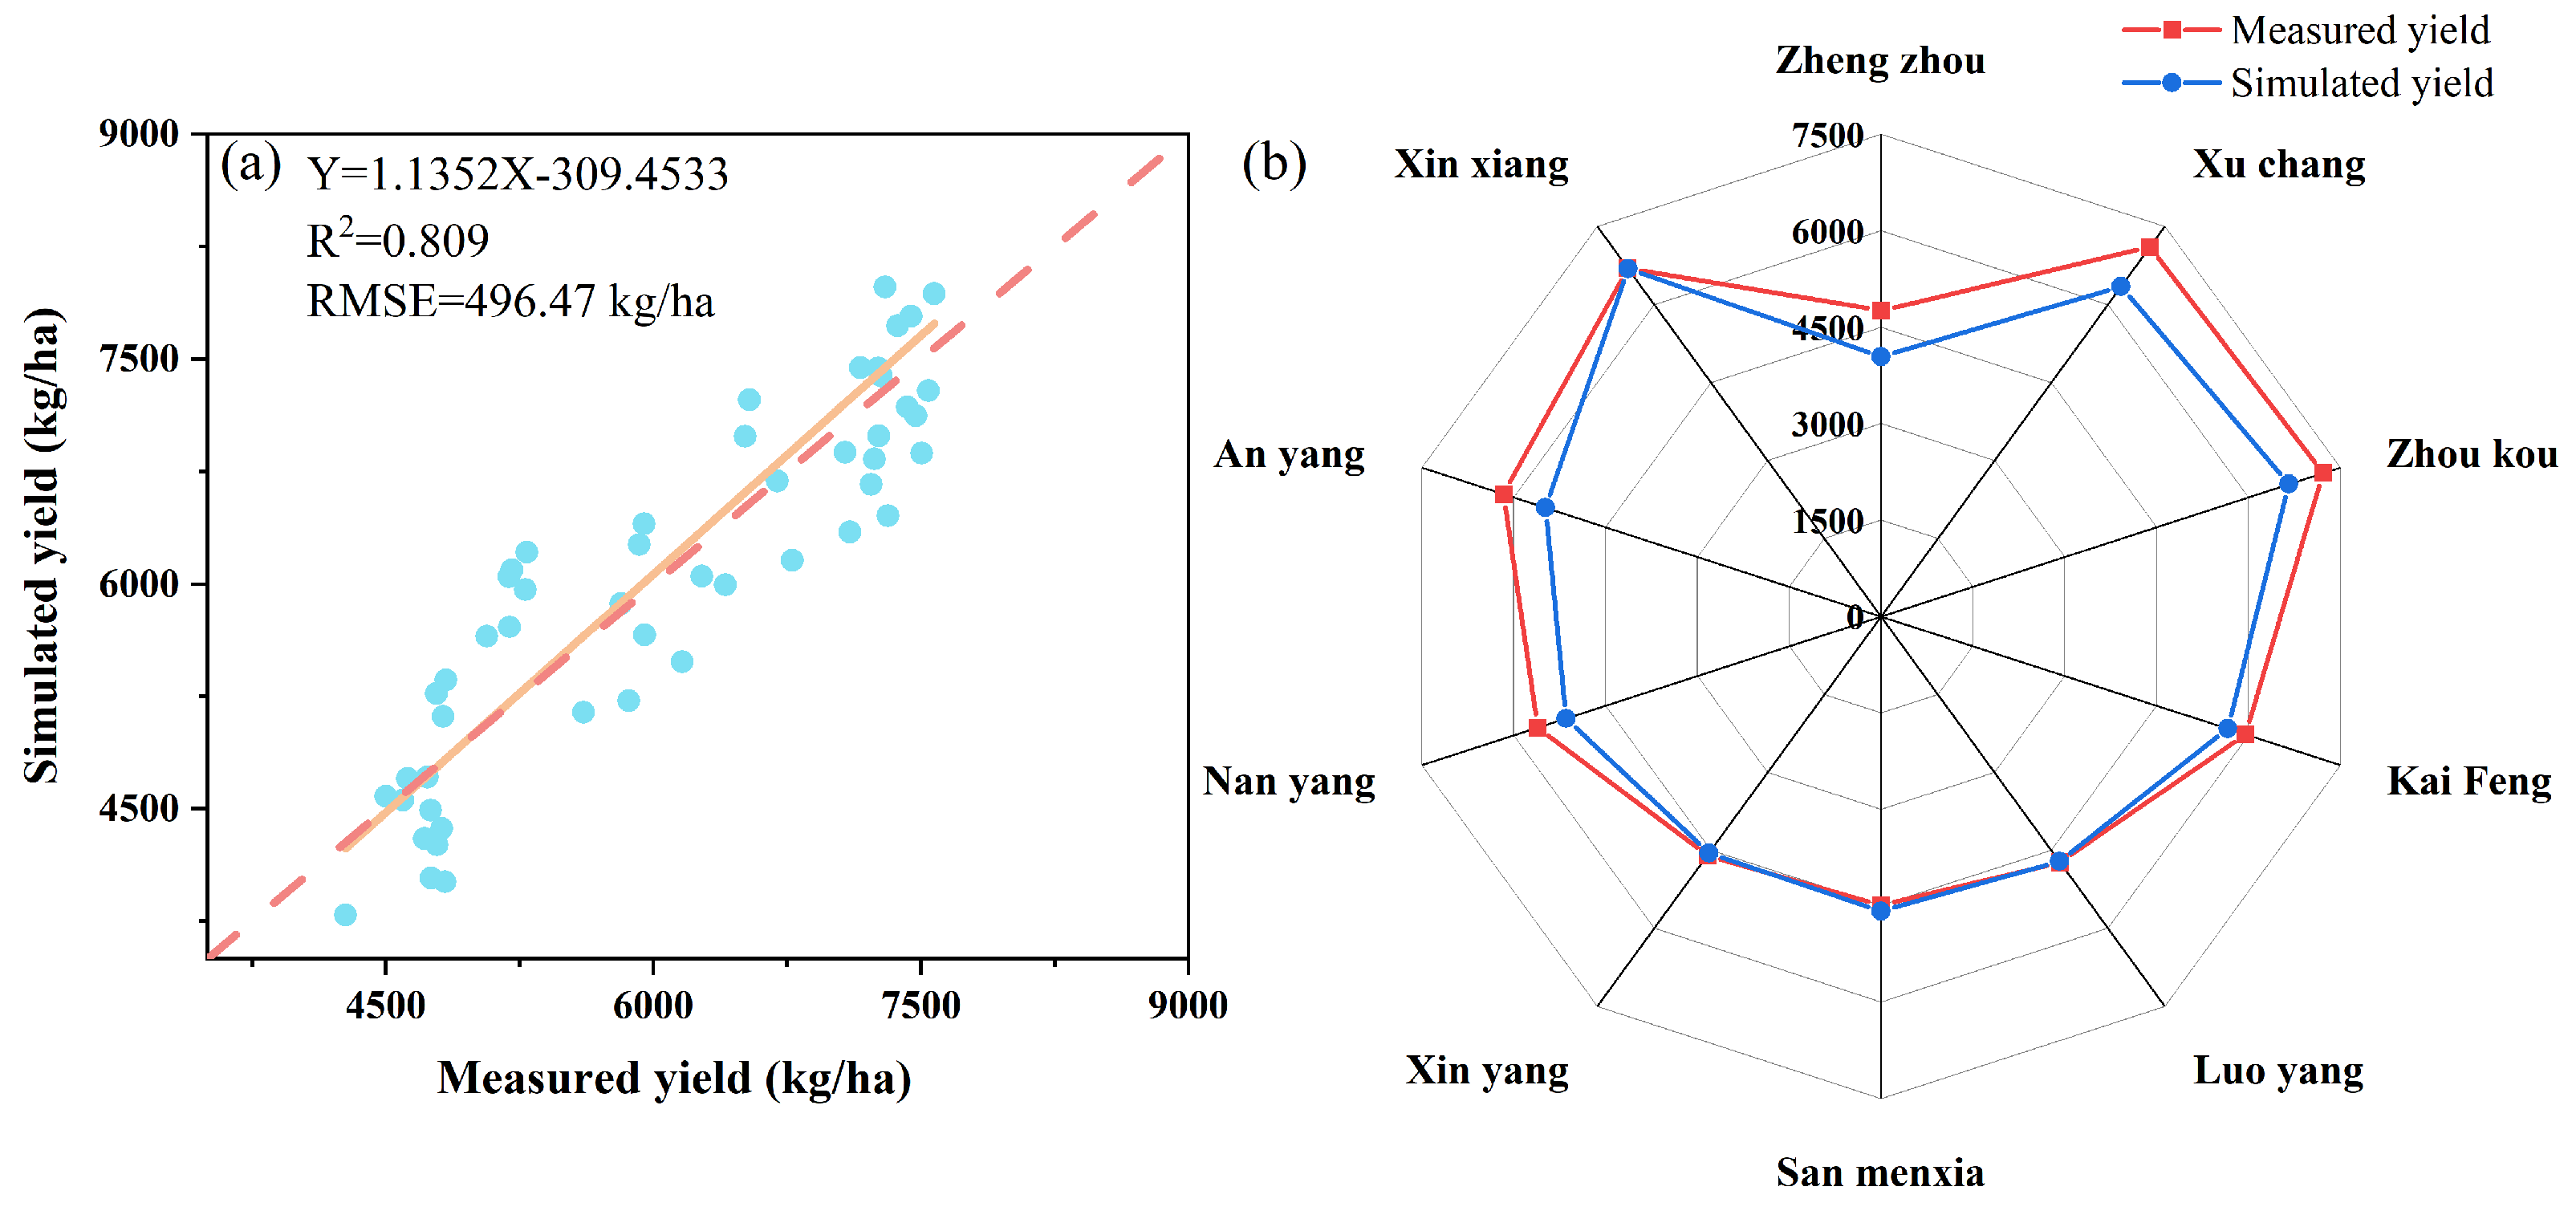
3.3. Prediction of CNN-LSTMN Model

This study considered the effects of meteorological and soil factors on winter wheat yield. Specifically, we used the meteorological data set from 2000 to 2023, containing 8766 observation days (5 meteorological parameters) (8766, 5). These parameters include average wind speed, relative humidity, temperature, sunshine hours, precipitation, and time identification (year, month, and day) (8766, 3). The total sample size of the data set is (8766, 8). The study mainly analyzed the meteorological data during the growth period of winter wheat. The total number of samples was 5832 observation days, and the average annual growth period was 243 days (24,243, 8). In addition, one of the key parameters of the soil data set is Saturated water content, and the dimension of the data matrix is 7560 rows × 4320 columns. These soil data use the D-WGS-1984 coordinate reference, and the depth of each pixel is 32 bits. In order to construct the CNN-LSTM model, we first divide the data set into a training set and a test set according to a ratio of 82. Before the model training, we normalized the data and used the sliding window technique to construct the time series data. Through these preprocessing steps, the prediction results of the model are finally obtained. Based on the PyCharm (2024 edition) development environment, this study uses Python 3.11 to implement and train the CNN-LSTM model. The results of the measured data on winter wheat yield in 10 national stations from 2018 to 2022, combined with the CNN-LSTM model simulation data, are shown in Figure 8a. The simulated data points are evenly distributed around the 1:1 line, suggesting that the model prediction performance is good, the error is small, and the model prediction accuracy is high, R2 is as high as 0.809, and RMSE is 496.47 kg/ha. Figure 8b compares the output observations of various regions in Henan Province in 2018 and the output values simulated by the CNN-LSTM model. Each axis in the figure represents a region. The value on the axis represents the yield (kg/ha), the red point represents the yield observation value, and the blue point represents the simulated yield value. It can be seen from the figure that the trend of simulated yield and measured yield is similar, and the difference between the two data sets is slight, indicating that the model performs well. The figure can help evaluate the applicability and accuracy of the model in different regions. Further analysis shows that. Further analysis shows the relative error of Zhengzhou, Xuchang, Zhoukou, and Anyang four stations is slightly larger than that of Kaifeng, Luoyang, Sanmenxia, Xinyang, and Nanyang six stations, which may be due to these four stations’ small annual yield changes. In contrast, the meteorological data changes considerably, affecting the balance of the model training data set, ultimately leading to the model’s underestimation of winter wheat crop yield. In short, the simulated yield of the model is consistent with the measured yield, which proves that the prediction model constructed by combining a CNN with LSTM has good performance. The excellent prediction results of winter wheat in Henan Province also show that applying the model in regional winter wheat yield prediction is feasible and valuable.

3.4. Probability of Winter Wheat Under Future Climate Change

China actively releases energy conservation and emission reduction policies, encourages everyone to adopt emission reduction technologies, and contributes to carbon neutrality goals. The study selected SSP1-2.6 as the future climate scenario and used Copula to calculate the conditional probability of winter wheat yield loss below 30, 50, and 70 percentiles under different drought scenarios (Figure 9). Based on the Copula conditional probability framework, Table 4 shows the optimal marginal distribution and joint distribution function under different scenarios (historical and SSP1-2.6) in the winter wheat production area. Comparing the conditional probability of historical climate and future climate in Figure 9, it was found that the conditional probability of winter wheat yield is reduced under the SSP1-2.6 scenario. However, when the loss level is lower than the 70th percentile (yield loss of 30%), the spatial distribution of conditional probability is significantly different. As the yield loss increases to 70% (the loss level is lower than the 30th percentile), the difference becomes smaller and smaller. For example, under the historical climate (2000–2023) in Figure 7, the conditional probability mean of winter wheat yield loss below the 70 percentile in eastern Henan is 78.7%, while the conditional probability means under the future (2024–2047) (SSP1-2.6) climate is 64.9% (Figure 9). As time goes by, the growth of greenhouse gas concentration in the future (2024–2047) will tend to be stable, resulting in a significantly lower emission concentration than in the historical period. The comparison of historical and future conditional probabilities in Figure 9 shows that the probability of future yield loss is lower than that of historical periods. This is because reducing greenhouse gas emission concentration will significantly improve the yield loss level under future climate change and reduce the risk of yield loss.
The spatial distribution results of the conditional probability of future yield loss are relatively consistent with the historical climatic conditional probability (Figure 9). Under the exact condition of winter wheat yield loss, the conditional probability of yield reduction in the southern and eastern regions is greater than in the central, western, and northern regions. In general, the drought vulnerability of southern and eastern Henan under future climate change is high, and it is expected to bear a greater risk of yield loss.

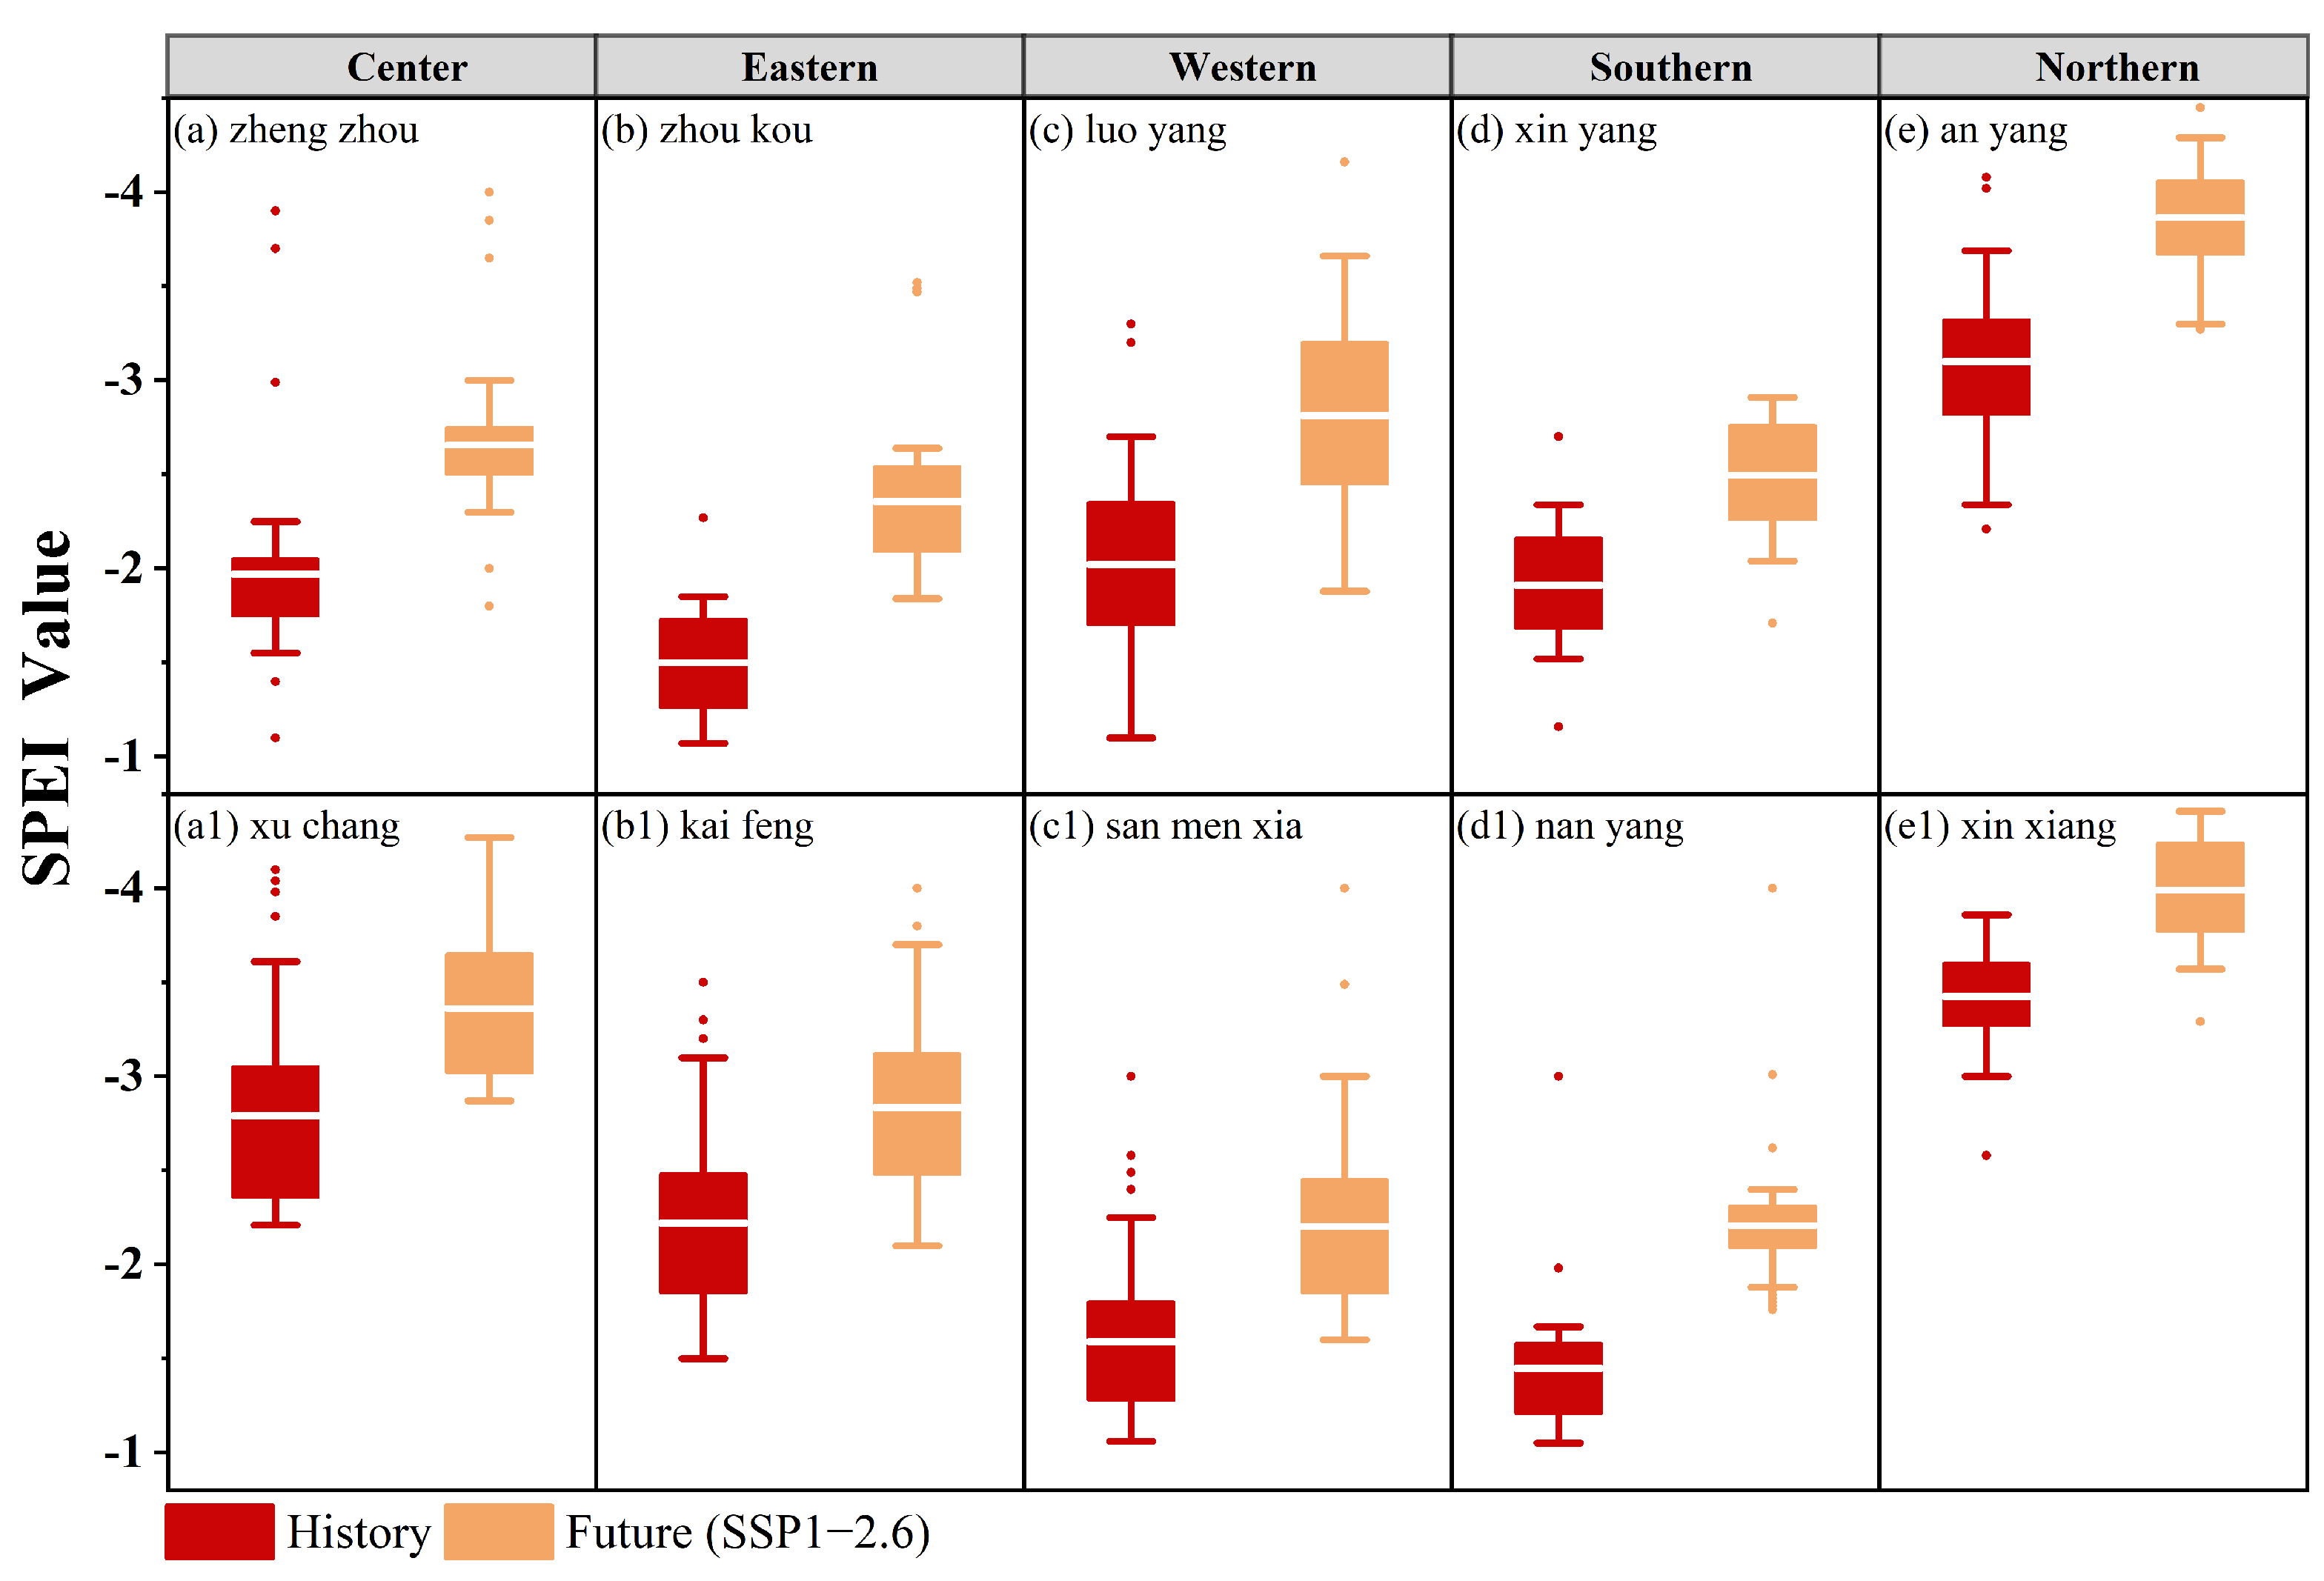
3.5. Drought Threshold Under Different Levels of Yield Loss

As mentioned above, when the conditional probability exceeds 60%, this drought index can be used as a drought threshold to trigger the loss of yield. The conditional probability under different drought scenarios is different. This study uses conditional probability to quantify the drought threshold under different yield level losses in history (2000–2023) and future (2024–2047) (SSP1-2.6). The results are shown in Table 5. According to the different drought thresholds, the higher the drought threshold, the higher the drought vulnerability, the lighter the drought, the greater the loss of yield, and vice versa, the more severe the drought. In addition, this study took the threshold of winter wheat yield loss less than the 30th percentile (yield reduction of 70%) in ten meteorological stations in Henan Province as an example (Figure 10). It analyzed the variation characteristics of drought thresholds in ten meteorological stations to provide a reference for local agricultural management departments to adopt countermeasures. Figure 10 shows that the drought threshold under the SSP1-2.6 (2024–2047) scenario is significantly lower than in the historical period (2000–2023). This result is consistent with Figure 9, indicating that higher drought conditions are required under the SSP1-2.6 (2024–2047) scenario to cause winter wheat yield loss.
As mentioned above, the drought vulnerability in southern and eastern Henan is relatively high. Taking these two regions as an example to analyze further the data in Table 5, the drought thresholds for yield level losses below 30 (50/70) percentiles in Zhoukou, Kaifeng, Xinyang, and Nanyang in the historical period (2000–2023) are 1.47 (−0.97/0.69), −2.18 (−1.80/−0.75), −1.86 (−0.85/0.60) and −1.45 (−0.75/−0.17), respectively. The drought thresholds under the SSP1-2.6 (2024–2047) scenario increased by −0.77 (−0.64/−0.41), −0.68 (-0.56/−0.33), −0.61 (−0.54/−0.25), and −0.71 (−0.59/−0.26). Other meteorological stations also have the same phenomenon. These results indicate that some areas are prone to yield reduction under mild drought conditions in the past, and moderate or severe drought may be required in future scenarios to achieve the corresponding yield loss level.
From the results of Figure 5, Figure 6, Figure 7, Figure 8, Figure 9 and Figure 10 and Table 5, it can be seen that Henan’s southern and eastern regions are more sensitive to drought in both the historical and future periods, and the conditional probability is higher under the same yield loss level when drought occurs. As the main producing area of winter wheat in China, Henan Province can analyze the drought vulnerability of different regions to formulate corresponding management measures for agricultural departments and farmers, effectively resist drought for future climate, and efficiently manage the yield loss of winter wheat.

4. Discussion

4.1. Stability of Triggering Drought Thresholds and Deep Learning Model Within Conditional Probability Framework

This study used a two-dimensional Copula conditional probability framework (Figure 2) to quantify the drought threshold triggered by the reduction in winter wheat yield. Comparing the dynamic changes in drought threshold in Henan Province in the past and future periods, and proposing the response strategies of winter wheat yield reduction in Henan Province under future climate change. The two-dimensional Copula framework involves multiple models and algorithms, which are more complex because the stability of the framework is crucial to studying drought thresholds. It can be seen from Table 4 that the best marginal distribution of SPEI8 of winter wheat is the normal distribution. Comparing the standard deviation of drought threshold in the historical period (2000–2023) and the future (2024–2047) can be used to evaluate the stability of the Copula conditional probability framework. Taking eastern Henan as an example, the standard deviations of drought thresholds in Zhoukou and Kaifeng (historical period/future period) are 0.22/0.24 and 0.54/0.46, respectively. The standard deviations of the two periods are similar, indicating that the data dispersion obtained using the framework in the two periods is similar. Therefore, the two-dimensional Copula conditional probability framework used in this study is stable and reliable in assessing the drought threshold that triggers winter wheat yield loss under future climate change and can provide a more accurate reference for future climate change response strategies.
The CNN-LSTM model used in this study efficiently processes historical meteorological data. Combined with the future meteorological data of SSP1-2.6, it can effectively simulate the yield changes in winter wheat in the future climate. The deep learning model’s simulated values correlate with the measured values (Figure 8a). This study used the CNN-LSTM hybrid model to predict the winter wheat yield in Henan Province. The results showed that the model showed high prediction accuracy (R2 = 0.809) on the training and independent test sets, verifying its effectiveness in modeling complex meteorological-yield nonlinear relationships.

4.2. Effects of Soil Properties, Evapotranspiration Rate, and Agronomic Practices on Drought Vulnerability

The relationship between crop yield and agricultural drought is a complex issue involving many factors, such as climatic factors, soil characteristics, crop types, and agricultural practices. Clay is more resistant to drought under severe rainfall deficits and high temperatures. Compared with the other two soil textures, sand is less able to absorb and store rainfall. It is, therefore, less likely to recover from severe agricultural droughts, while clay and loam have better water-holding capacity when replenished with timely precipitation and, therefore, recover faster [73]. These results have important implications for different crop selections and spatial heterogeneity of drought vulnerability [67]. For example, the crop planting soil in the southern part of Henan Province is mostly clay, which has a strong water retention capacity and is suitable for planting crops with high water demand, such as rice. The central region of Henan belongs to sandy loam, and the water storage capacity is insufficient, which is more suitable for planting dry crops such as winter wheat. Evapotranspiration in this study includes crop transpiration and soil water evaporation. Soil water evaporation rate is closely related to soil type, and crop transpiration is often much more significant than soil surface evaporation. Different characteristics of crops (such as leaf area index (LAI), root depth), physiological characteristics (crop aperture), and the proportion of crop planting will affect the evapotranspiration rate of crops in different regions, thus affecting evapotranspiration [74]. For example, LAI can reflect the potential photosynthesis and dry matter accumulation at the reproductive stage, indicating that it can monitor crop growth and yield [75]. A study [18] has established a method of LAI relative threshold to represent drought vulnerability in different regions of the North China Plain. This result indicates that the evapotranspiration rate in different regions of Henan Province may affect the spatial heterogeneity of drought vulnerability [70]. In addition, irrigation is an agronomic practice. In recent years, Henan Province has encouraged the development of water-saving irrigation models to cope with drought, and the development speed has differed in different regions. The irrigation method in the western Henan region is mostly micro-sprinkler irrigation technology, which reduces runoff loss, improves water use efficiency, and may reduce drought vulnerability. However, buried pipelines are still used for irrigation in southern Henan, resulting in water accumulation in some areas and water shortage in others, which increases the risk of crop drought. The results of this study show that the drought stress in the southern and eastern regions is more serious than that in the central, western, and northern regions. Consistent with the results, soil characteristics, evapotranspiration rate, and agronomic practice factors may be the potential mechanism that leads to regional differences in drought vulnerability in Henan Province.
Based on the above analysis, there are some potential strategies to adapt to the drought risk faced by different regions under future climate change in Henan Province. Chen et al. [76] used the combination of regulated deficit irrigation and crops to enhance the water productivity of crops so that they can tolerate mild water shortages. Li et al. [77] studied the water use characteristics of different wheat varieties to cope with drought risks by enhancing the drought tolerance of wheat, thereby increasing crop yield. Kelly et al. [78] optimize the existing irrigation system to alleviate the drought pressure in water shortage areas so that farmers can maximize water productivity. At present, there are various strategies to adapt to drought. The difficulty mainly lies in predicting and preventing drought in the future. Therefore, future studies can consider adding multiple SSPs, adding models of medium and high emission paths to the model, and making a more comprehensive prediction of future drought risks.

4.3. Effects of Drought on Wheat Production, Physiology, and Economy

The results of this study show that with the increase in drought degree, the probability of winter wheat yield loss gradually increases, which is consistent with previous studies [33,54]. In order to make the actual situation of crop yield loss under drought stress more consistent, this study further analyzed the relationship between SPEI and winter wheat yield loss, and the results showed a nonlinear relationship. Yang et al. [79] used Linear function, Cubic curve function, and Hyperbolic tangent function methods to fit the drought severity and crop yield loss of Songnen Plain in Northeast China. The results showed that the average R2 of the three functions in Northeast China was 0.55, 0.65, and 0.64, respectively. The Cubic curve function had the best simulation effect, reflecting that the crop yield loss decreased first and then increased. Leng and Hall [80] selected the world’s top ten wheat-producing countries to conduct research and further analyzed the relationship between drought degree and wheat yield loss. The results showed that when experiencing special types of drought, the probability of wheat yield reduction was >80% lower than its long-term average, and the risk growth rate tended to decrease with the increase in drought severity. That is to say, the risk difference between severe and extreme drought (China: 1.99%) is less than that between mild and severe drought (4.56%). This trend indicates that the yield response to drought is nonlinearly related to its severity. This may be because crops usually have specific adaptability and resistance, so the rate of change in crop yield loss under drought stress cannot remain stable. Under the combined influence of drought stress and crop tolerance and resistance, the rate of change in crop yield loss will generally gradually slow down. In addition, drought stress can lead to physiological changes in crops to resist the adverse effects of drought [81]. Crops undergo a series of physiological responses after drought stress, including stomatal closure, scavenging reactive oxygen species (ROS), activating antioxidant systems, osmotic regulation, affecting endogenous hormone balance, increasing abscisic acid (ABA), and antioxidant enzyme activity [82,83,84,85]. Mu et al. [86] studied the physiological response of winter wheat to different soil water conditions (intermittent drought, gradual drought, and continuous drought) and found that under intermittent drought conditions, winter wheat stimulated drought stress response indicators, resulting in higher ABA levels in leaves. The rate of increase is higher than other indicators, which improves the drought resistance of winter wheat, resulting in a significantly lower yield loss in this treatment than in gradual drought and continuous drought. Ru et al. [14] found that drought during the vegetative growth period of wheat weakened the adverse effects of drought after flowering. The stress response of wheat leaves was significant after intermittent moderate drought, which effectively enhanced the stress resistance of plants, provided continuous antioxidant protection for wheat, and reduced the proportion of wheat yield reduction. The results of this study show that the higher the degree of drought in the region, the greater the probability of winter wheat yield loss. Intermittent and short-term droughts are based on soil moisture content, and mild drought in this study is based on SPEI. The soil evapotranspiration of the two is the same, and the growth and drought conditions of the crop growth period are closer. Therefore, the results of this study are consistent with the physiological drought tolerance mechanism.
Drought often leads to severe crop yield loss, affecting food security and causing economic losses [87,88]. For example, Schmitt et al. [89] analyzed the impact of drought on crop yield and economy in Germany from 1995 to 2019, and the results showed that drought reduced winter wheat yield by 0.36% (1d), with an average annual loss of more than 23 million euros. Pinke et al. [90] analyzed the drought conditions of the 27 EU countries in 2022 and found that the drought caused an estimated loss of revenue of major grains and oilseeds of up to EUR 12.6 billion (about 0.09% of the GDP of the 27 EU countries). According to the statistics of the Ministry of Water Resources of the People’s Republic of China, the average grain loss of crops in China from 2008 to 2017 was 1.90 × 10¹⁰ kg, and the average economic loss accounted for 0.22% of GDP [91]. Therefore, developing a drought threshold prediction framework under future climate change is necessary. Revealing the impact of drought on crop production will help the government formulate targeted food security policies and reduce economic losses.

4.4. Research Limitations and Future Work

This study focuses on the yield loss probability of winter wheat under meteorological drought. Then, it quantifies the loss probability to visually compare the dynamic changes in drought thresholds in history and future periods. The yield of winter wheat is the basis of research. Many factors affect the yield, including winter wheat varieties [92], irrigation [93], fertilization management [94], field management measures [95], irrigation methods [96], and pest management [97]. This study used detrended yield to exclude the influence of non-meteorological conditions on winter wheat yield. The scope of the study was limited and may have an impact on the results. Different crop varieties in different regions may change the impact of drought on yield loss. Studies have shown that winter wheat drought-resistant varieties [77] under drought scenarios can help reduce the probability of yield loss in the region. At the same time, good irrigation management can effectively increase crop yield in areas with insufficient rainfall, adopt appropriate irrigation methods in drought-prone areas, or timely crop irrigation under drought scenarios to improve crop drought resistance [98]. In addition, some pests and diseases will not only destroy plant roots, affect the balance of microbial communities [99], accelerate soil water loss, and aggravate the impact of climate drought on crop yield. Moreover, pests and diseases can destroy crop organs and affect the growth and development of crops. In addition, other extreme weather events usually exacerbate the negative impact on yield. For example, the impact of combined extreme climates, such as drought and high temperatures, on agricultural production is more significant than that of a single extreme climate [34]. The loss of maize yield caused by the combination of the two extreme climates (18.75%) is higher than that of single maize yield (drought 17.32% and high temperature 1.27%) [100]. Low temperature is an important abiotic stress that negatively impacts crop growth, yield, and quality. Studies have shown that the combined events of frost and drought significantly impact wheat yield in the middle and late growth stages, resulting in an average annual yield loss of 6.4% in the Huang-Huai-Hai Plain. The spring frost has the most significant wheat yield loss (3.1%) [101]. Many tropical and subtropical crops, such as tomato, rice, and maize, are susceptible to low temperatures from 0 °C to 12 °C and cannot tolerate freezing conditions, which may affect yield [102]. Deep learning is a commonly used modeling technology in recent years, but it requires a lot of data for training. Manually collecting data is time-consuming and laborious, and it begins to use multi-source remote sensing data to estimate various data in the study area. Based on multiple remote sensing data sets-airborne LiDAR data, Landsat 8 optical remote sensing data, ALOS-2 radar data, and spaceborne GEDI LiDAR data DMR, RF, and RK models for FCH estimation, Luo et al. [103] constructed a mountain forest canopy height estimation framework based on deep learning and multi-source remote sensing data fusion. After combining the two, the estimation accuracy of the model is further improved. Xu et al. [104] developed the most advanced glacial lake mapping method based on deep learning technology and multi-source remote sensing images. They automatically drew a map of the glacial lake in the Himalayas of Bhutan. The model F1 score is as high as 0.91, revealing the region’s latest distribution of glacial lakes in 2021. Research on agricultural remote sensing technology is popular, but most of it is single research [105]. In the future, we can combine multi-source remote sensing data and alternative deep learning architecture [106] or integrated modeling methods [107] to develop a drought prediction framework with higher accuracy and a more extended prediction time series. Therefore, in the future research framework, we should not only consider the effects of soil characteristics, evapotranspiration rate, agronomic practices, and complex events such as extreme weather events (such as high temperature or cold damage) and drought on regional drought vulnerability and yield but also combine multi-source remote sensing data and alternative deep learning architectures or integrated modeling methods to expand the new perspective of the drought prediction framework. In summary, drought is a problem that agriculture has always faced. We recommend that growers and stakeholders use models to predict drought thresholds while learning crop variety characteristics and updating field management measures to improve crop drought resistance and enhance the ability of drought thresholds to trigger risk responses related to crop yield loss.

5. Conclusions

This study established a two-dimensional Copula conditional probability framework and quantified the drought threshold that triggers yield loss for the first time. The CNN-LSTM coupling model proposed in this study can automatically extract features and predict time series, which solves the feature extraction problem. This framework provides new insights for identifying winter wheat’s drought vulnerability under different future drought scenarios. The results showed that winter wheat was greatly affected by climate drought, and there were regional differences in the drought threshold of winter wheat yield loss in Henan Province. In the future research framework, we should not only consider the effects of soil characteristics, evapotranspiration rate, agronomic practices, and complex events such as extreme weather events (such as high temperature or cold damage) and drought on regional drought vulnerability and yield but also combine multi-source remote sensing data and alternative deep learning architectures or integrated modeling methods to expand the new perspective of the drought prediction framework. These research results can help the principal winter wheat-producing areas reduce the waste of water resources and achieve sustainable irrigation. It also helps the agricultural sector and growers to formulate appropriate risk response strategies based on the predicted drought threshold. In addition, the results also provide a valuable reference for the breeding and development of drought-resistant crop varieties in arid and fragile areas in the future.

Supplementary Materials

The following supporting information can be downloaded at: https://www.mdpi.com/article/10.3390/agronomy15040954/s1, Figure S1: Schematic diagram of CNN-LSTM coupled model; Figure S2: Schematic diagram of model sliding window, Figure S3: Comparing the detrended time series in eastern Henan with SPEI over the same period, Figure S4: Comparing the detrended time series in western Henan with SPEI over the same period, Figure S5: Comparing the detrended time series in southern Henan with SPEI over the same period, Figure S6: Comparing the detrended time series in northern Henan with SPEI over the same period, Figure S7. Comparing the detrended time series in northern Henan with SPEI over the same period. Table S1: Division of winter wheat planting area in Henan Province; Table S2: Information for CNRM-CM6-1 selected in CMIP6; Table S3: Characteristics of the one selected SSP scenarios; Table S4: The Candidate Hyperparameters of CNN-LSTM model; Table S5: Probability density functions of 10 marginal distributions; Table S6: Probability density functions of five commonly used binary copula.

Author Contributions

Conceptualization, Y.Z. and J.M.; methodology, Y.Z.; software, Y.Z.; validation, Y.Z., B.C. and X.Z.; formal analysis, L.L.; investigation, Y.Z.; resources, X.Z.; data curation, Y.Z.; writing—original draft preparation, Y.Z.; writing—review and editing, J.M.; visualization, Y.Z.; supervision, Y.Z.; project administration, B.C., Y.D. and Y.C.; funding acquisition, J.M. All authors have read and agreed to the published version of the manuscript.

Funding

This research was funded by the Projects in Henan Province, grant numbers 241111112600 (Funder: Jianqin Ma) and special fund of Henan Key Laboratory of Water Pollution Control and Rehabilitation Technology, grant numbers CJSZ2024008 (Funder: Bifeng Cui).

Data Availability Statement

The data sets used in the current study are available from the corresponding author on reasonable request.

Conflicts of Interest

Author Xinxi Zhang was employed by the company Zhengzhou Nongren Irrigation Technology Co., Ltd. The remaining authors declare that the research was conducted in the absence of any commercial or financial relationships that could be construed as a potential conflict of interest.

References

  1. Bolan, S.; Padhye, L.P.; Jasemizad, T.; Govarthanan, M.; Karmegam, N.; Wijesekara, H.; Amarasiri, D.; Hou, D.; Zhou, P.; Biswal, B.K.; et al. Impacts of Climate Change on the Fate of Contaminants through Extreme Weather Events. Sci. Total Environ. 2024, 909, 168388. [Google Scholar] [CrossRef] [PubMed]
  2. Song, Y.; Zhang, B.; Wang, J.; Kwek, K. The Impact of Climate Change on China’s Agricultural Green Total Factor Productivity. Technol. Forecast. Soc. Change 2022, 185, 122054. [Google Scholar] [CrossRef]
  3. Lefèvre, J.; Le Gallic, T.; Fragkos, P.; Mercure, J.-F.; Simsek, Y.; Paroussos, L. Global Socio-Economic and Climate Change Mitigation Scenarios through the Lens of Structural Change. Glob. Environ. Change 2022, 74, 102510. [Google Scholar] [CrossRef]
  4. Dang, C.; Zhang, H.; Yao, C.; Mu, D.; Lyu, F.; Zhang, Y.; Zhang, S. IWRAM: A Hybrid Model for Irrigation Water Demand Forecasting to Quantify the Impacts of Climate Change. Agric. Water Manag. 2024, 291, 108643. [Google Scholar] [CrossRef]
  5. Elsadek, E.A.; Zhang, K.; Hamoud, Y.A.; Mousa, A.; Awad, A.; Abdallah, M.; Shaghaleh, H.; Hamad, A.A.A.; Jamil, M.T.; Elbeltagi, A. Impacts of Climate Change on Rice Yields in the Nile River Delta of Egypt: A Large-Scale Projection Analysis Based on CMIP6. Agric. Water Manag. 2024, 292, 108673. [Google Scholar] [CrossRef]
  6. Radmehr, R.; Brorsen, B.W.; Shayanmehr, S. Adapting to Climate Change in Arid Agricultural Systems: An Optimization Model for Water-Energy-Food Nexus Sustainability. Agric. Water Manag. 2024, 303, 109052. [Google Scholar] [CrossRef]
  7. Wang, D.; Li, Y.; Zhang, B.; Jiang, T.; Wu, S.; Wu, W.; Li, Y.; He, J.; Liu, D.; Dong, Q.; et al. Explore the Evolution of Winter Wheat Production and Its Response to Climate Change under Varying Precipitation Years in the Loess Plateau of China. Agric. Water Manag. 2025, 309, 109335. [Google Scholar] [CrossRef]
  8. Zobeidi, T.; Yaghoubi, J.; Yazdanpanah, M. Farmers’ Incremental Adaptation to Water Scarcity: An Application of the Model of Private Proactive Adaptation to Climate Change (MPPACC). Agric. Water Manag. 2022, 264, 107528. [Google Scholar] [CrossRef]
  9. Nouri, M.; Homaee, M.; Pereira, L.S.; Bybordi, M. Water Management Dilemma in the Agricultural Sector of Iran: A Review Focusing on Water Governance. Agric. Water Manag. 2023, 288, 108480. [Google Scholar] [CrossRef]
  10. Xing, Y.; Zhang, T.; Jiang, W.; Li, P.; Shi, P.; Xu, G.; Cheng, S.; Cheng, Y.; Fan, Z.; Wang, X. Effects of Irrigation and Fertilization on Different Potato Varieties Growth, Yield and Resources Use Efficiency in the Northwest China. Agric. Water Manag. 2022, 261, 107351. [Google Scholar] [CrossRef]
  11. Bwambale, E.; Abagale, F.K.; Anornu, G.K. Data-Driven Model Predictive Control for Precision Irrigation Management. Smart Agric. Technol. 2023, 3, 100074. [Google Scholar] [CrossRef]
  12. Talari, G.; Cummins, E.; McNamara, C.; O’Brien, J. State of the Art Review of Big Data and Web-Based Decision Support Systems (DSS) for Food Safety Risk Assessment with Respect to Climate Change. Trends Food Sci. Technol. 2022, 126, 192–204. [Google Scholar] [CrossRef]
  13. Lu, B.; Lin, Y.; He, C.; Li, X.; Zhang, W.; He, X. Dark Septate Endophyte Enhances Ammopiptanthus Mongolicus Growth during Drought Stress through the Modulation of Leaf Morphology and Physiology Characteristics. Ind. Crops Prod. 2025, 225, 120544. [Google Scholar] [CrossRef]
  14. Ru, C.; Hu, X.; Chen, D.; Wang, W. Drought Stimulus Enhanced Stress Tolerance in Winter Wheat (Triticum aestivum L.) by Improving Physiological Characteristics, Growth, and Water Productivity. Plant Physiol. Biochem. 2024, 214, 108906. [Google Scholar] [CrossRef]
  15. Duan, H.-X.; Luo, C.-L.; Zhu, Y.; Zhao, L.; Wang, J.; Wang, W.; Xiong, Y.-C. Arbuscular Mycorrhizal Fungus Activates Wheat Physiology for Higher Reproductive Allocation under Drought Stress in Primitive and Modern Wheat. Eur. J. Agron. 2024, 161, 127376. [Google Scholar] [CrossRef]
  16. Shoormij, F.; Mirlohi, A.; Saeidi, G.; Sabzalian, M.R.; Shirvani, M. Zinc Foliar Application May Alleviate Drought Stress in Wheat Species through Physiological Changes. Plant Stress 2024, 13, 100534. [Google Scholar] [CrossRef]
  17. Wang, X.; Zhao, W.; Wei, X.; Sun, Y.; Dong, S. Molecular Mechanism of Drought Resistance in Soybean Roots Revealed Using Physiological and Multi-Omics Analyses. Plant Physiol. Biochem. 2024, 208, 108451. [Google Scholar] [CrossRef] [PubMed]
  18. Shi, J.; Sang, Y.-F.; Sun, S.; Aghakouchak, A.; Hu, S.; Sandeep Dash, S. Development of a Leaf Area Index-Based Relative Threshold Method for Identifying Agricultural Drought Areas. J. Hydrol. 2024, 641, 131846. [Google Scholar] [CrossRef]
  19. Zhang, R.; Shangguan, W.; Liu, J.; Dong, W.; Wu, D. Assessing Meteorological and Agricultural Drought Characteristics and Drought Propagation in Guangdong, China. J. Hydrol. Reg. Stud. 2024, 51, 101611. [Google Scholar] [CrossRef]
  20. Khaledi-Alamdari, M.; Majnooni-Heris, A.; Fakheri-Fard, A.; Russo, A. Probabilistic Climate Risk Assessment in Rainfed Wheat Yield: Copula Approach Using Water Requirement Satisfaction Index. Agric. Water Manag. 2023, 289, 108542. [Google Scholar] [CrossRef]
  21. He, Y.; Xie, Y.; Liu, J.; Hu, Z.; Liu, J.; Cheng, Y.; Zhang, L.; Wang, Z.; Li, M. Generation of 1 Km High Resolution Standardized Precipitation Evapotranspiration Index for Drought Monitoring over China Using Google Earth Engine. Int. J. Appl. Earth Obs. Geoinf. 2024, 135, 104296. [Google Scholar] [CrossRef]
  22. Li, L.; Peng, Q.; Wang, M.; Cao, Y.; Gu, X.; Cai, H. Quantitative Analysis of Vegetation Drought Propagation Process and Uncertainty in the Yellow River Basin. Agric. Water Manag. 2024, 295, 108775. [Google Scholar] [CrossRef]
  23. Ma, Y.; Ren, J.; Kang, S.; Niu, J.; Tong, L. Spatial-Temporal Dynamics of Meteorological and Agricultural Drought in Northwest China: Propagation, Drivers and Prediction. J. Hydrol. 2025, 650, 132492. [Google Scholar] [CrossRef]
  24. Pei, W.; Hao, L.; Fu, Q.; Ren, Y.; Li, T. The Standardized Precipitation Evapotranspiration Index Based on Cumulative Effect Attenuation. J. Hydrol. 2024, 635, 131148. [Google Scholar] [CrossRef]
  25. Fang, D.; Chen, J.; Wang, S.; Chen, B. Can Agricultural Mechanization Enhance the Climate Resilience of Food Production? Evidence from China. Appl. Energy 2024, 373, 123928. [Google Scholar] [CrossRef]
  26. Zhang, Z.; Li, C.; Deng, J.; Chanussot, J.; Hong, D. Adaptive High-Quality Sampling for Winter Wheat Early Mapping: A Novel Cascade Index and Machine Learning Approach. Smart Agric. Technol. 2025, 10, 100725. [Google Scholar] [CrossRef]
  27. Cao, J.; Luo, Y.; Zhang, X.; Fan, L.; Tao, J.; Nam, W.-H.; Sur, C.; He, Y.; Gulakhmadov, A.; Niyogi, D. Assessing the Responsiveness of Multiple Microwave Remote Sensing Vegetation Optical Depth Indices to Drought on Crops in Midwest US. Int. J. Appl. Earth Obs. Geoinf. 2024, 132, 104072. [Google Scholar] [CrossRef]
  28. Gao, S.; Huang, S.; Singh, V.P.; Deng, X.; Duan, L.; Leng, G.; Guo, W.; Li, Y.; Zhang, L.; Han, Z.; et al. Dynamic Response of Vegetation to Meteorological Drought and Driving Mechanisms in Mongolian Plateau. J. Hydrol. 2025, 650, 132541. [Google Scholar] [CrossRef]
  29. Geng, G.; Zhang, B.; Gu, Q.; He, Z.; Zheng, R. Drought Propagation Characteristics across China: Time, Probability, and Threshold. J. Hydrol. 2024, 631, 130805. [Google Scholar] [CrossRef]
  30. Wang, B.; Li, L.; Feng, P.; Chen, C.; Luo, J.-J.; Taschetto, A.S.; Harrison, M.T.; Liu, K.; Liu, D.L.; Yu, Q.; et al. Probabilistic Analysis of Drought Impact on Wheat Yield and Climate Change Implications. Weather Clim. Extrem. 2024, 45, 100708. [Google Scholar] [CrossRef]
  31. Wei, X.; Huang, S.; Liu, D.; Li, J.; Huang, Q.; Leng, G.; Shi, H.; Peng, J. The Response of Agricultural Drought to Meteorological Drought Modulated by Air Temperature. J. Hydrol. 2024, 639, 131626. [Google Scholar] [CrossRef]
  32. Feiziasl, V.; Jafarzadeh, J.; Sadeghzadeh, B.; Mousavi Shalmani, M.A. Water Deficit Index to Evaluate Water Stress Status and Drought Tolerance of Rainfed Barley Genotypes in Cold Semi-Arid Area of Iran. Agric. Water Manag. 2022, 262, 107395. [Google Scholar] [CrossRef]
  33. Li, P.; Huang, Q.; Huang, S.; Leng, G.; Peng, J.; Wang, H.; Zheng, X.; Li, Y.; Fang, W. Various Maize Yield Losses and Their Dynamics Triggered by Drought Thresholds Based on Copula-Bayesian Conditional Probabilities. Agric. Water Manag. 2022, 261, 107391. [Google Scholar] [CrossRef]
  34. Zhu, X.; Liu, T.; Xu, K.; Chen, C. The Impact of High Temperature and Drought Stress on the Yield of Major Staple Crops in Northern China. J. Environ. Manag. 2022, 314, 115092. [Google Scholar] [CrossRef] [PubMed]
  35. Guo, W.; Huang, S.; Huang, Q.; Leng, G.; Mu, Z.; Han, Z.; Wei, X.; She, D.; Wang, H.; Wang, Z.; et al. Drought Trigger Thresholds for Different Levels of Vegetation Loss in China and Their Dynamics. Agric. For. Meteorol. 2023, 331, 109349. [Google Scholar] [CrossRef]
  36. Veettil, A.V.; Mishra, A.K. Quantifying Thresholds for Advancing Impact-Based Drought Assessment Using Classification and Regression Tree (CART) Models. J. Hydrol. 2023, 625, 129966. [Google Scholar] [CrossRef]
  37. Ayoub Shaikh, T.; Rasool, T.; Rasheed Lone, F. Towards Leveraging the Role of Machine Learning and Artificial Intelligence in Precision Agriculture and Smart Farming. Comput. Electron. Agric. 2022, 198, 107119. [Google Scholar] [CrossRef]
  38. Yang, C.; Liu, C.; Liu, Y.; Gao, Y.; Xing, X.; Ma, X. Prediction of Drought Trigger Thresholds for Future Winter Wheat Yield Losses in China Based on the DSSAT-CERES-Wheat Model and Copula Conditional Probabilities. Agric. Water Manag. 2024, 299, 108881. [Google Scholar] [CrossRef]
  39. Huang, J.; Gómez-Dans, J.L.; Huang, H.; Ma, H.; Wu, Q.; Lewis, P.E.; Liang, S.; Chen, Z.; Xue, J.-H.; Wu, Y.; et al. Assimilation of Remote Sensing into Crop Growth Models: Current Status and Perspectives. Agric. For. Meteorol. 2019, 276–277, 107609. [Google Scholar] [CrossRef]
  40. Zhang, L.; Li, C.; Wu, X.; Xiang, H.; Jiao, Y.; Chai, H. BO-CNN-BiLSTM Deep Learning Model Integrating Multisource Remote Sensing Data for Improving Winter Wheat Yield Estimation. Front. Plant Sci. 2024, 15, 1500499. [Google Scholar] [CrossRef]
  41. Li, Y.; Guan, K.; Yu, A.; Peng, B.; Zhao, L.; Li, B.; Peng, J. Toward Building a Transparent Statistical Model for Improving crop Yield Prediction: Modeling Rainfed Corn in the U.S. Field Crops Res. 2019, 234, 55–65. [Google Scholar] [CrossRef]
  42. Elbeltagi, A.; Srivastava, A.; Ehsan, M.; Sharma, G.; Yu, J.; Khadke, L.; Gautam, V.K.; Awad, A.; Jinsong, D. Advanced Stacked Integration Method for Forecasting Long-Term Drought Severity: CNN with Machine Learning Models. J. Hydrol. Reg. Stud. 2024, 53, 101759. [Google Scholar] [CrossRef]
  43. Dupuis, A.; Dadouchi, C.; Agard, B. Methodology for Multi-Temporal Prediction of Crop Rotations Using Recurrent Neural Networks. Smart Agric. Technol. 2023, 4, 100152. [Google Scholar] [CrossRef]
  44. Han, J.; Shi, L.; Yang, Q.; Chen, Z.; Yu, J.; Zha, Y. Rice Yield Estimation Using a CNN-Based Image-Driven Data Assimilation Framework. Field Crops Res. 2022, 288, 108693. [Google Scholar] [CrossRef]
  45. Tian, H.; Wang, P.; Tansey, K.; Zhang, J.; Zhang, S.; Li, H. An LSTM Neural Network for Improving Wheat Yield Estimates by Integrating Remote Sensing Data and Meteorological Data in the Guanzhong Plain, PR China. Agric. For. Meteorol. 2021, 310, 108629. [Google Scholar] [CrossRef]
  46. Sagheer, A.; Kotb, M. Time Series Forecasting of Petroleum Production Using Deep LSTM Recurrent Networks. Neurocomputing 2019, 323, 203–213. [Google Scholar] [CrossRef]
  47. Pan, S.; Yang, B.; Wang, S.; Guo, Z.; Wang, L.; Liu, J.; Wu, S. Oil Well Production Prediction Based on CNN-LSTM Model with Self-Attention Mechanism. Energy 2023, 284, 128701. [Google Scholar] [CrossRef]
  48. Zha, W.; Liu, Y.; Wan, Y.; Luo, R.; Li, D.; Yang, S.; Xu, Y. Forecasting Monthly Gas Field Production Based on the CNN-LSTM Model. Energy 2022, 260, 124889. [Google Scholar] [CrossRef]
  49. Agga, A.; Abbou, A.; Labbadi, M.; Houm, Y.E.; Ou Ali, I.H. CNN-LSTM: An Efficient Hybrid Deep Learning Architecture for Predicting Short-Term Photovoltaic Power Production. Electr. Power Syst. Res. 2022, 208, 107908. [Google Scholar] [CrossRef]
  50. Saini, P.; Nagpal, B.; Garg, P.; Kumar, S. CNN-BI-LSTM-CYP: A Deep Learning Approach for Sugarcane Yield Prediction. Sustain. Energy Technol. Assess. 2023, 57, 103263. [Google Scholar] [CrossRef]
  51. Galmarini, S.; Solazzo, E.; Ferrise, R.; Srivastava, A.K.; Ahmed, M.; Asseng, S.; Cannon, A.J.; Dentener, F.; De Sanctis, G.; Gaiser, T.; et al. Assessing the Impact on Crop Modelling of Multi- and Uni-Variate Climate Model Bias Adjustments. Agric. Syst. 2024, 215, 103846. [Google Scholar] [CrossRef]
  52. Shoukat, M.R.; Wang, J.; Habib-ur-Rahman, M.; Hui, X.; Hoogenboom, G.; Yan, H. Adaptation Strategies for Winter Wheat Production at Farmer Fields under a Changing Climate: Employing Crop and Multiple Global Climate Models. Agric. Syst. 2024, 220, 104066. [Google Scholar] [CrossRef]
  53. Wang, T.; Tu, X.; Singh, V.P.; Chen, X.; Lin, K.; Zhou, Z.; Zhu, J. A CMIP6-Based Framework for Propagation from Meteorological and Hydrological Droughts to Socioeconomic Drought. J. Hydrol. 2023, 623, 129782. [Google Scholar] [CrossRef]
  54. Xiang, K.; Wang, B.; Liu, D.L.; Chen, C.; Waters, C.; Huete, A.; Yu, Q. Probabilistic Assessment of Drought Impacts on Wheat Yield in South-Eastern Australia. Agric. Water Manag. 2023, 284, 108359. [Google Scholar] [CrossRef]
  55. Xu, P.; Zhang, Z.; Wang, D.; Singh, V.P.; Zhang, C.; Fu, X.; Wang, L. A Time-Varying Copula-Based Approach to Quantify the Effects of Antecedent Drought on Hot Extremes. J. Hydrol. 2023, 627, 130418. [Google Scholar] [CrossRef]
  56. Zha, X.; Sun, H.; Jiang, H.; Cao, L.; Xue, J.; Gui, D.; Yan, D.; Tuo, Y. Coupling Bayesian Network and Copula Theory for Water Shortage Assessment: A Case Study in Source Area of the South-to-North Water Division Project (SNWDP). J. Hydrol. 2023, 620, 129434. [Google Scholar] [CrossRef]
  57. Long, J.; Xu, C.; Wang, Y.; Zhang, J. From Meteorological to Agricultural Drought: Propagation Time and Influencing Factors over Diverse Underlying Surfaces Based on CNN-LSTM Model. Ecol. Inform. 2024, 82, 102681. [Google Scholar] [CrossRef]
  58. Li, Z.; Liu, Q.; Ma, Z. Influences of Graupel Microphysics on CMA-GFS Simulation of Summer Regional Precipitation. J. Meteorol. Res. 2024, 38, 27–38. [Google Scholar] [CrossRef]
  59. Dutta, R.; Chanda, K.; Maity, R. Future of Solar Energy Potential in a Changing Climate Across the World: A CMIP6 Multi-Model Ensemble Analysis. Renew. Energy 2022, 188, 819–829. [Google Scholar] [CrossRef]
  60. John, A.; Douville, H.; Ribes, A.; Yiou, P. Quantifying CMIP6 Model Uncertainties in Extreme Precipitation Projections. Weather Clim. Extrem. 2022, 36, 100435. [Google Scholar] [CrossRef]
  61. Eekhout, J.P.C.; Delsman, I.; Baartman, J.E.M.; van Eupen, M.; van Haren, C.; Contreras, S.; Martínez-López, J.; de Vente, J. How Future Changes in Irrigation Water Supply and Demand Affect Water Security in a Mediterranean Catchment. Agric. Water Manag. 2024, 297, 108818. [Google Scholar] [CrossRef]
  62. Wang, M.; Fu, X.; Zhang, D.; Chen, F.; Liu, M.; Zhou, S.; Su, J.; Tan, S.K. Assessing Urban Flooding Risk in Response to Climate Change and Urbanization Based on Shared Socio-Economic Pathways. Sci. Total Environ. 2023, 880, 163470. [Google Scholar] [CrossRef] [PubMed]
  63. Li, X.; Babovic, V. Multi-Site Multivariate Downscaling of Global Climate Model Outputs: An Integrated Framework Combining Quantile Mapping, Stochastic Weather Generator and Empirical Copula Approaches. Clim. Dyn. 2019, 52, 5775–5799. [Google Scholar] [CrossRef]
  64. Dai, Y.; Shangguan, W.; Duan, Q.; Liu, B.; Fu, S.; Niu, G. Development of a China Dataset of Soil Hydraulic Parameters Using Pedotransfer Functions for Land Surface Modeling. J. Hydrometeorol. 2013, 14, 869–887. [Google Scholar] [CrossRef]
  65. Shen, Z.; Fan, X.; Zhang, L.; Yu, H. Wind Speed Prediction of Unmanned Sailboat Based on CNN and LSTM Hybrid Neural Network. Ocean Eng. 2022, 254, 111352. [Google Scholar] [CrossRef]
  66. Yao, Z.; Wang, Z.; Wang, D.; Wu, J.; Chen, L. An Ensemble CNN-LSTM and GRU Adaptive Weighting Model Based Improved Sparrow Search Algorithm for Predicting Runoff Using Historical Meteorological and Runoff Data as Input. J. Hydrol. 2023, 625, 129977. [Google Scholar] [CrossRef]
  67. Vicente-Serrano, S.M.; Beguería, S.; López-Moreno, J.I. A Multiscalar Drought Index Sensitive to Global Warming: The Standardized Precipitation Evapotranspiration Index. J. Clim. 2010, 23, 1696–1718. [Google Scholar] [CrossRef]
  68. Lee, S.; Moriasi, D.N.; Danandeh Mehr, A.; Mirchi, A. Sensitivity of Standardized Precipitation and Evapotranspiration Index (SPEI) to the Choice of SPEI Probability Distribution and Evapotranspiration Method. J. Hydrol. Reg. Stud. 2024, 53, 101761. [Google Scholar] [CrossRef]
  69. Lingua, L.N.; Carcedo, A.J.P.; Giménez, V.D.; Maddonni, G.A.; Ciampitti, I.A. Environmental Characterization for Rainfed Maize Production in the US Great Plains Region. Agric. For. Meteorol. 2024, 359, 110286. [Google Scholar] [CrossRef]
  70. Meng, H.; Qian, L. Performances of Different Yield-Detrending Methods in Assessing the Impacts of Agricultural Drought and Flooding: A Case Study in the Middle-and-Lower Reach of the Yangtze River, China. Agric. Water Manag. 2024, 296, 108812. [Google Scholar] [CrossRef]
  71. Feng, S.; Hao, Z.; Zhang, X.; Hao, F. Changes in Climate-Crop Yield Relationships Affect Risks of Crop Yield Reduction. Agric. For. Meteorol. 2021, 304–305, 108401. [Google Scholar] [CrossRef]
  72. Meng, H.; Qian, L.; Duan, K. Evaluating the Impacts of Flooding on Crop Yields by Different Meteorological Indices: A Regional Case Study in the Middle-Lower Reach of the Yangtze River, China. Ecol. Indic. 2024, 162, 112068. [Google Scholar] [CrossRef]
  73. Yu, M.; Zhang, J.; Wei, L.; Wang, G.; Dong, W.; Liu, X. Impact of Soil Textures on Agricultural Drought Evolution and Field Capacity Estimation in Humid Regions. J. Hydrol. 2023, 626, 130257. [Google Scholar] [CrossRef]
  74. Yang, L.; Feng, Q.; Zhu, M.; Wang, L.; Alizadeh, M.R.; Adamowski, J.F.; Wen, X.; Yin, Z. Variation in Actual Evapotranspiration and Its Ties to Climate Change and Vegetation Dynamics in Northwest China. J. Hydrol. 2022, 607, 127533. [Google Scholar] [CrossRef]
  75. Tian, H.; Wang, P.; Tansey, K.; Zhang, S.; Zhang, J.; Li, H. An IPSO-BP Neural Network for Estimating Wheat Yield Using Two Remotely Sensed Variables in the Guanzhong Plain, PR China. Comput. Electron. Agric. 2020, 169, 105180. [Google Scholar] [CrossRef]
  76. Chen, Y.; Zhang, J.-H.; Chen, M.-X.; Zhu, F.-Y.; Song, T. Optimizing Water Conservation and Utilization with a Regulated Deficit Irrigation Strategy in Woody Crops: A Review. Agric. Water Manag. 2023, 289, 108523. [Google Scholar] [CrossRef]
  77. Li, L.; Li, H.; Liu, N.; Lu, Y.; Shao, L.; Chen, S.; Zhang, X. Water Use Characteristics and Drought Tolerant Ability of Different Winter Wheat Cultivars Assessed under Whole Growth Circle and at Seedling Stage. Agric. Water Manag. 2024, 300, 108921. [Google Scholar] [CrossRef]
  78. Kelly, T.D.; Foster, T.; Schultz, D.M. Assessing the Value of Adapting Irrigation Strategies Within the Season. Agric. Water Manag. 2023, 275, 107986. [Google Scholar] [CrossRef]
  79. Yang, H.; Feng, X.; Wang, H.; Yan, H.; Zhao, P.; Gao, F.; Guo, X.; Xie, B. Long Time-Series Variation of Crop Yield under Drought Stress and Drought Vulnerability Curves in Songnen Plain, Northeast China. Ecol. Indic. 2023, 154, 110624. [Google Scholar] [CrossRef]
  80. Leng, G.; Hall, J. Crop Yield Sensitivity of Global Major Agricultural Countries to Droughts and the Projected Changes in the Future. Sci. Total Environ. 2019, 654, 811–821. [Google Scholar] [CrossRef]
  81. Mu, Q.; Cai, H.; Sun, S.; Wen, S.; Xu, J.; Dong, M.; Saddique, Q. The Physiological Response of Winter Wheat under Short-Term Drought Conditions and the Sensitivity of Different Indices to Soil Water Changes. Agric. Water Manag. 2021, 243, 106475. [Google Scholar] [CrossRef]
  82. Wang, X.; Chen, J.; Ge, J.; Huang, M.; Cai, J.; Zhou, Q.; Dai, T.; Mur, L.A.J.; Jiang, D. The Different Root Apex Zones Contribute to Drought Priming Induced Tolerance to a Reoccurring Drought Stress in Wheat. Crop J. 2021, 9, 1088–1097. [Google Scholar] [CrossRef]
  83. Wang, X.; Li, Q.; Xie, J.; Huang, M.; Cai, J.; Zhou, Q.; Dai, T.; Jiang, D. Abscisic Acid and Jasmonic Acid Are Involved in Drought Priming-Induced Tolerance to Drought in Wheat. Crop J. 2021, 9, 120–132. [Google Scholar] [CrossRef]
  84. Gómez-Candón, D.; Mathieu, V.; Martinez, S.; Labbé, S.; Delalande, M.; Regnard, J.-L. Unravelling the Responses of Different Apple Varieties to Water Constraints by Continuous Field Thermal Monitoring. Sci. Hortic. 2022, 299, 111013. [Google Scholar] [CrossRef]
  85. Bao, X.; Hou, X.; Duan, W.; Yin, B.; Ren, J.; Wang, Y.; Liu, X.; Gu, L.; Zhen, W. Screening and Evaluation of Drought Resistance Traits of Winter Wheat in the North China Plain. Front. Plant Sci. 2023, 14, 1194759. [Google Scholar] [CrossRef]
  86. Mu, Q.; Xu, J.; Yu, M.; Guo, Z.; Dong, M.; Cao, Y.; Zhang, S.; Sun, S.; Cai, H. Physiological Response of Winter Wheat (Triticum aestivum L.) during Vegetative Growth to Gradual, Persistent and Intermittent Drought. Agric. Water Manag. 2022, 274, 107911. [Google Scholar] [CrossRef]
  87. Shi, W.; Wang, M.; Liu, Y. Crop Yield and Production Responses to Climate Disasters in China. Sci. Total Environ. 2021, 750, 141147. [Google Scholar] [CrossRef]
  88. Espinosa-Tasón, J.; Berbel, J.; Gutiérrez-Martín, C.; Musolino, D.A. Socioeconomic Impact of 2005–2008 Drought in Andalusian Agriculture. Sci. Total Environ. 2022, 826, 154148. [Google Scholar] [CrossRef]
  89. Schmitt, J.; Offermann, F.; Söder, M.; Frühauf, C.; Finger, R. Extreme Weather Events Cause Significant Crop Yield Losses at the Farm Level in German Agriculture. Food Policy 2022, 112, 102359. [Google Scholar] [CrossRef]
  90. Pinke, Z.; Ács, T.; Kalicz, P.; Kern, Z.; Jambor, A. Hotspots in the EU-27 and Economic Consequences of the 2022 Spring-Summer Drought. EuroChoices 2024, 23, 28–33. [Google Scholar] [CrossRef]
  91. Geng, G.; Yang, R.; Chen, Q.; Deng, T.; Yue, M.; Zhang, B.; Gu, Q. Tracking the Influence of Drought Events on Winter Wheat Using Long-Term Gross Primary Production and Yield in the Wei River Basin, China. Agric. Water Manag. 2023, 275, 108019. [Google Scholar] [CrossRef]
  92. Zhao, K.; Tao, Y.; Liu, M.; Yang, D.; Zhu, M.; Ding, J.; Zhu, X.; Guo, W.; Zhou, G.; Li, C. Does Temporary Heat Stress or Low Temperature Stress Similarly Affect Yield, Starch, and Protein of Winter Wheat Grain during Grain Filling? J. Cereal Sci. 2022, 103, 103408. [Google Scholar] [CrossRef]
  93. Chalise, D.P.; Snider, J.L.; Hand, L.C.; Roberts, P.; Vellidis, G.; Ermanis, A.; Collins, G.D.; Lacerda, L.N.; Cohen, Y.; Pokhrel, A.; et al. Cultivar, Irrigation Management, and Mepiquat Chloride Strategy: Effects on Cotton Growth, Maturity, Yield, and Fiber Quality. Field Crops Res. 2022, 286, 108633. [Google Scholar] [CrossRef]
  94. Li, H.; Zhang, Y.; Sun, Y.; Liu, P.; Zhang, Q.; Wang, X.; Wang, R.; Li, J. Long-Term Effects of Optimized Fertilization, Tillage and Crop Rotation on Soil Fertility, Crop Yield and Economic Profit on the Loess Plateau. Eur. J. Agron. 2023, 143, 126731. [Google Scholar] [CrossRef]
  95. Li, Y.; Huang, G.; Chen, Z.; Xiong, Y.; Huang, Q.; Xu, X.; Huo, Z. Effects of Irrigation and Fertilization on Grain Yield, Water and Nitrogen Dynamics and Their Use Efficiency of Spring Wheat Farmland in an Arid Agricultural Watershed of Northwest China. Agric. Water Manag. 2022, 260, 107277. [Google Scholar] [CrossRef]
  96. Slamini, M.; Sbaa, M.; Arabi, M.; Darmous, A. Review on Partial Root-Zone Drying Irrigation: Impact on Crop Yield, Soil and Water Pollution. Agric. Water Manag. 2022, 271, 107807. [Google Scholar] [CrossRef]
  97. Riemens, M.; Sønderskov, M.; Moonen, A.-C.; Storkey, J.; Kudsk, P. An Integrated Weed Management Framework: A Pan-European Perspective. Eur. J. Agron. 2022, 133, 126443. [Google Scholar] [CrossRef]
  98. Zeng, R.; Lin, X.; Welch, S.M.; Yang, S.; Huang, N.; Sassenrath, G.F.; Yao, F. Impact of Water Deficit and Irrigation Management on Winter Wheat Yield in China. Agric. Water Manag. 2023, 287, 108431. [Google Scholar] [CrossRef]
  99. Zhou, W.; Li, M.; Achal, V. A comprehensive Review on Environmental and Human Health Impacts of Chemical Pesticide Usage. Emerg. Contam. 2025, 11, 100410. [Google Scholar] [CrossRef]
  100. Li, E.; Zhao, J.; Pullens, J.W.M.; Yang, X. The Compound Effects of Drought and High Temperature Stresses Will Be the Main Constraints on Maize Yield in Northeast China. Sci. Total Environ. 2022, 812, 152461. [Google Scholar] [CrossRef]
  101. Zhao, Y.; Xiao, L.; Tang, Y.; Yao, X.; Cheng, T.; Zhu, Y.; Cao, W.; Tian, Y. Spatio-Temporal Change of Winter Wheat Yield and Its Quantitative Responses to Compound Frost-Dry Events—An Example of the Huang-Huai-Hai Plain of China from 2001 to 2020. Sci. Total Environ. 2024, 940, 173531. [Google Scholar] [CrossRef] [PubMed]
  102. Delarue, M.; Benhamed, M.; Fragkostefanakis, S. The Role of Epigenetics in Tomato Stress Adaptation. New Crops 2025, 2, 100044. [Google Scholar] [CrossRef]
  103. Luo, H.; Ou, G.; Yue, C.; Zhu, B.; Wu, Y.; Zhang, X.; Lu, C.; Tang, J. A Framework for Montane Forest Canopy Height Estimation via Integrating Deep Learning and Multi-Source Remote Sensing Data. Int. J. Appl. Earth Obs. Geoinf. 2025, 138, 104474. [Google Scholar] [CrossRef]
  104. Xu, X.; Liu, L.; Huang, L.; Hu, Y. Combined Use of Multi-Source Satellite Imagery and Deep Learning for Automated Mapping of Glacial Lakes in the Bhutan Himalaya. Sci. Remote Sens. 2024, 10, 100157. [Google Scholar] [CrossRef]
  105. Cai, S.; Zuo, D.; Wang, H.; Xu, Z.; Wang, G.; Yang, H. Assessment of Agricultural Drought Based on Multi-Source Remote Sensing Data in a Major Grain Producing Area of Northwest China. Agric. Water Manag. 2023, 278, 108142. [Google Scholar] [CrossRef]
  106. Shi, H.; Li, Z.; Xiang, Y.; Tang, Z.; Sun, T.; Du, R.; Li, W.; Liu, X.; Huang, X.; Liu, Y.; et al. Integrating Multi-Source Remote Sensing and Machine Learning for Root-Zone Soil Moisture and Yield Prediction of Winter Oilseed Rape (Brassica napus L.): A New Perspective from the Temperature-Vegetation Index Feature Space. Agric. Water Manag. 2024, 305, 109129. [Google Scholar] [CrossRef]
  107. Chen, R.; Zhang, C.; Xu, B.; Zhu, Y.; Zhao, F.; Han, S.; Yang, G.; Yang, H. Predicting Individual Apple Tree Yield Using UAV Multi-Source Remote Sensing Data and Ensemble Learning. Comput. Electron. Agric. 2022, 201, 107275. [Google Scholar] [CrossRef]
Figure 1. Distribution map of national basic meteorological observation stations in Henan Province.
Agronomy 15 00954 g001
Figure 2. Schematic diagram of the drought threshold calculation framework for future yield losses under various drought conditions.
Agronomy 15 00954 g002
Figure 3. Trend analysis of the SPEI time series. (a,b) Show the change in SPEI8 in the Center, (c,d) Show the change in SPEI8 in the Easter, (e,f) Show the change in SPEI8 in the Western, (g,h) Show the change in SPEI8 in the Southern, (i,j) Show the change in SPEI8 in the Northern. Each subgraph in the figure represents a region. The red solid line represents the change in SPEI8 during the growth period of winter wheat from 2000 to 2023, and the green dotted line represents the linear trend of SPEI8. The abscissa represents the year, and the ordinate represents the value of SPEI8.
Agronomy 15 00954 g003
Figure 4. Comparing the detrended time series in central Henan with SPEI over the same period. (a,b) Show yield change in winter wheat growth period, (c,d) Show SPEI8 value. This gray column indicates that winter wheat yield has a significant downward trend in severe drought years.
Agronomy 15 00954 g004
Figure 5. The relationship between winter wheat detrended yield and SPEI8 in Henan province. (a) Central Henan: cyan represents Zhengzhou, red represents Xuchang; (b) Eastern Henan: cyan represents Zhoukou, red represents Kaifeng; (c) Western Henan: cyan represents Luoyang, red represents Sanmenxia; (d) Southern Henan: cyan represents Xinyang, red represents Nanyang; (e) Northern Henan: cyan represents Anyang, red represents Xinxiang; (f) Spatial distribution of related trends in Henan Province.
Agronomy 15 00954 g005
Figure 6. Conditional probability of yield loss below the 30th, 50th, and 70th percentiles for different drought severities in the growing season of winter wheat under different climate scenarios. (a1,b1,c1) are mild drought, (a2,b2,c2) are moderate drought, (a3,b3,c3) are severe drought, (a4,b4,c4) are extreme drought.
Agronomy 15 00954 g006
Figure 7. Conditional probability of winter wheat yield below the 30th, 50th, and 70th percentiles under different drought levels under climate change.
Agronomy 15 00954 g007
Figure 8. (a) Accuracy evaluation of the yield prediction model of 10 national basic meteorological stations in Henan Province from 2018 to 2022, (b) Data difference map in 2018. The yellow solid line is a linear regression line, and the red dotted line is a 1:1 line.
Agronomy 15 00954 g008
Figure 9. Conditional probability of winter wheat yield loss below the 30th, 50th, and 70th percentiles under the SSP1-2.6 scenario.
Agronomy 15 00954 g009
Figure 10. Drought thresholds for winter wheat are when the yield loss is lower than the 30th percentile (a 70% yield reduction).
Agronomy 15 00954 g010
Table 1. The optimal parameter combination of the CNN-LSTM model.
ModelIndexParameter
CNNLayer3
Filter64
Kernel size3 × 3
Pooling size2 × 2
LSTMLayer3
Unit128; 128; 128
ActivationReLu
Dropout0.2; 0.2; 0.2
Bath-size8
Epoch100
OptimizerAdam
Learning rate0.001
LossMSE
Table 2. Classification standard for the SPEI.
NumberClassSPEI
1Extreme humid[2, +∞)
2Severe humid(1.5, 2]
3Moderate humid(1, 1.5]
4Normal(−0.5, 1]
5Mild drought(−1, −0.5]
6Moderate drought(−1.5, −1]
7Severe drought(−2, −1.5]
8Extreme drought(−∞, −2]
Table 3. Pearson Correlation Coefficient between the winter wheat yields and SPEI8 during 2000–2023.
AreaNational Basic StationsScalesDetrended Winter Wheat Yield (Correlation/r)
CenterZheng zhouSPEI80.29
Xu changSPEI80.33
EasternZhou kouSPEI80.49 *
Kai fengSPEI80.17
WesternLuo yangSPEI80.25
San men xiaSPEI80.43 *
SouthernXin yang SPEI80.30
Nan yangSPEI80.43 *
NorthernAn yangSPEI80.06
Xin xiangSPEI8−0.08
* Passing 95% significance test.
Table 4. The optimal marginal and joint distributions of winter wheat yield and SPEI8 in 2000–2023.
History (2000–2023)
SPEI8Yield
StationMarginal DistributionJoint Distribution
Zheng zhouNormGEVGumbel
Xu changNormGEVClayton
Zhou kouNormGEVGumbel
Kai fengNormGEVGumbel
Luo yangNormGEVClayton
San men xiaNormGEVFrank
Xin yangNormGEVStudent’s t
Nan yangNormGEVStudent’s t
An yangNormGEVStudent’s t
Xin xiangNormGEVStudent’s t
Table 5. Drought thresholds under different yield loss levels in history (2000–2023) and future (2024–2047) (SSP1-2.6).
RegionStudy PeriodsWinter Wheat Yield Loss Percentiles
30%50%70%
Zheng zhou2000–2023−2.00−1.43−0.50
2024–2047−2.66−1.85−0.73
Xu chang2000–2023−2.75−2.59−2.44
2024–2047−2.83−2.61
Zhou kou2000–2023−1.47−0.970.69
2024–2047−2.24−1.610.28
Kai feng2000–2023−2.18−1.80−0.75
2024–2047−2.86−2.36−1.08
Luo yang2000–2023−2.06−1.38−0.43
2024–2047−2.72−1.86−0.68
San men xia2000–2023−1.40−0.75−0.17
2024–2047−1.97−1.32−0.44
Xin yang2000–2023−1.86−0.850.60
2024–2047−2.47−1.390.35
Nan yang2000–2023−1.45−0.75−0.17
2024–2047−2.16−1.34−0.43
An yang2000–2023−0.64
2024–2047−1.01
Xin xiang2000–2023−2.10−0.22
2024–2047−2.59−0.44
—Denotes SPEI8 thresholds below −3
Disclaimer/Publisher’s Note: The statements, opinions and data contained in all publications are solely those of the individual author(s) and contributor(s) and not of MDPI and/or the editor(s). MDPI and/or the editor(s) disclaim responsibility for any injury to people or property resulting from any ideas, methods, instructions or products referred to in the content.

