Article

Impact of Phosphorus Fertilization on Leaching, Accumulation, and Microbial Cycling in New Apple Orchards

1
State Key Laboratory of Nutrient Use and Management, Key Laboratory of Wastes Matrix Utilization, Ministry of Agriculture, Shandong Provincial Engineering Research Center of Environmental Protection Fertilizers, Institute of Agricultural Resources and Environment, Shandong Academy of Agricultural Sciences, Jinan 250100, China
2
Shandong Institute of Pomology, Tai’an 271000, China
3
Stanley Agriculture Group Co., Ltd., Linyi 276700, China
*
Authors to whom correspondence should be addressed.
Agronomy 2025, 15(4), 952; https://doi.org/10.3390/agronomy15040952
Submission received: 11 March 2025 / Revised: 12 April 2025 / Accepted: 12 April 2025 / Published: 14 April 2025

Abstract

:
Field experiments spanning five years were conducted to convert barren mountainous land into apple orchards, testing five phosphorus (P) fertilization schemes: no inorganic P (NP0K), superphosphate (FP), water-soluble inorganic P (WSF), superphosphate with alkaline soil conditioner (SC), and superphosphate with grass interplanting (GC). Fertilizer solubility and soil pH were found to significantly impact P leaching and accumulation. Among the schemes, WSF exhibited the highest P leaching loss (3.65–3.87%), while SC (2.17–2.79%) and GC (2.79–3.25%) minimized such losses. As soil pH declined over time, aluminum P (Al-P) replaced calcium P (Ca-P) as the dominant inorganic P fraction, while occluded P (O-P) increased, resulting in reduced P bioavailability. Soil organic carbon (SOC) and acid phosphatase activity positively influenced inorganic P fractions, whereas prolonged orchard establishment decreased fixed inorganic P content. Microbial P cycling genes were less abundant and showed negative correlations with soil nitrate-N, electrical conductivity, available P (Olsen P), and SOC. These findings highlight that grass interplanting with superphosphate (GC) is an optimal strategy to minimize phosphorus leaching, enhance soil phosphorus bioavailability, and reduce environmental risks, making it a sustainable approach for orchard management.

1. Introduction

Worldwide apple production in the 2022–2023 season is estimated to be 81.57 million metric tons, and China’s production is about 47.57 million metric tons [1]. On average, apple orchards yield around 40–50 metric tons per hectare. China has strict regulations on the use of arable land to ensure food security and prevent the loss of fertile farmland, and the government provides incentives for converting non-arable land into economically productive uses [2]. In recent years, to realize economic gains without violating land use regulations, some Chinese farmers have converted barren mountains into intensive apple orchards. By utilizing previously unproductive land, farmers increase their overall agricultural output without expanding into protected arable land.
Apple orchards require a balanced supply of nutrients, primarily nitrogen (N), phosphorus (P), and potassium (K), to ensure healthy growth and high yields. Fertilization is needed both before and during the growing season, and it affects the soil profoundly. While proper fertilization improves soil structure and fertility, the excessive use of fertilizers may lead to soil acidification and the imbalance of nutrients, which negatively affect soil health and plant growth. Fertilization practices also influence the microbial communities in the soil, and the runoff from fertilized fields can contaminate water bodies to cause eutrophication. Balanced fertilization, based on soil tests and tailored to the specific needs of the orchard, can optimize growth while minimizing environmental risks.
The use of chemical P fertilizers in agriculture is essential to high crop productivity and economic gains, and it has increased considerably over the past decades [3,4]. Researchers have examined various aspects of long-term P fertilization in apple orchards [5]. Excessive long-term fertilization, particularly P inputs, has been shown to cause P accumulation in topsoil (0–2 m) and subsequent leaching into deeper soil layers (2–6 m), posing risks to groundwater quality [6,7]. It has been reported that 70–90% of the applied inorganic P reacts with iron (Fe), aluminum (Al), and calcium (Ca) to form insoluble complexes as Fe-P, Al-P, and Ca-P, which significantly reduces the bioavailability of P to crops [8,9]. On the Chinese Loess Plateau, for instance, the conversion of farmland into apple orchards resulted in significant vertical redistribution of Olsen-P, with overfertilization driving P migration beyond the root zone [6,10]. In addition, the accumulation of P in the soil increases the risk of P leaching [11,12]. Kopytko et al. highlighted that excessive P accumulation in the soil leads to environmental concerns, such as P runoff, which can contribute to water pollution [13]. Investigating the dynamic changes of the inorganic P complexes fixed in soils and the degree of P leaching is necessary for optimizing P fertilization strategies [14].
Since most of the applied P is fixed in the soil or lost through runoff and the P use efficiency (PUE) of the crop is generally less than 20% [15,16], efficient P management practices are crucial to maintaining soil fertility while minimizing environmental impacts. Phosphorus (P) is an essential macronutrient for apple trees, as it supports key processes such as energy transfer (via ATP), cell division, and root development. However, P management in apple orchards has historically received less attention than nitrogen and potassium. Challenges in P management stem from its low mobility in soil, strong fixation in high-calcium soils, and the lack of clear deficiency symptoms. As a result, growers must balance sufficient P supply to enhance tree vigor and fruit quality while avoiding excess that can lead to environmental losses. Some studies have explored a range of approaches for improving phosphorus availability and uptake in apple orchards.
To optimize P use efficiency, cover cropping and amendments have emerged as effective strategies. Long-term use of legume or grass cover crops improves soil organic matter and microbial activity, thereby enhancing P cycling and reducing dependence on chemical P fertilizers [16]. Integrated irrigation and nutrient management are equally critical. Mammadov et al. demonstrated that optimizing furrow length and irrigation flow rates enhances water and P use efficiency, whereas excessive irrigation promotes nutrient loss [5]. Hou et al. further highlighted that orchard age negatively correlates with P availability, as long-term fertilization in mature orchards leads to P fixation—a problem that can be addressed through precision fertilization and alkaline soil amendments [17]. Future research should focus on developing P management practices that combine cover crops, alkaline soil conditioners, and irrigation-fertilization technologies to balance orchard productivity with environmental sustainability.
Improper P fertilization can reduce the relative abundance of dominant soil microbial communities. Diverse P-transforming processes take place in the soil, and they involve various microbial communities and their functional genes [18]. Understanding phosphorus cycling genes (PCGs) and their varying abundances offers valuable insights into soil ecosystem interactions, which helps to improve soil fertility, manage ecosystems sustainably, and develop new biotechnological solutions [19]. Excessive soil P can inhibit the growth of some functional microorganisms related to soil carbon and P cycling [20], and the changes in P fertilization practices affect the microbial communities and the PCGs. However, most research on PCGs focuses on annual crops or grasslands, and the role of PCGs in orchard systems, especially under different P management strategies, remains poorly understood.
Despite progress in P fertilization strategies for apple orchards, significant research gaps remain. These include understanding the long-term dynamics of soil P accumulation, the persistence and impact of annual fertigation under varying soil and climatic conditions, and the effects of P fertilization on soil microbial communities and PCGs. Several key questions remain unanswered: (1) How do different P fertilizers influence P leaching and redistribution in newly established orchards? (2) Which soil properties most strongly regulate P bioavailability over time? (3) How do soil microbial communities and PCG abundances respond to P management, and what are the implications for P cycling? In addition, previous studies have explored P dynamics in mature orchards [16,17], but little is known about the P behavior in newly established orchards on marginal lands. Therefore, in this work, we conducted a five-year field experiment evaluating different P management strategies in a newly converted apple orchard. The changes in soil physicochemical properties, P leaching, and soil microbial communities were analyzed. The main objectives were as follows: (1) evaluate the effects of P fertilization on P leaching, (2) identify the key factors influencing P accumulation in the soil, and (3) examine the variations in the soil microbial communities, particularly the PCGs, and their relationships with soil properties.

2. Materials and Methods

2.1. Study Site

The experimental site was on the Jinniu Mountain (36°7′ N, 116°59′ E) in the southwest of the Tai’an municipality in Shandong, China. The area was completely barren before 2018, and its typical vegetation included pear trees, pine trees, wild jujube shrubs, etc. The land was not fertilized or irrigated previously.
At the experimental site, from 2019 to 2023, the annual precipitation was 685.6, 487.3, 511.4, 883.9, and 631.0 mm, respectively. The precipitation mainly (60–70%) occurred between May and September. The daytime temperatures were 10–31, 9–30, 11–32, 8–30, and 9–31 °C, respectively. According to the United States Department of Agriculture soil taxonomy, the local soils were Alfisols. To prepare a composite soil sample, local soil samples were collected at random spots with three replicates at three different depth intervals, i.e., 0–30 cm, 30–60 cm, and 60–90 cm. The freshly collected soil samples were stored at −20 °C before determining the physicochemical properties.

2.2. Fertilization Design

The experimental site had 15 plots, each 12 m in length and 6 m in width, with a slope gradient of 6°. In 2018, one-year-old dwarf rootstock Fuji apple trees (Malus domestica Borkh.) were planted in the plots, and the plots were fertilized starting from 2019. A total of 16 trees were planted in two parallel rows that were 4 m apart, with 8 trees in each row. Within each row, the neighboring trees were 1.43 m apart.
A randomized block design was adopted. From 2019 to 2023, each of the five following fertilization schemes was applied to three replicated plots: (1) the absence of inorganic P fertilizer (NP0K), (2) superphosphate fertilizer (FP), (3) drip irrigation of water-soluble inorganic P fertilizer (WSF), (4) superphosphate with alkaline soil conditioner (SC), and (5) superphosphate with the interplanting of hairy vetch (Vicia villosa Roth.) grass in the orchards (GC). Areas without apple trees were not fertilized and served as the control (CK). The experiment systematically compared conventional P fertilization with irrigation, alkaline soil amendment, and grass covering approaches to evaluate their effects on P utilization efficiency through annual monitoring of soil P dynamics and tree growth parameters.
Chemical fertilizers, including urea (N, 46.0%), superphosphate (P, 18.9%), potassium sulfate (K, 41.5%), and water-soluble compound fertilizer (N/P/K = 18:15:15, consisting of urea, potassium dihydrogen phosphate, and potassium sulfate), were all purchased from Stanley Agriculture Group Co. Ltd. (Linyi, China). The nutrient input from these inorganic fertilizers was 1120.60 kg N and 912.54 kg K ha⁻1 year⁻1 for NP0K, and 1120.60 kg N, 446.43 kg P, and 912.54 kg K ha⁻1 year⁻1 for the other four treatments. The fertilization process comprised base fertilizer and topdressing application. Each year, sheep manure (N/P/K = 2.01:1.15:1.32) was applied as the base fertilizer at 6000 kg ha−1 year−1 after apple harvest, and additional fertilizers were applied in March (after flowering) and August (during fruit swelling). The base fertilizer was placed in a trench with a depth of 30 cm, matching the radius of the tree trunk, and then covered with soil. Topdressing application was carried out using traditional trenching or drip fertigation methods. Table S2 describes the fertilizers (including chemical compositions) applied in March and August for each treatment. In the WSF treatment, urea, potassium sulfate, and the water-soluble compound fertilizer were dissolved in water and applied to the 5–10 cm soil layer through drip irrigation, and all other treatments received water irrigation only after fertilization. In the SC treatment, the alkaline soil conditioner (pH = 8.80, see Table S3 for the chemical compositions) from Shandong Kingenta Ecological Engineering Co., Ltd. (Linyi, China) was applied in March at 750 kg ha−1 year−1. For the GC treatment, 400 hairy vetch seeds per square meter were sown between the two rows of trees after tillage in October. The rotten grass was left uncleaned on the soil surface so that new grass could grow the next year from the seeds that fell into the soil. The barren mountain areas with crude vegetation were used as the control (CK). No other secondary and micronutrients were applied.

2.3. Leaching Solution Analysis

In each plot, two lysimeters were installed between the two rows of trees. Each lysimeter was designed to monitor a soil block measuring 150 cm in length, 80 cm in width, and 90 cm in depth. The components of the lysimeter and the collection of leachates are described in our previous work [21]. The extraction and ventilation pipes of the lysimeters were inspected once a year for maintenance. After each irrigation event and heavy rainfall, leaching solutions were systematically collected using a vacuum pump to retrieve the leachates from the drainage outlet. The total volume of the leachate from each lysimeter was meticulously measured using a 5-L graduated cylinder, and a leachate sample (500 mL) was stored at −80 °C for up to 48 h before the analysis of total P and total dissolved P.
To determine the total dissolved P, the leachate was passed through a 0.45-µm filter membrane, oxidized with potassium persulfate, and measured using molybdenum blue colorimetry [22]. To determine the total P that included not only soluble P but also colloidal and granular P, the raw leachate was oxidized directly with potassium persulfate and measured using molybdenum blue colorimetry [22].

2.4. Soil Physicochemical Property Analysis

Each year after harvesting the apples, soil samples with three replicates were collected at random spots in the plot at three different depth intervals, i.e., 0–30 cm, 30–60 cm, and 60–90 cm. For each depth, three replicate samples were taken, homogenized, and pooled to form a composite sample. The fresh soil was passed through a 2-mm sieve to remove debris and plant residues before analysis. For sequential inorganic P fractionation, subsamples were air-dried, finely ground, and sieved (100 mesh).
For each segment, the freshly collected soil samples were combined and then mixed with deionized water (1:2.5 w/v). The suspension was sonicated for 1 h to ensure homogeneity and measured using a pH meter (METTLER TOLEDO S210-K pH meter, Columbus, OH, USA) to give the soil pH. The soil organic carbon (SOC) content was determined using the K2Cr2O7 oxidation-reduction titration method [23]. The air-dried soil (0.5 g) was digested with K2Cr2O7 (0.8 mol·L−1, 10 mL) and concentrated H2SO4 (20 mL) at 170–180 °C for 5 min. The residual K2Cr2O7 was titrated with FeSO4 (0.5 mol·L−1) using diphenylamine as an indicator. The soil’s total P was quantified using the colorimetric method (700 nm) described by Bremner and Mulvaney [24] after dissolution in HClO4-H2SO4 at 300 °C. The soil’s available P (Olsen P) content was quantified using the molybdenum-blue colorimetric method after the soil (2.5 g) was extracted with aqueous NaHCO3 (0.5 mol·L−1, 50 mL) at 25 °C for 30 min [25]. The soil NO3-N and NH4+-N contents were determined using an automated flow injection analyzer (Foss FIA 5000, Hillerød, Denmark) after the soil (5 g) was extracted with aqueous KCl (2 mol L−1, 25 mL) for 1 h. The soil’s available K was quantified using flame photometry after the soil (5 g) was extracted with aqueous CH3COONa (1 mol L−1, 25 mL) [24].
The changes in the different forms of insoluble inorganic P in soil, which include aluminum phosphate (Al-P), occluded phosphate (O-P), calcium phosphate (Ca-P), and iron phosphate (Fe-P) [25,26,27], were detected using a sequential extraction method. To begin with, the air-dried and sieved (<100 mesh) soil (1.00 g) was added into a 100-mL centrifuge tube and extracted with NH4Cl (1.0 mol L−1, 50 mL). After discarding the supernatant, the residue was further extracted with NH4F (0.5 mol L−1, pH 8.2, 50 mL) for 1 h, and the supernatant was used for quantifying Al-P. The soil was then rinsed with saturated NaCl twice and extracted with NaOH (0.1 mol L−1, 50 mL) for 2 h, and the solution was used to quantify Fe-P. The remaining soil was rinsed with saturated NaCl twice and extracted with sodium citrate (0.3 mol L−1, 40 mL, containing 1 g Na2S2O4), and the solution was used to quantify O-P (mainly P that is difficult to release from the cinnamate lattice). Finally, the soil was extracted with H2SO4 (0.25 mol L−1, 50 mL) for 1 h, and the extract was used to quantify Ca-P. For all extracts, the P concentration was determined using the molybdenum antimony resistance colorimetric method [28].
The activity of soil acid phosphatase (SAP) was determined using the 96-well microplate approach. The soil (1 g) was maintained in acetate buffer (pH 4.6, 4 mL) and disodium phenyl phosphate (10 mol L−1, 1 mL) at 37 °C for 1 h. The phenol released was quantified by measuring the absorbance at 660 nm after the reaction with 2% 4-aminoantipyrine and 8% potassium ferricyanide [29].

2.5. DNA Isolation and Metagenomic Sequencing

Total DNA was extracted from the 0–30 cm soil samples (0.5 g, three replicates) using the E.Z.N.A.® Soil DNA Kit (Omega Bio-tek, Norcross, GA, USA) following the manufacturer’s instructions. To enhance microbial cell lysis, an additional bead-beating step was included, using 0.5 mm zirconia beads agitated at 6 m/s for 45 s, which ensured the efficient breakdown of microbial cell walls for improved DNA recovery. The concentration of the extracted DNA was determined using a TBS-380 fluorometer (Promega, Madison, WI, USA), and the purity of the DNA was assessed using a NanoDrop 2000 spectrophotometer (Thermo Scientific, Waltham, MA, USA). The quality of the DNA was assessed using 1% agarose gel, which confirmed the presence of intact high-molecular-weight DNA fragments exceeding 10 kilobases (kb) in size. The DNA extract was then fragmented to an average size of approximately 400 bp using a Covaris M220 instrument (Gene Company Limited, Hong Kong, China). Paired-end libraries (350–450 bp inserts) were prepared using the NEXTFlex Rapid DNA-Seq Kit (Bioo Scientific, Austin, TX, USA), followed by size selection with AMPure XP beads (Beckman Coulter, Brea, CA, USA). Library quality was assessed using Qubit 3.0 (Thermo Fisher, Waltham, MA, USA) and qPCR (Kapa Biosystems, Wilmington, MA, USA). Sequencing was carried out using the Illumina NovaSeq 6000 platform (Majorbio, Shanghai, China), employing paired-end reads (2 × 150 bp) and generating approximately 10 Gb data per sample.
Data analysis was carried out on the Majorbio cloud platform (https://www.majorbio.com, accessed on 10 February 2024). The paired-end reads were first processed using fastp 0.20.0 (https://github.com/OpenGene/fastp, accessed on 10 February 2024) to remove the adapters and eliminate the reads that were <50 bp in length, had a quality value of <20, or included N bases. The metagenomics data were then assembled using MEGAHIT 1.1.2 based on succinct de Bruijn graphs. CD-HIT 4.6.1 was used to export contigs with a minimum length of 300 bp as the final assembly output for gene prediction and annotation. Taxonomic assignment was achieved by aligning sequences against the NCBI NR database using BLAST (2.13.0, e-value threshold: 1 × 10⁻⁵) with the LCA algorithm (70% confidence threshold). Microbial taxa with >0.1% abundance in at least three samples were retained. Beta diversity analysis utilized Bray-Curtis (taxonomic) and Jaccard (functional, based on KEGG 2022 pathways) distance matrices, with Permanova testing group differences. PCoA visualization included 95% confidence ellipses, and variance percentages were derived from covariance matrix eigenvalues. Chimeric sequences and singletons were removed prior to analysis to ensure data integrity. PCGs were identified based on KEGG orthology (KO) terms [30,31] and the manual curation of known phosphorus metabolism genes using Diamond 0.8.35 (https://github.com/bbuchfink/diamond, accessed on 10 February 2024) with an e-value threshold set at 1 × 10⁻⁵ [32]. Gene abundance was normalized to reads per kilobase per million (RPKM) to account for sequencing depth and gene length. The differential abundance of PCGs between treatments was tested using DESeq2 with FDR correction.

2.6. Data Analysis

Data analysis was carried out using SPSS 20.0 (IBM Corp., Armonk, NY, USA) unless noted otherwise. The physicochemical data of the soil were evaluated using the Shapiro–Wilk test to determine if they were normally distributed and were then analyzed using one-way analysis of variance (ANOVA) [33,34]. Duncan’s test was applied to identify the differences between treatments. Differences were considered statistically significant when p < 0.05. Origin 2021 (OriginLab Corp., Northampton, MA, USA) was used to generate graphs and for the principal component analysis (PCA) and Pearson correlation analysis [35].
Principal coordinates analysis (PCoA) based on the Bray–Curtis distance was carried out using R 4.0.3 to assess how the microbial composition and functional diversity varied across different treatments. The impact of treatments on the overall microbial taxonomic and functional diversity was evaluated by analysis of similarities (ANOSIM). The differences between the microbial genes of different treatments or aggregate sizes were tested by ANOVA with false discovery rate (FDR)-adjusted P values. The normality and heterogeneity of variances were checked using Shapiro–Wilk’s normality test and Levene’s test before ANOVA. KEGG pathway enrichment was analyzed using STAMP. The heatmap packages in R 4.0.3 were used for the visualization of the following analyses: (1) the changes in the abundance and diversity of 53 PCGs, (2) the correlations between the gene functions related to the P cycle and the chemical properties of the soil, and (3) the standardized Z-scores representing the abundance of PCGs.

3. Results

3.1. P Leaching Loss

The P leaching loss was determined by quantifying the leaching solution collected in the lysimeters. Between 2020 and 2023, the leaching loss of total P generally ranked in the order of WSF > FP > GC > SC > NP0K (Figure 1a). In 2023, GC had greater leaching loss of total P than FP. Much of the leached P was lost in the soluble form, as total dissolved P accounted for 68.04–96.44% of total P (Figure 1b). The P leaching rate was calculated as the percentage of total P input lost through leaching. The total P input was 29.76 kg P ha−1 year⁻1 for NP0K (from only the base fertilizer) and 446.43 kg P ha−1 year⁻1 for all other treatments. For NP0K, the leaching rate of total P, which ranged from 4.75 to 14.20%, was high in 2020 and 2021 and dropped in 2022 and 2023. For all other treatments, the leaching rate of total P was always at <4% and increased slightly over time (Figure 1b). Among the four treatments, the leaching rate of total P was highest for WSF (3.65–3.87%) and notably lower for SC (2.17–2.79%) and GC (2.79–3.25%).

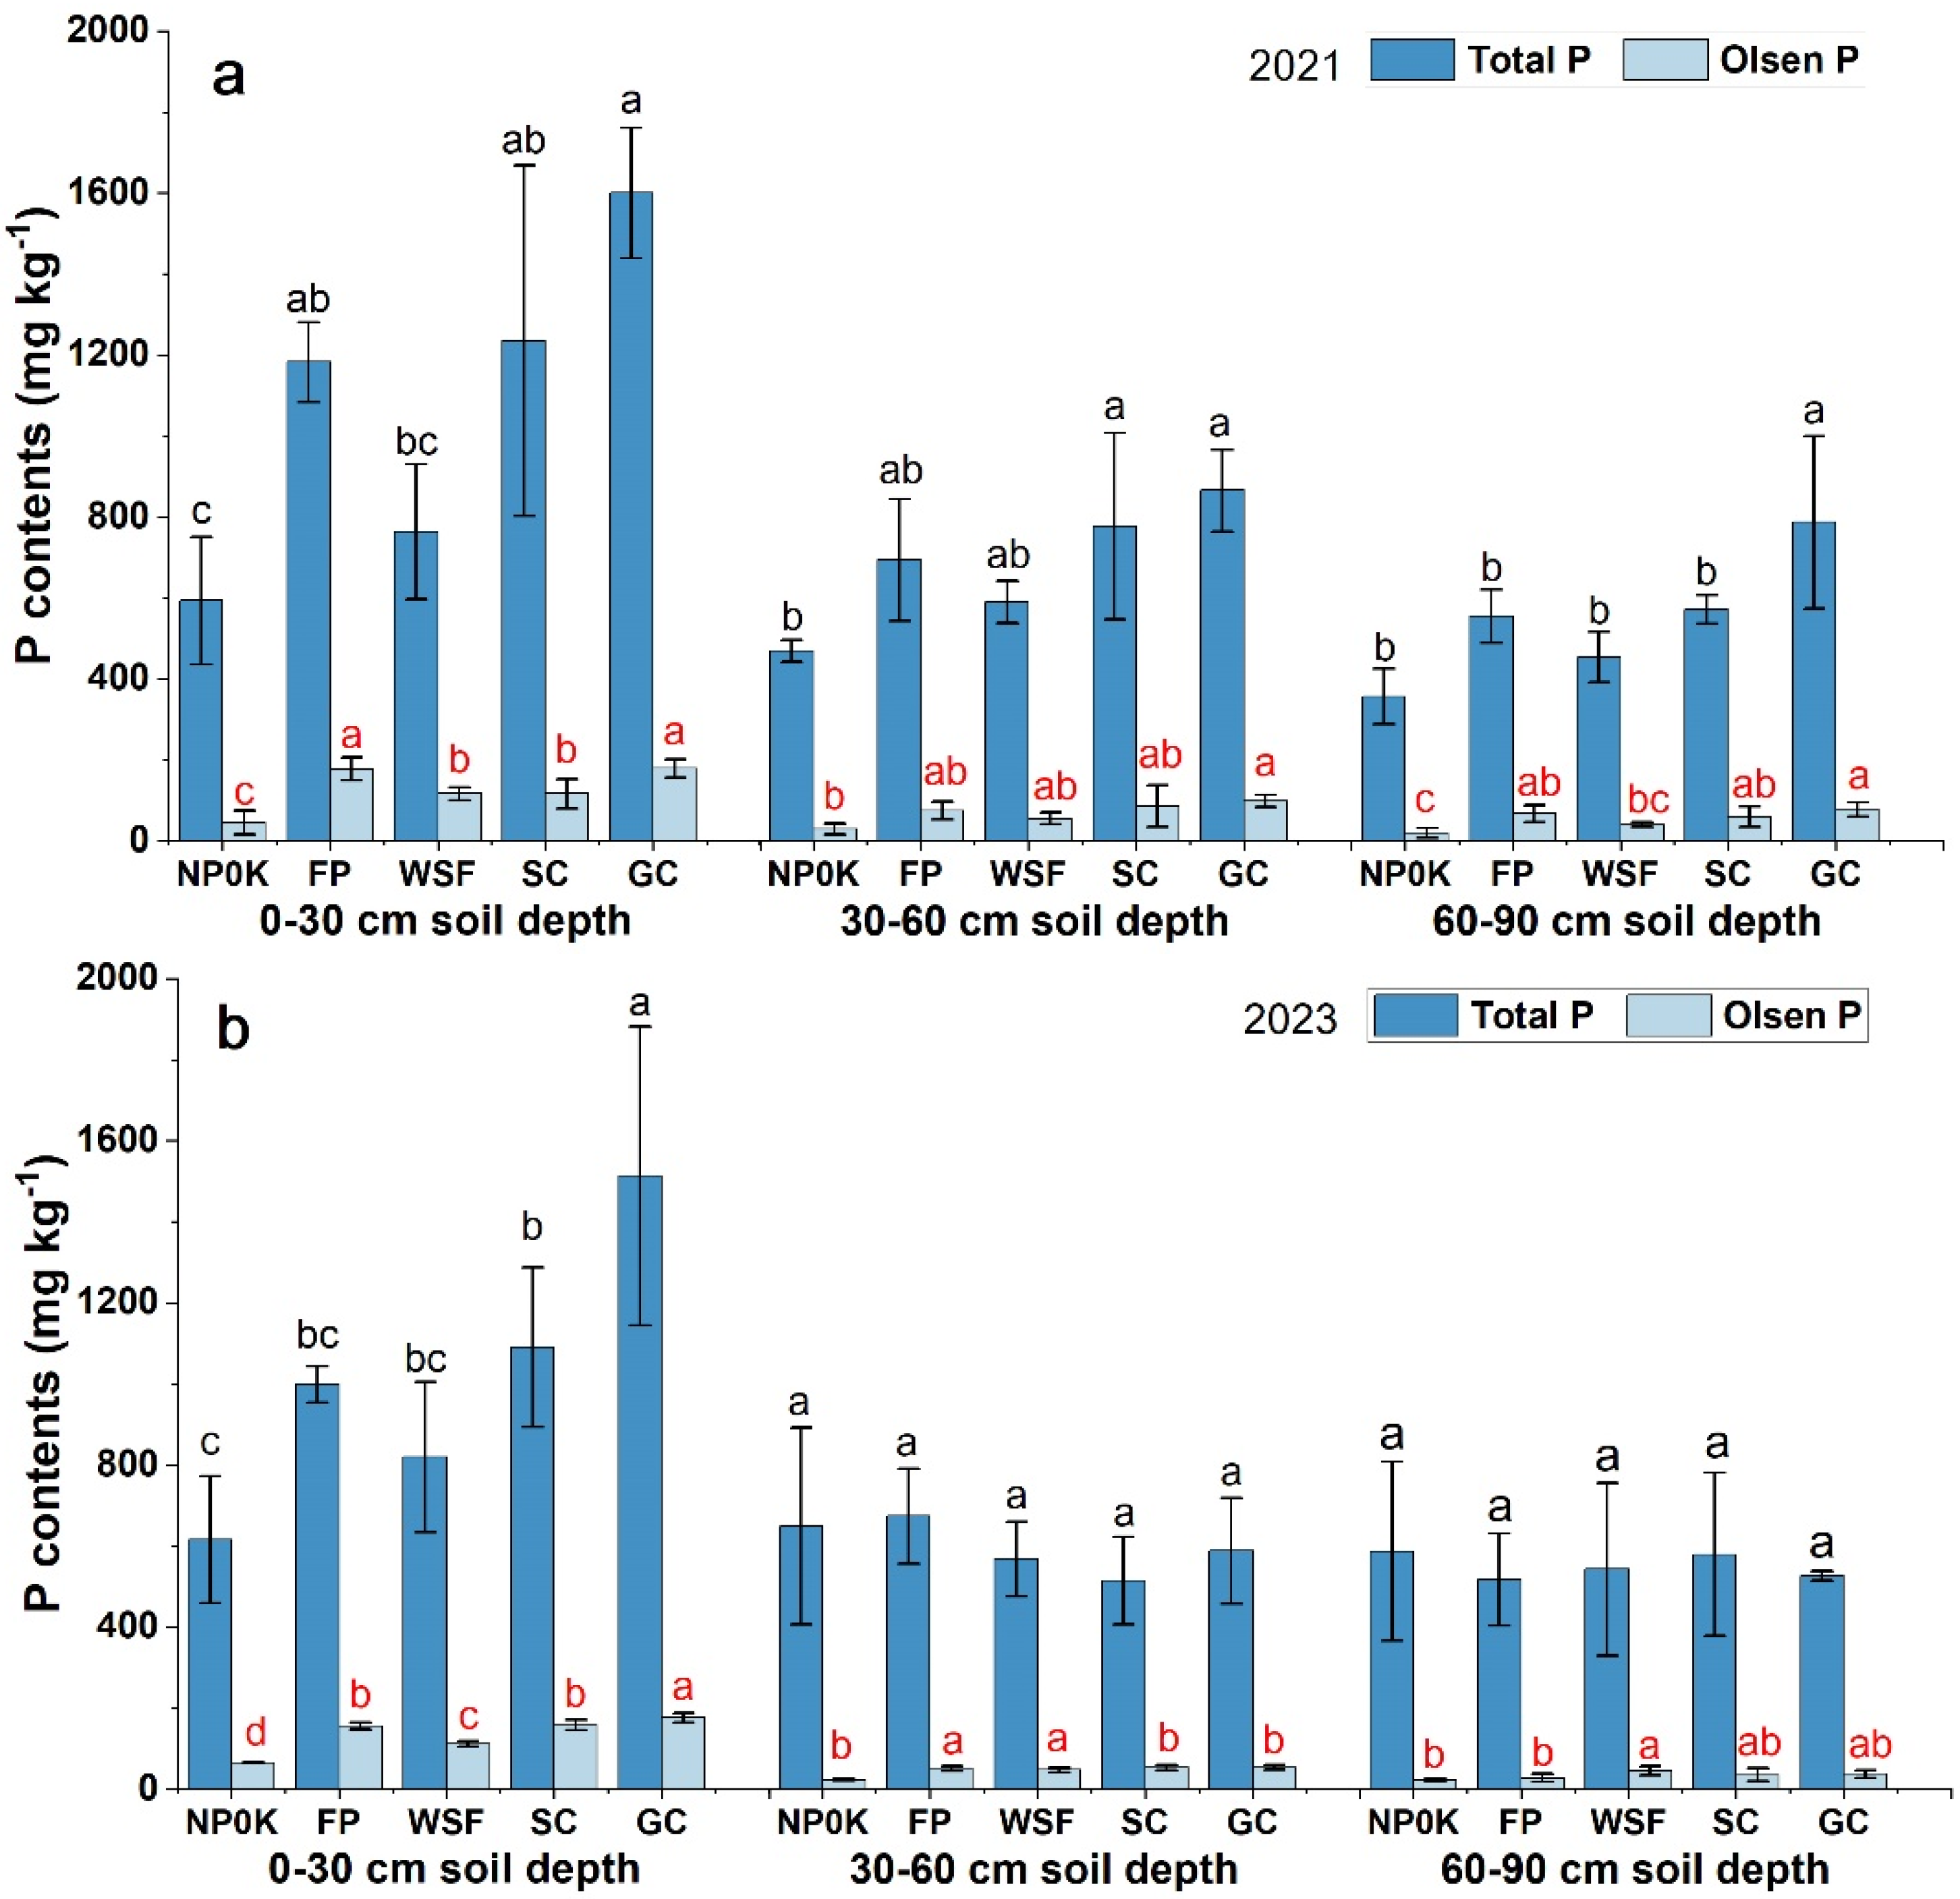
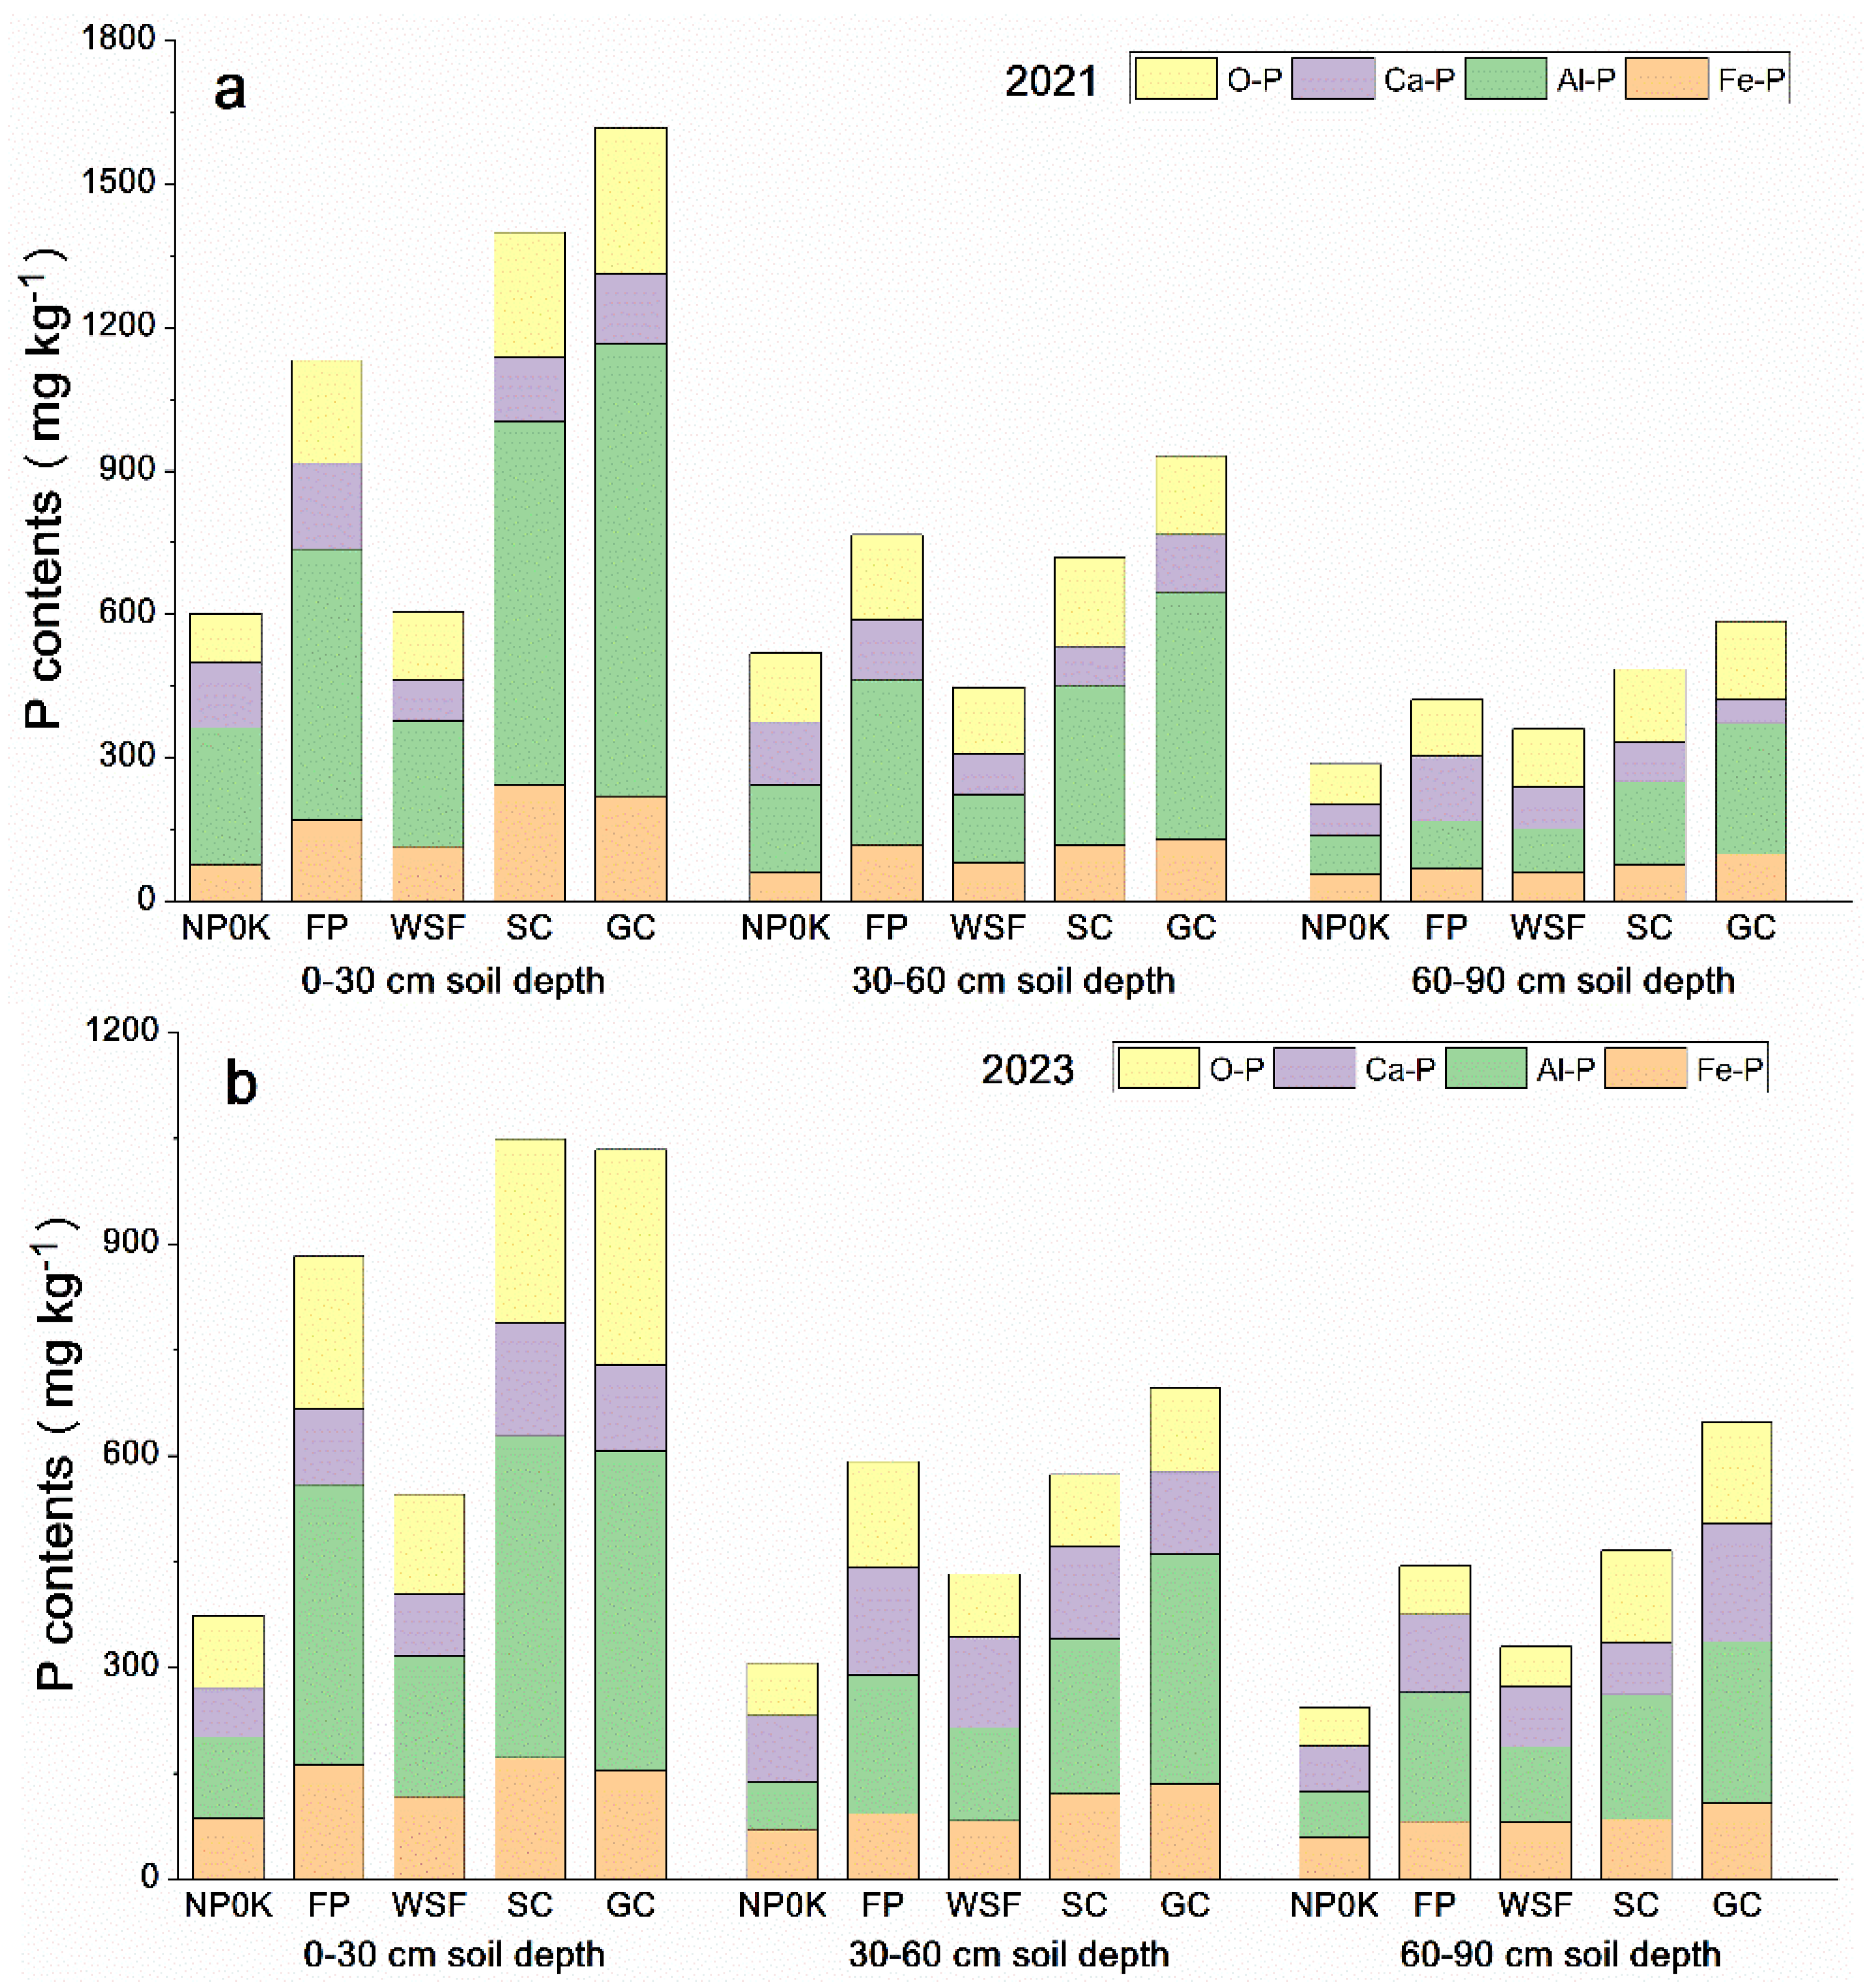
3.2. P Accumulation in Soil

In both 2021 and 2023, soil samples were collected at the plots from different depths (0–90 cm) after harvesting the apples but before the base fertilizer was applied for the next growing season (i.e., in mid-November), and their P contents were determined. In 2016, before the orchards were created, the total P of the soil was only 730.08 mg kg−1 (Table S1). After multiple years of apple plantation and continuous P fertilization, the total P and Olsen P contents of the soil increased significantly (except NP0K), especially in the 0–30 cm soil layers (Figure 2). For all soil layers in all plots, the ratio of Olsen P to total P was very low (less than 20%). Total P and Olsen P were the highest at GC in the 0–30 cm soil layer. For the GC treatment, the total P that accumulated in the soil reached 1600.38 and 1512.86 mg kg−1 in 2021 and 2023, respectively. Of all treatments that applied P fertilization (i.e., excluding NP0K), WSF had the least accumulation of both total P and Olsen P. For all soil layers of all treatments, the P accumulation was attenuated in 2023 compared to 2021.
In 2016, the total inorganic P was 141.91, 170.63, and 150.20 mg kg−1 in the 0–30 cm, 30–60 cm, and 60–90 cm soil layers, respectively (Figure S1). For all soil layers, the most abundant fraction was O-P, followed by Ca-P. After the apple orchard was started and P fertilization was applied, the total inorganic P in the soil increased dramatically. Among the five treatments, in 2021, the total inorganic P fraction generally fell in the order of GC > SC ≥ FP > WSF > NP0K for all soil layers (Figure 3a). In 2023, SC had higher total inorganic P than GC in the 0–30 cm soil layer (Figure 3b). Fertilization significantly increased the contents of Al-P and Fe-P in all soil layers. Whereas in 2016 O-P and Fe-P were the most and the least abundant forms of inorganic P, in 2021 and 2023 the most and the least abundant forms of inorganic P became Al-P and Ca-P, respectively.

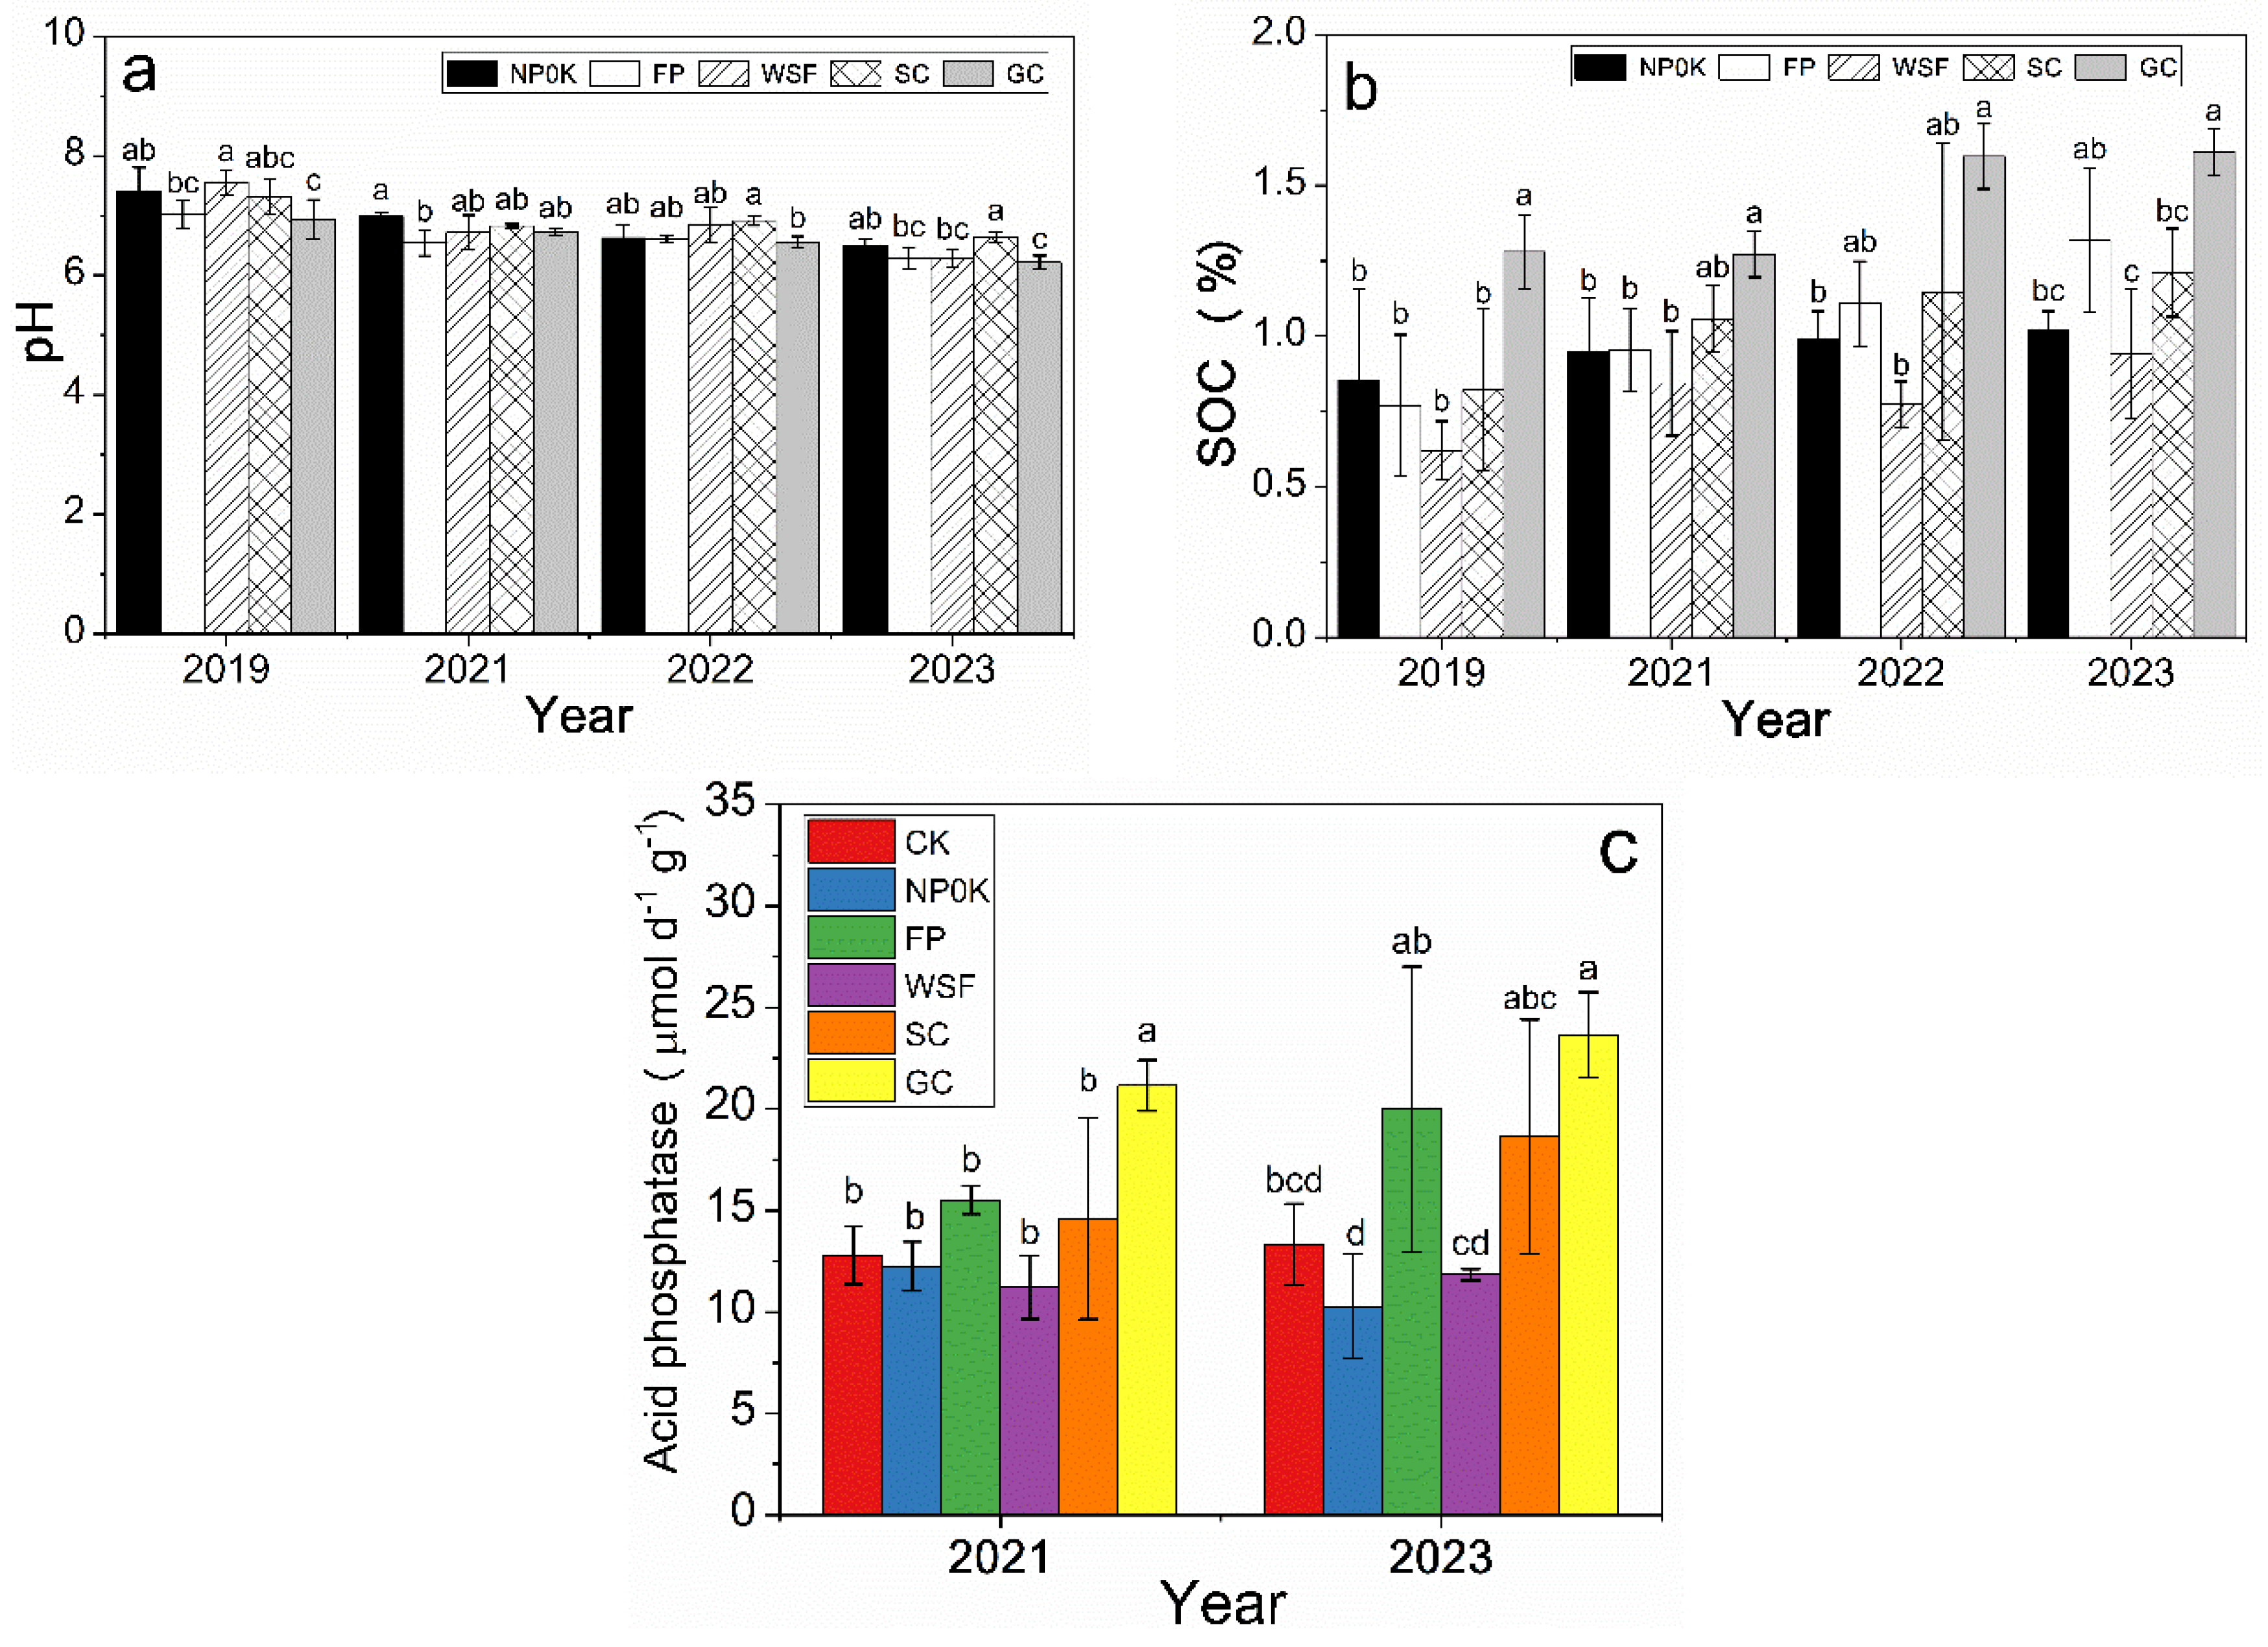
3.3. Soil Physicochemical Properties and Soil Acid Phosphatase Activity

The continuous fertilization steadily decreased the soil pH. In 2017, the soil was still slightly basic (pH = 7.51), but after apple plantation over five years, in 2023, the soil pH fell below 7.00 at all plots (Figure 4a). GC always had the lowest soil pH, and SC had the highest soil pH from 2021 to 2023. The SOC ranked in the order of GC > SC ≥ FP > N0PK > WSF (Figure 4b). The presence of the grass residues was likely responsible for the higher SOC of GC. The lowest SOC was consistently found at WSF, where irrigation and fertilization were carried out simultaneously [21]. The SAP activity, measured after harvest in 2021 and 2023, ranked in the order of GC > FP > SC > CK > WSF > NP0K (Figure 4c). The trend was consistent with the Olsen P content in 0–30 cm soil and could be associated with the bioavailable P present in the soil.

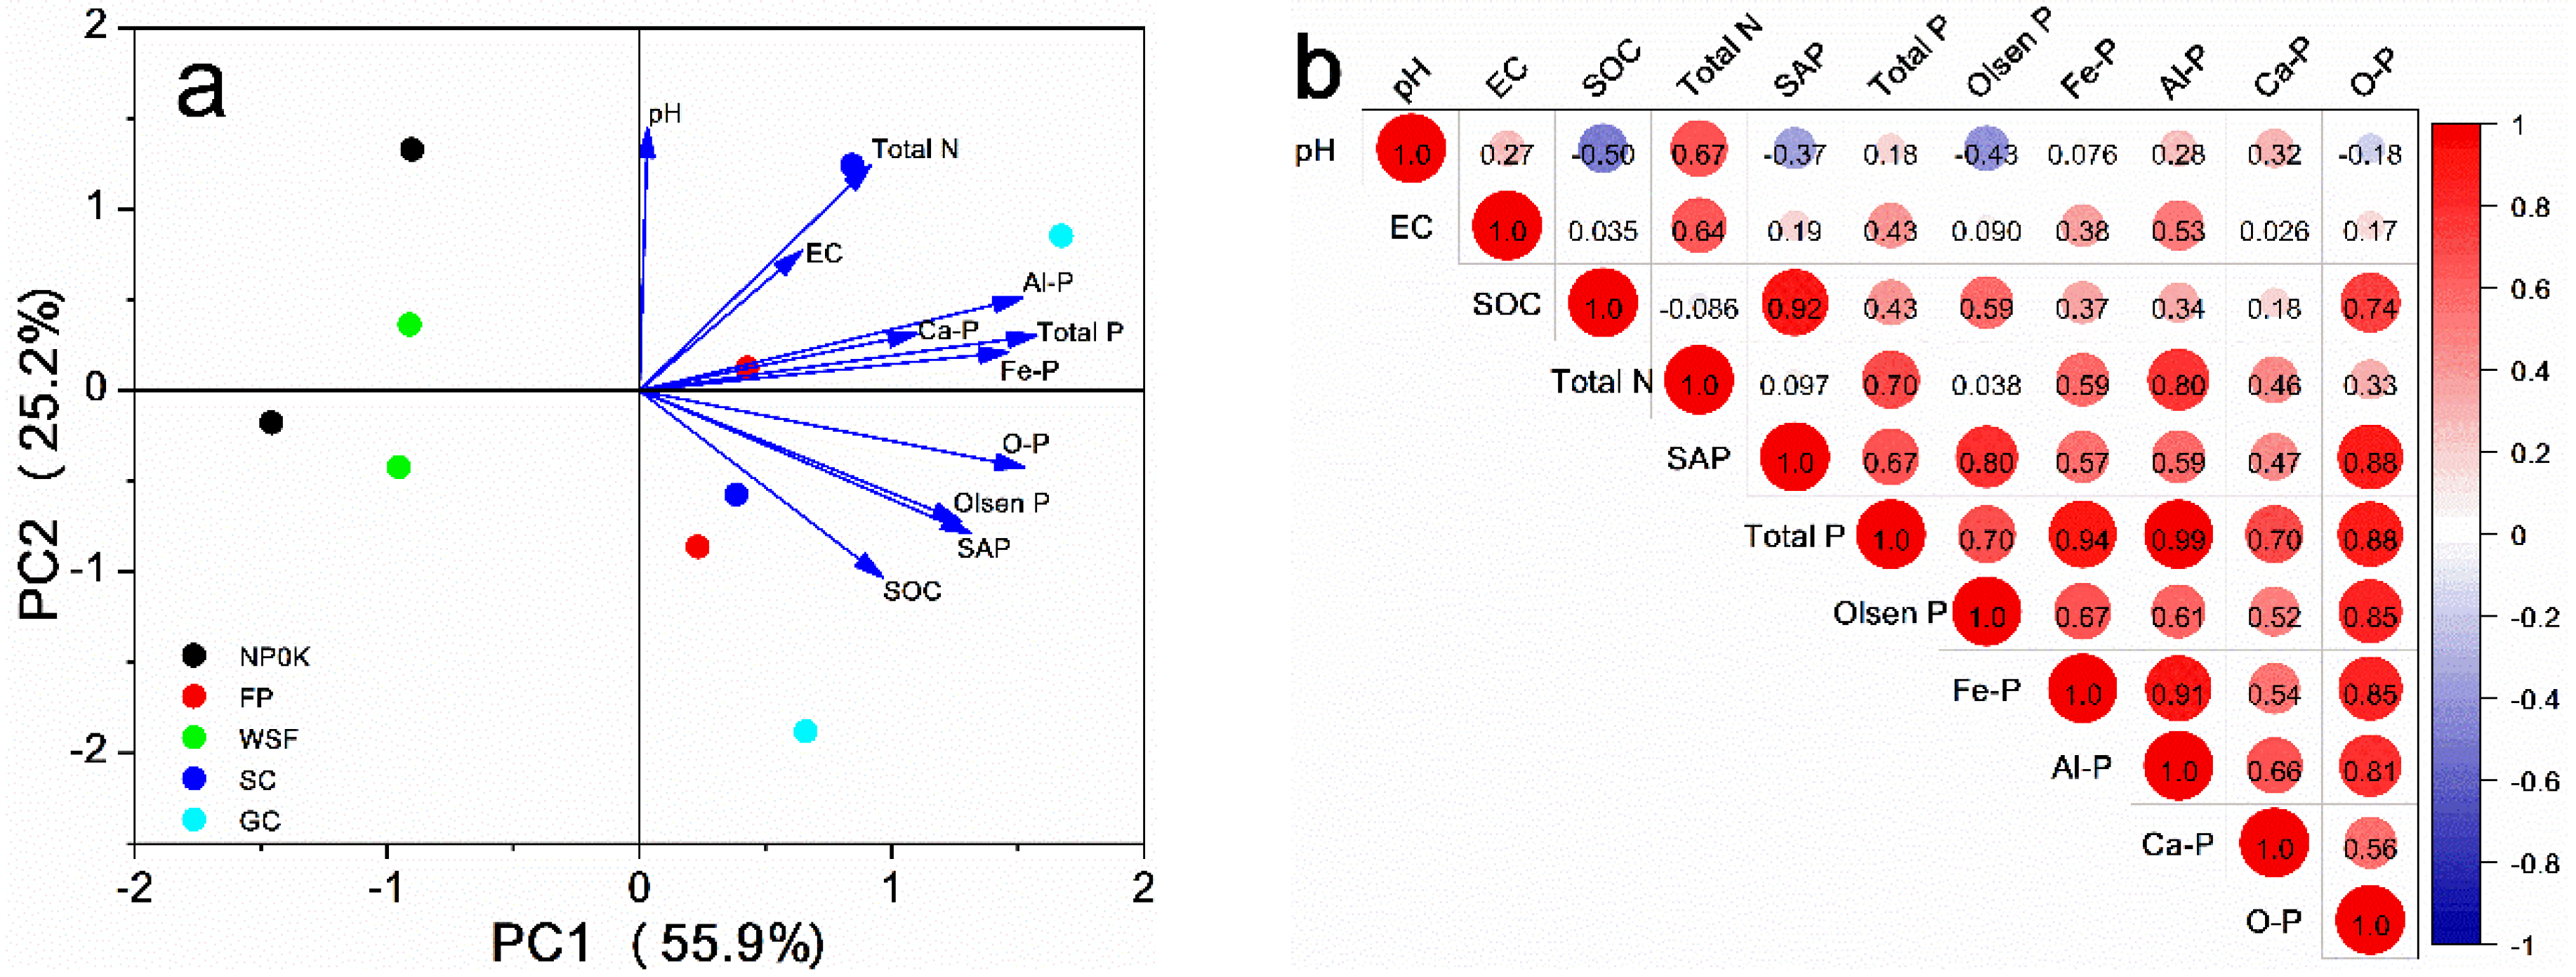
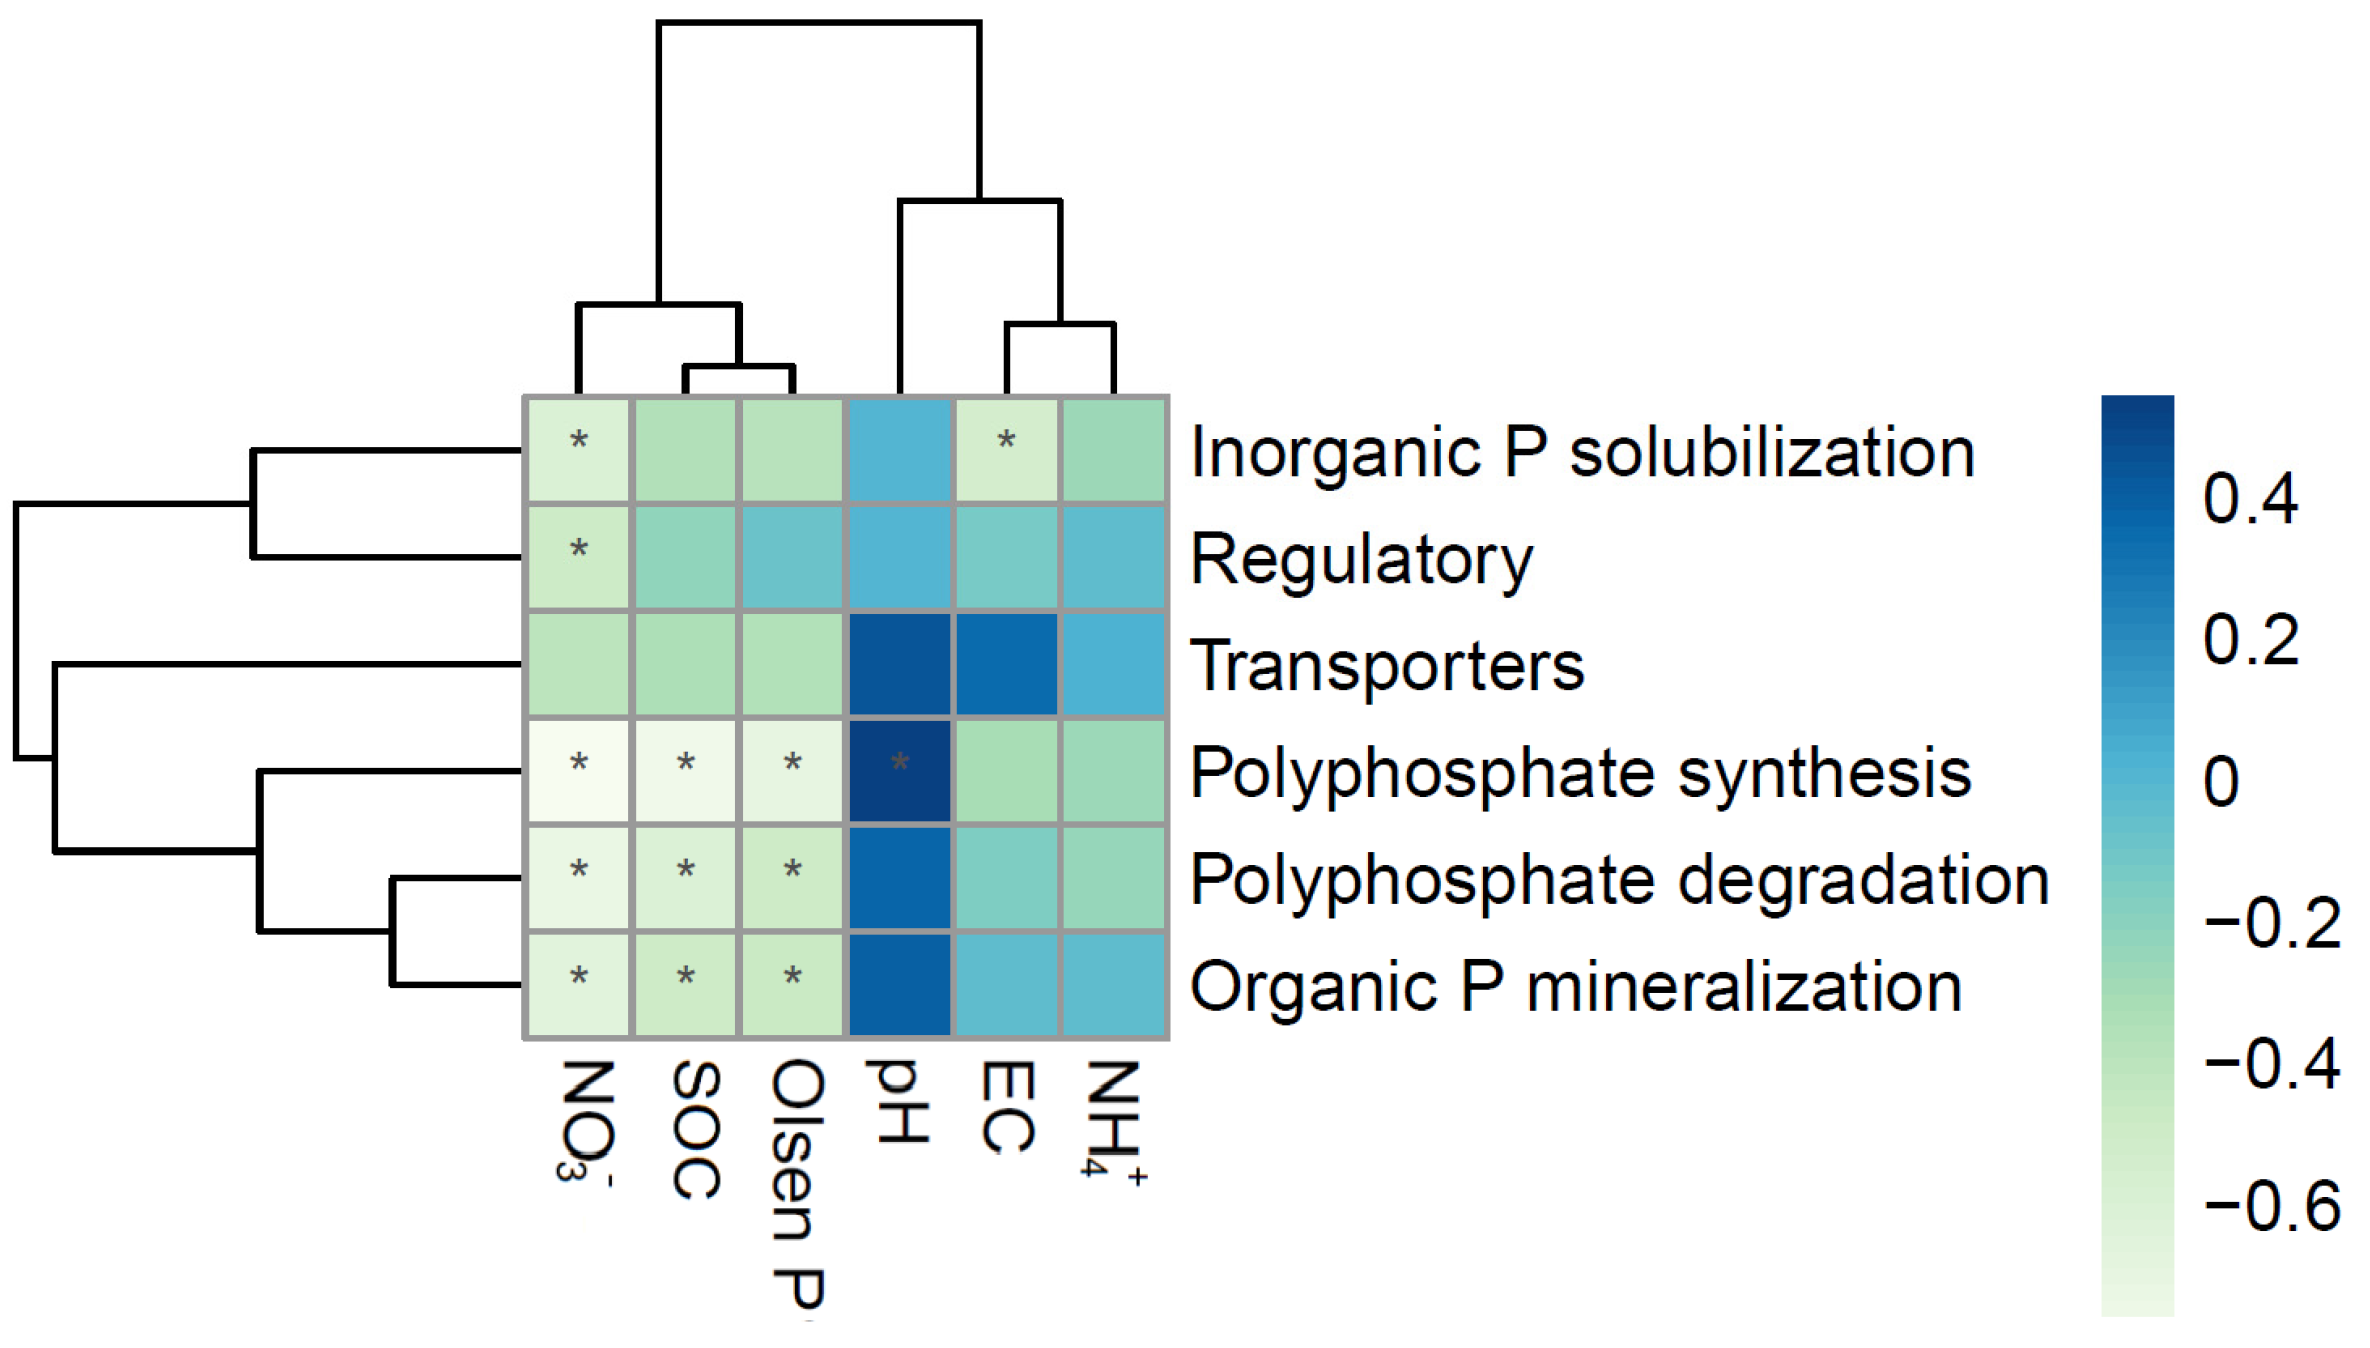
3.4. Correlations Between Soil P Fractions and Environmental Factors

The association between soil P fractions and environmental factors was assessed using the data from 2021 and 2023. In the principal component analysis (Figure 5a), PC1 and PC2 accounted for 55.9% and 25.2% of the variance, respectively. Al-P, Fe-P, and Ca-P were correlated most strongly with total P, followed by electrical conductivity (EC) and Olsen P. O-P was correlated most strongly with Olsen P, followed by SAP, total P, and SOC.
Figure 5b shows the calculated Spearman correlation coefficients between soil P fractions and environmental factors, including soil pH, EC, SOC, SAP, total N, total P, and Olsen P. A significant positive correlation existed between the soil inorganic P fractions and the environmental factors (p < 0.05, Figure 5b). Al-P was the fraction most positively correlated with total P (R = 0.99), followed by Fe-P (R = 0.94), O-P (R = 0.88), and Ca-P (R = 0.70). O-P was the fraction most positively correlated with Olsen P (R = 0.85), followed by Fe-P (R = 0.67), Al-P (R = 0.61), and Ca-P (R = 0.52). O-P was also the fraction most positively associated with SOC (R = 0.74) and with SAP (R = 0.88). Al-P was the fraction most positively associated with total N (R = 0.82).

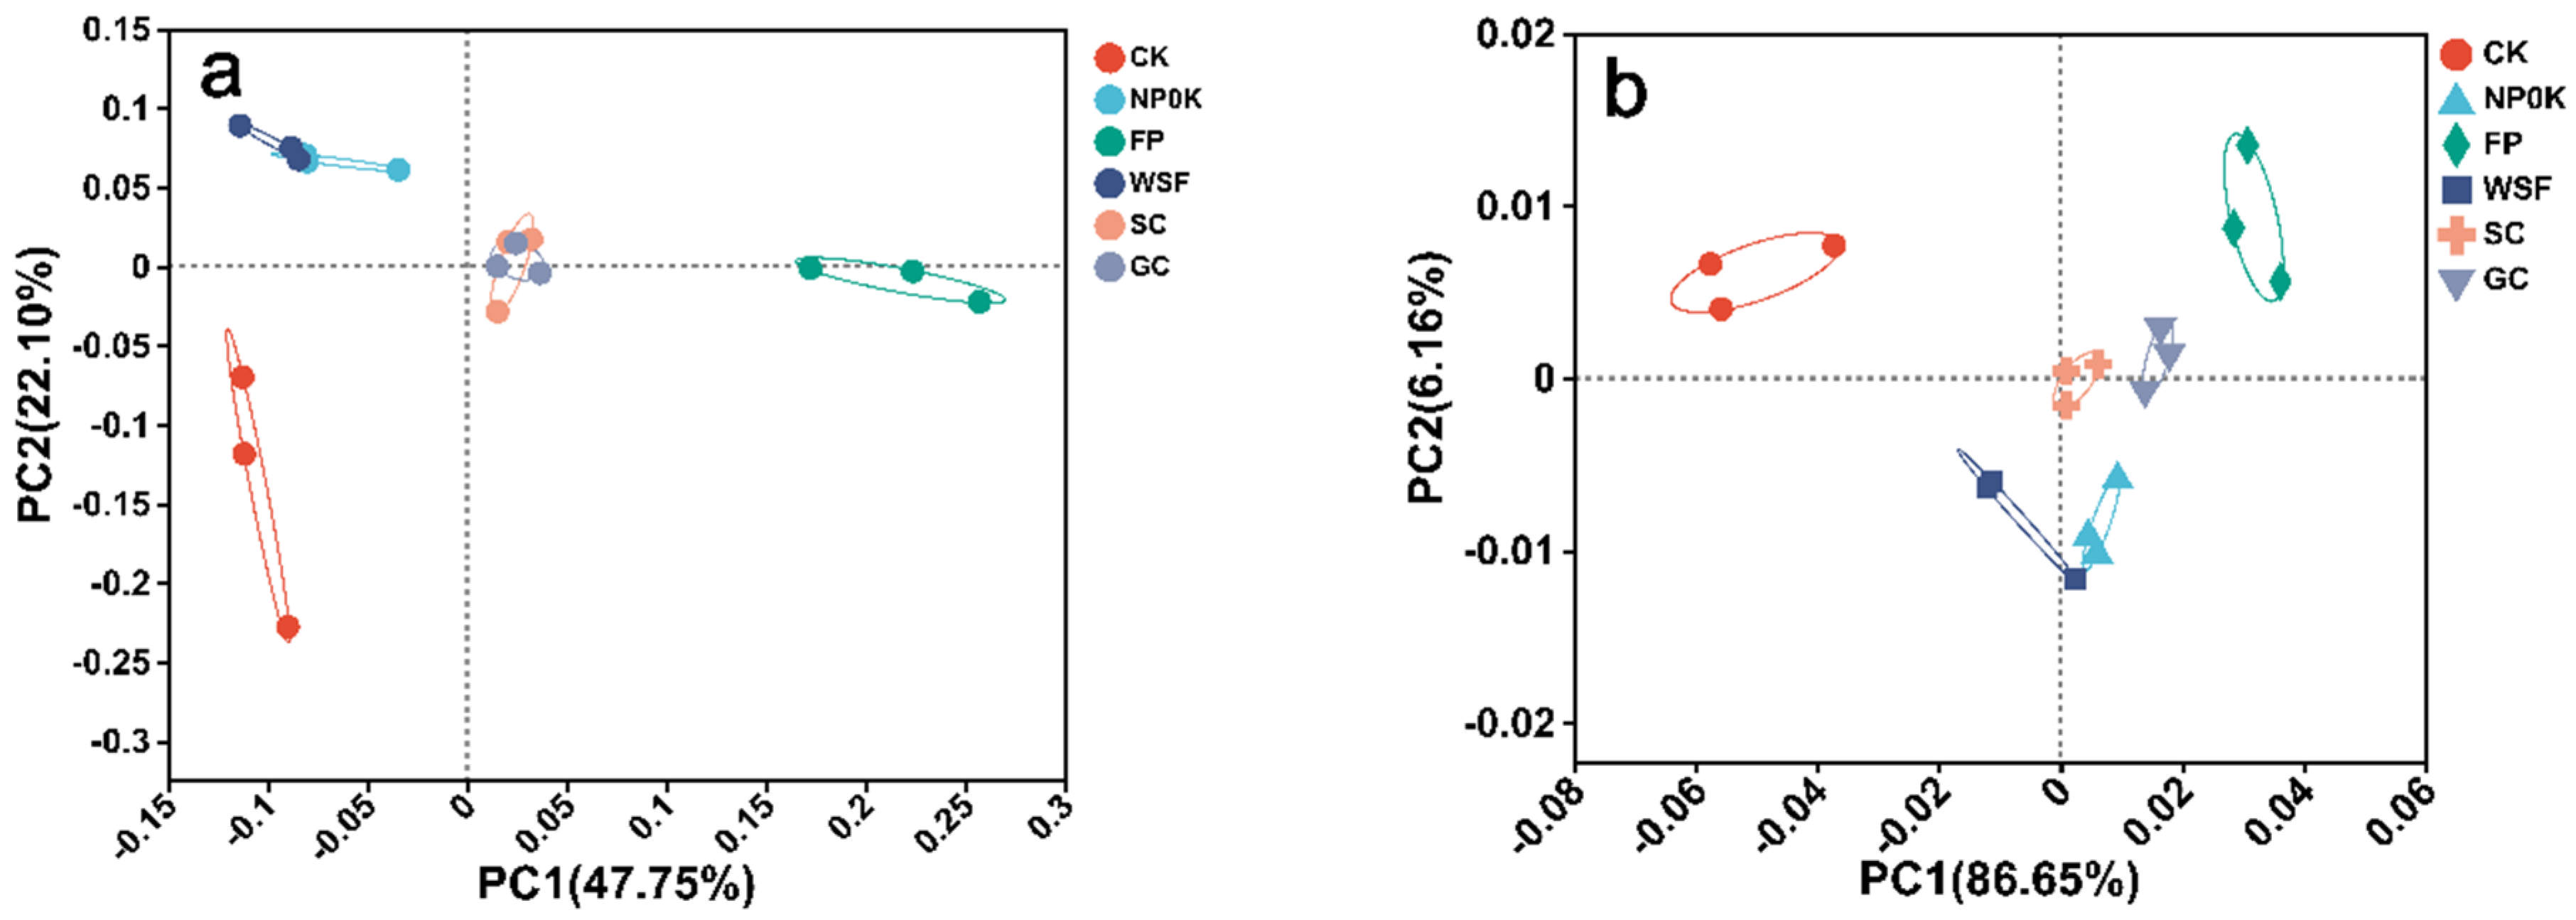
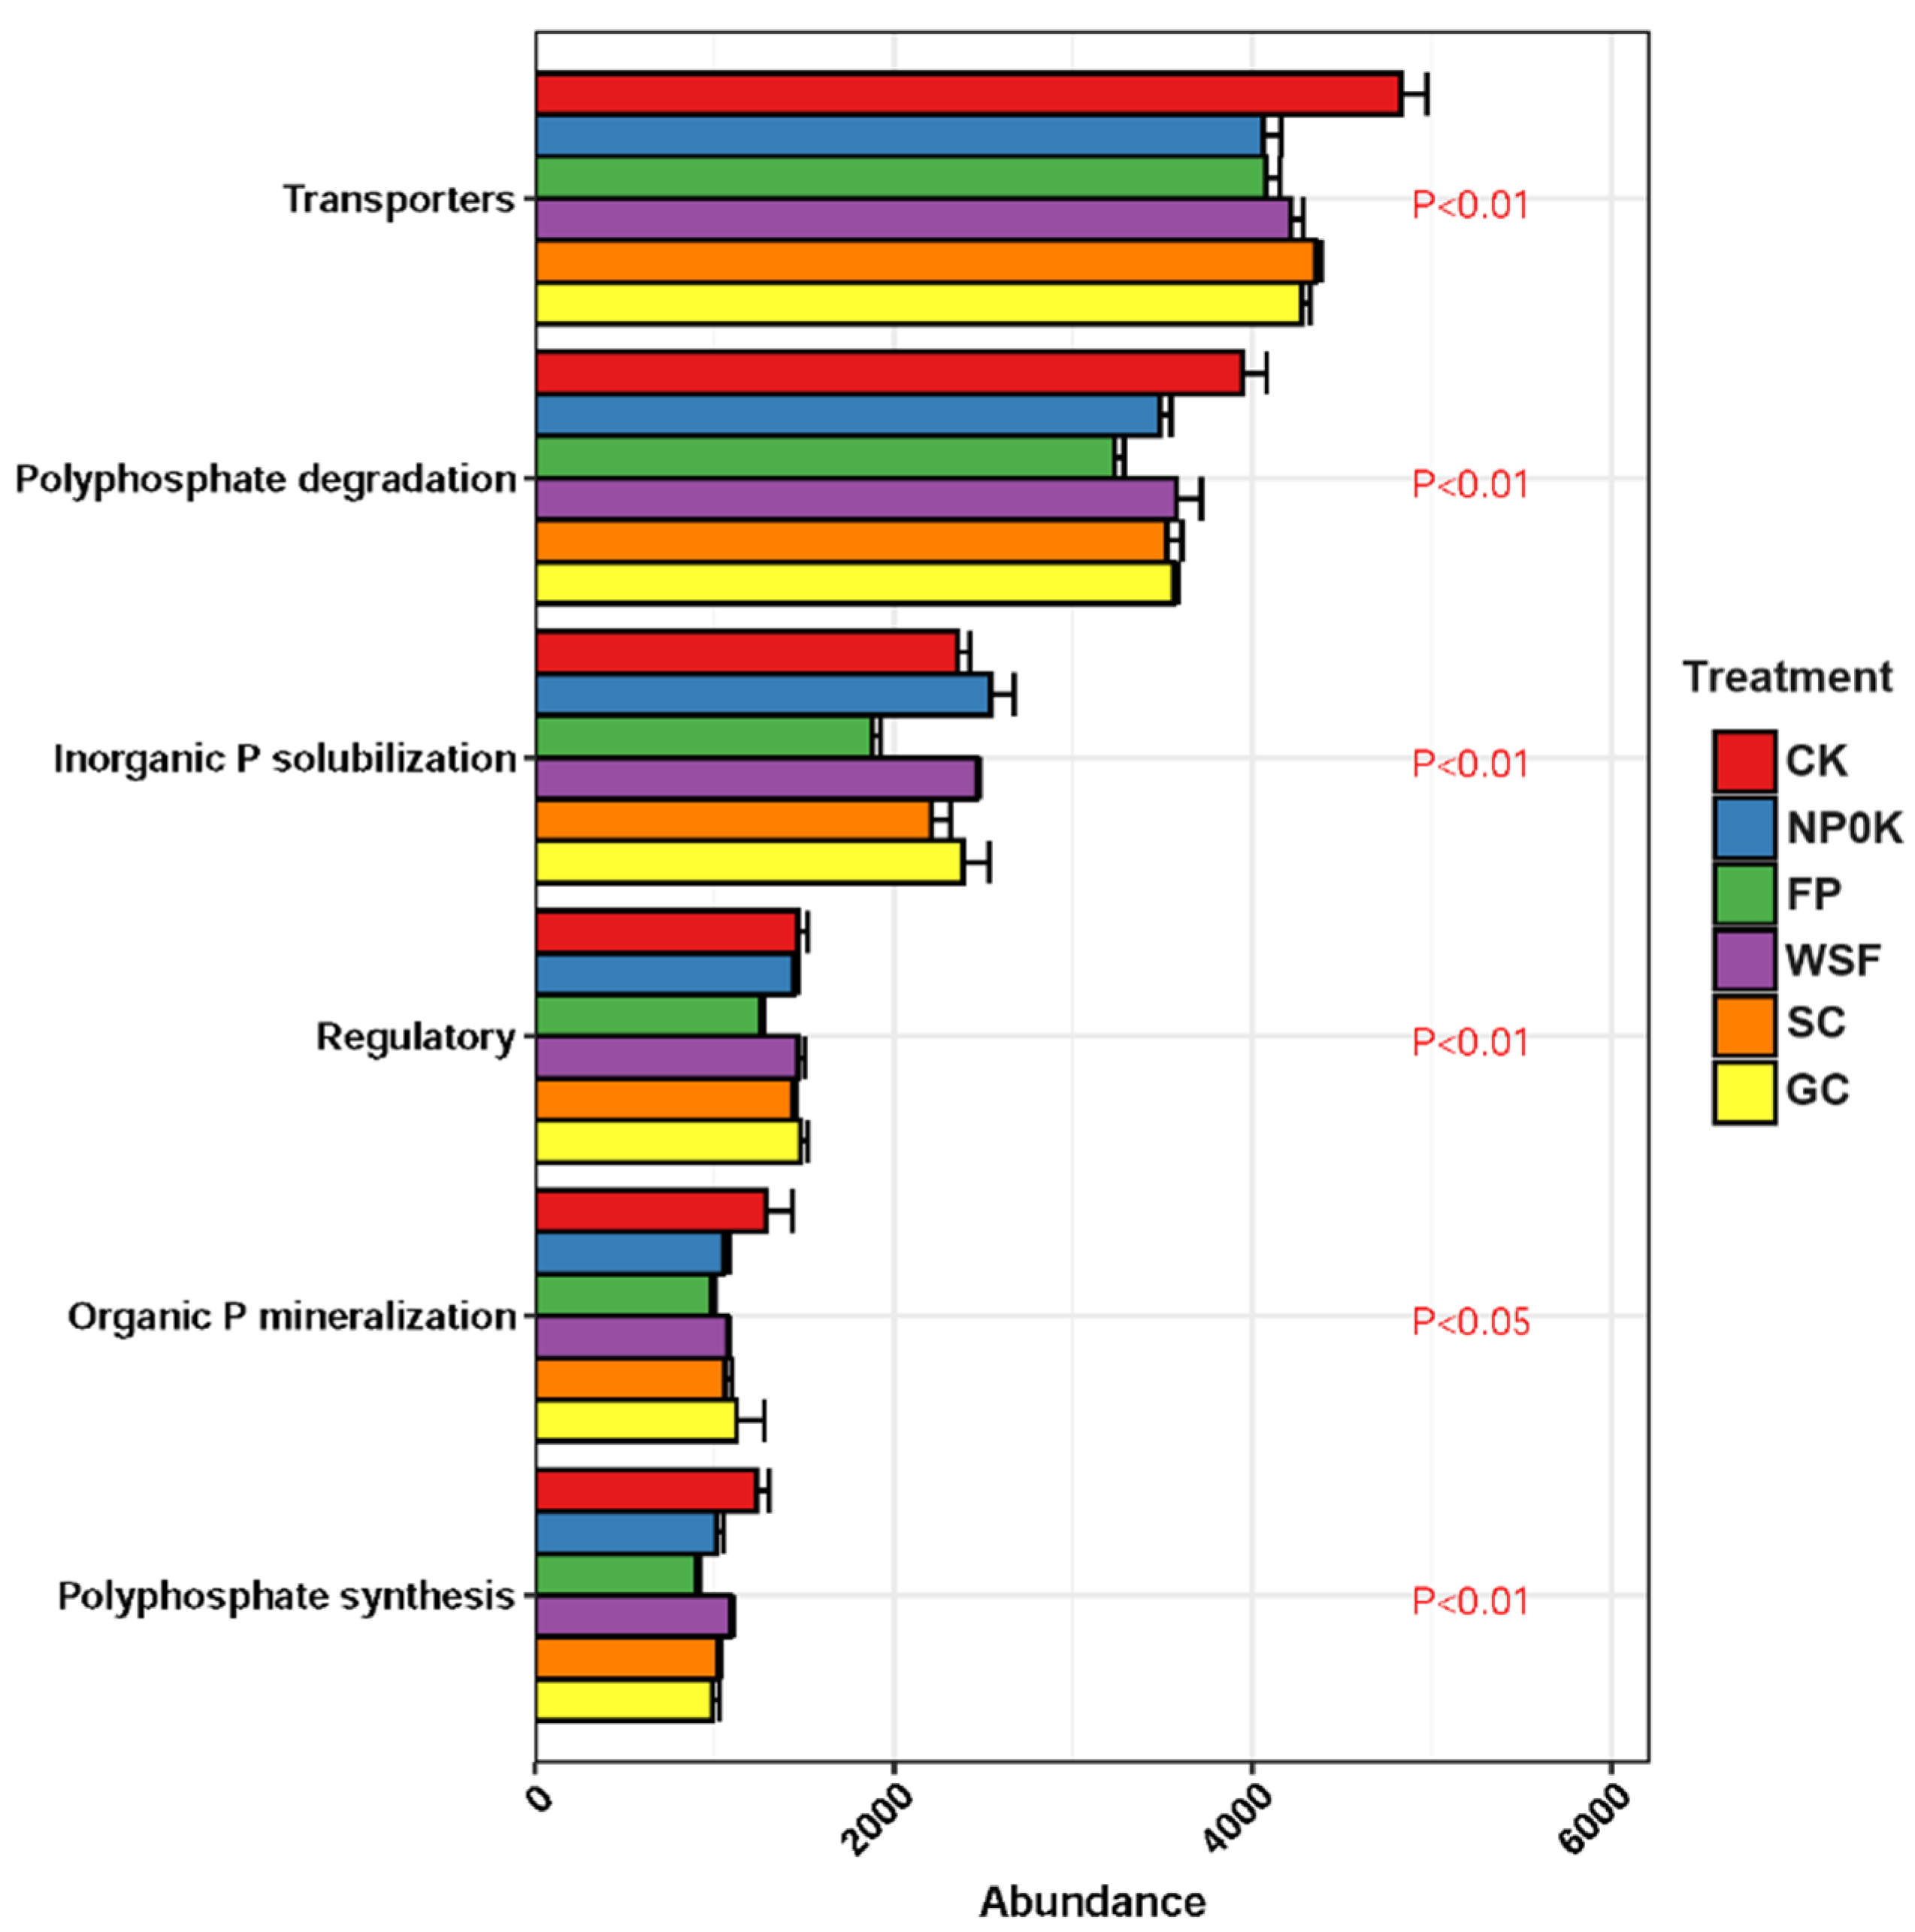
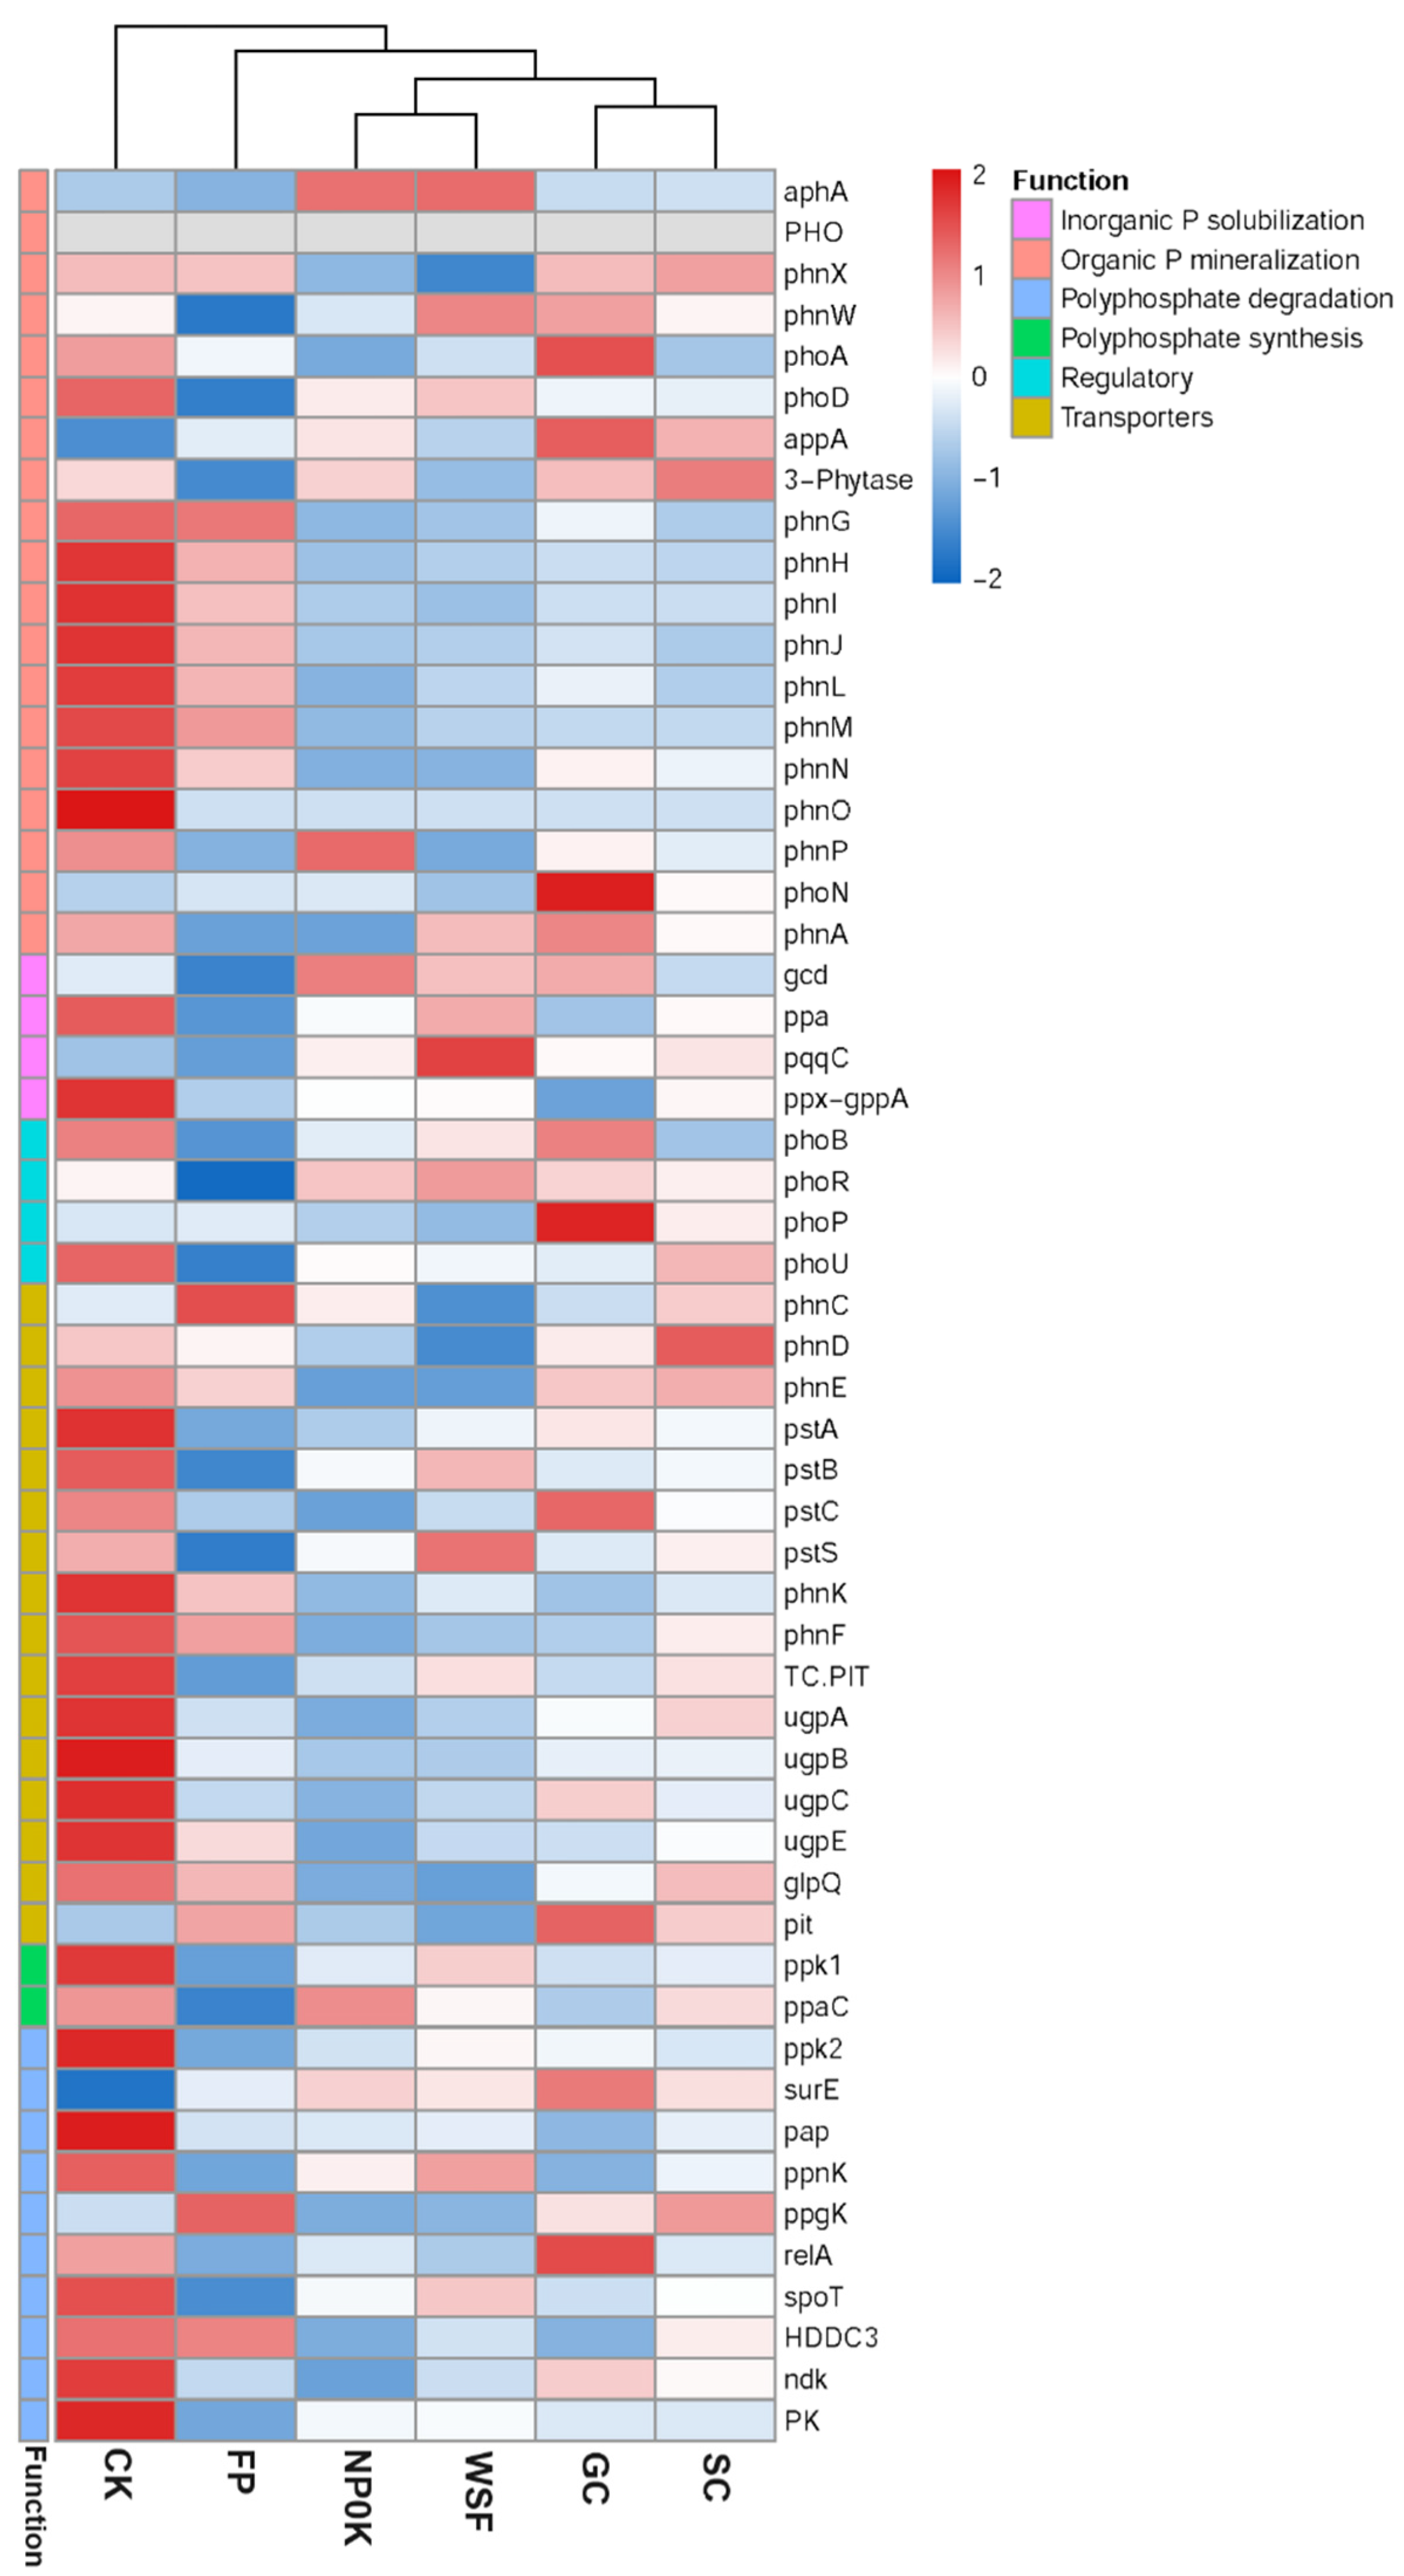
3.5. Soil Microbial Communities and the P Cycling Genes

The microbial communities in the 0–30 cm soil layer were determined by metagenomic sequencing, and PCoA was performed to evaluate the microbial communities and the functional diversity of different plots (Figure 6). For the microbial composition at the genus level (Figure 6a), PC1 and PC2 accounted for 47.75% and 22.10% of the cumulative variance, respectively, and they added to a total variance of 69.85%. Converting the barren mountain into apple orchards must have significantly affected the microbial communities, as CK was clearly separated from all other treatments. SC and GC had similar microbial community structures, but FP and WSF were distinct. Regarding the functional diversity (Figure 6b), PC1 and PC2 accounted for 86.65% and 6.16% of the cumulative variance, respectively, and they added to a total variance of 92.81%. CK was well separated from all other treatments.
Phosphorus cycling genes fall into six categories, i.e., transport, regulation, polyphosphate degradation, polyphosphate synthesis, inorganic P solubilization, and organic P mineralization [36,37,38]. The most abundant functional genes in the soil samples were transporter genes, inorganic P solubilization genes, and regulatory genes (Figure 7, Table S4). Therefore, the soil P cycle in the apple orchards was mainly affected by inorganic P solubilization, P transport, and P regulation genes. For all treatments, the abundance of PCGs, except inorganic P solubilization genes, dropped significantly compared to CK. Among the four treatments that received inorganic P input, WSF had the highest abundance of inorganic P solubilization genes.
In terms of individual genes (Figure 8, Table S5), setting up the apple orchards significantly reduced the abundance of the following genes: phnH, phnI, phnJ, phnL, phnM, phnN, and phnO, which are related to organic P mineralization; phnK, phnF, TC.PIT, ugpA, ugpB, ugpC, and ugpE, which belong to transporters; and ppk2, pap, ndk, and PK, which are related to polyphosphate degradation. The abundance of phoN, which is related to organic P mineralization, was the highest in GC. The abundance of pqqC, which is related to inorganic P solubilization, was the highest in WSF.
The correlations between the six categories of PCGs and the soil physicochemical properties were also analyzed (Figure 9, Table S6). A positive correlation existed between pH and polyphosphate synthesis genes. Strong negative correlations existed between NO3 and all gene categories except transporters. Both SOC and Olsen P were negatively correlated with polyphosphate degradation genes, organic P mineralization genes, and polyphosphate synthesis genes. A negative correlation also existed between EC and inorganic P solubilization genes.

4. Discussion

4.1. Planting Apple Trees Caused P Leaching Loss and Severe Accumulation of Inorganic P in Soil

Over time, the P leaching loss increased (Figure 1), and the soil pH decreased. The elevated P leaching could be associated with the falling soil pH, which in turn could be associated with the input of inorganic N over time. These findings align with previous studies that noted acidification from ammonium-based fertilizers enhances P mobility [39,40]. One aim of this study was to find a proper P fertilization management strategy to reduce P leaching and inorganic P accumulation.
Among all treatments, alkaline soil conditioners (SC) always had the lowest P leaching loss, likely because the alkaline soil amendment increased the soil pH. This supports earlier research demonstrating that liming reduces P leaching in acidic soils [41,42]. In contrast, WSF had the highest P leaching loss. In WSF, the nutrients were dissolved in water, existed in the ionic form, and could not be readily retained by the soil. Indeed, prior studies found that highly soluble P sources are prone to loss in coarse-textured soils [43]. For the NP0K treatment, the P leaching values were unusually high, which might be relevant to lateral nutrient movement in sandy soils, since the experimental site was located at a well-known sand production area.
The input of inorganic P fertilizers significantly increased the total P and Olsen P in the soil, especially in the 0–30 cm soil layer. The application of inorganic P fertilizers can directly enhance soil fertility, and Olsen P is the standard for assessing the bioavailable P in soil. Figure 2b shows that the proportion of Olsen P remained low even with rising total P. Hence, a large amount of P existed in forms not available to the plants. This aligns with studies showing that long-term P fertilization leads to P saturation and fixation, particularly as Al/Fe-bound fractions [44]. Figure 3 shows that after the application of P fertilizers, the O-P, Al-P, and Fe-P fractions increased significantly, and Al-P replaced O-P to become the most abundant fraction of inorganic P in the soil. The rise in the inorganic P fractions may have reduced the bioavailability of P in the soil and the P uptake by plants. The total P in the soil decreased from 2021 to 2023, which could be related to lower soil pH, leaching, and crop uptake. Thus, the five-year monitoring of soil fertility is important for orchard productivity. GC had the largest increase in bioavailable P, likely due to improvements in soil structure and SOC, as meta-analyses have shown that organic inputs enhance P use efficiency [45]. FP and SC also showed favorable changes in bioavailable P. However, WSF had the least accumulation of P in the soil, possibly because of the solubility of the fertilizer and the efficiency of plant uptake. The low P accumulation of WSF underscores the tradeoff between immediate plant uptake and long-term soil P storage.

4.2. The Inorganic P Fractions in Soils Were Closely Related to Environmental Factors

The inorganic P fractions in soils were closely related to environmental factors. Higher levels of inorganic P were strongly associated with the increases in total and bioavailable P, highlighting the dynamic interplay between soil chemistry, microbial activity, and nutrient cycling. Our findings align with prior studies demonstrating that Fe-P and Al-P are dominant in acidic soils with high organic matter content, where metal oxides strongly influence P speciation [46]. However, this study further clarifies the indirect role of N in changing P fractions—a mechanism less emphasized in earlier works. The correlation between Fe-P/Al-P and total N/SOC (Figure 5) matches the observations in the literature [46,47,48], suggesting that the competition of NH4+ for adsorption sites promotes Fe/Al-P precipitation. The tight coupling of N and P dynamics suggests that N fertilization strategies should account for their indirect effects on P availability. For instance, excessive NH4+ application in acidic soils may inadvertently enhance P fixation as Fe-P/Al-P, reducing P bioavailability. This underscores the need for balanced N-P inputs or alkaline amendments to mitigate P immobilization.
This O-P formation process becomes more significant under acidic conditions, since a lower pH inhibits P desorption in the soil [49,50]. Indeed, GC had the highest SOC and O-P. The significant role of SAP in driving O-P formation under acidic conditions also corroborates the literature findings [47,48], but our results link SAP activity to the simultaneous increases in Fe-P, Al-P, and O-P. The increase of SAP activity accelerates the mineralization of organophosphorus in the soil and converts organophosphorus into inorganic P. The newly released inorganic P can then combine with Fe, Al, and other oxides in the soil to form Fe-P, Al-P, and O-P. Hence, SOC and SAP are key environmental factors that increase the inorganic P fractions in the soil.

4.3. Planting Apple Trees Influenced the Microbial Genes and Functions Related to the Soil P Cycle

Converting the barren mountain to apple orchards significantly affected the soil bacterial communities. For all treatments, compared to CK, the abundance of PCGs except inorganic P solubilization genes decreased. The metagenomic analysis based on the KEGG database demonstrated that the functional genes of the soil microbes were highly sensitive to the P fertilization practices, like other agricultural systems [51,52]. The genes responsible for inorganic P solubilization and organic P mineralization play a vital role in the soil P cycle as they increase the bioavailability of P for plant uptake. The ppx-gppa gene mediates the biological solubilization of the insoluble inorganic P, such as Ca-P, hydroxyapatite, and rock-P, and it is more abundant in soils with lower P accumulation [51]. The accumulation of P in the soil seemed to inhibit the abundance of all PCGs except ppx-gppa (Figure 8). WSF had the highest abundance of pqqC, which is a gene responsible for inorganic P solubilization and likely improved the bioavailability of P at WSF by enhancing P dissolution. Among the genes for organic P mineralization, phoD had the most sensitive response to P fertilization [52]. It has been reported that the abundance of phoD decreases with extended P fertilization in acidic soil [18,53]. The abundance of phoN was the highest in GC, possibly because interplanting grass in the orchard effectively promoted the activity of the genes involved in the mineralization of organic P. The success of grass interplanting (GC) in promoting phoN abundance signals that integrated orchard management with cover crops can enhance organic P mineralization. The result aligns with the global trends toward regenerative agriculture, where plant diversity is harnessed to sustain soil microbiome resilience.
Strong negative correlations existed between inorganic phosphorus solubilization and soil properties such as EC, SOC, Olsen P, NH4+ and NO3. Thus, the increase in these factors may inhibit microbial P mobilization. This underscores the need for precision fertilization to avoid suppressing native microbial functions. The strong negative correlations between Olsen P, SOC, and NO3 with polyphosphate synthesis implied that optimizing carbon and nitrogen levels may significantly inhibit polyphosphate synthesis.
The different fertilization strategies had distinct environmental impacts. Water-soluble fertilizer (WSF) showed the highest phosphorus leaching risk because the P in ionic form cannot be effectively retained by the soil, especially coarse-textured soil. In contrast, alkaline soil conditioners (SC) effectively reduced P leaching by increasing soil pH. The long-term application of inorganic P fertilizers led to the accumulation of Al/Fe-bound P fractions, which decreased P bioavailability. Covering grass (GC) enhanced soil organic carbon and promoted microbially mediated P cycling. The five-year monitoring revealed declining total soil P associated with soil acidification, leaching losses, and plant uptake. These results highlight the need for optimized fertilization strategies that balance agricultural productivity with long-term environmental sustainability in orchard systems. The findings provide scientific evidence for developing management practices that minimize environmental risks while maintaining soil health and crop production.

5. Conclusions

Converting the land on a barren mountain into apple orchards, to which P fertilizers were applied for five years, led to issues of inorganic P accumulation and leaching due to the changes in soil pH, SOC, and SAP activity. The application of P fertilizers reduced the abundance of microbial phosphorus cycling genes (PCGs), which potentially affected the soil P bioavailability. The water-soluble P fertilizers (WSF) showed the highest leaching risks and lowest inorganic P fixation. The grass interplanting treatment (GC) emerged as the optimal strategy in minimizing P leaching while enhancing bioavailable P through improved organic P mineralization. Future research is needed to inspect the complex interactions between land-use changes and soil microbial communities, including their composition and the PCGs. Effective fertilization strategies, integrated with microbial ecology, should enhance phosphorus (P) use efficiency, reduce environmental impacts, and facilitate the transition to more sustainable orchard management practices.

Supplementary Materials

The following supporting information can be downloaded at: https://www.mdpi.com/article/10.3390/agronomy15040952/s1, Scheme S1. Each plot is 12 m in length and 6 m in width, with a slope gradient of 6°. Figure S1. Soil inorganic P contents of different soil depths in 2016. Table S1. Physicochemical properties of the original soil collected in 2017. Table S2. Fertilization applied in different treatments. Table S3. Chemical composition of the amendments. Table S4. The analysis of variance (ANOVA) analysis on soil P-cycling functions in barren mountain soil (CK) and orchard soils under different treatments in 2022. Table S5. Abundances of functional genes related to the P cycle in impacts of barren mountain soils (CK) and orchard soils under different treatments, the absence of P fertilizer (NP0K), the traditional farmer’s fertilization practice (FP), water-soluble fertilizer (WSF), alkaline soil conditioner (SC), and interplanting grass (GC) in 2022. Table S6. Spearman correlations related to the P cycle in barren mountain soil (CK) and orchard soils under different treatments in 2022.

Author Contributions

Conceptualization, Y.S. (Yuwen Shen), Y.M. and H.L.; Methodology, Y.S. (Yuwen Shen) and H.L.; Validation, Y.S. (Yuwen Shen), Y.M. and R.X.; Formal Analysis, Y.S. (Yuwen Shen), R.X. and Y.S. (Yan Song); Investigation, Y.S. (Yuwen Shen), Y.M. and H.L.; Resources, R.X. and Y.S. (Yan Song); Data Curation, Y.S. (Yuwen Shen), R.X. and Y.S. (Yan Song); Writing—Original Draft Preparation, Y.S. (Yuwen Shen); Writing—Review and Editing, H.L., Y.M., R.X. and Y.S. (Yan Song); Supervision, Y.S. (Yuwen Shen) and Y.M.; Funding Acquisition, Y.S. (Yuwen Shen) and Y.M. All authors have read and agreed to the published version of the manuscript.

Funding

This research was funded by Shandong Province Key R&D Program (Science and Technology Demonstration Project) (No. 2022SFGC0305), Taishan Scholars Program (No. tsqn 202312289), and Agricultural Science and Technology Innovation Project of Shandong Academy of Agricultural Sciences (Nos. CXGC2024D04 and CXGC2025B07).

Data Availability Statement

The datasets used and/or analyzed during the current study are available from the corresponding author upon reasonable request.

Conflicts of Interest

Author Yan Song was employed by the company Stanley Agriculture Group Co., Ltd. The remaining authors declare that the research was conducted in the absence of any commercial or financial relationships that could be construed as a potential conflict of interest.

Abbreviations

The following abbreviations are used in this manuscript:
Nnitrogen
Pphosphorus
Kpotassium
Feiron
Alaluminum
Cacalcium
PUEP use efficiency
PCGsphosphorus cycling genes
WSFwater-soluble fertilizer
SCsoil conditioner
SOCsoil organic carbon
Al-Paluminum phosphate
O-Poccluded phosphate
Ca-Pcalcium phosphate
Fe-Piron phosphate
SAPsoil acid phosphatase
PCAprincipal component analysis
PCoAPrincipal co-ordinates analysis
FDRfalse discovery rate
ECelectrical conductivity

References

  1. China Apple Industry Association. China Agricultural University Agricultural Planning and Design Institute 2021 China Apple Industry Development Report (General) Condensed version. China Fruit Veg. 2023, 44, 1–9. [Google Scholar] [CrossRef]
  2. Zhou, W.; Fan, Z.L.; Wang, C.; Wu, J.M.; Guo, Y.; Li, L. Research on optimization of cultivated land protection policies based on dual objectives of development and protection. Nat. Resour. Econ. China 2024, 1–13. [Google Scholar] [CrossRef]
  3. Cordell, D.; White, S. Tracking phosphorus security: Indicators of phosphorus vulnerability in the global food system. Food Sec. 2015, 7, 337–350. [Google Scholar] [CrossRef]
  4. Haygarth, P.M.; Mezeli, M.M. Opportunity to improve global phosphorus governance. Nat. Food 2023, 4, 837–838. [Google Scholar] [CrossRef] [PubMed]
  5. Mammadov, G.M.; Mahboub Khomami, A.; Mammadov, T.G. Effect of fertilizer, furrow length, and irrigation flow rate on soil nutrient and yield of apple orchard. Appl. Environ. Soil Sci. 2024, 2024, 9088511. [Google Scholar] [CrossRef]
  6. Liu, Z.; Hou, L.; Zhu, Y.; Xu, X. Vertical distribution and regulation of Olsen-phosphorus in 6-m soil profiles after farm Land-to-apple orchard conversion on the Chinese Loess Plateau. Catena 2021, 202, 105254. [Google Scholar] [CrossRef]
  7. Zhao, J.; Yuan, X.; Liu, Z.; Shi, H.; Zhai, B.; Zhu, Y. Divergent responses of soil physicochemical properties in 6-m profiles to long-term overfertilization in rainfed apple orchards on China’s Loess Plateau. Agric. Ecosyst. Environ. 2024, 361, 108817. [Google Scholar] [CrossRef]
  8. Sugihara, S.; Tomita, Y.; Nishigaki, T.; Kilasara, M.; Wasaki, J.; Funakawa, S. Effects of different phosphorus-efficient legumes and soil texture on fractionated rhizosphere soil phosphorus of strongly weathered soils. Biol. Fertil. Soils 2016, 52, 367–376. [Google Scholar] [CrossRef]
  9. Rodrigues, M.; Withers, P.J.A.; Soltangheisi, A.; Vargas, V.; Holzschuh, M.; Pavinato, P.S. Tillage systems and cover crops affecting soil phosphorus bioavailability in Brazilian Cerrado Oxisols. Soil Till. Res. 2021, 205, 104770. [Google Scholar] [CrossRef]
  10. Wang, R.; Guo, S.; Li, N.; Li, R.; Zhang, Y.; Jiang, J.; Wang, Z.; Liu, Q.; Wu, D.; Sun, Q.; et al. Phosphorus Accumulation and Sorption in Calcareous Soil under Long-Term Fertilization. PLoS ONE 2015, 10, e0135160. [Google Scholar] [CrossRef]
  11. Weihrauch, C.; Weber, C.J. Comparative risk assessment of phosphorus loss from “deep phosphorus stocks” in floodplain subsoils to surface waters. Sci. Total Environ. 2021, 769, 149037. [Google Scholar] [CrossRef] [PubMed]
  12. Xie, Z.; Yang, X.; Sun, X.; Huang, L.; Li, S.; Hu, Z. Effect of biochar application and irrigation rate on the soil phosphorus leaching risk of fluvisol profiles in open vegetable fields. Sci. Total Environ. 2021, 789, 147973. [Google Scholar] [CrossRef]
  13. Kopytko, P.; Karpenko, V.; Yakovenko, R.; Mostoviak, I. Soil fertility and productivity of apple orchard under a long-term use of different fertilizer systems. Agronomy Res. 2017, 15, 444–455. [Google Scholar]
  14. Bindraban, P.S.; Dimkpa, C.O.; Pandey, R. Exploring phosphorus fertilizers and fertilization strategies for improved human and environmental health. Biol. Fertil. Soils 2020, 56, 299–317. [Google Scholar] [CrossRef]
  15. Yuan, Z.; Jiang, S.; Sheng, H.; Liu, X.; Hua, H.; Liu, X.; Zhang, Y. Human perturbation of the global phosphorus cycle: Changes and consequences. Environ. Sci. Technol. 2018, 52, 2438–2450. [Google Scholar] [CrossRef] [PubMed]
  16. Wang, Y.; Huang, Q.; Gao, H.; Zhang, R.; Yang, L.; Guo, Y.; Li, H.; Awasthi, M.K.; Li, G. Long-term cover crops improved soil phosphorus availability in a rain-fed apple orchard. Chemosphere 2021, 275, 130093. [Google Scholar] [CrossRef]
  17. Hou, L.; Liu, Z.; Zhao, J.; Ma, P.; Xu, X. Comprehensive assessment of fertilization, spatial variability of soil chemical properties, and relationships among nutrients, apple yield and orchard age: A case study in Luochuan County, China. Ecol. Indic. 2021, 122, 107285. [Google Scholar] [CrossRef]
  18. Liu, S.; Li, H.; Xie, X.; Chen, Y.; Lang, M.; Chen, X. Long-term moderate fertilization increases the complexity of soil microbial community and promotes regulation of phosphorus cycling genes to improve the availability of phosphorus in acid soil. Appl. Soil Ecol. 2024, 194, 105178. [Google Scholar] [CrossRef]
  19. Yan, C.; An, D.; Zhao, B.; Ma, Z.; Ma, H.; Zhao, Q.; Kong, R.; Su, J. Intercropping herbage promoted the availability of soil phosphorus and improved the bacterial genus structure and the abundance of key bacterial taxa in the acidic soil of mango (Mangifera indica L.) orchards. Soil Use Manag. 2024, 40, e13046. [Google Scholar] [CrossRef]
  20. Zeng, Q.; Mei, T.; Wang, M.; Tan, W. Linking phosphorus fertility to soil microbial diversity and network complexity in citrus orchards: Implications for sustainable agriculture. Appl. Soil Ecol. 2024, 200, 105441. [Google Scholar] [CrossRef]
  21. Shen, Y.; Chen, H.; Lin, H.; Liu, P.; Song, X.; Ma, Y.; Li, M.; Gao, W.; Song, L. Severe nitrogen leaching and marked decline of nitrogen cycle-related genes during the cultivation of apple orchard on barren mountain. Agric. Ecosyst. Environ. 2024, 367. [Google Scholar] [CrossRef]
  22. Tiessen, H.; Moir, J.O. Characterization of Available P by Sequential Extraction; CRC Press: Boca Raton, FL, USA, 1993. [Google Scholar]
  23. Walkley, A.; Black, I.A. An examination of the Degtjareff method for determining soil organic matter and a proposed modification of the chromic acid titration method. Soil Sci. Soc. Am. J. 1934, 37, 29–38. [Google Scholar] [CrossRef]
  24. Bremner, J.M.; Mulvaney, C.S. Methods of Soil Analysis. Part 2. Chemical and Microbiological Properties; Wi American Society of Agronomy Inc. & Soil Science Society of America Inc.: Madison, WI, USA, 1982. [Google Scholar]
  25. Olsen, S.R.; Cole, C.V.; Watanabae, F.S.; Dean, L.A. Estimation of available phosphorus in soils by extraction with sodium bicarbonate. U.S. Dept. Agric. Circ. 1954, 939, 19. [Google Scholar]
  26. Williams, J.D.H.; Syers, J.K.; Walker, T.W. Fractionation of soil inorganic phosphate by modification of Chang and Jackson’s procedure. Soil Sci. Soc. Am. J. 1967, 3, 736–739. [Google Scholar] [CrossRef]
  27. Jiang, B.; Gu, Y. A suggested fractionation scheme of inorganic phosphorus in calcareous soils. Sci. Agr. Sin. 1989, 22, 58–66. [Google Scholar] [CrossRef]
  28. Murphy, J.; Riley, J.P. A modified single solution method for the determination of phosphate in natural waters. Anal. Chim. Acta 1962, 27, 31–36. [Google Scholar] [CrossRef]
  29. Guan, S. Soil Enzymes and Their Research Methods; Agricultural Press: Beijing, China, 1986. [Google Scholar]
  30. Huson, D.H.; Beier, S.; Flade, I.; Górska, A.; El-Hadidi, M.; Mitra, S.; Ruscheweyh, H.; Tappu, R. MEGAN community edition-interactive exploration and analysis of large-scale microbiome sequencing data. PLoS Comput. Biol. 2016, 12, e1004957. [Google Scholar] [CrossRef]
  31. Kanehisa, M.; Goto, S. KEGG: Kyoto encyclopedia of genes and genomes. Nucleic Acids Res. 2000, 28, 27–30. [Google Scholar] [CrossRef]
  32. Buchfink, B.; Xie, C.; Huson, D.H. Fast and sensitive protein alignment using diamond. Nat. Methods 2015, 12, 59–60. [Google Scholar] [CrossRef]
  33. Anderson, M.J. Distance-based tests for homogeneity of multivariate dispersions. Biometrics 2006, 62, 245–253. [Google Scholar] [CrossRef]
  34. Epp Schmidt, D.J.; Pouyat, R.; Szlavecz, K.; Setälä, H.; Kotze, D.J.; Yesilonis, I.; Cilliers, S.; Hornung, E.; Dombos, M.; Yarwood, S.A. Urbanization erodes ectomycorrhizal fungal diversity andmay cause microbial communities to converge. Nat. Ecol. Evol. 2017, 1, 0123. [Google Scholar] [CrossRef] [PubMed]
  35. Oksanen, J.; Blanchet, F.G.; Friendly, M.; Kindt, R.; Legendre, P.; McGlinn, D.; Minchin, P.R.; O’Hara, R.B.; Simpson, G.L.; Solymos, P.; et al. vegan: Community Ecology Package. R Package Version 2.5-2. 2018. Available online: https://CRAN.R-project.org/package=vegan (accessed on 6 March 2024).
  36. Tang, Y.; Zhan, T.; Fan, G.; Huang, J.; Zhou, Y.; Yuan, X.; Li, K.; Chen, S.; Zhao, X.; Hu, C. Selenium combined with chitin reduced phosphorus leaching in soil with pomelo by driving soil phosphorus cycle via microbial community. J. Environ. Chem. Engin. 2022, 10, 107060. [Google Scholar] [CrossRef]
  37. Dai, Z.; Liu, G.; Chen, H.; Chen, C.; Wang, J.; Ai, S.; Wei, D.; Li, D.; Ma, B.; Tang, C.; et al. Long-term nutrient inputs shift soil microbial functional profiles of phosphorus cycling in diverse agroecosystems. ISME J. 2020, 14, 757–770. [Google Scholar] [CrossRef] [PubMed]
  38. Liang, J.L.; Liu, J.; Jia, P.; Yang, T.; Zeng, Q.; Zhang, S.; Liao, B.; Shu, W.; Li, J. Novel phosphate-solubilizing bacteria enhance soil phosphorus cycling following ecological restoration of land degraded by mining. ISME J. 2020, 14, 1600–1613. [Google Scholar] [CrossRef]
  39. Yan, Z.; Chen, S.; Li, J.; Alva, A.; Chen, Q. Manure and nitrogen application enhances soil phosphorus mobility in calcareous soil in greenhouses. J. Environ. Manag. 2016, 181, 26–35. [Google Scholar] [CrossRef]
  40. Do Nascimento, C.A.; Pagliari, P.H.; Faria, L.D.A.; Vitti, G.C. Phosphorus mobility and behavior in soils treated with calcium, ammonium, and magnesium phosphates. Soil Sci. Soc. Am. J. 2018, 82, 622–631. [Google Scholar] [CrossRef]
  41. Yan, X.; Shi, L.; Gong, L. Mechanism analysis of soil amelioration and phosphorus recovery by using a mineral soil conditioner in southern China. J. Soils Sediments 2018, 18, 1884–1895. [Google Scholar] [CrossRef]
  42. Liu, M.; Tan, X.; Zheng, M.; Yu, D.; Lin, A.; Liu, J.; Cui, J. Modified biochar/humic substance/fertiliser compound soil conditioner for highly efficient improvement of soil fertility and heavy metals remediation in acidic soils. J. Environ. Manag. 2023, 325, 116614. [Google Scholar] [CrossRef]
  43. Ge, N.; Wei, X.; Wang, X.; Liu, X.; Shao, M.; Jia, X.; Zhang, Q. Soil texture determines the distribution of aggregate-associated carbon, nitrogen and phosphorous under two contrasting land use types in the Loess Plateau. Catena 2019, 172, 148–157. [Google Scholar] [CrossRef]
  44. Grenon, G.; Singh, B.; De Sena, A.; Madramootoo, C.A.; von Sperber, C.; Goyal, M.K.; Zhang, T. Phosphorus fate, transport and management on subsurface drained agricultural organic soils: A review. Environ. Res. Lett. 2021, 16, 013004. [Google Scholar] [CrossRef]
  45. Schröder, J.J.; Smit, A.L.; Cordell, D.; Rosemarin, A. Improved phosphorus use efficiency in agriculture: A key requirement for its sustainable use. Chemosphere 2011, 84, 822–831. [Google Scholar] [CrossRef] [PubMed]
  46. Gao, S.; Yang, J.; Yao, R.; Cao, Y.; Zhu, H.; Sun, Y.; Wang, X.; Xie, W. Effects of Different Management on Phosphorus Fractions in Coastal Saline Soil and Phosphorus Absorption and Utilization by Crops. Soils 2020, 52, 691–698. [Google Scholar] [CrossRef]
  47. Lu, P.; Li, W.; Niu, J.; Batbayar, J.; Zhang, S.; Yang, X. Phosphorus Availability and Transformation of Inorganic Phosphorus Forms Under Different Organic Carbon Levels in a Tier Soil. Sci. Agric. Sin. 2022, 55, 111–122. [Google Scholar]
  48. Shao, W.; Zhu, J.; Teng, Z.; Zhang, K.; Liu, S.; Li, M. Distribution of inorganic phosphorus and its response to the physicochemical characteristics of soil in Yeyahu Wetland, China. Process Saf. Environ. Prot. 2019, 125, 1–8. [Google Scholar] [CrossRef]
  49. Yan, X.J.; Yang, W.H.; Chen, X.H.; Wang, M.K.; Wang, W.Q.; Ye, D.L.; Wu, L.Q. Soil phosphorus pools, bioavailability and environmental risk in response to the phosphorus supply in the red soil of Southern China. Int. J. Envrion. Res. Public Health 2020, 17, 7384. [Google Scholar] [CrossRef] [PubMed]
  50. Hu, Y.; Chen, J.; Hui, D.; Li, J.; Yao, X.; Zhang, D.; Deng, Q. Soil acidification suppresses phosphorus supply through enhancing organomineral association. Sci. Total Environ. 2023, 905, 167105. [Google Scholar] [CrossRef]
  51. Khan, M.S.; Zaidi, A.; Wani, P.A. Role of phosphate-solubilizing microorganisms in sustainable agriculture—A review. Agron. Sustain. Dev. 2007, 27, 29–43. [Google Scholar] [CrossRef]
  52. Wang, Y.; Liu, L.; Hu, Y.; Zhang, J.; Jia, R.; Huang, Q.; Gao, H.; Awasthi, M.K.; Li, H.; Zhao, Z. The spatio-temporal change in soil P and P-solubilizing bacteria under clover mulching in apple orchards of Loess Plateau. Chemosphere 2022, 304, 135334. [Google Scholar] [CrossRef]
  53. Guo, L.; Wang, C.; Shen, R.F. Stronger effects of maize rhizosphere than phosphorus fertilization on phosphatase activity and phosphorus-mineralizing-related bacteria in acidic soils. Rhizosphere 2022, 23, 100555. [Google Scholar] [CrossRef]
Figure 1. (a) Leaching contents of total P and total dissolved P (DTP), and (b) P leaching rate for different treatments. NP0K, no P fertilizer; FP, traditional farmer’s fertilization; WSF, water-soluble fertilizer; SC, alkaline soil conditioner; GC, interplanting of hairy vetch. The error bars represent the standard deviation calculated from three replicates (n = 3). Different letters indicate statistically significant differences (p < 0.05), with black letters denoting total P and red letters denoting DTP.
Agronomy 15 00952 g001
Figure 2. The total P and Olsen P of the soil at different soil depths in (a) 2021 and (b) 2023. NP0K, no P fertilizer; FP, traditional farmer’s fertilization; WSF, water-soluble fertilizer; SC, alkaline soil conditioner; GC, interplanting of hairy vetch. The error bars represent the standard deviation calculated from three replicates (n = 3). Different letters indicate statistically significant differences (p < 0.05), with black letters denoting total P and red letters denoting Olsen P.
Agronomy 15 00952 g002
Figure 3. The inorganic P in soil at different soil depths in (a) 2021 and (b) 2023. NP0K, no P fertilizer; FP, traditional farmer’s fertilization; WSF, water-soluble fertilizer; SC, alkaline soil conditioner; GC, interplanting of hairy vetch. O-P, occluded phosphate; Ca-P, calcium phosphate; Al-P, aluminum phosphate; Fe-P, iron phosphate. The error bars represent the standard deviation calculated from three replicates (n = 3).
Agronomy 15 00952 g003
Figure 4. (a) Soil pH, (b) soil organic carbon, and (c) soil acid phosphatase activities of the soil at 0–30 cm depth after harvest. CK, barren mountain soil; NP0K, no P fertilizer; FP, traditional farmer’s fertilization; WSF, water-soluble fertilizer; SC, alkaline soil conditioner; GC, interplanting of hairy vetch. The error bars represent the standard deviation calculated from three replicates (n = 3). Different letters indicate statistically significant differences (p < 0.05).
Agronomy 15 00952 g004
Figure 5. (a) Principal component analysis and (b) Pearson correlation analysis of soil P fractions and environmental factors. The analyses were based on the data from 2021 and 2023. NP0K, no P fertilizer; FP, traditional farmer’s fertilization; WSF, water-soluble fertilizer; SC, alkaline soil conditioner; GC, interplanting of hairy vetch. O-P, occluded phosphate; Ca-P, calcium phosphate; Al-P, aluminum phosphate; Fe-P, iron phosphate; Olsen P, soil available P; SAP, soil acid phosphatase; SOC, soil organic carbon; EC, electrical conductivity.
Agronomy 15 00952 g005
Figure 6. Principal coordinates analysis of the (a) taxonomy and (b) beta diversity of soil microbes in the 0–30 cm soil layer at the genus level. CK, barren mountain soil; NP0K, no P fertilizer; FP, traditional farmer’s fertilization; WSF, water-soluble fertilizer; SC, alkaline soil conditioner; GC, interplanting of hairy vetch. The analysis was based on the data from 2022.
Agronomy 15 00952 g006
Figure 7. Analysis of variance (ANOVA) of the phosphorus cycling genes in the soil microbes of the 0–30 cm soil layer. CK, barren mountain soil; NP0K, no P fertilizer; FP, traditional farmer’s fertilization; WSF, water-soluble fertilizer; SC, alkaline soil conditioner; GC, interplanting of hairy vetch. The analysis was based on the data from 2022.
Agronomy 15 00952 g007
Figure 8. Abundances of phosphorus cycling genes in the soil microbes of the 0–30 cm soil layer. CK, barren mountain soil; NP0K, no P fertilizer; FP, traditional farmer’s fertilization; WSF, water-soluble fertilizer; SC, alkaline soil conditioner; GC, interplanting of hairy vetch. The analysis was based on the data from 2022.
Agronomy 15 00952 g008
Figure 9. Spearman correlations between categories of phosphorus cycling genes and soil properties in the 0–30 cm soil layer. NO3, soil NO3-N concentration; SOC, soil organic carbon concentration; EC, electrical conductivity; NH4+, soil NH4+-N concentration; Olsen P, soil available P concentration. * indicates statistically significant differences (p < 0.05).
Agronomy 15 00952 g009
Disclaimer/Publisher’s Note: The statements, opinions and data contained in all publications are solely those of the individual author(s) and contributor(s) and not of MDPI and/or the editor(s). MDPI and/or the editor(s) disclaim responsibility for any injury to people or property resulting from any ideas, methods, instructions or products referred to in the content.

