Abstract
Runner bean is an important food source worldwide, and effective disease prevention and control are crucial to ensuring food security. However, runner bean is vulnerable to various diseases during its growth, which significantly affect both yield and quality. Despite the continuous advancement of disease detection technologies, existing legume disease detection models still face significant challenges in identifying small-scale, irregular, and visually insignificant disease types, limiting their practical application. To address this issue, this study proposes an improved detection model, YOLOv8_RBean, based on the YOLOv8n object detection framework, specifically designed for runner bean leaf disease detection. The model enhances detection performance through three key innovations: (1) the BeanConv module, which integrates depthwise separable convolution and pointwise convolution to improve multi-scale feature extraction; (2) a lightweight LA attention mechanism that incorporates spatial, channel, and coordinate information to enhance feature representation; and (3) a lightweight BLBlock structure built upon DWConv and LA attention, which optimizes computational efficiency while maintaining high accuracy. Experimental results on the runner bean disease dataset demonstrate that the proposed model achieves a precision of 88.7%, with mAP50 and mAP50-95 reaching 83.5% and 71.3%, respectively. Moreover, the model reduces the number of parameters to 2.71 M and computational cost to 7.5 GFLOPs, representing reductions of 10% and 7.4% compared to the baseline model. Notably, the method shows clear advantages in detecting morphologically subtle diseases such as viral infections, providing an efficient and practical technical solution for intelligent monitoring and prevention of runner bean diseases.
1. Introduction
As one of the world’s major food crops, runner bean plays a key role in ensuring food security and sustainable agricultural development [1]. According to the United Nations Food and Agriculture Organization (FAO), pulses provide an important source of plant protein for the world’s population. However, disease has become an important factor restricting the increase in bean yield and seriously affecting agricultural production efficiency [2]. In the growth cycle of legumes, timely and accurate detection and control of diseases is of great significance to ensure yield. Traditional disease surveillance methods mainly rely on agronomists’ empirical judgment and artificial visual recognition [3]. This method is not only time-consuming and labor-intensive, but also susceptible to environmental conditions, personal experience, and subjective judgment, which is difficult to meet the demand for rapid and accurate disease diagnosis in large-scale agricultural production.
In recent years, with the rapid development of computer vision and deep learning technologies, deep learning-based plant disease detection methods have gradually become a research hotspot [4]. By automating the learning of feature representation, this method overcomes the high dependence of traditional methods on manual feature engineering, so it shows significant advantages in crop disease detection. The relevant studies mainly focus on three aspects: feature extraction, model optimization and practical application. In terms of feature extraction, Barbedo et al. [5] adopted deep learning to identify plant diseases, and used transfer learning to improve the generalization ability of the model. Jiao et al. [6] proposed an adaptive feature Fusion pyramid network (AFFP-Net) method for the detection of multiple types of agricultural pests. The method introduced adaptive feature fusion and adaptive feature enhancement modules, which effectively improved the detection accuracy of agricultural pests in complex scenes. For model optimization, Gao et al. [7] proposed a crop disease recognition method based on two-branch efficient channel attention mechanism (DECA), which significantly improved the detection and classification performance of crop diseases by optimizing the ResNet model structure. Sun et al. [8] proposed a lightweight disease detection framework MEAN-SSD and optimized the computational efficiency of the model through knowledge distillation. In terms of practical application, Tassis et al. [9] developed an end-to-end coffee disease diagnosis system, which realized the automation of the whole process from image acquisition to disease recognition. Nawaz et al. (2024) [10] proposed a deep learning method called CoffeeNet, which improved the CenterNet model and introduced a spatial-channel attention mechanism to successfully achieve high-precision identification and classification of coffee plant leaf diseases. Meanwhile, Liu et al. [11] proposed a method of disease image synthesis based on generative adversarial networks (Gans) to expand the diversity of training data.
In particular, YOLO series target detection algorithm is widely used in the field of agricultural visual analysis due to its excellent real-time performance. With the continuous evolution of YOLO model, its application in crop disease detection has experienced many technological innovations. Yan et al. [12] proposed a convolutional neural network (CNN) model named FSM-YOLO for the detection of apple leaf disease, and the model achieved 88.6% mAP@0.5 on the ALDD dataset. It is 2.7% higher than the current optimal YOLOv8s algorithm and 10.7% higher than the classical two-stage detection algorithm, Faster R-CNN. The RiceNet model proposed by Pan [13] combined YoloX and Siamese networks to efficiently identify rice diseases through a two-stage method. In the detection stage, the mAP of YoloX was 95.58%. The Siamese network’s recognition accuracy rate was 99.03%, exceeding the performance of other models. Li et al. [14] proposed a YOLOv9 model with MSPA module for maize pest detection, achieving 96.3% mAP on the IP102 dataset. Wang et al. [15] developed TomatoGuard-YOLO, an improved YOLOv10-based framework for tomato disease detection, achieving 94.23% mAP50 with 129.64 FPS and only 2.65 MB model size.
In terms of innovation in disease recognition methods, Zhang et al. [16] proposed a method based on global pooled extended convolutional neural network (GPDCNN) for the recognition of cucumber leaf diseases. This method combines extended convolutional and global pooling to identify cucumber leaf diseases. The accuracy and efficiency of disease identification were significantly improved. Experimental results showed that the accuracy of GPDCNN on the cucumber leaf disease dataset reached 94.65%, which was superior to the traditional DCNN and AlexNet models. Liu et al. [17] proposed a method based on deep convolutional neural networks (CNN) for apple leaf disease identification, and the accuracy of the model on the test set reached 97.62%. Wang et al. [18] designed a method for tomato leaf disease detection based on attention mechanism and multi-scale feature fusion, which enhanced the extraction of disease spot features through convolutional block attention module (CBAM). The improved multi-scale feature fusion module (BiRepGFPN) was used to improve the location ability of minor lesions. In the detection of tomato leaf disease, the average accuracy (mAP) was increased by 2.7% compared with YOLOv6, and the accuracy, recall rate and F1 score were also improved.
In addition, the deep convolutional neural network based plant disease detection method proposed by Mohanty et al. [19] was trained using 54,306 datasets containing 14 crops and 26 disease images, and achieved an accuracy of 99.35%. It demonstrates the great potential of deep learning in agricultural disease detection. Similarly, the automatic plant disease severity estimation method proposed by Wang et al. [20], which uses the VGG16 model for transfer learning, achieves an accuracy of 90.4% and successfully avoids artificial feature engineering and threshold-based image segmentation.
In terms of maize leaf disease classification, Liu et al. [21] proposed a multi-scale feature fusion-based residual network (MResNet) method, which extracted disease features through multi-scale residual subnetworks and fused them through a hybrid feature weight optimization method. Finally, the accuracy of the maize leaf disease dataset reached 97.45%, which was better than other existing methods. However, there are still many challenges in applying the existing detection models directly to the disease detection of pulses. First of all, bean diseases have diversified symptoms, including spots, necrosis, wilting, etc., and the spots are irregular in shape and significantly different in size [22]. Such complex morphological features put forward higher requirements on the feature extraction and expression ability of models. The existing models often perform poorly when dealing with diseases with changeable morphology, especially for early symptoms and atypical diseases. Second, early disease symptoms are often not obvious and resemble the visual features of healthy tissue, increasing the risk of false and missed detection. There may be similar apparent features between different types of diseases, and this feature ambiguity poses a challenge for accurate diagnosis. In addition, bean disease images collected in the field are often disturbed by factors such as light intensity, shooting angle, and shadow occlusion, which will lead to different visual characteristics of the same type of disease, increasing the difficulty of detection [23]. Finally, the existing high-precision detection models often have a large number of parameters and computational overhead, which is difficult to meet the demand for real-time detection in agricultural production, while the lightweight model has a faster inference speed [24], but the detection accuracy in complex scenarios still needs to be improved.
Based on the analysis of limitations of existing bean disease detection models, the YOLOv8_RBean model proposed in this paper has the following innovations:
(1) Multi-modal BeanConv hybrid convolution module: Aiming at the shortcomings of traditional convolution structures in capturing multi-scale features, a hybrid convolution structure combining depth separable convolution (DWConv) and point convolution (PConv) is designed. This module uses DWConv to effectively process local features in spatial dimensions, and PConv to realize information interaction between channels, thus theoretically achieving the optimal balance between computational complexity and feature expression ability and solving the difficult problem of feature extraction for small lesions and irregular form diseases.
(2) Three-dimensional feature fusion LA attention mechanism: In order to solve the problem of insufficient perception of local morphological features of diseases by traditional attention mechanism, a LA attention mechanism integrating spatial, channel, and coordinate information was proposed. The mechanism realizes the cross-dimensional feature interaction through the tensor decomposition principle in mathematics, which significantly enhances the model’s ability to distinguish diseases with irregular forms and insignificant symptoms, especially improves the detection sensitivity of early diseases such as viral diseases.
(3) Environmental adaptability BLBlock feature extraction module: Aiming at the limitation of computing resources deployed by object detection model on edge devices, a lightweight structure based on DWConv and SE attention is designed. By using the optimal parameter allocation strategy in theory, the structure reduces the computational complexity to 92.6% of the original model and the number of model parameters to 90% of the original model while maintaining high detection accuracy, and it solves the contradiction between high performance detection and resource limitation.
These technological innovations form a systematic solution that comprehensively improves the disease detection performance of beans from four aspects: feature extraction, attention mechanism, model lightweight, and environmental adaptability, and provides scientific and effective technical support for precision agriculture applications.
2. Materials and Methods
2.1. Dataset
The dataset used in this study consists of two parts. The first part includes 1100 images of bean leaf diseases, sourced from the public dataset (Bean Disease Dataset) and additional images collected via web scraping. The second part comprises 100 self-collected images, which were captured at Guoxin Modern Agriculture Base in Changchun, Jilin Province, China, disease identification is carried out by local senior agricultural experts. These images were acquired under diverse environmental conditions, including multiple illumination scenarios (such as sunny conditions and indoor lighting), varying camera angles and orientations, and different distances between the camera and the leaves, ensuring a realistic and comprehensive representation of leaf disease characteristics. The dataset includes four distinct leaf health categories: healthy leaves, virus-infected leaves, spot disease-infected leaves, and rust disease-infected leaves. However, the initial distribution of data across these categories was imbalanced, with significantly fewer virus-infected leaf samples compared to other classes. To address this imbalance and enhance the dataset diversity, several data augmentation techniques were employed using image-processing software, including random rotation (ranging from −20° to +20°, simulating variations in camera orientation), random cropping (from 85% to 100% of the original image dimensions, simulating different capture distances and removing redundant backgrounds), vertical flipping (with a probability of 50%, enriching spatial diversity), random brightness adjustments (with intensity factors ranging between 0.8 and 1.2, simulating various lighting conditions), and the addition of Gaussian noise (mean μ = 0, standard deviation σ = 0.02, representing sensor or environmental noise). Following the implementation of these augmentation strategies, the dataset was expanded from the original 1200 images to 3300 images. The augmented dataset was subsequently partitioned into subsets containing 3000 training images, 200 test images, and 100 validation images according to predefined proportions. Figure 1 is a design flow chart of the entire experiment.
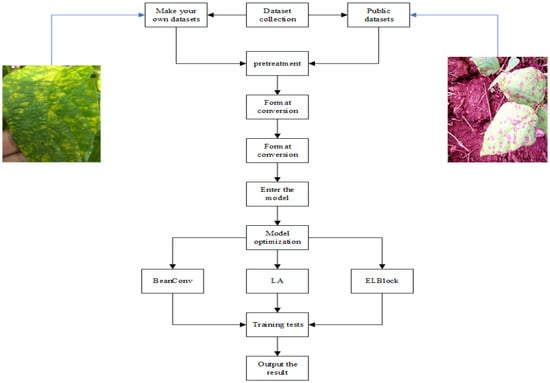
Figure 1.
Flowchart of the design of the experiment.
Table 1 presents a comparison of the dataset before and after data enhancement. In the original dataset, the categories Spot, Rust, Health, and Virus contained 378, 346, 354, and 122 samples, respectively. After data enhancement, the number of samples increased significantly to 801, 920, 899, and 680, respectively. Overall, data enhancement effectively expanded the dataset across all categories, providing a more balanced and enriched foundation for subsequent model training.

Table 1.
Comparison of the dataset before and after.
Some samples of bean leaf diseases and their distribution are shown in Figure 2 and Figure 3. Figure 3 provides a detailed visualization of label distribution and key feature characteristics in the bean leaf disease dataset. The upper-left bar chart precisely depicts the number of instances for each class (healthy, virus, spot, and rust), clearly highlighting class imbalance, notably the fewer instances of virus-infected leaves. The upper-right plot demonstrates the spatial distribution of leaves by overlaying all normalized leaf bounding boxes, clearly showing that leaves are predominantly positioned near the center of the images. The lower-left heatmap further specifies the density distribution of leaf-center coordinates, emphasizing a concentration area slightly above the image midpoint. Finally, the lower-right scatter-density plot comprehensively illustrates the correlation between width and height of leaf instances, revealing a significant linear relationship and clarifying that medium-sized leaves.
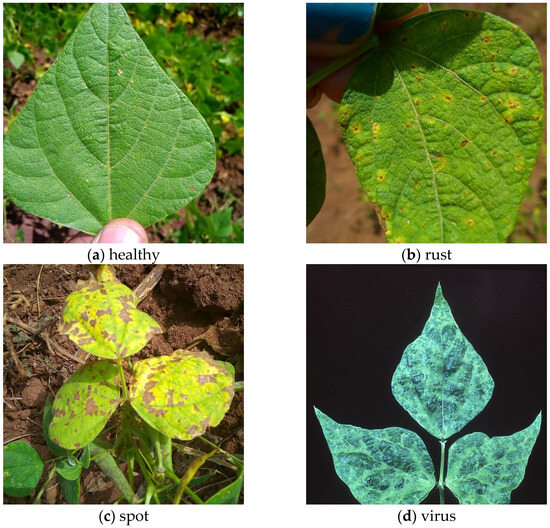
Figure 2.
Sample images of three kinds of bean leaf diseases: (a) healthy; (b) rust; (c) spot; (d) virus.

Figure 3.
Label diagram of the bean leaf disease dataset.
2.2. Model Building
2.2.1. Yolo v8_RBean
Based on YOLOv8n architecture, an improved model YOLOv8_RBean for disease detection of beans was proposed in this study. Aiming at the difficulties of feature extraction, diverse disease forms and not obvious early symptoms, three key improvement modules were designed: BConv convolution module, LA attention module, and NewBlock lightweight module. The synergies of these modules are designed to improve the model’s performance in detecting disease of pulses while maintaining a low computational overhead. The overall architecture of the model is shown in Figure 3, wherein the BConv module enhances the feature extraction capability through the mixed convolution structure; the LA attention module realizes multi-dimensional feature enhancement; the BLBlock module focuses on lightweight models. The design of these three modules fully takes into account the special needs of bean disease detection, forming a complete detection framework.
2.2.2. BeanConv Convolution Module
The BConv module significantly enhances feature extraction capability while optimizing computational cost through innovative fusion of hybrid convolutional structures. As shown in Figure 4, the architecture of the module can be divided into several key components: spatial feature extraction, parallel feature enhancement, and feature fusion and optimization.
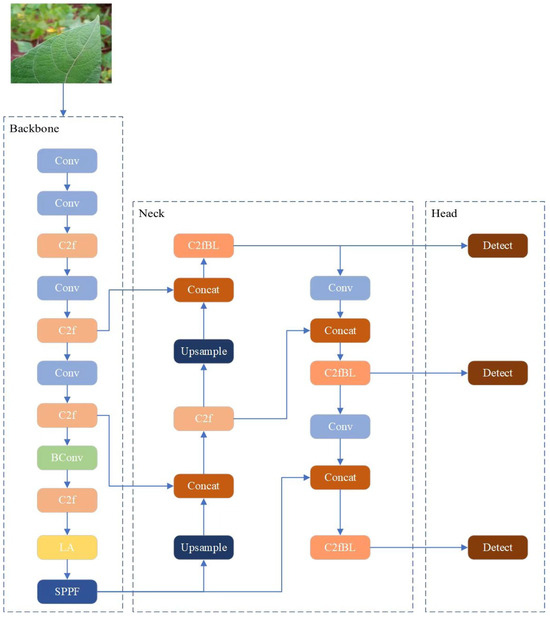
Figure 4.
Frame diagram.
In the stage of spatial feature extraction, the module first uses 3 × 3 depth separable convolution (DWConv) to process input features. By decoupling traditional convolution operations into two independent steps, depthwise convolution and pointwise convolution, DWConv achieves the optimal balance between computational efficiency and feature extraction capability [25]. In the deep convolution phase, by assigning an independent convolution kernel to each input channel, the number of parameters is significantly reduced while the ability to accurately perceive spatial features is maintained. The subsequent point-by-point convolution uses 1 × 1 convolution operation, which further enhances the expression ability of features through the information exchange and fusion in the channel dimension.
In the feature enhancement phase, a dual parallel 3 × 3 pseudo-convolution (PConv) structure is introduced. Based on the concept of hierarchical processing of feature importance, PConv improves computing efficiency by intelligently identifying and optimizing information redundancy in feature graphs. Specifically, PConv uses a grouping strategy based on Channel importance: the Primary Channel Group performs a complete convolution operation to retain key feature information, while the Secondary Channel Group uses simplified processing to reduce the computational overhead. The dual parallel PConv design not only provides the diversity of feature extraction but also enhances the model’s ability to capture multi-scale disease features through the combination of different receptive fields.
In the feature optimization phase, the extracted features are first standardized through the Batch Normalization (BN) layer. By dynamically adjusting the feature distribution, the Internal Covariate Shift is effectively reduced in layer BN, which improves the stability and convergence speed of model training. Then, the module uses SiLU (Sigmoid Linear Unit) activation function to introduce nonlinear transformation. Compared with the traditional ReLU activation function, SiLU shows better continuity in transmitting gradient information. Finally, 1 × 1 convolution is used to achieve feature reduction and information integration, which not only compresses the feature dimension, but also maintains the integrity of key information. This multilevel feature processing mechanism is particularly suitable for extracting progressive morphological characteristics of bean diseases from early symptoms to mature disease spots. Figure 5 shows the structure flow chart of related models as shown in the figure below.
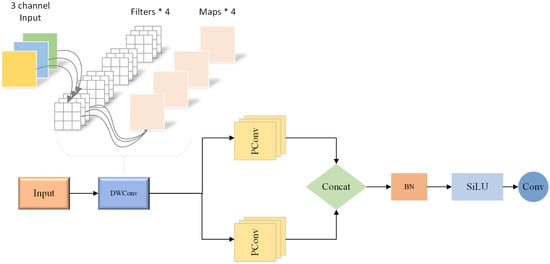
Figure 5.
BeanConv convolution module.
2.2.3. Attention Module
Based on the multi-dimensional complexity of runner bean diseases in terms of spatial distribution, morphological characteristics, and positional relationships, this study proposed a feature enhancement module (LA) based on the Triple Attention mechanism. The module integrates Triple Attention [26] with Channel Attention (CA) [27] mechanism to build a unified framework for multi-dimensional feature extraction and cross-dimensional interaction; its architecture is shown in Figure 6.

Figure 6.
LA attention module.
In the design of the spatial attention branch, the module adopts a dual parallel feature extraction strategy. Firstly, Global Average Pooling (GAP) and Global Max Pooling (GMP) operations are carried out on the input feature maps, respectively. These two complementary pooling methods can capture the overall statistics and local significance information of the feature maps, respectively. Then, the results of the two pools are spliced in channel dimension, and a 7 × 7 convolution layer with large receptive field is used for feature fusion and transformation, and finally a spatial attention map is generated. This two-path feature extraction mechanism helps to highlight the spatial distribution features of local disease regions while preserving the global context.
The channel attention branch draws on the core idea of CA mechanism and focuses on the establishment of long-range dependency between feature channels. In the concrete implementation, firstly, the spatial dimension information of input features is compressed by global average pooling operation, and the channel descriptor is obtained. Then, a two-layer fully connected network is used to construct the nonlinear transformation, in which the first layer plays the role of dimensionality reduction, and the second layer carries out feature reconstruction. Through this coding–decoding structure, the correlation between channels is learned. Finally, the channel attention weight is normalized by sigmoid function. The design adaptively modulates the importance of different characteristic channels.
The coordinate attention branch introduces a novel location-sensitive feature learning mechanism. The branch first constructs the relative position coding matrix, which is used to express the spatial position information of each pixel in the image explicitly. The location code is generated in a learnable way to ensure the adaptability of the location representation. Then, the location coding and the original feature map are adaptively fused to establish the pixel-level position dependence. In order to realize efficient feature integration, the module designs a channel-space interdimensional interaction mechanism to realize dynamic fusion of multi-dimensional information through feature recombination operation. The mechanism adaptively adjusts the contribution weights according to the importance of different dimensional features by means of attention guidance.
Through the above design, LA module can enhance features from the three dimensions of space, channel, and location, and provide more abundant and discriminative feature expression for subsequent disease recognition tasks.
2.2.4. BLBlock Module—Balance Lightweight Block
To achieve a better trade-off between model efficiency and accuracy, while further ensuring the performance of the model, the number of model parameters, and the number of calculations is reduced, we propose a novel lightweight module named BLBlock (Balance Light-weight Block) [28]. The core component, BLBlock, is constructed using an alternating structure of two 3 × 3 depthwise convolutions (DWConv) and a 1 × 1 pointwise convolution. The 1 × 1 convolution captures fine-grained details, while the 3 × 3 DWConvs expand the receptive field with minimal computational cost. To further enhance feature representation, the block integrates an SE attention module and residual connections, improving both attention awareness and gradient flow. The standard C2f module’s Bottleneck blocks are replaced with NewBlock, forming a redesigned version termed C2fNB. This modified C2fNB is applied in three key locations of the detection head. Experimental results show that C2fNB significantly reduces model parameters and computational complexity while maintaining or even improving detection performance.
Three structural patterns of BLBlock are also proposed to flexibly balance resource constraints and performance across different deployment scenarios. Overall, BLBlock demonstrates strong potential for efficient and accurate object detection in real-time and edge-computing environments [29]. Figure 7 shows the flow charts associated with the three BLBlock structural patterns.
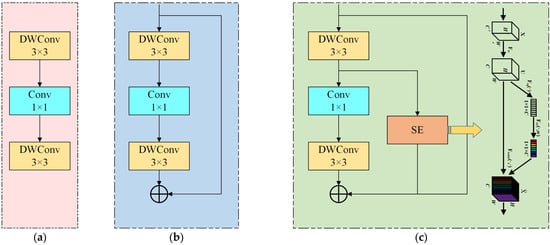
Figure 7.
BLBlock three patterns. (a–c) show the flow charts associated with the three BLBlock structural patterns.
2.3. Evaluation Index
In order to fully evaluate the performance of the proposed model, in this study, Precision (P), Recall (R), F1 value, and average precision (mAP@0.5) were used as evaluation indicators [18].
Precision refers to the proportion of samples that are actually positive among all samples tested as positive, and its calculation formula is as follows:
TP represents True Positives, that is, the number of samples that are correctly predicted to be positive; FP stands for False Positives, the number of samples that are incorrectly predicted to be positive. Recall rate refers to the proportion of samples that are correctly predicted to be positive, calculated by the following formula:
where FN stands for False Negatives, which is the number of samples that are incorrectly predicted to be negative. F1 value is the harmonic average of precision and recall rate, aiming to comprehensively consider precision and recall rate, and its calculation formula is as follows:
The F1 value can provide a compromise evaluation index in the case of an imbalance between precision and recall.
Average Precision (AP) is the area under the precision-recall (PR) curve. AP is the integral value of precision calculation under different recall rate thresholds. The calculation formula is as follows:
where P(R) is the precision value at the specific recall rate RRR. Finally, mAP@0.5 is the average of AP values for all categories under the 0.5 threshold, calculated as:
where N is the total number of classes and AP_c is the average precision of class c.
3. Results
3.1. Experimental Environment
All experiments in this paper were conducted on a single computer, and the model was trained and tested in the following environments: Operating system is Ubuntu 20.04, using PyTorch 2.0.0 framework for development and training, Python version 3.8, CUDA version 11.8, GPU configuration is 1 NVIDIA RTX 3090 (24 GB video memory, Santa Clara, CA, USA) The CPU is Intel(R) Xeon(R) Gold 6330. The parameters of the experiment are shown in Table 2 below.

Table 2.
Detailed hyperparameters of the experiment.
3.2. Performance Analysis of the Original YOLOv8 Model
Figure 8 illustrates the performance evaluation and training process of the proposed model in the pulse disease detection task. Figure 8a–d show the results of the analysis of four key performance curves: (a) the precision-confidence curve shows the precision of the model at each confidence threshold, with an average accuracy of 1.00 for all categories at a confidence level of 0.545, (b) the precision-recall curve reflects a mAP@0.5 of 0.934 for all categories, and (c) the recall-confidence curve shows an average recall of 0.91 for all classes at a confidence level of 0.580; (d) The F1-confidence curve shows the optimal F1 score of 0.81 for all categories at a confidence level of 0.436. Figure 8e records the changes in the loss function and the trend of the evaluation metrics during the training process, including the changes in bounding box loss (box_loss), class loss (cls_loss), and target existential loss (obj_loss) on the training and validation sets, as well as the convergence process of key indicators such as mAP, accuracy, and recall. It can be seen from the curve that the model shows good convergence performance in training and shows balanced and stable detection ability for four categories: healthy samples, viral diseases, spot diseases, and rust diseases.

Figure 8.
Performance of YOLOv8 in the training process: (a) precision-confidence curve, (b) precision-recall curve, (c) recall-confidence curve, (d) F1-Confidence curve, (e) loss curve, precision curve, mAP curve.
However, the experimental results also reveal the limitations of the benchmark model: first, the accuracy of detecting small disease features is low. Secondly, the detection performance of virus diseases with insignificant morphological characteristics still needs to be improved. The existence of these problems highlights the necessity of improving the feature extraction ability of the model and also provides a clear direction for the subsequent introduction of optimization strategies such as attention mechanism.
3.3. Contrast Experiment
In order to systematically evaluate the performance of the target detection model in the detection task of bean disease, the representative detection model was selected for comparison experiment. Table 3 shows the performance results of the different models.

Table 3.
Performance comparison of different models.
It can be seen from the experimental data that the precision of the two-stage detector Faster RCNN is only 56.5%, although it has a high recall (78.2%), but mAP50 only reaches 72.3%. Although the precision of single-stage detector SSD has been improved (78.6%), the overall performance is still insufficient, indicating that the traditional detection framework is difficult to adapt to complex disease detection scenarios.
YOLO series models as a whole show excellent performance. Among them, YOLOv9s has the best performance in the main indicators, with a precision of 92.4%, mAP50 and MAP50-95 reaching 86.0% and 77.2%, respectively. However, its large parameter count (6.20 M) and computational overhead (22.1 GFLOPs) limit its practical application. In contrast, YOLOv8n has a smaller parameter count (3.01 M) and computational overhead (8.1 GFLOPs) while maintaining a better detection performance (precision 84.2%, mAP50 81.2%).
Later versions, such as YOLOv10n and YOLOv11n, further reduce the model size, but their performance improvements are limited. Although YOLOv10 provides advanced improvements in anchor-free design and dynamic label assignment strategies, this study specifically focuses on improving the attention mechanism for leaf spot features, an enhancement that functions independently from the iteration of detection head architectures. Considering the detection accuracy, computational efficiency and actual deployment requirements, this study selected YOLOv8n as the basic framework, aiming to further improve its performance in the detection task of bean disease through structural optimization.
Figure 9 presents a performance comparison of different object detection models in the task of bean disease detection. Traditional models such as Faster RCNN and SSD perform relatively poorly, with Faster RCNN showing the lowest precision at only 56.5%. In contrast, the YOLO series demonstrates superior overall performance. YOLOv9s achieves the best results across major metrics, with a precision of 92.4% and mAP50 of 86.0%, but its large parameter size and computational cost limit its practical deployment. YOLOv8n offers a balanced trade-off, maintaining high detection performance (precision 84.2%, mAP50 81.2%) while significantly reducing model size and computation. Therefore, considering detection accuracy, computational efficiency, and deployment requirements, YOLOv8n is selected as the base model for further optimization in this study.

Figure 9.
Comparison of data histograms for comparison experiments.
3.4. Ablation Experiment
To verify the effectiveness of the proposed method, a series of detailed ablation experiments were conducted. Using YOLOv8n as the baseline model, the improved modules were progressively integrated to evaluate their individual and combined contributions. The quantitative results are presented in Table 4.

Table 4.
Ablation experiment.
In the first round of experiments, the BConv module was introduced. The advantages of joining this module are the number of parameters is significantly reduced while maintaining the ability to accurately perceive spatial features, and this multi-level feature processing mechanism is especially suitable for extracting the progressive morphological characteristics of legume diseases from early symptoms to mature lesions. The results indicate that BConv effectively enhances detection performance, with the precision and recall improving by 1.0% and 1.6%, respectively. The mAP50 increased from 81.2% to 82.6%. Notably, while performance improved, the number of model parameters decreased from 3.01 M to 2.93 M, and the computational complexity slightly reduced from 8.1 to 8.0 GFLOPs. This demonstrates the efficiency of the BConv structure in feature extraction.
In the second round, the temporal attention mechanism (LA) was incorporated. The advantage of this mechanism is that contribution weight is adaptively adjusted according to the importance of different dimensional features through attention guidance. The module can enhance features from three dimensions: space, channel, and location, and provide richer and more differentiated feature expressions for subsequent disease identification tasks. This led to a substantial improvement in detection accuracy, with the precision reaching 87.9% and mAP50-95 increasing to 70.8%. The mAP50 also rose to 83.2%. Although the introduction of LA resulted in a slight increase in parameters to 3.06M and computational cost to 8.2 GFLOPs, the performance gain justifies the additional complexity.
Finally, the enhanced C2fNB module (BLBlock) was added to form the fully improved model. The resource constraints and performance in different deployment scenarios are flexibly balanced, which significantly reduces the model parameters and computational complexity, and improves the detection performance. The results show further performance gains: the precision increased to 88.7%, while mAP50 and mAP50-95 reached 83.5% and 71.3%, respectively. Interestingly, the final model achieved these improvements with only 2.71 M parameters and 7.5 GFLOPs, which are 10% and 7.4% lower than the baseline, respectively. Although the recall slightly decreased to 75.3%, the overall detection capability and model efficiency were significantly enhanced.
These results clearly demonstrate the necessity and effectiveness of each proposed module. The integration of BConv, LA, and BLBlock not only boosts detection accuracy but also contributes to model lightweighting, making the approach highly practical for real-time and resource-constrained applications.
Meanwhile, the model remains efficient, with only 2.7 1M parameters and 7.5 GFLOPs, showing its practical value for lightweight object detection tasks. Compared to the proposed YOLOv10n and YOLOv11n models, the fully improved version still holds an advantage in terms of mAP50-95 (1.1% and 0.8% higher, respectively). However, YOLOv11n exhibits superior recall and model efficiency, achieving the smallest parameter size (2.58 M) and lowest computational cost (6.3 GFLOPs). Therefore, while the fully improved version is more suitable for scenarios requiring maximum detection accuracy, YOLOv11n offers a better trade-off between accuracy and efficiency, making it more appropriate for resource-constrained or real-time applications.
Figure 10 illustrates the performance comparison of YOLOv8n and its progressively improved versions across six metrics: Precision, Recall, mAP50, mAP50-95, Parameters, and FLOPs. As BConv, LA, and BLBlock modules are gradually integrated, the model shows consistent improvements. Precision increases from 84.2% to 88.7%, mAP50 rises from 81.2% to 83.5%, and mAP50-95 improves from 68.2% to 71.3%. Meanwhile, the model’s parameters are reduced from 3.01 M to 2.71 M, and computational cost (FLOPs) decreases from 8.1 to 7.5. Overall, Figure 10 clearly demonstrates the effectiveness of each module in enhancing detection performance while achieving model lightweighting. Figure 11 shows some of the results associated with the experiment and is annotated below. Figure 12 shows a comparison between the experimental results of the improved model and those of the initial model.
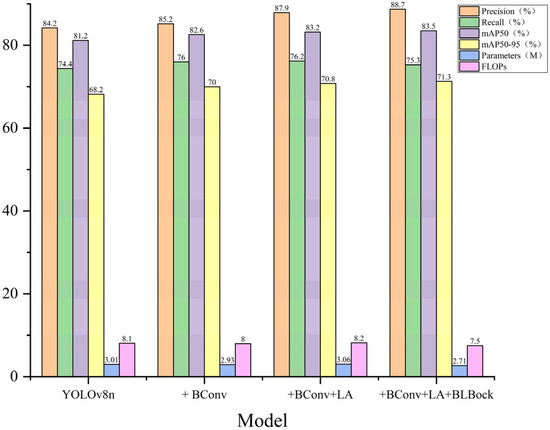
Figure 10.
Ablation experiment performance bar chart comparison.
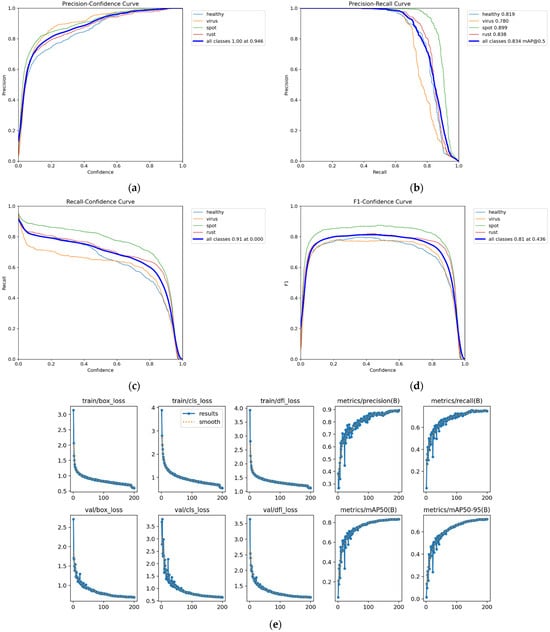
Figure 11.
Performance of YOLOv8_Bean in the training process: (a) precision-confidence curve, (b) precision-recall curve, (c) recall-confidence curve, (d) F1-Confidence curve, (e) loss curve, precision curve, mAP curve.

Figure 12.
Improved before and after confusion matrix comparison. (a) YOLOv8n; (b) ours.
3.5. Comparison of Model Detection
Figure 13 presents a qualitative comparison between the baseline model (YOLOv8n) and our proposed method on leaf disease detection tasks. It is evident that our model achieves more precise lesion localization and better robustness under natural environmental conditions. In the first row, the baseline model exhibits multiple overlapping bounding boxes for a single lesion area, leading to redundant detection results. In contrast, our model produces more concise and spatially accurate boxes, effectively outlining the true extent of each lesion. The second and third rows highlight our model’s improved ability to suppress background noise and irrelevant textures. While YOLOv8n occasionally misidentifies leaf textures or lighting artifacts as diseased regions, our method demonstrates more consistent focus on actual lesion areas. In the final row, both models correctly detect the healthy leaves. However, our model shows a cleaner output, avoiding unnecessary markings in non-infected regions or backgrounds.
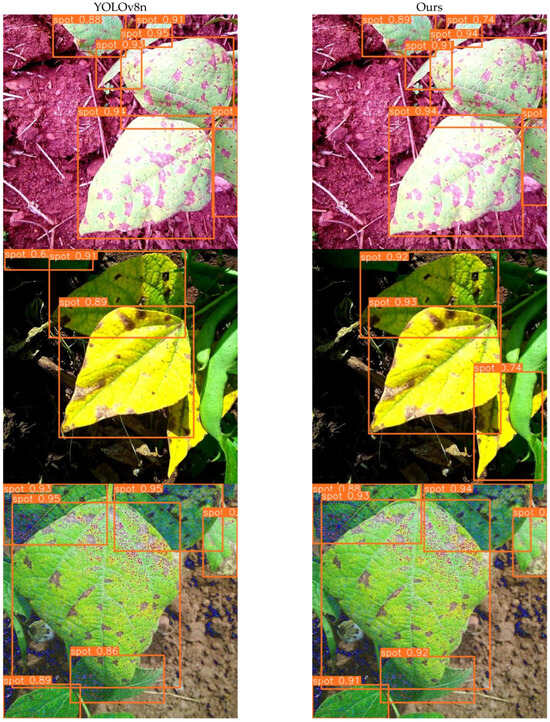
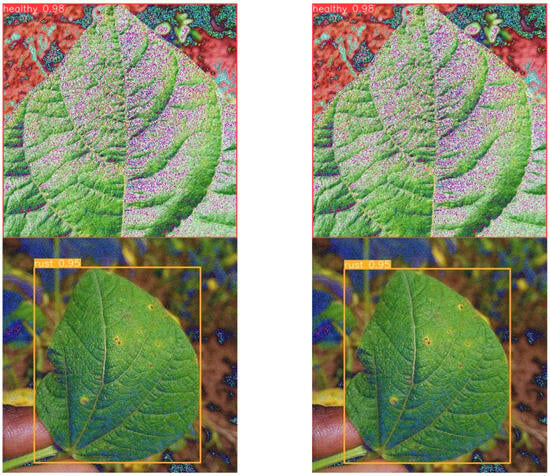
Figure 13.
Comparison of detection performance between YOLOv8n and our proposed model.
4. Discussion
The improved YOLOv8_RBean model has made significant progress in addressing key challenges related to detecting leaf diseases in common beans, especially in scenarios involving early lesions, small or scattered disease areas, and morphologically indistinct symptoms. Compared to traditional YOLO variants and existing plant disease detection methods, YOLOv8_RBean introduces targeted architectural improvements that directly enhance the model’s feature discrimination capability and deployment efficiency.
In the existing literature, many studies have proposed deep learning methods to identify plant diseases. For example, Barbedo et al. [5] employed deep learning methods for plant disease recognition and improved model generalization through transfer learning. The AFFP-Net method proposed by Jiao et al. [6] effectively improved the accuracy of agricultural pest detection but still had limitations in recognizing complex disease morphologies. To address these issues, the BeanConv module proposed in this study combines the advantages of depth-separable convolution and point convolution, which can effectively capture features of small lesions and irregular morphologies, overcoming the limitations of existing models in fine-grained feature extraction. Experimental results show that through this module, YOLOv8_RBean has significantly improved its ability to detect early lesions, especially in the detection accuracy of viral diseases and early symptoms, with improvements of 1.0% to 1.6% compared to methods in the literature (such as the DECA model by Gao et al. [7]).
From a technical perspective, the integration of the BeanConv module played a key role in enabling the model to extract fine-grained features across multiple scales. This is particularly beneficial for accurately locating and identifying early or subtle disease patterns that typically evade traditional detection frameworks. The observed increase in precise detection of viral and early infections can be attributed to the model’s enhanced spatial resolution and texture sensitivity due to the depth-separable convolution strategy.
In terms of model optimization, many studies in the literature, such as the crop disease recognition method based on efficient channel attention mechanism proposed by Gao et al. [7], have improved model performance in multi-class crop disease detection. Attention mechanisms in the literature mainly focus on a single dimension. However, YOLOv8_RBean innovated in this field by proposing the LA attention mechanism, which combines spatial, channel, and coordinate information to form three-dimensional feature fusion. This mechanism effectively addresses the low recognition rate of existing models when dealing with diseases with unclear morphology and severe background noise interference. Furthermore, the introduction of the LA attention mechanism—which jointly considers spatial, channel, and coordinate information—represents a significant departure from commonly used single-dimensional attention schemes. This multi-dimensional fusion allows the network to better distinguish between background noise and biologically meaningful disease features, thereby improving its robustness when facing complex morphological variations. Experimental results, such as the significant improvement in mAP50-95, support the hypothesis that attention mechanisms with dimensional diversity can compensate for visual ambiguities in real-world agricultural images.
For computational efficiency optimization, existing research largely relies on optimizing convolutional neural networks (such as the YOLO series and Faster R-CNN). For example, while the TomatoGuard-YOLO framework proposed by Wang et al. [15] demonstrates excellent accuracy, it has a larger number of model parameters and higher computational overhead. In contrast, the BLBlock module proposed in this study adopts a lightweight design, combining depth-separable convolution and SE attention modules, significantly reducing the number of parameters and computational complexity while maintaining high detection accuracy.
Additionally, the introduction of the lightweight BLBlock structure addresses a well-known trade-off in model design: the balance between computational complexity and detection performance. By strategically combining efficient convolution operations and adaptive attention refinement, YOLOv8_RBean achieves significant reductions in parameter count and computational cost without sacrificing accuracy. This suggests that the model’s architecture can scale well to resource-constrained agricultural scenarios, such as mobile or edge deployments on drones and field robots. In comparison with YOLOv8n, YOLOv10n, and YOLOv11n, YOLOv8_RBean is only slightly lower in accuracy than YOLOv9s but has distinct advantages in model efficiency.
In practical applications, although most models in the literature have high accuracy, they are often limited by device performance and deployment environment. For example, while the CoffeeNet model proposed by Nawaz et al. [10] achieved good results in coffee leaf disease recognition, its high computational cost limited its application in real agricultural environments. While optimizing detection accuracy, the YOLOv8_RBean model considered the needs of edge computing and real-time detection, proposing a lightweight design applicable to resource-constrained environments, making it deployable efficiently on agricultural IoT platforms, drones, or field robots.
Despite the important technical advances made in this study, challenges remain. First, the model’s performance under extreme lighting conditions still shows some fluctuations, and, in particular, the stability of model performance at different stages of plant growth remains to be improved. This highlights the need for further optimization of data augmentation strategies and domain adaptation learning methods. Second, although the model performs excellently on most types of lesions, there are still some difficulties in detecting early symptoms, especially minor changes that are visually difficult to distinguish. This indicates that further exploration is needed in pathological modeling and data representation.
Future research directions should focus on the following: (1) Expanding the training dataset to cover different environments and plant growth stages; (2) exploring cross-species transfer learning to enhance the generality of the model; (3) integrating agricultural expert knowledge into the training phase to bridge the semantic gap between model predictions and actual agricultural decision-making.
Through comparison with the existing literature, this study has made important contributions in several aspects: First, YOLOv8_RBean significantly enhances the detection capability for complex diseases (especially early and irregular morphology diseases) by introducing BeanConv and LA attention mechanisms; second, the lightweight design of the BLBlock module effectively reduces computational costs, enabling the model to meet the requirements of practical agricultural deployment; finally, although there is still room for improvement in adaptability to different lighting conditions and growth stages, the model has provided efficient and practical technical support for intelligent agricultural disease detection.
5. Conclusions
In this study, an improved YOLOv8_RBean model was proposed to overcome the limitations of the existing bean disease detection models in small target recognition and lightweight. The BConv module designed in this study effectively extracts spatial dimensional features through DWConv and reduces computational redundancy by using parallel PConv. This multi-scale feature extraction mechanism enables the model to better capture the morphological features of diseases, thus increasing mAP50 from 81.2% to 82.6%. In order to cope with the differences in feature expression of different disease types, the designed LA attention mechanism was enhanced by the features of space, channel, and coordinate to achieve inter-dimensional feature interaction, enhance the adaptability of the model to diseases of different scales and forms, and improve the precision of the model to 87.9% and mAP50-95 to 70.8%. While ensuring the performance, the BLBlock module adopts the lightweight design of DWConv and 1 × 1 convolution alternately, which not only preserves the sensitivity field of different scales, but also highlights important features through the SE attention mechanism, achieving a 10% reduction in the number of model parameters and a 7.4% reduction in computing overhead while maintaining high detection accuracy. Compared with the mainstream target detection model, the experiment shows that this multi-module cooperative optimization strategy significantly improves the detection ability of the model in complex scenarios, especially in the detection tasks of diseases with insignificant morphological characteristics such as viral diseases. This performance improvement is due to innovative improvements in the model at the three levels of feature extraction, attention mechanism and lightweight design, providing an efficient and accurate solution for agricultural disease detection. Follow-up studies will further explore the model’s adaptability to complex light conditions and its ability to generalize in other crop disease detection tasks.
Author Contributions
Conceptualization, H.Z., H.C. (Hongbing Chen) and G.W.; methodology, H.Z., H.C. (Hongbing Chen) and G.W.; software, H.Z. and H.C. (Hongbing Chen); validation, H.Z., H.C. (Hongbing Chen) and J.H.; formal analysis, H.Z. and H.C. (Hongbing Chen); investigation, H.C. (Hongrui Chen), C.W. and Y.F.; resources, H.Z.; data curation, G.W.; writing—original draft preparation, H.Z., H.C. (Hongrui Chen) and G.W.; writing—review and editing, H.C. (Hongrui Chen), G.W., H.Z., K.W., Z.L., C.W. and H.C. (Hongbing Chen); visualization, G.W., H.Z., J.H. and H.C. (Hongrui Chen); supervision, H.Z.; project administration, H.C. (Hongrui Chen) and J.H.; funding acquisition, H.C. (Hongrui Chen) All authors have read and agreed to the published version of the manuscript.
Funding
This research was funded by the Jilin Province Development and Reform Commission (Grant No. 2023C030-3); and the scientific research project of the Education Department of Jilin Province (JJKH20240441HT).
Data Availability Statement
The original contributions presented in this study are included in the article. Further inquiries can be directed to the corresponding author.
Acknowledgments
The author would like to thank Changchun Institute of Technology for its help.
Conflicts of Interest
The authors declare no conflicts of interest.
References
- McDermott, J.; Wyatt, A.J. The role of pulses in sustainable and healthy food systems. Ann. N. Y. Acad. Sci. 2017, 1392, 30–42. [Google Scholar] [CrossRef] [PubMed]
- Lisciani, S.; Marconi, S.; Le Donne, C.; Camilli, E.; Aguzzi, A.; Gabrielli, P.; Gambelli, L.; Kunert, K.; Marais, D.; Vorster, B.J.; et al. Legumes and common beans in sustainable diets: Nutritional quality, environmental benefits, spread and use in food preparations. Front. Nutr. 2024, 11, 1385232. [Google Scholar] [CrossRef] [PubMed]
- Bi, C.; Xu, S.; Hu, N.; Zhang, S.; Zhu, Z.; Yu, H. Identification method of corn leaf disease based on improved Mobilenetv3 model. Agronomy 2023, 13, 300. [Google Scholar] [CrossRef]
- Upadhyay, A.; Chandel, N.S.; Singh, K.P.; Chakraborty, S.K.; Nandede, B.M.; Kumar, M.; Subeesh, A.; Upendar, K.; Salem, A.; Elbeltagi, A. Deep learning and computer vision in plant disease detection: A comprehensive review of techniques, models, and trends in precision agriculture. Artif. Intell. Rev. 2025, 58, 92. [Google Scholar] [CrossRef]
- Barbedo, J.G.A. Impact of dataset size and variety on the effectiveness of deep learning and transfer learning for plant disease classification. Comput. Electron. Agric. 2018, 153, 46–53. [Google Scholar] [CrossRef]
- Jiao, L.; Xie, C.; Chen, P.; Du, J.; Li, R.; Zhang, J. Adaptive feature fusion pyramid network for multi-classes agricultural pest detection. Comput. Electron. Agric. 2022, 195, 106827. [Google Scholar] [CrossRef]
- Gao, R.; Wang, R.; Feng, L.; Li, Q.; Wu, H. Dual-branch, efficient, channel attention-based crop disease identification. Comput. Electron. Agric. 2021, 190, 106410. [Google Scholar] [CrossRef]
- Sun, H.; Xu, H.; Liu, B.; He, D.; He, J.; Zhang, H.; Geng, N. MEAN-SSD: A novel real-time detector for apple leaf diseases using improved light-weight convolutional neural networks. Comput. Electron. Agric. 2021, 189, 106379. [Google Scholar] [CrossRef]
- Tassis, L.M.; de Souza, J.E.T.; Krohling, R.A. A deep learning approach combining instance and semantic segmentation to identify diseases and pests of coffee leaves from in-field images. Comput. Electron. Agric. 2021, 186, 106191. [Google Scholar] [CrossRef]
- Nawaz, M.; Nazir, T.; Javed, A.; Tawfik Amin, S.; Jeribi, F.; Tahir, A. CoffeeNet: A deep learning approach for coffee plant leaves diseases recognition. Expert Syst. Appl. 2024, 237, 121481. [Google Scholar] [CrossRef]
- Liu, B.; Tan, C.; Li, S.; He, J.; Wang, H. A data augmentation method based on generative adversarial networks for grape leaf disease identification. IEEE Access 2020, 8, 102188–102198. [Google Scholar] [CrossRef]
- Yan, C.; Yang, K. FSM-YOLO: Apple leaf disease detection network based on adaptive feature capture and spatial context awareness. Digit. Signal Process. 2024, 155, 104770. [Google Scholar] [CrossRef]
- Pan, J.; Wang, T.; Wu, Q. RiceNet: A two stage machine learning method for rice disease identification. Biosyst. Eng. 2023, 225, 25–40. [Google Scholar] [CrossRef]
- Li, Y.; Wang, M.; Wang, C.; Zhong, M. A method for maize pest detection based on improved YOLO-v9 model. In Proceedings of the 2024 7th International Conference on Computer Information Science and Application Technology (CISAT), Hangzhou, China, 12–14 July 2024; pp. 858–861. [Google Scholar]
- Wang, X.; Liu, J. TomatoGuard-YOLO: A novel efficient tomato disease detection method. Front. Plant Sci. 2025, 15, 1499278. [Google Scholar] [CrossRef] [PubMed]
- Zhang, S.; Zhang, S.; Zhang, C.; Wang, X.; Shi, Y. Cucumber leaf disease identification with global pooling dilated convolutional neural network. Comput. Electron. Agric. 2019, 162, 422–430. [Google Scholar] [CrossRef]
- Liu, B.; Zhang, Y.; He, D.; Li, Y. Identification of Apple Leaf Diseases Based on Deep Convolutional Neural Networks. Symmetry 2017, 10, 11. [Google Scholar] [CrossRef]
- Wang, Y.; Zhang, P.; Tian, S. Tomato leaf disease detection based on attention mechanism and multi-scale feature fusion. Front. Plant Sci. 2024, 15, 1382802. [Google Scholar] [CrossRef]
- Mohanty, S.P.; Hughes, D.P.; Salathe, M. Using Deep Learning for Image-Based Plant Disease Detection. Front. Plant Sci. 2016, 7, 1419. [Google Scholar] [CrossRef]
- Wang, G.; Sun, Y.; Wang, J. Automatic Image-Based Plant Disease Severity Estimation Using Deep Learning. Comput. Intell. Neurosci. 2017, 2017, 2917536. [Google Scholar] [CrossRef]
- Liu, L.; Qiao, S.; Chang, J.; Ding, W.; Xu, C.; Gu, J.; Sun, T.; Qiao, H. A multi-scale feature fusion neural network for multi-class disease classification on the maize leaf images. Heliyon 2024, 10, e28264. [Google Scholar] [CrossRef]
- Jeena, H.; Singh, K.P.; Rakhonde, G.; Dev, M.; Surbhi, K.; Aravind, T. Diagnosis and Management Strategies for Soybean Diseases. In Diseases of Field Crops: Diagnostics and Management; Springer: Berlin/Heidelberg, Germany, 2024; pp. 223–264. [Google Scholar]
- Nagaraju, M.; Chawla, P. Systematic review of deep learning techniques in plant disease detection. Int. J. Syst. Assur. Eng. Manag. 2020, 11, 547–560. [Google Scholar] [CrossRef]
- Tan, M.; Le, Q. Efficientnet: Rethinking model scaling for convolutional neural networks. In Proceedings of the International Conference on Machine Learning, Long Beach, CA, USA, 9–15 June 2019; pp. 6105–6114. [Google Scholar]
- Chollet, F. Xception: Deep learning with depthwise separable convolutions. In Proceedings of the IEEE Conference on Computer Vision and Pattern Recognition, Honolulu, HI, USA, 21–26 July 2017; pp. 1251–1258. [Google Scholar]
- Misra, D.; Nalamada, T.; Arasanipalai, A.U.; Hou, Q. Rotate to attend: Convolutional triplet attention module. In Proceedings of the IEEE/CVF Winter Conference on Applications of Computer Vision, Virtual Conference, 5–9 January 2021; pp. 3139–3148. [Google Scholar]
- Hou, Q.; Zhou, D.; Feng, J. Coordinate attention for efficient mobile network design. In Proceedings of the IEEE/CVF Conference on Computer Vision and Pattern Recognition, Nashville, TN, USA, 19–25 June 2021; pp. 13713–13722. [Google Scholar]
- Chen, J.; Kao, S.-h.; He, H.; Zhuo, W.; Wen, S.; Lee, C.-H.; Chan, S.-H.G. Run, don’t walk: Chasing higher FLOPS for faster neural networks. In Proceedings of the IEEE/CVF Conference on Computer Vision and Pattern Recognition, Vancouver, BC, Canada, 18–22 June 2023; pp. 12021–12031. [Google Scholar]
- Hu, J.; Shen, L.; Sun, G. Squeeze-and-excitation networks. In Proceedings of the IEEE Conference on Computer Vision and Pattern Recognition, Salt Lake City, UT, USA, 18–22 June 2018; pp. 7132–7141. [Google Scholar]
Disclaimer/Publisher’s Note: The statements, opinions and data contained in all publications are solely those of the individual author(s) and contributor(s) and not of MDPI and/or the editor(s). MDPI and/or the editor(s) disclaim responsibility for any injury to people or property resulting from any ideas, methods, instructions or products referred to in the content. |
© 2025 by the authors. Licensee MDPI, Basel, Switzerland. This article is an open access article distributed under the terms and conditions of the Creative Commons Attribution (CC BY) license (https://creativecommons.org/licenses/by/4.0/).