Article

Joint Transcriptome and Metabolome-Based Analysis Reveals Key Modules and Candidate Genes for Drought Tolerance in Wheat (Triticum aestivum L.) Seedlings

1
State Key Laboratory for Crop Stress Resistance and High-Efficiency Production, Collage of Agronomy, Northwest A&F University, Yangling 712100, China
2
Xinjiang Academy of Agricultural Sciences, Urumqi 830091, China
3
Faculty of Agronomy, S. Seifullin Kazakh Agro Technical Research University, Astana 010000, Kazakhstan
4
Zhumadian Academy of Agricultural Sciences, Zhumadian 463000, China
*
Author to whom correspondence should be addressed.
These authors contributed equally to this work.
Agronomy 2025, 15(4), 922; https://doi.org/10.3390/agronomy15040922
Submission received: 11 March 2025 / Revised: 2 April 2025 / Accepted: 3 April 2025 / Published: 10 April 2025
(This article belongs to the Section Plant-Crop Biology and Biochemistry)

Abstract

:
Wheat plays a crucial role in global food security. However, drought stress severely restricts its growth and development, and drought during the seedling stage significantly affects its organogenesis, thereby affecting yield. To study wheat drought tolerance mechanisms at the seedling stage and to explore drought tolerance gene resources, this study focused on the drought-tolerant wheat variety Bainong 207 and performed RNA-Seq and metabolome sequencing on leaves collected at the three-leaf stage under drought stress conditions. Drought stress significantly altered the expression of 12,930 genes and 2544 metabolites in wheat seedlings. Through bioinformatics methods such as O2PLS-DA, a gene–metabolite correlation network was constructed, and key regulatory genes within this network were subsequently identified. The results identified the important gene module MEbrown and metabolite module Meta6 and finally screened 20 transcription factors that are closely related to drought response. These transcription factors were predicted to be able to combine and regulate the expression of six key genes, which together help the variety to improve drought tolerance under drought stress conditions by regulating reactive oxygen species metabolism, maintaining intracellular redox homeostasis, promoting wax biosynthesis, enhancing the osmotic stress response, and regulating abscisic acid response.

1. Introduction

Wheat (Triticum aestivum L.), as a vital food crop, contributes about 20% of global dietary calories and proteins, making it indispensable for ensuring global food security [1]. Nevertheless, drought, as one of the most significant abiotic stresses, severely constrains wheat yield improvement globally, with approximately 50% of wheat-growing regions worldwide affected by drought conditions [2], resulting in yield reductions ranging from 10% to 70% [3]. Furthermore, drought stress can occur during various growth stages of wheat. Notably, drought exposure at the seedling stage frequently leads to irreversible adverse effects such as restricted growth, uneven plant development, and insufficient tillering. These impairments ultimately compromise both grain yield and quality.
For heterozygous hexaploid wheat, which has a large and structurally complex genome [4], transcriptome sequencing is a rapid and effective method to mine candidate genes, especially when studying stress responses [5]. Nouraei et al. (2022), identified 1614 differentially expressed genes in transcriptome analyses of two near-isogenic lines of wheat, and the qDSI.4B.1 QTL was empirically validated as a drought tolerance candidate [6]. RNA-Seq analyses from other germplasms, such as ‘Zhengmai 366’ and ‘Chuanmai 42’ [7], ‘Luyuan 502’ [8], ‘Deguo 2’ and ‘Truman’ [9] also revealed many differentially expressed genes (DEGs) in response to drought stress, providing important clues for further identification of drought tolerance genes in wheat. However, most of the previously reported RNA-Seq analyses were based only on DEGs and used simple qRT-PCR to validate candidate genes, which failed to reveal more useful information. In the present work, transcriptome and metabolome analyses were combined to expand upon prior findings and gain new insights.
Metabolomics enables qualitative and quantitative analyses of all low molecular weight metabolites within a given organism or cell under specific environmental stresses and physiological stages [10]. Studies have shown that plants undergo significant metabolic changes in response to stress [11]. The results of untargeted metabolic analyses by Guo et al. (2020) indicated that the drought-tolerant wheat genotype HX10 significantly accumulated phenolics as well as metabolites such as amino acids, alkaloids, organic acids, and flavonoids under drought stress compared with the sensitive type YN211, and the synergistic modulation of these metabolites may enhance its drought tolerance [12]. In addition, six wild and domesticated wheat genotypes with different ploidy levels in Aegilops speltoides ssp. Speltoids [13], JingDong-17 and JingDong-8 [14], LA754, and AGS2038 [15] were carried out in wheat germplasm for metabolomic analyses, which helped to gain insights into the metabolite regulatory mechanisms of wheat under drought stress.
Orthogonal Partial Least Squares (O2PLS) is a multivariate statistical analysis method that can be used to predict potentially related data sets in two matrices based on the sum of the histological data in a bivariate modeling approach, based on which the joint analysis of metabolomic and transcriptomic data can be used to rapidly correlate genes and metabolites [16,17]. Szymanski et al. (2014) performed an integrated analysis of transcriptomics and lipidomics databased on O2PLS, revealing a large-scale coordinated relationship between gene expression and changes in glycerol ester levels in response to light and temperature stimuli in Arabidopsis thaliana [18]. Wang et al. (2023) identified CsMYC2 as a phenylpropanoid biosynthesis through a combined transcriptomics and metabolomics analysis of the key transcription factor, and further identified metabolites positively correlated with CsMYC2 by the O2PLS method [19]. However, there are still few studies using O2PLS to analyze the mechanism of drought tolerance in wheat by combined transcriptome–metabolome analysis.
This study aimed to systematically elucidate the molecular mechanisms underlying the drought tolerance of the drought-tolerant variety BN207 at the seedling stage. Transcriptomic and metabolomic analyses were integrated to identify key metabolite modules and gene modules, a gene–metabolite correlation network was constructed, the hub genes of this network were mined, and the transcription factors with regulatory effects on the hub genes were predicted.

2. Materials and Methods

2.1. Plant and Treatments

The experimental material in this study was Bainong 207 (BN207), a widely cultivated wheat variety exhibiting strong drought tolerance. The experiment was conducted from January to February 2024 in the greenhouse of Northwest A&F University (Shaanxi, China). Firstly, uniform and full seeds were selected and sterilized with 75% ethanol for 5 min and then rinsed with distilled water, and placed in Petri dishes with a diameter of 9 cm and lined with filter paper for cultivation. The well-germinated seeds were transplanted into pots (10 cm × 10 cm × 10 cm) filled with nutrient substrate, 10 seeds per pot, five pots as one biological replicate, and three biological replicates per group. Seedlings were grown under controlled conditions (25 °C day/22 °C night, 16/8 h light/dark cycle) until reaching the three-leaf stage (Zadoks 13) [20], confirmed by the full expansion of the third true leaf. Drought stress was initiated at the three-leaf stage by withholding water (Treatment, T group), while control plants continued to receive daily irrigation (Control, CK group). After 7 days of treatment, the third fully expanded leaf from each plant in both CK and T groups was harvested at 10:00 AM, flash-frozen in liquid nitrogen, and stored at −80 °C for RNA-Seq and metabolome analysis.

2.2. Transcriptome Sequencing and Data Analysis

Total RNA was used as input material for the RNA sample preparations. Briefly, mRNA was purified from total RNA using poly-T oligo-attached magnetic beads (Thermo Fisher Scientific, Waltham, MA, USA). Fragmentation was carried out using divalent cations under elevated temperature in First Strand Synthesis Reaction Buffer (5X; Thermo Fisher Scientific). First-strand cDNA was synthesized using random hexamer primer (Thermo Fisher Scientific) and M-MuLV Reverse Transcriptase (RNase H-; New England Biolabs, Ipswich, MA, USA). Second-strand cDNA synthesis was subsequently performed using DNA Polymerase I (New England Biolabs) and RNase H (New England Biolabs). The remaining overhangs were converted into blunt ends via exonuclease/polymerase activities. After the adenylation of 3′ ends of DNA fragments, an Adaptor with a hairpin loop structure was ligated to prepare for hybridization. In order to select cDNA fragments of preferentially 370~420 bp in length, the library fragments were purified with the AMPure XP system (Beckman Coulter, Indianapolis, IN, USA). Then, PCR was performed with Phusion High-Fidelity DNA polymerase (Thermo Fisher Scientific), Universal PCR primers (Illumina, San Diego, CA, USA), and Index (X) Primer (Illumina). At last, PCR products were purified (AMPure XP system) and library quality was assessed on the Agilent Bioanalyzer 2100 system (Agilent Technologies, Santa Clara, CA, USA). After passing the library inspection, different libraries are pooled according to the effective concentration and the target downstream data volume for Illumina sequencing. Sequencing was performed by Novogene Co., Ltd. (Beijing, China) on an Illumina NovaSeq 6000 platform (Illumina) in paired-end (PE150) mode, generating ≥10 Gb clean data per sample. Raw reads were processed with fastQC (v0.12.1) and fastp (https://github.com/OpenGene/fastp, accessed on 15 February 2024) [21] to remove adapters and low-quality bases (Q-score < 20), followed by alignment to the Triticum aestivum reference genome (IWGSC RefSeq v1.1) using HISAT2 (v2.2.1). Assembly of new transcripts was performed using StringTie software (v2.2.1) [22]. Based on Pfam (v36.0) [23], SUPERFAMILY (v2.0) GO (https://www.geneontology.org/, accessed on 15 February 2024), and KEGG (https://www.genome.jp/kegg/pathway.html, accessed on 15 February 2024) databases for functional annotation of transcripts.
Quantitative analyses of gene expression levels were performed using the featureCounts tool [24] in the Subread software(v2.0.3) and merged to obtain expression matrices for all samples. Differential expression analysis between groups was conducted with DESeq2 (v1.36.0) [25], with differentially expressed genes (DEGs) defined as those meeting the criteria of |log2(Fold Change)| ≥ 1 and adjusted p-value (padj) ≤ 0.05. Visualization of DEG results was implemented using the ggplot2 R package (v3.2.2). Correlations were calculated across samples using the R package psych (v2.3.9) and visualized using the heatmap tool of Tbtools [26] (https://github.com/CJ-Chen/TBtools, accessed on 16 February 2024). The R package FactoMineR (v2.8) was used for principal component analysis and PCA results of the samples were visualized using ggplot2 (v3.2.2). The 300 DEGs with the most significant differential expression up- and down-regulation were selected and visualized using the R package pheatmap (v1.0.12). GO and KEGG functional enrichment analyses of DEGs were performed using the R package ClusterProfiler https://www.bioconductor.org/packages/release/bioc/html/clusterProfiler.html, accessed on 16 February) [27]. GSEA enrichment analysis was performed using GSEA software (v4.3.2) [28].

2.3. Metabolomics Measurements and Data Analysis

Wheat tissue samples (100 mg) were individually grounded with liquid nitrogen and the homogenate was resuspended with prechilled 80% methanol. The samples were incubated on ice for 5 min and then were centrifuged at 15,000× g, 4 °C for 20 min. The super-natant from all samples was diluted with LC-MS grade water to a final methanol concentration of 53% (v/v). After centrifugation (15,000× g, 4 °C, 20 min), a 200 μL aliquot of the clarified supernatant from each sample was injected into the LC-MS/MS system. LC-MS/MS analyses were performed using an ExionLC™ AD system (SCIEX, Framing-ham, MA, USA) coupled with a QTRAP® 6500+ mass spectrometer (SCIEX) in Novogene Co., Ltd. (Beijing, China). Samples were injected onto an Xselect HSS T3 (2.1 × 150 mm, 2.5 μm; Milford, MA, USA) using a 20 min linear gradient at a flow rate of 0.4 mL/min for the positive/negative polarity mode. The eluents were: 0.1% Formic acid-water (A), and 0.1%Formic acid-acetonitrile (B). The solvent gradient was set as follows: 2% B, 2 min; 2-100% B, 15.0 min; 100% B, 17.0 min; 100-2% B, 17.1 min; 2% B, 20 min. QTRAP® 6500+ mass spectrometer was operated in positive polarity mode with Curtain Gas of 35 psi, Collision Gas of Medium, IonSpray Voltage of 5500V, Temperature of 550 °C, Ion Source Gas of 1:60, Ion Source Gas of 2:60. The mass spectrometry detection process included analyses of blank samples (Blank), quality control (QC) samples, and experimental samples. Blank samples were analyzed to detect potential residual contaminants in the instrument. QC samples, prepared by pooling equal volumes of all experimental samples, were used to evaluate the stability of the chromatography–mass spectrometry system throughout the experimental sequence and to ensure data reproducibility and reliability.
Based on novoDB (novogene database), the experimental samples were detected in multiple reaction monitoring (MRM) modes using a triple quadrupole, and the compounds were quantified according to Q3 (daughter ion), Q1 (parent ion), Q3 (daughter ion), RT (retention time), DP (de-clustering voltage), and CE (collision energy) were used for the qualitative analysis. SCIEX OS software (V1.4) was used to open the downstream mass spectrometry files for peak integration and correction, and the peaks were screened according to the set minimum peak height of 500, the signal-to-noise ratio of five, and the number of smoothing points of one, etc. The peaks were then separated into two groups, one for each chromatographic retention time and the other for each chromatographic retention time. The peak area of the sub-ion integrated in each chromatographic retention time represents the relative content of the corresponding substance, and finally, the peak area data of all the spectral peaks integrated were exported to obtain the qualitative and quantitative results of the metabolites. The KEGG database (https://www.genome.jp/kegg/, accessed on 18 February 2024), HMDB database (https://hmdb.ca/metabolites/, accessed on 18 February 2024), and LIPIDMaps database (http://www.lipidmaps.org/, accessed on 18 February 2024) were used for the identification of the metabolites, which were annotated.
Correlation and PCA analyses were performed based on the metabolic profiles of the individual samples in the same way as the sample analyses of the transcriptome. In the PCA, the representative mass (cos2) values of each variable were extracted and the distribution of cos2 values of each variable across PCs was visualized and clustered using pheatmap (v1.0.12), and class 1 metabolites contributing to the variation in PC1 were visualized by ggplot2 (v3.2.2). In the multivariate statistical analysis section, the data were transformed using metaX (v1.6.0) [29], followed by partial least squares discriminant analysis (PLS-DA), to obtain VIP values for each metabolite. In univariate analyses, statistical significance (p-value) was calculated for each metabolite between the two groups based on t-tests, and the multiplicity of differences (FC-value) of metabolites between the two groups was calculated. The screening criteria for differentially accumulating metabolites (DAM) were VIP ≥ 1.0, FC ≥ 1.5, or FC ≤ 0.667, and p-value ≤ 0.05. DAM volcano plots were visualized using ggplot2 (v3.2.2) and KEGG analysis was performed using clusterProfiler (https://www.bioconductor.org/packages/release/bioc/html/clusterProfiler.html, accessed on 18 February 2024). Metabolites related to the formation of drought tolerance in plants were further screened by a literature survey and their contents and differential accumulation in each sample were visualized.

2.4. Metabolite Module and Gene Module Construction

The metabolite and gene modules were constructed based on the WGCNA method. Firstly, data normalization was performed based on the metabolic profiling data of all experimental samples, the correlation coefficients between two by two of all metabolites in the matrix were calculated, the correlation values were subjected to a power operation, and the soft threshold value of power = 25 was calculated by the pickSoftThreshold function when the value of the scale-free topology fitting exponent was taken to be 0.8; the distribution matrix of metabolite contents was transformed by the power–exponential weighting to the adjacency matrix A; transform A into topological matrix Ω, 1 − Ω is used to define the node dissimilarity, cluster the node dissimilarity and use cutreeDynamic function for module identification. Set the minimum module size parameter minModuleSize = 30, merge cut height parameter MEDissThres = 0.25, and call the automatic merge function mergeCloseModules to merge the modules. Finally, metabolite modules with similar distribution patterns were obtained, and the R package ggforce was used to visualize the distribution trend of metabolite content within the modules and the percentage of metabolite classes in each module.
Gene co-expression modules were constructed in the same steps as described above, and the optimal soft threshold power = 8 was determined with the scale-free topological fitting exponent taking a value of 0.9 for module identification. Module eigenvalues (MEs) were further calculated for each gene module, and their correlation analysis with metabolite MEs was calculated using psych and visualized using ggplot2 (v3.2.2).

2.5. Gene–Metabolite Correlation Network Construction

An O2PLS approach was used to integrate transcriptomic and metabolomic data to identify highly correlated metabolites and DEGs. To focus on potential differential information, the expression matrices of all DEGs and the content distribution matrices of metabolites were selected for O2PLS analysis using the R package OmicsPLS (v1.3.0). The two histological orthogonal and correlation sections containing components were first cross-validated, and the model with the smallest prediction error was selected for subsequent analyses through multiple pre-modeling. The loading values (loading values) of the joint covariate fraction were extracted from the O2PLS analysis results to find highly interrelated genes and metabolites. The genes and metabolites with TOP 200 absolute loading values were further selected to visualize their loading maps in the two histologies, and the data of these genes and metabolites were extracted for correlation analysis to calculate the Spearman correlation coefficients between the genes and metabolites, and only those gene–metabolite pairs with p value ≤ 1 × 10⁻³ were retained to construct the network. The network was visualized using Cytoscape software (v3.9.1) [30].

2.6. Screening of Hub Genes

Gene modules were analyzed based on WGCNA to identify functionally important genes in the modules. The module–gene connectivity (KME, module eigengene-based connectivity) values of each gene in the module were calculated using the signedKME function, and the top 100 genes were screened by the |KME| values, and the genes with high confidence were screened based on the module eigengene-based connectivity (weight) value > 0.6. The final co-expression network was visualized using Cytoscape software. The immediate homologs of these genes in rice were obtained by homology matching and their functional information was found in the database of the National Rice Data Centre. The reciprocal transcription factors of the Hub genes were obtained by analysis in the wGRN database (http://wheat.cau.edu.cn/wGRN/w9/, accessed on 20 February 2024), and the reciprocal transcription factors were predicted using a threshold value of ≥1.4 as a criterion, and based on these transcription factors were further screened to obtain drought-responsive transcription factors based on the expression of these transcription factors in the samples.

2.7. qRT-PCR

The expression of six hub genes was verified by real-time quantitative PCR (qPCR). Total RNA (1 µg) was reverse-transcribed into cDNA using the All-in-One First-Strand Synthesis MasterMix (with dsDNase) (Applied Biological Materials Inc., Canada) in a 20 µL reaction volume, including DNase treatment (37 °C, 2 min; 65 °C, 2 min) and reverse transcription (50 °C, 15 min; 85 °C, 5 min for enzyme inactivation). Gene-specific primers (Supplementary Table S15), designed with Primer 5.0 (Premier Biosoft, Palo Alto, CA, USA), were used at a final concentration of 0.4 µM. qPCR reactions (20 µL total volume) contained 10 µL F488 SYBR qPCR Mix (Universal) (BestEnzymes Biotech Co., Ltd., China), 0.8 µL each of forward/reverse primers, 2 µL cDNA template (1:10 dilution), and 6.4 µL nuclease-free water. Amplification was performed on Applied Biosystems QuantStudio 6 and 7 Flex instruments (Thermo Fisher Scientific) with the following program: 95 °C for 1 min; 40 cycles of 95 °C for 10 s and 60 °C for 30 s; followed by melt curve analysis (60–95 °C, 0.3 °C/s). The reference gene EF-1α (F: 5′-CAGATTGGCAACGGCTACG-3′; R: 5′-CGGACAGCAAAACGACCAAG-3′) was used for normalization. Relative expression levels were calculated using the 2−ΔΔCt method with three biological and three technical replicates per sample, and statistical significance was assessed by one-way ANOVA (p < 0.05).

3. Results

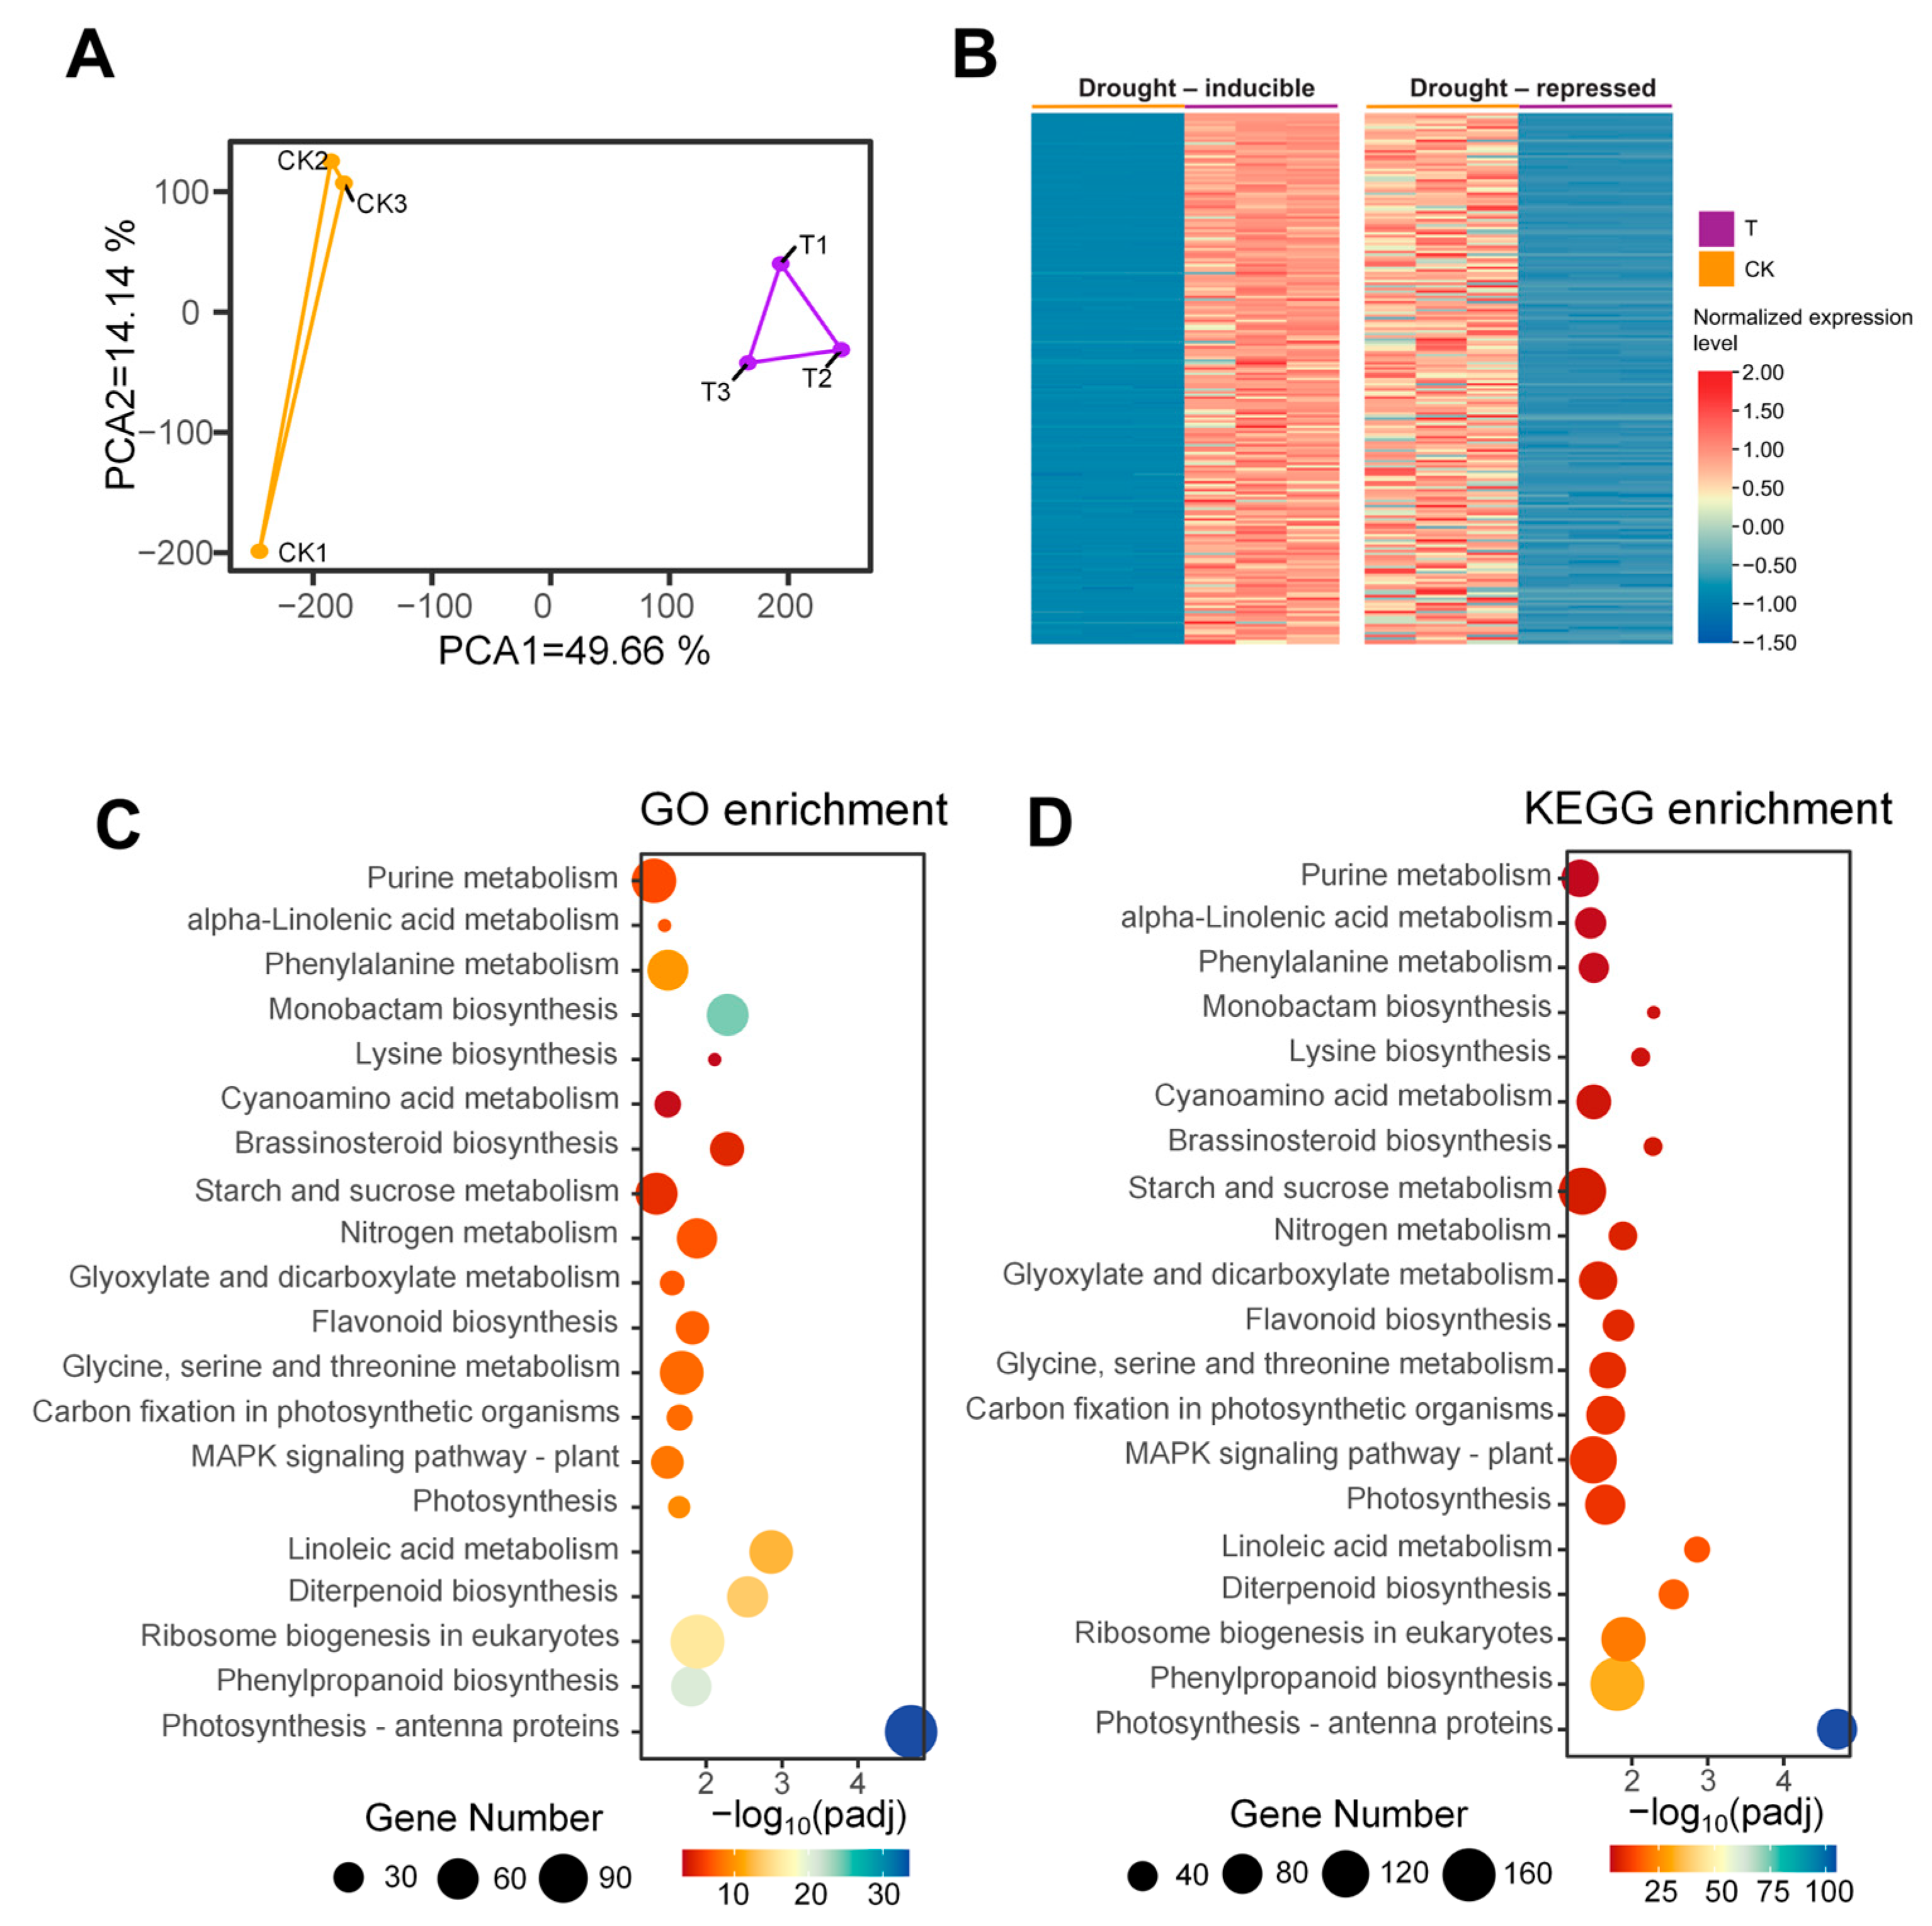
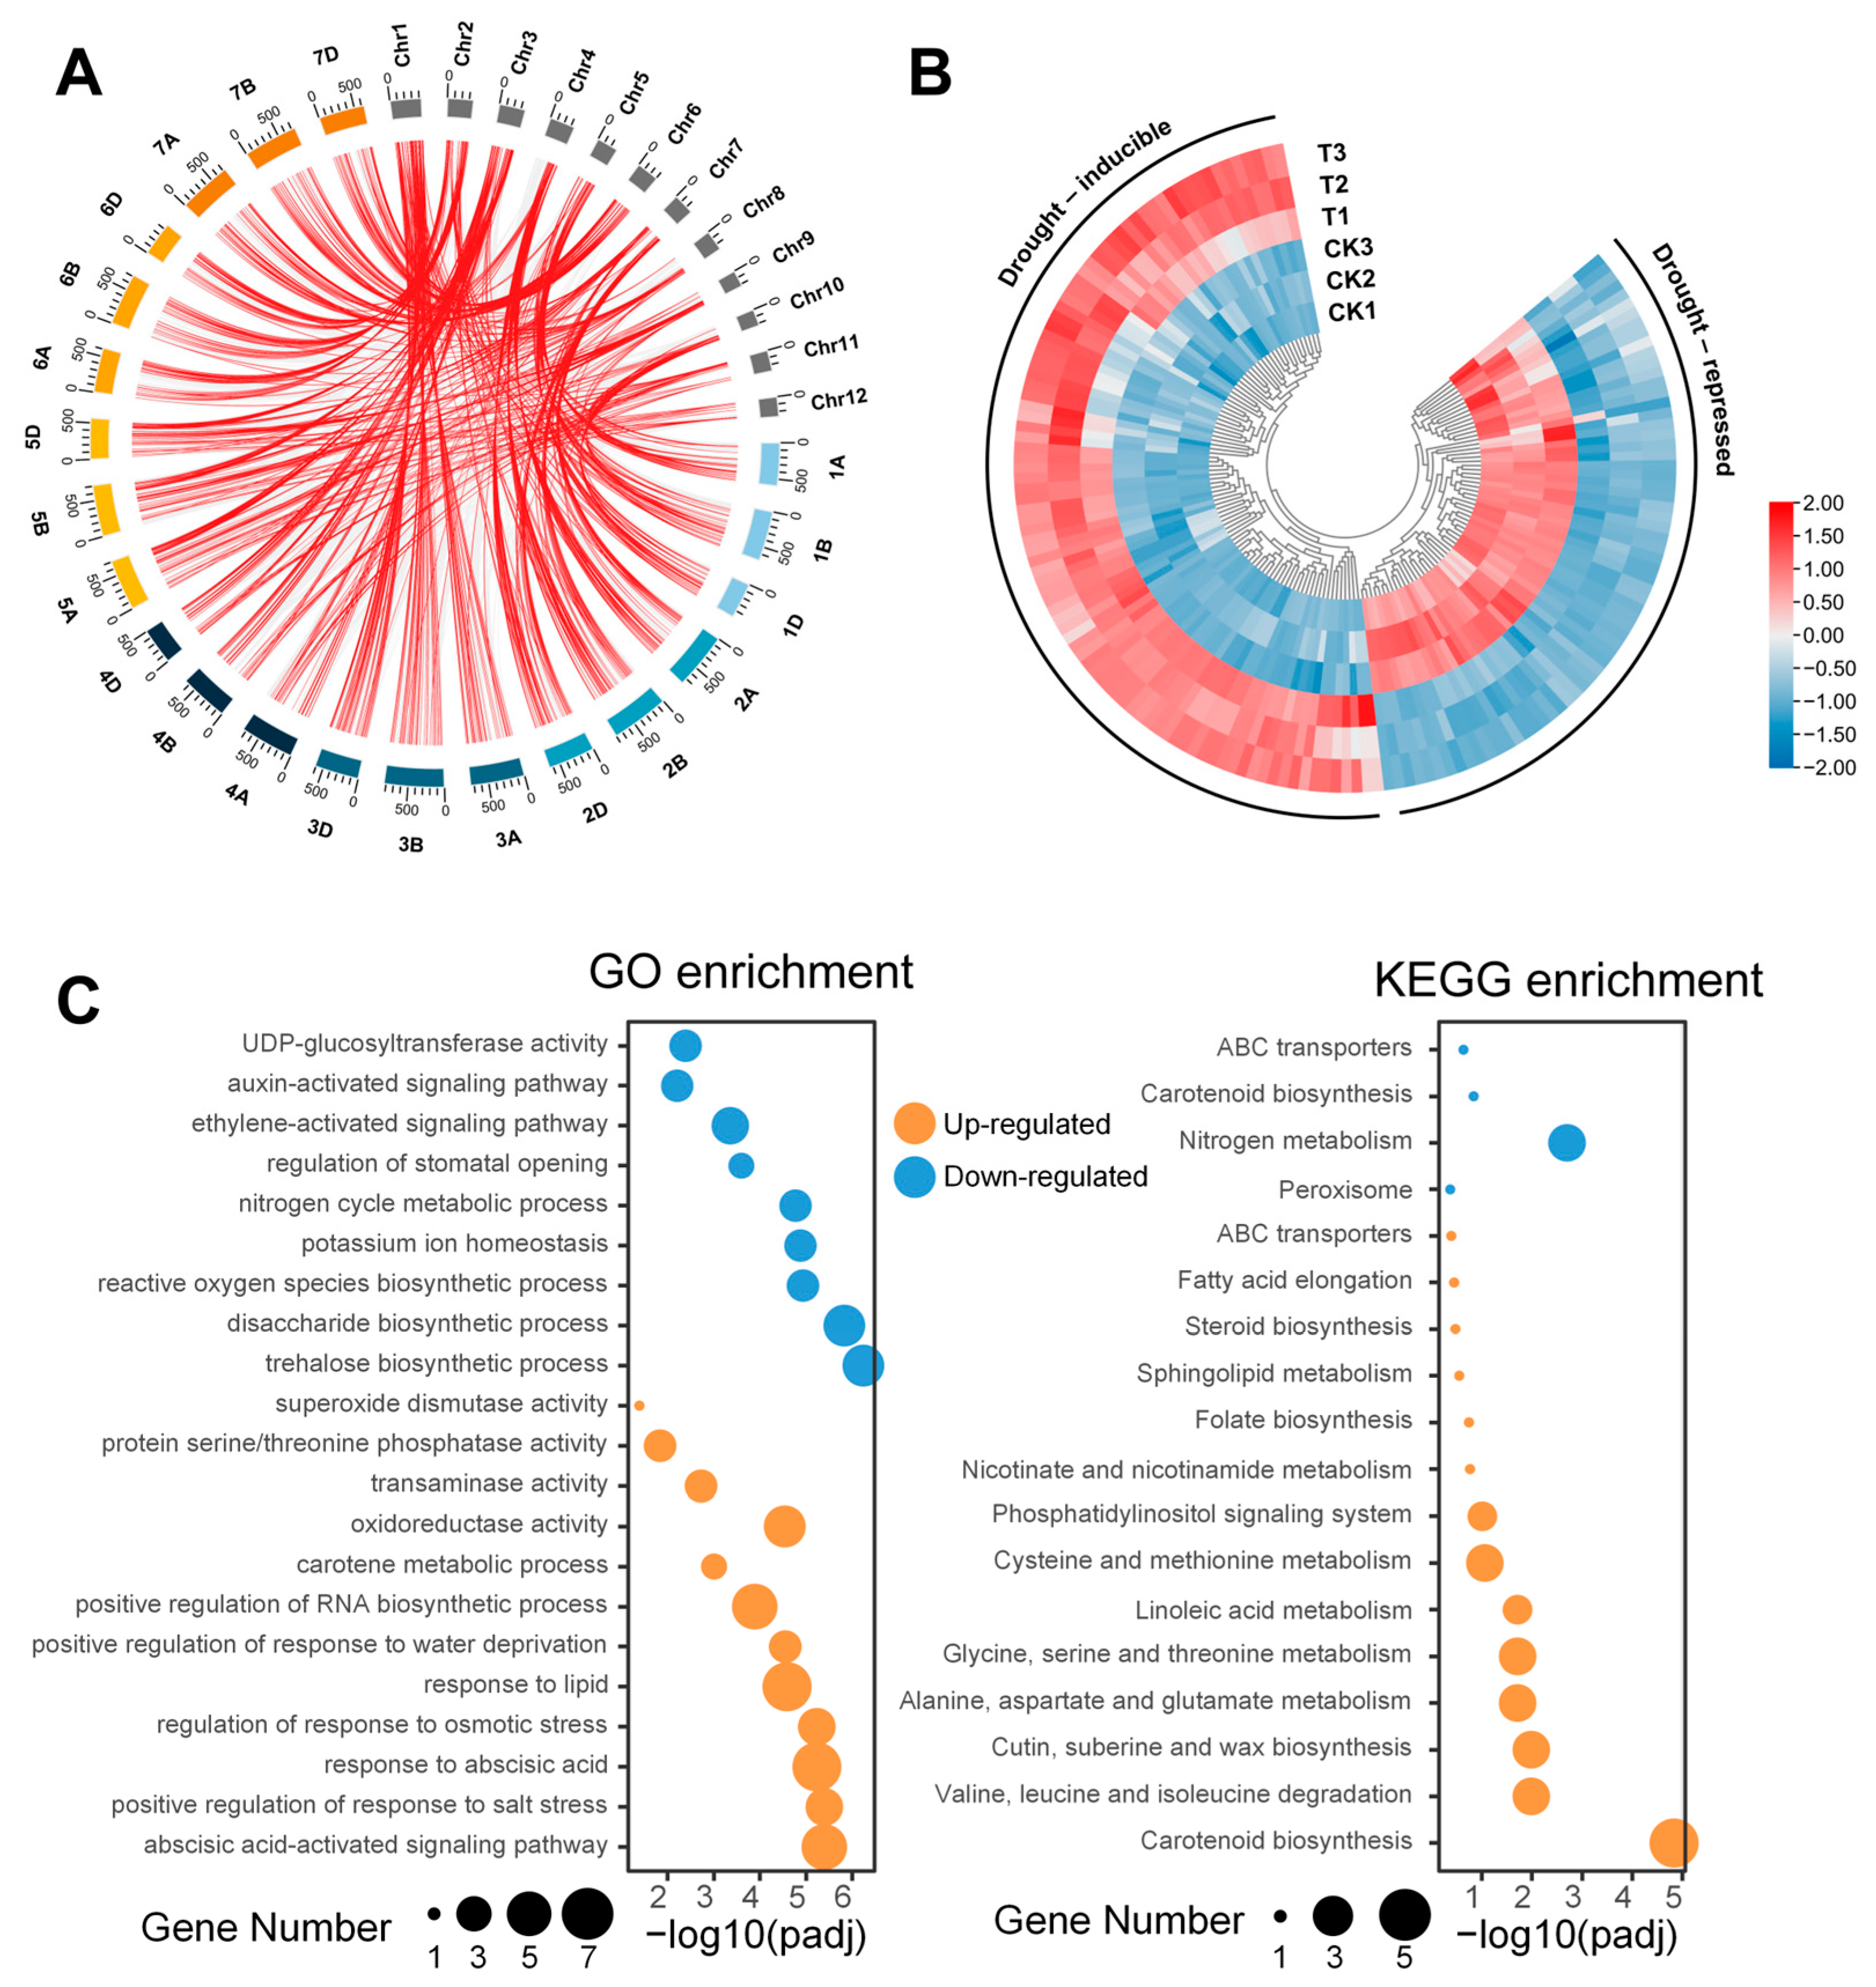
3.1. Transcriptome Analysis

Sequencing results showed that 34.72 and 36.43 Gb of downstream data were obtained for CK and T, respectively, with an average of 11.86 Gb of sequencing data per sample. After filtering, an average of 7,162,946,464 and 77,248,670 Clean reads were obtained for the two groups of samples, respectively, and the percentage of Q30 bases in all samples was greater than 93.70%, which demonstrated superior sequencing quality (Table S1). Sequence matching results showed that the average matching rates for CK and T were 90.40% and 90.65%. The results of inter-sample correlation analysis showed (Figure S1A) that there was a strong correlation between the biological replicates of each group of samples, with correlation coefficients of 0.971 and 0.976, respectively, indicating that the test exhibited high reproducibility. Inter-sample principal component analysis showed a sample distribution consistent with the experimental treatments, indicating that drought stress induced significant variation in gene transcript levels (Figure 1A). Differential expression analysis of genes resulted in the identification of 12,930 drought-responsive genes, of which 7402 genes were induced by drought, including 6787 annotated genes and 615 new genes, and 5528 genes were suppressed by drought, including 5003 annotated genes and 525 new genes (Figures S1C and 1B). Overall, the stressed samples exhibited a significantly higher number of up-regulated DEGs compared to the controls (Padj ≤ 0.05).
The GO enrichment results showed that a total of 2988 GO entries were enriched for all DEGs, of which 358 entries were significantly enriched (Padj ≤ 0.05), including 228 biological processes (BP), 36 cellular components (CC), and 94 molecular function (Molecular function, MF) entries (Table S2). The top 20 most significantly enriched GO terms were selected for presentation. These terms were primarily associated with biological pathways such as photosynthesis (GO:0019684), phytosome defense response (GO:0009814), cellular redox homeostasis (GO:0045454), and anion transmembrane transport (GO:0098656), as well as metabolic processes including phytohormone metabolism (GO:0042445), cellular amino acid catabolism (GO:0009063), carbohydrate biosynthesis (GO:0016051), phenylpropanoid metabolism (GO:0009698), sucrose metabolism (GO:0005985), and trehalose metabolism (GO:0005991). In addition to the aforementioned pathways, significant enrichment was observed in processes related to RNA processing and epigenetic modifications, including the one-carbon metabolic process (GO:0006730) and RNA methylation (GO:0001510). Furthermore, multiple genes were associated with UDP-glucosyltransferase activity (GO:0035251) and oxidoreductase activity (GO:0016903) (Figure 1C). The KEGG enrichment results showed that all DEGs were enriched into a total of 118 metabolic pathways, of which 17 pathways were significantly enriched (Padj ≤ 0.05) (Table S3). All DEGs were mainly involved in (1) photosynthesis, MAPK signaling pathway, purine metabolism, and nitrogen metabolism; (2) energy metabolism-related pathways such as lipid metabolism, starch, and sucrose metabolism; (3) secondary metabolism pathways such as phenylpropanoid metabolism, diterpene, and flavonoid biosynthesis; (4) amino acids metabolisms pathways such as glycine, serine and threonine metabolism, and lysine biosynthesis; (5) metabolic pathways of phytohormones such as oleuropein lactones (Figure 1D). These results indicated that BN207 seedlings initiated multiple biological pathways and metabolic pathways to respond synergistically to drought stress.
GSEA enrichment analysis of GO biological pathways showed that all genes were involved in a total of 3114 biological pathways, of which 1,991 were drought-activated, and 860 biological pathways were significantly enriched when screened with p value ≤ 5% and FDR (corrected p value after multiple hypothesis testing) ≤ 25% (Table S4). We show six pathways with high enrichment for the description of biological responses activated by drought stress, mainly including response to water (GO:0009415), response to oxygen-containing compound (GO:1901700), regulation of defense response (GO:0031347), proline metabolic process (GO:0006560), methionine metabolic process (GO:0006555), and superoxide dismutase activity(GO:0004784) (Figure S2A). GSEA enrichment analysis of KEGG metabolic pathways revealed that all genes were associated with 134 metabolic pathways. Among these, 80 pathways exhibited up-regulated activity under drought stress, and 46 pathways were significantly enriched (Padj ≤ 0.05) (Table S5). The main ones include pyrimidine metabolism (ko00240), cysteine and methionine metabolism (ko00270), biosynthesis of amino acids (ko01230), phenylalanine metabolism (ko00360), peroxisome (ko04146), and ascorbate and aldarate metabolism (ko00053) (Figure S2B). Overall, most of the pathways were activated under drought stress conditions and significant up-regulation of the activities of the pathways of secondary metabolism, amino acid metabolism, antioxidant system, water deficit response of the plant body, and defense response occurred.

3.2. Candidate Gene Mining and Functional Analysis Based on Homology Comparison

A total of 304 functional genes verified to be associated with drought tolerance in rice were screened from the National Rice Data Centre (https://www.ricedata.cn/, accessed on 25 February 2024) and compared and identified as direct homologues in wheat. The results showed that a total of 285 known drought tolerance genes in rice were homologous to 838 wheat genes, of which 270 were covaried in all three subgenomes of wheat, suggesting that these functional genes have conserved covariance among species (Table S6, Figure 2A). Subsequently, we analyzed the expression patterns of these functional genes, and the results showed that 160 genes showed significant responses to drought stress, which could be classified into two categories: 94 genes had drought-induced up-regulation of their expression levels, while 66 were suppressed (Figure 2B), and these genes could be useful for drought tolerance improvement efforts in wheat.
In addition, functional analyses of these drought-responsive genes were performed to understand the mechanism of drought tolerance formation in drought-tolerant wheat varieties (Figure 2C). The results of GO enrichment analyses showed that up-expressed genes were enriched to 95 pathways, which mainly included the abscisic acid-activated signaling pathway (GO:0009738) and other genes that were up-regulated in response to abscisic acid signaling (GO:0009738), response to osmotic stress (GO:0047484), and positive regulation of response to water deprivation (GO:1902584), as well as various pathways related to stress resistance and secondary metabolism; down-regulated expressed genes were enriched to 87 pathways, including reactive oxygen species biosynthetic process (GO:1903409), monovalent inorganic cation homeostasis (GO:0055067) and other reactive oxygen species and ion homeostasis-related pathway, ethylene-activated signaling pathway (GO:0009873), auxin-activated signaling pathway (GO:0009734), and other phytohormone signaling pathways, as well as glycan biosynthesis (GO:0005992, GO.0046351) and other pathways. KEGG enrichment analysis showed that a total of 18 metabolic pathways were enriched, of which 15 were enriched by up-regulated genes and three by down-regulated genes. The up-regulated genes are mainly involved in secondary metabolism, amino acid metabolism, wax synthesis, and other pathways related to, for example, carotenoid biosynthesis (ko00906), valine, leucine, and isoleucine degradation (ko00280), cutin, suberine and wax biosynthesis (ko00073) and Phosphatidylinositol signaling system (ko04070), etc.; down-regulated genes are mainly involved in nitrogen metabolism pathway (ko00910).

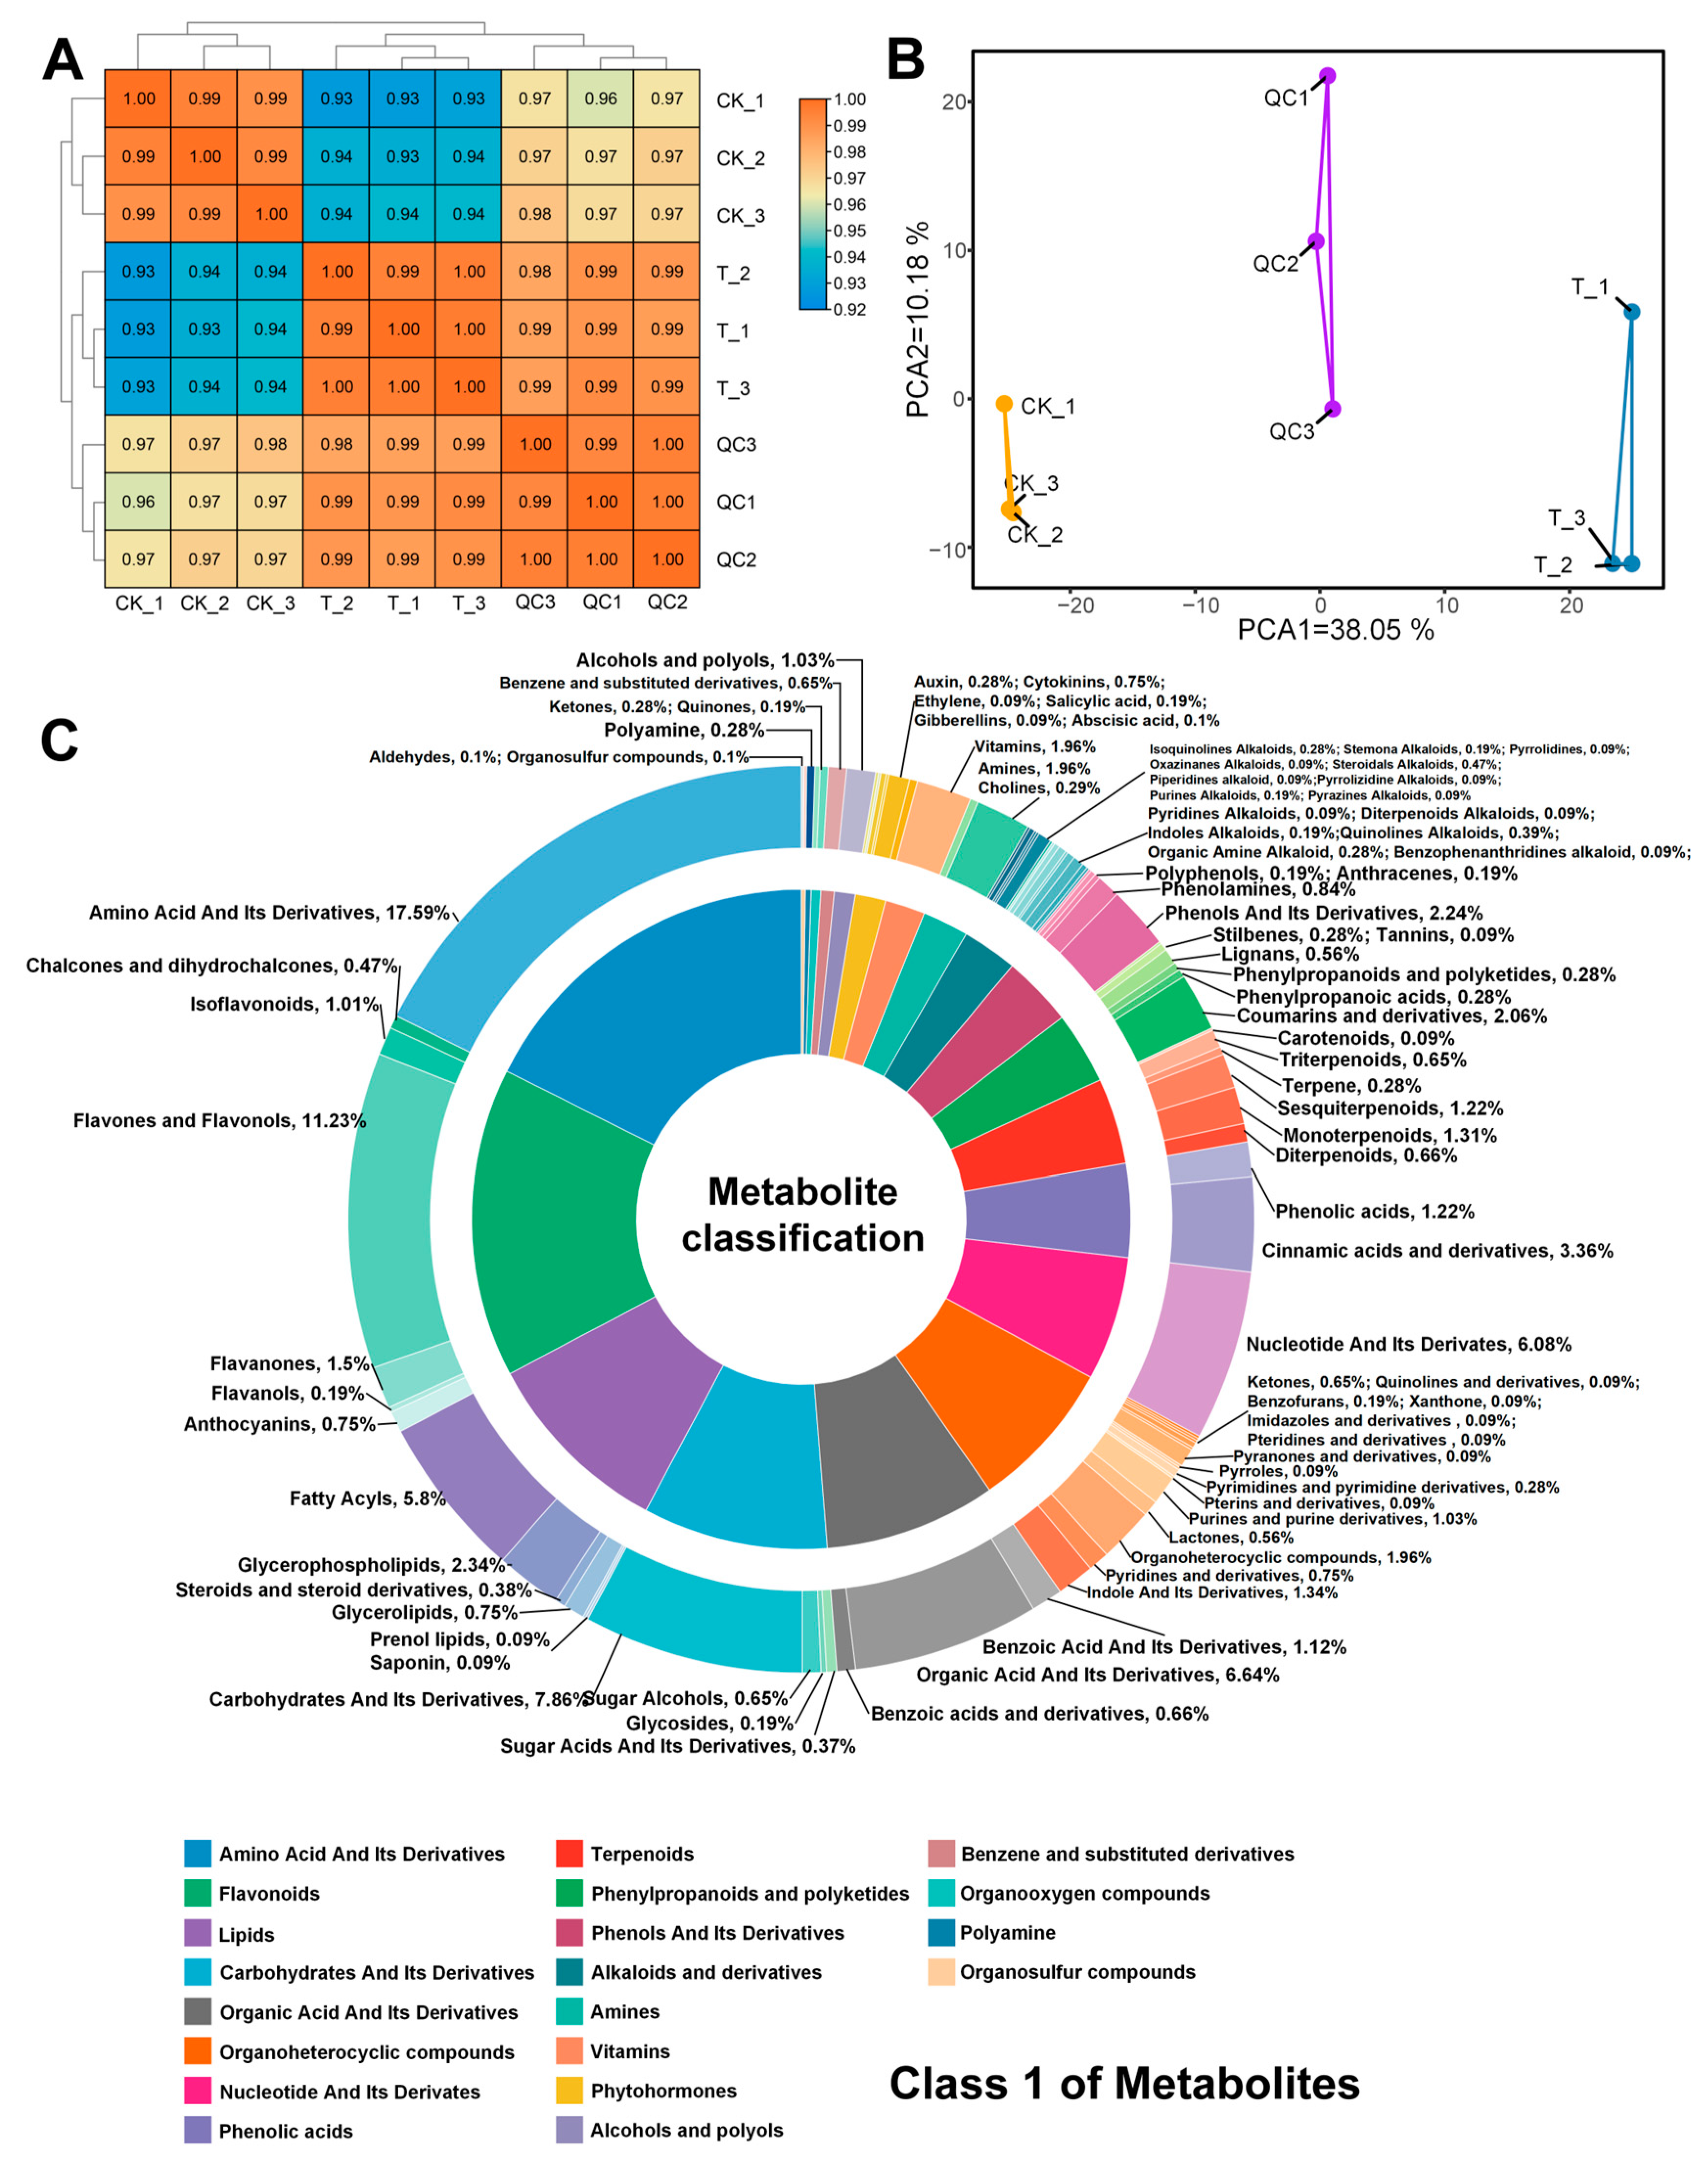
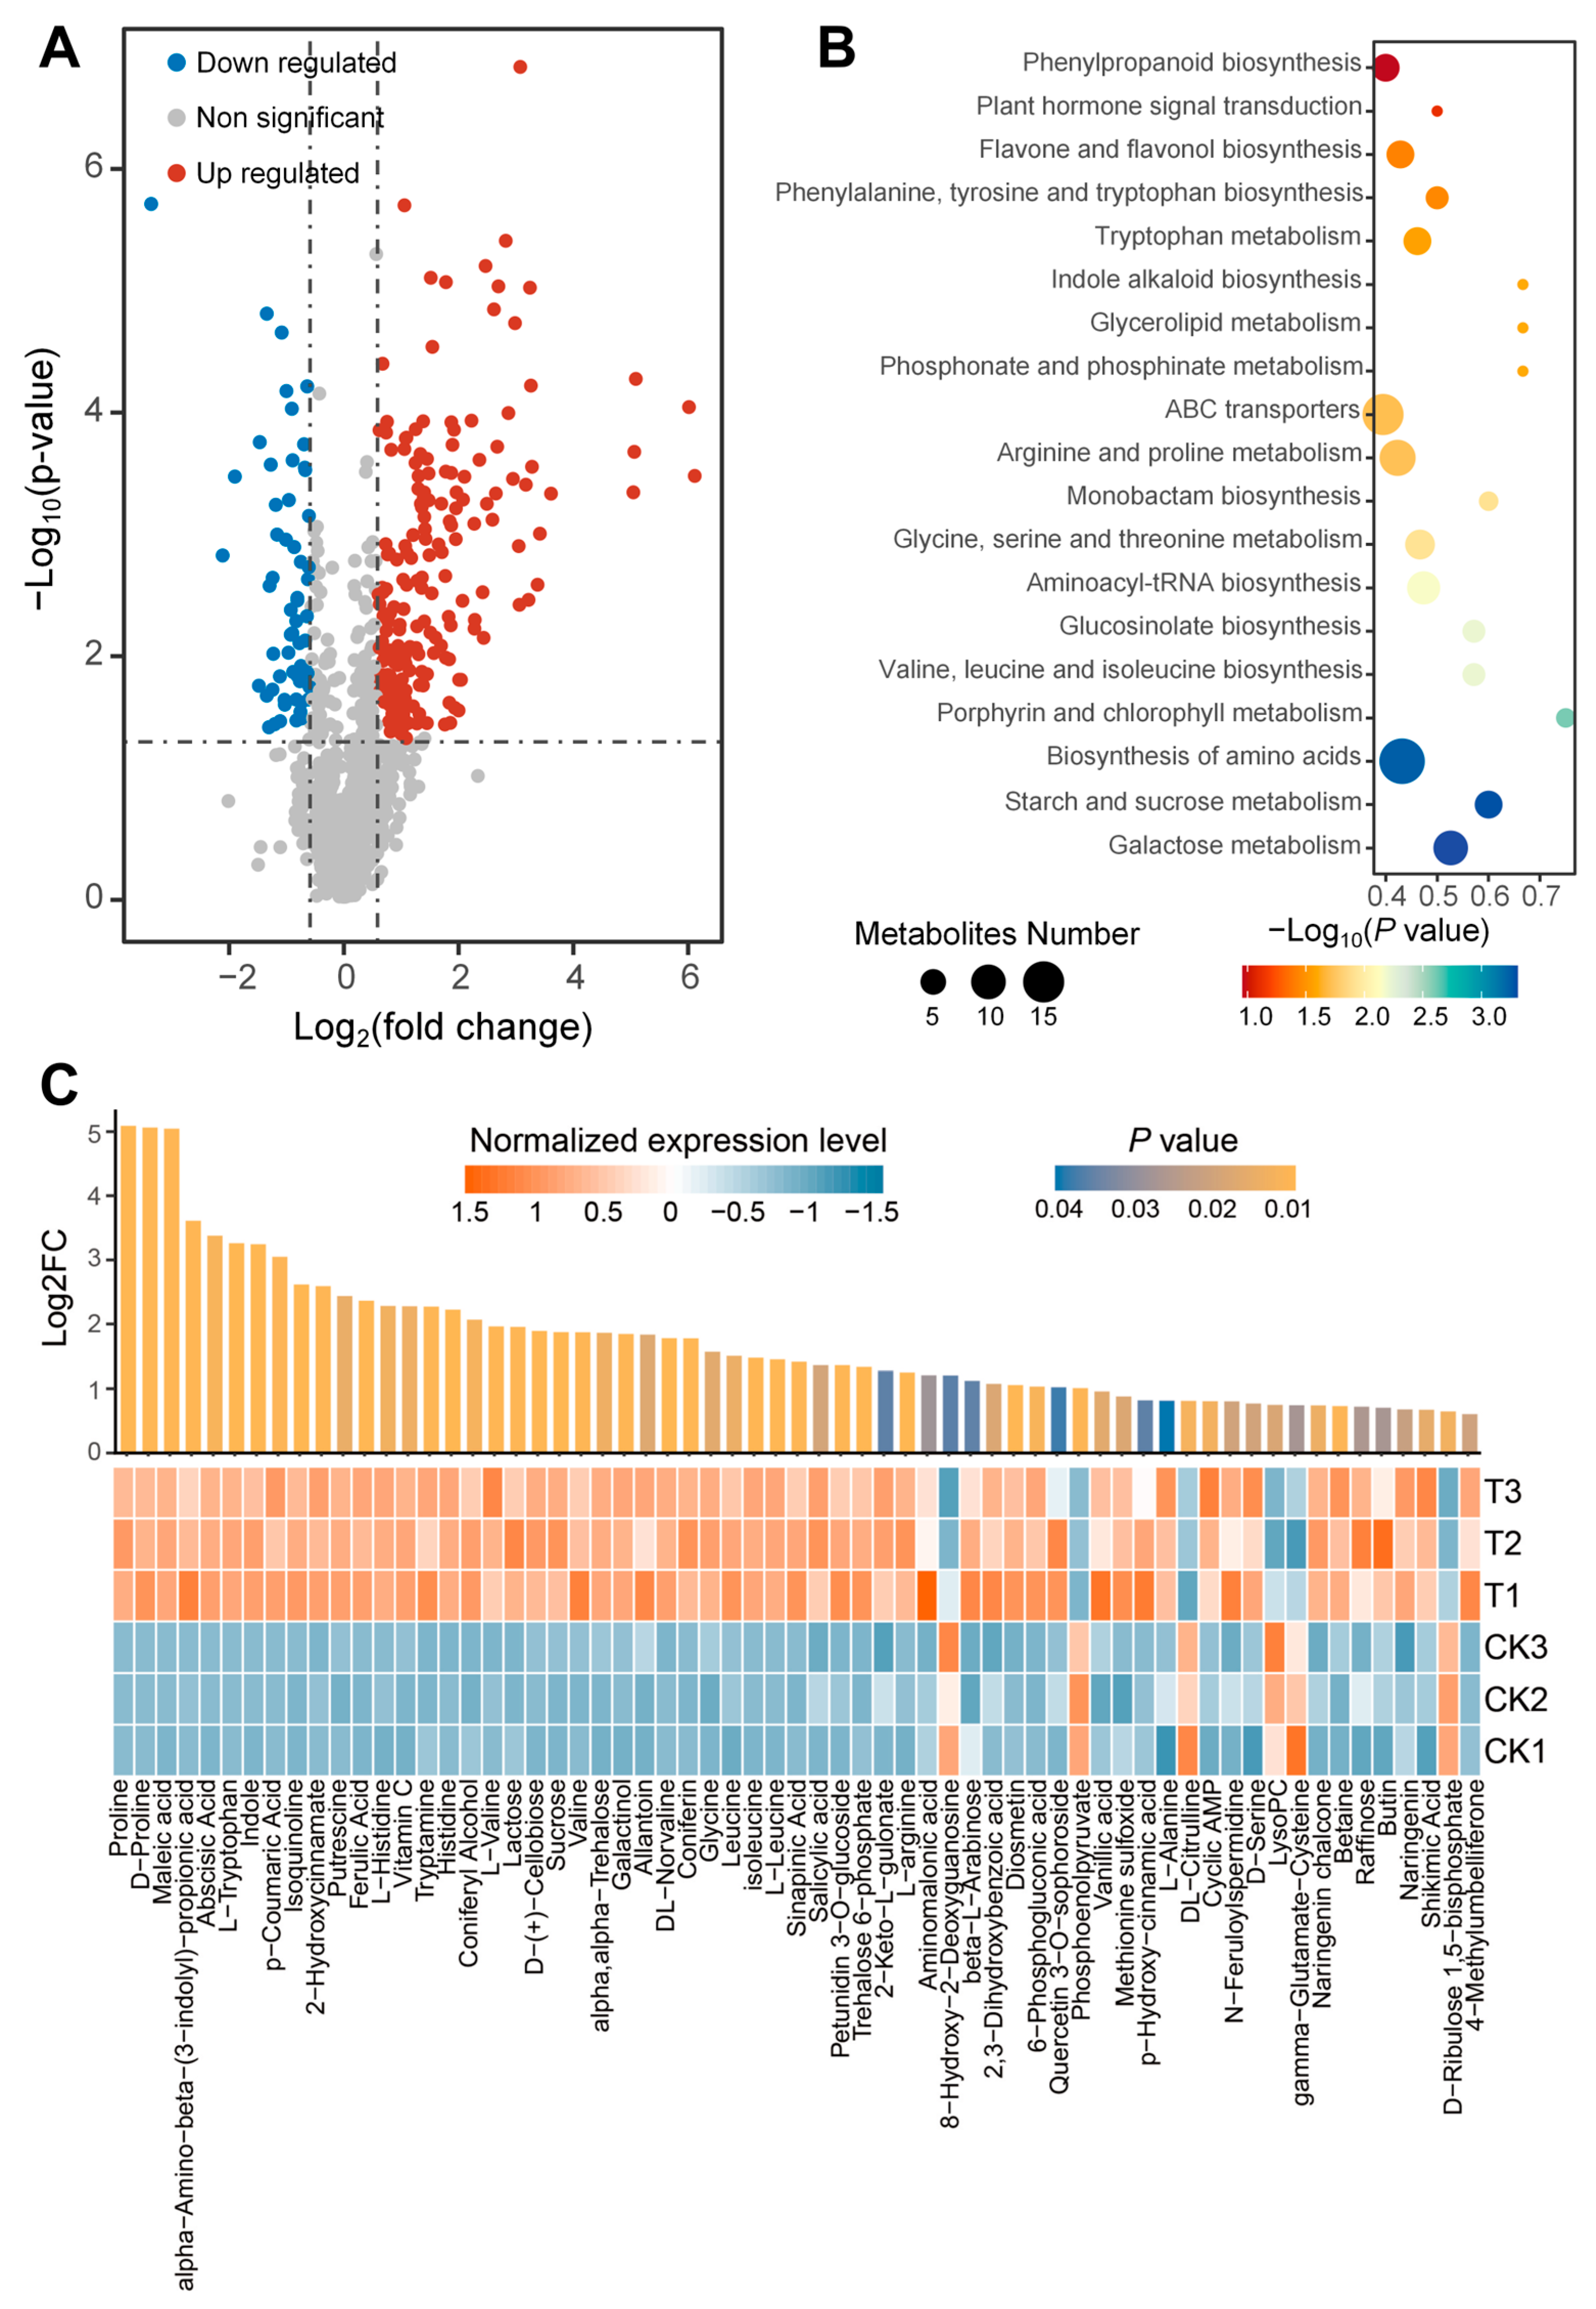
3.3. Metabolomics Analysis

The class-targeted metabolomics group detected a total of 1069 annotated metabolites in 6 samples, of which 664 and 405 were detected by positive and negative ion spectra, respectively. There was a high correlation between the six experimental samples and the three QC samples, with an R2 ≥ 0.99 (Figure 3A). In addition to this, the PCA of the samples also showed a similar distribution between biological replicates (Figure 3B), indicating stable and reliable results for class-targeted metabolomics. A total of 20 metabolite classes were detected in the metabolome, and amino acids and their derivatives and flavonoids were the most abundant, with 188 and 162 detected, respectively, accounting for 17.50% and 15.15% of all. These detected metabolites were further classified into 85 subclasses (Table S7), with amino acids and their derivatives being the most prevalent, accounting for 17.59%, followed by flavonoids and flavonols, accounting for 11.23% (Figure 3C).
PCA analyses revealed that drought stress treatments induced significant variability in metabolite levels, especially at the PC1 level. To explore the metabolites that contributed most to the variation in metabolic levels of the samples, the representative mass (cos2) values of each metabolite in each PC (Table S8) were further calculated (Table S8). The distribution of cos2 values of all metabolites in each PC was analyzed by clustering heatmap, and 351 metabolites were screened to have high representative mass for PC1 (Figure S3A), which were the main contributors to the variation in metabolic levels of the samples, mainly including amino acids and their derivatives (85, 24.22%), flavonoids (47, 13.39%), and lipid (40, 11.4%)class metabolites (Figure S3B). In addition, the identified metabolites were functionally and taxonomically annotated in the KEGG, HMDB, and LIPID MAPS databases. The results showed that 557, 658, and 139 metabolites were annotated in KEGG, HMDB, and LIPID MAPS databases, respectively, of which 94 metabolites were able to be annotated in all three databases (Figure S3C).
The DAM screening results showed that a total of 254 DAMs were screened in the T vs. CK comparison group (Table S9, Figure 4A). The contents of 195 DAMs increased under drought stress, with a multiplicative distribution of differences ranging from 1.52 to 69.36-fold, with aspartic acid and N-feruloylputrescine showing the most pronounced increases; the contents of 59 DAMs decreased, with a multiplicative distribution of differences ranging from 0.09 to 0.66-fold, with rutin content decreasing most significantly. KEGG enrichment analysis of DAMs showed that 49 metabolic pathways were enriched, and the drought mainly affected galactose metabolism (ko00052), starch and sucrose metabolism (ko00500), biosynthesis of amino acids (ko01230), porphyrin and chlorophyll metabolism (ko00860), as well as a variety of amino acids and chlorophyll metabolism (ko00860). Biosynthesis of amino acids (ko01230), porphyrin and chlorophyll metabolism (ko00860), as well as the metabolism and signaling of a wide range of amino acids, flavonoids, lipids, and phytohormones (Table S10, Figure 4B). Sixty-three DAMs known to have antioxidant activity or to be associated with plant drought tolerance were further screened, of which fifty-seven were increased under drought stress with a multiplicative distribution of differences ranging from 1.52 to 34.04; and six DAMs were reduced to 0.43–0.64 times that of CK (Table S11, Figure 4C). Overall, the accumulation mechanisms of a variety of metabolites with drought-tolerant effects were activated under drought stress, with the most pronounced increases in proline, maleic acid, abscisic acid, tryptophan, putrescine, ferulic acid, and ascorbic acid metabolites.

3.4. Metabolite Module Construction and Screening of Important Gene Modules

Different metabolites have synergistic or mutually exclusive correlations with each other, and similar metabolic patterns imply that metabolites may have similar functions or participate in metabolic processes synergistically. Therefore, the analysis method of WGCNA was used to cluster and correlate metabolites according to their distribution patterns among samples, and constructed metabolite modules with correlations, which can help to comprehensively understand the mechanism of drought tolerance formation and the mining of related functional genes. The soft threshold power = 25 was determined by taking a value of 0.8 for the scale-free topological fit index (Figure S4A). The metabolites were further hierarchically clustered and divided into modules, and finally, six modules were obtained except gray (invalid module, Meta7): green, brown, yellow, blue, black, and red, named Meta1–6. These modules contained 59, 83, 62, 87, 51, and 484 metabolites, respectively. The inter-module correlation was shown in Figure 4B, with a good correlation between Meta4, 5, and 6 modules. The distribution patterns of metabolite contents and classes in each module were further analyzed (Figure S4C), and significant changes in the contents of metabolites within the Meta6 module were observed under drought stress. The module contained 19 classes of metabolites, of which amino acids and their derivatives were the most abundant (112, 23.14%), followed by flavonoids (68, 14.05%) (Table S12). It is noteworthy that the Meta6 module contained the largest proportion of metabolites from the amino acid and their derivatives group and also contained more metabolites from the phytohormone group (9/16) compared to the other modules.
All genes were analyzed using the WGCNA approach, with the optimal soft threshold power (β = 8) determined when the scale-free topological fit index reached 0.9 (Figure S5A). Further division yielded 24 co-expressed gene modules (Figure S5B). Correlation analysis of the gene modules with the metabolite modules showed that a total of eight gene modules were significantly correlated with the metabolite modules (Figure 5A). Among them, MEdarkturquoise module (r = 0.93, p value = 7.0 × 10⁻³), MEsalmon1 module (r = −0.85, p value = 3.0 × 10⁻²), and MEcoral4 module (r = −0.83, p value = 4 × 10⁻²) were significantly correlated with Meta1 module; the MEdodgerblue2 module (r = 0.87, p value = 3.0 × 10⁻²) was significantly correlated with the Meta3 module; the MEgrey60 module and the MEdeepskyblue4 module (r = −0.85, p value = 3.0 × 10⁻²) were significantly correlated with the Meta5; the MEorange1 module (r = −0.81, p value = 5.0 × 10⁻²), MEbrown module (r = 0.99, p value = 3.0 × 10⁻⁴), and MEgrey60 module (r = −0.95, p value = 4.0 × 10⁻³) were significantly correlated with the Meta6 module. The MEbrown gene module was significantly correlated with the Meta6 metabolite module in the drought stress followed the same trend and were important gene modules.

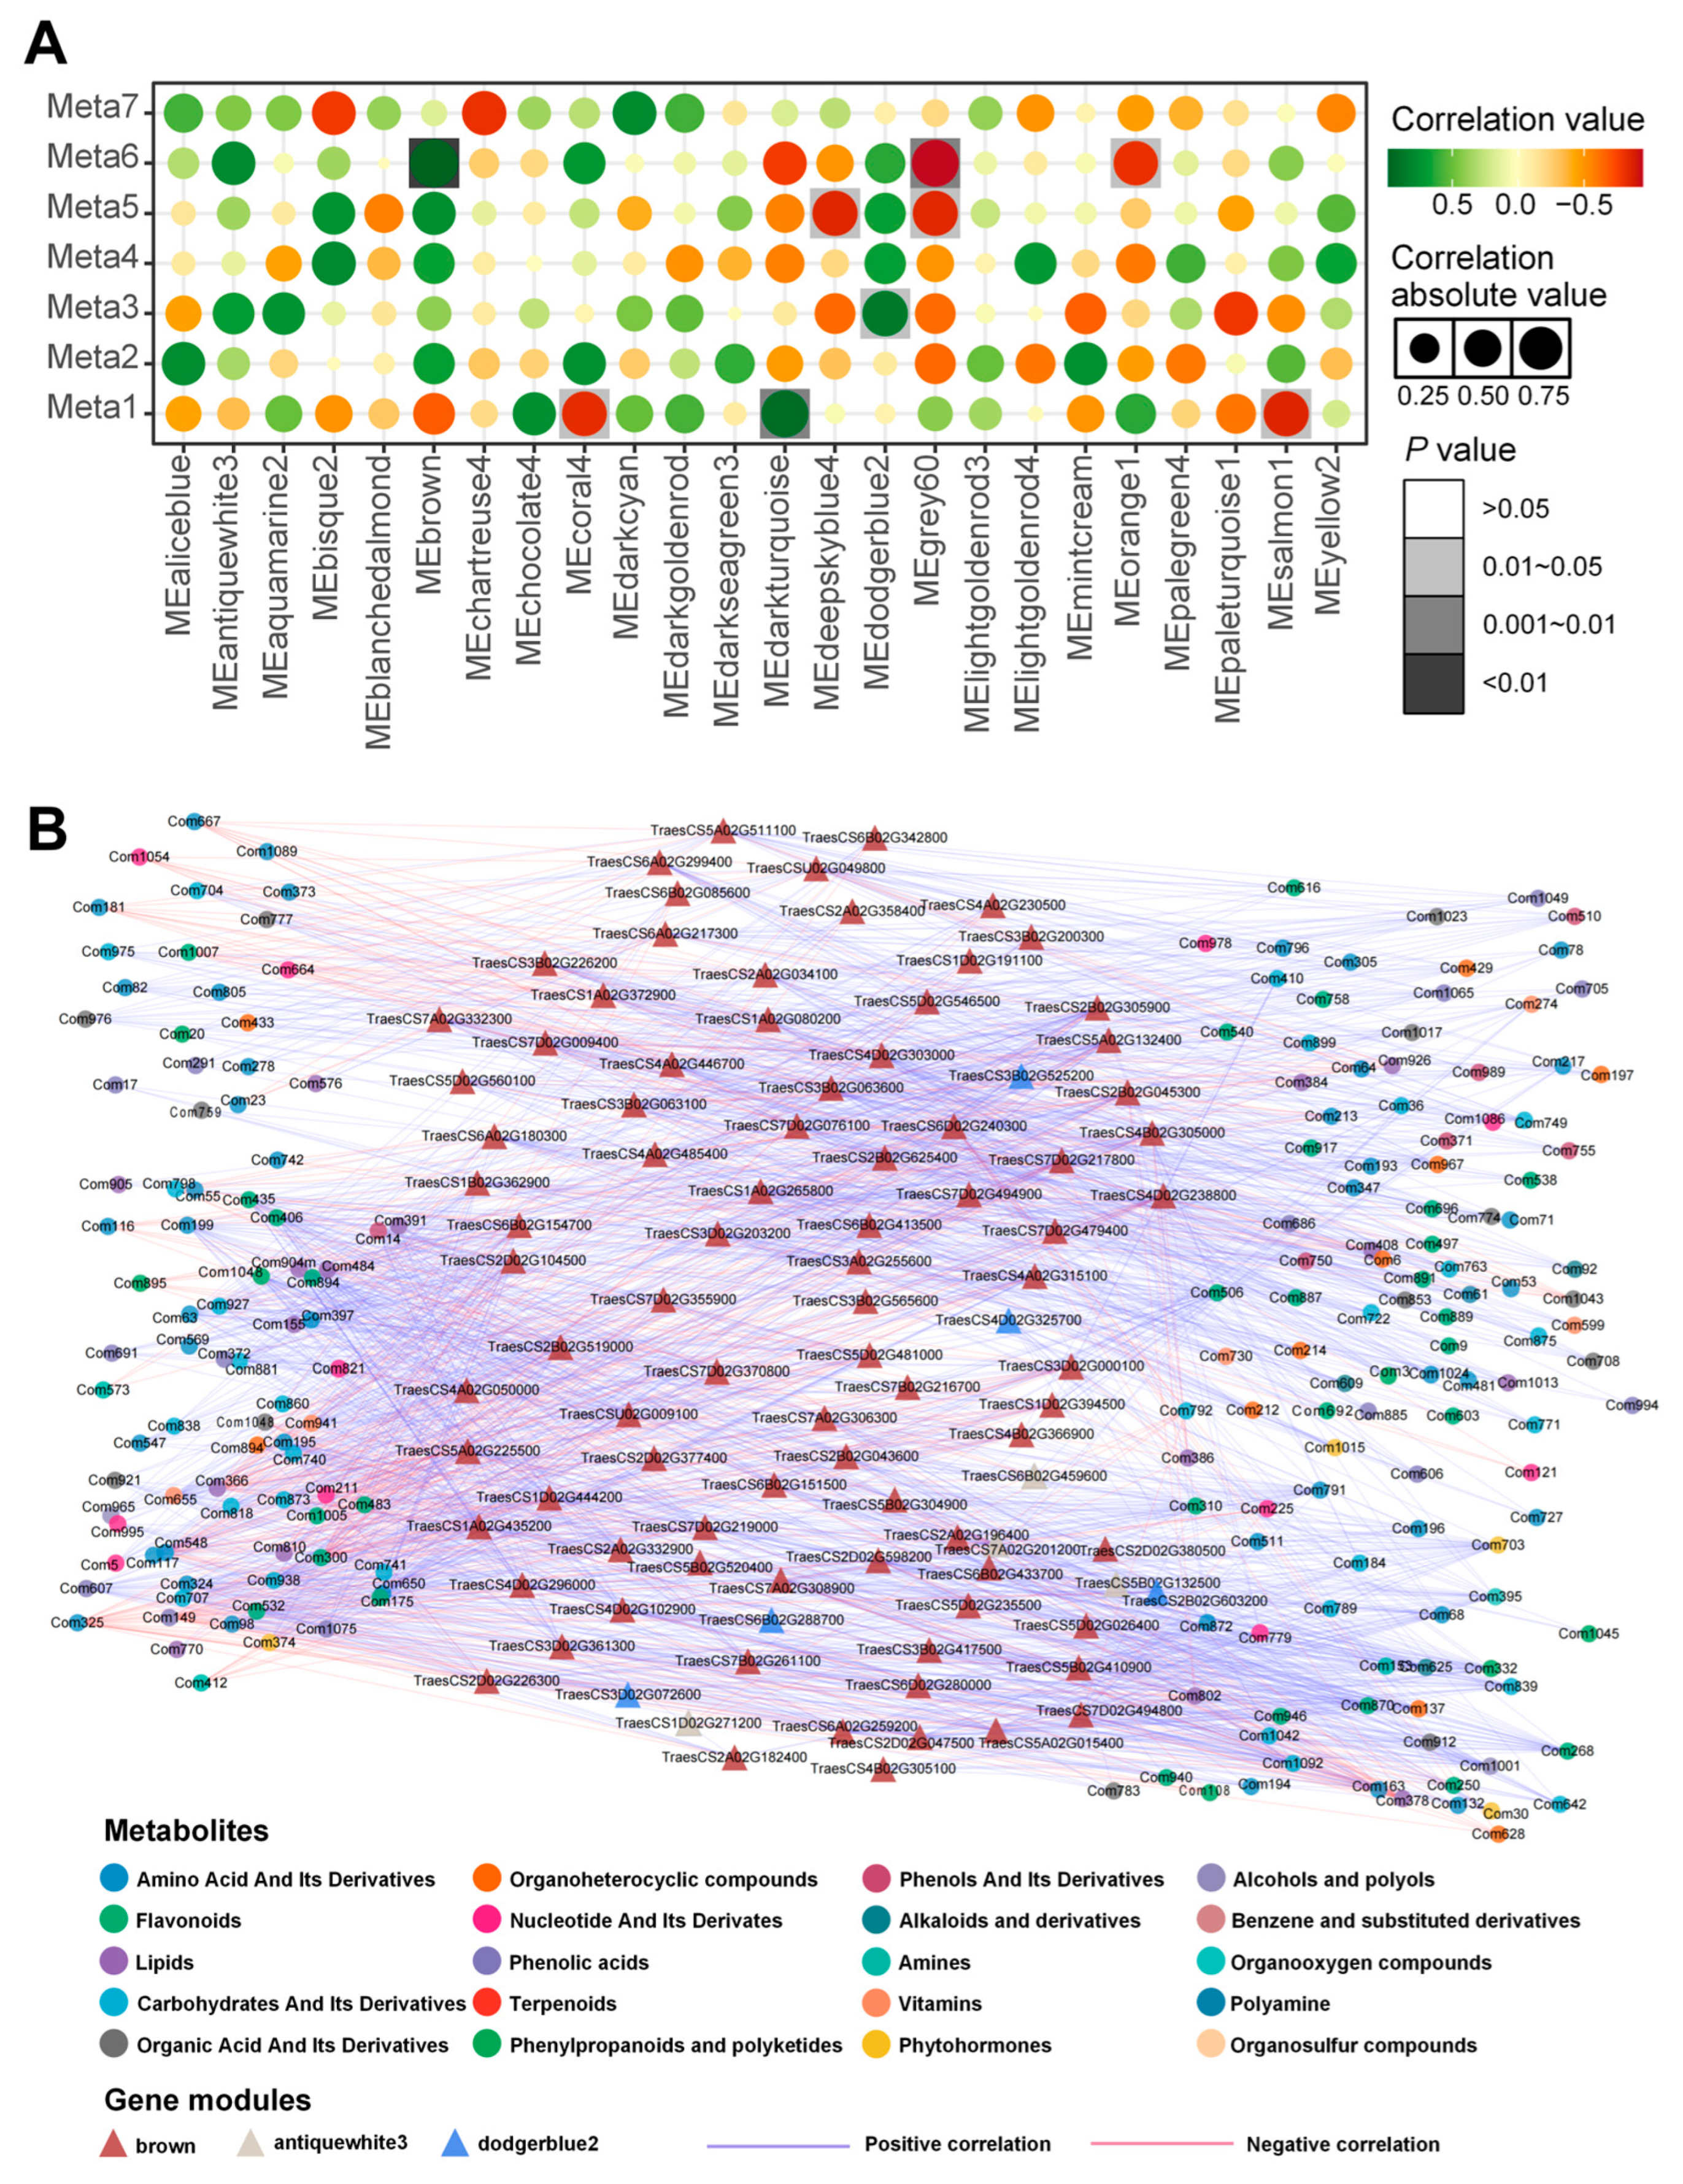
3.5. Combined Transcription-Metabolism Analysis

Twelve thousand nine hundred thirty differentially expressed genes and 1069 metabolites were selected through O2PLS analyses to identify joint covariance relationships between the two omics datasets. The large amount of joint covariance indicated that a significant proportion of changes in metabolite levels were accompanied by changes in gene expression. The top 200 genes and metabolites that contributed the most to the between-group differences were identified by calculating the loading values of the variables in each dataset for further construction of the correlation network (Figure S6). Based on the Spearman correlation coefficient, the correlation between the 200 gene and metabolite pairs was calculated and 2197 gene–metabolite pairs were filtered to constitute the correlation network based on the correlation p-value of ≤1 × 10⁻³ (Figure 5B).
The network included 95 genes, of which 87 were from the MEbrown co-expression gene module related to an amino acid, flavonoid, and phytohormone metabolism, four from the MEantiquewhite3 gene module and five from the MEdodgerblue2 gene module. The network contains 197 metabolites in 17 classes, including 44 amino acids and their derivatives, 29 flavonoid compounds, 28 carbohydrates, 16 lipid metabolites, and 4 important phytohormones (abscisic acid, salicylic acid, zeaxanthin riboside, ip7G). The metabolites in the network were mainly from four metabolite modules, including Meta2 (4, 2.03%), Meta4 (3, 1.52%), Meta5 (2, 1.02%), and Meta6 (188, 95.43%), with the most metabolites coming from the Meta6 module. In addition, the gene–metabolite correlation network showed 57 metabolites associated with drought tolerance, including abscisic acid, ascorbic acid, trehalose, raffinose, and more. These metabolites were significantly correlated with the differential expression of related genes, which may be the main reason for the formation of the drought tolerance phenotype in this variety. Overall, the gene–metabolite correlation network constructed based on the O2PLS method showed overall the joint contribution of gene transcript levels and metabolic levels in the leaves of seedlings of the superior drought-tolerant variety under drought stress and further identified the important function of the MEbrown co-expressed gene module in the formation of drought tolerance in this variety.

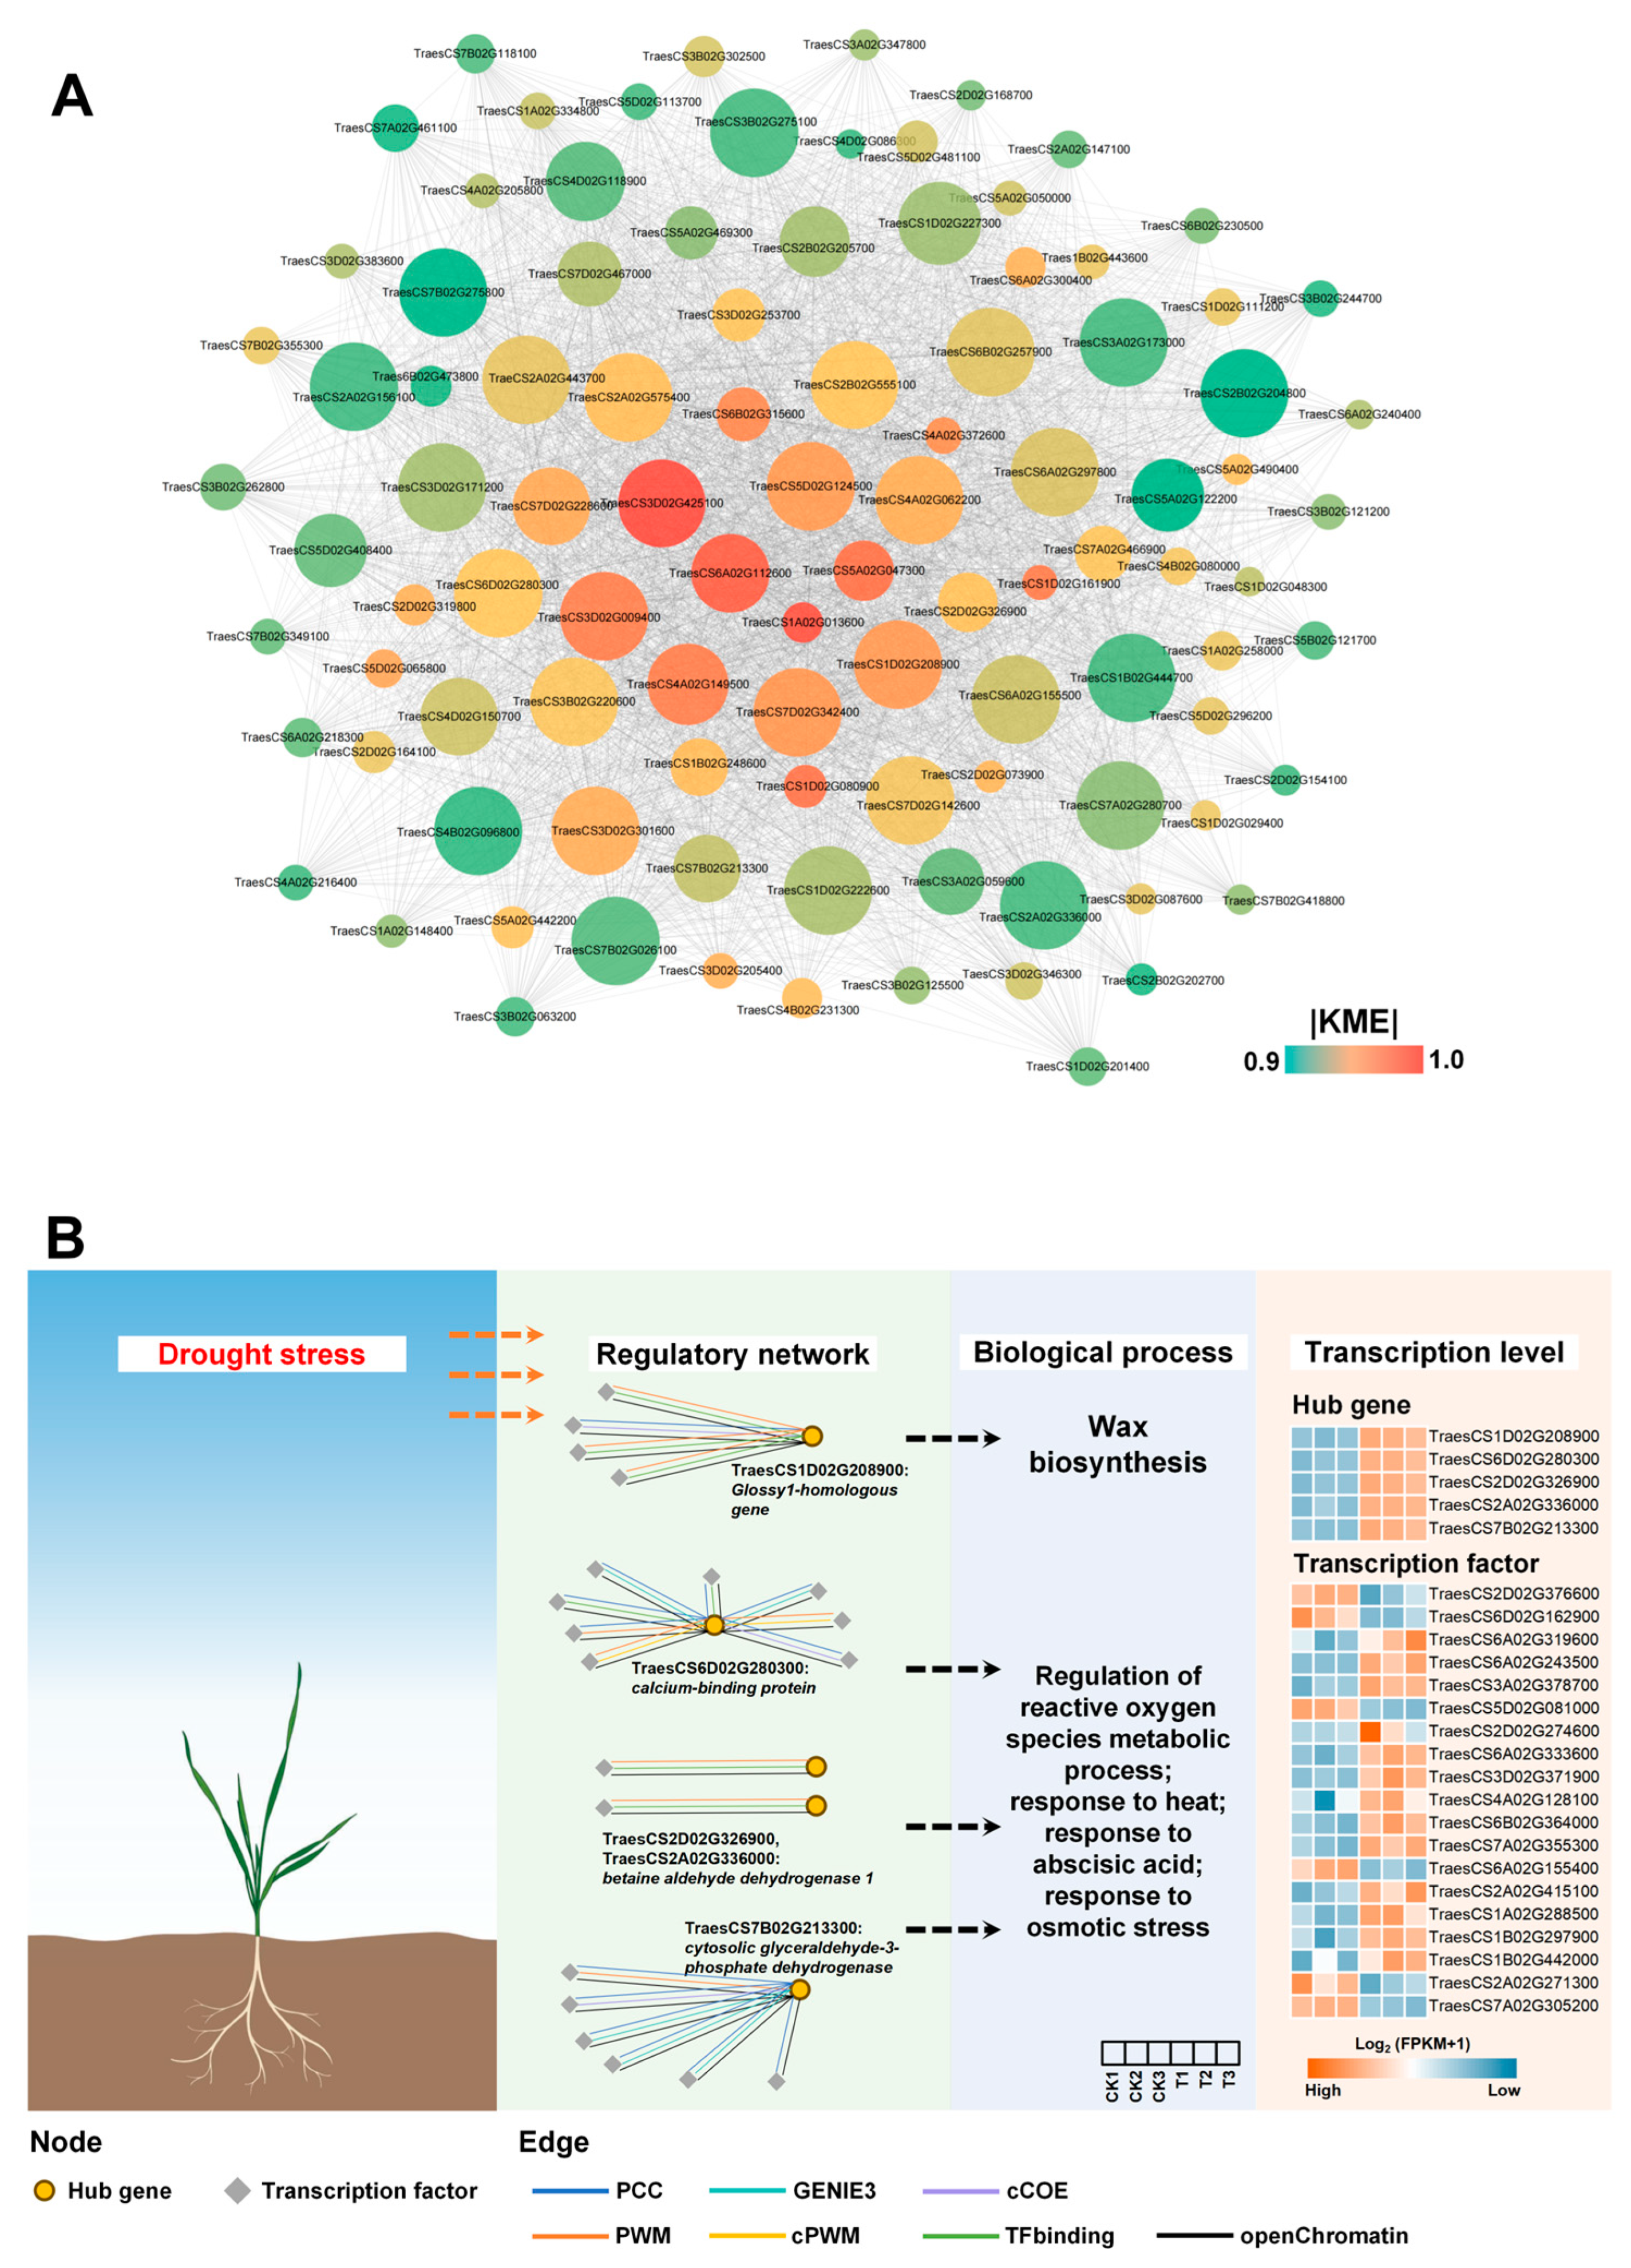
3.6. Mining and Analysis of Hub Genes

The MEbrown gene co-expression module was determined to be functionally important for BN207 to withstand drought stress by combined transcript–metabolome analysis. To further explore the important functional genes contributing to the drought resistance of this variety, the hub genes of this network were mined, and their regulatory mechanisms were analyzed in conjunction with public databases. First, the gene–module connectivity (KME) value was calculated for each gene in the MEbrown module, serving as an indicator of gene importance within the module. The results showed that there are 5485 genes contained in the MEbrown module, and the |KME| values were distributed between 0.56 and 0.99. The top 100 genes with |KME| values were further selected, and the network containing 4950 genes with good performance on connectivity was filtered based on the inter-gene connectivity (Weight) value > 0.6 (Figure 6A).
The functions of these genes were annotated by homology comparison with functional genes in rice, resulting in the annotation of a total of 21 genes that have been reported in rice, including six genes related to the functions of drought tolerance, wax biosynthesis, high-temperature–stimulus response, osmotic stress response, abscisic acid response, and reactive oxygen species metabolism (Table S13). TraesCS1D02G208900 belongs to the wax synthesis gene (Glossy1-homologous gene, GL1-10) and its homologues are able to participate in the biosynthesis of waxes, helping to prevent the loss of water and protect plants from different environmental stresses. TraesCS6A02G300400 and TraesCS6D02G280300 belong to the same gene triad, a calcium-binding protein gene (ANN), and they are homologous to genes with calcium-binding and ATPase activities, which increase SOD and CAT activities, and regulate H2O2 content and oxidativereduction homeostasis, thus providing comprehensive cellular protection against abiotic stress-induced losses. TraesCS2D02G326900 and TraesCS2A02G326000, members of the same gene triad, encode betaine aldehyde dehydrogenase 1 (BADH). Their homologs catalyze the dehydrogenation of betaine aldehyde (a precursor of glycine betaine) and other aldehydes, thereby alleviating toxic effects under abiotic stress. In knockout mutants of these genes, elevated levels of reactive oxygen species (ROS) and malondialdehyde (MDA) were observed, accompanied by reduced stress tolerance. TraesCS7B02G213300 encodes cytosolic glyceraldehyde-3-phosphate dehydrogenase (GAPDH), a homolog of which is widely involved in the glycolytic pathway and has been reported to be involved in the osmotic stress response, abscisic acid response, and reactive oxygen metabolism and reactive oxygen species metabolism. In summary, based on the importance of the genes in the module and their functional annotations, six Hub genes were identified as playing critical roles during drought stress, and their expression levels in both control and drought-treated groups were experimentally validated via qRT-PCR, in which three genes were significantly up-regulated and three genes were significantly down-regulated under drought stress (Figure S7). Transcription factors with regulatory effects on Hub genes were further identified at multiple levels using the wGRN database, and the most stringent interaction thresholds were selected to screen the transcription factors. As a result, a total of 135 transcription factors with regulatory effects on these six Hub genes were screened. The expression of 20 genes was identified to be able to respond to drought stress by differential expression analysis, and the regulatory network was further mapped (Figure 6B). In conclusion, twenty drought-responsive transcription factors were identified. These transcription factors were computationally inferred to bind and regulate the expression of six hub genes and played a role in drought stress through wax biosynthesis, reactive oxygen metabolism, abscisic acid response, and other pathways, which are the molecular basis for the formation of excellent drought tolerance in BN207.

4. Discussion

Reactive oxygen species (ROS) produced by plant cells during normal metabolism can lead to oxidative damage under environmental stresses, such as drought, as the rate of production exceeds the scavenging capacity. It has been shown that a wide range of crops (wheat [30,31], sorghum [32,33], rice [34], tomato [35], and maize [36]) activate gene expression in antioxidant systems under drought stress. In this study, functional enrichment analysis of differentially expressed genes revealed significant up-regulation of pathways associated with cellular redox homeostasis and oxidoreductase activity, which coincided with known mechanisms of drought tolerance in plants. Notably, the two hub genes screened, TraesCS6A02G300400 and TraesCS6D02G280300, were identified as members of the calcium-binding protein (ANN) family, whose rice homolog OsANN1 has been shown to enhance abiotic stress resistance by regulating SOD and CAT activities and maintaining H2O2 homeostasis [37]. Recent studies have further revealed that overexpression of OsANN9 significantly enhances drought tolerance in rice [38], while overexpression of StCaM2 in tobacco improves drought tolerance by enhancing photosynthetic efficiency and ROS scavenging [39]. These findings mechanistically correlate with the significant upregulation of two calcium-binding protein genes observed under drought induction in the current study, suggesting conserved regulatory roles of calcium-related proteins in plant drought adaptation. Meanwhile, in gene–metabolite regulatory network analyses, eight transcription factors potentially regulating the expression of TraesCS6D02G280300 were identified (Table S14), among which four bZIP transcription factors (e.g., TraesCS3A02G378700) were prioritized as critically important. Studies have shown that bZIP family members have bidirectional roles in drought regulation: chili CaATBZ1 overexpression reduces drought tolerance [40], whereas tomato SlbZIP38 acts as a negative regulator of ABA-mediated drought response [41]. In addition, the predicted WRKY transcription factor TraesCS4A02G128100 homologous genes in maize and tobacco exerted positive regulatory effects through activation of ABA biosynthesis [42] and enhancement of stress tolerance [43], respectively. Another key regulator, TraesCS2D02G274600 (bHLH62-like), is associated with known drought tolerance mechanisms: tomato SlbHLH96 enhances drought tolerance by repressing ABA catabolic genes [44], and peanut AhbHLH112 improves drought tolerance by enhancing ROS scavenging capacity [45]. Taken together, the eight transcription factors predicted in this study may synergistically maintain redox homeostasis through cascade regulation of calcium-binding protein gene expression.
Plants maintain water homeostasis in their tissues through osmoregulation, while ensuring normal physiological and biochemical cellular activities through the uptake of water from the environment [46]. In this study, a rice–wheat direct homology comparison strategy was employed to mine key functional genes potentially regulating drought tolerance in wheat, based on transcriptome data from Bainong 207. GO enrichment analysis showed that the up-regulated genes were significantly enriched in osmotic stress-related pathways, including “osmotic stress response regulation” and “response to water deprivation positive regulation”. Among the six Hub genes screened, TraesCS2D02G326900 and TraesCS2A02G336000 encode betaine aldehyde dehydrogenase (BADH), a key enzyme in glycine betaine biosynthesis. BADH catalyzes the oxidation of betaine aldehyde to glycine betaine, a potent osmoprotectant that enhances plant tolerance to salinity and drought by maintaining cellular osmotic balance and stabilizing macromolecules [47]. Functional studies of the rice homologous gene OsBADH1 confirmed that BADH effectively mitigates abiotic stress damage by catalyzing the dehydrogenation of aldehydes such as beet aldehyde [48], and this mechanism has been further validated in sweet potato and Arabidopsis thaliana: BADH overexpression significantly elevated beet alkaloid accumulation and enhanced plant tolerance [49,50]. Notably, the expression of wheat BADH genes showed genotype- and stress-specific differences, such that the expression level and betaine accumulation of the BADH-A1b allele were significantly higher than that of BADH-A1a under salt and drought stress [51]. Through integrated RNA-Seq and RT-qPCR analyses, significant up-regulation of TraesCS2A02G336000 expression under drought stress was observed, with its abundance exceeding that of TraesCS2D02G326900, suggesting that these two BADH genes may synergistically enhance the osmotic adjustment capacity of wheat by differentially regulating the betaine synthesis pathway to form a drought-resistant and thus form a key molecular mechanism to resist drought stress.
Glyceraldehyde-3-phosphate dehydrogenase (GAPDH), as a core enzyme of the glycolytic pathway, is not only involved in glucose catabolism but also plays a regulatory function in plant abiotic stress response [52]. Studies have shown that GAPDH expression is significantly up-regulated under drought stress in Arabidopsis [53], and transcript expression of several GAPDH isoforms (especially TaGAPDH12) is significantly up-regulated under abiotic stresses (e.g., cold, heat, salt, drought) in wheat [54]. In upland cotton (Gossypium hirsutum L.), silencing of Gh_GAPDH9 exacerbated leaf wilting and plant death under drought stress, whereas its overexpression significantly improved drought tolerance [55]. In this study, the screened hub gene TraesCS7B02G213300 encodes GAPDH, and its rice homolog OsGAPDH was shown to respond to stress by enhancing glycolytic efficiency and salt tolerance, suggesting functional conservation of this gene in plant adversity adaptation [56]. In addition, the expression of this gene was predicted to be regulated by six drought-responsive transcription factors, among which the Y-B nuclear transcription factors TraesCS1A02G288500, TraesCS1B02G297900, and TraesCS1B02G442000 were hypothesized to play key regulatory roles. This hypothesis was supported by the functional role of soybean GmNF-YB17 in regulating drought response pathways [57]. Collectively, it is proposed that TraesCS7B02G213300 is regulated by a transcription factor network that coordinates sugar metabolism and stress signaling via GAPDH synthesis, highlighting its critical role in the drought stress response of wheat.
Cuticular waxes act as the first barrier against drought in plants and significantly enhance drought tolerance by reducing water evaporation [58,59]. In the model plant Arabidopsis thaliana, this process involves the synergistic regulation of more than 190 genes, with the key transcription factors AtMYB96/AtMYB94 enhancing adversity adaptation through activation of wax synthesis genes [60,61], whereas DEWAX2 exerts a negative regulatory role [62]. This mechanism is conserved in crops: wheat TaCER1-6A is involved in drought response through alkane synthesis [63]. In this study, transcriptome analysis revealed that differentially expressed genes were significantly enriched in the wax, cuticle, and cork synthesis pathways under drought stress, and identified the hub gene TraesCS1D02G208900, which is associated with wax synthesis. An in-depth analysis of its regulatory network identified four potential regulatory transcription factors, including TraesCS2D02G376600 (growth hormone response factor ARF8-like) and TraesCS6D02G162900 (MYB44-like). It has been shown that ARF family members have bidirectional regulatory properties in drought response: sweet potato ARF5 overexpression enhances drought tolerance by augmenting growth hormone signaling [64], whereas tomato ARF4 deficiency enhances drought resilience by unknown mechanisms [65]. For the MYB44 class of regulators, recent studies revealed that wheat TaMYB44-5A reduces drought tolerance by repressing the ABA signaling pathway gene TaRD22-3A [66], revealing the complexity of MYB family members in the regulation of wax synthesis. Based on the integrated evidence, it is hypothesized that the activation of the wax biosynthesis pathway is driven by TraesCS1D02G208900, mediated synergistically by transcription factors such as ARF8-like and MYB44-like.

5. Conclusions

Drought tolerance in wheat is a complex trait regulated by multiple genes, we used the O2PLS approach to jointly analyze the transcriptomics and metabolomics of BN 207 under drought stress, together with the WGCNA approach, to identify the important gene module MEbrown and the metabolite module Meta6, in which 5485 genes were included in the MEbrown module, along with 19 metabolite classes in the Meta6 module. Through further analysis, six Hub genes were identified that play important functions during drought stress, among them, TraesCS1D02G208900 belongs to the wax synthesis genes, TraesCS6A02G300400 and TraesCS6D02G280300 are calcium-binding protein genes (ANN), TraesCS2D02G326900 and TraesCS2A02G336000 encode betaine aldehyde dehydrogenase, TraesCS7B02G213300 encodes cytosolic glyceraldehyde-3-phosphate dehydrogenase (GAPDH). The wGRN database was further used to identify transcription factors that regulate Hub genes at multiple levels, and 20 drought-responsive transcription factors were identified and predicted to bind and regulate the expression of these six Hub genes. These findings provide valuable genetic resources for molecular breeding programs aimed at improving drought tolerance in wheat. The identified transcription factors, candidate genes, and metabolite modules could serve as targets for marker-assisted selection or genome editing to develop drought tolerance in wheat.

Supplementary Materials

The following supporting information can be downloaded at https://www.mdpi.com/article/10.3390/agronomy15040922/s1, Figure S1: Transcriptome analysis. (A) Correlation analysis of each sample. (B) Differential expression gene statistics; Table S1: Transcriptome sequencing data filtered for quality control and comparison information; Figure S2: GSEA enrichment analysis. (A) Enrichment analysis of GO pathway. (B) Enrichment analysis of KEGG pathway; Table S2: GO enrichment analysis of DEGs; Figure S3: Screening of high contribution metabolites and database annotation. (A) The clustering heatmap shows the distribution of cos2 values of all metabolites in each PC. (B) Classification and proportion of high contribution metabolites. (C) The annotation status of all metabolites in KEGG, HMDB, and LIPID MAPS databases; Table S3: KEGG enrichment analysis of DEGs; Figure S4: Module partitioning and construction based on the distribution pattern of metabolite content. (A) Unscaled topology fitting exponential graph, used to select the optimal soft threshold. (B) Cluster and correlation analysis of metabolite modules. (C) The content and category distribution of metabolites in the module; Table S4: GSEA enrichment analysis of the GO pathway; Figure S5: Construction of co-expressed gene modules. (A) Unscaled topology fitting exponential graph, used to select the optimal soft threshold. (B) Division and merging of gene module; Table S5: GSEA enrichment analysis of KEGG metabolic pathways; Figure S6: Load distribution map of the top 200 genes and metabolites with the highest contribution to inter group differences; Table S6: Comparison of known drought tolerance genes in rice with direct lineage homologs in wheat; Figure S7: Quantitative Real-Time PCR of 6 hub genes; Table S7: Metabolite characterization and quantification and database annotation; Table S8: cos2 values of metabolites in each principal; Table S9: Content of DAMs and analysis of variance; Table S10: KEGG enrichment analysis of DAMs; Table S11: DAMs known to be functional for drought tolerance; Table S12 Eigenvalues and significance p-values for; Table S13: Core gene screening and annotation in the Mebrown; Table S14: Prediction of regulatory networks for Hub genes; Table S15: RT-qPCR validation of genes and primer design.

Author Contributions

L.L.: Writing—original draft, conceptualization, formal analysis, investigation, data curation, writing—review and editing; C.Z.: conceptualization, investigation, resources, writing—review and editing; Y.M.: data curation, validation, formal analysis, writing—review and editing; L.C., J.L. and Q.S.: conceptualization, resources, methodology, writing—review and editing, supervision, funding acquisition; N.L., Y.Z., Z.C. and Y.H. (Yanju Huang): investigation, writing—review and editing; Y.H. (Yingang Hu), L.Z. and S.D.: writing—review and editing. All authors have read and agreed to the published version of the manuscript.

Funding

This work was financially supported by the Natural Science Basic Research Program of Shaanxi Province (2023-JC-ZD-08); ANSO Joint Research Cooperation Project (ANSO-CR-KP-2022-05); Shandong Province Key R&D Program Projects (2023TZXD005-01); National Natural Science Foundation of China (Grant Nos. 31501307; 31671695; 32171991); Henan Province Central Guided Local Science and Technology Development Funding Program (Z20231811144); Science and Technology Tackling in Henan Province (242102111149); Zhumadian City Science and Technology Innovation Youth Special Project (QNZX202320).

Data Availability Statement

The original contributions presented in this study are included in the article/Supplementary Materials. Further inquiries can be directed to the corresponding authors.

Acknowledgments

We gratefully acknowledge the farming work by students and temporary workers. We thank all those who helped with sample collection and processing.

Conflicts of Interest

The authors declare no conflicts of interest.

References

  1. Tadesse, W.; Sanchez-Garcia, M.; Assefa, S.G.; Amri, A.; Bishaw, Z.; Ogbonnaya, F.; Baum, M. Genetic gains in wheat breeding and its role in feeding the world. Crop Breed. Genet. Genom. 2019, 1, e190005. [Google Scholar] [CrossRef]
  2. Piao, S.L.; Ciais, P.; Huang, Y.; Shen, Z.H.; Peng, S.S.; Li, J.S.; Zhou, L.P.; Liu, H.Y.; Ma, Y.C.; Ding, Y.H.; et al. The impacts of climate change on water resources and agriculture in China. Nature 2010, 467, 43–51. [Google Scholar] [CrossRef] [PubMed]
  3. Curtis, T.; Halford, N.G. Food security: The challenge of increasing wheat yield and the importance of not compromising food safety. Ann. Appl. Biol. 2014, 164, 354–372. [Google Scholar] [CrossRef] [PubMed]
  4. International Wheat Genome Sequencing Consortium (IWGSC). Shifting the limits in wheat research and breeding using a fully annotated reference genome. Science 2018, 361, eaar7191. [Google Scholar] [CrossRef]
  5. Wang, Z.; Gerstein, M.; Snyder, M. RNA-Seq: A revolutionary tool for transcriptomics. Nat. Rev. Genet. 2009, 10, 57–63. [Google Scholar] [CrossRef]
  6. Nouraei, S.; Mia, M.S.; Liu, H.; Turner, N.C.; Yan, G. Transcriptome Analyses of Near Isogenic Lines Reveal Putative Drought Tolerance Controlling Genes in Wheat. Front. Plant Sci. 2022, 13, 857829. [Google Scholar] [CrossRef]
  7. Xi, W.; Hao, C.; Li, T.; Wang, H.; Zhang, X. Transcriptome Analysis of Roots from Wheat (Triticum aestivum L.) Varieties in Response to Drought Stress. Int. J. Mol. Sci. 2023, 24, 7245. [Google Scholar] [CrossRef]
  8. Ma, J.; Li, R.; Wang, H.; Li, D.; Wang, X.; Zhang, Y.; Zhen, W.; Duan, H.; Yan, G.; Li, Y. Transcriptomics Analyses Reveal Wheat Responses to Drought Stress during Reproductive Stages under Field Conditions. Front. Plant Sci. 2017, 8, 592. [Google Scholar] [CrossRef]
  9. Niu, Y.; Li, J.; Sun, F.; Song, T.; Han, B.; Liu, Z.; Su, P. Comparative transcriptome analysis reveals the key genes and pathways involved in drought stress response of two wheat (Triticum aestivum L.) varieties. Genomics 2023, 115, 110688. [Google Scholar] [CrossRef]
  10. Hall, R.D. Plant metabolomics in a nutshell: Potential and future challenges. In Biology of Plant Metabolomics; Blackwell: Oxford, UK, 2011; Volume 43, pp. 1–24. [Google Scholar] [CrossRef]
  11. Meena, K.K.; Sorty, A.M.; Bitla, U.M.; Choudhary, K.; Gupta, P.; Pareek, A.; Prabha, R.; Sahu, P.K.; Gupta, V.K. Abiotic stress responses and microbe-mediated mitigation in plants: The omics strategies. Front. Plant Sci. 2017, 8, 172. [Google Scholar] [CrossRef]
  12. Guo, X.; Xin, Z.; Yang, T.; Ma, X.; Zhang, Y.; Wang, Z.; Ren, Y.; Lin, T. Metabolomics Response for Drought Stress Tolerance in Chinese Wheat Genotypes (Triticum aestivum). Plants 2020, 9, 520. [Google Scholar] [CrossRef] [PubMed]
  13. Ullah, N.; Yüce, M.; Gökçe, Z.N.O.; Budak, H. Comparative metabolite profiling of drought stress in roots and leaves of seven Triticeae species. BMC Genom. 2017, 18, 969. [Google Scholar] [CrossRef]
  14. Guo, R.; Shi, L.; Jiao, Y.; Li, M.; Zhong, X.; Gu, F.; Liu, Q.; Xia, X.; Li, H. Metabolic responses to drought stress in the tissues of drought-tolerant and drought-sensitive wheat genotype seedlings. AoB Plants 2018, 10, ply016. [Google Scholar] [CrossRef]
  15. Kang, Z.; Babar, M.A.; Khan, N.; Guo, J.; Khan, J.; Islam, S.; Shrestha, S.; Shahi, D. Comparative metabolomic profiling in the roots and leaves in contrasting genotypes reveals complex mechanisms involved in post-anthesis drought tolerance in wheat. PLoS ONE 2019, 14, e0213502. [Google Scholar] [CrossRef]
  16. Bouhaddani, S.E.; Houwing-Duistermaat, J.; Salo, P.; Perola, M.; Jongbloed, G.; Uh, H.W. Evaluation of O2PLS in Omics data integration. BMC Bioinform. 2016, 17 (Suppl. S2), 11. [Google Scholar] [CrossRef]
  17. Bylesjö, M.; Eriksson, D.; Kusano, M.; Moritz, T.; Trygg, J. Data integration in plant biology: The O2PLS method for combined modeling of transcript and metabolite data. Plant J. 2007, 52, 1181–1191. [Google Scholar] [CrossRef]
  18. Szymanski, J.; Brotman, Y.; Willmitzer, L.; Cuadros-Inostroza, Á. Linking gene expression and membrane lipid composition of Arabidopsis. Plant Cell 2014, 26, 915–928. [Google Scholar] [CrossRef] [PubMed]
  19. Wang, J.; Tian, P.; Sun, J.; Li, B.; Jia, J.; Yuan, J.; Li, X.; Gu, S.; Pang, X. CsMYC2 is involved in the regulation of phenylpropanoid biosynthesis induced by trypsin in cucumber (Cucumis sativus) during storage. Plant Physiol. Biochem. 2023, 196, 65–74. [Google Scholar] [CrossRef] [PubMed]
  20. Zadoks, J.C.; Chang, T.T.; Konzak, C.F. A decimal code for the growth stages of cereals. Weed Res. 1974, 14, 415–421. [Google Scholar] [CrossRef]
  21. Chen, S.; Zhou, Y.; Chen, Y.; Gu, J. fastp: An ultra-fast all-in-one FASTQ preprocessor. Bioinformatics 2018, 34, i884–i890. [Google Scholar] [CrossRef]
  22. Pertea, M.; Pertea, G.M.; Antonescu, C.M.; Chang, T.C.; Mendell, J.T.; Salzberg, S.L. StringTie enables improved reconstruction of a transcriptome from RNA-seq reads. Nat. Biotechnol. 2015, 33, 290–295. [Google Scholar] [CrossRef] [PubMed]
  23. Mistry, J.; Chuguransky, S.; Williams, L.; Qureshi, M.; Salazar, G.A.; Sonnhammer, E.L.L.; Tosatto, S.C.; Paladin, L.; Raj, S.; Richardson, L.J.; et al. Pfam: The protein families database in 2021. Nucleic Acids Res. 2021, 49, D412–D419. [Google Scholar] [CrossRef] [PubMed]
  24. Liao, Y.; Smyth, G.K.; Shi, W. featureCounts: An efficient general purpose program for assigning sequence reads to genomic features. Bioinformatics 2014, 30, 923–930. [Google Scholar] [CrossRef]
  25. Love, M.I.; Huber, W.; Anders, S. Moderated estimation of fold change and dispersion for RNA-seq data with DESeq2. Genome Biol. 2014, 15, 550. [Google Scholar] [CrossRef]
  26. Chen, C.; Chen, H.; Zhang, Y.; Thomas, H.R.; Frank, M.H.; He, Y.H.; Xia, R. TBtools: An integrative toolkit developed for interactive analyses of big biological data. Mol. Plant 2020, 13, 1194–1202. [Google Scholar] [CrossRef]
  27. Yu, G.; Wang, L.G.; Han, Y.; He, Q.Y. clusterProfiler: An R package for comparing biological themes among gene clusters. OMICS 2012, 16, 284–287. [Google Scholar] [CrossRef]
  28. Subramanian, A.; Tamayo, P.; Mootha, V.K.; Mukherjee, S.; Ebert, B.L.; Gillette, M.A.; Paulovich, A.; Pomeroy, S.L.; Golub, T.R.; Lander, E.S.; et al. Gene set enrichment analysis: A knowledge-based approach for interpreting genome-wide expression profiles. Proc. Natl. Acad. Sci. USA 2005, 102, 15545–15550. [Google Scholar] [CrossRef] [PubMed]
  29. Wen, B.; Mei, Z.; Zeng, C.; Liu, S. metaX: A flexible and comprehensive software for processing metabolomics data. BMC Bioinform. 2017, 18, 183. [Google Scholar] [CrossRef] [PubMed]
  30. Shannon, P.; Markiel, A.; Ozier, O.; Baliga, N.S.; Wang, J.T.; Ramage, D.; Amin, N.; Schwikowski, B.; Ideker, T. Cytoscape: A software environment for integrated models of biomolecular interaction networks. Genome Res. 2003, 13, 2498–2504. [Google Scholar] [CrossRef]
  31. Ebeed, H.T.; Stevenson, S.R.; Cuming, A.C.; Baker, A. Conserved and differential transcriptional responses of peroxisome associated pathways to drought, dehydration and ABA. J. Exp. Bot. 2018, 69, 4971–4985. [Google Scholar] [CrossRef]
  32. Nxele, X.; Klein, A.; Ndimba, B.K. Drought and salinity stress alters ROS accumulation, water retention, and osmolyte content in sorghum plants. S. Afr. J. Bot. 2017, 108, 261–266. [Google Scholar] [CrossRef]
  33. Varoquaux, N.; Cole, B.; Gao, C.; Pierroz, G.; Baker, C.R.; Patel, D.; Madera, M.; Jeffers, T.; Hollingsworth, J.; Sievert, J.; et al. Transcriptomic analysis of field-droughted sorghum from seedling to maturity reveals biotic and metabolic responses. Proc. Natl. Acad. Sci. USA 2019, 116, 27124–27132. [Google Scholar] [CrossRef]
  34. Xiong, H.; Yu, J.; Miao, J.; Li, J.; Zhang, H.; Wang, X.; Liu, P.; Zhao, Y.; Jiang, C.; Yin, Z.; et al. Natural variation in OsLG3 increases drought tolerance in rice by inducing ROS scavenging. Plant Physiol. 2018, 178, 451–467. [Google Scholar] [CrossRef]
  35. Ijaz, R.; Ejaz, J.; Gao, S.; Liu, T.; Imtiaz, M.; Ye, Z.; Wang, T. Overexpression of Annexin gene AnnSp2, enhances drought and salt tolerance through modulation of ABA synthesis and scavenging ROS in tomato. Sci. Rep. 2017, 7, 12087. [Google Scholar] [CrossRef]
  36. Anjum, S.A.; Ashraf, U.; Tanveer, M.; Khan, I.; Hussain, S.; Shahzad, B.; Zohaib, A.; Abbas, F.; Saleem, M.F.; Ali, I.; et al. Drought induced changes in growth, osmolyte accumulation and antioxidant metabolism of three maize hybrids. Front. Plant Sci. 2017, 8, 69. [Google Scholar] [CrossRef]
  37. Qiao, B.; Zhang, Q.; Liu, D.; Wang, H.; Yin, J.; Wang, R.; He, M.; Cui, M.; Shang, Z.; Wang, D.; et al. A calcium-binding protein, rice annexin OsANN1, enhances heat stress tolerance by modulating the production of H2O2. J. Exp. Bot. 2015, 66, 5853–5866. [Google Scholar] [CrossRef]
  38. Jia, Y.; Gu, X.; Chai, J.; Yao, X.; Cheng, S.; Liu, L.; He, S.; Peng, Y.; Zhang, Q.; Zhu, Z. Rice OsANN9 enhances drought tolerance through modulating ROS scavenging systems. Int. J. Mol. Sci. 2023, 24, 17495. [Google Scholar] [CrossRef] [PubMed]
  39. Cheng, H.; Pan, G.; Zhou, N.; Zhai, Z.; Yang, L.; Zhu, H.; Cui, X.; Zhao, P.; Zhang, H.; Li, S.; et al. Calcium-dependent protein kinase 5 (CPK5) positively modulates drought tolerance through phosphorylating ABA-responsive element binding factors in oilseed rape (Brassica napus L.). Plant Sci. 2022, 315, 111125. [Google Scholar] [CrossRef] [PubMed]
  40. Joo, H.; Lim, C.W.; Lee, S.C. Roles of pepper bZIP transcription factor CaATBZ1 and its interacting partner RING-type E3 ligase CaASRF1 in modulation of ABA signalling and drought tolerance. Plant J. 2019, 100, 399–410. [Google Scholar] [CrossRef]
  41. Pan, Y.; Hu, X.; Li, C.; Xu, X.; Su, C.; Li, J.; Song, H.; Zhang, X.; Pan, Y. SlbZIP38, a tomato bZIP family gene downregulated by abscisic acid, is a negative regulator of drought and salt stress tolerance. Genes 2017, 8, 402. [Google Scholar] [CrossRef]
  42. Gulzar, F.; Fu, J.; Zhu, C.; Yan, J.; Li, X.; Meraj, T.A.; Shen, Q.; Hassan, B.; Wang, Q. Maize WRKY transcription factor ZmWRKY79 positively regulates drought tolerance through elevating ABA biosynthesis. Int. J. Mol. Sci. 2021, 22, 10080. [Google Scholar] [CrossRef] [PubMed]
  43. Yu, Y.; He, L.; Wu, Y. Wheat WRKY transcription factor TaWRKY24 confers drought and salt tolerance in transgenic plants. Plant Physiol. Biochem. 2023, 205, 108137. [Google Scholar] [CrossRef]
  44. Liang, Y.; Ma, F.; Li, B.; Guo, C.; Hu, T.; Zhang, M.; Liang, Y.; Zhu, J.; Zhan, X. A bHLH transcription factor, SlbHLH96, promotes drought tolerance in tomato. Hortic. Res. 2022, 9, uhac198. [Google Scholar] [CrossRef]
  45. Li, C.; Yan, C.; Sun, Q.; Wang, J.; Yuan, C.; Mou, Y.; Shan, S.; Zhao, X. The bHLH transcription factor AhbHLH112 improves the drought tolerance of peanut. BMC Plant Biol. 2021, 21, 540. [Google Scholar] [CrossRef]
  46. Gao, S.S.; Wang, Y.L.; Yu, S.; Huang, Y.Q.; Liu, H.C.; Chen, W.; He, X.Y. Effects of drought stress on growth, physiology and secondary metabolites of two Adonis species in Northeast China. Sci. Hortic. 2020, 259, 108855. [Google Scholar] [CrossRef]
  47. Weretilnyk, E.A.; Hanson, A.D. Molecular cloning of a plant betaine-aldehyde dehydrogenase, an enzyme implicated in adaptation to salinity and drought. Proc. Natl. Acad. Sci. USA 1990, 87, 2745–2749. [Google Scholar] [CrossRef]
  48. Tang, W.; Sun, J.; Liu, J.; Liu, F.; Yan, J.; Gou, X.; Lu, B.R.; Liu, Y. RNAi-directed downregulation of betaine aldehyde dehydrogenase 1 (OsBADH1) results in decreased stress tolerance and increased oxidative markers without affecting glycine betaine biosynthesis in rice (Oryza sativa). Plant Mol. Biol. 2014, 86, 443–454. [Google Scholar] [CrossRef] [PubMed]
  49. Fan, W.J.; Zhang, M.; Zhang, H.X.; Zhang, P. Improved tolerance to various abiotic stresses in transgenic sweet potato (Ipomoea batatas) expressing spinach betaine aldehyde dehydrogenase. PLoS ONE 2012, 7, e37344. [Google Scholar] [CrossRef]
  50. Yang, C.L.; Zhou, Y.; Fan, J.; Fu, Y.H.; Shen, L.B.; Yao, Y.; Li, R.; Fu, S.; Duan, R.; Hu, X.; et al. SpBADH of the halophyte Sesuvium portulacastrum strongly confers drought tolerance through ROS scavenging in transgenic Arabidopsis. Plant Physiol. Biochem. 2015, 96, 377–387. [Google Scholar] [CrossRef]
  51. Yu, M.; Yu, Y.; Guo, S.; Zhang, M.; Li, N.; Zhang, S.; Zhou, H.; Wei, F.; Song, T.; Cheng, J.; et al. Identification of TaBADH-A1 allele for improving drought resistance and salt tolerance in wheat (Triticum aestivum L.). Front. Plant Sci. 2022, 13, 942359. [Google Scholar] [CrossRef]
  52. Ranjbar, M.; Khakdan, F.; Ghorbani, A.; Zargar, M.; Chen, M. The variations in gene expression of GAPDH in Ocimum basilicum cultivars under drought-induced stress conditions. Environ. Sci. Pollut. Res. 2023, 30, 119187–119203. [Google Scholar] [CrossRef]
  53. Zhang, L.; Zhang, H.; Yang, S. Cytosolic TaGAPC2 enhances tolerance to drought stress in transgenic Arabidopsis plants. Int. J. Mol. Sci. 2020, 21, 7499. [Google Scholar] [CrossRef]
  54. Zeng, L.; Deng, R.; Guo, Z.; Yang, S.; Deng, X. Genome-wide identification and characterization of glyceraldehyde-3-phosphate dehydrogenase genes family in wheat (Triticum aestivum). BMC Genom. 2016, 17, 240. [Google Scholar] [CrossRef]
  55. Geng, S.; Li, S.; Zhao, J.; Gao, W.; Chen, Q.; Zheng, K.; Wang, Y.; Jiao, Y.; Long, Y.; Liu, P.; et al. Glyceraldehyde-3-phosphate dehydrogenase Gh_GAPDH9 is associated with drought resistance in Gossypium hirsutum. PeerJ 2023, 11, e16445. [Google Scholar] [CrossRef] [PubMed]
  56. Zhang, X.H.; Rao, X.L.; Shi, H.T.; Li, R.J.; Lu, Y.T. Overexpression of a cytosolic glyceraldehyde-3-phosphate dehydrogenase gene OsGAPC3 confers salt tolerance in rice. Plant Cell Tissue Organ Cult. 2011, 107, 1–11. [Google Scholar] [CrossRef]
  57. Sun, M.; Li, Y.; Zheng, J.; Wu, D.; Li, C.; Li, Z.; Zang, Z.; Zhang, Y.; Fang, Q.; Li, W.; et al. A Nuclear Factor Y-B Transcription Factor, GmNFYB17, Regulates Resistance to Drought Stress in Soybean. Int. J. Mol. Sci. 2022, 23, 7242. [Google Scholar] [CrossRef] [PubMed]
  58. Xue, D.; Zhang, X.; Lu, X.; Chen, G.; Chen, Z.H. Molecular and evolutionary mechanisms of cuticular wax for plant drought tolerance. Front. Plant Sci. 2017, 8, 621. [Google Scholar] [CrossRef]
  59. Patwari, P.; Salewski, V.; Gutbrod, K.; Kreszies, T.; Dresen-Scholz, B.; Peisker, H.; Steiner, U.; Meyer, A.J.; Schreiber, L.; Dörmann, P. Surface wax esters contribute to drought tolerance in Arabidopsis. Plant J. 2019, 98, 727–744. [Google Scholar] [CrossRef]
  60. Seo, P.J.; Lee, S.B.; Suh, M.C.; Park, M.J.; Go, Y.S.; Park, C.M. The MYB96 transcription factor regulates cuticular wax biosynthesis under drought conditions in Arabidopsis. Plant Cell 2011, 23, 1138–1152. [Google Scholar] [CrossRef]
  61. Lee, S.B.; Kim, H.U.; Suh, M.C. MYB94 and MYB96 additively activate cuticular wax biosynthesis in Arabidopsis. Plant Cell Physiol. 2016, 57, 2300–2311. [Google Scholar] [CrossRef]
  62. Kim, H.; Chung, M.S.; Yoo, S. DEWAX2 transcription factor negatively regulates cuticular wax biosynthesis in Arabidopsis leaves. Plant Cell Physiol. 2018, 59, 966–977. [Google Scholar] [CrossRef] [PubMed]
  63. He, J.; Li, C.; Hu, N.; Zhu, Y.; He, Z.; Sun, Y.; Wang, Z.; Wang, Y. ECERIFERUM1-6A is required for the synthesis of cuticular wax alkanes and promotes drought tolerance in wheat. Plant Physiol. 2022, 190, 1640–1657. [Google Scholar] [CrossRef] [PubMed]
  64. Kang, C.; He, S.; Zhai, H.; Li, R.; Zhao, N.; Liu, Q. A sweet potato auxin response factor gene (IbARF5) is involved in carotenoid biosynthesis and salt and drought tolerance in transgenic Arabidopsis. Front. Plant Sci. 2018, 9, 1307. [Google Scholar] [CrossRef]
  65. Chen, M.; Zhu, X.; Liu, X.; Wu, C.; Yu, C.; Hu, G.; Chen, L.; Chen, R.; Bouzayen, M.; Zouine, M.; et al. Knockout of auxin response factor SlARF4 improves tomato resistance to water deficit. Int. J. Mol. Sci. 2021, 22, 3347. [Google Scholar] [CrossRef] [PubMed]
  66. Peng, D.; Li, L.; Wei, A.; Zhou, L.; Wang, B.; Liu, M.; Lei, Y.; Xie, Y.; Li, X. TaMYB44-5A reduces drought tolerance by repressing transcription of TaRD22-3A in the abscisic acid signaling pathway. Planta 2024, 260, 52. [Google Scholar] [CrossRef]
Figure 1. Transcriptomic profiling of drought-stressed wheat seedlings. (A) Principal component analysis (PCA) of RNA-Seq samples (n = 3 per group) showing a clear separation between control (yellow) and drought-treated (purple) groups. The first two principal components (PC1 and PC2) explained 63.8% of the total variance. (B) Hierarchical clustering heatmap of 12,930 drought-responsive genes (|log2FC| ≥ 1, padj ≤ 0.05). Color intensity indicates normalized expression levels. (C) Gene Ontology (GO) enrichment analysis of differentially expressed genes. Top 20 significantly enriched biological processes (Padj ≤ 0.05) are shown. (D) Kyoto Encyclopedia of Genes and Genomes (KEGG) pathway enrichment. Top 20 significantly enriched biological processes are shown, and 17 of these pathways were significantly enriched (Padj ≤ 0.05).
Agronomy 15 00922 g001
Figure 2. Comparison and functional analysis of known functional genes in rice in wheat. (A) The collinearity relationship between known functional genes in rice and homologous genes in wheat. For ease of display, the rice genome was expanded tenfold. (B) Expression patterns of homologous DEGs in wheat in CK and T group samples. (C) Functional enrichment analysis of homologous DEGs in wheat.
Agronomy 15 00922 g002
Figure 3. Class-targeted metabolomics analysis of excellent drought-resistant varieties. (A) Correlation analysis between experimental samples and QC samples. (B) PCA. (C) Primary and secondary classification of metabolites, with the inner circle representing the primary classification and the annotation shown in the legend (class 1 of metabolites), and the outer circle representing the secondary classification annotation. Use line segments to connect the annotation name, proportion, and color block.
Agronomy 15 00922 g003
Figure 4. Functional Analysis of DAMs. (A) Volcano plot of accumulated differences in metabolite content. (B) KEGG enrichment analysis of DAMs. (C) The content distribution spectrum of drought-resistant DAMs.
Agronomy 15 00922 g004
Figure 5. Construction of co-expressed gene modules and Establishment of a correlation network between genes and metabolites based on the O2PLS method. (A) Gene metabolite module correlation analysis. (B) A correlation network diagram containing 95 genes and 197 metabolites. Circular nodes represent metabolites, while triangular nodes represent genes. The color of metabolite nodes is represented by the color of species, while the color of gene nodes is represented by the color of co-expression modules. The color of the connecting line is the positive (blue) or negative (red) correlation coefficient between genes and metabolites.
Agronomy 15 00922 g005
Figure 6. Construction of MEbrown module gene co-expression network and Hub gene screening and analysis. (A) The gene co-expression network with the top 100 values of |KME| is represented by circular nodes and the node color is displayed by the size of the |KME| value. The node size is directly proportional to the connectivity of the gene in the network. (B) The regulatory network of Hub genes is represented by circular and diamond nodes, respectively, representing Hub genes and transcription factors. Line segments represent regulatory effects, and different line segment colors represent the basis for this regulatory effect at multiple levels. The annotations are the same as Table S14.
Agronomy 15 00922 g006
Disclaimer/Publisher’s Note: The statements, opinions and data contained in all publications are solely those of the individual author(s) and contributor(s) and not of MDPI and/or the editor(s). MDPI and/or the editor(s) disclaim responsibility for any injury to people or property resulting from any ideas, methods, instructions or products referred to in the content.

