Abstract
Temperature changes strongly affect apple development and quality. In this study, we analyze the relationships between the main factors modulating both of the aforementioned processes in the fruits of four apple cultivars. We assessed three-dimensional data concerning the expression profile (fold change) of eight genes related to fruit ripeness regulation (involved in the cell respiration process and sorbitol metabolism as well as encoding cell kinase receptors) and fruit parameters such as fruit weight, ethylene concentration, concentration of soluble solids and acidity, which are affected by seasonal temperature variations (2018–2020). We observed that low temperatures (before the apple ripening phase) promoted an increase in gene activity and improved the fruit quality of the following cultivars: early-flowering/mid-ripening ‘Pink Braeburn’ and ‘Pinokio’, early-flowering/late-ripening ‘Ligol’ and late-flowering/late-ripening ‘Ligolina’. We confirmed the positive effect of low temperatures on the activity of the AAAA1, AALA1, StG and AAXA genes and on the evaluated fruit quality parameters, and we confirmed their dependence on the genotype of the studied cultivars. The obtained results shed light on the complexity of the variability mechanism in fruit features and fruit harvest dates. This knowledge may improve breeding programs for the production of better-quality apples.
1. Introduction
Seasonal temperature changes have a huge impact on plant yield and fruit development and influence the variability of fruit features accepted by consumers. Global climate change is leading to unusual weather conditions, including temperature fluctuations and annual average temperature increases [1]. In the period of 2000–2020, worldwide temperatures increased by approximately 2 °C and showed rising trends in subsequent seasons (source: GUS, available at https://300gospodarka.pl/ (accessed on 29 January 2020)) [2]. Many authors have explained that based on the temperature values in a particular growing season, it is possible to assess fruit quality and fruit yield and determine the optimal date for fruit harvesting [3,4,5]. High temperatures have been shown to induce plant heat stress, affecting crucial growth stages, reducing photosynthesis and hampering plant development [6]. Low temperatures, especially in the apple blooming phase, may also result in serious damage to plant organs and reduce plant fruit expansion [7,8].
Apple (Malus domestica Borkh.) is one of the most economically important fruit tree species grown worldwide. Apple fruits have many benefits for human health and are a consumer favorite [9,10,11], with most being crunchy, juicy, sweet and rich in vitamins, dietary fiber, polyphenols and minerals [12]. Their quality is determined by a number of individual features, most of which are controlled by many primary genes and by minor polygenes or oligogenes [13,14,15]. Long-term evolution, gene recombination and natural mutations have resulted in a high level of heterozygosity in the genome of this species [16]. Additionally, targeted selection and the influence of non-additive genetic effects contributed to the increase in the genome variability of apples, as expressed in their phenotypic diversity [17].
The average number of days from flowering until harvest and temperature conditions seem to be the greatest factors impacting apple phenophases [18,19]. The methods of calculating degree-day accumulation or the sum of active temperatures in this precise period are also successfully used to predict the accumulation of desired substances like anthocyanins or sugars [5,20,21]. The phenological phases of fruit development in plants growing in temperate regions strongly depend on temperature conditions, especially during winter and spring [22,23], even though the selection of an appropriate onset of temperature calculation is disputable [24]. Fruit organ growth also depends on temperature accumulation from the flowering to fruit maturity period and can be stimulated by a fixed number of degree days, which facilitates the comparison of different evaluated seasons and locations [4].
The process of apple fruit development is well recognized and includes the early period, in which intensive cell division and tissue expansion predominate (up to 70 days after full bloom); the maturation stage (lasting from 90 to approximately 150 days after full bloom), when the fruits possesses the prerequisites for use by consumers; and finally the ripening stage, an irreversible stage in which the fruits reach collective maturity [19].
Based on a global microarray analysis, Jansen et al. 2008 discovered that four major patterns of coordinated gene expression occurred in different fruit developmental stages. The first group was represented by genes expressed in floral buds but down-regulated throughout fruit developmental stages; the second group of genes was up-regulated in the early fruit developmental stage and down-regulated later, and two additional groups of genes were defined as up-regulated during the middle stages of fruit development and during ripening [19].
This knowledge underlines the complexity of apple fruit development regulated by many genes, and their activity may vary according to external (environmental) factors. In this context, temperature fluctuations seem to be pivotal in the formation of fruit phenotypical attributes [8]
Thanks to the development of omics technologies, such as genomics, transcriptomics, proteomics, metabolomics and phenomics, as well as genome-wide associated studies (GWASs), metabolic GWASs and structural analyses of variability, which are supported by molecular markers and other molecular technologies, significant progress in the genetic research of fruit plant characteristics has been achieved. Despite the long juvenile phase occurring in woody species, such as apple, hampering the application of molecular tools in genotype–phenotype assessments, specific molecular markers (e.g., functional markers) are requested by breeders to improve the marker-assisted selection of apples with better fruit quality breeding materials [25].
This study aimed to fill the knowledge gap in understanding the apple fruit ripening mechanism modulated by seasonal temperature changes, thereby also explaining the environmental influence of these changes on the activity of selected genes of interest, which has so far not been characterized. We expect the uncovered sequences may contribute to the development of functional molecular markers, which could be applied to monitor the fruit ripening process of selected apple cultivars grown in changing climatic conditions.
2. Materials and Methods
2.1. Plant Material
For quality and maturity assessments, fruits of four winter apple cultivars (early-flowering and mid-ripening ‘Pink Braeburn’ and ‘Pinokio’, early-flowering but late-ripening ‘Ligol’, and late-flowering and late-ripening ‘Ligolina’ (both suitable for long-term storage)) were collected in three subsequent seasons (2018, 2019 and 2020) and at approximately five-day intervals: 135 (I), 140 (II), 145 (III) and 150 (IV) after full bloom (DAFB). Even though all varieties are considered winter apples, they significantly differ in flowering time and the time of reaching physiological maturity. The picking time points were chosen according to FB dates for the ‘Ligol’ cultivar, classified as early-flowering (Table 1).

Table 1.
Fruit collection dates. ‘Ligol’ is considered a cultivar representing the long-term period of fruit ripening (reference), and the dates of its full bloom are presented in bold.
Fruits were harvested at the same time intervals for all cultivars to avoid a potential disequilibrium in their developmental stage. Due to the optimum harvest date (OHD), and for research purposes, the cultivars were classified into groups: early-ripening (‘Ligol’), mid-ripening (‘Pink Braeburn’ and ‘Pinokio’) and late-ripening (‘Ligolina’).
In parallel, the material from the same set of fruits dedicated for molecular analysis (fruit flesh disks with a diameter of 2 cm, cut from 3 fruits/repetitions) was collected in the orchard directly into liquid nitrogen, transported to the laboratory and stored at −80 °C.
2.2. Fruit Maturity and Quality Assessment
Ten fruits from each apple genotype were picked at the same development periods for instrumental measurements of phenotypic features.
The fruit weight, internal ethylene concentration (IEC), total soluble solid (TSS) content, titratable acidity (TA) and flesh firmness (FF) were measured for individual collected apple fruit.
The fruit weight, expressed in grams (g), was measured using a WPS 2100/C/2 balance (Radwag, Radom, Poland).
For internal ethylene concentration (IEC), a 1 mL gas sample was taken from the apple core and injected into a gas chromatograph HP 5890 II (Hewlett Packard, USA) with a flame ionization detector (FID). The chromatograph was equipped with a glass column 6 mm in diameter and 1200 mm long, filled with aluminum oxide (Alumina F-1, 60/80 mesh). The results were expressed in µL/L (ppm).
Flesh firmness was measured on two opposite sides of the fruit using a Zwick Roell Z010 (Zwick Roell, Ulm, Germany) equipped with a Magness-Taylor 11.1 mm probe. The results were expressed in (N).
The total soluble solid (TSS) content was measured in fresh fruit juice samples (prepared for individual fruit) with a digital refractometer Atago PR-101 (Atago Co., Ltd., Tokyo, Japan) and expressed as %.
The titratable acidity (TA) was measured with an automatic titrator DL 50 (Mettler-Tolledo, Greifensee, Switzerland), using the standard titration method (0.1 N NaOH to the endpoint pH = 8.1). The results were expressed as % of malic acid.
2.3. Molecular Assessment
2.3.1. RNA Isolation and Reverse Transcription
RNA was isolated from a total of 12 fruits of the above-mentioned (2.1) apple cultivars, according to the method described by Zeng and Yang [26]. Fruit flesh tissue, ground in liquid nitrogen, was incubated for 20 min. (65 °C) in an extraction buffer (CTAB). After centrifuging the samples in a mixture of chloroform and isoamyl alcohol (24:1, v/v), RNA molecules were collected from the upper fraction and precipitated with 10 M LiCl2 (overnight incubation, 4 °C). Finally, the centrifuged RNA preparations were dissolved in RNAse-free water (DEPC). The quality, degree of integration and concentration of the RNA preparations were assessed via micro-flow electrophoresis using an Agilent 2100 Bioanalyzer (Perlan Technologies, Beaverton, OA, USA) and the Expert 2100 software program.
High-quality RNA samples (1 µg) were reverse-transcribed into stable cDNA using the cDNA Synthesis Kit Affinity Script QPCR (Agilent, Santa Clara, CA, USA). The reaction was performed with the universal oligo-dT primer (0.1 µg/µL) and the reverse transcriptase (RT) under optimized thermal conditions: 25 °C/5 min.; 42 °C/5 min.—oligo-dT annealing; 55 °C/15 min.—RT; 95 °C/5 min.—enzyme inactivation (Biometra Basic thermocycler). The stable cDNA was then used as a template for quantitative amplification reaction (qPCR).
2.3.2. Selection of Genes of Interest (GOI)
In this study, based on available databases, we have chosen so-far uncharacterized gene sequences recognized in ‘Royal Gala’ genome libraries, within the project by The Horticulture and Food Research Institute of New Zealand, and submitted in the NCBI database (https://www.ncbi.nlm.nih.gov/ (accessed on 8 March 2018)) in 2004 and published by Newcomb in 2006 [27]. The names of the genes, recognized as significantly activated in different apple fruit tissues, were assigned sequencing library ‘Royal Gala’ codes (Figure 1).
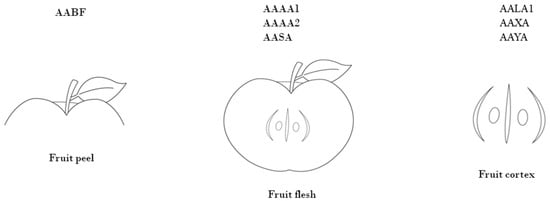
Figure 1.
The source of genes of interest known to be activated 10, 59, 126 and 150 DAFB (discovered in the apple EST library).
The genes of interest were not yet characterized, and the data recovery sequences were blasted against the NCBI database (https://blast.ncbi.nlm.nih.gov, accessed on 17 March 2025). The roles of the sequences were defined based on the sequence revealing perfect matches on the Malus genome functional annotations.
The selected genes were described as encoding protein receptors of kinases, transcription factors and proteins involved in general sorbitol metabolic pathways (Table 2).
Table 2.
‘Royal Gala’ library code, putative function and localization of selected genes of interest (GOI) and designed oligonucleotides complementary to their mRNA sequence.
As a structural gene known to be involved in starch degradation pathway in apple fruit flesh, we selected StG encoding starch glucosidase. Based on our previous research, StG was recognized as valuable functional molecular marker for apple fruit harvest date prediction [12].
Specific oligonucleotides complementary to the sequences of selected genes were designed using the Primer 3 PRO software package, https://www.primer3plus.com/index.html (accessed on 21 April 2018). The acronyms of selected genes, gene functions and sequences of the designed oligonucleotides used in the study are listed in Table 2.
2.3.3. qPCR Tests and Data Analysis
QPCR tests were performed using Kapa SYBR qPCR kit (KapaBiosystems, Wilmington, MA, USA) in Rotor Gen 6000 thermal cycler (Corbett Research, Vienna, Austria). In each experimental setup, two pairs of specific oligos complementary to the sequence of evaluated genes and the reference Md18sRNA gene (stable in the experimental layout) were used in analogous reactions. The cDNA template was prepared in dilutions of known concentrations, enabling the calculation of a standard amplification curve. The thermal profile of the qPCR reaction was 95 °C for 5 min. (polymerase activation), and then 35 cycles were completed, including the following steps: 95 °C for 15 s (denaturation), 60 °C for 20 s (oligonucleotide annealing) and 72 °C for 20 s (detection of fluorescence level). The relative expression (fold change) normalized in relation to the reference gene was determined based on single data points derived from real-time PCR amplification curve threshold cycles (Ct values) (2−∆∆Ct method described by Livak and Schmittgen [28]). For this purpose, Rotor-Gene 6000 Series Software 1.7 was used (Corbett Research Pty. Ltd. (Sydney, Australia)).
The data of relative gene fold changes were visualized with the GraphPad Prism 10.0.3 software package. The presented diagrams show relative fold changes in the number of gene transcripts with a standard error (±SEM) at the significance of p-value: p < 0.05 *, 0.01 **, 0.001 ***.
2.4. Statistical Analyses
The effects of weather temperature changes observed for the evaluated seasons (2018–2020) regarding the gene expression activity and fruit evaluated features are presented as volcano charts, exhibiting the level of significance [Log(p-value)], with a standard error of the mean (±SEM) of the variables. For the analysis, each evaluated season was divided into three time periods based on average temperatures: from the beginning of February to the end of April (average temperature ranges between −1.6 and 14.9 °C), from the beginning of May to the end of July (average temperature ranges between 14.9 and 17.7 °C) and from the beginning of August until the harvest (the latest fruit harvest date—7 October) (temperature ranges between 17.7 and 19.4 °C) (Supplementary Table S1).
The relationships between gene expression and temperature changes were determined using the two-stage Benjamini linear increase procedure and Krieger and Yekutieli with Q = 1%. Each row of data was analyzed individually, without assuming a consistent standard deviation (SD) with the t-test significance level at p < 0.05 *, 0.01 ** and 0.001 ***.
The weather (meteo) data were collected from three consecutive seasons (2018, 2019 and 2020) from the METOS station, by Pessl Instruments, localized in Skierniewice, Poland, in the orchard where the evaluated apple cultivars grow. The climatograph of the seasonal temperature changes and the seasonal temperature distribution chart are presented in Supplementary Figure S1a,b.
The linear regression analysis was performed to evaluate the mean differences for monthly temperature changes within the years of fruit evaluation. An analysis of variance is presented as the Sum of Squares (SS) = variation (lower SS ratio = higher variation), Mean Square (MS) and F ratio of two independent chi-squared variables—representing the variation between the sample means and within the seasons.
To evaluate the relationships between the number of gene transcripts and the values of evaluated fruit features, the coefficient of determination ratio, using R2 test with the significance of p < p > 0.05 (*), 0.01 (**), 0.001 (***) and 0.0001 (****) was calculated. The correlation plots were constructed using GraphPad Prism 10.0.3 software.
3. Results
3.1. Changes in Relative Gene Expression in Different Stages of Apple Fruit Ripening
For the ‘Pink Braeburn’, considered a mid-ripening cultivar in our study, significantly high levels of AALA1 (unknown role), AAAA2 (encoding cell kinase), AAYA (responsible for cell photorespiration) and StG gene expression were recorded in fruits collected 135 days (I) after full bloom. In the fruits harvested 5 days later (II), significant activity of the AAAA1, AAFB, AAXA (encoding general cell kinases) and AASA (responsible for fructose and mannose metabolism) genes and a continuation of the activity of AAAA2 (transcription factor), AAYA (cell photorespiration) and StG (starch glucosidase) genes were recorded. A decrease in the activity of five selected genes (excluding AAAA2, AAYA and StG) was then noted in the fruits collected 145 (III) and 150 (IV) DAFB (Figure 2, Supplementary Figure S2). Despite the significant variation in the activity of all genes analyzed in the study in the ‘Pink Braeburn’ fruits, the high level of the transcript of AAYA (cell respiration) and STG was maintained until the harvest maturity stage.
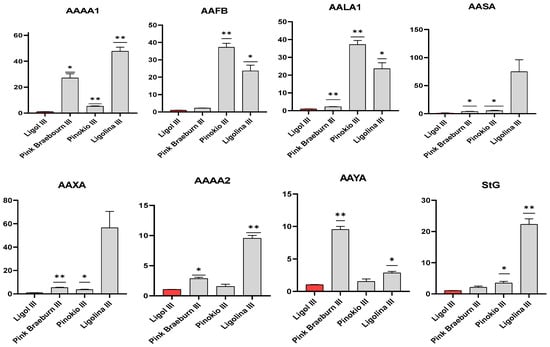
Figure 2.
Expression profiles of the studied GOI for the fruit full maturity date (III) of four apple cultivars. Diagrams present average relative gene expression data with standard error of the cultivar mean (±SEM) compared to long-ripening ‘Ligol’ cv (presented in red) and t-test significance calculation level at p < 0.05 *, 0.01 **, normalized to Md18sRNA gene (showing stable expression in the experiment layout). The relative expression of genes of interest was calculated using mathematical equation 2−∆∆Ct (RotorGene 6000 Series 1.7 software package) and visualized with the GraphPad Prism10.0.3 software package.
When analyzing the fruits of ‘Pinokio’ (here also considered a mid-ripening cultivar), collected in the ripening stage (IV), we noted a high activity of all tested genes. Similarly to ‘Pink Braeburn’, a significantly high level of AAAA2 (transcription factor), AALA1 (unknown), AAYA (cell respiration) and StG gene activity was also observed in the fruits of this cultivar collected 140 (II) DAFB. Meanwhile, in comparison to ‘Ligol’ (reference early-ripening cultivar), the AAFB gene (encoding cell kinase receptor protein) was significantly overexpressed in ‘Pinokio’ fruits, collected 140 (II) DAFB.
Compared to the reference ‘Ligol’, in fruit samples classified as late-ripening ‘Ligolina’ (both belong to the same sibling family derived from the ‘Linda’ and ‘Golden Delicious’ cross-pollination), collected 135 (I) DAFB, significantly high expression levels of the AAAA1, AAXA (both encoding kinases proteins), AASA (mannose 6-phosphatase), AAYA (cell respiration) and StG genes were calculated. Moreover, the overexpression of AAFB (kinase protein), AALA1 (unknown) and StG genes was observed in immature fruits of this cultivar collected 140 (II) DAFB. The early activation of those genes could be a result of the initiation of their transcription in the fruit peel and the fruit core, and the genes remained overexpressed for a much longer period in the fruits of mid- and late-ripening varieties. For ‘Pinokio’ and ‘Ligolina’, all analyzed genes were significantly up-regulated in immature (a few days before fruit full maturity, 145 DAFB, Figure 2) and ripe fruits (150 DAFB) (Supplementary Figure S2). Examples of gene expression profiles at the time of full fruit maturity are shown in Figure 2.
3.2. Relationship Between the Temperature Variations in Evaluated Growing Seasons
Average temperatures collected from the weather station showed small but significant variance between evaluated seasons (the highest temperature fluctuation in evaluated seasons was observed from February to June, Supplementary Figure S1a), and notably, in the 2018 season, we observed a rapid temperature increase in March and April (Supplementary Figure S1b).
In this analysis, we compared the temperature fluctuation effect between the seasons of fruit evaluation, which allowed us to diversify the seasonal temperature relationships.
The highest year-to-year variations in temperatures were observed when comparing seasons 2018 vs. 2019 and 2018 vs. 2020 (F ratio = 74.59 and 70.17, respectively; Table 3). The regression analysis also confirmed the significantly higher seasonal variation value when comparing seasons 2018 vs. 2019 and 2018 vs. 2020 (SS ratio of 263.4 and 317, respectively) and a lower value between seasons 2019 and 2020 (SS = 507.1) (Table 3).
Table 3.
Analysis of variance and year-to-year correlation coefficient between average temperature changes within the evaluated months of fruit development.
The R square index also confirmed the higher (approximately 0.96) explained variation within the independent comparison of seasons 2018 and 2020. The presented data confirmed that according to the temperature fluctuation, the seasons of 2018 (significant temperature drop in February) and 2020 (significant temperature drop in September was detected) were the most diverse (Supplementary Figure S1b).
Moreover, an analysis of linear regression and Pearson correlation coefficient (Figure 3) showed a significantly higher deviation when comparing seasons 2018 and 2019 (Figure 3A) and between 2018 and 2020 (Figure 3B). The lowest level of seasonal temperature fluctuation was observed when comparing seasons 2019 and 2020. In this comparison, the month temperature ratios are more densely distributed near the lines of trends (Figure 3C).
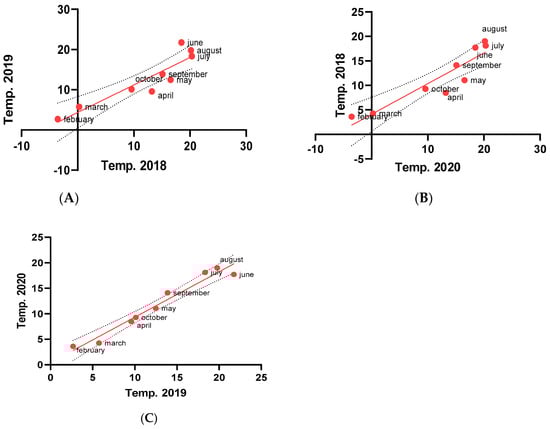
Figure 3.
Pearson correlation coefficient plots representing the temperature difference mean ratio between individual months (from February to October) in compared seasons. The correlation was calculated according to the season compartment in accordance with the average temperature changes in a particular month in each season (the red dots represent individual month average temperature ratio).
3.3. The Effect of Seasonal Temperature Fluctuations on the Activity of Selected Genes
The effects (presented as volcano plots, Supplementary Figure S3) of temperature changes on gene activity were assessed for the three (temperature fluctuating) periods recorded in three evaluated seasons: early spring (showing the temperature range between −1.6 to 14.9 °C), at the turn of spring and early summer (14.9 to 19.4 °C), and autumn (temperature ranged between 19.4 and 17.7 °C (Supplementary Table S1). On this basis, the effect of seasonal temperature changes on the number of transcripts of the selected genes was determined (Table 4).
Table 4.
Effects of the gene activity and temperature changes within the evaluated seasons (ns—not significant). The highest value of the negative effects are in bold and italic, and the highest values of positive effects are in bold (SE—standard error).
In the fruits of the mid-ripening apple cultivar ‘Pinokio’, a significant increase in the activity of the StG gene (which regulates the starch degradation pathway) was noted. The activation of this gene was promoted due to lower spring temperatures, while higher temperatures significantly inhibited its number of transcripts (Supplementary Figure S3, Table 4). Additionally, a decrease in StG activity was observed in this case (cv.) (effect of fold change over 90×) when the temperature in the pre-harvest period ranged between 14 and 19 °C. The relative increase in the temperature explained the negative effect of the activation of genes AAAA1, AAFB (encoding cell kinases), AALA1 (unknown) and AASA (encoding mannose 6-phosphatase). In the fruits of the late-ripening cultivar ‘Ligolina’, low temperatures significantly promoted the activation of the AAXA and AASA genes (encoding cell kinase and mannose 6-phosphatase, respectively), while higher temperatures significantly promoted the activation of AAFB (cell kinase) and StG (starch glucosidase) genes.
A different relationship between gene activity and temperature changes was observed for ‘Pink Braeburn’ fruits in which lower temperatures favored an increase in the activity of the AASA (mannose 6-phosphatase), AAFB (cell kinase) and AALA1 (unknown) genes (Table 4, Supplementary Figure S3). Regarding to AALA1 gene, this type of regulation could be recognized as occurring in the bark (cortex) of ripe fruits of the reference ‘Royal Gala’ database (Table 2, Materials and Methods). In ‘Ligolina’ (considered a late-ripening cultivar), lower temperatures significantly activated AAXA (cell kinase) and AASA (mannose 6-phosphatase) genes, while in the fruits of mid-ripening apple (cv.), those genes were relatively inhibited by the higher temperatures. Moreover, in the fruits of ‘Ligolina’, we observed the activation of StG and AAFB (kinase protein) genes under higher temperature exposition.
A summary of the positive and negative effects between gene activity and temperature ranks in the consecutive seasons is presented in Table 4.
3.4. The Impact of Seasonal Temperature Changes on Apple Fruit Features
The highest effect of temperature changes in all evaluated seasons was noted for the fruit weight (FW) of all analyzed cultivars. For ‘Pink Braeburn’, a significantly negative relationship with temperature changes (generally low temperature) was estimated for fruits collected in seasons 2018 and 2020 (comparing 2018 vs. 2019 and 2018 vs. 2020). Similar relationships were also observed in the fruits of early-ripening ‘Ligol’. In addition, the positive impact of temperature changes observed in seasons 2018 and 2019 on this trait was also noted for ‘Pinokio’ and ‘Ligolina’ fruits.
Simultaneously, a significantly negative or negligible relationship between all evaluated fruit traits in the compared seasons (2018 vs. 2020) was observed for all apple cultivars tested. For ‘Pink Braeburn’ and ‘Ligol’, changes in temperature conditions in the examined compared seasons (2018 vs. 2019 and 2018 vs. 2020) also had a negative effect on the fruit titratable acidity (TA) and fruit firmness (FF) values. The negative or non-significant effect of temperature fluctuations in the regulation of titratable soluble solids (TSSs) observed in the same comparative seasons was noted for all tested apple fruits (Table 5). Regarding the internal ethylene concentration (IEC), measured in the fruits of ‘Pinokio’ and ‘Pink Braeburn’ (both considered mid-ripening cultivars), we observed a negative effect of its regulation under lower temperature exposition.
Table 5.
Effects of the apple trait values and temperature changes within the evaluated seasons (ns—not significant). The highest values of the negative effects are in bold and italic, and the highest values of positive effects are in bold.
We observed that in the comparisons, including the 2018 and 2019 seasons, temperature changes generally exerted the most significant effects in differentiating the assessed phenotypic traits.
The volcano plots for the trait values in season compartments are presented in Supplementary Figure S4.
3.5. Correlation Between Gene Activities and the Values of Apple Fruit Traits
Based on the coefficient of determination ratio (R2) calculation, the highest relationship was noted between the AAYA and AAAA2 genes (involved in the cell respiration process and coding transcription factor protein, respectively) (R2 in the range of 0.46–0.99) and all the tested fruit quality parameters (Table 6). Only the cultivars ‘Pinokio’ and ‘Pink Braeburn’ showed no correlation with the internal ethylene concentration (IEC), confirming that the fruits have not reached the full ripeness stage.
Table 6.
Correlation matrix plot representing relationships between gene activity and the average value of fruit traits measured in evaluated seasons (FW, fruit weight; IEC, internal ethylene concentration; TSSs, total soluble solids; TA, titratable acidity; FF, fruit firmness). The significance between analyzed components was calculated according to R2 test with p-value: p > 0.05 (*), 0.01 (**), 0.001 (***) and 0.0001 (****). The most significant phenotype–genotype correlations are presented in bold.
Meanwhile, in the genomes of all tested apple cultivars, a significant correlation was noted between the activity of six analyzed genes (R2 ranged between 0.54 and 0.99, excluding AALA1 (unknown) and AASA (mannose 6-phosphatase)), fruit weight and fruit firmness. For the ‘Pinokio’ cultivar, the activity of the AAFB (kinase protein) gene was significantly correlated with all tested fruit quality parameters, while in the case of the reference cultivar ’Ligol’, four genes showed a significant relationship between the number of gene transcripts and TSS value: AAAA1, AAFB, AAXA (all coding kinase proteins or kinase receptor proteins) and AASA (encoding mannose 6-phosphatase) (R2 ranged between 0.65 and 0.97). Moreover, the lowest significance between the gene activity and evaluated fruit features of ‘Pink Braeburn’ was noted for genes AALA1 and AASA. The R2 ratios and the level of significance (p > 0.05, 0.01, 0.001 and 0.0001) for all tested genes and the fruit parameters of evaluated apple cultivars are presented in Table 6.
4. Discussion
Three years (2018–2020) of apple fruit evaluation allowed us to initially recognize the influence of seasonal temperature fluctuations on the expression profile changes in the selected genes of interest, overall fruit development and apple fruit traits.
For the sequential environmental analysis, we collected the temperatures for each entire year period/per individual season from the METOS station, by Pessl Instruments, which collects hourly data with an accuracy of ±0.01 °C. There are several methods to present seasonal temperature variations, such as average temperatures (e.g., from October of the previous season to April of the next season [7]), the number of degree days and the sum of cumulative temperatures [3,5]. In our study, the analyses were performed based on the monthly distribution of average temperatures, divided into four periods covering the temperature range from −1.6 to 19.4 °C (Supplementary Figure S1b and Table S1). Łysiak and Szot observed the critical winter temperature for apple growth, injuring buds in the post-bloom phenological period, ranging between −1.9 °C and −3.0 °C [3]. In our case, in the period of February to April, the temperature ranged approximately from −1.6 to 14.9 °C (giving a total average periodical temperature of 16.5 °C), but we did not observe any serious flower damage to the apple cultivars intended for analysis. Considering these observations, our choice of seasonal temperature ranges seems to be clearly justified since no acceptable minimum and maximum base temperature has been defined so far.
In this part of our study, samples from the fruit flesh at different stages of maturity and selected genes of interest were used as potential indicators of fruit maturity and quality.
In the first stage of the study, gene activity was assessed in four periods of fruit development (before ripening and at harvest), confirming the phenological phase of apples. According to the comparative analysis of cDNA libraries prepared for fruits collected at 87, 126 and 150 DAFB, Park, Newcomb and coworkers determined the activity level of 72,363 regulatory ESTs in the fruits of the ’Royal Gala’, thus building a valuable database for broad molecular studies of Malus. They indicated that transcription factors and compounds related to ripening (e.g., esters) are first detected at 134 DAFB and increase rapidly between 141 and 150 DAFB [27,29]. Based on these observations, we determined the first harvest at 135 DAFB, considering that spring temperatures have a major impact on the earlier onset of bud and flower initiation in fruit crops [1,30,31]. For example, in the 2018 season, a rapid increase in temperature (March and April) caused the appearance of full bloom 2 days earlier. Based on an equal time period covering full flowering until fruit ripeness, we then considered harvest dates in September and October, when the evaluated cultivars were before and at the commercial harvest stage.
For molecular purposes, we selected specific genes involved in regulating the apple fruit ripening process.
We analyzed an early-expressed group of genes belonging mainly to the class of kinase receptors, which were defined as members of ethylene receptors [27], and their regulation significantly differs depending on the fruits collected a few days before fruit harvest. The second group (activated later) of selected genes (AASA and AAYA) were confirmed as essential for sorbitol synthesis in source tissues and its metabolism in sink tissues [27]. They can therefore be considered early functional markers for predicting the ripening stage of apples. However, our data showed that even small seasonal temperature fluctuations (R2 ranged from 0.85 to 0.96—the largest temperature fluctuations were observed in the 2018 and 2019 seasons, and the year-to-year difference was −0.48) can have a significant effect on their activity level. Such external factors can be involved in gene transportation and their local redirection from different fruit tissues at different stages of their ripening. Our data show a beneficial effect of low temperatures on the activity of genes such as StG, AASA and AALA1, which can prolong the ripening process of ‘Ligol’, ‘Ligolina’ and ‘Pinokio’ fruit. The opposite relationship was observed for the ’Pink Braeburn’ fruit, for which lower temperatures negatively affected the activity of StG, AAA1, AAFB, AALA1, AASA and AAXA genes. This may be due to the inhibition of fruit growth and the extension of ripening underlying different genetic processes activated in this apple genotype.
In our studies, we observed a negative effect of low temperatures on the AAFB gene, which could occur due to its initial regulation in the fruit peel, and resulted in the inhibition of its activity (generally observed in ‘Pinokio’ and ‘Ligol’). The positive effect of higher seasonal temperatures on its activity may be caused by the “redirection” of its transcriptional pathway from mesocarp cells to fruit peel cells. Such a mechanism of gene activation/deactivation may be regulated by the presence of transposable regulatory sequences present in the structure of the Malus genome [32,33,34]. Brown, Telias and colleagues confirmed that genetic variability occurring in the process of fruit development is modulated by such transposable elements [35,36,37], which can affect the alternative transcription start site in gene expression at both the transcriptional and post-transcriptional levels [37].
As emphasized by many authors, in the early stage of fruit development, cell cycle genes represented by the group of cyclin-dependent kinases (CDKs) [12,19,38,39,40] are activated. In this research, we also observed the group of genes significantly expressed before the fruits reached full maturity. The AAXA, AAAA1 and AABF genes were designated encoding proteins of cell wall-associated kinase receptors. In addition, the analyzed AASA gene (encoding enzymes involved in sorbitol metabolism) seems to be crucial later in the process of fruit development. As emphasized, the accumulated sorbitol and sulfur are quickly metabolized via the high activity of SDH (sorbitol dehydrogenase), invertase, SUSY (sucrose synthase), FK (fructokinase) and HK (hexokinase) to maintain the plant cell energy demands, initiating cell division and an increase in fruit weight. The activity of these enzymes then decreases, and the starch degradation process is released, resulting in simple sugar accumulation (beginning about 90 days after full bloom), preceding the fruit ripening and determining their sweetness level [41,42]. Finally, the over-ripening stage begins, initiated by the initiation of ethylene biosynthesis [12,19,25].
The expression profiles of the selected genes of interest have not been studied so far, and our research sheds light on their usefulness as molecular markers for determining the degree of ripeness of the fruit of four apple varieties.
The general influence of temperature changes on the expression of the genes of interest is presented in Figure 4.
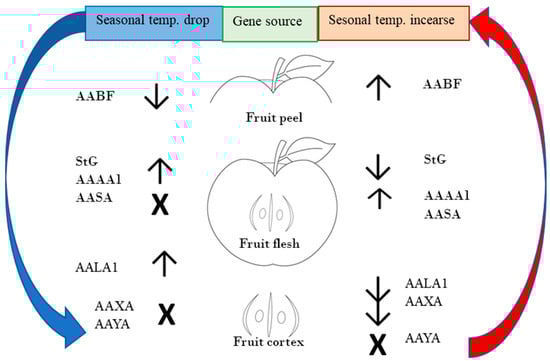
Figure 4.
Schematic circular relationship between gene activity and seasonal temperature fluctuations. Down arrows show negative regulation of gene activity, and up arrows show positive effect on regulation of gene activity in regard to temperature changes. Symbol X represents no significant effect.
In the next step of this study, we determined the relationship between the activity of the genes of interest, the evaluated apple fruit traits and the effect of temperature changes. Only in the cases of ‘Pinokio’ and ‘Pink Braeburn’ did the AAYA and AAAA2 genes (encoding the cellular respiratory cycle proteins and the kinase receptor protein, respectively) show no correlation with the internal ethylene concentration (IEC), which confirms that their fruits had not reached full maturity. A similar activation trend of these genes, noted in the immature fruit of ‘Royal Gala’, was also observed by Newcomb et al. [26].
Considering the complexity of the fruit ripening process, it should be considered that a higher temperature in spring (up to 18 °C) is necessary for the significant activation of some important genes, such as the flower bud formation factor (FBF), while in autumn, low temperatures (below 11 °C during the day and 7 °C at night) favored its down-regulation [43,44].
It has also been reported that higher temperatures significantly reduce fruit quality parameters, such as fruit acidity and anthocyanin content [45]. Our observations clearly confirmed that lower temperatures occurring during fruit ripening improved the value of apple quality parameters (especially the balance between the general total soluble solid (TSS) concentration and fruit acidity (TA)). In seasons 2018 and 2019 (mainly in 2019), fruits assessed at 150 DAFB were characterized by a significantly higher TSS content and a lower TA content compared to the warmer season of 2020. This may be the result of an increase in the activity of most of the studied genes under the influence of lower temperatures. Many authors have also confirmed that the final consumer value of apple fruit depends on the balance between its sugar and acid content [46,47,48,49,50,51].
Our data also shed light on the relationship between TSS and TA content and the effect of temperature on the fruit characteristics of four apple genotypes, which have not been reported so far. We detected a general temperature drop effect on both traits in all analyzed apple cultivars and its correlation with a significant variability in the activity of the StG gene (a structural gene of the starch degradation pathway), inhibited by high temperatures. Additionally, we also observed that temperatures below 10 °C, recorded in seasons 2018 and 2020, detected at the fruit ripening stage of the evaluated apples (150 DAFB), inhibited the fruits’ internal ethylene production. This corroborates the insights of other authors who have described a general negative effect of low temperatures on the fruit flavonoid content, fruit weight and fruit firmness of apple cultivars such as ‘Jonagold’ and ‘Cox’s Orange Pippin’ [44,48,49,50]. Other studies highlight the underlying complex mechanisms of physiological and biochemical rearrangements in apple fruits, which also strictly depend on the individual genotype studied [1,49,50,51].
To our knowledge, this research is the first to explain the relationships between such components as gene activity, phenotype and environment factors evaluated for four different apple cultivars grown in Polish orchards. However, further directions for this type of research should also concern other commercial apple varieties in future analyses.
5. Conclusions
We performed a three-dimensional analysis of genotype x phenotype x environment interactions to understand the response of an individual apple genotype to growth climatic conditions. The developed model, based on functional molecular markers, dependent on the genotype and an average temperature fluctuation in the three seasons assessed, may facilitate a precise determination of the apple ripeness stage.
In this study, we observed that low temperatures (seasons with relatively lower temperatures before full fruit ripening) exerted a more significant effect on the activity of the analyzed genes and the values of the assessed parameters.
The application of various data collection methods following genome sequencing approaches increased our understanding of the gene activation and silencing mechanisms during fruit development. We provided a brief definition of particular fruit ripeness stages based on changes in the expression profiles of genes from metabolic and signaling pathways impacted by environmental conditions.
The obtained results may facilitate the early determination of the harvest date of fruits intended for direct consumption and long-term storage, as well as the implementation of breeding programs aimed at improving the quality of apple fruits.
Supplementary Materials
The following supporting information can be downloaded at https://www.mdpi.com/article/10.3390/agronomy15040908/s1, Figure S1a, b: Climate graph of temperature fluctuations in the years 2018–2020. Table S1. Average temperature ranks of the seasonal periods of meteo data collection; Figure S2: Expression profiles of selected genes in apple fruits on various stages of ripeness. Diagrams present an average relative fold change in the gene expression data with the standard error of the mean (±SEM) compared to earliest ripening cv. ‘Ligol’ and t-test significance calculation level at p < 0.05 *, 0.01 **, 0.001 ***, normalized to Md18sRNA gene (showing stable expression in the experiment layout). The data for ‘Ligol’, an early-ripening control, are marked in red. Figure S3: Volcano plots showing fold changes (represented by Log(p-value)) of the number of gene transcripts in the average seasonal temperature intervals (−1.6 vs. 14.9 °C, −1.6 vs. 19.4 °C, −1.6 vs. 17.7 °C, 14.9 vs. 19.4 °C, 14.9 vs. 17.7 °C, and 19.4 vs. 17.7 °C. Figure S4: Volcano plots showing relative changes (represented by Log(p-value)) of the value of fruit weight (FW), internal ethylene concentration (IEC), total soluble solids (TSSs), titratable acidity (TA) and fruit firmness (FF) with regard to an average temperature fluctuation observed in the compared seasons (2018 vs. 2019, 2018 vs. 2020 and 2019 vs. 2020).
Author Contributions
Conceptualization, S.K.-P.; methodology, S.K.-P., A.K., K.P.R. and A.S.; software, S.K.-P.; validation, S.K.-P. and K.P.R.; formal analysis, S.K.-P., B.I., K.S. and R.C.; investigation, S.K.-P. and K.P.R.; resources, M.L.; data curation, S.K.-P.; writing—original draft preparation, S.K.-P.; writing—review and editing, S.K.-P. and K.P.R.; visualization, S.K.-P. All authors have read and agreed to the published version of the manuscript.
Funding
This research was funded by the Polish Ministry of National Education: grant number ZHRO/1/2016—statutory project.
Data Availability Statement
The original contributions presented in this study are included in the article/Supplementary Materials. Further inquiries can be directed to the corresponding (sylwia.keller@inhort.pl).
Acknowledgments
We would like to give special thanks to Waldemar Treder and Krzysztof Klamkowski for operating the meteo system and for the conversion and access to the meteo data. We would like to thank Norbert Kowara for the extensive language checking and correction.
Conflicts of Interest
The authors declare no conflicts of interest.
References
- Lee, J.-C.; Park, Y.-S.; Jeong, H.-N.; Kim, J.-H.; Heo, J.-Y. Temperature changes affected spring phenology and fruit quality of apples grown in high-latitude region of South Korea. Horticulturae 2023, 9, 794. [Google Scholar] [CrossRef]
- Available online: https://300gospodarka.pl/ (accessed on 29 January 2020).
- Łysiak, G.P.; Szot, I. The Use of Temperature Based Indices for Estimation of Fruit Production Conditions and Risks in Temperate Climates. Agriculture 2023, 13, 960. [Google Scholar] [CrossRef]
- Łysiak, G.P. Degree days as a method to estimate the optimum harvest date of ‘Conference’ pears. Agriculture 2022, 12, 1803. [Google Scholar] [CrossRef]
- Łysiak, G. The sum of active temperatures as a method of determining the optimum harvest date of ‘Šampion’ and ‘Ligol’ apple cultivars. Acta Sci. Pol. Hortorum Cultus 2012, 11, 3–13. [Google Scholar]
- Ruchel, Q.; Zandona, R.R.; Fraga, D.S.; Agostinettop, D.; Langaro, A.C. Effect of high temperature and recovery from stress on Crop-Weed interaction. Bragantia 2020, 79, 582–591. [Google Scholar] [CrossRef]
- Warrington, I.J.; Fulton, T.A.; Halligan, E.A.; de Silva, H.N. Apple Fruit Growth and Maturity Are Affected by Early Season Temperatures. J. Am. Soc. Hortic. Sci. 1999, 124, 468–477. [Google Scholar] [CrossRef]
- Keller-Przybyłkowicz, S.; Lewandowski, M.; Korbin, M. Identification of the genome regions correlated with cold hardiness of apple rootstocks by transcriptomic analysis of differentially expressed candidate genes. Biul. Inst. Hod. Aklim. Roślin 2019, 286, 415–418. [Google Scholar]
- Eberhardt, M.V.; Lee, C.Y.; Liu, R.H. Antioxidant activity of fresh apples. Nature 2000, 22, 903–904. [Google Scholar] [CrossRef]
- Hyson, A.D. A Comprehensive Review of Apples and Apple Components and Their Relationship to Human Health. Adv. Nutr. 2011, 2, 408–420. [Google Scholar] [CrossRef]
- Oyenihi, A.B.; Belay, Z.A.; Mditshwa, A.; Caleb, O.J. “An apple a day keeps the doctor away”: The potentials of apple bioactive constituents for chronic disease prevention. J. Food Sci. 2022, 87, 2291–2309. [Google Scholar] [CrossRef]
- Keller-Przybyłkowicz, S.E.; Rutkowski, K.P.; Kruczyńska, D.E.; Pruski, K. Changes in gene expression profile during fruit development determine fruit quality. Hort. Sci. 2016, 49, 1–9. [Google Scholar] [CrossRef]
- Conner, P.; Brown, S.; Weeden, N. Molecular-marker analysis of quantitative traits for growth and development in juvenile apple trees. Theor. Appl. Genet. 1998, 96, 1027–1035. [Google Scholar] [CrossRef]
- Cãtãlina, D.; Adriana, S.; Bozdog, C.; Radu, S. Estimation of genetic effects implied in apple inheritance of quantitative traits. J. Hortic. For. Biotechnol. 2015, 19, 85–90. [Google Scholar] [CrossRef]
- Zheng, W.; Shen, F.; Wang, W.; Wu, B.; Wang, X.; Xiao, C.; Tian, Z.; Yang, X.; Yang, J.; Wang, Y.; et al. Quantitative trait loci-based genomics-assisted prediction for the degree of apple fruit cover color. Plant Genome 2020, 13, e20047. [Google Scholar] [CrossRef]
- Sun, X.; Jiao, C.; Schwaninger, H.; Chao, C.T.; Ma, Y.; Duan, N.; Fei, Z. Phased diploid genome assemblies and pan-genomes provide insights into the genetic history of apple domestication. Nat. Genet. 2020, 52, 1423–1432. [Google Scholar] [CrossRef]
- Kumar, S.; Molloy, C.; Muñoz, P.; Daetwyler, H.; Chagné, D.; Volz, R. Genome-enabled estimates of additive and nonadditive genetic variances and prediction of apple phenotypes across environments. G3 2015, 5, 2711–2718. [Google Scholar] [CrossRef]
- Cãpraru, F.; Zlati, C. Observations regarding yield phenophases of some diseases genetic resistant apple cultivars, in the conditions of Bistrita Region. Horticulturã 2009, 52, 539–544. [Google Scholar]
- Jansen, B.J.; Thodey, K.; Schaffer, R.J.; Alba, R.; Balakrishman, L.; Bishop, R.; Bowen, J.H.; Crowhurst, R.N.; Gleave, A.P.; Ledger, S.; et al. Global gene expression analysis of apple fruit development from the floral bud to ripe fruit. BMC Plant Biol. 2008, 8, 1–29. [Google Scholar] [CrossRef]
- Howell, J.F.; Neven, L.G. Physiological Development Time and Zero Development Temperature of the Codling Moth (Lepidoptera: Tortricidae). Environ. Entomol. 2000, 29, 766–772. [Google Scholar] [CrossRef]
- Spayd, S.E.; Tarara, J.M.; Mee, D.L.; Ferguson, J.C. Separation of Sunlight and temperature Effects on the Composition of Vitis vinifera cv. Merlot Berrie. Am. J. Enol. Vitic. 2002, 53, 171–182. [Google Scholar]
- Menzel, A.; Estrella, N.; Fabian, P. Spatial and temporal variability of the phenological seasons in Germany from 1951 to 1996. Global Change Biol. 2001, 7, 657–666. [Google Scholar] [CrossRef]
- Gian-Reto, W. Plants in a warmer world. Perspectives in Plant Ecology. Evol. Syst. 2003, 6, 169–185. [Google Scholar]
- Yang, S.; Logan, J.; Coffey, D.L. Mathematical formulae for calculation the base temperature for growing degree days. Agric. Forest Meteorol. 1995, 74, 61–74. [Google Scholar] [CrossRef]
- Blanco, A.; Fernández, V.; Val, J. Improving the performance of calcium-containing spray formulations to limit the incidence of bitter pit in apple (Malus × domestica Borkh.). Sci. Hortic. 2010, 127, 23–28. [Google Scholar] [CrossRef]
- Zeng, Y.; Yang, T. RNA Isolation from Highly Viscous Samples Rich in Polyphenols and Polysaccharides. Plant. Mol. Biol. Rep. 2002, 20, 417. [Google Scholar] [CrossRef]
- Newcomb, R.D.; Crowhurst, R.N.; Gleave, A.P.; Rikkerink, E.H.; Allan, A.C.; Beuning, L.L.; Bowen, J.H.; Gera, E.; Jamieson, K.R.; Janssen, B.J.; et al. Analyses of expressed sequence tags from apple. Plant Physiol. 2006, 141, 147–166. [Google Scholar] [CrossRef]
- Livak, K.J.; Schmittgen, T.D. Analysis of relative gene expression data using real-time quantitative PCR and the 2(-Delta DeltaC(T)). Methods 2001, 25, 402–408. [Google Scholar]
- Park, S.; Sugimoto, N.; Larson, M.D.; Beaudry, R.; van Nocker, S. Identification of genes with potential roles in apple fruit development and biochemistry through large-scale statistical analysis of expressed sequence tags. Plant Physiol. 2006, 141, 811–824. [Google Scholar] [CrossRef]
- Grab, S.; Craparo, A. Advance of Apple and Pear Tree Full Bloom Dates in Response to Climate Change in the Southwestern Cape, South Africa: 1973–2009. Agric. For. Meteorol. 2011, 151, 406–413. [Google Scholar] [CrossRef]
- Chmielewski, F.M.; Müller, A.; Bruns, E. Climate Changes and Trends in Phenology of Fruit Trees and Field Crops in Germany, 1961–2000. Agric. For. Meteorol. 2004, 121, 69–78. [Google Scholar] [CrossRef]
- Velasco, R.; Zharkikh, A.; Affourtit, J.; Dhingra, A.; Cestaro, A.; Kalyanaraman, A.; Viola, R. The genome of the domesticated apple (Malus × domestica Borkh.). Nat. Genet. 2010, 42, 833–839. [Google Scholar] [CrossRef] [PubMed]
- Antonius-Klemola, K.; Kalendar, R.; Schulman, A.H. TRIM retrotransposons occur in apple and are polymorphic between varieties but not sports. Theor. Appl. Genet. 2006, 112, 999–1008. [Google Scholar] [CrossRef] [PubMed]
- Han, Y.; Korban, S.S. Spring: A novel family of miniature inverted-repeat transposable elements is associated with genes in apple. Genomics 2007, 90, 195–200. [Google Scholar] [CrossRef]
- Brown, S.K. Pome fruit breeding: Progress and prospects. Acta Hort. 2003, 622, 19–34. [Google Scholar] [CrossRef]
- Telias, A.; Lin-Wang, K.; Stevenson, D.E.; Cooney, J.M.; Hellens, R.P.; Allan, A.C.; Hoover, E.E.; Bradeen, J.M. Apple skin patterning is associated with differential expression of MYB10. BMC Plant Biol. 2011, 11, 93. [Google Scholar] [CrossRef]
- Feschotte, C. Transposable elements and the evolution of regulatory networks. Nat. Rev Genet. 2008, 9, 397–405. [Google Scholar] [CrossRef]
- Boudolf, V.; Vlieghe, K.; Beemster, G.T.; Magyar, Z.; Torres Acosta, J.A.; Maes, S.; Van Der Schueren, E.; Inze, D.; De Veylder, L. The plant-specific cyclin-dependent kinase CDKB1;1 and transcription factor E2Fa-DPa control the balance of mitotically dividing and endoreduplicating cells in Arabidopsis. Plant Cell. 2004, 16, 2683–2692. [Google Scholar] [CrossRef]
- Dewitte, W.; Murray, J.A. The plant cell cycle. Annu Rev Plant Biol. 2003, 54, 235–264. [Google Scholar] [CrossRef]
- Spruck, C.; Strohmaier, H.; Watson, M.; Smith, A.P.; Ryan, A.; Krek, T.W.; Reed, S.I. A CDK-independent function of mammalian Cks1, Targeting of SCF(Skp2) to the CDK inhibitor p27Kip1. Mol Cell. 2001, 7, 639–650. [Google Scholar] [CrossRef]
- Li, M.; Feng, F.; Cheng, L. Expression patterns of genes involved in sugar metabolism and accumulation during apple fruit development. PLoS ONE 2012, 7, e33055. [Google Scholar] [CrossRef]
- Wu, T.; Wang, Y.; Zheng, Y.; Fei, Z.; Dandekar, A.M.; Xu, K.; Han, K.; Cheng, L. Suppressing Sorbitol Synthesis Substantially Alters the Global Expression Profile of Stress Response Genes in Apple (Malus domestica) Leaves. Plant Cell Physiol. 2015, 56, 1748–1761. [Google Scholar] [CrossRef]
- Abbott, D.L.; Bull, V. The effect of summer temperature on flower initiation and fruit bud development. Annu. Rep. Long Ashton Res. Stn. 1973, 5, 35–36. [Google Scholar]
- Heide, O.M.; Rivero, R.; Sønsteby, A. Temperature control of shoot growth and floral initiation in apple (Malus × domestica Borkh.). CABI Agric. Biosci. 2020, 1, 8. [Google Scholar] [CrossRef]
- Yamada, H.; Ohmura, H.; Arai, C.; Terui, M. Effect of preharvest fruit temperature on ripening sugars, and watercore occurrence in apples. J. Amer. Soc. Hort. Sci. 1994, 119, 1208–1214. [Google Scholar]
- Bai, Y.; Dougherty, L.; Cheng, L.; Xu, K. A co-expression gene network associated with developmental regulation of apple fruit acidity. Mol. Genet. Genom. 2015, 290, 1247–1263. [Google Scholar] [CrossRef]
- Zhang, B.; Han, Y. Genomics of fruit acidity and sugar content in apple. In Apple Genome; Korban, S.S., Ed.; Springer Nature: Cham, Switzerland, 2021; pp. 297–309. [Google Scholar] [CrossRef]
- Ma, D.; Sun, D.; Wang, C.; Li, Y.; Guo, T. Expression of flavonoid biosynthesis genes and accumulation of flavonoid in wheat leaves in response to drought stress. Plant Physiol. Biochem. 2014, 80, 60–66. [Google Scholar]
- Musacchi, S.; Serra, S. Review: Apple fruit quality: Overview on pre-harvest factors. J. Sci. Hortic. 2018, 234, 409–430. [Google Scholar]
- Chagné, D.; Daya Dayatilake, D.; Diack, R.; Murray, O.; Ireland, H.; Watson, A.; Gardiner, S.E.; Johnston, J.W.; Schaffer, R.J.; Tustin, S. Genetic and environmental control of fruit maturation, dry matter and firmness in apple (Malus × domestica Borkh.). Hortic. Res. 2014, 1, 114046. [Google Scholar] [CrossRef]
- Liu, W.; Chen, Z.; Jiang, S.; Wang, Y.; Fang, H.; Zhang, Z.; Chen, X.; Wang, N. Research progress on genetic basis of fruit quality traits in apple (Malus × domestica). Front. Plant Sci. 2022, 13, 918202. [Google Scholar] [CrossRef]
Disclaimer/Publisher’s Note: The statements, opinions and data contained in all publications are solely those of the individual author(s) and contributor(s) and not of MDPI and/or the editor(s). MDPI and/or the editor(s) disclaim responsibility for any injury to people or property resulting from any ideas, methods, instructions or products referred to in the content. |
© 2025 by the authors. Licensee MDPI, Basel, Switzerland. This article is an open access article distributed under the terms and conditions of the Creative Commons Attribution (CC BY) license (https://creativecommons.org/licenses/by/4.0/).