Article

Synergistic Effects of Mineralization Degree and Sodium Adsorption Ratio on the Rhizosphere Bacterial Community and Soil Nutrients of Upland Cotton Under Saline Water Irrigation

by
Chenfan Zhang
1,2,
Guang Yang
1,2,
Huifeng Ning
1,2,
Yucai Xie
1,2,3,
Yinping Song
1,2,4 and
Jinglei Wang
1,2,*
1
Key Laboratory of Crop Water Use and Regulation, Ministry of Agriculture and Rural Affairs, Farmland Irrigation Research Institute, Chinese Academy of Agricultural Sciences, Xinxiang 453002, China
2
Western Agricultural Research Center, Chinese Academy of Agricultural Sciences, Changji 831100, China
3
College of Water Conservancy and Architectural Engineering, Tarim University, Alaer 843300, China
4
College of Agriculture, Zhengzhou University, Zhengzhou 450000, China
*
Author to whom correspondence should be addressed.
Agronomy 2025, 15(4), 895; https://doi.org/10.3390/agronomy15040895
Submission received: 6 March 2025 / Revised: 31 March 2025 / Accepted: 1 April 2025 / Published: 3 April 2025
(This article belongs to the Special Issue Water and Fertilizer Regulation Theory and Technology in Crops)

Abstract

:
In global drought-prone cotton-growing (Gossypium hirsutum L.) areas, saline water irrigation has become a key strategy to alleviate the shortage of freshwater resources. Against this backdrop, the synergistic effect of mineralization degree (MD) and sodium adsorption ratio (SAR) on the rhizosphere microecological regulation mechanism remains unclear. To address this issue, this study constructed an experimental framework of the interaction between MD and SAR, aiming to explore their effects on the bacterial community structure in the rhizosphere of cotton and the soil environment. The soil type in the study area is saline–sodic sandy loam. In the experimental design, three MD levels (3 g/L, 5 g/L, 7 g/L) were set, and under each mineralization condition, three SAR levels (10 (mmol/L)1/2, 15 (mmol/L)1/2, 20 (mmol/L)1/2) were arranged. In addition, local freshwater irrigation was used as the control group (CG), resulting in a total of 10 treatment schemes. The aim of this study was to investigate the effects of varying levels of irrigation water MD and SAR on the structure of bacterial communities in cotton rhizosphere soil and the soil environment. The results indicated that saline water irrigation could enhance the diversity and richness of the bacterial community in the rhizosphere soil of cotton and alter its community structure. Under treatment with the MD of 3 g/L and the SAR of 10 (mmol/L)1/2, the diversity and richness of the bacterial community in the cotton rhizosphere reached their peak levels. Compared with the CG, the Chao1 index significantly increased by 260 units, while the Shannon index increased by 0.464. When the MD does not exceed 5 g/L, reducing SAR can enhance the diversity and network stability of the rhizosphere bacterial community, thereby synergistically promoting the accumulation of soil nutrients. The key soil environmental factors driving changes in the rhizosphere bacterial community structure mainly include soil moisture content, total nitrogen, nitrate nitrogen, and total organic carbon. The concentrations of total nitrogen, nitrate nitrogen, available phosphorus, and available potassium significantly increased by 19.66%, 26.10%, 89.41%, and 49.76% respectively (p < 0.05). This study provides a theoretical basis for sustainable irrigation and microbial regulation strategies in saline–alkali cotton fields at the theoretical level, and offers a new perspective for revealing the mutual feedback mechanism between bacterial community assembly and soil environment under saline conditions. From a practical perspective, this research offers valuable hands-on experience for optimizing agricultural ecological management in saline–alkali sandy loam soils, thereby contributing to the sustainable development of agriculture on such lands.

1. Introduction

Cotton (Gossypium hirsutum L.) is a crop that achieves optimal yields only under irrigated conditions and is cultivated in 80 countries [1]. It is the world’s most important natural textile fiber. However, many cotton-producing regions worldwide, especially arid and semi-arid areas, commonly face water scarcity issues [2,3]. Additionally, in some regions, prolonged irrigation and unreasonable agricultural water use have led to increasingly severe soil salinization, which negatively impacts cotton growth and quality [4]. Globally, China, India, and the United States dominate cotton production, with their combined yields accounting for the majority of world production [5]. Among them, China is the largest cotton producer, and Xinjiang, as China’s largest premium cotton production base, has a cotton-planting area of 2447.9 thousand hectares, representing approximately 86.2% of the national total. Its annual production reaches 5.686 million tons, accounting for 92.2% of the country’s total output [6]. Nevertheless, agriculture in Xinjiang has long been constrained by drought and the shortage of freshwater resources. Notably, Alar City in southern Xinjiang possesses extensive underground saline water resources, spanning an area of 2163.45 km2 (77.26% of the total region), which provides a potential resource for saltwater irrigation [7]. In response to water scarcity challenges, saltwater irrigation has become an important alternative strategy for local cotton cultivation.
Soil salinization is a critical environmental constraint affecting over 1 billion hectares of land globally, including approximately 20% of agricultural land [8]. It transcends regional boundaries, posing a systemic threat to agricultural productivity, ecosystem stability, and carbon sequestration capacity [9]. Soil salinization is a complex process driven by both natural and anthropogenic factors. In recent decades, human activities have significantly exacerbated soil salinization [10,11]. Improper irrigation practices, inadequate drainage systems, the use of saline water for irrigation, and suboptimal agronomic management practices all contribute to the intensification of soil salinization [12]. Domestic and international scholars have conducted extensive research on the effects of saline water irrigation [13,14,15], among which mineralization degree (MD) and sodium adsorption ratio (SAR) are two critical indicators for assessing the quality of irrigation water in agricultural fields [16]. The degree of MD refers to the total concentration of dissolved salts in water, typically measured as grams of dissolved solids per liter, thereby reflecting the total amount of various ions in the water [17]. The sodium adsorption ratio is defined as the ratio of the concentration of Na+ in the water to the square root of the average concentration of Ca2+ and Mg2+, and it is used to assess the relative content of Na+ in the water [18]. High-salinity irrigation water significantly increases the SAR of soil solution [19]. The adsorption of dissolved organic carbon in soil is more affected by SAR than by electrical conductivity, and when SAR > 20 (mmol/L)1/2, the adsorption of dissolved organic carbon in all soils is significantly reduced [20]. Yuan et al. [21] discovered that when the salinity of irrigation water surpasses 3.4 dS·m−1, there is a significant increase in soil salinity, pH value, and SAR; moreover, when the salinity exceeds 7.1 dS·m−1, the stability of soil aggregates markedly decreases. Saltwater irrigation inhibits the growth of the aboveground parts and roots of cotton, with both fresh weight and dry weight significantly lower than those under freshwater treatment [22]. Additionally, saltwater irrigation leads to changes in physiological characteristics such as a decrease in the photosynthetic rate of cotton leaves and an increase in the activity of antioxidant enzymes [23]. Saltwater irrigation modifies the rhizosphere microenvironment via mechanisms of salt accumulation and Na+ stress, consequently impacting the composition and functionality of the rhizosphere bacterial community [24]. Yoon et al. [25] demonstrated that an increase in SAR significantly reduces soil bacterial diversity, altering both the community composition and function. Ding et al. [26] demonstrated that long-term saline water irrigation would significantly increase soil electrical conductivity, SAR, and the concentrations of Mg2+ and SO42−, which in turn would cause alterations in bacterial community structure and an increase in the number of bacterial biomarkers. Hu et al. [27] noted that long-term irrigation with bitter saline water increases soil SAR while decreasing total organic carbon (TOC) content and the diversity of the bacterial community. As the core driving force of the soil ecosystem, rhizosphere bacteria are directly involved in nutrient cycling, organic matter decomposition, and the regulation of plant stress resistance mechanisms [28,29,30]. Li et al. [31] compared the rhizosphere microbial communities of salt-sensitive and salt-tolerant plants and found that under salt–alkali stress, both types of plants can enrich beneficial bacteria to enhance their stress resistance. Wang et al. [32] demonstrated that under varying fertilization conditions, the diversity of coffee rhizosphere bacterial communities, as measured by the Chao1 and Shannon indices, was significantly and positively correlated with available phosphorus (AP) and available potassium (AK). Additionally, organic matter, along with AK and AP, were shown to have significant effects on the structure of dominant bacterial communities. Soil salinity and alkalinity stress result in diminished microbial diversity and richness, ultimately leading to soil degradation and nutrient depletion. Plant growth-promoting rhizobacteria (PGPR) can enhance the availability of plant-usable nutrients via mechanisms such as nitrogen fixation and the solubilization of phosphorus and potassium, thereby directly promoting plant growth and enhancing plant stress resistance [33].
Although previous studies have revealed the impacts of different salt concentrations on soil environmental factors and the structure of bacterial communities [34,35,36], most research has only focused on a single salt factor. In addition, the degree of MD and SAR is often analyzed separately, neglecting their potential synergistic effects in farmland. To deeply explore the influence of saline water irrigation on the rhizosphere bacteria of cotton, their community assembly, and the interaction with the soil environment, this study designed and carried out an interaction experiment involving salinity and SAR. Three different salinity levels were set up in the experiment, and three SAR levels were established at each salinity level. The study aimed to reveal the mechanisms by which the interaction between MD and SAR affects the structure of cotton rhizosphere bacterial communities and the soil environment. The research results show that the interaction between MD and SAR significantly impacts the structure of the bacterial community in the rhizosphere of cotton and the soil environment. This study evaluated the effects of saline water irrigation on soil physical and chemical properties and bacterial communities, providing a theoretical basis for optimizing irrigation strategies for cotton in saline sandy loam soils in global arid and semi-arid regions.

2. Materials and Methods

2.1. Overview of the Test Area

From 2023 to 2024, a two-year field experiment was conducted at the Modern Agricultural Academician and Expert Work Experimental Station in Alar City, Xinjiang Production and Construction Corps (81°11′50.2455″ E, 40°37′31.7567″ N) (Figure S1). The experimental area is located in the warm temperate region, and its climate is classified as an extremely continental arid desert type. Its soil exhibits the basic physical parameters conforming to international soil texture classification standards and is categorized as saline–alkali sandy loam (Table 1) [37,38]. The climate characteristics of this region include high temperatures in summer, severe cold in winter, frequent winds in spring, and significant diurnal temperature variations. The average precipitation during the two-year experimental period is 47.2 mm, the annual cumulative evaporation was as high as approximately 2000 mm, and the relative humidity ranged from 17% to 59%; the average monthly wind speed was 8.4 to 16 km/h, the average high temperature was 29 °C, the average low temperature was 13 °C, the extreme high temperature was 40 °C, the extreme low temperature was −1 °C, and April was the coldest month [39].

2.2. Experiment Design

This study utilized the Tahe-2 cotton variety as the experimental material and designed an experiment to investigate the interactive effects of mineralization degree (MD) and sodium adsorption ratio (SAR) factors. A total of 10 treatments were established in the experiment, among which local freshwater irrigation serving as the control group (CG). The main plot was designed with three MD levels: 3 g/L (T3), 5 g/L (T5), and 7 g/L (T7). The subplot was designed with three SAR levels: 10 (mmol/L)1/2 (S10), 15 (mmol/L)1/2 (S15), and 20 (mmol/L)1/2 (S20). Each treatment was replicated three times, resulting in a total of 30 plots, each measuring 20 m2. The experiment was conducted in the field using a completely randomized block design.
The cotton was sown in early April using a machine-harvest cotton-planting system, characterized by one plastic film, three drip tapes, and six rows. The plastic film was 2.28 m wide, and the row spacing was configured as 10 + 66 + 10 + 66 + 10 cm, forming a wide–narrow row pattern suitable for machine harvesting, and an interplant spacing of 10 cm. Each plastic film laid out three drip tapes with emitter spacing of 30 cm; each emitter had a maximum flow rate of 3 L/h and operated at a working pressure of 0.1 MPa. The irrigation water is loaded into two 1 m3 buckets. By adding NaCl and CaCl2, the water’s MD and SAR were adjusted (Table 2). A water pump was then used to connect the drip irrigation tape for irrigation. During the entire cotton growth period, irrigation was conducted 11 times, from mid-May to late August, with a cycle of 7 days. The initial irrigation volume was set at 25 m3 per mu, while the subsequent irrigation amounts were adjusted based on the crop evapotranspiration (ETC). The fertilization method is fertigation: 2 kg of urea is applied per mu during the first irrigation, and for subsequent irrigations, fertilization is carried out in accordance with the local agricultural practices in southern Xinjiang.

2.3. Determination Items and Methods

2.3.1. Soil Moisture Content and Sodium Adsorption Ratio Determination

The soil moisture content (MC) was determined using the oven-drying method. Within the central region of the narrow rows in each plot, a soil auger was used to collect samples from two distinct soil layers: 0–10 cm and 10–20 cm, with three replicates collected at each depth. Place the collected soil into aluminum boxes. Once all soil samples for each treatment have been gathered, immediately measure the fresh weight of the soil. Then, place the samples in an oven at 105 °C for 12 h to dry them. After drying, weigh the soil again to calculate its moisture content. The soil moisture content for the 0–20 cm layer was calculated as the average of the results obtained from the two depths.
The sodium adsorption ratio (SAR) is defined as the ratio of the concentration of Na+ in irrigation water to the square root of the average concentrations of Ca2+ and Mg2+ [40]. The calculation formula is as follows:
SAR = Na + Ca 2 + + M g 2 +
In the formula, [Na+], [Ca2+], and [Mg2+] all represent the concentrations in the solution, mmol/L.

2.3.2. Soil Nutrients and pH Determination

In each plot, soil samples from the 0–20 cm soil layer were collected using a soil drill, with three replicates per plot. Each soil sample was then evenly divided into two portions. One portion was naturally air-dried under cool, well-ventilated conditions away from direct sunlight, to be used for the determination of available phosphorus (AP), available potassium (AK), total nitrogen (TKN), and total organic carbon (TOC); the other portion was immediately placed in a refrigerator at −20 °C for the determination of nitrate nitrogen (NO3-N) and ammonium nitrogen (NH4+-N).
Available phosphorus was determined by the bicarbonate extraction–molybdenum–antimony anti-spectrophotometric method (Olsen method). A soil-to-solution ratio of 1:20 was used, with a 0.5 mol/L NaHCO3 solution (pH 8.5) shaken for 30 min; after filtration, the extract was measured. Available potassium was extracted using a 1 mol/L neutral ammonium acetate solution at a soil-to-solution ratio of 1:10. After shaking for 15 min and subsequent centrifugation, the supernatant was measured using a flame photometer (FP6440, INESA, Shanghai, China). Fresh soil samples were taken and mixed with a 2 mol/L KCl solution at a soil-to-solution ratio of 1:5, then shaken for 1 h and filtered; the filtrate was subsequently analyzed: NO3-N was determined by UV spectrophotometry (UV-1200, MAPADA, Shanghai, China), and NH4+-N by the indophenol blue colorimetric method. Total nitrogen was determined by the Kjeldahl method. Total organic carbon was determined using the Walkley–Black method. Soil pH was measured with a pH meter (PHS-3E, INESA, Shanghai, China), using a sample preparation ratio of 1:5, meaning that 20 g of dried soil was mixed with 100 mL of deionized water.

2.3.3. Collection of Rhizosphere Bacterial

At the cotton bell formation stage, three uniformly growing and representative cotton plants were selected from each plot as one set, with this selection process repeated for three sets in total. The entire underground root system of each cotton plant was dug out using a shovel, and the loosely attached soil was gently shaken off. The soil adhering to the surface of the roots (approximately 1–2 mm thick) was defined as the rhizosphere soil. The collected samples were placed in 50 mL centrifuge tubes and rapidly frozen at −80 °C for subsequent analysis of microbial community structure.

2.3.4. Determination of Rhizosphere Bacterial Community Diversity [41,42,43]

  • Sample DNA Extraction and Detection: Nucleic acids were extracted using the OMEGA Soil DNA Kit (D5635-02) (Omega Bio-Tek, Norcross, GA, USA). The extracted DNA was subjected to 0.8% agarose gel electrophoresis to assess molecular size and quantified using a Nanodrop.
  • Polymerase Chain Reaction Amplification: The V3-V4 variable region of the 16S rRNA gene was amplified by PCR using a forward primer 338F (5′-ACTCCTACGGGAGGCAGCAG-3′), which carries a barcode sequence, and a reverse primer 806R (5′-GGACTACHVGGGTWTCTAAT-3′).
  • Library Construction for Sequencing: Libraries were constructed using the TruSeq Nano DNA LT Library Prep Kit from Illumina (San Diego, CA, USA).
  • Sequencing: For qualified libraries, perform paired-end sequencing on the Illumina NovaSeq (PE250) instrument (Illumina, San Diego, CA, USA).

2.3.5. Data Processing

  • Using QIIME2 version 2022.11 and following the official tutorial, the biological information of the microbiome was analyzed. The raw sequence data were decoded using the “demux” plugin, and the primers were removed using the “cutadapt” plugin. Then, sequence quality filtering, denoising, merging, and chimera removal were performed using the DADA2 plugin. The resulting sequences were clustered at 100% sequence similarity to generate the ASV (Amplicon Sequence Variant) representative sequences and the corresponding abundance table.
  • Amplicon Sequence Variant Classification and Taxonomic Assignment: The Amplicon Sequence Variant (ASV) representative sequences were compared with the reference sequences in the Silva 138.1 database to obtain the taxonomic information for each ASV. All Amplicon Sequence Variants with abundance values below 0.001% of the total sequencing volume of all samples were removed, and the abundance matrix after removing rare ASVs was used for subsequent analysis. In the R 4.3.3 language environment, the VennDiagram package is used to draw petal diagrams; the ggplot2 package is used to draw bar charts and box plots; the vegan and dplyr packages are used for non-metric multidimensional scaling analysis and permutational multivariate analysis of variance, Redundancy analysis, and Mantel test correlation analysis; the RColorBrewer, igraph, psych, stringr, and dplyr packages are used for co-occurrence network analysis, and statistical analysis and visualization are conducted in Gephi 0.10; the LEfSe package in Python 3.9 and the ggtree package in R are used for Linear discriminant analysis Effect Size analysis.

3. Results

3.1. Influence of Saline Water Irrigation on the Structure of Rhizosphere Bacterial Communities

In all soil samples, bacterial coverage exceeded 99%, indicating a minimal probability of undetected sequences. These sequencing results reliably represent the soil bacterial structure. After filtering and screening, a total of 2,427,716 high-quality sequences were obtained, with sequence lengths ranging from 229 bp to 439 bp. A total of 99.5% of the sequences were between 404 bp and 432 bp in length, with an average sequence length of 418 bp. Sequences with 100% similarity were classified as identical Amplicon Sequence Variants (ASVs), resulting in a total of 38,781 ASVs. The number of ASVs shared across all groups was 1007 (Figure 1a), accounting for 15.66–17.87% of the ASVs in each treatment. The treatment T3S10 exhibited the highest total and unique ASV counts (Figure 1b), suggesting that the T3S10 treatment provided relatively favorable growth conditions for bacterial microorganisms, thereby promoting an increase in bacterial diversity.
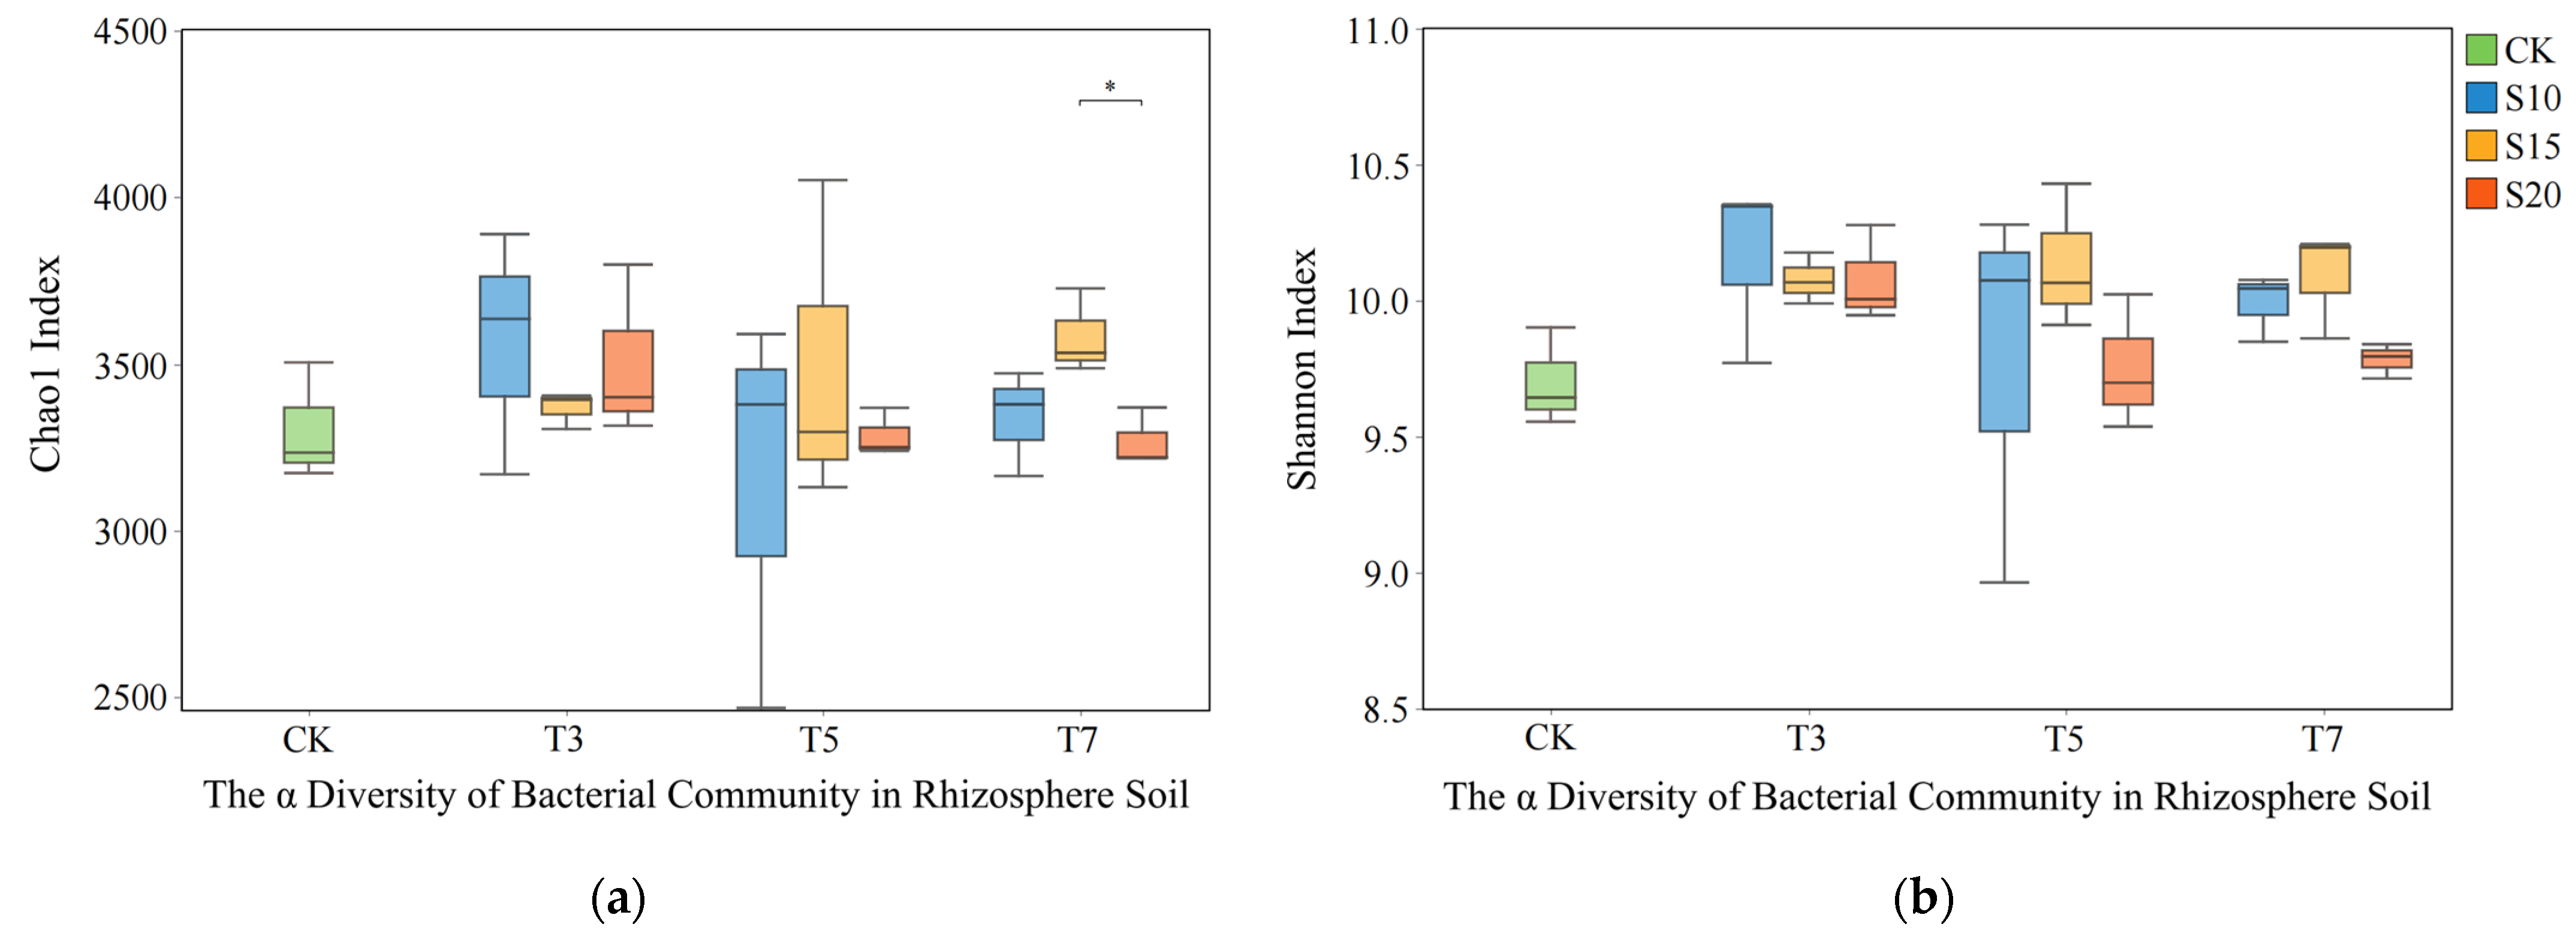
Compared with the control treatment, increasing the salinity and SAR of irrigation water can enhance the richness and diversity of the rhizosphere bacterial community (Figure 2). The Chao1 index of the T7S20 treatment (Figure 2a) was significantly lower than that of T7S15 (p < 0.05), while no significant differences were observed among the other treatments. Under identical MD conditions, decreasing SAR concurrently increases both the Chao1 index and the Shannon index of the bacterial community (Figure 2b), indicating that modulating SAR can improve rhizosphere bacterial community diversity, thereby alleviating the adverse effects of salt–alkali stress on the bacterial community in the cotton rhizosphere.
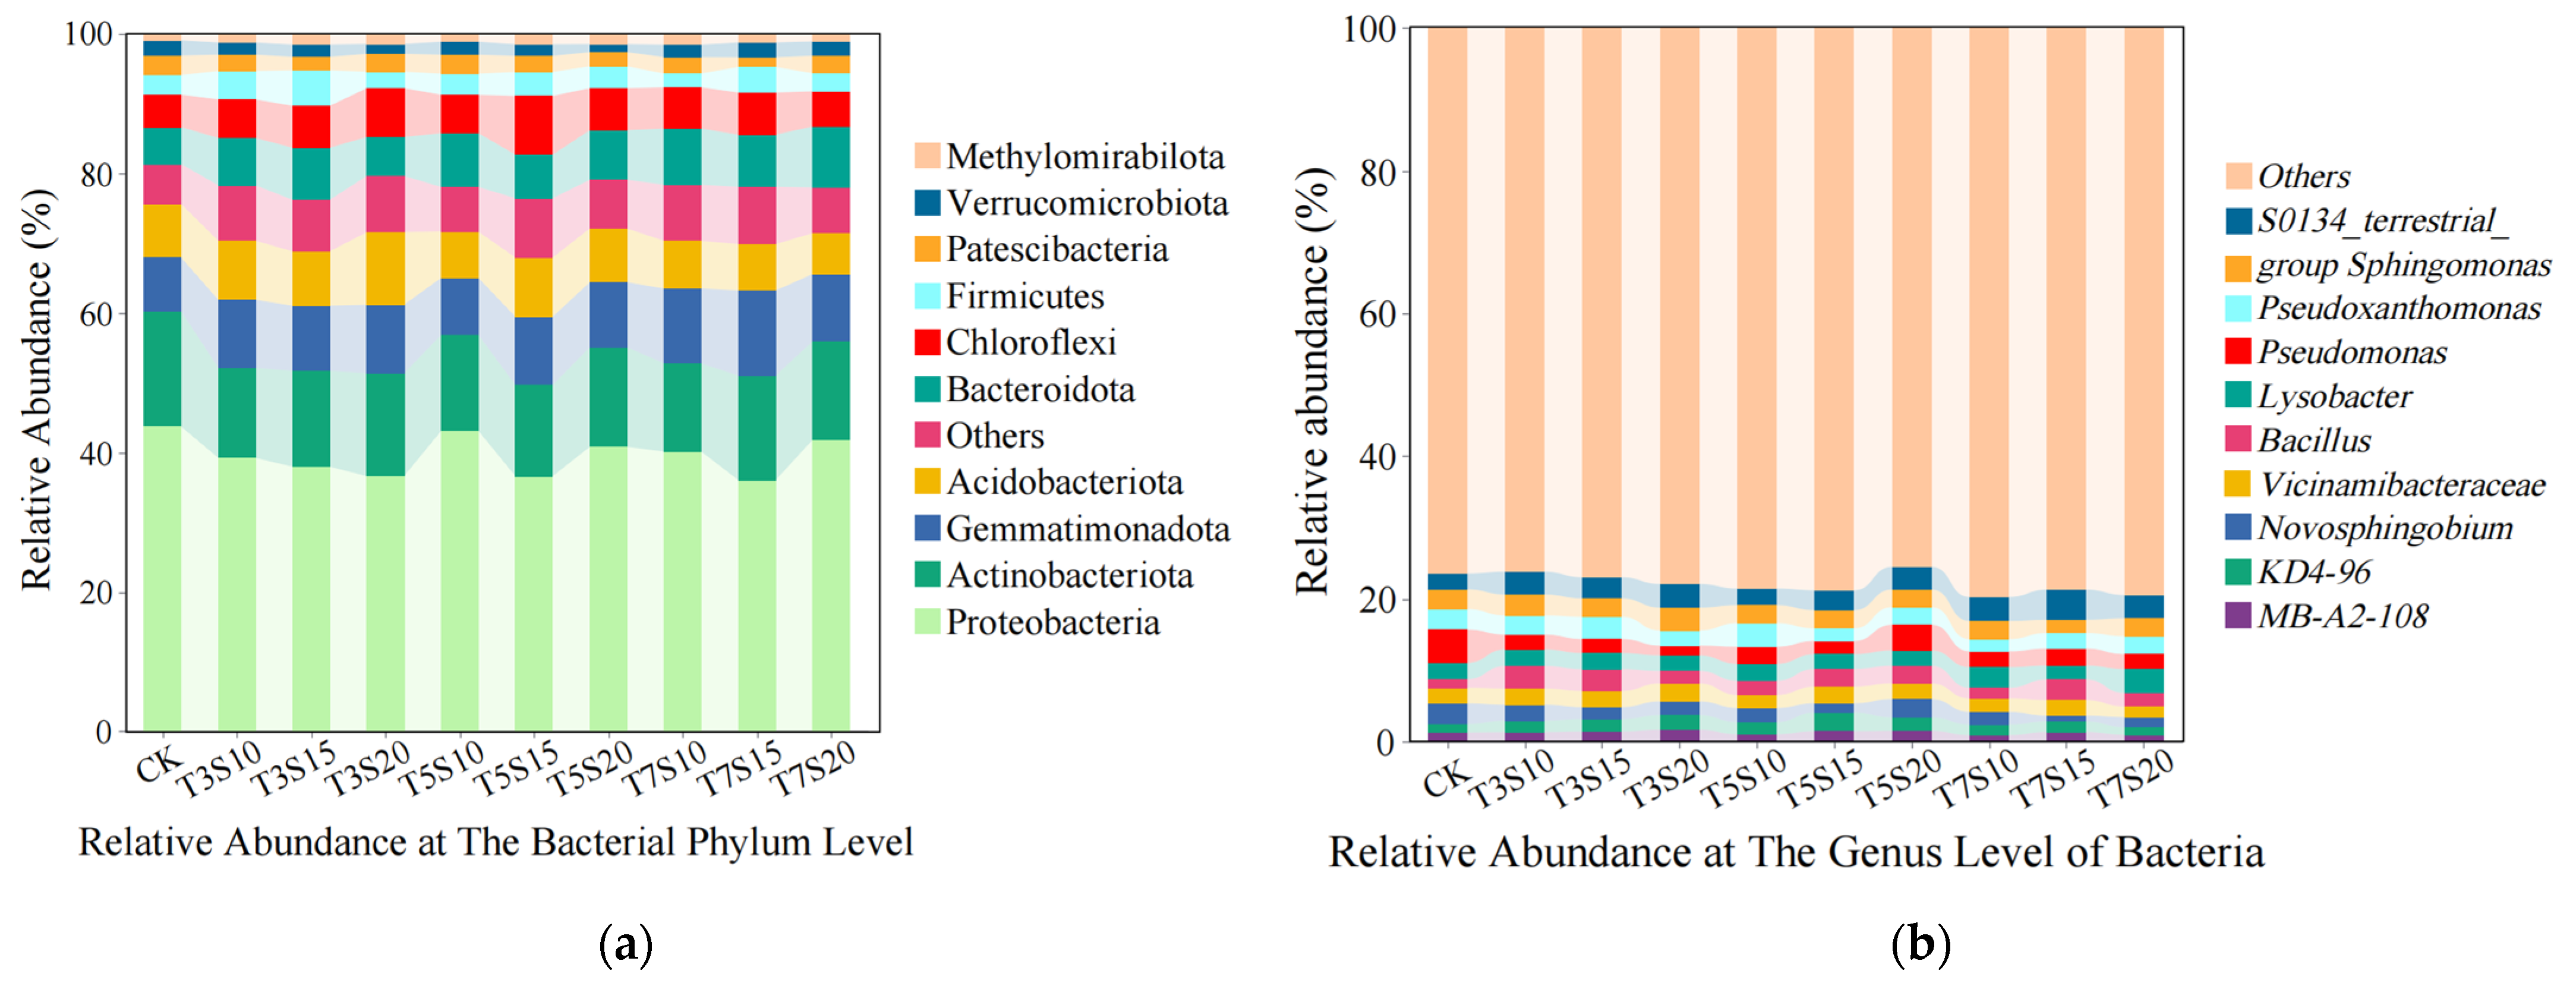
Research results indicate that within the rhizosphere bacterial community, the dominant phyla with relative abundances exceeding 5% mainly include Proteobacteria (36.78–43.50%), Actinobacteriota (12.72–16.80%), Gemmatimonadota (7.31–11.69%), Acidobacteriota (5.90–10.44%), Bacteroidota (5.23–8.71%), and Chloroflexi (4.67–8.44%). Together, these groups account for more than 80% of the total bacterial community (Figure 3a). Among them, the relative abundance of Bacteroidota is positively correlated with MD; in the T7S20 treatment, which experienced the most severe stress, its relative abundance reached 8.71%, representing a 66.54% increase compared to the CG. Meanwhile, the relative abundance of Chloroflexi shows a trend of initially increasing and then decreasing, reaching a peak value of 8.64% in the T5S15 treatment, an 82.73% increase over the CG. Additionally, under low to medium MD conditions, reducing SAR can enhance the relative abundances of both Proteobacteria and Bacteroidota.
The dominant genera with a relative abundance exceeding 2% include Gemmatimonadota bacterium S0134_terrestrial_group (genus, 2.19–4.16%), Pseudoxanthomonas (1.73–4.12%), Sphingomonas (1.86–3.22%), Pseudomonas (1.28–4.28%), Lysobacter (1.97–3.47%), Bacillus (1.22–3.16%), Vicinamibacteraceae (1.49–2.52%), Novospingobium (0.83–2.93%), and Chloroflexi bacterium KD4-96 (genus, 1.09–2.62%). Together, these genera account for more than 19% of the total bacterial community (Figure 3b). Among them, Pseudomonas exhibits the highest relative abundance in the CG; the relative abundances of Pseudoxanthomonas, Sphingomonas, and Novospingobium decrease with increasing MD; while Bacillus and Vicinamibacteraceae show an initial increase followed by a decrease with increasing MD, reaching their peaks at T3.
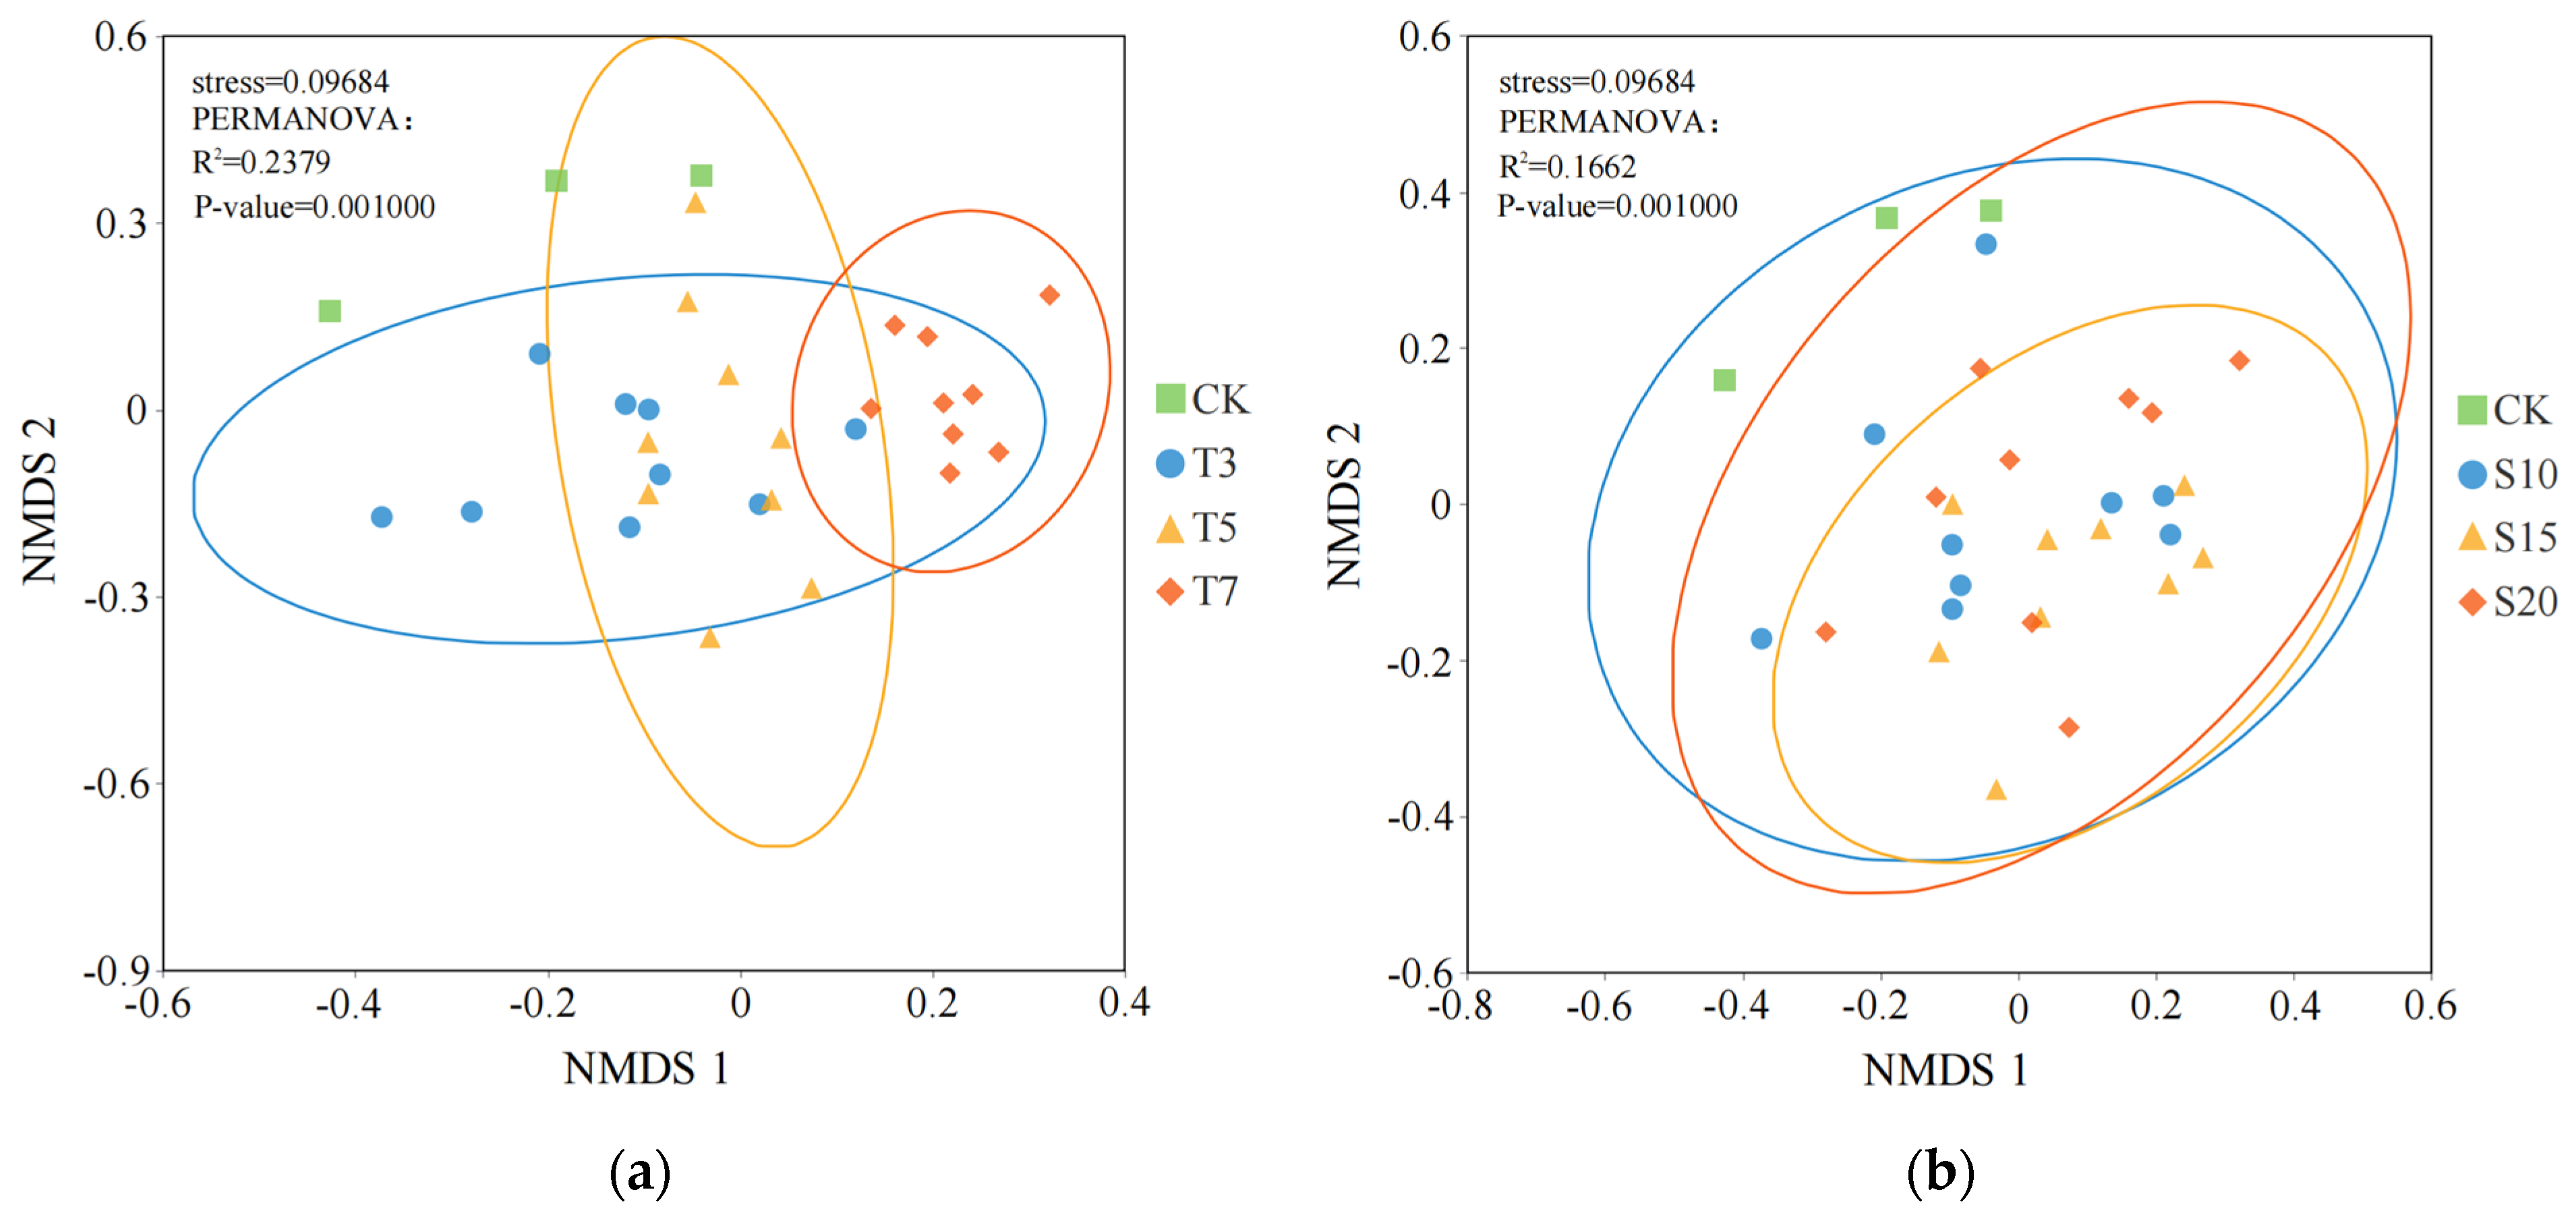
The non-metric multidimensional scaling (NMDS) analysis and permutational multivariate analysis of variance (PERMANOVA) results of the rhizosphere bacterial community based on Bray–Curtis distance showed that the stress value of the NMDS analysis was 0.09684 (stress value < 0.2), indicating that the results of this analysis were relatively reliable (Figure 4). The permutational multivariate analysis of variance showed a p-value of 0.001, demonstrating that both irrigation water MD and SAR have significant effects on rhizosphere bacterial community variation, explaining 23.79% and 16.62% of the variation, respectively. Mineralization degree contributed more significantly to the variation than SAR. Under different MD levels, the CG and the T7 group exhibited the greatest distance, indicating the largest difference in rhizosphere bacterial community composition; whereas under different SAR levels, although there were also significant differences in community composition, these differences were less pronounced compared to those observed under different MD levels.
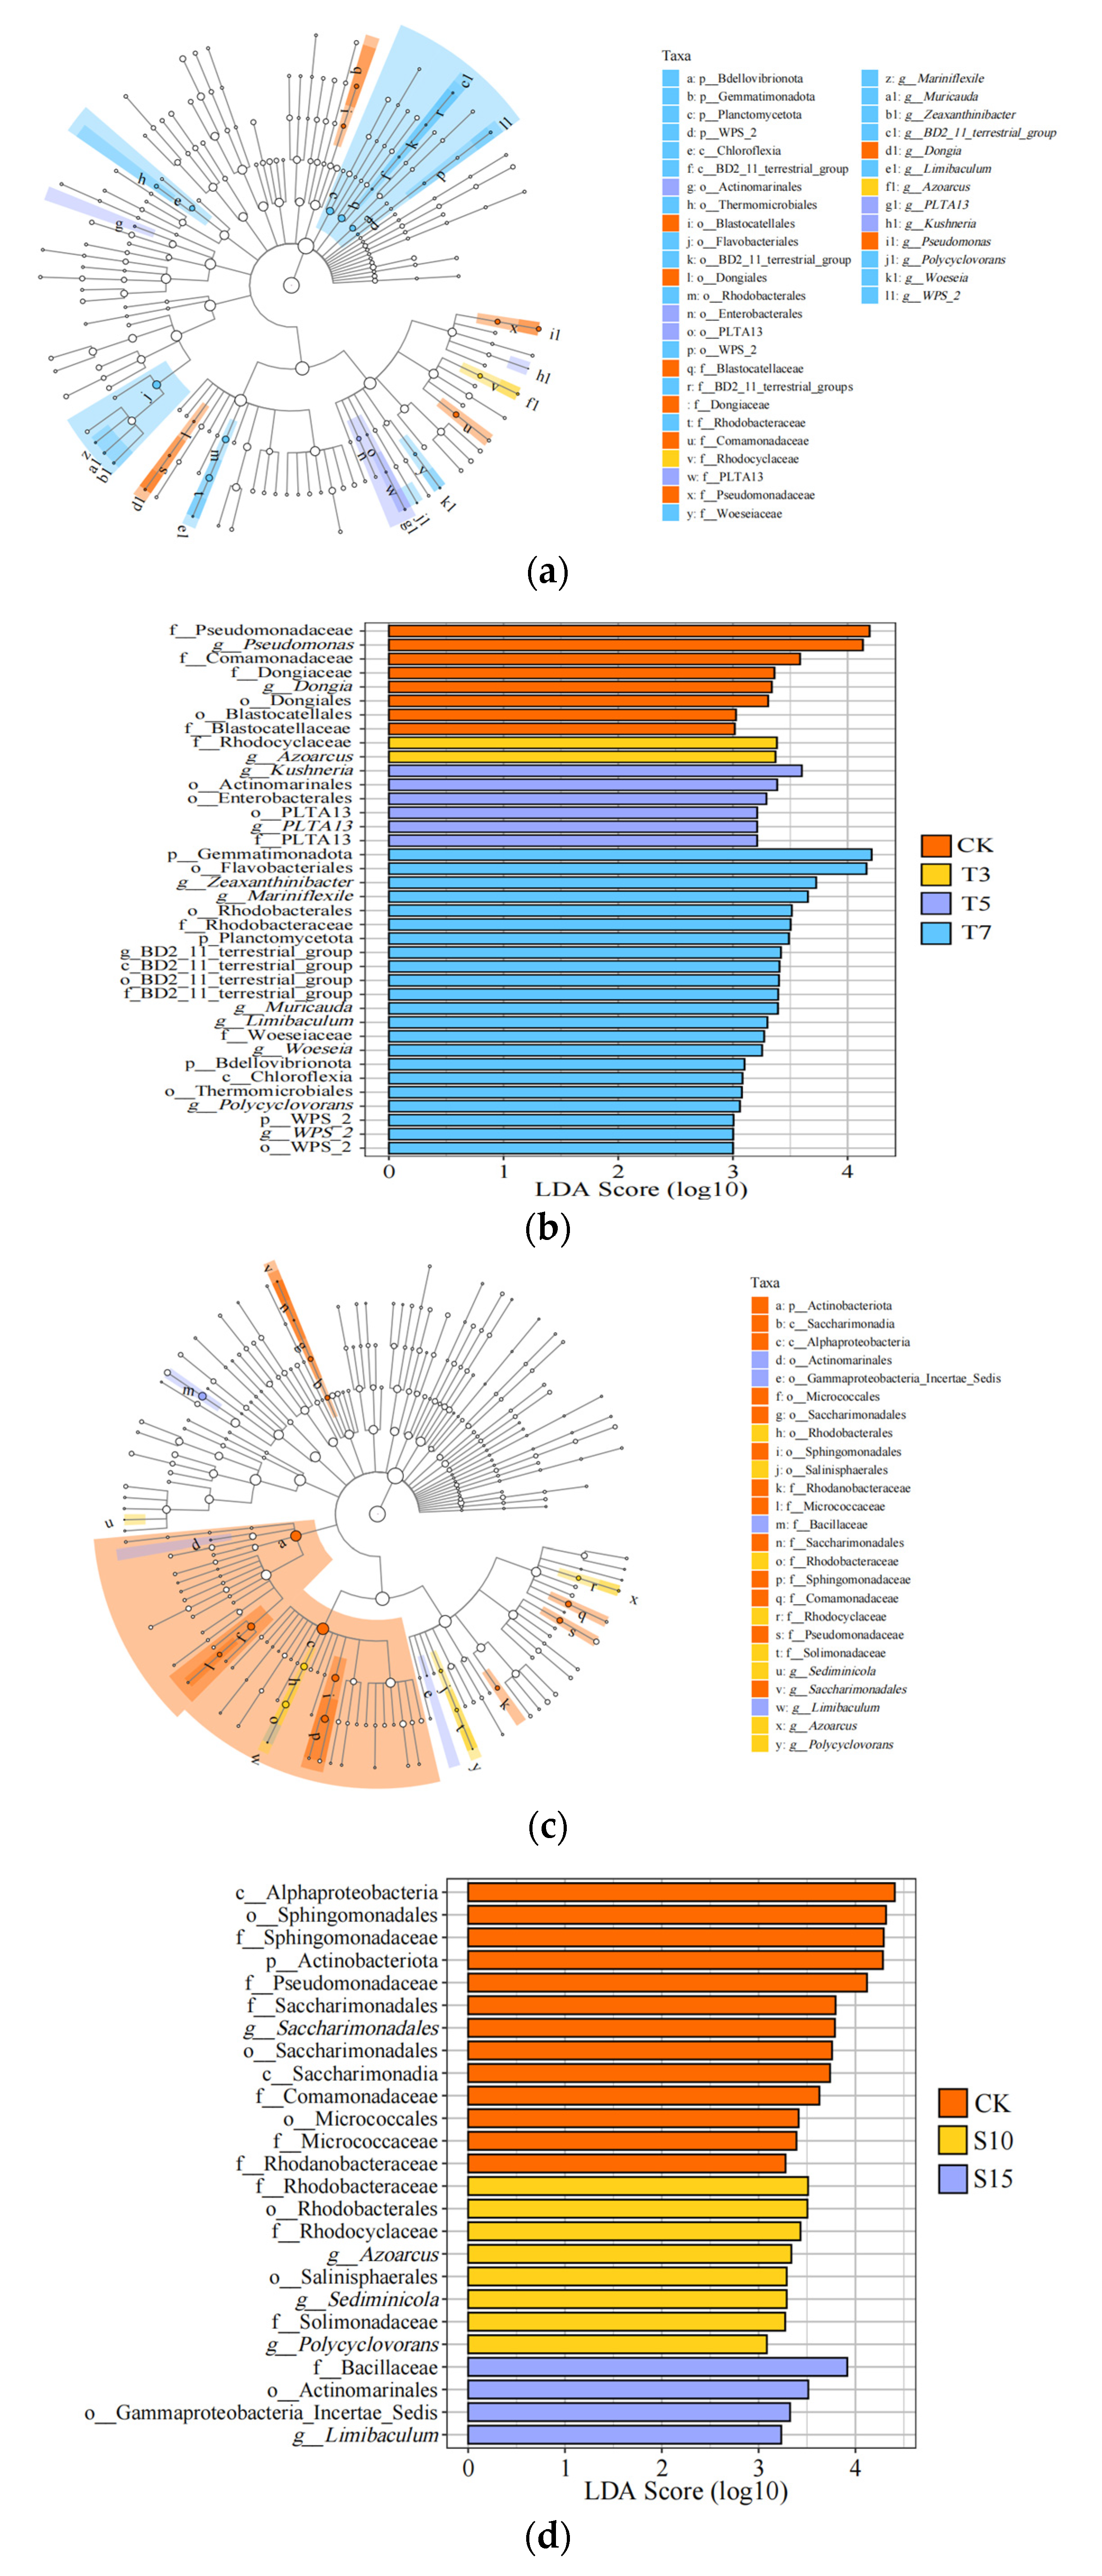
When using Linear discriminant analysis Effect Size, only species with a score greater than 3.0 are displayed. The results show that, at the MD level, a total of 38 significantly different rhizosphere bacterial taxa were detected (Figure 5a), including 8 in the CG, 2 in the T3 treatment, 6 in the T5 treatment, and 22 in the T7 treatment. The number of indicator species in the T7 treatment was notably higher than in the other treatments, indicating that high-MD irrigation water significantly increased the number of indicator species (Figure 5b). Specifically, in the CG, the discriminative genera included Pseudomonas and Dongia; in the T3 group, the discriminative genus was Azoarcus; in the T5 group, the discriminative genera were Kushneria and PLTA13 (Proteobacteria); and in the T7 group, the discriminative phyla were Gemmatimonadota, Planctomycetota, and Bdellovibrionota, while the discriminative genera were Zeaxanthinibacter, Mariniflexile, Muricauda, Limibaculum, Woeseia, and Polycyclovorans.
At the SAR level, a total of 25 significantly different rhizosphere bacterial taxa were detected, with 13 detected in the CG, 8 in the S10 treatment, and 4 in the S15 treatment (Figure 5c). With increasing SAR, the number of indicator species gradually decreased, indicating that reducing SAR helps to increase the number of indicator species (Figure 5d). Specifically, in the CG, the discriminative phylum was Actinobacteriota and the discriminative genus was Saccharimonadales; in the S10 treatment, the discriminative genera were Azoarcus, Sediminicola, and Polycyclovorans; in the S15 treatment, the discriminative genus was Limibaculum.

3.2. Impact of Saltwater Irrigation on Rhizosphere Bacterial Co-Occurrence Networks

A co-occurrence network was constructed using ASVs with a discovery rate of at least 20% and an abundance ranking within the top 300 to explore the interactions among rhizosphere bacterial communities under different treatments (Table 3). The results indicated that saline irrigation generally reduced the proportion of positive correlation edges in the rhizosphere bacterial network. In the T5 treatment, the proportion of positive correlation edges (54.60–56.12%), average degree (103.51–128.99), and network density (0.346–0.431) were all higher compared to those in T3 and T7, suggesting that the salinity level in T5 was conducive to promoting the synergistic effect among rhizosphere bacteria. At level T3 and T5, as the SAR increased, the variation range of the proportion of positive correlation edges and the average clustering coefficient in the rhizosphere bacterial network was relatively small, being only 1.42% and 0.012, and 1.62% and 0.008, respectively, indicating that the rhizosphere bacterial network was relatively stable under low to medium salinity levels. At level T5 and T7, the proportion of positive correlation edges, average degree, and network density in the rhizosphere bacterial network initially decreased and subsequently increased, which may be attributed to the high SAR environment selecting for halophilic dominant species, leading to the formation of a highly specialized community structure. The analysis of phyla in the networks of each treatment showed that the top six dominant phyla were Proteobacteria, Actinobacteriota, Acidobacteriota, Gemmatimonadota, Bacteroidota, and Chloroflexi (Table 4).

3.3. Impact of Saltwater Irrigation on Soil Environment

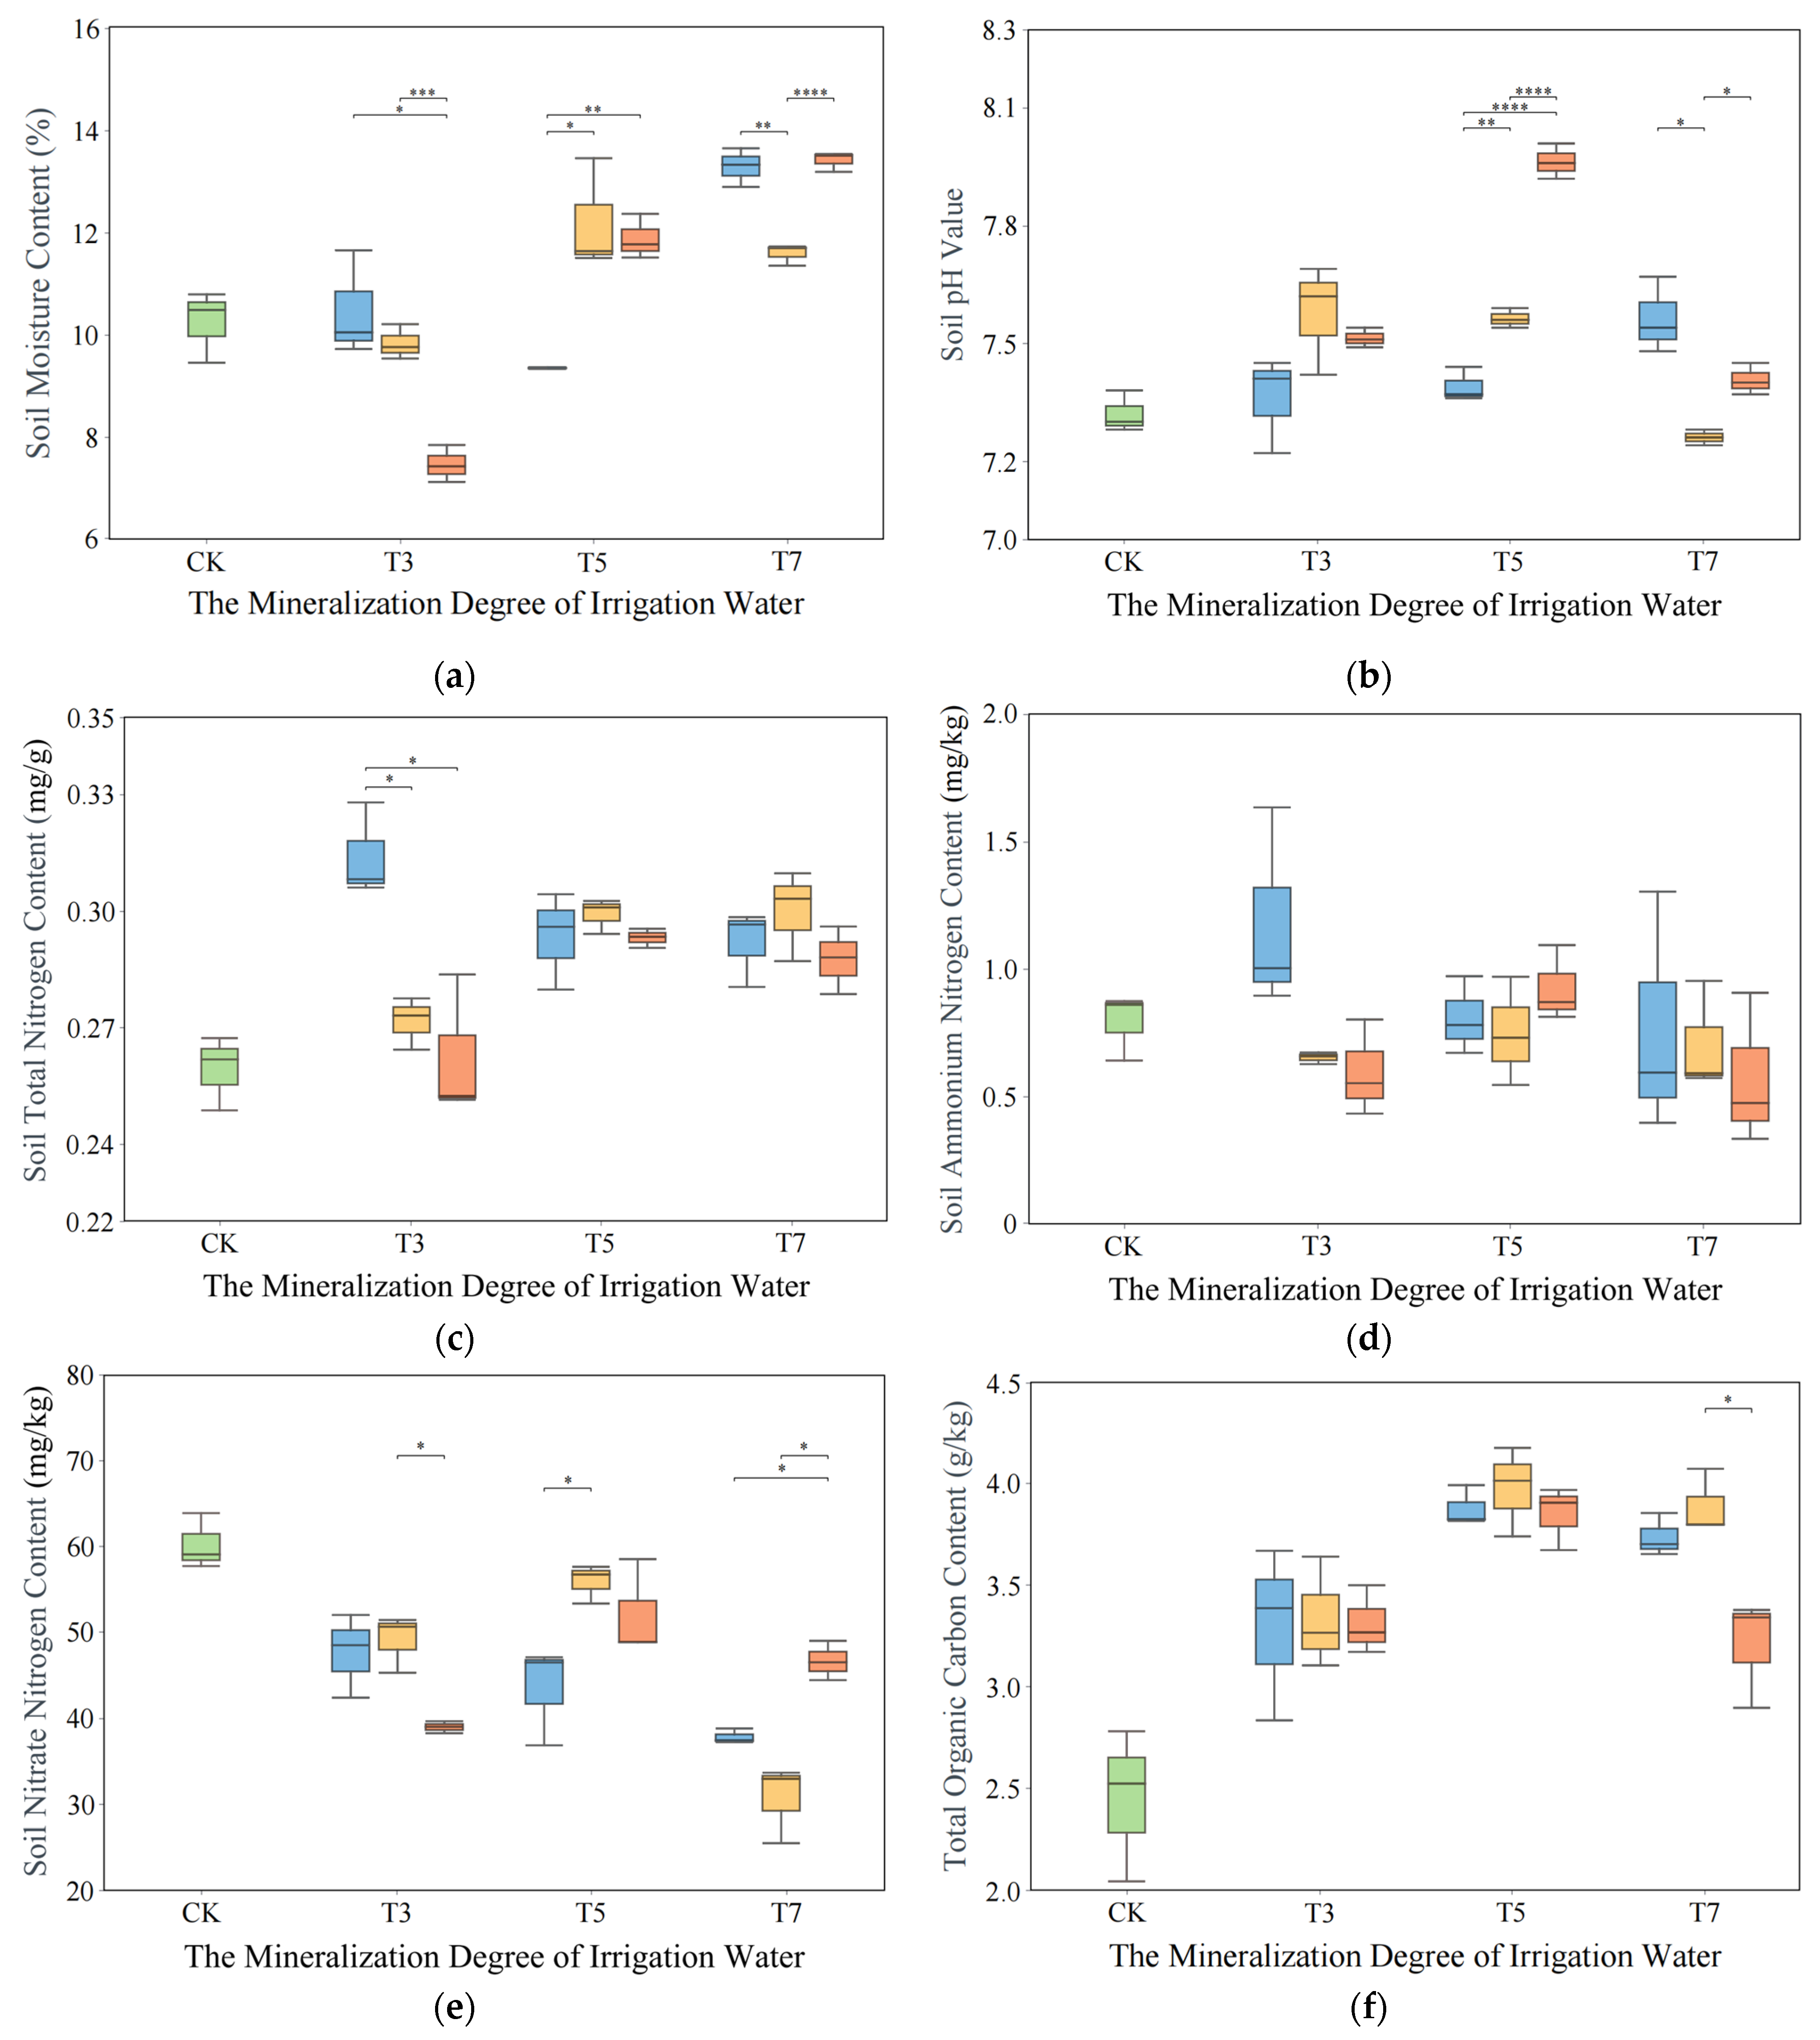
After increasing the MD of the irrigation water, the MC initially decreases and then increases (Figure 6a). In the treatment of T3S20, the MC dropped to its lowest level, indicating that under the T3 condition, the salt effectively promotes plant growth and enhances the roots’ ability to absorb water; however, when the MD exceeds a certain threshold, an overly high salt concentration can inhibit plant growth, leading to reduced root water absorption. Increasing the irrigation water’s MD also raises the soil pH (Figure 6b) and TKN content (Figure 6c), while the NO3-N content decreases (Figure 6e); under the T7 condition, the NH4+-N content also decreases (Figure 6d). The total organic carbon content (Figure 6f) shows a trend of first increasing and then decreasing, reaching its peak at T5.
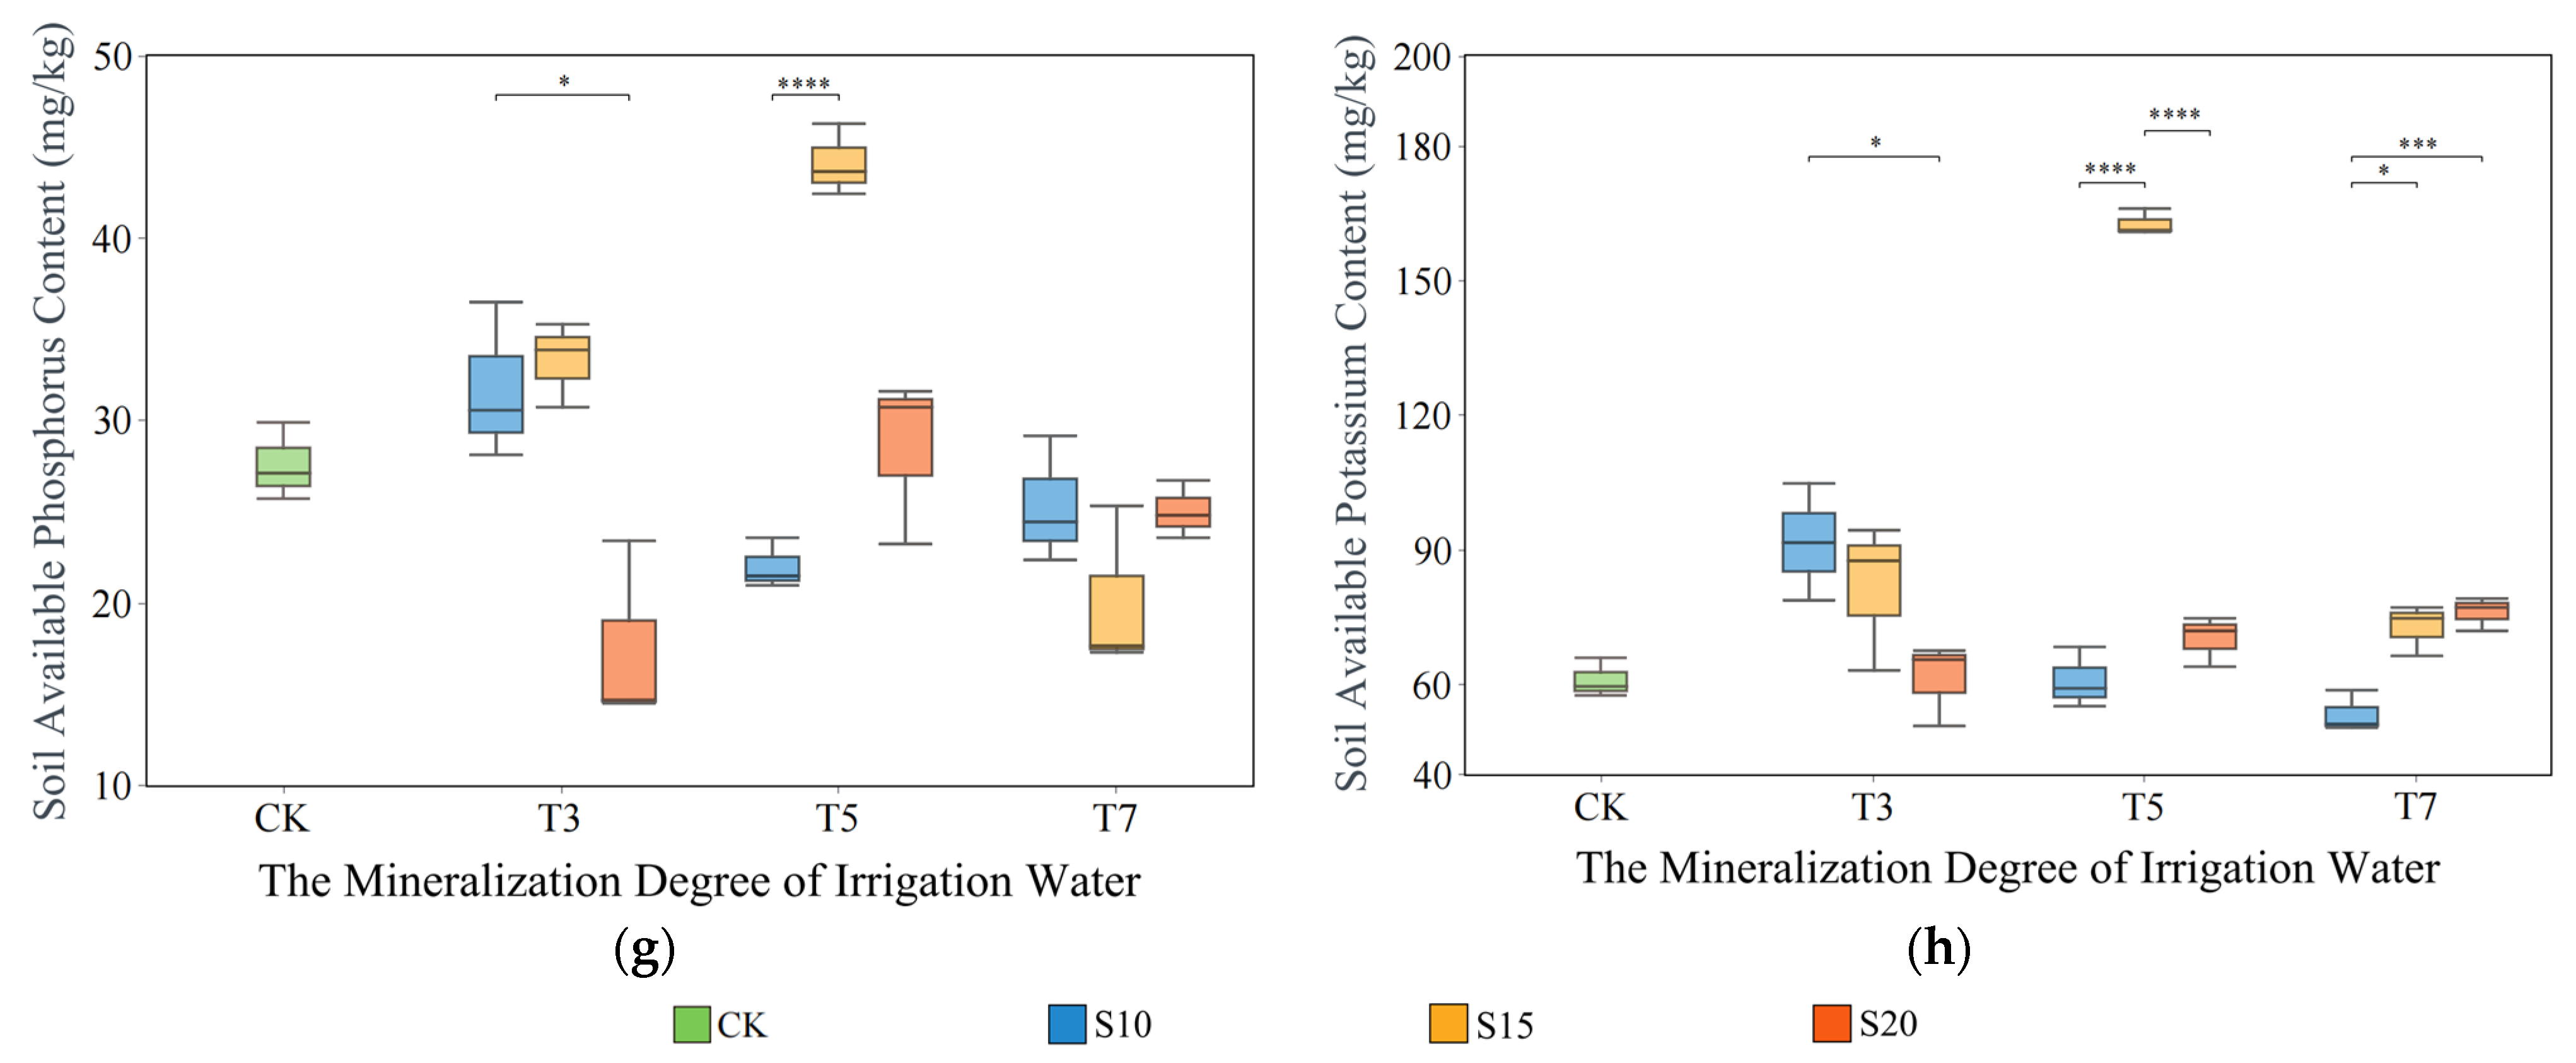
Under the irrigation conditions of T3 and T5, reducing SAR significantly increases the content of nutrients such as ammonium nitrogen, total nitrogen, organic carbon, available potassium (Figure 6g), and available phosphorus (Figure 6h) in the soil. Particularly under T3 conditions, the contents of total nitrogen, ammonium nitrogen, available phosphorus, and available potassium in the soil increased significantly by 19.66%, 26.10%, 89.41%, and 49.76%, respectively (p < 0.05). Reducing SAR effectively mitigates the accumulation of Na+ in the soil and decreases the soil pH value. Notably, under T5 salinity conditions, the pH value is significantly reduced by 0.57 units (p < 0.01). This not only alleviates salt–alkali stress but also optimizes the rhizosphere bacterial community structure, as reflected by an increase in diversity indices and a rise in the relative abundance of dominant phyla. The enhanced rhizosphere bacterial metabolic activity further accelerates the transformation and accumulation of soil nutrients, thereby improving the overall soil environment.

3.4. Relationship Between Rhizosphere Bacterial Community Structure and Soil Environmental Factors

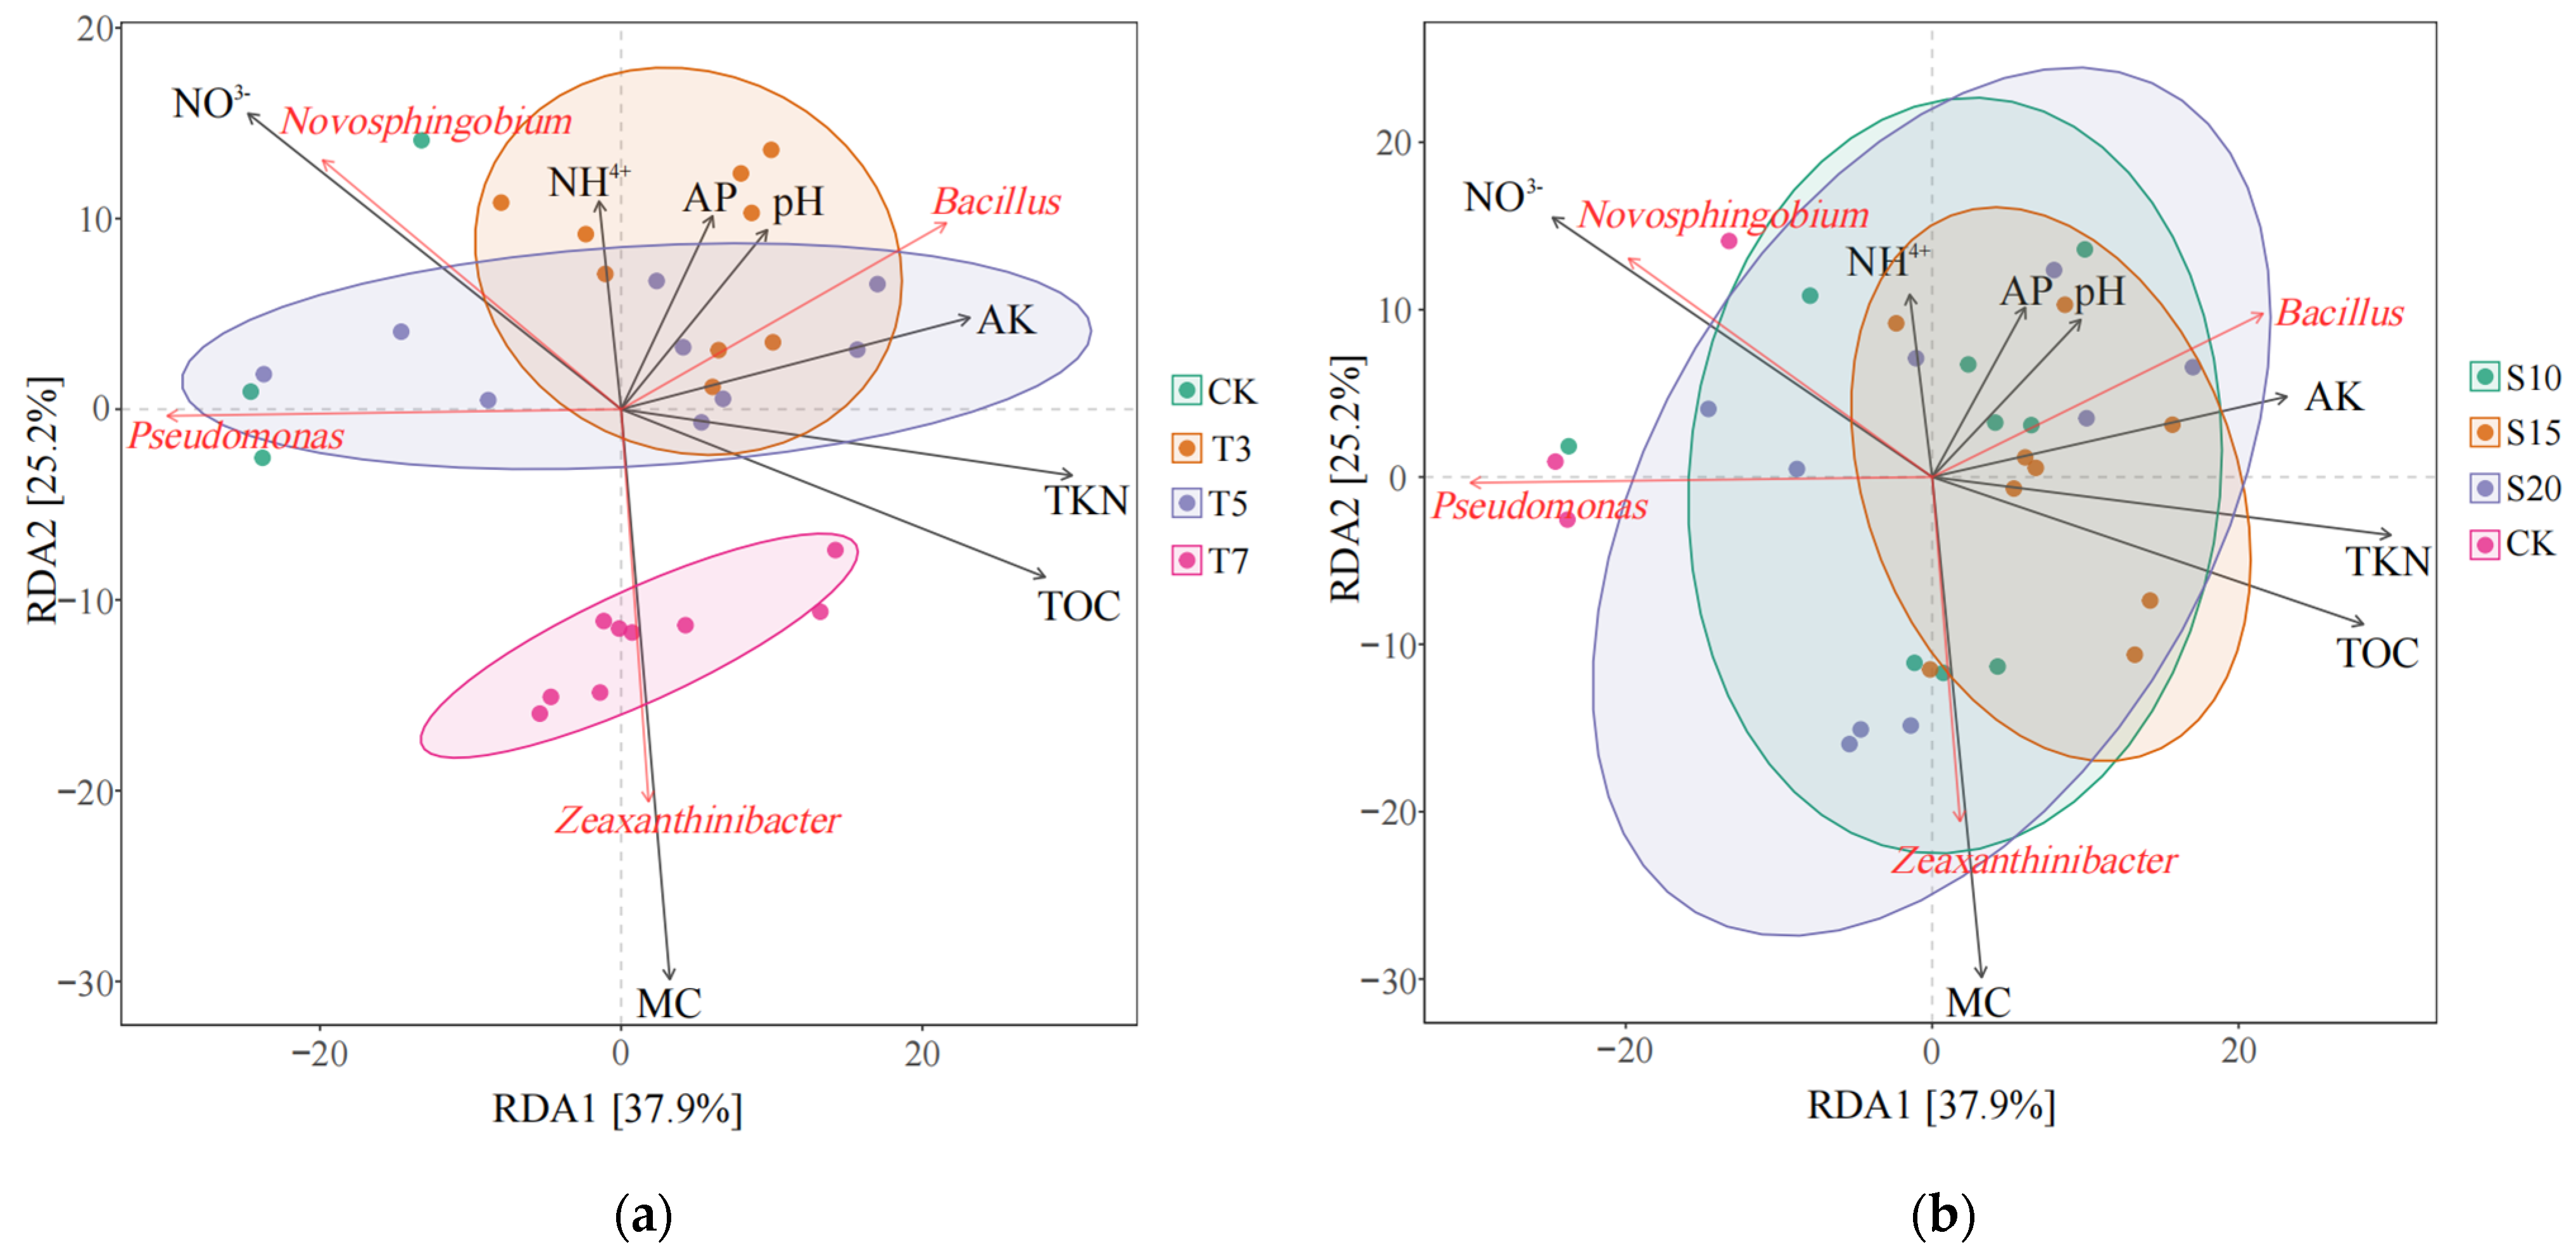
The Redundancy analysis (RDA) results show that axis 1 and axis 2 jointly explain 63.1% of the total variance (Figure 7). Among them, MC (explanatory degree 52.27%, p = 0.001), NO3-N (explanatory degree 31.63%, p = 0.006), TKN (explanatory degree 27.41%, p = 0.010), and TOC (explanatory degree 34.13%, p = 0.006) have a significant impact on the rhizosphere bacterial community composition, whereas pH, NH4+-N, AP, and AK do not show significant effects (Table 5). The relative influence of the key environmental factors is ranked as follows: MC > TOC > NO3-N > TKN > AK > NH4+-N > AP > pH. Correlation analysis indicates that AP is extremely significantly positively correlated with NO3-N, and AK is extremely significantly positively correlated with AP (p < 0.001); TOC is extremely significantly positively correlated with TKN (p < 0.01); TKN is significantly positively correlated with MC, AP with pH, AK with NO3-N, and AK with TKN (p < 0.05); TKN is negatively correlated with NO3-N; and NO3-N is significantly negatively correlated with TOC (p < 0.05) (Figure 8).
For the dominant and salt-tolerant bacterial genera that responded significantly to environmental factors, a Mantel test using the Pearson correlation calculation method was conducted (Figure 8). The results showed that the genera Pseudomonas, Bacillus, and Zeaxanthinibacter were extremely significantly positively correlated with TOC (p < 0.01); the genus Novosphingobium was significantly positively correlated with NO3-N and TOC (p < 0.05); and Pseudomonas was significantly positively correlated with NO3-N and TKN (p < 0.05). However, it should be noted that all statistically significant correlations were weak (r < 0.2), while the extremely significant correlations were moderate (0.2 < r < 0.4) (Table 6).

4. Discussion

4.1. Influence of Irrigation Water Ion Composition on the Structure and Composition of Rhizosphere Bacteria in Cotton

Accumulation of soil salinity can alter the diversity and richness of rhizosphere bacterial community structures [44]. In this study, although saltwater irrigation increased the Chao1 and Shannon indices of the cotton rhizosphere bacterial community, the differences between groups were not statistically significant. Chen et al. [45] demonstrated that slightly saline water irrigation can increase the rhizosphere bacterial Chao1 index. Chen et al. [46] found that under mild to severe stress from NaCl and Na2SO4, the α-diversity of the rhizosphere bacterial community increased. Shamim et al. [47] investigated the effects of different saline water irrigation sources on the bacterial community of date palm trees in arid agricultural ecosystems and reported no significant differences in bacterial α-diversity between the various irrigation sources, which is consistent with the results of this study. Other research indicates that bacterial biomass reaches its peak under moderate salinity conditions [48]. However, a long-term study on slightly saline drip irrigation by Guo et al. [49] showed a significant reduction in the Chao1 and Shannon indices of the soil bacterial community, resulting in decreased diversity and richness—findings that differ from those of the current study. The discrepancy may be attributed to factors such as the application of acidic nitrogen fertilizers, incomplete nitrogen cycling in the soil, or variations in microbial tolerance to salt stress under different environmental conditions [50]. Overall, these results illustrate that the response of bacterial community richness and diversity to saline water irrigation is influenced by both salinity range and environmental complexity. Under the same level of MD, reducing SAR can enhance the Chao1 and Shannon indices of the cotton rhizosphere bacterial community. Zhang et al. [51] increased the richness of the bacterial community by reducing the soil SAR through biochar application. Typically, high SAR is associated with elevated salt–alkali stress and pH, while bacterial community diversity is higher in neutral or acidic soils [52]. Reducing SAR not only helps to decrease soil salt accumulation, alleviate salt–alkali stress, and adjust pH, but also improves the soil cation exchange capacity, thereby enhancing soil fertility [53] and reducing the bioavailability of heavy metals [54]. Ultimately, this promotes an increase in the diversity and richness of the bacterial community. Liu et al. [55] investigated the effects of long-term continuous cotton cultivation in Xinjiang on soil bacterial community diversity, and Petermann et al. [56] reported on the characteristics of bacterial community diversity in semi-arid desert cotton soils. Both studies showed that Proteobacteria, Actinobacteriota, Gemmatimonadota, Acidobacteriota, Bacteroidota, and Chloroflexi were the dominant phyla.
In saline–alkali soils, there exists a large community of salt–alkali-tolerant microorganisms. These microorganisms have evolved unique physiological mechanisms to resist salinity and alkalinity, directly participating in the transformation of substances and energy flow within saline–alkali environments. They play an important role in maintaining ecosystem stability and enhancing crop stress resistance [57]. The results of this study indicate that under different levels of MD, the T7 treatment showed the highest number of indicator species; with respect to SAR levels, the number of indicator species was negatively correlated with SAR, where the CG had the highest number of indicator species and the S20 treatment had none. This suggests that increasing the MD of irrigation water is conducive to the proliferation of salt-tolerant bacteria, but it will lead to a reduction in the number of salt-sensitive bacteria; conversely, reducing the SAR can effectively alleviate the toxic effects of Na⁺ on rhizosphere bacteria, enhance bacterial species richness, and promote bacterial metabolic activities.
In the treatment of T7, significant indicator species were distributed across three phyla and six genera. At the phylum level, Gemmatimonadota, Planctomycetota, and Bdellovibrionota exhibited significant differences. Gemmatimonadota is one of the major phyla in soil ecosystems, maintaining a balance between metabolic activity and environmental stress tolerance through a slow-growth strategy [58]. Planctomycetota possesses notable carbohydrate degradation potential and can resist oxidative stress by secreting antagonistic substances, forming biofilms, and utilizing catalase mechanisms, thereby enhancing ecological adaptability [59]. Bdellovibrionota, as an obligate predator, adapts to extreme environments through osmotic regulation and cell wall recycling, while also modulating Gram-negative bacterial communities [60]. At the genus level, the six differential genera are Zeaxanthinibacter, Mariniflexile, and Muricauda (all belonging to the family Flavobacteriaceae of the phylum Bacteroidota); Limibaculum (from the α-Proteobacteria); Woeseia and Polycyclovorans (from the γ-Proteobacteria). Zeaxanthinibacter synthesizes carotenoids through the mevalonate pathway, and its extensive carbon source utilization capability supports its adaptation to a wide range of salinity (0–10% NaCl) and pH (5.5–9.0) environments [61,62]. Mariniflexile is a classic slightly halophilic bacterium capable of metabolizing a variety of carbon sources across a broad range of salinity (0–12% NaCl), temperature (4–40 °C), and pH (4.0–11.5) [63]. Although there is limited research on the application of the genus Mariniflexile in soil remediation, its adaptability and metabolic capabilities in marine environments suggest that it holds potential for soil remediation. Muricauda promotes plant salt ion absorption through organic matter mineralization and nitrogen fixation, thus enhancing the rhizosphere microenvironment [64]. Woeseia possesses both heterotrophic and chemolithoautotrophic metabolic capabilities, participating in nitrification and denitrification processes to drive the nitrogen cycle [65,66]. Polycyclovorans is associated with plant disease resistance and may inhibit pathogens causing bacterial wilt by synthesizing antibacterial compounds [67]. Limibaculum, as a halophilic nitrifying bacterium, can synergize with other microorganisms to promote plant growth [68].
Pseudomonas, Dongia, Azoarcus, and Kushneria all belong to the Proteobacteria. In the CG, the indicator species are Pseudomonas and Dongia. Pseudomonas is a well-known plant growth-promoting bacterium in the rhizosphere, featuring functions such as atmospheric nitrogen fixation, solubilization of insoluble phosphorus and potassium in the soil, and production of plant hormones [69]; some Pseudomonas species can protect seeds and roots from fungal infections by producing secondary metabolites and colonizing the rhizosphere faster than certain pathogens, thereby enhancing plant disease resistance [70]. Dongia possesses functions including nitrogen fixation, promoting the transformation of soil phosphorus, and improving phosphorus availability [71]. In the treatment of T3, the indicator species Azoarcus is a known nitrogen-fixing microorganism that can convert atmospheric nitrogen into plant-accessible NH4+-N [72] while solubilizing insoluble phosphorus and secreting plant hormones (such as IAA) to promote plant root development [73]. In the treatment of T5, the indicator species Kushneria is a halophilic microorganism capable of surviving in environments with NaCl concentrations as high as 26% (w/v) [74].
At the level of SAR, the indicator species in the CG belong to the phylum Actinobacteriota, and at the genus level, they are classified as Saccharimonadales. Actinobacteriota are primarily distributed in soil and freshwater ecosystems. The study by Bao et al. [75] indicates that in the freshwater environment at the mouth of the Yellow River, Actinobacteriota is the dominant phylum, but its relative abundance significantly decreases in seawater. Research on the ecological functions of Saccharimonadales in soil remains limited. Simulation experiments have shown that root exudates can selectively stimulate the enrichment of Saccharimonadales in the maize rhizosphere, where this taxon may play a key role in the soil phosphorus cycle [76]. At level S10 and S15, the use of saltwater irrigation increased the soil’s TKN and TOC content, thereby promoting the expansion of communities of the nitrogen-fixing genus Azoarcus, the nitrogen-cycling functional genus Limibaculum, and the carbon cycle-related genus Polycyclovorans [77]. Although Sediminicola possesses the ability to decompose complex organic matter and participate in nutrient cycling, most research on its ecological function has been focused on marine sediment systems; its role and mechanism in terrestrial soils require further investigation [78].

4.2. Influence of Irrigation Water Ion Composition on the Topological Properties of Co-Occurrence Networks of Cotton Rhizosphere Bacterial Communities

The rhizosphere bacterial co-occurrence network constructed in this study shows that under the T5 and T7 treatment levels, the proportion of positive correlation edges in the network, network density, and average degree all present a trend of initial decrease and subsequent increase with the increase in SAR. Meanwhile, under the S20 condition, both the Chao1 index and Shannon index reach their lowest values, indicating that the high bacterial network topological indices observed in the T5S20 and T7S20 treatments are attributable to a highly specific community structure dominated by halophilic species. The network topological indices in the T5S10 treatment are all relatively high, suggesting that moderately increasing salinity under low SAR conditions can enhance the stability of the rhizosphere bacterial network by increasing the richness and diversity of the rhizosphere bacterial community. Chen et al. [79] studied the effects of straw application on bacterial community diversity and network stability. They found that increased bacterial community diversity strengthens network stability. Additionally, their synergistic interactions help improve soil nutrient status. Guo et al. [80] found in their research on the loss of soil microbial community diversity that an increase in bacterial diversity can promote network stability, emphasizing the important role of diversity in maintaining ecosystem stability. In addition, the study by Qiu et al. [81] on the effects of erosion on soil microbial diversity and network stability further confirms that the enhancement of bacterial community diversity promotes network stability. This study also found that at the T5 level, the topological index of the rhizosphere bacterial network and the content of soil organic carbon were the highest, which might be the optimal balance state between the activity of rhizosphere bacteria and the supply of soil organic matter. In the treatment of T3, reducing SAR could increase the proportion of positive correlation edges, average degree, density, average clustering coefficient of the network, and the content of soil nutrients, further indicating that reducing SAR can enhance the diversity and richness of the rhizosphere bacterial community, thereby improving the stability of the rhizosphere bacterial network structure, and the diversity of the rhizosphere bacterial community and the stability of the network can jointly enhance soil nutrients.

4.3. Relationship Between the Composition of Bacterial Communities in the Rhizosphere of Cotton and Soil Physical and Chemical Properties

Soil pH is one of the key environmental factors affecting bacterial community structure and is often regarded as the main factor explaining bacterial community variation [82,83]. Soil pH influences community structure by regulating bacterial metabolic activities, nutrient absorption, and enzyme-catalyzed reactions [84,85]. Reducing SAR can decrease the concentration of Na⁺ in the soil, which in turn lowers the pH, thereby mitigating the adverse effects of soil alkalinity on bacterial activity and community structure, and promoting nutrient transformation and utilization. However, in this study, the coefficient of determination (R2) for pH was 0.0096, indicating that there is no obvious linear relationship between pH and rhizosphere bacterial community distribution; its explanatory power for rhizosphere bacterial community variation is weak. This may be because at the T7 level, the rhizosphere bacterial community structure has undergone significant changes, and the response mechanisms to different SAR treatments differ from those at lower MD levels, resulting in the absence of a clear linear correlation between pH and overall rhizosphere bacterial community changes.
In saline–alkali soils, the organic matter content is low, the soil structure is loose, and the solution concentration is high, resulting in a lack of nutrients and environmental conditions necessary for microbial survival [86]. Studies have shown that moderate saline–alkali stress can stimulate microbial activity, increasing their diversity and richness, and thereby enhancing soil organic carbon content [87]. Total organic carbon, as an important energy source and carbon source for bacterial metabolic activities, has a mineralization rate that is closely associated with bacterial growth. An appropriate amount of organic carbon helps improve bacterial growth efficiency [88,89]. The results of this study indicate that when the MD of irrigation water does not exceed 5 g/L, an appropriate amount of organic matter provides sufficient substrates for rhizosphere bacterial synthetic activities, promoting rhizosphere bacterial growth and reproduction, thereby increasing the soil organic carbon content; however, as MD further increases, an excessively high saline concentration begins to inhibit bacterial growth and the mineralization rate, causing the mineralization rate to fall below the synthesis rate [90]. In addition, under high MD conditions, other inhibitory factors can also adversely affect bacterial mineralization activities, ultimately leading to a decrease in soil organic carbon content. Surey et al. [91] found that among soil exchangeable base ions, Na+, as a high-intensity dispersant, can cause extensive dispersion of soil particles and disrupt soil aggregates, which is detrimental to the retention of soluble TOC. This aligns with the current experimental results, indicating that reducing the Na⁺ content in irrigation water can increase the soil TOC content.
As the irrigation water MD increases, the input of organic matter into the soil rises, and rhizosphere bacterial activity is enhanced. Under bacterial decomposition, the organic matter releases NH4+-N and organic nitrogen, leading to an increase in the TKN content of the soil [92]. The increase in TKN broadens the ecological niches of nitrogen-cycling bacteria and significantly enhances the diversity of bacterial functional genes involved in nitrification [93]. The important substrate for bacterial nitrification and denitrification is NO3-N, while NH4+-N is a key substrate for bacterial ammonification and nitrification [94]. Both substrates can significantly affect the structure of the soil bacterial community [95,96]. Rhizosphere bacteria, through fixation and assimilation, convert NO3-N in the soil into organic nitrogen, thereby relatively reducing this NO3-N content. At level T3 and T5, the decomposition of organic matter by bacteria releases a certain amount of NH4+-N, with some of the NH4+-N subsequently being converted into NO3-N by nitrifying bacteria [97]. However, because the rate of nitrification is comparable to the rate at which NH4+-N is replenished, the overall NH4+-N content remains relatively unchanged. At level T7, the intensified competition for adsorption between the numerous salt ions and NH4+, along with the reduced adsorption capacity of soil colloids for NH4+, leads to an increase in free NH4+ in the solution [98]. These free NH₄⁺ are easily lost from the soil through volatilization or leaching, ultimately resulting in a decrease in soil NH4+-N content. The study results indicate that at level T3 and T5, reducing the SAR can significantly increase the levels of AP, AK, TKN, NH4+-N, and NO3-N. This suggests that under conditions of low to medium mineralization, reducing the SAR can effectively alleviate the adverse impact of salt–alkaline stress on the rhizosphere bacterial community, promote rhizosphere bacterial growth and metabolism, and improve soil nutrient content. Basak et al. [99] found results consistent with those of this study, indicating that soils with high Na+ content have lower nutrient levels, particularly available nitrogen, which shows a significant decrease.
The Mantel test analysis indicated that Novosphingobium, Pseudomonas, and Bacillus all possess nitrogen transformation functions. By participating in nitrification, they can efficiently utilize NO3-N to drive microbial proliferation [100]. This is consistent with the results of the present study, which showed that these three genera are significantly positively correlated with NO3-N (p < 0.05). Although all three genera were positively correlated with TKN, only Pseudomonas exhibited a significant positive correlation with TKN (p < 0.05). This may be due to the notable ability of Pseudomonas to decompose organic nitrogen, effectively converting soil organic nitrogen into inorganic nitrogen, thereby promoting the accumulation of TKN [101]. Soil TOC was significantly positively correlated (p < 0.05) with the four dominant genera, among which Pseudomonas, Bacillus, and Zeaxanthinibacter showed extremely significant correlation coefficients with TOC (p < 0.01) [102]. It is noteworthy that in the RDA analysis, the vector for Pseudomonas formed an obtuse angle with the TOC vector. This may be due to two reasons: on one hand, Pseudomonas is relatively sensitive to saline–alkali stress, and high salinity limits its biological activity; on the other hand, the organic matter introduced by irrigation water with high mineralization is primarily mineralized into TOC by salt-tolerant microbial communities. In this process, Pseudomonas does not play a dominant role, leading to a negative correlation with TOC.

5. Conclusions

In arid and freshwater-scarce saline–sodic sandy loam areas, saline water irrigation can enhance the diversity and richness of the bacterial communities in the cotton rhizosphere soil and significantly alter the structure of the bacterial community in the rhizosphere. Reducing SAR is an effective approach to promote the enhancement of rhizosphere bacterial community diversity under mildly saline irrigation conditions, and the rhizosphere increased bacterial community diversity in turn provides strong support for improving rhizosphere bacterial network stability. The diversity of the rhizosphere bacterial community and network stability can work synergistically to enhance soil nutrient content. Reducing SAR can lower soil pH, thereby increasing the diversity and richness of the rhizosphere bacterial community. MC, TKN, NO3-N, and TOC are key environmental factors influencing the rhizosphere bacterial community structure. Under mildly saline water irrigation conditions (T3 and T5), reducing SAR can significantly increase the soil nutrient content.

Supplementary Materials

The following supporting information can be downloaded at: https://www.mdpi.com/article/10.3390/agronomy15040895/s1, Figure S1: The test site is located in Alar City, Xinjiang, China.

Author Contributions

Conceptualization, J.W. and H.N.; methodology, H.N. and G.Y.; software, G.Y. and C.Z.; investigation, G.Y., C.Z., Y.X. and Y.S.; resources, G.Y., C.Z., Y.X. and Y.S.; data curation, C.Z.; writing—original draft preparation, C.Z.; writing—review and editing, J.W., H.N. and G.Y.; project administration, J.W. and H.N. All authors have read and agreed to the published version of the manuscript.

Funding

This work was supported by the National Key R&D Program of China (no. 2022YFD1900502), the Central Public-interest Scientific Institution Basal Research Fund (Farmland Irrigation Research Institute, CAAS, FIRI2022-06), the Earmarked Fund for China Agriculture Research System (CARS-15-13), and the “Tianchi Yingcai” Introduction Plan.

Data Availability Statement

The data presented in this study are available on request from the corresponding author, as some of the original data contain private information of the cooperating units that has not been made public.

Acknowledgments

Thanks to the guidance and assistance of Researcher Guomin Zhou, a specially appointed expert under the “Tianchi Yingcai” Introduction Plan. Thanks to the support of the Henan Field Observation & Research Station of High-Efficient Agricultural Water Use platform. Thanks to the Alar Modern Agricultural Experts Experiment Station for providing the experimental site.

Conflicts of Interest

The authors declare no conflicts of interest.

Abbreviations

The following abbreviations are used in this manuscript:
AKavailable potassium
APavailable phosphorus
ASVsAmplicon Sequence Variants
LEfSeLinear discriminant analysis Effect Size
LDALinear discriminant analysis
MCsoil moisture content
MDmineralization degree
NH4+-Nammonium nitrogen
NMDSnon-metric multidimensional scaling
NO3-Nnitrate nitrogen
PERMANOVApermutational multivariate analysis of variance
RDARedundancy analysis
SARsodium adsorption ratio
TOCtotal organic carbon
TKNtotal nitrogen

References

  1. USDA Foreign Agricultural Service. Cotton: World Markets and Trade. 11 February 2025. Available online: https://usda.library.cornell.edu/concern/publications/kp78gg36g?locale=en (accessed on 17 March 2025).
  2. Rao, S.S.; Tanwar, S.P.S.; Regar, P.L. Effect of deficit irrigation, phosphorous inoculation and cycocel spray on root growth, seed cotton yield and water productivity of drip irrigated cotton in arid environment. Agric. Water Manag. 2016, 169, 14–25. [Google Scholar] [CrossRef]
  3. Zhang, J.; Soothar, R.K.; Shar, S.U.; Alharthi, B.; Shaikh, I.A.; Laghari, M.; Das, S.J.; Samoon, A.; Jamali, N.A.; Fiaz, S.; et al. Responses of cotton yield and water productivity to irrigation management: Assessment of economic costs, interactive effects of deficit irrigation water and soil types. Discov. Life 2025, 55, 1. [Google Scholar] [CrossRef]
  4. Zhang, J.; Ding, J.; Wang, J.; Zhang, Z.; Tan, J.; Ge, X. Spatial heterogeneity response of soil salinization inversion cotton field expansion based on deep learning. Front. Plant Sci. 2024, 15, 1437390. [Google Scholar] [CrossRef]
  5. FAOSTAT. Available online: https://www.fao.org/faostat/en/#data/QCL/visualize (accessed on 17 March 2025).
  6. National Bureau of Statistics of China. Announcement on Cotton Production in 2024. National Bureau of Statistics of China. 25 December 2024. Available online: https://www.stats.gov.cn/sj/zxfb/202412/t20241225_1957879.html (accessed on 2 March 2025).
  7. Wu, Q.; Liang, Y.; Gao, F.; Du, M.L.; Wu, B.; Liu, J. Analysis of chemical characteristics, distribution and cause of formation of brackish water in Alar City, Xinjiang. Environ. Chem. 2021, 40, 737–745. [Google Scholar]
  8. FAO. Global Status of Salt-Affected Soils—Main Report; FAO: Rome, Italy, 2024. [Google Scholar] [CrossRef]
  9. Li, S.; Zhao, L.; Wang, C.; Huang, H.; Zhuang, M. Synergistic improvement of carbon sequestration and crop yield by organic material addition in saline soil: A global meta-analysis. Sci. Total Environ. 2023, 891, 164530. [Google Scholar] [CrossRef]
  10. Ghassemi, F. Salinisation of Land and Water Resources: Human Causes, Extent, Management and Case Studies; University of New South Wales Press Ltd.: Sydney, Australia, 1995. [Google Scholar]
  11. Litalien, A.; Zeeb, B. Curing the earth: A review of anthropogenic soil salinization and plant-based strategies for sustainable mitigation. Sci. Total Environ. 2020, 698, 134235. [Google Scholar] [CrossRef]
  12. Stavi, I.; Thevs, N.; Priori, S. Soil Salinity and Sodicity in Drylands: A Review of Causes, Effects, Monitoring, and Restoration Measures. Front. Environ. Sci. 2021, 9, 712831. [Google Scholar] [CrossRef]
  13. Guo, Q.; Wang, Y.; Nan, L.; Li, B.; Cao, S. Effects of solute types and degree of mineralization on salt ions in soil release solution. Trans. Chin. Soc. Agric. Eng. 2019, 35, 105–111. [Google Scholar]
  14. Mojtaba, M.; Mohsen, F.; Naser, B. Adsorption Isotherms of Boron in Soil: The effects of Sodium Adsorption Ratio (SAR), pH and Ionic strength. Majallah-I Āb Va Khāk 2017, 30, 1954–1963. [Google Scholar] [CrossRef]
  15. Garcia, G.d.O.; Martins Filho, S.; Reis, E.F.d.; Moraes, W.B.; Nazário, A.d.A. Chemical changes in two soils irrigated with saline water. Ciên. Agron. 2008, 39, 7. [Google Scholar]
  16. Mohammed, S.; Arshad, S.; Bashir, B.; Ata, B.; Al-Dalahmeh, M.; Alsalman, A.; Ali, H.; Alhennawi, S.; Kiwan, S.; Harsanyi, E. Evaluating machine learning performance in predicting sodium adsorption ratio for sustainable soil-water management in the eastern Mediterranean. J. Environ. Manag. 2024, 370, 122640. [Google Scholar] [CrossRef] [PubMed]
  17. McCleskey, R.B.; Cravotta, C.A.; Miller, M.P.; Tillman, F.; Stackelberg, P.; Knierim, K.J.; Wise, D.R. Salinity and total dissolved solids measurements for natural waters: An overview and a new salinity method based on specific conductance and water type. Appl. Geochem. 2023, 154, 105684. [Google Scholar] [CrossRef]
  18. Wu, Z.; Moayedi, H.; Salari, M.; Le, B.N.; Ahmadi Dehrashid, A. Assessment of sodium adsorption ratio (SAR) in groundwater: Integrating experimental data with cutting-edge swarm intelligence approaches. Stoch. Environ. Res. Risk Assess. 2024, 1–18. [Google Scholar] [CrossRef]
  19. Zhang, J.; Wang, H.; Feng, D.; Cao, C.; Zheng, C.; Dang, H.; Li, K.; Gao, Y.; Sun, C. Evaluating the impacts of long-term saline water irrigation on soil salinity and cotton yield under plastic film mulching: A 15-year field study. Agric. Water Manag. 2024, 293, 108703. [Google Scholar] [CrossRef]
  20. Mavi, M.S.; Sanderman, J.; Chittleborough, D.J.; Cox, J.W.; Marschner, P. Sorption of dissolved organic matter in salt-affected soils: Effect of salinity, sodicity and texture. Sci. Total Environ. 2012, 435, 337–344. [Google Scholar] [CrossRef]
  21. Yuan, H.; Zhang, A.; Zhu, C.; Dang, H.; Zheng, C.; Zhang, J.; Cao, C. Saline Water Irrigation Changed the Stability of Soil Aggregates and Crop Yields in a Winter Wheat–Summer Maize Rotation System. Agronomy 2024, 14, 2564. [Google Scholar] [CrossRef]
  22. Chaudhary, M.T.; Majeed, S.; Rana, I.A.; Ali, Z.; Jia, Y.; Du, X.; Hinze, L.; Azhar, M.T. Impact of salinity stress on cotton and opportunities for improvement through conventional and biotechnological approaches. BMC Plant Biol. 2024, 24, 20. [Google Scholar] [CrossRef]
  23. Muhammad, N.; Dong, Q.; Luo, T.; Zhang, X.; Song, M.; Wang, X.; Ma, X. New developments in understanding cotton’s physiological and molecular responses to salt stress. Plant Stress 2025, 15, 100742. [Google Scholar] [CrossRef]
  24. Moghbel, F.; Fazel, F.; Aguilar, J.; Mostafazadeh-Fard, B.; Mosaedi, A.; Howell, N. Maintaining Silage Corn Production Under Sodic Irrigation Water Conditions in a Semi-Arid Environment. Agronomy 2025, 15, 400. [Google Scholar] [CrossRef]
  25. Yoon, J.H.; Adhikari, M.; Jeong, S.S.; Lee, S.P.; Kim, H.S.; Lee, G.S.; Park, D.H.; Kim, H.; Yang, J.E. Microbial diversity of soils under different land use and chemical conditions. Appl. Biol. Chem. 2024, 67, 111. [Google Scholar] [CrossRef]
  26. Ding, B.; Bai, Y.; Guo, S.; He, Z.; Wang, B.; Liu, H.; Zhai, J.; Cao, H. Effect of Irrigation Water Salinity on Soil Characteristics and Microbial Communities in Cotton Fields in Southern xinjiang, China. Agronomy 2023, 13, 1679. [Google Scholar] [CrossRef]
  27. Hu, Y.; Li, X.; Jin, M.; Wang, R.; Chen, J.; Guo, S. Reduced co-occurrence and ion-specific preferences of soil microbial hub species after ten years of irrigation with brackish water. Soil Tillage Res. 2020, 199, 104599. [Google Scholar] [CrossRef]
  28. Wang, R.; Sun, C.; Cai, S.; Liu, F.; Xie, H.; Xiong, Q. Research progress in crop root biology and nitrogen uptake and use, with emphasis on cereal crops. Agronomy 2023, 13, 1678. [Google Scholar] [CrossRef]
  29. Yukun, G.; Jianghui, C.; Genzeng, R.; Shilin, W.; Puyuan, Y.; Congpei, Y.; Hongkai, L.; Jinhua, C. Changes in the root-associated bacteria of sorghum are driven by the combined effects of salt and sorghum development. Environ. Microbiome 2021, 16, 14. [Google Scholar] [CrossRef]
  30. Hnini, M.; Aurag, J. Genetic diversity, stress tolerance and phytobeneficial potential in rhizobacteria of Vachellia tortilis subsp. raddiana. Environ. Microbiome 2024, 19, 73. [Google Scholar] [CrossRef]
  31. Li, H.; La, S.; Zhang, X.; Gao, L.; Tian, Y. Salt-induced recruitment of specific root-associated bacterial consortium capable of enhancing plant adaptability to salt stress. ISME J. 2021, 15, 2865–2882. [Google Scholar] [CrossRef]
  32. Wang, Z.; Yan, Q.; Zhang, Y.; He, G.; Yang, T.; Kong, C. Effects of different fertilization treatments on coffee bean quality and rhizosphere microorganisms. Arch. Agron. Soil Sci. 2025, 71, 1. [Google Scholar] [CrossRef]
  33. Rafique, N.; Khalil, S.; Cardinale, M.; Rasheed, A.; Zhao, F.; Abideen, Z. A comprehensive evaluation of the potential of plant growth-promoting rhizobacteria for applications in agriculture in stressed environments. Pedosphere 2025, 35, 229–248. [Google Scholar] [CrossRef]
  34. Mark Ibekwe, A.; Ors, S.; Ferreira JF, S.; Liu, X.; Suarez, D.L. Seasonal induced changes in spinach rhizosphere microbial community structure with varying salinity and drought. Sci. Total Environ. 2017, 579, 1485–1495. [Google Scholar] [CrossRef]
  35. Ye, Y.; Guo, X.-W.; Yang, M.-Q.; Min, W.; Guo, H.-J. Microbial Community Structure and Functional Genes of Phosphorus Cycling in Cotton Field Soil Under Long-term Saline Drip Irrigation. Huanjing Kexue 2025, 46, 1225. [Google Scholar] [CrossRef]
  36. Guo, K.; Feng, X.; Liu, X.; Ju, Z. Long-term freezing saline water irrigation and cotton cultivation improved soil properties and maintained low salinity in the root zone of coastal saline soil. Soil Use Manag. 2024, 40, e13117. [Google Scholar] [CrossRef]
  37. Gao, F.; Wang, L.; Xie, Y.; Sun, J.; Ning, H.; Han, Q.; Kanneh, J.E.; Liu, H. Optimizing canopy structure through equal row spacing and appropriate irrigation enhances machine-harvested seed cotton yield and quality. Ind. Crops Prod. 2024, 216, 118799. [Google Scholar] [CrossRef]
  38. Xie, Y.; Ning, H.; Zhang, X.; Zhou, W.; Xu, P.; Song, Y.; Li, N.; Wang, X.; Liu, H. Reducing the Sodium Adsorption Ratio Improves the Soil Aggregates and Organic Matter in Brackish-Water-Irrigated Cotton Fields. Agronomy 2024, 14, 2169. [Google Scholar] [CrossRef]
  39. Tianqi24.com. (n.d.). Alar Temperature: Monthly Temperature Trends for Alar City in 2024. Available online: https://www.tianqi24.com/alaer/history2024.html (accessed on 16 March 2025).
  40. Guo, K.; Liu, X. The successive infiltration of various saline waters accelerates the infiltration processes and enhances the salt leaching in a coastal saline soil. Land Degrad. Dev. 2023, 34, 5083–5095. [Google Scholar] [CrossRef]
  41. Bokulich, N.A.; Subramanian, S.; Faith, J.J.; Gevers, D.; Gordon, J.I.; Knight, R.; Mills, D.A.; Caporaso, J.G. Quality-filtering vastly improves diversity estimates from Illumina amplicon sequencing. Nat Methods 2013, 10, 57–59. [Google Scholar] [CrossRef]
  42. Callahan, B.J.; McMurdie, P.J.; Rosen, M.J.; Han, A.W.; Johnson, A.J.A.; Holmes, S.P. DADA2: High-resolution sample inference from Illumina amplicon data. Nat. Methods 2016, 13, 581–583. [Google Scholar] [CrossRef]
  43. Caporaso, J.G.; Kuczynski, J.; Stombaugh, J.; Bittinger, K.; Bushman, F.D.; Costello, E.K.; Fierer, N.; Peña, A.G.; Goodrich, J.K.; Gordon, J.I.; et al. QIIME allows analysis of high-throughput community sequencing data. Nat. Methods 2010, 7, 335–336. [Google Scholar] [CrossRef]
  44. Qin, Y.; Druzhinina, I.S.; Pan, X.; Yuan, Z. Microbially mediated plant salt tolerance and microbiome-based solutions for saline agriculture. Biotechnol. Adv. 2016, 34, 1245–1259. [Google Scholar] [CrossRef]
  45. Chen, L.; Li, C.; Feng, Q.; Wei, Y.; Zheng, H.; Zhao, Y.; Feng, Y.; Li, H. Shifts in soil microbial metabolic activities and community structures along a salinity gradient of irrigation water in a typical arid region of China. Sci. Total Environ. 2017, 598, 64–70. [Google Scholar] [CrossRef]
  46. Chen, Z.; Zhou, T.; Huang, G.; Xiong, Y. Soil microbial community and associated functions response to salt stresses: Resistance and resilience. Sci. Total Environ. 2024, 954, 176475. [Google Scholar] [CrossRef]
  47. Shamim, A.; Sanka Loganathachetti, D.; Chandran, S.; Masmoudi, K.; Mundra, S. Salinity of irrigation water selects distinct bacterial communities associated with date palm (Phoenix dactylifera L.) root. Sci. Rep. 2022, 12, 12733. [Google Scholar] [CrossRef]
  48. Chowdhury, N.; Marschner, P.; Burns, R.G. Soil microbial activity and community composition: Impact of changes in matric and osmotic potential. Soil Biol. Biochem. 2011, 43, 1229–1236. [Google Scholar] [CrossRef]
  49. Guo, X.; Du, S.; Guo, H.; Min, W. Long-term saline water drip irrigation alters soil physicochemical properties, bacterial community structure, and nitrogen transformations in cotton. Appl. Soil Ecol. 2023, 182, 104719. [Google Scholar] [CrossRef]
  50. Zhang, K.; Shi, Y.; Cui, X.; Yue, P.; Li, K.; Liu, X.; Tripathi, B.M.; Chu, H. Salinity is a key determinant for soil microbial communities in a desert ecosystem. Msystems 2019, 4, 1. [Google Scholar] [CrossRef]
  51. Zhang, Y.; Miao, S.; Song, Y.; Wang, X.; Jin, F. Biochar application reduces saline–alkali stress by improving soil functions and regulating the diversity and abundance of soil bacterial community in highly saline–alkali paddy field. Sustainability 2024, 16, 1001. [Google Scholar] [CrossRef]
  52. Rousk, J.; Bååth, E.; Brookes, P.C.; Lauber, C.L.; Lozupone, C.; Caporaso, J.G.; Knight, R.; Fierer, N. Soil bacterial and fungal communities across a pH gradient in an arable soil. ISME J. 2010, 4, 1340–1351. [Google Scholar] [CrossRef]
  53. Xu, X.; Guo, L.; Wang, S.; Wang, X.; Ren, M.; Zhao, P.; Huang, Z.; Jia, H.; Wang, J.; Lin, A. Effective strategies for reclamation of saline-alkali soil and response mechanisms of the soil-plant system. Sci. Total Environ. 2023, 905, 167179. [Google Scholar] [CrossRef]
  54. Drabesch, S.; Lechtenfeld, O.J.; Bibaj, E.; León Ninin, J.M.; Lezama Pachecco, J.; Fendorf, S.; Friedrich-Planer, B.; Kappler, A.; Muehe, E.M. Climate induced microbiome alterations increase cadmium bioavailability in agricultural soils with pH below 7. Commun. Earth Environ. 2024, 5, 637. [Google Scholar] [CrossRef]
  55. Liu, J.-G.; Bian, X.-M.; Li, Y.-B.; Zhang, W.; Li, S. Effects of long-term continuous cropping of cotton and returning cotton stalk into field on soil biological activities. Chin. J. Appl. Ecol. 2008, 19, 1027–1032. [Google Scholar]
  56. Petermann, B.J.; Acosta-Martinez, V.; Laza, H.E.; Lewis, K.; Steffan, J.; Slaughter, L.C. Soil bacterial and fungal microbiomes under cotton production are more sensitive to tillage and cover crops than irrigation level in a semi-arid sandy soil. Appl. Soil Ecol. 2024, 204, 105711. [Google Scholar] [CrossRef]
  57. Li, X.; Wang, A.; Wan, W.; Luo, X.; Zheng, L.; He, G.; Huang, D.; Chen, W.; Huang, Q. High salinity inhibits soil bacterial community mediating nitrogen cycling. Appl. Environ. Microbiol. 2021, 87, e01366-21. [Google Scholar] [CrossRef] [PubMed]
  58. Du, J.; Wang, Z.; Hu, L.; Wang, L.; Fang, J.; Liu, R. Comparative Genomics Reveal Distinct Environment Preference and Functional Adaptation Among Lineages of Gemmatimonadota. Microorganisms 2024, 12, 2198. [Google Scholar] [CrossRef] [PubMed]
  59. Gao, X.; Xiao, Y.; Wang, Z.; Zhao, H.; Yue, Y.; Nair, S.; Zhang, Z.; Zhang, Y. Adaptive traits of Planctomycetota bacteria to thrive in macroalgal habitats and establish mutually beneficial relationship with macroalgae. Limnol. Oceanogr. Lett. 2024, 9, 745–753. [Google Scholar] [CrossRef]
  60. Li, Q.M.; Zhou, Y.L.; Wei, Z.F.; Wang, Y. Phylogenomic insights into distribution and adaptation of Bdellovibrionota in marine waters. Microorganisms 2021, 9, 757. [Google Scholar] [CrossRef] [PubMed]
  61. Chen, Y.; Xie, J.; Yang, M.; Cai, R.; Cai, C.; Gan, Y.; Aweya, J.J.; Cai, G.; Wang, H. Marine Flavobacteriaceae produce zeaxanthin via the mevalonate pathway. Mar. Life Sci. Technol. 2025, 7, 132–143. [Google Scholar] [CrossRef] [PubMed]
  62. Lee, Y.; Jeong, H.I.; Jeong, S.E.; Jeon, C.O. Zeaxanthinibacter aestuarii sp. nov., isolated from estuary sediment and emended description of the genus Zeaxanthinibacter Asker et al. 2007. Int. J. Syst. Evol. Microbiol. 2016, 66, 3264–3269. [Google Scholar] [CrossRef]
  63. Romanenko, L.; Bystritskaya, E.; Savicheva, Y.; Eremeev, V.; Otstavnykh, N.; Kurilenko, V.; Velansky, P.; Isaeva, M. Description and whole-genome sequencing of Mariniflexile litorale sp. nov., isolated from the shallow sediments of the sea of Japan. Microorganisms 2024, 12, 1413. [Google Scholar] [CrossRef]
  64. Hu, J.P.; He, Y.Y.; Li, J.H.; Lü, Z.L.; Zhang, Y.W.; Li, Y.H.; Li, J.L.; Zhang, M.X.; Cao, Y.H.; Zhang, J.L. Planting halophytes increases the rhizosphere ecosystem multifunctionality via reducing soil salinity. Environ. Res. 2024, 261, 119707. [Google Scholar] [CrossRef]
  65. Hoffmann, K.; Bienhold, C.; Buttigieg, P.L.; Knittel, K.; Laso-Pérez, R.; Rapp, J.Z.; Boetius, A.; Offre, P. Diversity and metabolism of Woeseiales bacteria, global members of marine sediment communities. ISME J. 2020, 14, 1042–1056. [Google Scholar] [CrossRef]
  66. Guo, C.; Zhang, X.; Luan, S.; Zhou, H.; Liu, L.; Qu, Y. Diversity and structure of soil bacterial community in intertidal zone of Daliao River estuary, Northeast China. Mar. Pollut. Bull. 2021, 163, 111965. [Google Scholar] [CrossRef]
  67. Wei, C.; Liang, J.; Wang, R.; Chi, L.; Wang, W.; Tan, J.; Shi, H.; Song, X.; Cui, Z.; Xie, Q.; et al. Response of bacterial community metabolites to bacterial wilt caused by Ralstonia solanacearum: A multi-omics analysis. Front. Plant Sci. 2024, 14, 1339478. [Google Scholar] [CrossRef]
  68. Li, L.; Zhang, M.L.; Liu, L.M.; Guo, Y.S.; Chen, J.F. Effects of Fertilizers Applied on Growth of Kandelia obovata Seedlings and Microbial Community in Soil. Fujian J. Agric. Sci. 2024, 39, 839–847. [Google Scholar] [CrossRef]
  69. Zhang, S.; Zuo, X.; Wei, G.; Wang, H.; Gao, Y.; Ling, W. Immobilized Pseudomonas spp. for bioremediation of soils contaminated with emerging organic pollutants. Appl. Soil Ecol. 2024, 204, 105717. [Google Scholar] [CrossRef]
  70. Bhardwaj, T.; Singh, R.; Singh, H.; Bhanwaria, R.; Gandhi, S.G.; Bhardwaj, R.; Gandhi, S.G.; Bhardwaj, R.; Ahmad, A.; Ahmad, P. Pseudomonas consortium improves soil health and alleviates cadmium (Cd) toxicity in Brassica juncea L. via biochemical and in silico approaches. Plant Stress 2024, 14, 100611. [Google Scholar] [CrossRef]
  71. Jin, W.X.; Luo, B.J.; Guo, H.R.; Cen, S.J.; Zhang, H.Q.; Ge, T.D.; Wu, J.X.; Fan, X.L. Soil ecological effects of soil fumigation and microbial agents controlling continuous melon barrier in high tunnel. Soils Crops 2024, 13, 13–26. [Google Scholar] [CrossRef]
  72. Thakor, R.; Mistry, H.; Bariya, H. Isolation and Identification of Nitrogen Fixing Bacteria: Azoarcus Species. In Practical Handbook on Agricultural Microbiology; Springer: Berlin/Heidelberg, Germany, 2022; pp. 47–55. [Google Scholar] [CrossRef]
  73. Fernandez, H.; Prandoni, N.; Fernández-Pascual, M.; Fajardo, S.; Morcillo, C.; Diaz, E.; Carmona, M. Azoarcus sp. CIB, an anaerobic biodegrader of aromatic compounds shows an endophytic lifestyle. PLoS ONE 2014, 9, e110771. [Google Scholar] [CrossRef]
  74. Yun, J.H.; Sung, H.; Kim, H.S.; Tak, E.J.; Kang, W.; Lee, J.Y.; Hyun, D.W.; Kim, P.S.; Bae, J.W. Complete genome sequence of the halophile bacterium Kushneria konosiri X49 T, isolated from salt-fermented Konosirus punctatus. Stand. Genom. Sci. 2018, 13, 19. [Google Scholar] [CrossRef]
  75. Bao, W.X.; Chen, M.; Zhang, W.; Tang, J.H.; Li, Y.T.; Gu, P.; Lu, Y. Characterization of bacterial communities in freshwater and seawater of the Yellow River estuary by 16S rRNA gene high-throughput absolute abundance quantification. Acta Microbiol. Sin. 2024, 64, 4338–4357. [Google Scholar]
  76. Wang, G.; Jin, Z.; Wang, X.; George, T.S.; Feng, G.; Zhang, L. Simulated root exudates stimulate the abundance of Saccharimonadales to improve the alkaline phosphatase activity in maize rhizosphere. Appl. Soil Ecol. 2022, 170, 104274. [Google Scholar] [CrossRef]
  77. Thompson, H.F.; Lesaulnier, C.; Pelikan, C.; Gutierrez, T. Visualisation of the obligate hydrocarbonoclastic bacteria Polycyclovorans algicola and Algiphilus aromaticivorans in co-cultures with micro-algae by CARD-FISH. J. Microbiol. Methods 2018, 152, 73–79. [Google Scholar] [CrossRef]
  78. Khan, S.T.; Nakagawa, Y.; Harayama, S. Sediminicola luteus gen. nov., sp. nov., a novel member of the family Flavobacteriaceae. Int. J. Syst. Evol. Microbiol. 2006, 56, 841–845. [Google Scholar] [CrossRef] [PubMed]
  79. Chen, L.; Zhu, G.; Pascual-Garcia, A.; Dini-Andreote, F.; Zheng, J.; Wang, X.; Zhou, S.; Jiang, Y. Unraveling the diversity dynamics and network stability of alkaline phosphomonoesterase-producing bacteria in modulating maize yield. Imeta 2024, 3, e260. [Google Scholar] [CrossRef] [PubMed]
  80. Guo, Y.; Jin, J.; Lu, Y.; Lin, Y.; Liu, Q.; Li, Z. Bacterial diversity loss weakens community functional stability. Appl. Soil Ecol. 2024, 202, 105536. [Google Scholar] [CrossRef]
  81. Qiu, L.; Zhang, Q.; Zhu, H.; Reich, P.B.; Banerjee, S.; van der Heijden, M.G.; Sadowsky, M.H.; Ishii, S.; Jia, X.; Shao, M.; et al. Erosion reduces soil microbial diversity, network complexity and multifunctionality. ISME J. 2021, 15, 2474–2489. [Google Scholar] [CrossRef]
  82. Yang, G.; Jiang, L.; Li, W.; Li, E.; Lv, G. Structural Characteristics and Assembly Mechanisms of Soil Microbial Communities under Water–Salt Gradients in Arid Regions. Microorganisms 2023, 11, 1060. [Google Scholar] [CrossRef]
  83. Wang, J.; Zhou, Q.; Chen, R.; Wang, Z. Rationale saline-water irrigation also serves as enhancing soil aggregate stability, regulating carbon emissions, and improving water use efficiency in oasis cotton fields. Ind. Crops Prod. 2025, 223, 120144. [Google Scholar] [CrossRef]
  84. Mougi, A. pH Adaptation stabilizes bacterial communities. NPJ Biodivers. 2024, 3, 32–37. [Google Scholar] [CrossRef] [PubMed]
  85. Wu, Y.; Zeng, J.; Zhu, Q.; Zhang, Z.; Lin, X. pH is the primary determinant of the bacterial community structure in agricultural soils impacted by polycyclic aromatic hydrocarbon pollution. Sci. Rep. 2017, 7, 40093. [Google Scholar] [CrossRef] [PubMed]
  86. Rengasamy, P. World salinization with emphasis on Australia. J. Exp. Bot. 2006, 57, 1017–1023. [Google Scholar] [CrossRef]
  87. Hou, Y.; Zeng, W.; Hou, M.; Wang, Z.; Luo, Y.; Lei, G.; Zhou, B.; Huang, J. Responses of the soil microbial community to salinity stress in maize fields. Biology 2021, 10, 1114. [Google Scholar] [CrossRef]
  88. Kong, C.; Zhang, S.; Yuan, S.; Wang, W.; Song, X.; Guo, D.; Lawi, A.S. Soil bacterial community characteristics and its effect on organic carbon under different fertilization treatments. Front. Microbiol. 2024, 15, 1356171. [Google Scholar] [CrossRef]
  89. Li, J.Y.; Chen, P.; Li, Z.G.; Li, L.Y.; Zhang, R.Q.; Hu, W.; Liu, Y. Soil aggregate-associated organic carbon mineralization and its driving factors in rhizosphere soil. Soil Biol. Biochem. 2023, 186, 109182. [Google Scholar] [CrossRef]
  90. Mei, W.; Li, L.; Zhao, Q.; Li, X.; Wang, Z.; Gao, Q.; Wei, L.; Wang, K.; Jiang, J. A critical review of effects, action mechanisms and mitigation strategies of salinity in anaerobic digestion. Renew. Sustain. Energy Rev. 2025, 208, 115095. [Google Scholar] [CrossRef]
  91. Surey, R.; Schimpf, C.M.; Sauheitl, L.; Mueller, C.W.; Rummel, P.S.; Dittert, K.; Kaiser, K.; Böttcher, J.; Mikutta, R. Potential denitrification stimulated by water-soluble organic carbon from plant residues during initial decomposition. Soil Biol. Biochem. 2020, 147, 107841. [Google Scholar] [CrossRef]
  92. Liao, X.; Tang, T.; Li, J.; Wang, J.; Neher, D.A.; Zhang, W.; Xiao, J.; Xiao, D.; Hu, P.; Wang, K.; et al. Nitrogen fertilization increases the niche breadth of soil nitrogen-cycling microbes and stabilizes their co-occurrence network in a karst agroecosystem. Agric. Ecosyst. Environ. 2024, 374, 109177. [Google Scholar] [CrossRef]
  93. Hu, Z.; Delgado-Baquerizo, M.; Fanin, N.; Chen, X.; Zhou, Y.; Du, G.; Hu, F.; Jiang, L.; Hu, S.; Liu, M. Nutrient-induced acidification modulates soil biodiversity-function relationships. Nat. Commun. 2024, 15, 2858. [Google Scholar] [CrossRef] [PubMed]
  94. Wang, M.; Frey, B.; Li, D.; Liu, X.; Chen, C.; Liu, Y.; Zhang, R.; Sui, X.; Li, M.H. Effects of organic nitrogen addition on soil microbial community assembly patterns in the Sanjiang Plain wetlands, northeastern China. Appl. Soil Ecol. 2024, 204, 105685. [Google Scholar] [CrossRef]
  95. Liang, H.Y.; Wang, Y.; Quan, X.; Tang, X.H.; Wang, L.; Li, X.; Qu, L.P.; Yan, X.L. Ammonium and Nitrate Nitrogen Alter Bacterial Community in the Rhizospheres and Root Surfaces with Seedling Growth of Two Tree Species. Forests 2024, 15, 2218. [Google Scholar] [CrossRef]
  96. Weng, X.; Wang, M.; Sui, X.; Frey, B.; Liu, Y.; Zhang, R.; Ni, H.; Li, M. High ammonium addition changes the diversity and structure of bacterial communities in temperate wetland soils of northeastern China. Microorganisms 2023, 11, 2033. [Google Scholar] [CrossRef]
  97. Van Kessel, M.A.; Speth, D.R.; Albertsen, M.; Nielsen, P.H.; Op den Camp, H.J.; Kartal, B.; Jetten, M.S.; Lücker, S. Complete nitrification by a single microorganism. Nature 2015, 528, 555–559. [Google Scholar] [CrossRef]
  98. Dong, L.; Berg, B.; Sun, T.; Wang, Z.; Han, X. Response of fine root decomposition to different forms of N deposition in a temperate grassland. Soil Biol. Biochem. 2020, 147, 107845. [Google Scholar] [CrossRef]
  99. Basak, N.; Rai, A.K.; Krishnamurthy, S.L.; Singh, R.K.; Sundha, P.; Patel, S.; Bedwal, S.; Sharma, P.C. Nutrients availability in salt-affected soils varies with the ionic composition of solid and solution phases of inland and coastal agroecosystems of India. Environ. Earth Sci. 2023, 82, 489. [Google Scholar] [CrossRef]
  100. Şentürk, E.; Atasoy, G.; Şanlıbaba, P. Ammonia-Oxidizing Bacteria: Biochemical and Molecular Characteristics. In Anammox Technology in Industrial Wastewater Treatment; Springer Nature: Singapore, 2023; pp. 11–33. [Google Scholar] [CrossRef]
  101. Chen, J.; Shen, L.; Li, Y.; Cao, H.; Chen, C.; Zhang, G.; Xu, Z.; Lu, Y. Insights into the nitrogen transformation mechanism of Pseudomonas sp. Y15 capable of heterotrophic nitrification and aerobic denitrification. Environ. Res. 2024, 240, 117595. [Google Scholar] [CrossRef] [PubMed]
  102. Kim, B.J.; Jeon, Y.J.; Ko, M.S. Influence of Pseudomonas aeruginosa-based biopolymer on mitigating soil erosion and heavy metal dispersion. Sci. Total Environ. 2024, 955, 176889. [Google Scholar] [CrossRef]
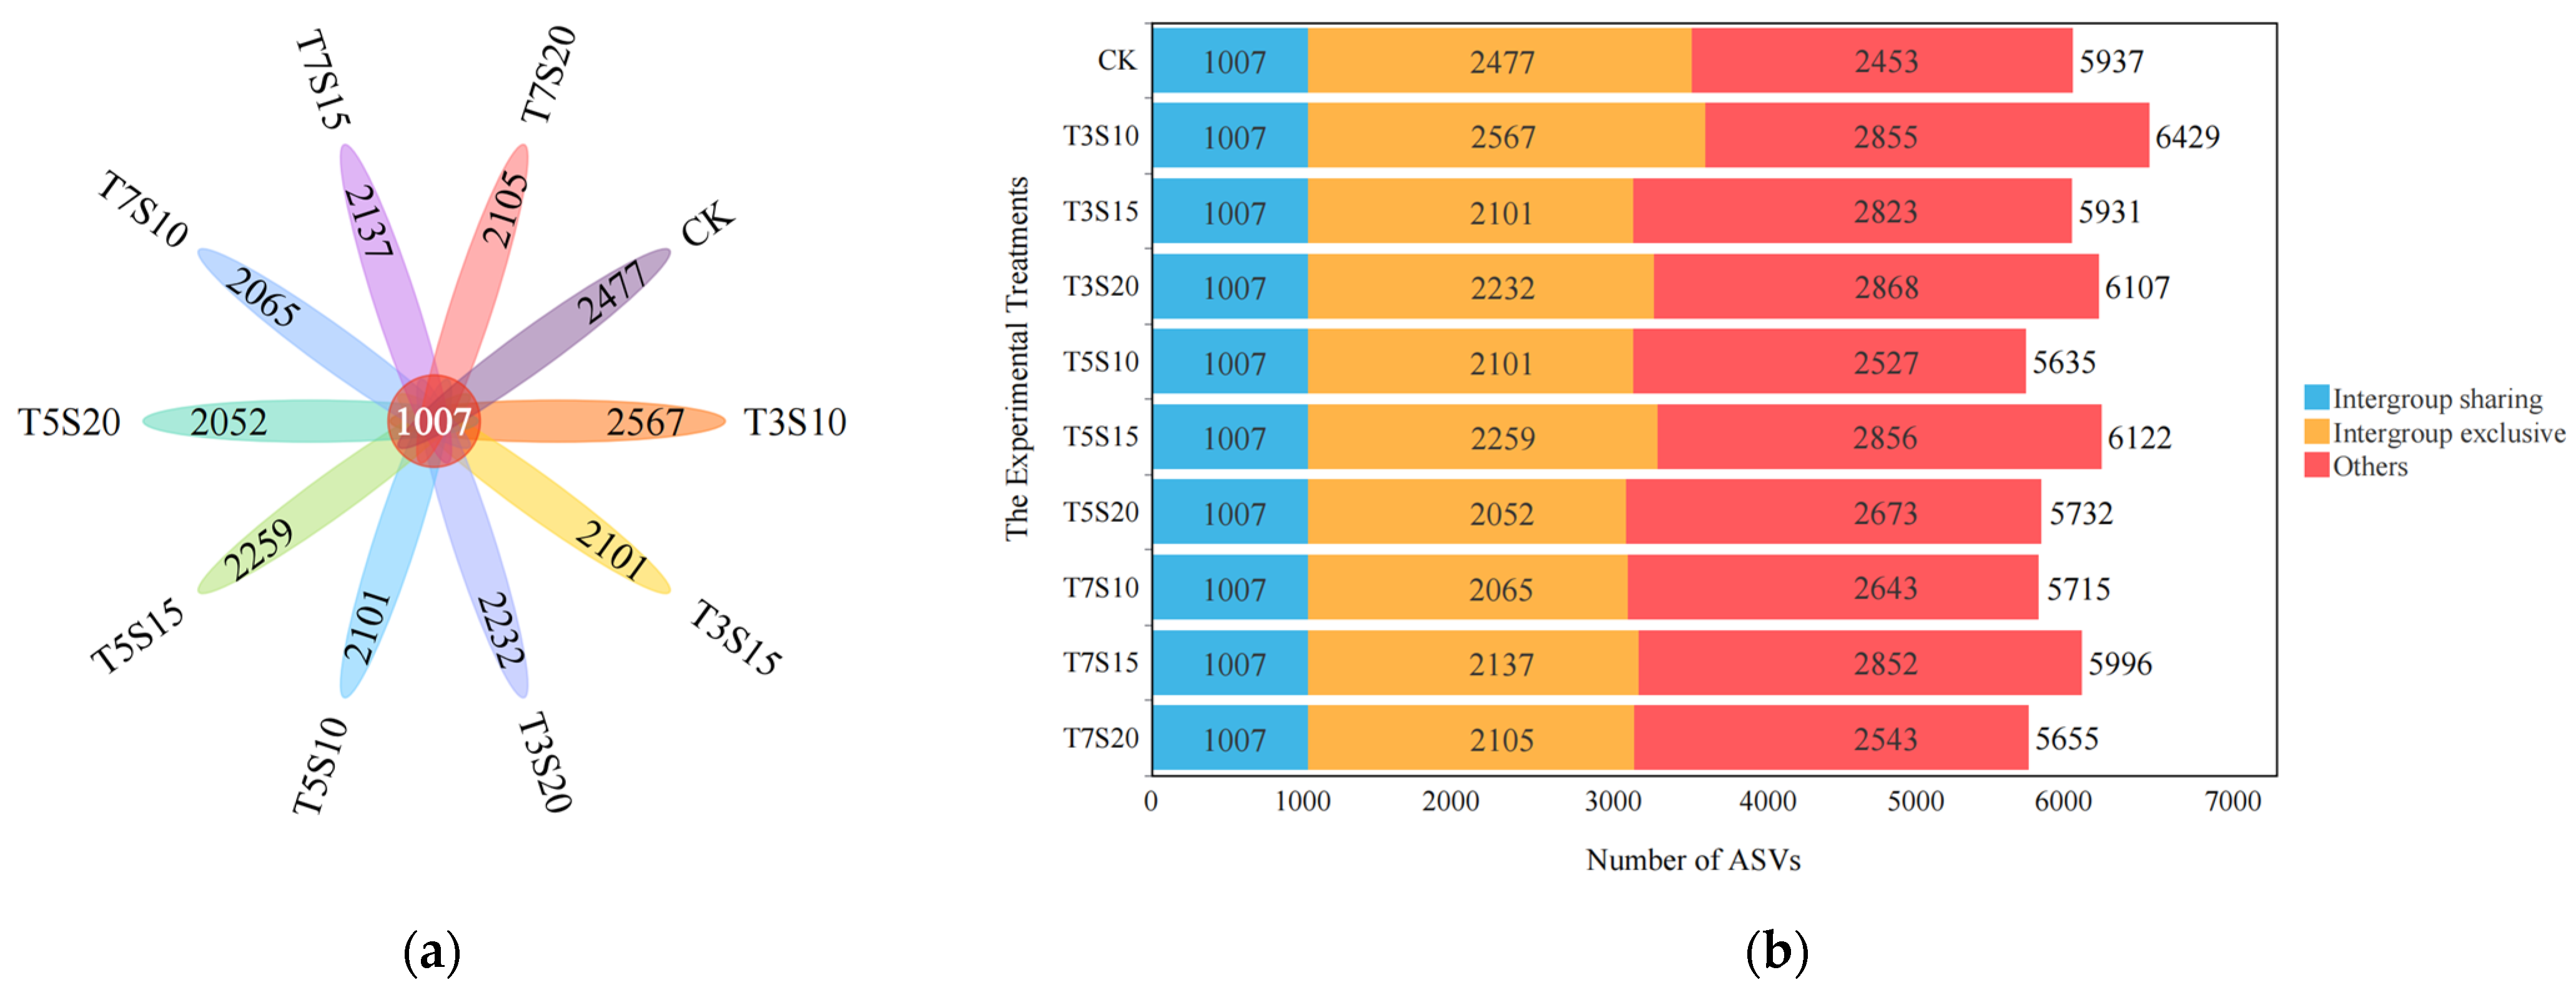
Figure 1. Venn diagram and bar chart of Amplicon Sequence Variants (ASVs) in the rhizosphere bacterial community. (a) Petal-shaped Venn diagram. The number at the tip of each petal indicates the number of unique ASVs in that treatment, while the overlapping center section represents the number of ASVs common to the treatments (1007); (b) Bar chart of ASV counts.
Agronomy 15 00895 g001
Figure 2. Analysis of cotton rhizosphere bacterial community α-diversity. (a) Box plot of the bacterial community Chao1 index; (b) Box plot of the bacterial community Shannon index. All data in the figure are based on triplicate experiments. An asterisk indicates that there is a statistically significant difference between treatments (* p ≤ 0.05).
Agronomy 15 00895 g002
Figure 3. Analysis of relative abundance at the rhizosphere bacterial phylum and genus levels. (a) Relative abundance analysis at the bacterial phylum level; (b) Relative abundance analysis at the bacterial genus level. In both figures, only the top 10 species with the highest relative abundances are displayed.
Agronomy 15 00895 g003
Figure 4. Non-metric multidimensional scaling (NMDS) analysis and permutational multivariate analysis of variance (PERMANOVA) of rhizosphere bacterial communities. (a) NMDS + PERMANOVA analysis at the mineralization degree level; (b) NMDS + PERMANOVA analysis at the sodium adsorption ratio level.
Agronomy 15 00895 g004
Figure 5. Linear discriminant analysis Effect Size (LEfSe) of rhizosphere bacterial communities. (a) Taxonomic branch diagram of LEfSe at the mineralization levels; (b) Linear discriminant analysis (LDA) bar chart of LEfSe at the mineralization levels; (c) Taxonomic branch diagram of LEfSe at the sodium adsorption ratio levels; (d) Linear discriminant analysis bar chart of LEfSe at the sodium adsorption ratio levels. Only biomarkers with a LDA Score ≥ 3 are displayed in the figure.
Agronomy 15 00895 g005
Figure 6. Analysis of changes in soil environmental factors under different treatments. (a) Soil moisture content; (b) Soil pH value; (c) Soil total nitrogen content; (d) Soil ammonium nitrogen content; (e) Soil nitrate nitrogen content; (f) Total organic carbon content; (g) Soil available phosphorus content; (h) Soil available potassium content. All data presented in the figure are based on three replicates. Asterisks indicate statistically significant differences among treatments (* p ≤ 0.05, ** p ≤ 0.01, *** p ≤ 0.001, **** p ≤ 0.0001).
Agronomy 15 00895 g006aAgronomy 15 00895 g006b
Figure 7. Redundancy analysis (RDA) of the rhizosphere bacterial community structure and soil environmental factors. (a) Redundancy analysis of the mineralization degree level; (b) Redundancy analysis of the sodium adsorption ratio level.
Agronomy 15 00895 g007
Figure 8. Mantel test correlation analysis. Blue squares indicate a positive correlation; red squares indicate a negative correlation; solid lines indicate a positive correlation; dashed lines indicate a negative correlation; red lines indicate extremely significant correlations; green lines indicate significant correlations; blue lines indicate non-significant correlations; narrow lines indicate weak correlations; medium-width lines indicate moderate correlations; thick lines indicate strong correlations. Asterisks denote statistically significant differences between treatments (* p ≤ 0.05, ** p ≤ 0.01, *** p ≤ 0.001).
Agronomy 15 00895 g008
Table 1. Soil physical and chemical properties of experimental fields.
Soil Depth
(cm)
Na+
(g/kg)
Ca2+
(g/kg)
Mg2+
(g/kg)
Clay
Particle
(%)
Silt
(%)
Sand
(%)
Dry Bulk
Density
(g/cm3)
Field
Capacity
(cm3/cm−3)
Organic
Matter
(g/kg)
0-200.090.110.030.3717.0582.581.60.265.66
Table 2. Mineralization degree, sodium adsorption ratio, and major ion contents of each treated irrigation water.
TreatmentsMD (g/L)SAR (mmol/L)1/2Na⁺ (mg/L)Ca²⁺ (mg/L)Cl⁻ (mg/L)Mg²⁺ (mg/L)
CG1.448.74419.09103.60648.1087.54
T3S10310759.08356.691616.0287.54
T3S15315918.27209.401604.1087.54
T3S203201013.00121.781597.0187.54
T5S105101077.46789.422864.9187.54
T5S155151350.00536.002844.4787.54
T5S205201532.23368.692830.8787.54
T7S107101344.741269.424117.6387.54
T7S157151727.97914.874088.9587.54
T7S207201991.32671.244069.2487.54
Table 3. Rhizosphere bacterial co-occurrence network topological indices.
TreatmentsProportion of Positive Correlation Edges (%)Proportion of Negatively Correlated Edges (%)Average DegreeNetwork DensityAverage Clustering Coefficient
CG58.0141.99113.2070.3790.983
T3S1051.8548.15104.220.3490.986
T3S1551.0548.95112.9930.3780.976
T3S2050.4349.57103.940.3480.988
T5S1054.6045.40114.1470.3820.985
T5S1554.5145.49103.5130.3460.993
T5S2056.1243.88128.9930.4310.987
T7S1052.5447.46108.9930.3650.986
T7S1552.0747.93104.3070.3490.990
T7S2057.3942.61115.960.3880.983
Table 4. Phylum abundances of the top six nodes in the rhizosphere bacterial co-occurrence network. The unit is (%).
TreatmentsProteobacteriaActinobacteriotaAcidobacteriotaGemmatimonadotaBacteroidotaChloroflexi
CG43.6717.678.007.335.675.00
T3S1040.3316.007.6710.337.005.67
T3S1541.0016.006.679.678.006.33
T3S2038.3319.008.0010.675.677.00
T5S1042.3315.676.008.678.675.67
T5S1541.3315.007.009.005.008.67
T5S2041.3318.007.009.005.676.33
T7S1041.3315.676.0011.676.336.00
T7S1537.0017.006.3313.006.006.33
T7S2041.0016.334.6711.338.005.33
Table 5. Index of environmental factor Redundancy analysis.
Environmental FactorsRDA 1RDA 2R2p
MC−0.236−0.9720.52270.001
TOC−0.988−0.1540.34130.006
NO3-N0.9360.3520.31630.006
TKN−0.100−0.0270.27410.010
AK−0.9190.3950.09870.230
NH4+-N0.3200.9470.02500.699
AP0.0700.9980.02360.716
pH−0.4080.9130.00960.898
Table 6. Part of the Mantel test correlation test index.
Bacterial Genus-Level SpeciesEnvironmental Factorsrp
NovospingobiumNO3-N0.18550.017
NovospingobiumTOC0.19790.029
PseudomonasNO3-N0.16680.022
PseudomonasTKN0.15740.048
PseudomonasTOC0.30640.007
BacillusNO3-N0.27870.009
BacillusTOC0.37210.004
ZeaxanthinibacterTOC0.38990.002
Disclaimer/Publisher’s Note: The statements, opinions and data contained in all publications are solely those of the individual author(s) and contributor(s) and not of MDPI and/or the editor(s). MDPI and/or the editor(s) disclaim responsibility for any injury to people or property resulting from any ideas, methods, instructions or products referred to in the content.