Article

Characteristics and Influencing Factors of Cropland Function Trade-Off in Highly Urbanized Areas: Insights from the Yangtze River Delta Region in China

1
School of Geography and Ocean Science, Nanjing University, Nanjing 210023, China
2
School of Geography, Nanjing Normal University, Nanjing 210023, China
3
School of Geography, Geomatics and Planning, Jiangsu Normal University, Xuzhou 221116, China
4
School of Tourism and Exhibition, Hefei University, Hefei 230601, China
*
Author to whom correspondence should be addressed.
Agronomy 2025, 15(4), 894; https://doi.org/10.3390/agronomy15040894
Submission received: 23 February 2025 / Revised: 29 March 2025 / Accepted: 1 April 2025 / Published: 3 April 2025
(This article belongs to the Section Farming Sustainability)

Abstract

:
Exploring the characteristics of changes in cropland function trade-off and the influencing factors in highly urbanized areas can promote the synergistic development of urbanization and fine cropland management. Taking the Yangtze River Delta region as the study area, this paper developed a cropland function evaluation system from the production–ecology–living perspective, identified the spatial and temporal changes in cropland function trade-offs through Wavelet analysis and Root mean square error, and explored the driving factors of the trade-offs by using GeoDetector. The results indicated the following: (1) The cropland function in the Yangtze River Delta region has undergone a transition from a single production function to a composite function integrating ecology and life in conjunction with urbanization. The trade-offs between cropland functions are weakened, and the rate of decline from 2010 to 2023 is significantly higher than that from 2000 to 2010, and the characterization of cropland in different types of cities is revealed. (2) The turning points of cropland function trade-off changes in cities of different scales diverge, with the inflection points of small and medium-sized cities and large cities shrinking toward the center (decreasing from 42–48 km to 30–36 km), and metropolises showing an obvious trend of outward expansion (expanding from 42 km to 60 km). (3) The influence of natural and socioeconomic factors on cropland function trade-off intensity generally increases over time, with socioeconomic factors increasingly becoming significant drivers of the trade-off intensities. It is recommended that the study area focus on developing cropland characterization in different types of cities in the future, and continue to improve the degree of sharing the integration of profits from cropland functions, so as to promote optimal development.

1. Introduction

The process of urbanization is accelerating on a global scale, leading to a significant increase in urbanization levels. Projections indicated that the global population was expected to surpass 8 billion by 2023, with urban areas comprising over half of the total population. Furthermore, the United Nations Department of Economic and Social Affairs (DESA) projects that by 2050, 68% of the world’s population will reside in urban areas. A high degree of urbanization is generally considered to be achieved when the proportion of the urban population exceeds 70% of the total population in a region. The Yangtze River Delta, one of the world’s six largest urban agglomerations, exemplifies a highly urbanized region, with a population proportion of 72.80% in 2023. However, the inherent imbalance in urbanization and economic development results in regional disparities in the degree of urbanization. For instance, within the YRD, Shanghai recorded the highest urbanization rate of 89.33% in 2023, while Fuyang City in Anhui Province exhibited the lowest rate of 45.16%. This disparity underscores the complexity and variability of urbanization patterns across different regions. As urbanization progresses, it inevitably changes land use patterns [1] and industrial structures [2] within urban centers. Consequently, the structure, function, scale, and key drivers of cropland in highly urbanized areas have undergone continuous transformation [3], emerging as significant urbanization features.
Due to the diverse paths of urban development, differential utilization of regional cropland occurs [4], and the functional positioning of cropland varies from region to region. From the perspective of sustainable development, cropland can be categorized into three functions: production, living, and ecology [5]. The production function (PF) encompasses the agricultural production of all kinds of products, such as food and fibers. The living function (LF) refers to the cultural and recreational services embedded in the cropland for the survival and development of human beings [6], and the ecological function (EF) is the maintenance of the natural conditions created by cropland for human survival and its utility, which is manifested in terms of water conservation and soil retention [7,8,9]. A comprehensive understanding of the multifunctional characteristics of cropland in highly urbanized areas can facilitate the realization of a rational division of cropland and a positive feedback loop with urban development.
The cropland functions are primarily defined by trade-offs or synergies [10], which are spatially mapped as integration and symbiosis or conflict and competition. A substantial body of research has been dedicated to examining the trade-off and synergistic characteristics of cropland functions and their factors and driving mechanisms [11,12,13]. For instance, Accatino et al. [14] discovered that the synergistic effect of on-farm food production and carbon sequestration increased with the progression of agricultural intensification. Wardropper et al. [15] found that there was a spatial trade-off between food production and ecosystem services such as biodiversity, and Bao et al. [16] showed that natural factors such as elevation and slope had the strongest influence on the spatial differentiation of trade-offs between agricultural production, ecological services, and cultural landscape. With the progression of urbanization, the ecological, cultural, and landscape recreational cropland functions have garnered attention, and the needs of residents are undergoing a process of diversification and hierarchical structuring. For instance, Liu et al. [17] concluded that the cropland functions in China have transformed, evolving into an integrated function that encompasses social security, ecological, and cultural dimensions. The study further asserts that socioeconomic development exerts a substantial influence on the trade-offs and synergies among these functions. A comprehensive review of the extant literature reveals a predominant focus on the functions of cropland in general. However, there is a paucity of studies addressing cropland functions in highly urbanized areas. Moreover, the majority of existing analyses are of a qualitative nature, with a dearth of quantitative studies on cropland functions in these areas. These regions have undergone substantial changes in the pattern of cropland use, exhibiting complex structures and functions. They are pivotal areas in the transformation of cropland use and the focal point for investigating the trade-offs of cropland functions. Consequently, there is an urgent need to elucidate the characteristics of the stages of the trade-offs of cropland functions, the intra-regional differences, and the influencing factors of highly urbanized areas, so as to realize scientific management in the context of urbanization.
The interplay and competition among cropland functions in highly urbanized areas essentially constitute a dynamic process involving the spatial redistribution of scarce cropland resources [18,19]. Taking the YRD as an example, this paper builds a framework for assessing the cropland functions, characterizes the spatial and temporal changes in the trade-offs/synergies of cropland functions in the YRD in 2000, 2010, and 2023, applies wavelet analyses to reveal the key scales at which the trade-off intensities of cropland functions change spatially, and finally explores the influencing factors at different scales using GeoDetector. This research can provide a scientific basis and suggestions for the differentiated management and optimization of cropland.

2. Materials and Methods
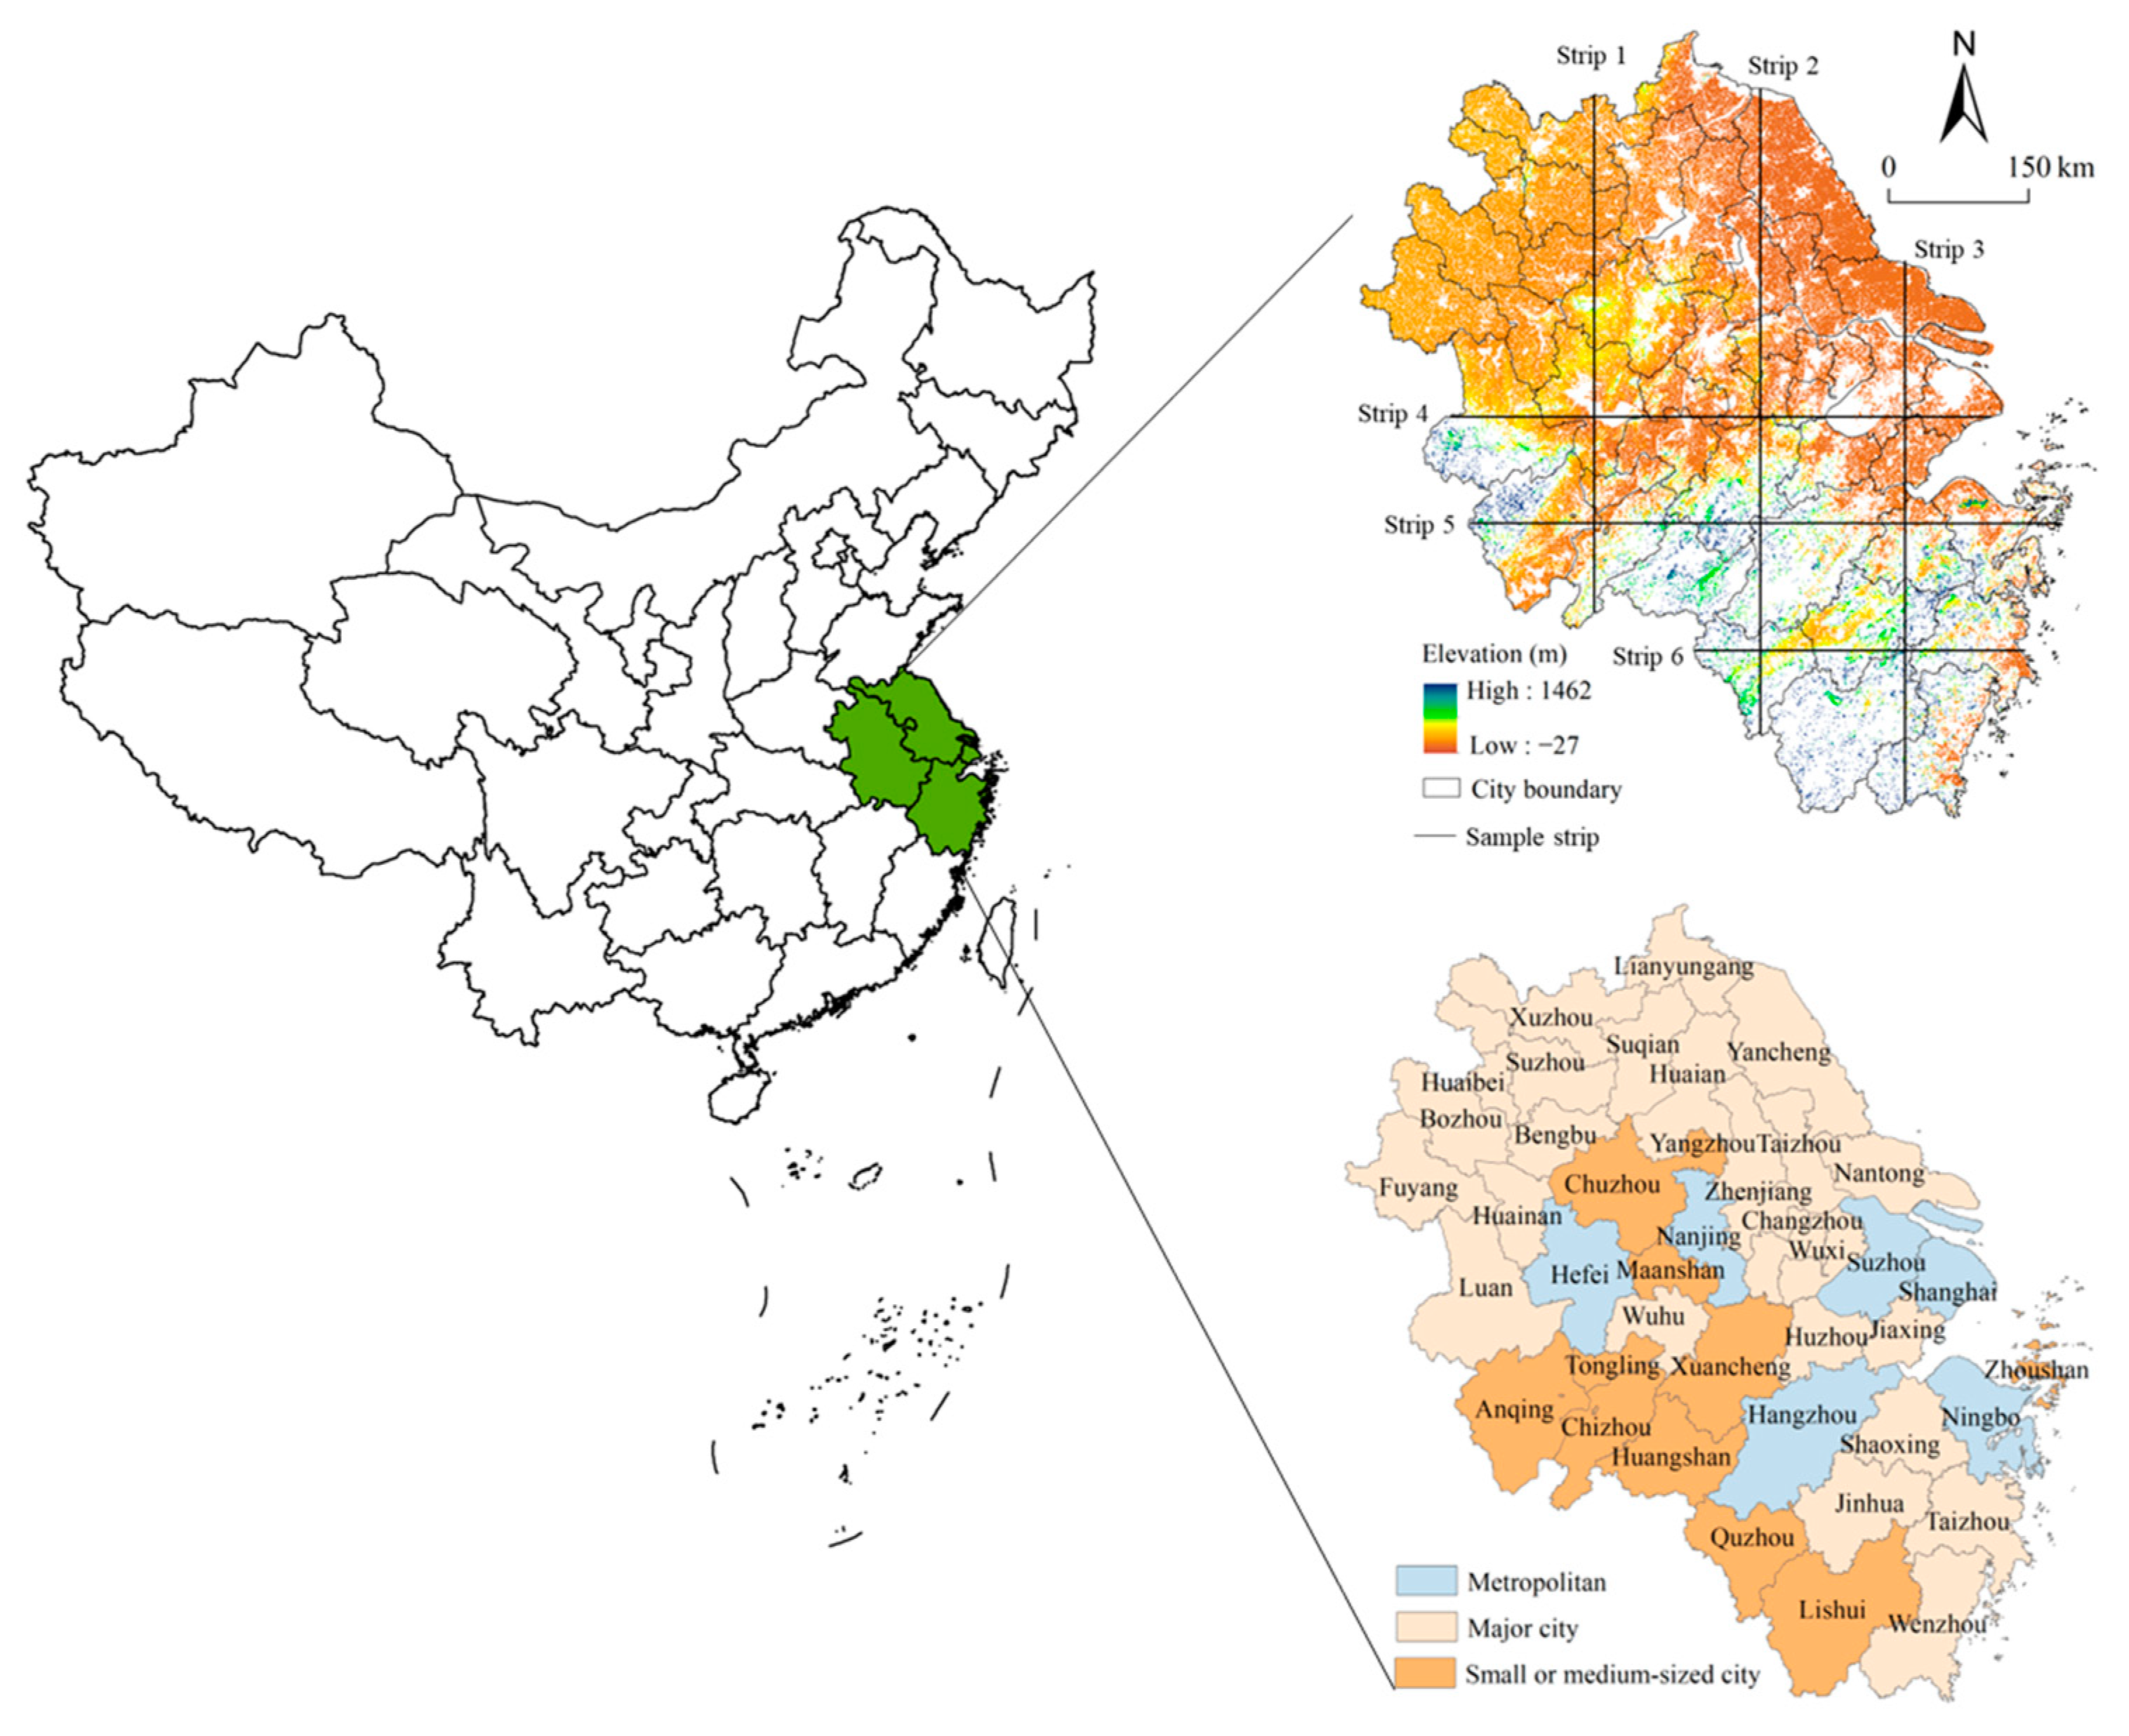
2.1. Study Area

The YRD (36°46′−32°04′ N, 119°08′−121°15′ E) consists of four provinces and one municipality, Jiangsu, Zhejiang, Anhui, and Shanghai, with a total of 41 prefecture-level cities (Figure 1). From 2000 to 2023, the urbanization rate increased from 49.6% to 70.84%, the total population increased from 194 million to 235 million, and the gross domestic product (GDP) increase from CNY 2.20 trillion to 24.47 trillion, making it a typical highly urbanized region in China. The regional topography slopes from the southwest, where there are more hills and mountains, to the northeast, where there is a concentration of rolling plains, with good light and heat conditions and abundant water resources, providing a favorable base for agricultural production.
In the subsequent wavelet analysis of the variance study, the implementation of a sample strip is imperative to ensure the continuity of the data. By the principle that the sample strips are laid out parallel to or coinciding with the latitude and longitude lines, and at the same time traversing as much as possible through a variety of habitats, geomorphologies, and different landscape type units [20,21], we constructed six sample strips, with a sample strip width of 1 km × 1 km grid units along the direction of the longitudinal line (sample strips 1~3) and the latitudinal line (sample strips 4~6).
As the global population and the amount of available construction land increase, it becomes evident that the cropland functions in cities of varying sizes are subject to variation. To accurately describe the trade-off differences among different types of cities in the YRD, we categorized the 41 cities into three types, metropolis (>5 million), large cities (>1 million), and small and medium-sized cities (<1 million), based on China’s urban hierarchical classification standards and existing studies [22], using urban population size as the statistical caliber.

2.2. Data Sources and Preprocessing

The multi-source data utilized in this study are presented in Table 1. Prior to analysis, the data were subjected to preprocessing in accordance with the attribute characteristics of each data set. The specific preprocessing steps are outlined below: (1) Meteorological data, including precipitation, temperature, and evapotranspiration data, were obtained from 1995 to 2023. These data were spatially processed to obtain the five-year average of the meteorological data for the three phases of the years 2000, 2010, and 2023. (2) Multisource remote sensing information. The remote sensing data utilized in this study encompass Land use/cover data, digital elevation model (DEM) data, net primary productivity (NPP) data, and Landsat8 remote sensing image normalized vegetation index (NDVI) products for the period between 2000 and 2023. Using ArcGIS 10.8 and ENVI 5.6 software, the remote sensing data were refined. (3) Web map service. The Python 3.13 programming language and online map-related application program interface services were used to obtain open-source spatial and temporal data such as points of geographic interest (POIs), historical traffic conditions, etc., and obtain geospatial information data for the three phases of 2000, 2010, and 2023 through extraction and standardization. (4) Other data, such as statistics, were obtained by online downloading and application to relevant departments and were processed by spatial mapping. All data were resampled to the WGS_1984_UTM_Zone_50N projection system at a spatial resolution of 1 km × 1 km.

2.3. Methodology

2.3.1. Construction of Cropland Function Evaluation System

In light of the necessity for the coordinated development of food security, urban development, and ecological protection, we divided the cropland functions into three categories: PF, LF, and EF. Then, a system of evaluation indicators for cropland functions was constructed (Figure 2): (1) The PF is based on the premise that cropland, as land dedicated to agricultural production, can provide a variety of agricultural products, which are essential for the survival and development of humans. Furthermore, cropland plays a crucial role in providing the foundation for economic and material security. Therefore, this study selected grain production indicators to characterize the cropland PF. (2) The LF is concerned with the pursuit of livability and refers to the non-material benefits obtained by human beings, such as leisure and entertainment. These benefits are related to the natural properties of the ecosystem and are also affected by the accessibility of the ecosystem and the number of beneficiaries. This can be quantified by selecting cultural and recreational indicators using the recreation score method, where recreational opportunities are calculated using points of interest in the categories of “agro-paradise”, “ecological farm”, and “leisure farm”, which are highly related to agrotourism. (3) The EF is the background of cropland, which is an important resource and environmental guarantee to support high-quality human production needs and livelihood, including natural conditions such as the regional climate, hydrology, and soil. In this study, regarding related studies [23,24,25], three typical indicators, namely, water yield, carbon sequestration and oxygen release services, and soil retention, were selected to quantitatively assess the EF (Table 2).

2.3.2. Assessment of the Cropland Function Trade-Off Intensity

The root mean square error (RMSE) was employed to elucidate the trade-off relationship between cropland functions. This approach extends the conventional understanding of trade-off from a mere negative correlation to encompass the variable rate of isotropic change between cropland functions. The trade-off intensity results are obtained by calculating the distance from the paired cropland function values to the 1:1 line. A higher RMSE value indicates a stronger trade-off, while a smaller value indicates a weaker trade-off. This method has been widely employed in the investigation of the trade-off relationship between ecosystem services [32,33,34]. The specific formula is as follows:
R M S E = 1 n 1 i = 1 n C F i j C F i ¯ 2
where C F i is the normalized cropland function score j on a cell i; C F ¯ is the mean value of the two types of functions on unit i; and n is the number of regional units.

2.3.3. Determination of the Scale of Functional Characteristics of Cropland

Wavelet analysis is an analytical method that links variables in long time series or spatial scales with their specific spatiotemporal characteristics [35]. This method can be parsed into sub-signals at different spatial and temporal scales by wavelet transform. Wavelet analysis has been widely used in geography and ecology research [36]. For one-dimensional data, the following definition can be proposed:
W a , x = 1 a f x φ x b a d x  
where W a , x is the wavelet transform coefficients; f x is the original signal data function in the spatiotemporal domain, which is called the analytical wavelet; a is the spatial scale parameter; b is the position of the center of the representative wavelet in space; and φ x is the wavelet kernel function, which is also called the basis wavelet.
The wavelet variance is the square of the modal deviation of the wavelet coefficients, which can reflect the abundance or lack of structural information at the corresponding scale. Geographic spatial distribution scale analysis can reflect the scale characteristics and effects of spatial elements. Its calculation formula is
S 2 = 1 n 1 i = 1 n W i u ¯ 2  
where S 2 denotes the wavelet variance; W i is the wavelet coefficients; u ¯ is the average value of the wavelet coefficients; and n is the number of wavelet coefficients. The wavelet variance results are calculated by the Wavelet Analyzer module in MATLAB R2018b, and the sample line layout is shown in Figure 2.

2.3.4. Identification of Key Factors in the Functional Trade-Offs of Cropland

Considering the reality of the study area and the availability of data, the trade-off intensity between cropland functions was chosen as the dependent variable. In terms of the independent variables, we selected potential drivers from natural and socioeconomic dimensions (Table 3), referring to existing studies [37,38] and considering the development characteristics of cropland in highly urbanized areas [39]: (1) Natural resource conditions. Agricultural production is often constrained by nature, as food crops must grow in a suitable production environment, and regional temperature, precipitation, and topographic conditions predominantly affect food production, which in turn affects the spatial layout of cropland production. (2) Socioeconomic factors. Urbanization is an important driver of the transformation of cropland functions, including population migration, land expansion, and the non-agricultural economy. We selected evaluation indicators from three dimensions: population, economy, and land [40,41]. Among them, population urbanization reflects the agglomeration of rural surplus labor to large cities and refers to the degree of spatial agglomeration of the urban population, which is specifically characterized by the population density. Economic urbanization is mainly manifested in the improvement of urban economic efficiency, which is characterized by the per capita GDP; land urbanization is mainly manifested in the scale of construction expansion in the urban space, which is specifically characterized by the proportion of construction land.
GeoDetector is a statistical method for detecting the spatially stratified heterogeneity of dependent variables and revealing their driving mechanisms without the need for preset models and distributional assumptions. In this study, the natural breakpoint hierarchical hairpin was used to classify each influencing factor at multiple scales to realize the transformation of continuous variables into categorical variables, and to extract the dependent variable Y (cropland function trade-off intensity) and the independent variable X (influencing factor) to identify the dominant factors affecting the intensity of function trade-offs of cropland in highly urbanized areas. The specific formula is as follows:
q = 1 i = 1 m N i i 2 σ N σ 2
where q is the indicator of the explanatory power of the driving factor on the trade-off strength index, the value interval is [0, 1], and a larger q value indicates a stronger explanatory power of the driving factor; i = 1, ……, m is the stratification of the driving factor X; N i and N are the number of cells in layer i and the whole region, respectively; and i 2 σ and σ 2 are the variance of the Y values for stratum i and the whole region, respectively.

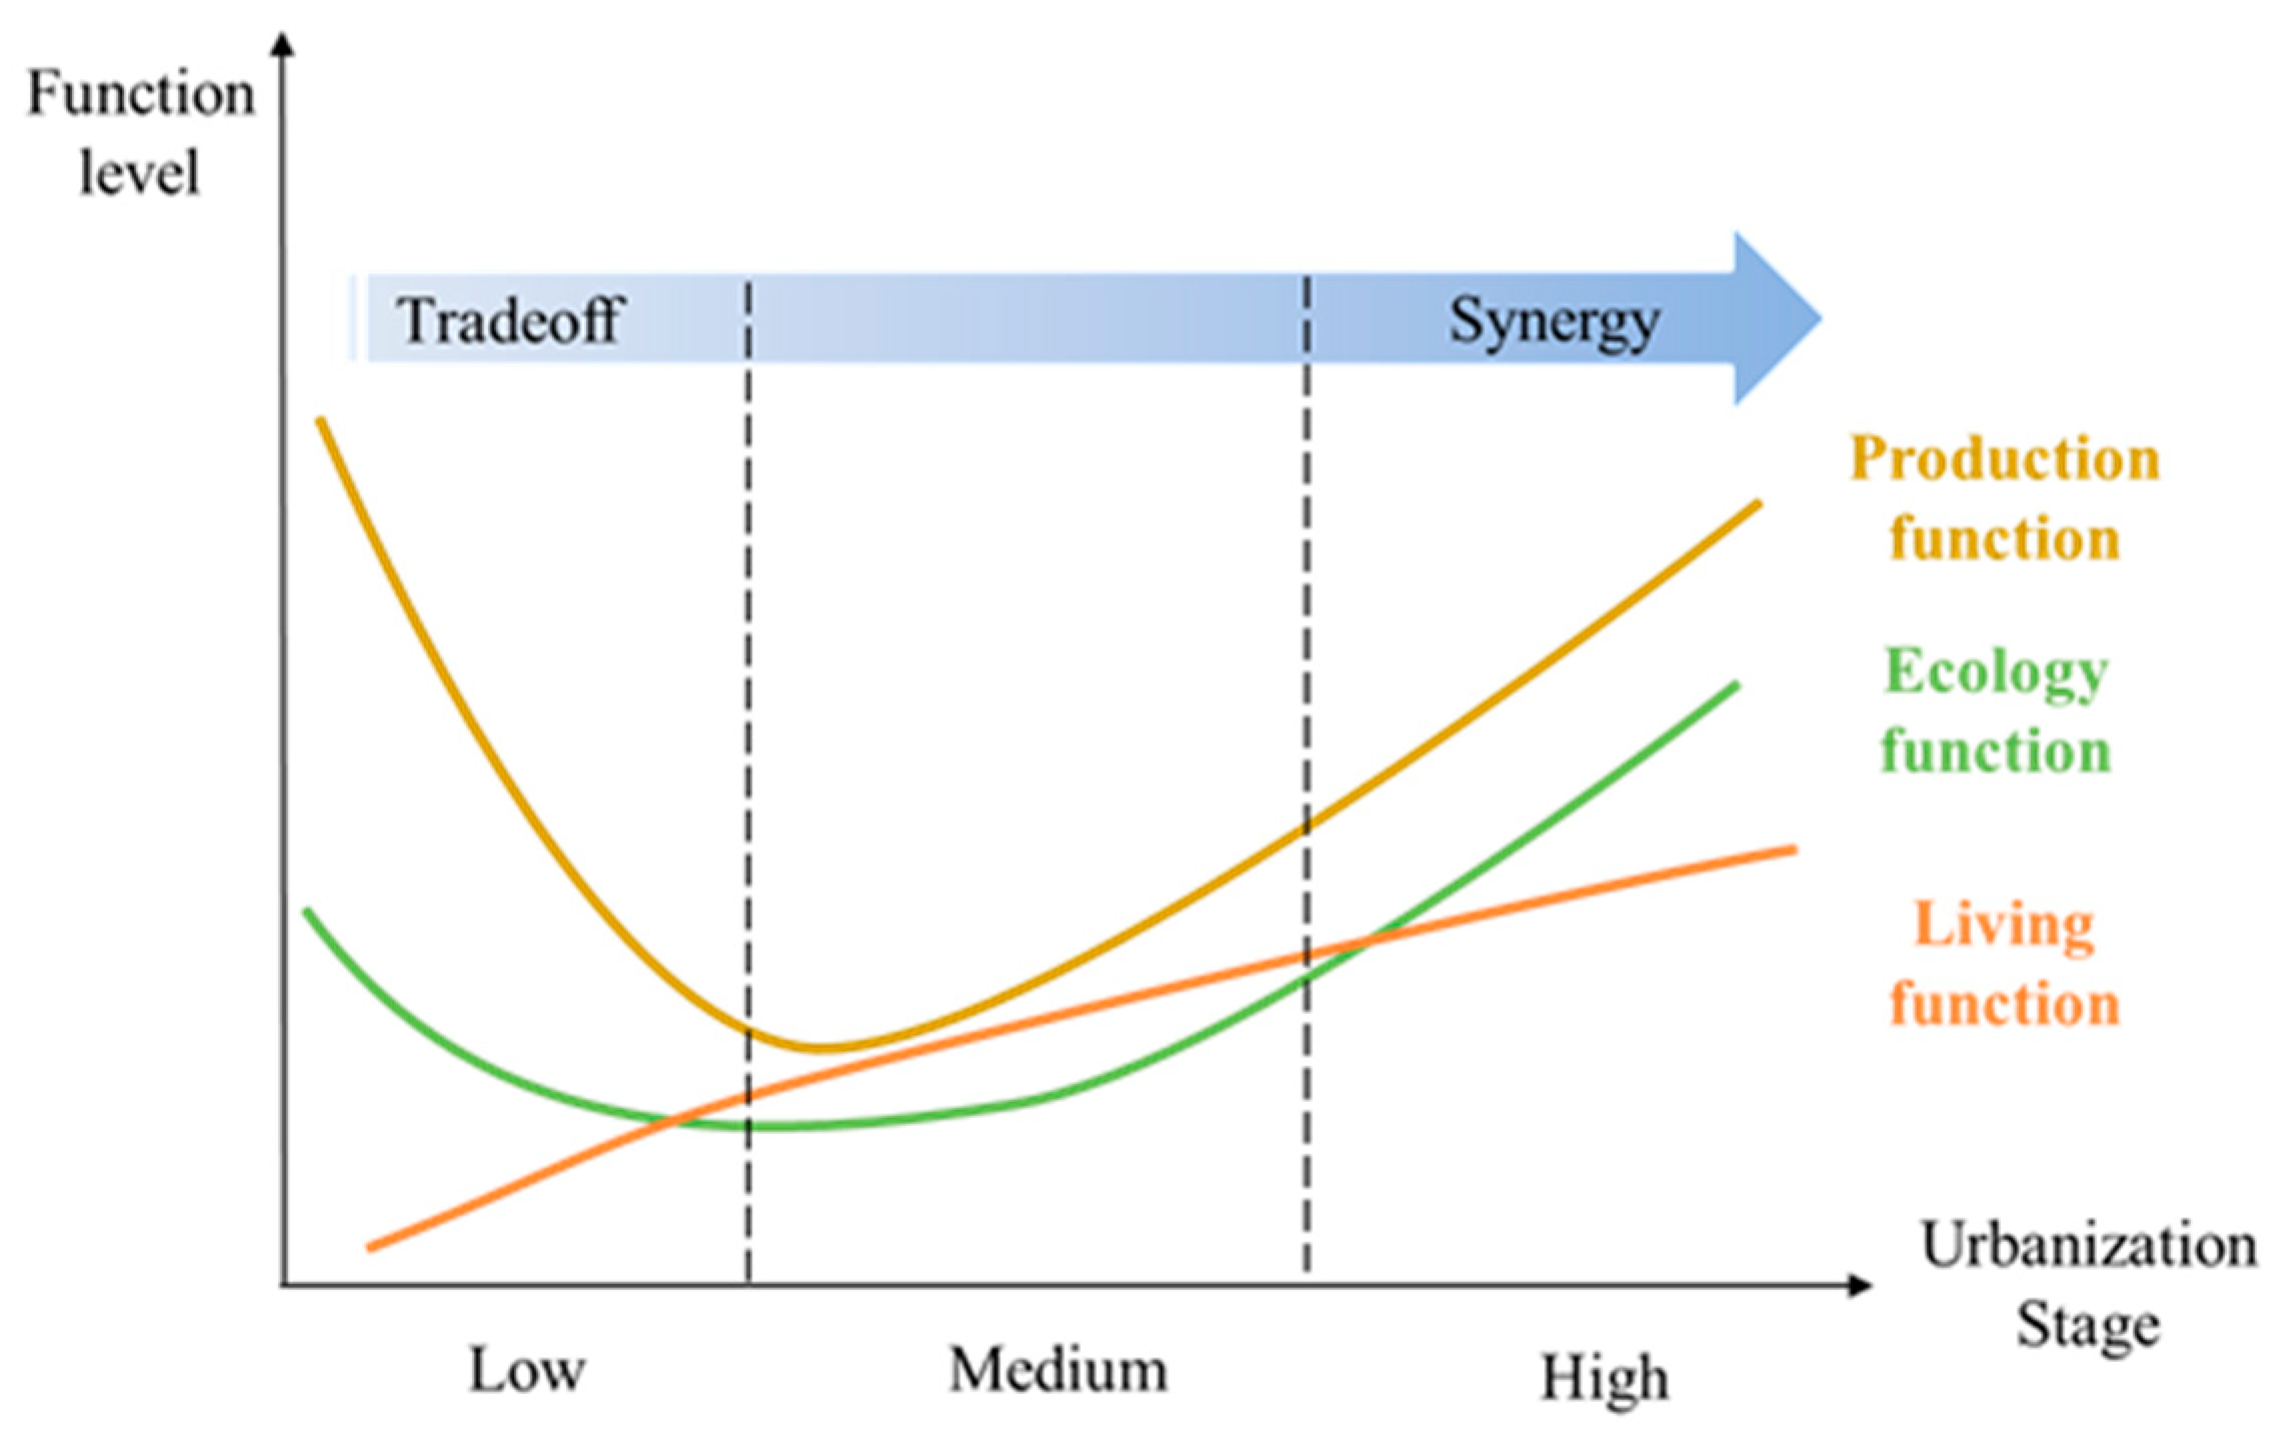
2.4. Theoretical Framework

As an integral land use, cropland provides diversified products and services that address various facets of human needs, including intensive production, comfortable living, safety, and ecology [42]. Concomitant with the progression of urbanization, cropland has undergone a trend of differentiation in its function (Figure 3).
During the initial stages of the study period, the level of regional urbanization was generally low. The production function (PF) of cropland was highly esteemed, serving as a crucial provider of essential agricultural products that fueled the process of urbanization. Additionally, cropland offered a diverse array of ecosystem services and possessed inherent, superior ecological functions (EFs), as noted by [43]. Due to the socioeconomic constraints of the time, the living function (LF) of cropland was not yet prominent. As urbanization progressed rapidly, the cropland LF began to gain significance. However, this rapid urbanization and industrialization also posed a series of challenges, including the degradation of cropland’s ecological environment and the encroachment of construction land upon cropland space. These issues resulted in the diminution of cropland’s PF advantages and the impairment of its EF. The LF and the two functions of PF and EF are characterized by trade-offs, with potential negative synergistic effects observed between the PF and EF.
As urbanization has progressed to a medium level, people’s demands for cropland have diversified, encompassing values such as food security, ecological well-being, and recreational experiences. Notably, the trade-offs among cropland functions have diminished. In recent years, with the shift towards highly urbanized regions, there has been a heightened concern for food security and urban ecological issues [44]. Consequently, cropland development has transitioned from an unsustainable, monolithic structure to a sustainable, composite one [45]. This transition has led to a rapid enhancement of the synergistic effects among cropland functions.

3. Results

3.1. Spatiotemporal Characterization of Cropland Functions

3.1.1. Spatiotemporal Distribution Characteristics of Cropland Functions

Cropland functions in the YRD demonstrate varied trends over time and exhibit spatial heterogeneity (Figure 4). The northern portion of the YRD is considered to be within the primary agricultural production zone, exhibiting high levels of PF. In contrast, the eastern part, encompassing regions such as Shanghai, southern Jiangsu, and northern Zhejiang, is characterized by high population density, economic activity, and a high level of urbanization. This urbanization has led to the development of the cropland LF, including agricultural recreation and tourism, and the experience of farming culture.
In time, with the accelerated urbanization and rapid industrialization of the YRD, there has been a rapid loss of cropland, and the non-agriculturalization in the eastern and southwestern YRD and other regions has been obvious, with a decline in the PF, while the negative ecological effects of water resource shortages, soil erosion, and other factors have emerged. For instance, the urbanization rate in southern Jiangsu exhibited an increase from 59.62% in 2000 to 70.30% in 2010, while the urbanization rate in Lishui City, Zhejiang Province, demonstrated a rise from 33.10% in 2000 to 48.40% in 2010 (see Appendix A). This has led to a decline in food production and a weakening of the EF, despite an enhancement in the living standard. Following 2010, the average annual growth rate of urbanization in all regions exhibited a decline in comparison to the period of 2000–2010 (see Appendix A). Notably, urbanization in the YRD transitioned from an incremental expansion to a phase of “high-quality development”. This transition may be attributed to the successive implementation of policies such as the National Main Functional Areas Plan (2010), New Urbanization (2012), and the Rural Revitalization Strategy (2017). These policies have promoted the continuous upgrading of agricultural farming techniques and tools, thereby enhancing food security and optimizing the cropland EF, particularly in the eastern and southwestern parts of the YRD.
In the context of increasing urbanization levels, the function of cropland in the YRD has undergone a transition from a primary focus on “production” to a more comprehensive “production–living–ecology” paradigm. Cropland in different types of cities shows a characteristic development.

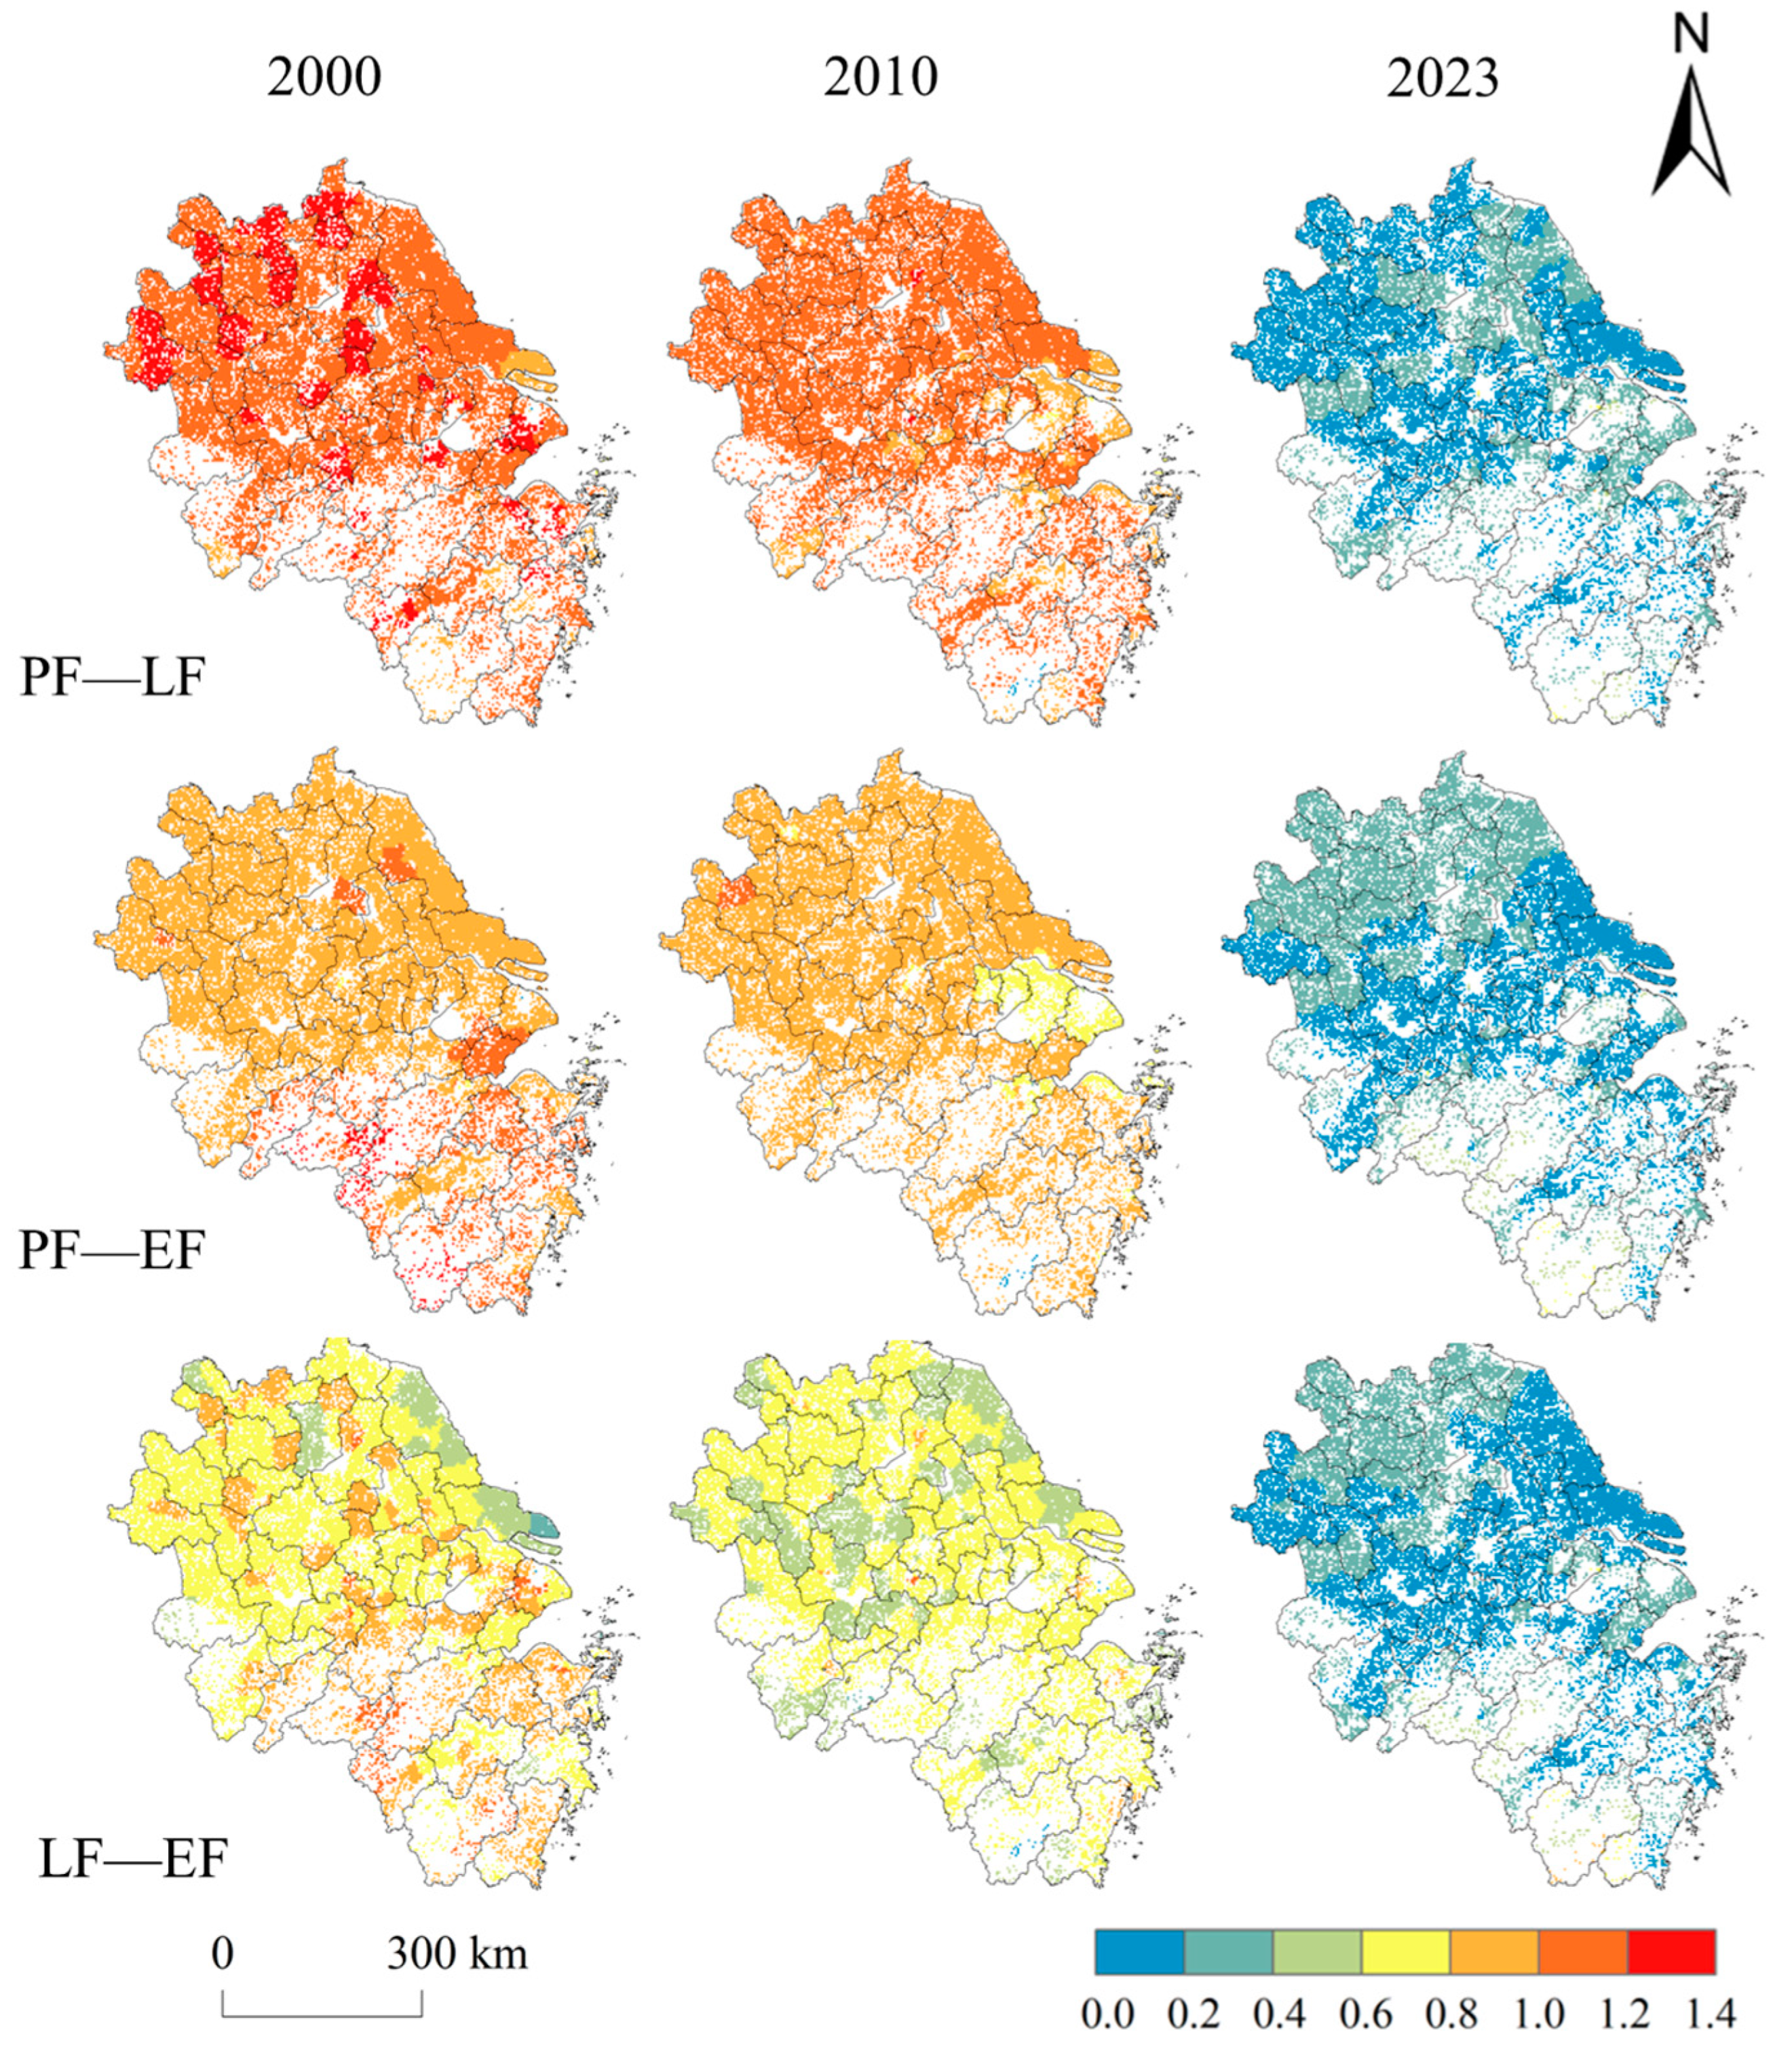
3.1.2. Characterization of the Cropland Function Trade-Offs

As shown in Appendix A, the urbanization rate of the YRD is increasing, and the average annual growth rate in 2010–2023 is decreasing compared with that in 2000–2010, and regional urbanization has shifted from “speed-oriented” to “quality-oriented”. The intensity of the cropland functional trade-off is also decreasing, and the rate of decrease in 2010–2023 is significantly higher than that in 2000–2010 (Figure 5). Regarding the PF-LF, the YRD reveals a decline in the RMSE from 1.141 in 2000 to 1.074 in 2010, and further to 0.168 in 2023. This decline is accompanied by a shift in the rate of decrease in the trade-off strength, which varies from 0.61% to 6.47%. Similarly, the RMSEs of the PF-EF in 2000, 2010, and 2023 are 0.930, 0.911, and 0.191, respectively. The rates of decrease are 0.17% (2000–2010) and 5.14% (2010–2023). The data reveal a decline in the LF-EF trade-off intensity, with a decrease from 0.748 to 0.637 and further to 0.179. The rate of decline was 1.01% (2000–2010) and 3.27% (2010–2023), respectively. This finding suggests that during the process of urbanization in the YRD, from the initial phase of development to the subsequent period of steady growth, the cropland functions are shown as a weakening of trade-offs and a synergistic enhancement.
Different regions have their characteristics. The northern part of the YRD is a high-value area for trade-offs between the various cropland functions. These less developed regions exhibit relatively low levels of urbanization development, as evidenced by Fuyang City, Anhui Province, which had an urbanization rate of 45.16% in 2023, significantly lower than that of the YRD (72.80%). The cropland in these regions is predominantly dedicated to food crop cultivation, with a concomitantly weaker LF and EF. A small range of high PF-LF values was observed in 2023 in economically advanced regions, such as Shanghai and southern Jiangsu, which are distinguished by a concentration on high-value-added agriculture, including facility and urban agriculture. These regions exhibit a pronounced emphasis on cultural and recreational services, accompanied by a comparatively diminished grain production capacity. In the southwestern part of the YRD, high values of the PF-EF and LF-EF trade-offs emerged in 2000, subsequently dissipating. This may be due to the implementation of a series of policies such as the establishment of land transfer pilots (2017) and the strengthening of the ecological compensation mechanism for cropland (2020), coupled with the enhancement of agricultural mechanization and technological advances in the process of urbanization, which have effectively promoted large-scale operations in southwestern municipalities (e.g., Lishui, Zhejiang Province) and increased food production capacity, and strengthened synergies between the region’s good cropland EF.

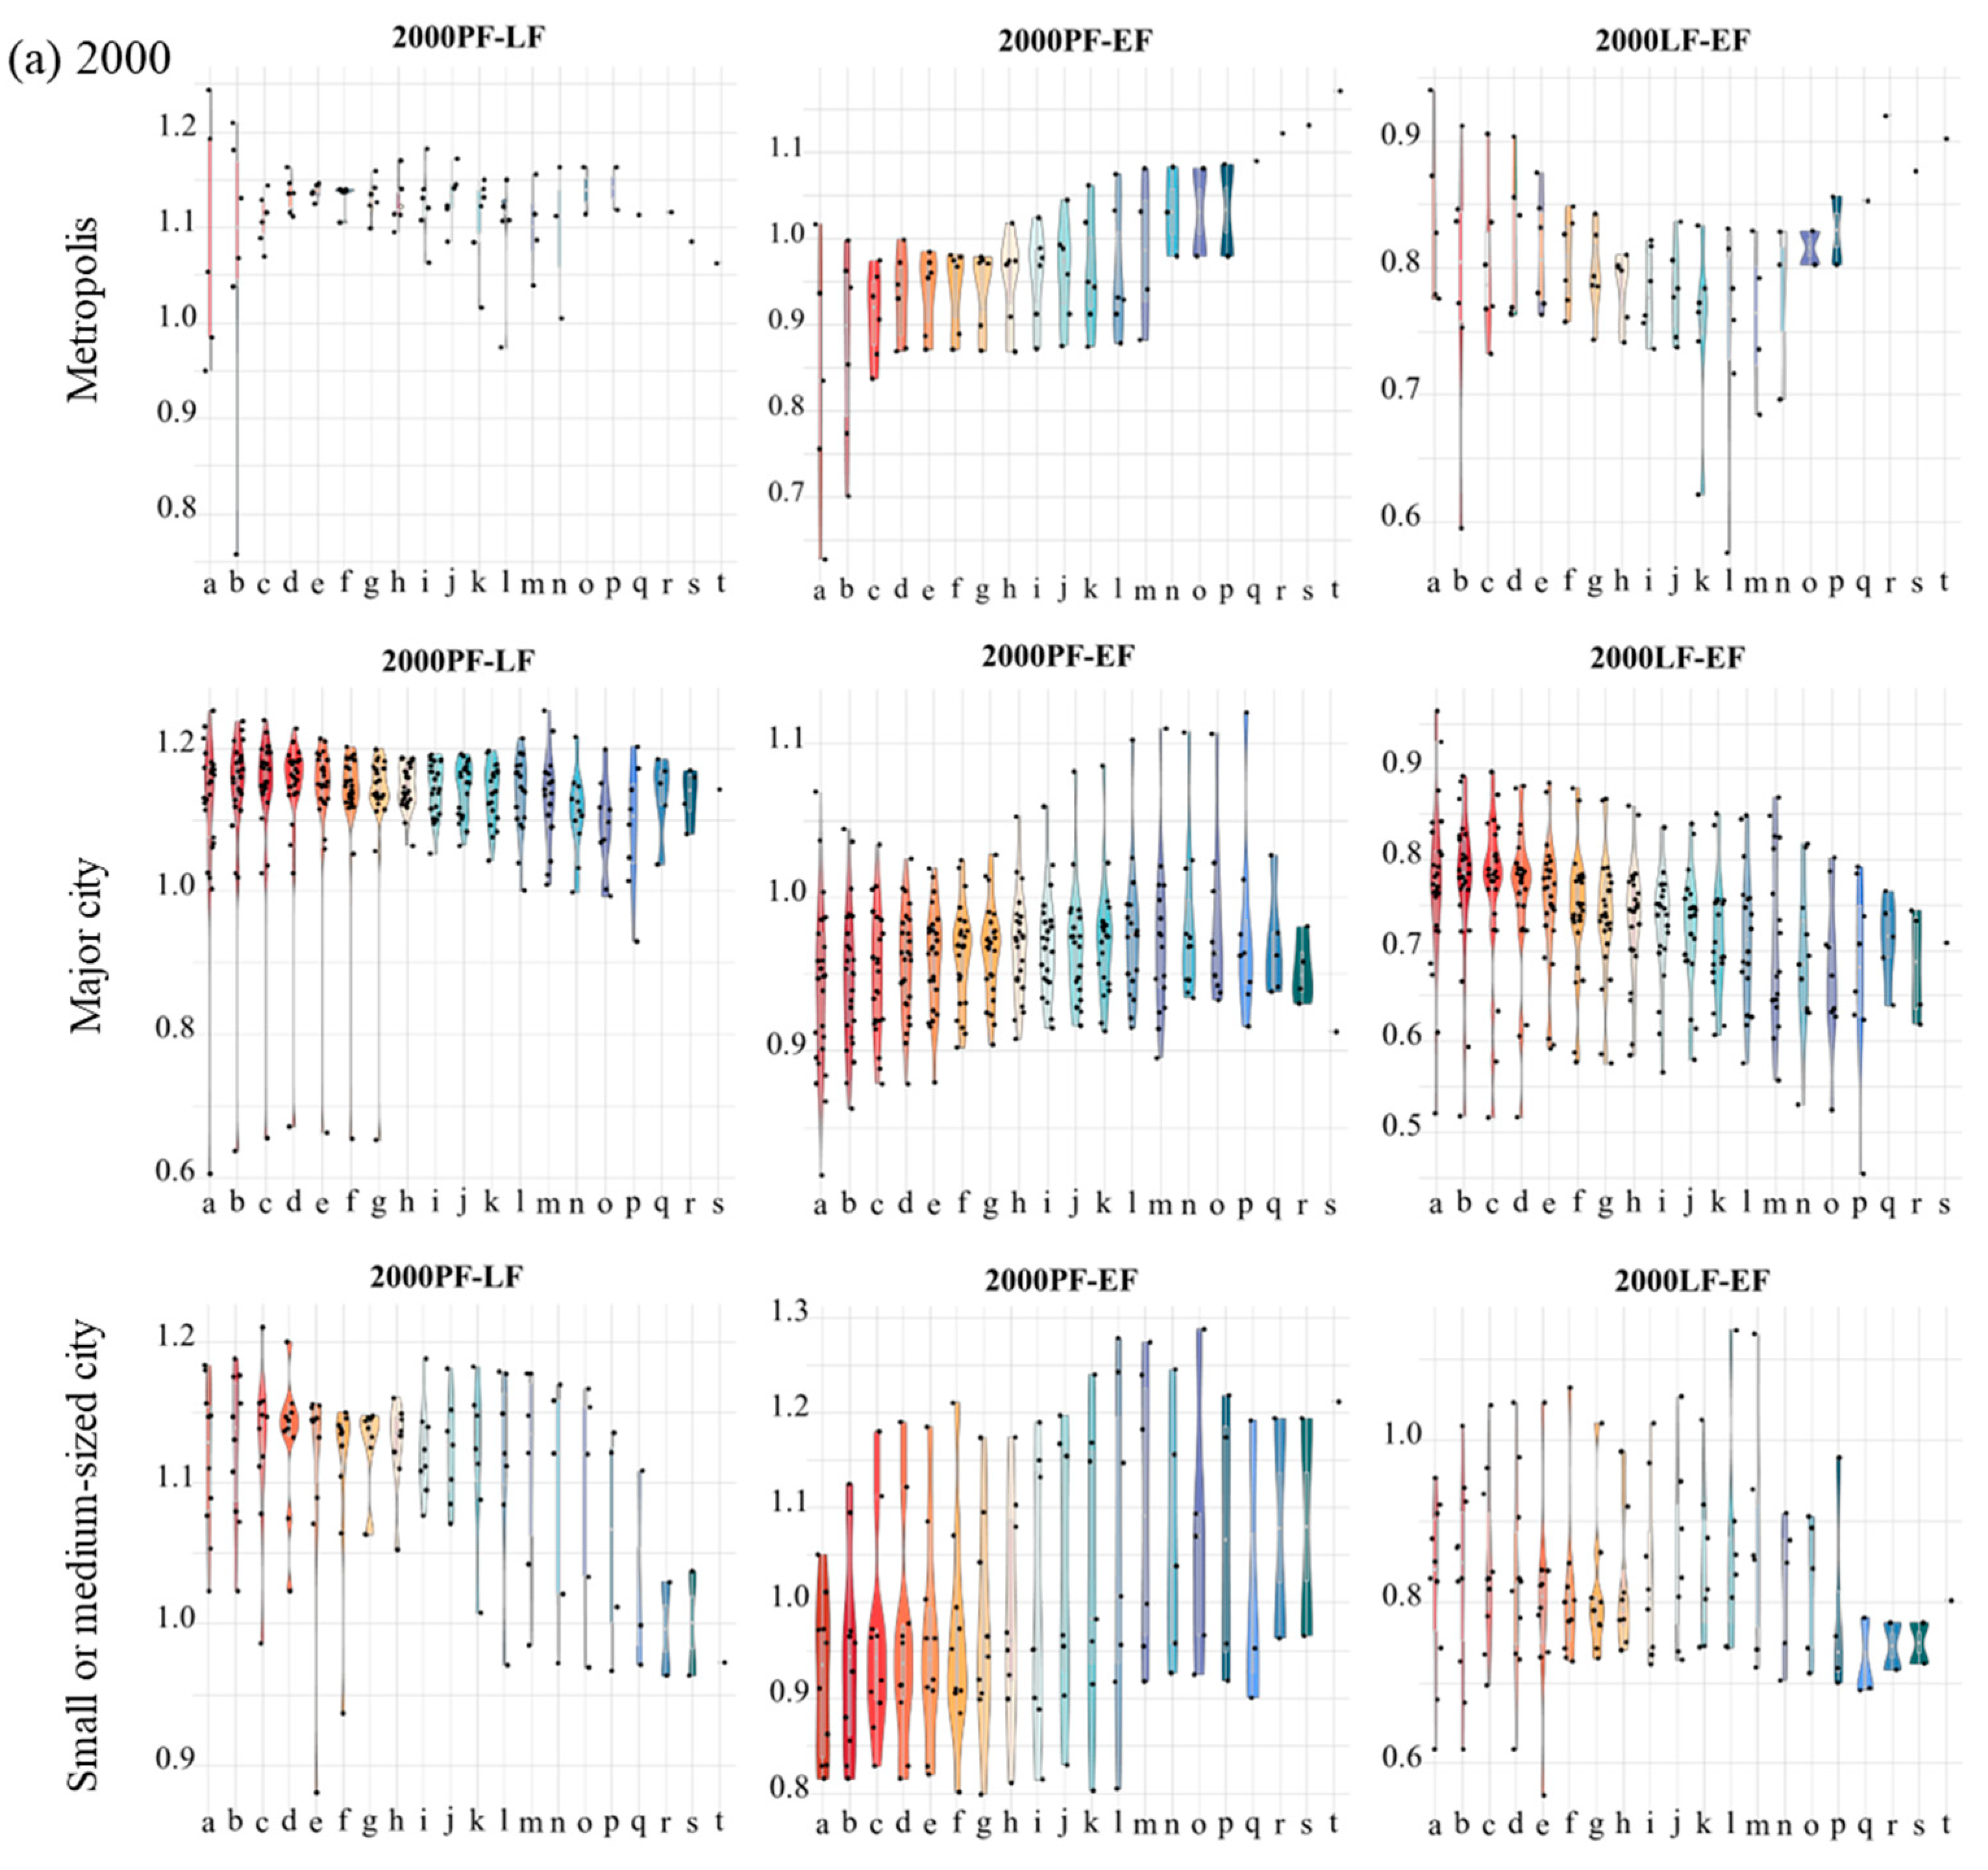
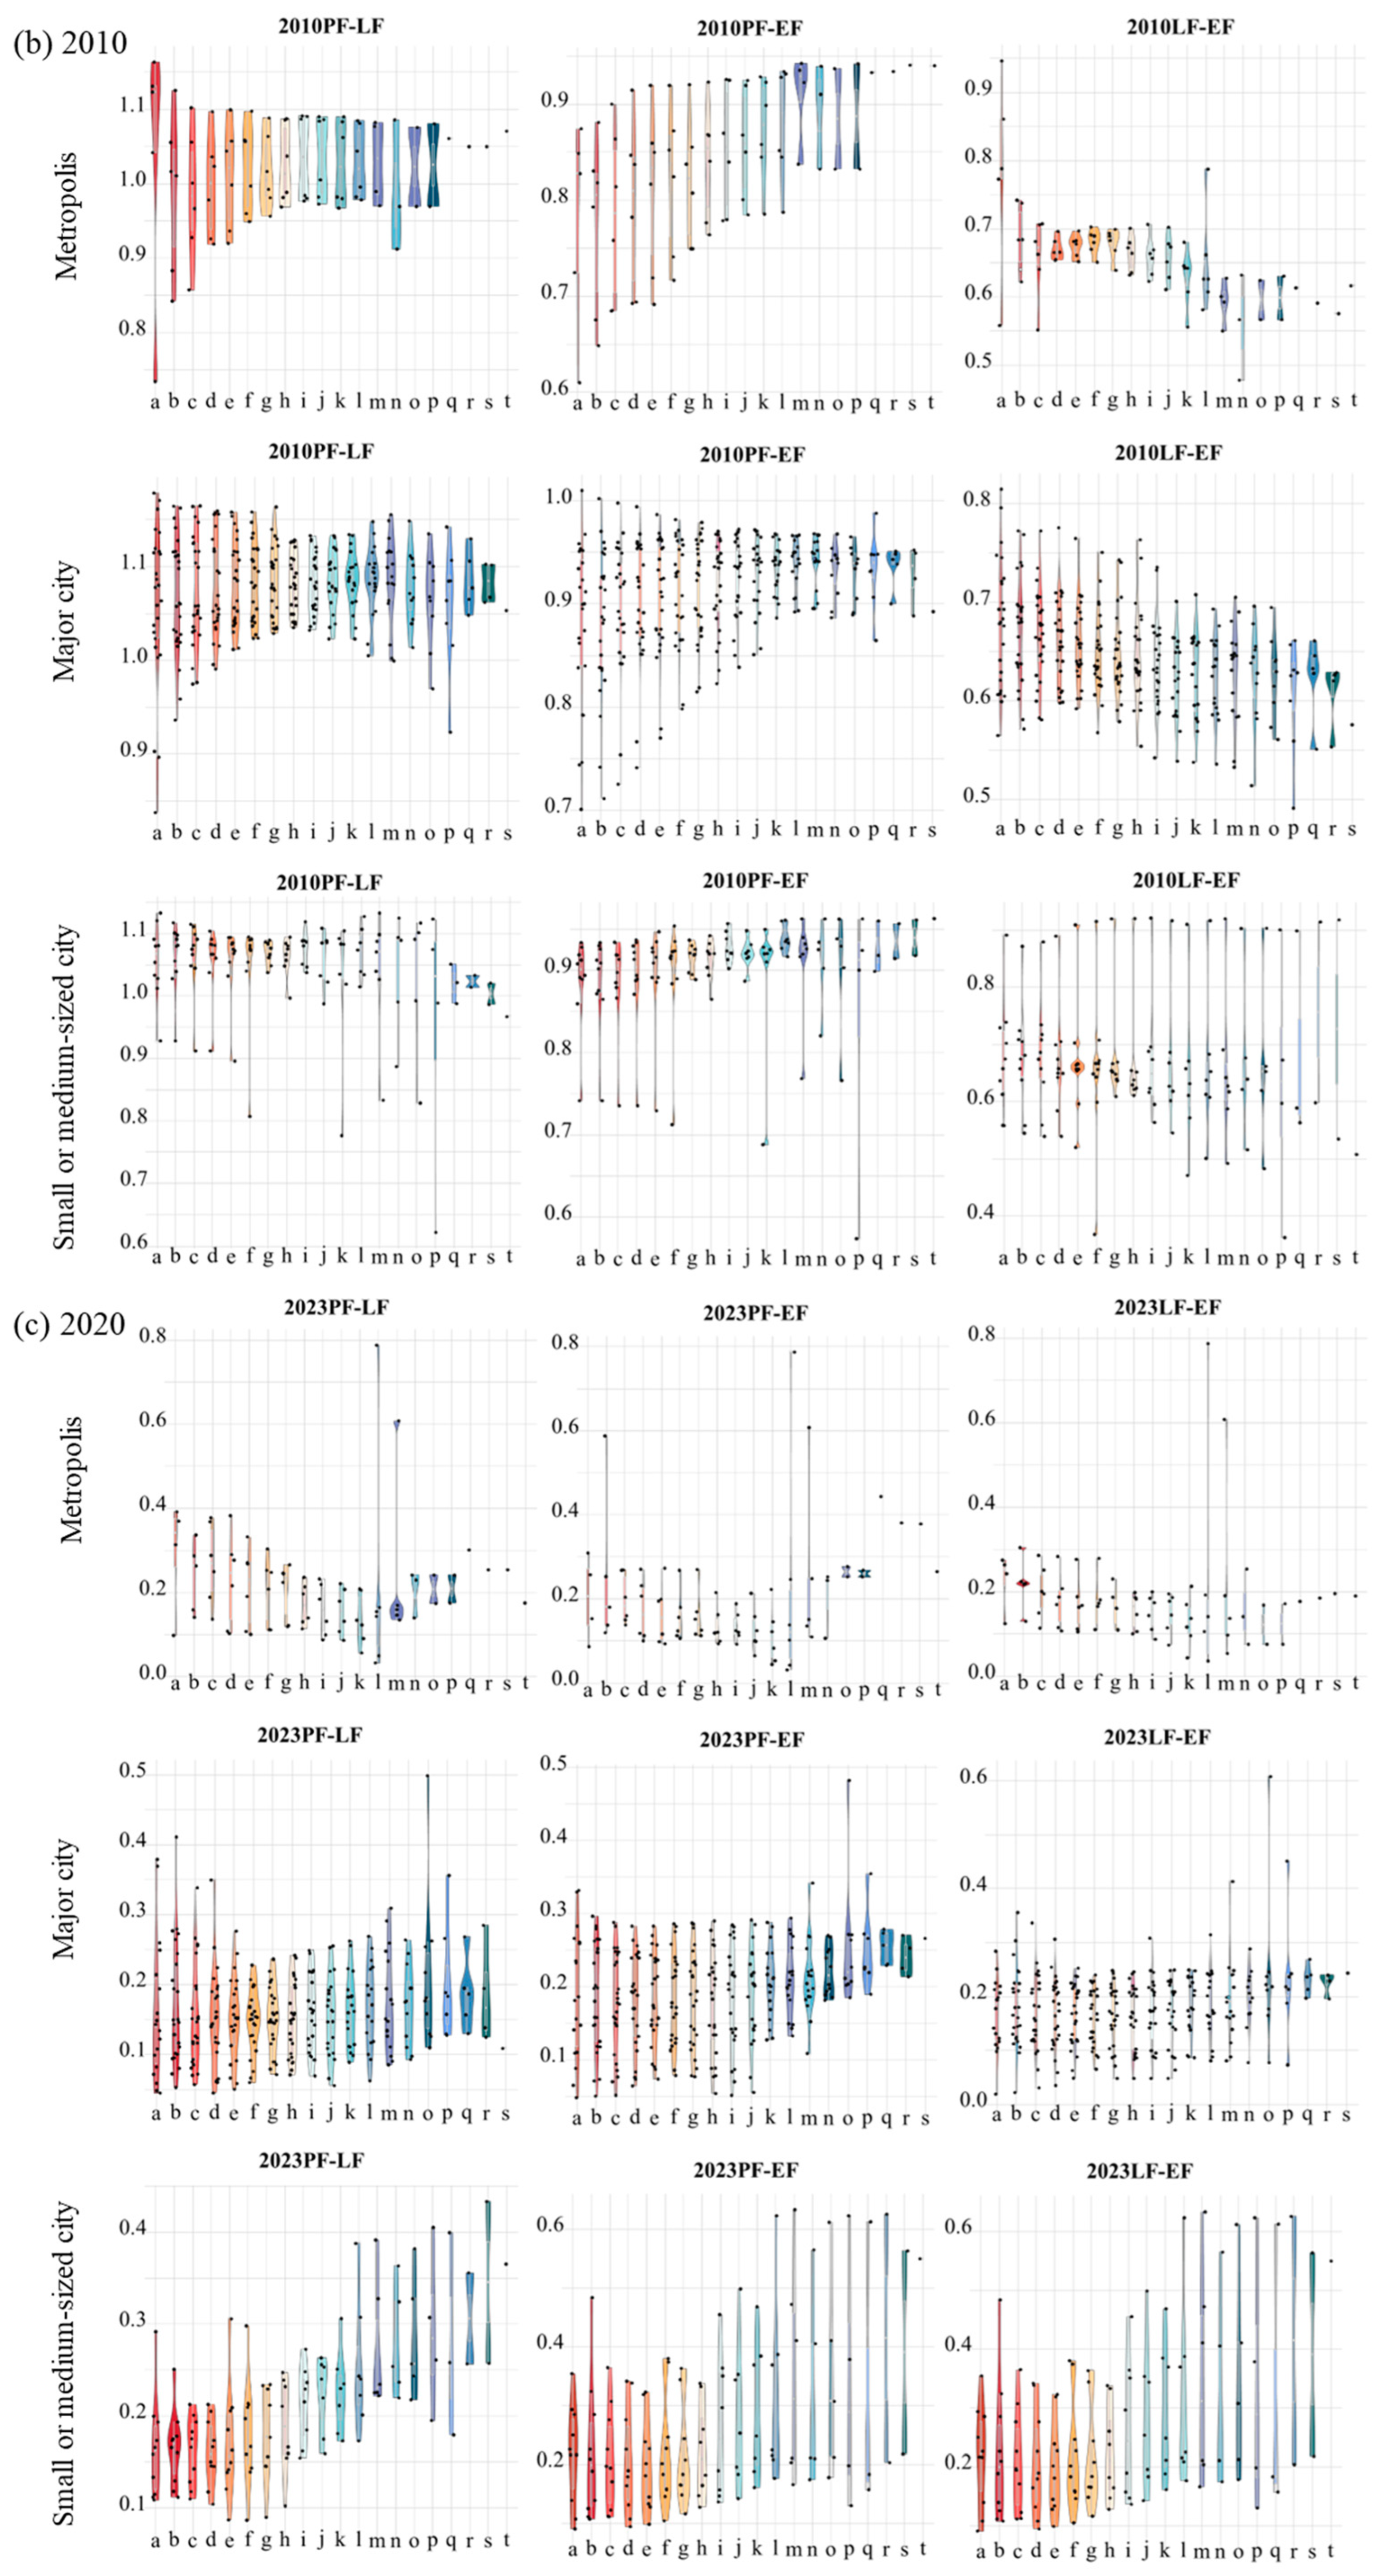
3.2. Scaling the Responses to Cropland Functions Trade-Offs

3.2.1. Optimal Scale Sequence Construction

The trade-off intensity information of the data sample points was taken on the meridional and latitudinal sample strips at a sampling resolution of 1 km, and wavelet coefficient extraction and wavelet variance calculation were carried out (Figure 6) to monitor the spatial scale characteristics of the trade-off intensities.
It can be seen that the wavelet variance curves of the cropland function in different years on the longitude sample line follow a relatively consistent trend, and there are more than two prominent and adjacent local maxima of the wavelet variance, i.e., there is a feature-scale domain with continuous feature scales. This indicates that the spatial heterogeneity of geographic phenomena or processes in the longitude sample line is pronounced, resulting in significant differences in the expression of feature information at different scales. Specifically, the peaks of function trade-offs in different years differ, and there are generally three common characteristic scales, 6 km, 18 km, and 30 km. In the latitudinal sample line, 18 km and 30 km, corresponding to 18 and 30 grid cells in the moving window, can be regarded as the characteristic scales of the strength of trade-offs, and information on the trade-off relationships at the scales of key ecological features is not available. The informative expression of the trade-off relationships at the scales of key ecological attributes is the richest. By integrating the range of characteristic scales, the vector rasters are aggregated into a sequence of multi-scale layers ranging from 6 km × 6 km to 30 km × 30 km, and thus the optimal sequence of multi-scale analyses containing three levels of grid cells is generated.

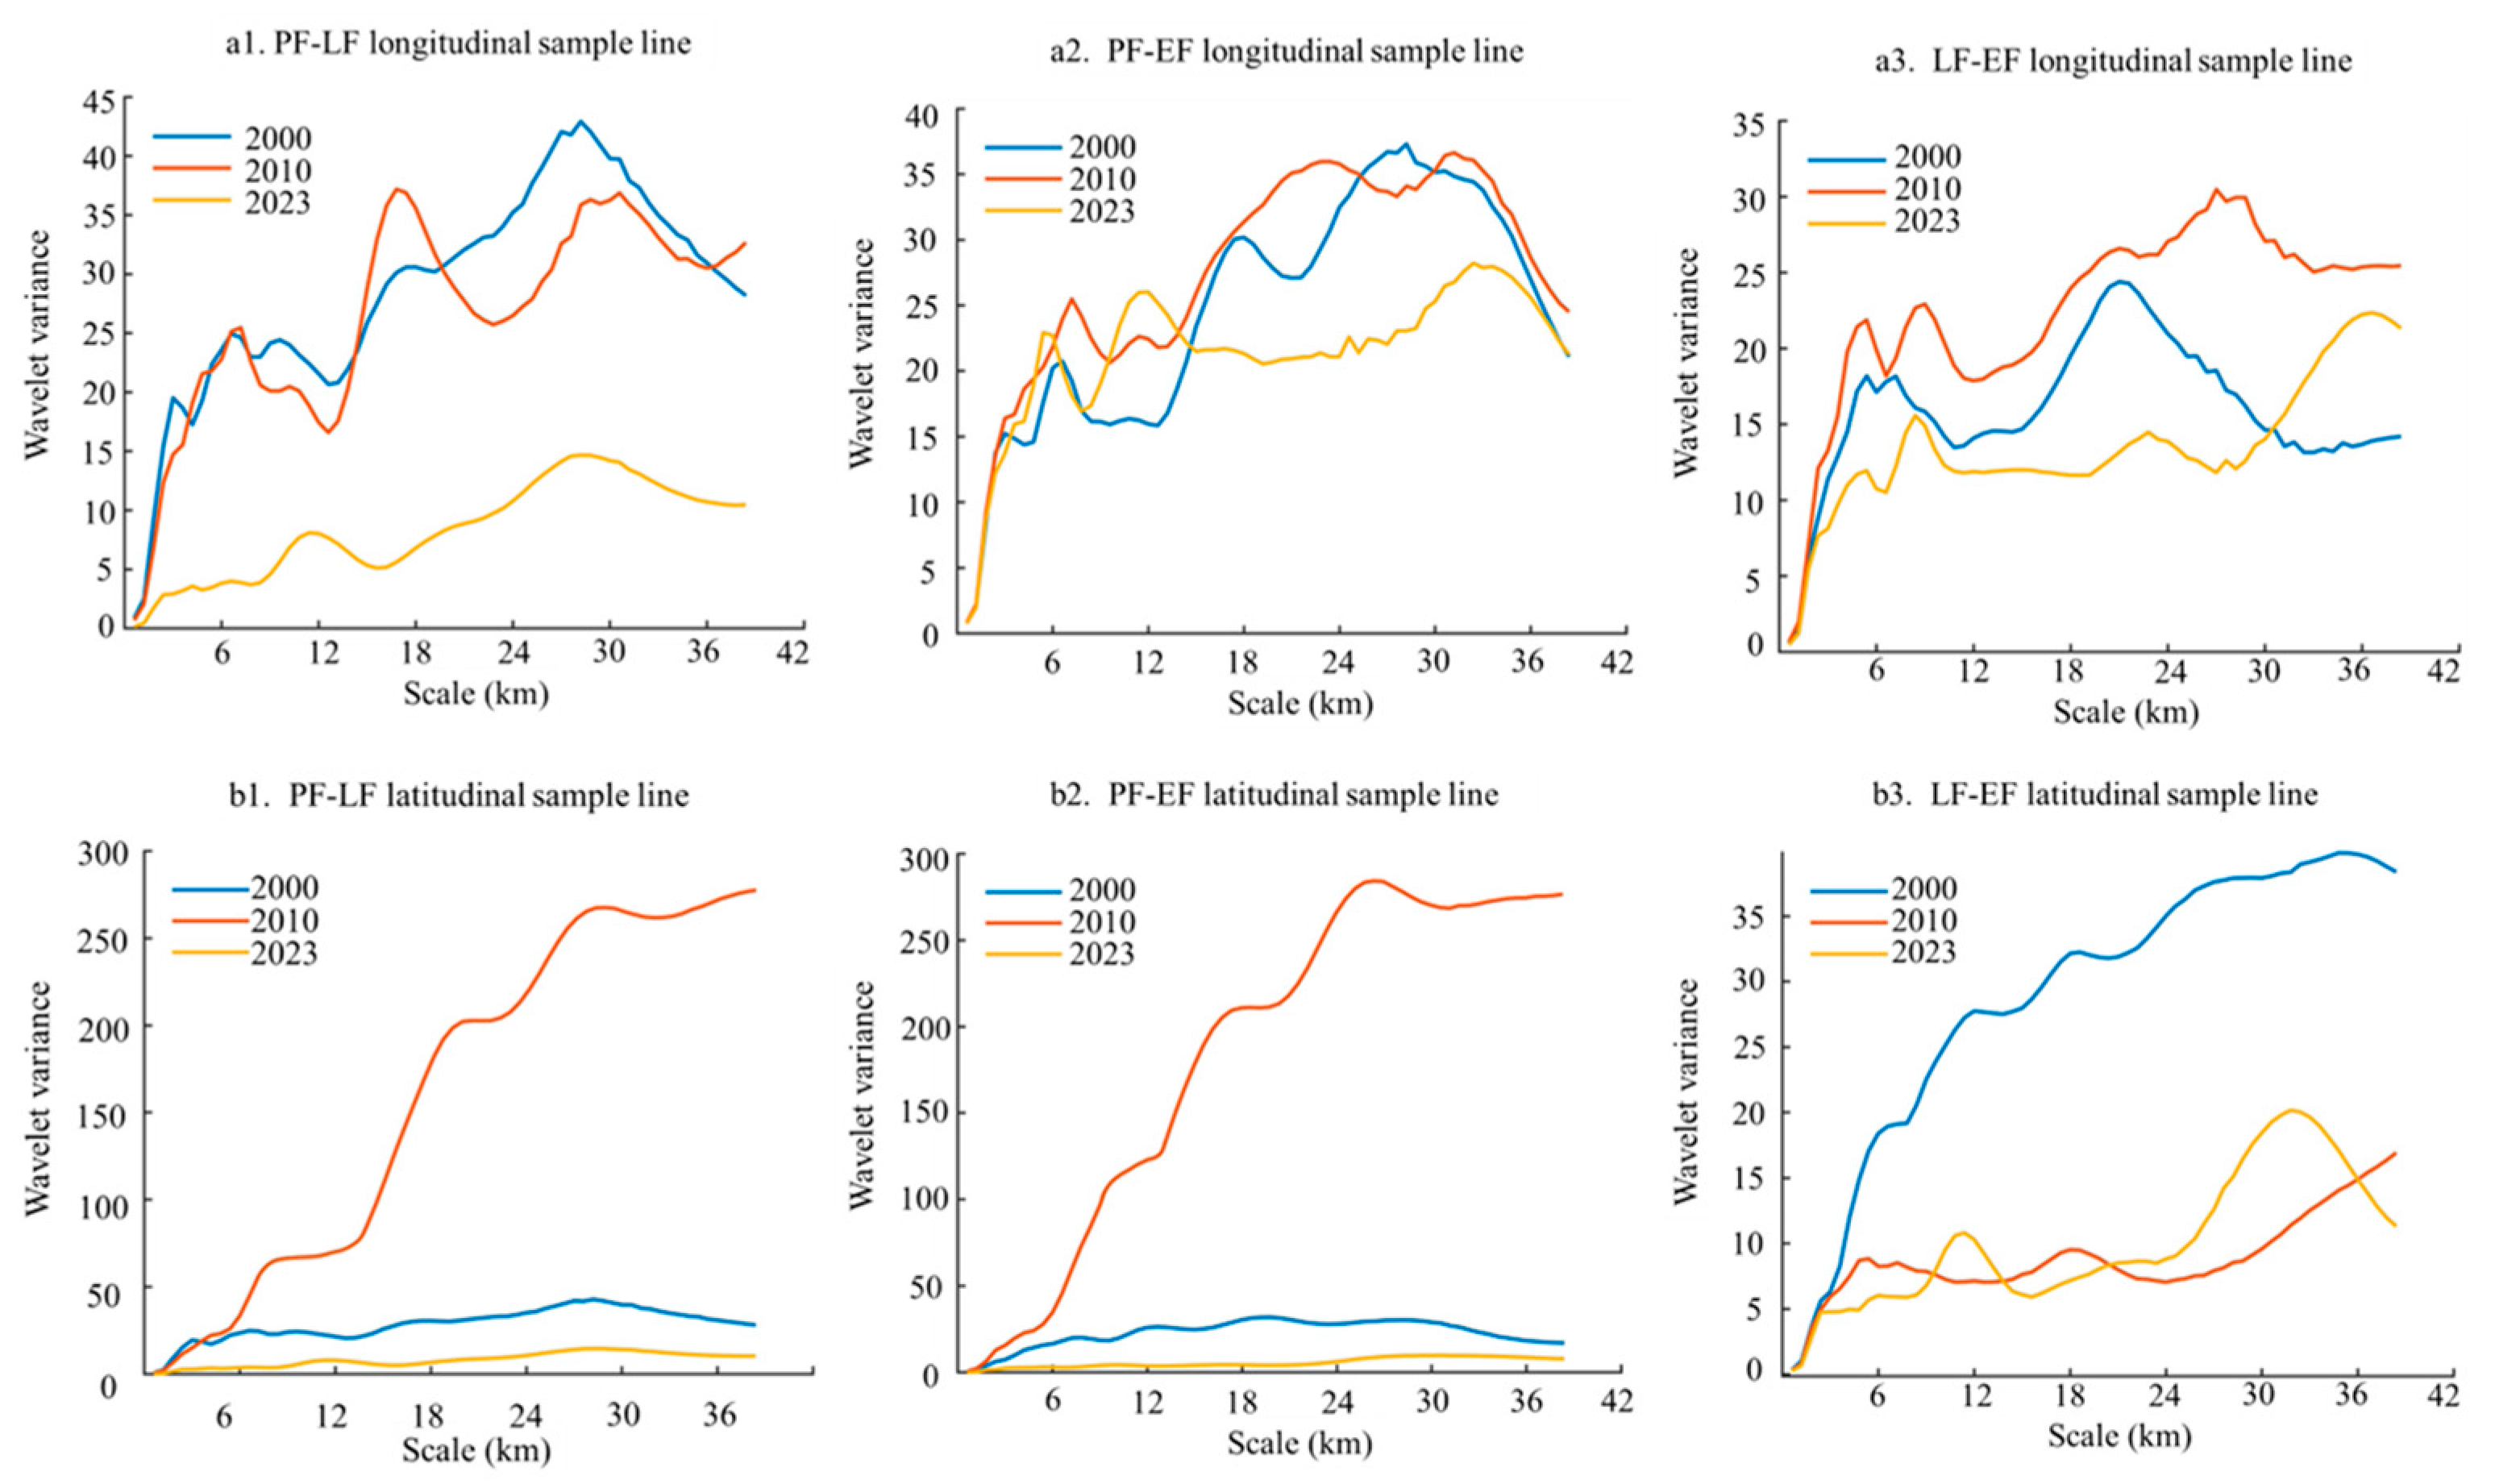
3.2.2. Scaling the Responses to Cropland Function Trade-Off

After classifying the 41 cities in the YRD into three types, we set the radius of concentric circles with a minimum scale of 6 km based on the results of the wavelet analysis, taking the geographic center of each city as the center to form concentric circles with a gradually increasing radius. The intensity of the cropland function trade-off of each city in each layer of the concentric circles was then revealed through the construction of a violin map, which was used to determine the scale characteristics of the cropland function trade-off of cities in highly urbanized areas (Figure 7).
Disregarding the evident discrete points, the inflection intervals of the cropland function trade-off strengths of the three types of cities in 2000 are all situated at g~h (near 42–48 km). The change curves demonstrate that they initially decrease and subsequently increase with the increase in distance. In 2010, the change curves of the metropolis and the large city are analogous and have not yet exhibited an evident inflection point, in which the PF-LF and PF-EF trade-offs generally demonstrate that they first strengthen and then flatten with increasing distance, and LF-EF trade-off intensity weakens with increasing distance. The cropland function trade-offs for small and medium-sized cities exhibit less variability with distance. In 2023, the change in the trade-off intensity of the metropolis exhibited a U-shaped distribution, with the inflection point interval ranging from 54 to 60 km from the city center. This area corresponds to the fringe zones of each metropolis. The inflection point of the change in function trade-off intensity for other large cities is located at f (at 36 km), exhibiting a smoother trend of first decreasing and then increasing. In the case of small and medium-sized cities, the inflection point of trade-offs occurs at e (30 km from the city center), and the change curve is characterized by a U-shaped distribution.

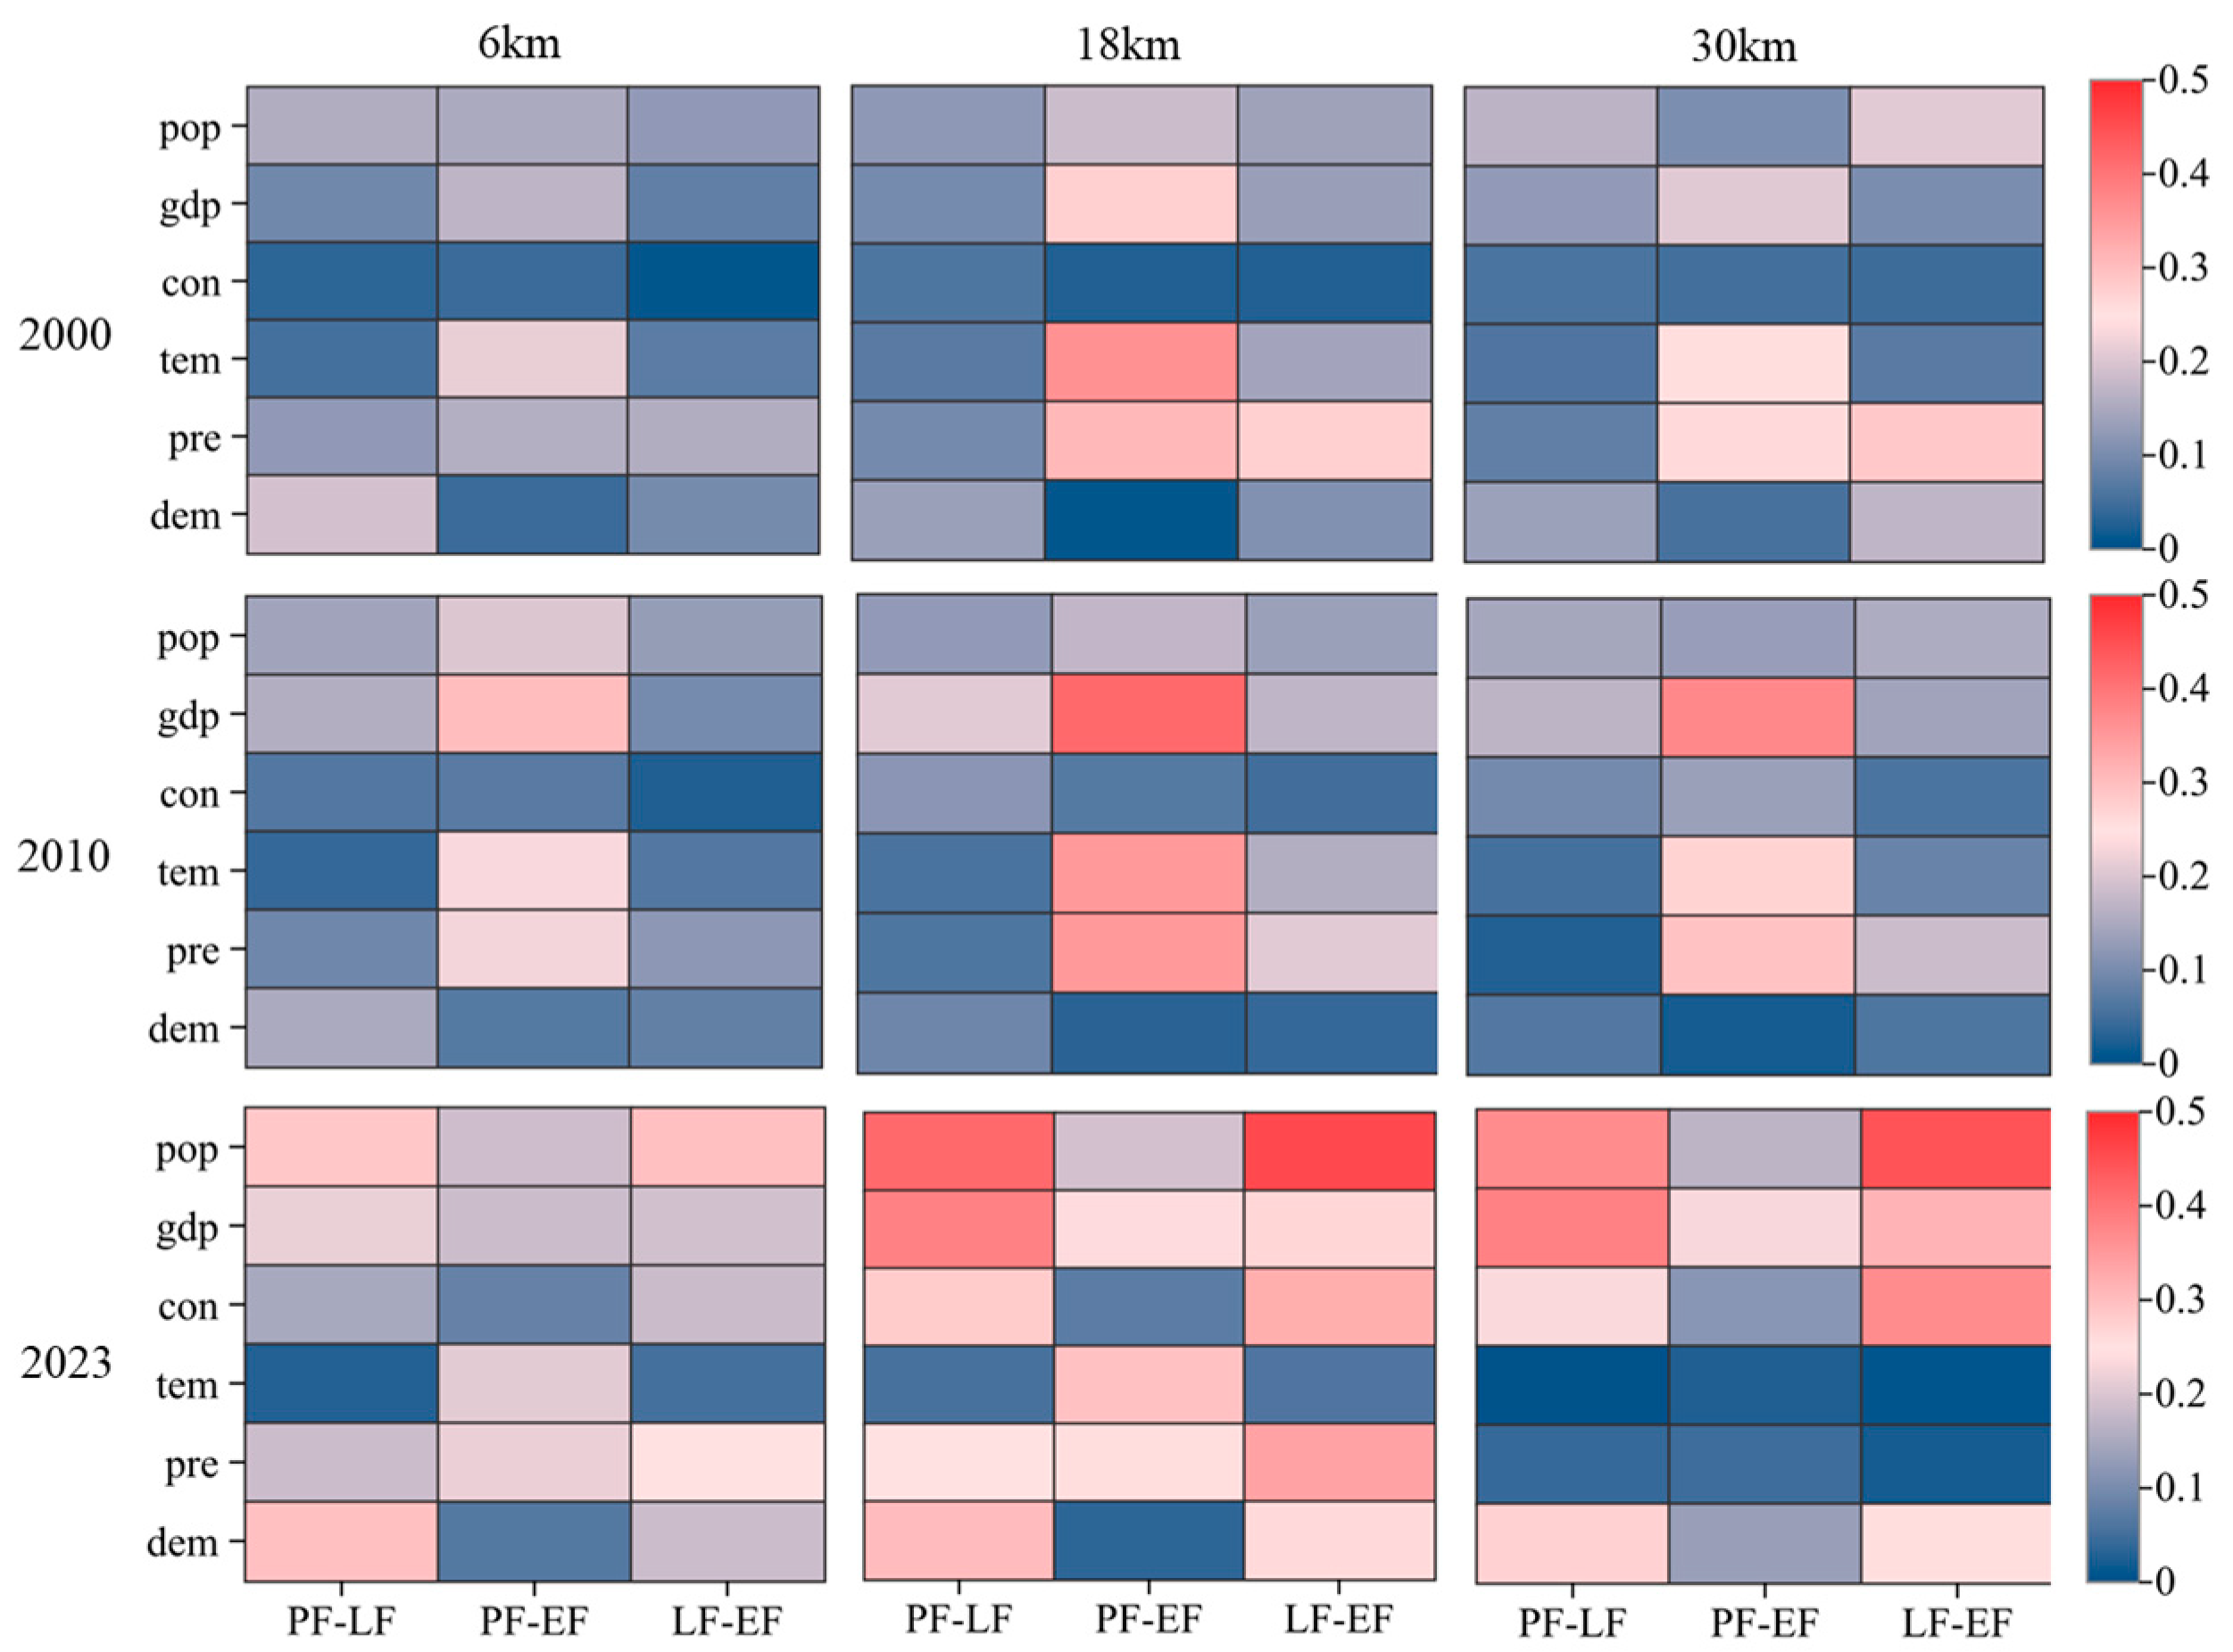
3.3. Factors Influencing the Cropland Function Trade-Off

By comparing the coefficient values of different influencing factors at different spatial scales, it is found (Figure 8) that the force of each type of factor on cropland function tradeoffs generally shows an increasing trend over time, with several socioeconomic factors gradually exerting a significant influence. Specifically, in the year 2000, the influence of natural elements is more pronounced. Temperature and precipitation factors contributed more to the PF-EF at the 18 and 30 km scales. The LF-EF is more significantly influenced by precipitation. In 2010, the PF-EF is found to be significantly impacted by a variety of factors, particularly at the 18 km scale. Among socioeconomic factors, GDP emerges as a more pronounced element, exhibiting a significant positive correlation (r = 0.417). Additionally, temperature and precipitation remain prominent factors influencing the PF-EF. This dominance is particularly evident at the 18 km scale, where both temperature and precipitation exhibit strong coefficients of effect at 0.352. In 2023, the influence of socioeconomic factors undergoes further amplification, with the population factor assuming a pivotal role in the PF-LF and LF-EF across all spatial scales. Concurrently, the GDP and built-up land factors demonstrate a notable impact, particularly within the 18 km and 30 km range.

4. Discussion

4.1. Characterization of the Cropland Function Trade-Off

Previous studies have shown that the expansion of urban construction land and high-intensity human activities can negatively affect cropland soils and biodiversity, and exacerbate function trade-offs [46]. In the YRD, a highly urbanized region with a rich variety of levels and types of urbanization, the intensity of the trade-offs between cropland functions has gradually weakened, and the rate of decline in trade-offs has increased as urbanization has shifted from a “scale-expansion-oriented” to a “high-quality development transition” [47]. This shift can be attributed to the positive impacts of urbanization, including the enhancement of agricultural technology and financial resources, as well as the implementation of policies aimed at safeguarding cropland [48]. Regarding the turning point of the function trade-off of cropland in the YRD, it disappears from 2000 to 2010 and reappears in 2023. The difference from the year 2000 is the narrowing of the range of inflection points in small and medium-sized cities and large cities, which shift toward the central region. The transition zone between urban and rural fringes of metropolitan cities demonstrates a discernible outward expansion. This phenomenon indicates that the allocation of cropland among different urban typologies within the YRD has become increasingly delineated, and the internal characteristics of these urban typologies have become more pronounced during the urbanization process [49].
Therefore, targeted measures for cropland management should be emphasized for different types of cities in the YRD. First, an “agriculture-friendly” spatial pattern should be constructed in urban planning. The establishment of rigid red lines for cropland protection is imperative, and cropland situated close to metropolises, such as Shanghai, Hangzhou, and Nanjing (within 60 km from the city center), should be incorporated into urban agriculture protection zones. This approach can serve to impede development encroachment, thereby fostering a high degree of synergy in the diversification of cropland functions. Second, in the domains of land planning and management, as well as agricultural policies, the implementation of diversified measures is required for urban cropland at different levels of urbanization and development. Mixed-use land use should be optimized, such as in small and medium-sized cities in hilly areas of western Zhejiang and Anhui, where cropland is highly fragmented. In these areas, it is necessary to strengthen the use of low trade-off zones of cropland (e.g., 30–36 km from urban centers), and give full play to the value of their ecological products through the “advantageous zone for characteristic agricultural products” and the “rural agricultural tourism demonstration zone”, etc., to bring out the value of the surrounding cropland and to promote synergies of functions. In the northern YRD, characterized by its predominance of large cities and significant grain production, the potential exists for the enhancement of both the concentration of arable land and the degree of mechanization through initiatives such as land consolidation and reclamation. Concurrent with this process, there is an opportunity to expand the low-value cropland zone by 30–36 m, thereby ensuring that the quantity of cropland remains stable and the quality is improved throughout urban development, thus contributing to ecological process stabilization. By challenging the conventional single-control paradigm, the multifaceted objective of safeguarding food security, enhancing ecological service functions, and mitigating the urban–rural income disparity will be actualized for cropland in the YRD.

4.2. Mechanisms Affecting the Cropland Function Trade-Offs

The mechanisms by which different variables affect the trade-offs among various cropland functions vary [50]. The strength of the trade-offs between cropland functions and the importance of the driving factors changes with spatial scales. Rapid urbanization has caused the urban and rural geographic space to undergo a rapid transformation process, which has also caused changes in cropland functions [51].
In 2000, climatic factors such as temperature and precipitation are important factors influencing the spatial variability of the strength of the PF-EF trade-off, which is consistent with the conclusions obtained by other scholars in different research areas [3]. Suitable temperature and precipitation are the basis for regional agricultural development and provide good natural background conditions for agricultural production, resulting in a high PF, while irrational agricultural practices tend to cause damage to the agricultural environment, resulting in a high trade-off between the PF and EF. With the development of urbanization, the high-density agglomeration of population and industry gradually occupies more cropland space, and the crop reduction by economic urbanization becomes another important driving force leading to the PF-EF trade-off of cropland [52,53]. Meanwhile, socioeconomic factors begin to become key factors in the cropland function trade-off. In 2023, the effect of socioeconomic indicators such as population, GDP, and built-up area is significant, especially for the PF-LF and LF-EF relationships, and population urbanization, economic urbanization, and spatial urbanization all have important effects on cropland function trade-offs.
On the other hand, the influencing factors on the cropland function trade-off intensities increased and then decreased with the expansion of spatial scales. The highest degree of explanation of the factors is found at the 18 km scale, and the driving factors show higher sensitivity to cropland function trade-offs. At the 30 km scale, the negative impacts of the factors on cropland functions decrease, which can be attributed to the greater resilience of larger cropland ecosystems, allowing for them to mitigate the negative impacts caused by local weather extremes, hilly topography, and urbanization. Therefore, management at different scales is a viable way to promote synergies in cropland functions. According to the results of the study, in 2023, for example, the socioeconomic factors have the greatest impact on the PF-LF and LF-EF trade-offs at the 30 km scale (the largest scale), and it is necessary to play an active role in urbanization at a larger scale to promote joint gains in the PF and EF while ensuring the sustainable development of the cropland LF. This scale also corresponds to the inflection intervals of the trade-off intensity change curves for small and medium-sized cities and large cities in the YRD. At the medium-range scale of 18 km, natural conditions play a prominent role in functional trade-offs. To minimize the trade-offs of cropland functions, initiatives such as topographic and geomorphic reshaping and local climate improvement should be implemented at this scale. The 6 km scale, which reflects the most detail of cropland functional trade-offs, is the key scale for implementing precision management measures and should be optimized for small-scale specificities.

4.3. Limitations and Future Directions

The YRD, a prototypical highly urbanized area, exhibits notable variations in the spatial and temporal characteristics of cropland utilization changes and their trade-offs. The ecological civilization construction, rural revitalization strategy, and geographic system coupling form a composite relationship. Consequently, in-depth investigation of the above key issues will help to clarify the process mechanism of the transformation of the study area’s cropland utilization, and also provide a theoretical basis and practical analysis for the scientific management of farmland in highly urbanized areas. However, it still has some limitations. First, some ecosystem services are measured only by remote sensing data, which inevitably causes certain errors in the measurement of cropland functions due to the limitations of remote sensing image resolution and quality. Secondly, the present study utilizes a methodological approach that quantifies the trade-off relationships between pairs of cropland functions, thereby elucidating their interactive characteristics. However, the direct and simultaneous characterization of the three functional trade-offs remains an unsolved problem, and a rational integrated model is needed to measure the trade-offs among cropland functions in the future. The multifunctionality of cropland in highly urbanized areas engenders a multitude of economic, social, resource, and environmental effects. Variations in the stage and degree of regional economic development have resulted in divergent degrees of importance attributed to the functions of cropland in different types of cities. Given the multifaceted nature of these transformations, it is imperative to address the ecological and environmental ramifications, the interplay between economic and social development, and the spillover effects that result from the transformation of different types of cropland functions, so as to help the sustainable development of agriculture in highly urbanized areas through cropland risk assessment, prevention, and control.

5. Conclusions

Taking the YRD as an example, this study traced the spatial and temporal changes in the trade-offs of cropland functions from 2000 to 2023, analyzed the characteristics of the scaled response of cropland in the process of urbanization, and identified the main driving factors affecting the trade-off relationships. The results showed the following: (1) As the level of urbanization rises, the cropland function in the YRD is no longer limited to “solving the problem of food and clothing”, but is moving towards meeting the multiple needs of the people, such as material and cultural needs. The trade-offs between cropland functions are weakened, the decline rate from 2010 to 2023 is significantly higher than that from 2000 to 2010, and the characteristics of cropland in different types of cities are revealed. (2) There is generally no significant inflection point in 2010, and the strength of the trade-offs between cropland functions in 2000 and 2023 generally shows a “U”-shaped distribution that decreases and then increases with distance from the downtown location. The turning points of the cropland function trade-offs at different levels of urbanization diverged, with the turning points of small and medium-sized cities and large cities shrinking toward the center (from 42–48 km in 2000 to 30–36 km in 2023), and metropolises showing a clear trend of outward expansion (from 42 km in 2000 to 60 km in 2023). (3) The forces of various factors on the intensity of cropland function trade-offs generally show an increasing trend over time, in which several socioeconomic factors have gradually had a significant impact, and 30 km is an important scale for the role of socioeconomic factors. These findings provide important guidance for cropland ecosystem management and the promotion of the sustainable development of cropland in urbanized areas.

Author Contributions

J.T.: writing—original draft, methodology, and investigation; J.Z.: funding acquisition, supervision, and writing—review and editing; P.D.: formal analysis, visualization, and resources; Y.L.: supervision and writing—review and editing; X.M.: data curation, software; and validation; Z.Z.: project administration and investigation; Y.D.: writing—original draft, resources, and visualization; P.W.: methodology and writing—review and editing. All authors have read and agreed to the published version of the manuscript.

Funding

This research was funded by the National Natural Science Foundation of China (42271251) for Jinhe Zhang.

Data Availability Statement

No new data were created or analyzed in this study.

Conflicts of Interest

The authors declare no conflicts of interest.

Appendix A

Table A1. Annual urbanization and annual growth rates of YRD from 2000 to 2023.
DistrictUrbanization Rate in 2000Urbanization Rate in 2010Urbanization Rate in 2023Average Annual Growth Rate (2000–2010)Average Annual Growth Rate (2010–2023)
YRD/59.58%72.80%/0.97%
Shanghai88.3%88.86%89.33%0.05%0.03%
Fuyang, Anhui20.70%31.90%45.16%1.01%0.95%
Northern Jiangsu31.79%51.50%66.34%1.79%1.06%
Southern Jiangsu59.62%70.30%83.11%0.97%0.92%
Lishui, Zhejiang33.10%48.40%64.60%1.39%1.16%
Note: the Appendix provides annual urbanization data and annual growth rates for the regions mentioned in the text.

Appendix B

Table A2. Influencing factors of the cropland functional trade-off intensity at different scales.
Variable6 km18 km30 km
PF-LFPF-EFLF-EFPF-LFPF-EFLF-EFPF-LFPF-EFLF-EF
2000pop0.1560.1510.1230.1210.1830.1370.1660.1030.207
gdp0.0920.1690.0770.0970.2760.1310.1240.2060.101
con0.0340.0430.0090.0610.0240.0250.0570.050.045
tem0.0510.2150.0710.0690.3620.1420.060.2550.069
pre0.1230.1590.1560.0950.3090.2770.0770.2610.286
dem0.1920.0430.0980.1320.0090.1080.1350.0530.171
2010pop0.1390.2010.1290.1240.1730.1320.1440.130.153
gdp0.1570.3010.0970.2070.4170.1710.1680.3750.139
con0.0640.0690.0230.1160.0680.0480.0950.1330.058
tem0.0380.2330.0640.0560.3520.1570.0510.2710.084
pre0.0910.2270.1190.0610.3520.2070.0250.2950.183
dem0.1510.0680.0780.0890.030.0390.0640.0180.061
2023pop0.2870.1860.2990.4160.1920.4580.3690.1670.446
gdp0.2160.1840.190.3850.2370.2670.3850.2310.316
con0.1470.0810.1810.2820.0710.3240.2340.1150.369
tem0.0270.2090.0510.0530.2960.060.0020.0230.007
pre0.1840.2170.2490.2520.2550.3390.0410.0460.018
dem0.2970.0650.1830.3040.0340.2610.2730.1310.255

References

  1. Ouyang, X.; Xu, J.; Li, J.; Wei, X.; Li, Y. Land space optimization of urban-agriculture-ecological functions in the Changsha-Zhuzhou-Xiangtan urban agglomeration, China. Land Use Policy 2022, 117, 106112. [Google Scholar]
  2. Liu, Y.; Zhang, X.; Pan, X.; Ma, X.; Tang, M. The spatial integration and coordinated industrial development of urban agglomerations in the Yangtze River Economic Belt, China. Cities 2020, 104, 102801. [Google Scholar]
  3. Zhang, X.; Brandt, M.; Tong, X.; Ciais, P.; Yue, Y.; Xiao, X.; Zhang, W.; Wang, K.; Fensholt, R. A large but transient carbon sink from urbanization and rural depopulation in China. Nat. Sustain. 2022, 5, 321–328. [Google Scholar]
  4. Chabert, A.; Sarthou, J. Conservation agriculture as a promising trade-off between conventional and organic agriculture in bundling ecosystem services. Agric. Ecosyst. Environ. 2020, 292, 106815. [Google Scholar] [CrossRef]
  5. Yu, M.; Yang, Y.; Chen, F.; Zhu, F.; Qu, J.; Zhang, S. Response of agricultural multifunctionality to cropland loss under rapidly urbanizing processes in Yangtze River Delta, China. Sci. Total Environ. 2019, 666, 1–11. [Google Scholar]
  6. Linghu, L.; Sun, P.; Zhang, M.; Wu, Y. Data-driven projections demonstrate non-farming use of cropland in non-major grain-producing areas: A case study of Shaanxi Province, China. Agronomy 2023, 13, 2060. [Google Scholar] [CrossRef]
  7. Jiang, L.; Wang, Z.; Zuo, Q.; Du, H. Simulating the impact of land use change on ecosystem services in agricultural production areas with multiple scenarios considering ecosystem service richness. J. Clean. Prod. 2023, 397, 136485. [Google Scholar]
  8. Wu, J. Landscape sustainability science: Ecosystem services and human well-being in changing landscapes. Landsc. Ecol. 2013, 28, 999–1023. [Google Scholar] [CrossRef]
  9. Xu, Z.; Peng, J.; Dong, J.; Liu, Y.; Liu, Q.; Lyu, D.; Qiao, R.; Zhang, Z. Spatial correlation between the changes of ecosystem service supply and demand: An ecological zoning approach. Landsc. Urban Plan. 2022, 217, 104258. [Google Scholar] [CrossRef]
  10. Galic, N.; Salice, C.J.; Birnir, B.; Bruins, R.J.; Ducrot, V.; Jager, H.I.; Kanarek, A.; Pastorok, R.; Rebarber, R.; Thorbek, P.; et al. Predicting impacts of chemicals from organisms to ecosystem service delivery: A case study of insecticide impacts on a freshwater lake. Sci. Total Environ. 2019, 682, 426–436. [Google Scholar] [CrossRef]
  11. Pang, X.; Zhang, L.; Li, S.; Lu, R.; Liu, S. Spatial-temporal change and synergy/trade-off relationship of “production–living–ecological” space along the Sino-Vietnamese border. Agronomy 2022, 12, 2862. [Google Scholar] [CrossRef]
  12. Huang, Y.; Wu, J. Spatial and temporal driving mechanisms of ecosystem service trade-off/synergy in national key urban agglomerations: A case study of the Yangtze River Delta urban agglomeration in China. Ecol. Indic. 2023, 154, 110800. [Google Scholar] [CrossRef]
  13. Xu, X.; Yang, G.; Tan, Y.; Liu, J.; Hu, H. Ecosystem services trade-offs and determinants in China’s Yangtze River Economic Belt from 2000 to 2015. Sci. Total Environ. 2018, 634, 1601–1614. [Google Scholar] [CrossRef] [PubMed]
  14. Accatino, F.; Tonda, A.; Dross, C.; Léger, F.; Tichit, M. Trade-offs and synergies between livestock production and other ecosystem services. Agric. Syst. 2019, 168, 58–72. [Google Scholar]
  15. Wardropper, C.B.; Mase, A.S.; Qiu, J.; Kohl, P.; Booth, E.G.; Rissman, A.R. Ecological worldview, agricultural or natural resource-based activities, and geography affect perceived importance of ecosystem services. Landsc. Urban Plan. 2020, 197, 103768. [Google Scholar]
  16. Bao, J.; Mao, L.; Liu, Y.; Fan, S. Investigation of spatiotemporal changes and impact factors of trade-off intensity in cultivated land multifunctionality in the Min River basin. Agriculture 2024, 14, 1666. [Google Scholar] [CrossRef]
  17. Liu, Y.; Wan, C.; Xu, G.; Chen, L.; Yang, C. Exploring the relationship and influencing factors of cultivated land multifunction in China from the perspective of trade-off/synergy. Ecol. Indic. 2023, 149, 110171. [Google Scholar] [CrossRef]
  18. Hou, D.; Meng, F.; Prishchepov, A.V. How is urbanization shaping agricultural land-use? Unraveling the nexus between cropland abandonment and urbanization in China. Landsc. Urban Plan. 2021, 214, 104170. [Google Scholar] [CrossRef]
  19. Huang, Z.; Du, X.; Castillo, C.S.Z. How does urbanization affect cropland protection? Evidence from China. Resour. Conserv. Recycl. 2019, 145, 139–147. [Google Scholar] [CrossRef]
  20. Liu, Y.; Zhang, C.; Zeng, H. Constraint effects among several key ecosystem service types and their influencing factors: A case study of the Pearl River Delta, China. Ecol. Indic. 2023, 146, 109883. [Google Scholar] [CrossRef]
  21. Xu, Z.; Hu, Y.; Zhen, L.; Zhuang, D. Wavelet-based multi-scale analysis of NDVI and background factors in Zhejiang Province. Geogr. Res. 2015, 34, 567–577. [Google Scholar]
  22. Shui, H.; Yu, J.; Zhao, C.; Fang, L.; Cao, Y.; Huang, Z. Evolution characteristics of urban hierarchical scale structure since the expansion of the Yantze River Delta urban agglomeration. J. Anhui Norm. Univ. (Nat. Sci.) 2023, 46, 366–374. [Google Scholar]
  23. Bartolini, F.; Vergamini, D. Trade-offs and synergies between ecosystem services provided by different rural landscape. Agronomy 2023, 13, 977. [Google Scholar] [CrossRef]
  24. La Notte, A.; D’amato, D.; Mäkinen, H.; Paracchini, M.L.; Liquete, C.; Egoh, B.; Geneletti, D.; Crossman, N.D. Ecosystem services classification: A systems ecology perspective of the cascade framework. Ecol. Indic. 2017, 74, 392–402. [Google Scholar] [CrossRef]
  25. Tamburini, G.; Bommarco, R.; Wanger, T.C.; Kremen, C.; van der Heijden, M.G.A.; Liebman, M.; Hallin, S. Agricultural diversification promotes multiple ecosystem services without compromising yield. Sci. Adv. 2020, 6, eaba1715. [Google Scholar] [CrossRef]
  26. Maes, J.; Barbosa, A.; Baranzelli, C.; Zulian, G.; e Silva, F.B.; Vandecasteele, I.; Hiederer, R.; Liquete, C.; Paracchini, M.L.; Mubareka, S.; et al. More green infrastructure is required to maintain ecosystem services under current trends in land-use change in Europe. Landsc. Ecol. 2015, 30, 517–534. [Google Scholar] [CrossRef]
  27. Sharp, R.; Tallis, H.T.; Ricketts, T.; Guerry, A.D.; Wood, S.A.; Chaplin-Kramer, R.; Nelson, E.; Ennaanay, D.; Wolny, S.; Olwero, N. InVEST User’s Guide; The Natural Capital Project: Stanford, CA, USA, 2014. [Google Scholar]
  28. Zhang, J.; Lyu, Y.; Li, Y.; Geng, Y. Digital economy: An innovation driving factor for low-carbon development. Environ. Impact Assess. Rev. 2022, 96, 106821. [Google Scholar] [CrossRef]
  29. Lyu, Y.; Wang, W.; Wu, Y.; Zhang, J. How does digital economy affect green total factor productivity? Evidence from China. Sci. Total Environ. 2023, 857, 159428. [Google Scholar] [CrossRef]
  30. Wischmeier, W.H.; Smith, D.D. Predicting Rainfall Erosion Losses: A Guide to Conservation Planning; Department of Agriculture, Science and Education Administration: Beltsville, MD, USA, 1978. [Google Scholar]
  31. Ren, Z.; Zhang, Y.; Li, J. The value of vegetation ecosystem services: A case of Qinling-Daba mountains. J. Geogr. Sci. 2003, 13, 195–200. [Google Scholar]
  32. Forouzangohar, M.; Crossman, N.D.; Macewan, R.J.; Wallace, D.D.; Bennett, L.T. Ecosystem services in agricultural landscapes: A spatially explicit approach to support sustainable soil management. Sci. World J. 2014, 2014, 483298. [Google Scholar]
  33. Qiao, J.; Deng, L.; Liu, H.; Wang, Z. Spatiotemporal heterogeneity in ecosystem service trade-offs and their drivers in The Huang-Huai-Hai plain, China. Landsc. Ecol. 2024, 39, 42. [Google Scholar] [CrossRef]
  34. Zhong, L.; Wang, J.; Zhang, X.; Ying, L. Effects of agricultural land consolidation on ecosystem services: Trade-offs synergies. J. Clean. Prod. 2020, 264, 121412. [Google Scholar] [CrossRef]
  35. Popiński, W.; Kosek, W. Wavelet transform and its application for short period earth rotation analysis. Artif. Satell. 1994, 29, 75–86. [Google Scholar]
  36. Dong, J.; Peng, J.; Liu, Y.; Qiu, S.; Han, Y. Integrating spatial continuous wavelet transform and kernel density estimation to identify ecological corridors in megacities. Landsc. Urban Plan. 2020, 199, 103815. [Google Scholar] [CrossRef]
  37. Qiu, J.; Turner, M.G. Spatial interactions among ecosystem services in an urbanizing agricultural watershed. Proc. Natl. Acad. Sci. USA 2013, 110, 12149–12154. [Google Scholar] [CrossRef] [PubMed]
  38. Zou, R.; Peng, Y.; Yang, H.; Hu, Y.; Liu, L.; Mao, X. Multifunctional Evaluation and Analysis of Synergistic Relationships: A Cognitive Framework for the Sustainable Use of Cropland in China. Agronomy 2024, 14, 284. [Google Scholar] [CrossRef]
  39. Liu, Q.; Qiao, J.; Li, M.; Huang, M. Spatiotemporal heterogeneity of ecosystem service interactions and their drivers at different spatial scales in the Yellow River basin. Sci. Total Environ. 2024, 908, 168486. [Google Scholar] [CrossRef]
  40. Cumming, G.S.; Buerkert, A.; Hoffmann, E.M.; Schlecht, E.; von Cramon-Taubadel, S.; Tscharntke, T. Implications of agricultural transitions and urbanization for ecosystem services. Nature 2014, 515, 50–57. [Google Scholar] [CrossRef]
  41. Deng, X.; Huang, J.; Rozelle, S.; Zhang, J.; Li, Z. Impact of urbanization on cultivated land changes in China. Land Use Policy 2015, 45, 1–7. [Google Scholar] [CrossRef]
  42. Pérez-Soba, M.; Petit, S.; Jones, L.; Bertrand, N.; Briquel, V.; Omodei-Zorini, L.; Contini, C.; Helming, K.; Farrington, J.H.; Mossello, M.T.; et al. Land use functions—A multifunctionality approach to assess the impact of land use changes on land use sustainability. In Sustainability Impact Assessment of Land Use Changes; Springer: Berlin/Heidelberg, Germany, 2008; pp. 375–404. [Google Scholar]
  43. Jiang, G.; Wang, M.; Qu, Y.; Zhou, D.; Ma, W. Towards cultivated land multifunction assessment in China: Applying the “influencing factors-functions-products-demands” integrated framework. Land Use Policy 2020, 99, 104982. [Google Scholar] [CrossRef]
  44. Barthel, S.; Isendahl, C.; Vis, B.N.; Drescher, A.; Evans, D.L.; van Timmeren, A. Global urbanization and food production in direct competition for land: Leverage places to mitigate impacts on SDG2 and on the earth system. Anthr. Rev. 2019, 6, 71–97. [Google Scholar] [CrossRef]
  45. Wang, S.; Hu, M.; Wang, Y.; Xia, B. Dynamics of ecosystem services in response to urbanization across temporal and spatial scales in a mega metropolitan area. Sustain. Cities Soc. 2022, 77, 103561. [Google Scholar] [CrossRef]
  46. Wang, M.; Yuan, M.; Han, P.; Wang, D. Assessing sustainable urban development based on functional spatial differentiation of urban agriculture in Wuhan, China. Land Use Policy 2022, 115, 105999. [Google Scholar]
  47. Zhu, C.; Zhang, X.; Wang, K.; Yuan, S.; Yang, L.; Skitmore, M. Urban–rural construction land transition and its coupling relationship with population flow in China’s urban agglomeration region. Cities 2020, 101, 102701. [Google Scholar] [CrossRef]
  48. Wang, J.; Zhou, W.; Pickett, S.T.A.; Yu, W.; Li, W. A multiscale analysis of urbanization effects on ecosystem services supply in an urban megaregion. Sci. Total Environ. 2019, 662, 824–833. [Google Scholar] [CrossRef]
  49. Shen, W.; Hu, Q.; Zhang, Z. Impacts of in situ urbanisation on grain production: Evidence from the Yangtze River Delta, China. Habitat Int. 2024, 143, 102989. [Google Scholar] [CrossRef]
  50. Liu, C.; Cheng, L.; Li, J.; Lu, X.; Xu, Y.; Yang, Q. Trade-offs analysis of land use functions in a hilly-mountainous city of northwest Hubei Province: The interactive effects of urbanization and ecological construction. Habitat Int. 2023, 131, 102705. [Google Scholar] [CrossRef]
  51. Wu, Y.; Tao, Y.; Yang, G.; Ou, W.; Pueppke, S.; Sun, X.; Chen, G.; Tao, Q. Impact of land use change on multiple ecosystem services in the rapidly urbanizing Kunshan city of China: Past trajectories and future projections. Land Use Policy 2019, 85, 419–427. [Google Scholar] [CrossRef]
  52. Li, H.; Hu, Y.; Li, H.; Ren, J.; Shao, R.; Liu, Z. Assessing the impact of spatiotemporal evolution of urbanization on carbon storage in the mega-urban agglomeration area: Case study of Yangtze River Delta urban agglomeration, China. Sustainability 2023, 15, 14548. [Google Scholar] [CrossRef]
  53. Halperin, S.; Castro, A.J.; Quintas-Soriano, C.; Brandt, J.S. Assessing high quality agricultural lands through the ecosystem services lens: Insights from a rapidly urbanizing agricultural region in the western united states. Agric. Ecosyst. Environ. 2023, 349, 108435. [Google Scholar] [CrossRef]
Figure 1. Study area.
Agronomy 15 00894 g001
Figure 2. Flowchart of the methodology of this study. Note: yellow, light blue, dark blue, and pink correspond to the indicator data and calculation methods used for the production function (PF), water yield and soil retention in the ecological function (EF), carbon sequestration and oxygen release in the EF, and the living function (LF), respectively.
Agronomy 15 00894 g002
Figure 3. The “production–living–ecology” function transformation of cropland in highly urbanized areas. Note: the solid brown line represents PF, the solid red line represents LF, and the solid green line represents EF.
Agronomy 15 00894 g003
Figure 4. The spatial and temporal distribution of cropland functions in the Yangtze River Delta.
Agronomy 15 00894 g004
Figure 5. The spatiotemporal distribution of cropland function trade-off intensity in the Yangtze River Delta.
Agronomy 15 00894 g005
Figure 6. Wavelet variance curves of the cropland function trade-off intensity in the Yangtze River Delta.
Agronomy 15 00894 g006
Figure 7. Multi-scale change in the cropland function trade-off intensity. Note: letters in the horizontal coordinates indicate radial distances from the city centers in multiples of 6, e.g., a indicates a radius of 6 km from the city center, b indicates a radius of 12 km from the city center, and so on; the vertical coordinates indicate the cropland function trade-off intensities.
Agronomy 15 00894 g007aAgronomy 15 00894 g007b
Figure 8. Influencing factors of the cropland functional trade-off intensity at different scales.
Agronomy 15 00894 g008
Table 1. Details of the data used in this research.
Data NameSourceDescription
Land use/cover dataResources and Environment Science Data Center
http://www.resdc.cn (accessed on 1 June 2024)
Grid, 30 m × 30 m
DEM dataResources and Environment Science Data Center
http://www.resdc.cn (accessed on 1 June 2024)
Grid, 30 m × 30 m
Soil dataChinese Soil Database
http://vdb3.soil.csdb.cn/ (accessed on 1 June 2024)
Raster, 1 m × 1 km
Net primary productivity (NPP) of vegetationNational Aeronautics and Space Administration (NASA)
http://lpdaac.usgs.gov/ (accessed on 1 June 2024)
Grid, 500 m × 500 m
Normalized vegetation index (NDVI)United States Geological Survey
https://earthexplorer.usgs.gov/ (accessed on 1 June 2024)
Raster, 1 m × 1 km
Precipitation dataChina Meteorological Data Service Centre http://data.cma.cn/ (accessed on 1 June 2024)Raster, 1 m × 1 km
Evapotranspiration dataNational Tibetan Plateau Data Center
https://data.tpdc.ac.cn/ (accessed on 1 June 2024)
Raster, 1 m × 1 km
Food production dataStatistical Yearbook of Jiangsu, Zhejiang, Anhui and Shanghaiforms
Population urbanization rate dataStatistical Yearbook of Jiangsu, Zhejiang, Anhui and Shanghaiforms
Historical road traffic dataOpenStreetMapvector
Data on the spatial distribution of the populationLandScan high-resolution global population data set
https://landscan.ornl.gov/ (accessed on 1 June 2024)
Raster, 1 km × 1 km
Agriculture-related points of interest (POIs)Amap API
https://lbs.amap.com/ (accessed on 1 June 2024)
vector
Table 2. The cropland function evaluation index system.
FunctionSub-FunctionExplanationDescriptionCalculation Method
PFGrain production (GP)Ability to provide foodBased on the significant linear relationship that exists between crops and the NDVI, grain production in this study was allocated according to the ratio of raster NDVI values to total NDVI values of cropland. P F i = G P s u m × N D V I i N D V I s u m
where N D V I i refers to the NDVI of the i th grid, N D V I s u m refers to the NDVI of the i th grid, and G P s u m embodies the total grain production and NDVI, respectively.
LFCulture and recreation (CR)Ability to provide leisure and recreationReferring to Maes et al. [26], the recreation score method was used to calculate the cultural and recreational service indicators from the three dimensions of recreational opportunities, population agglomeration, and road density. L F i = A i O p p t i + P o p i + R o a d i
where L F i is the total score of the cultural and recreational services of grid i; A i is the area of grid i; and O p p t i , P o p i , and R o a d i refer to the recreational opportunity score, population agglomeration score, and the road density score, respectively.
EFWater yield (WY)Ability to maintain ecosystem stabilityThe InVEST water yield model [27] was used to calculate water conservation.According to reference [28], the fully arranged polygon graphical index method is adopted for weight assignment. This method not only realizes system integration, but also avoids the intersection problem among multiple variables [29]. The calculation formula is as follows: S i = ( U i L i ) ( X i T i ) U i + L i 2 T i X i + U i + L i T i 2 U i L i
E F i = 1 2 n ( n 1 ) i = 1 n j = 1 n S i + 1 S j + 1 , i j
where U i , L i , and T i denote the maximum, minimum, and critical values of the ith indicator, respectively, and the critical value takes the mean value; X i is the actual value of the ith indicator; S i and S j are the standardized values of the ith and jth indicators, respectively; E F i embodies the ecological function index; and n is the number of indicators, which takes the value of 3.
Soil retention (SR) Capacity for ecosystem conservationThe InVEST revised universal soil loss equation model [30] was used to calculate soil retention.
Carbon sequestration and oxygen release (CO)Ability to regulate ecosystemCO is represented by the combined value of carbon sequestration and oxygen release, which is based on an alternative market price approach [31].
Table 3. Indicator set of potential influencing factors.
TypeInfluencing FactorRepresented MeaningCodingUnit (of Measure)
Socioeconomic factorsPopulation densityPopulation urbanizationpopperson/km2
Per capita GDPEconomic urbanizationgdp104 • RMB/km2
Percentage of built-up landSpatial urbanizationcon%
Natural resource conditionsAverage annual temperatureThermal conditiontem°C
Annual precipitationMoisture acquisitionpremm
ElevationTopographydemm
Disclaimer/Publisher’s Note: The statements, opinions and data contained in all publications are solely those of the individual author(s) and contributor(s) and not of MDPI and/or the editor(s). MDPI and/or the editor(s) disclaim responsibility for any injury to people or property resulting from any ideas, methods, instructions or products referred to in the content.

