

A Rice-Mapping Method with Integrated Automatic Generation of Training Samples and Random Forest Classification Using Google Earth Engine

Abstract
1. Introduction
2. Study Area and Data
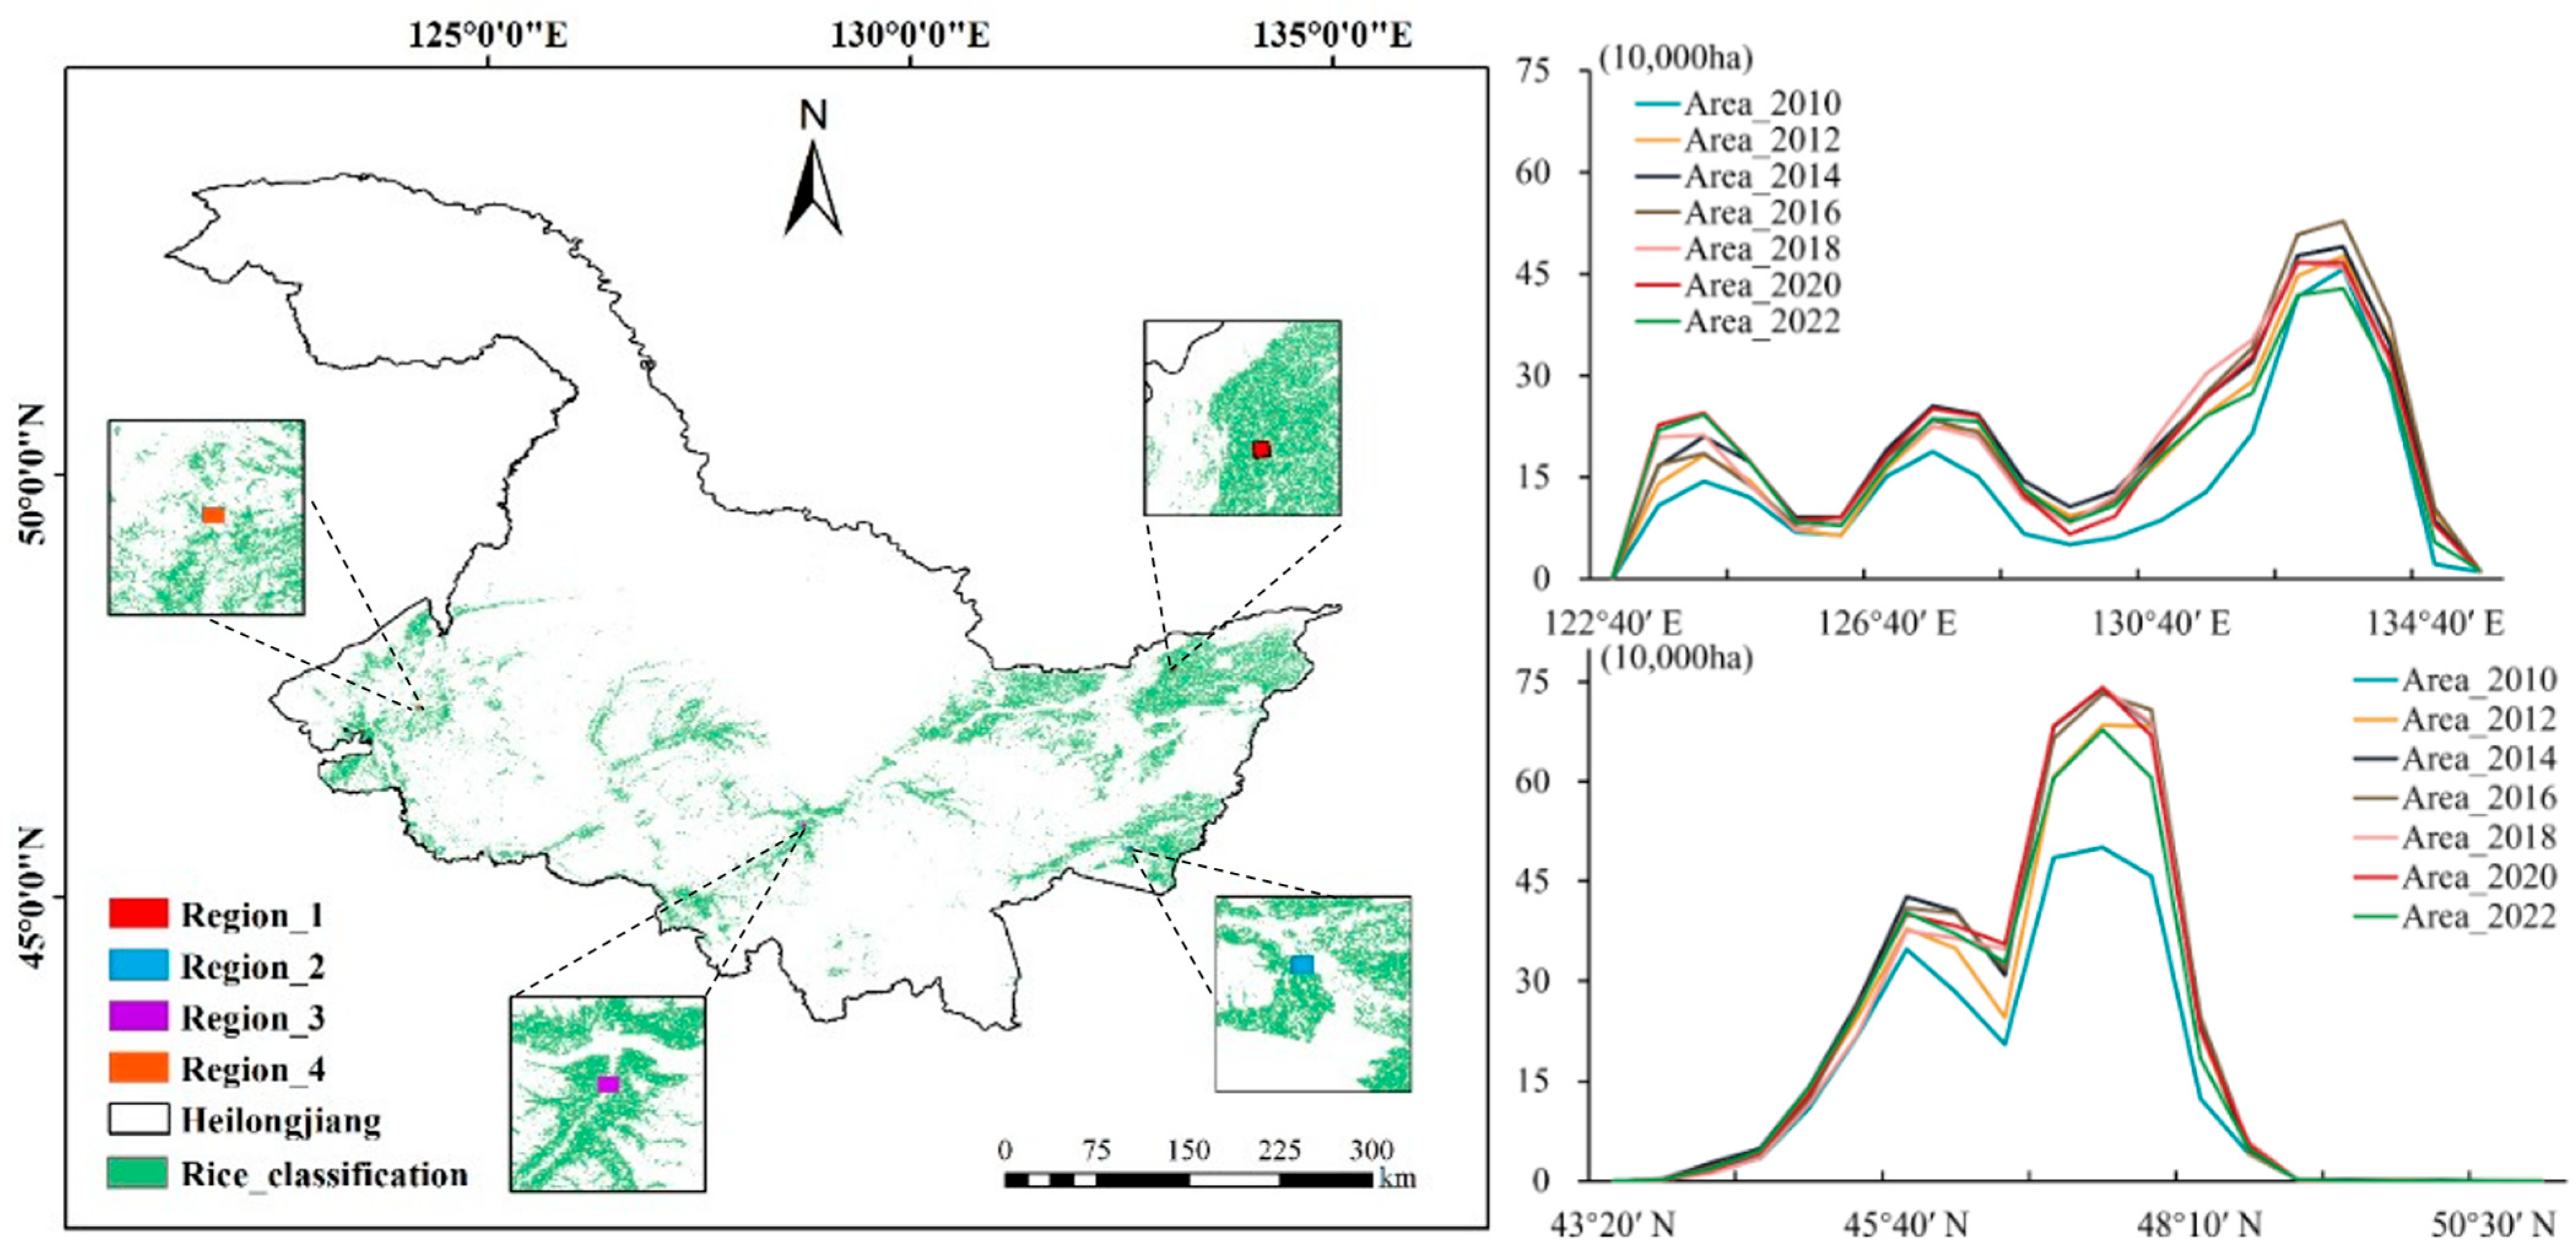
2.1. Study Area
2.2. Data
2.2.1. Landsat Data
2.2.2. Categorized Data on Agricultural Land Use
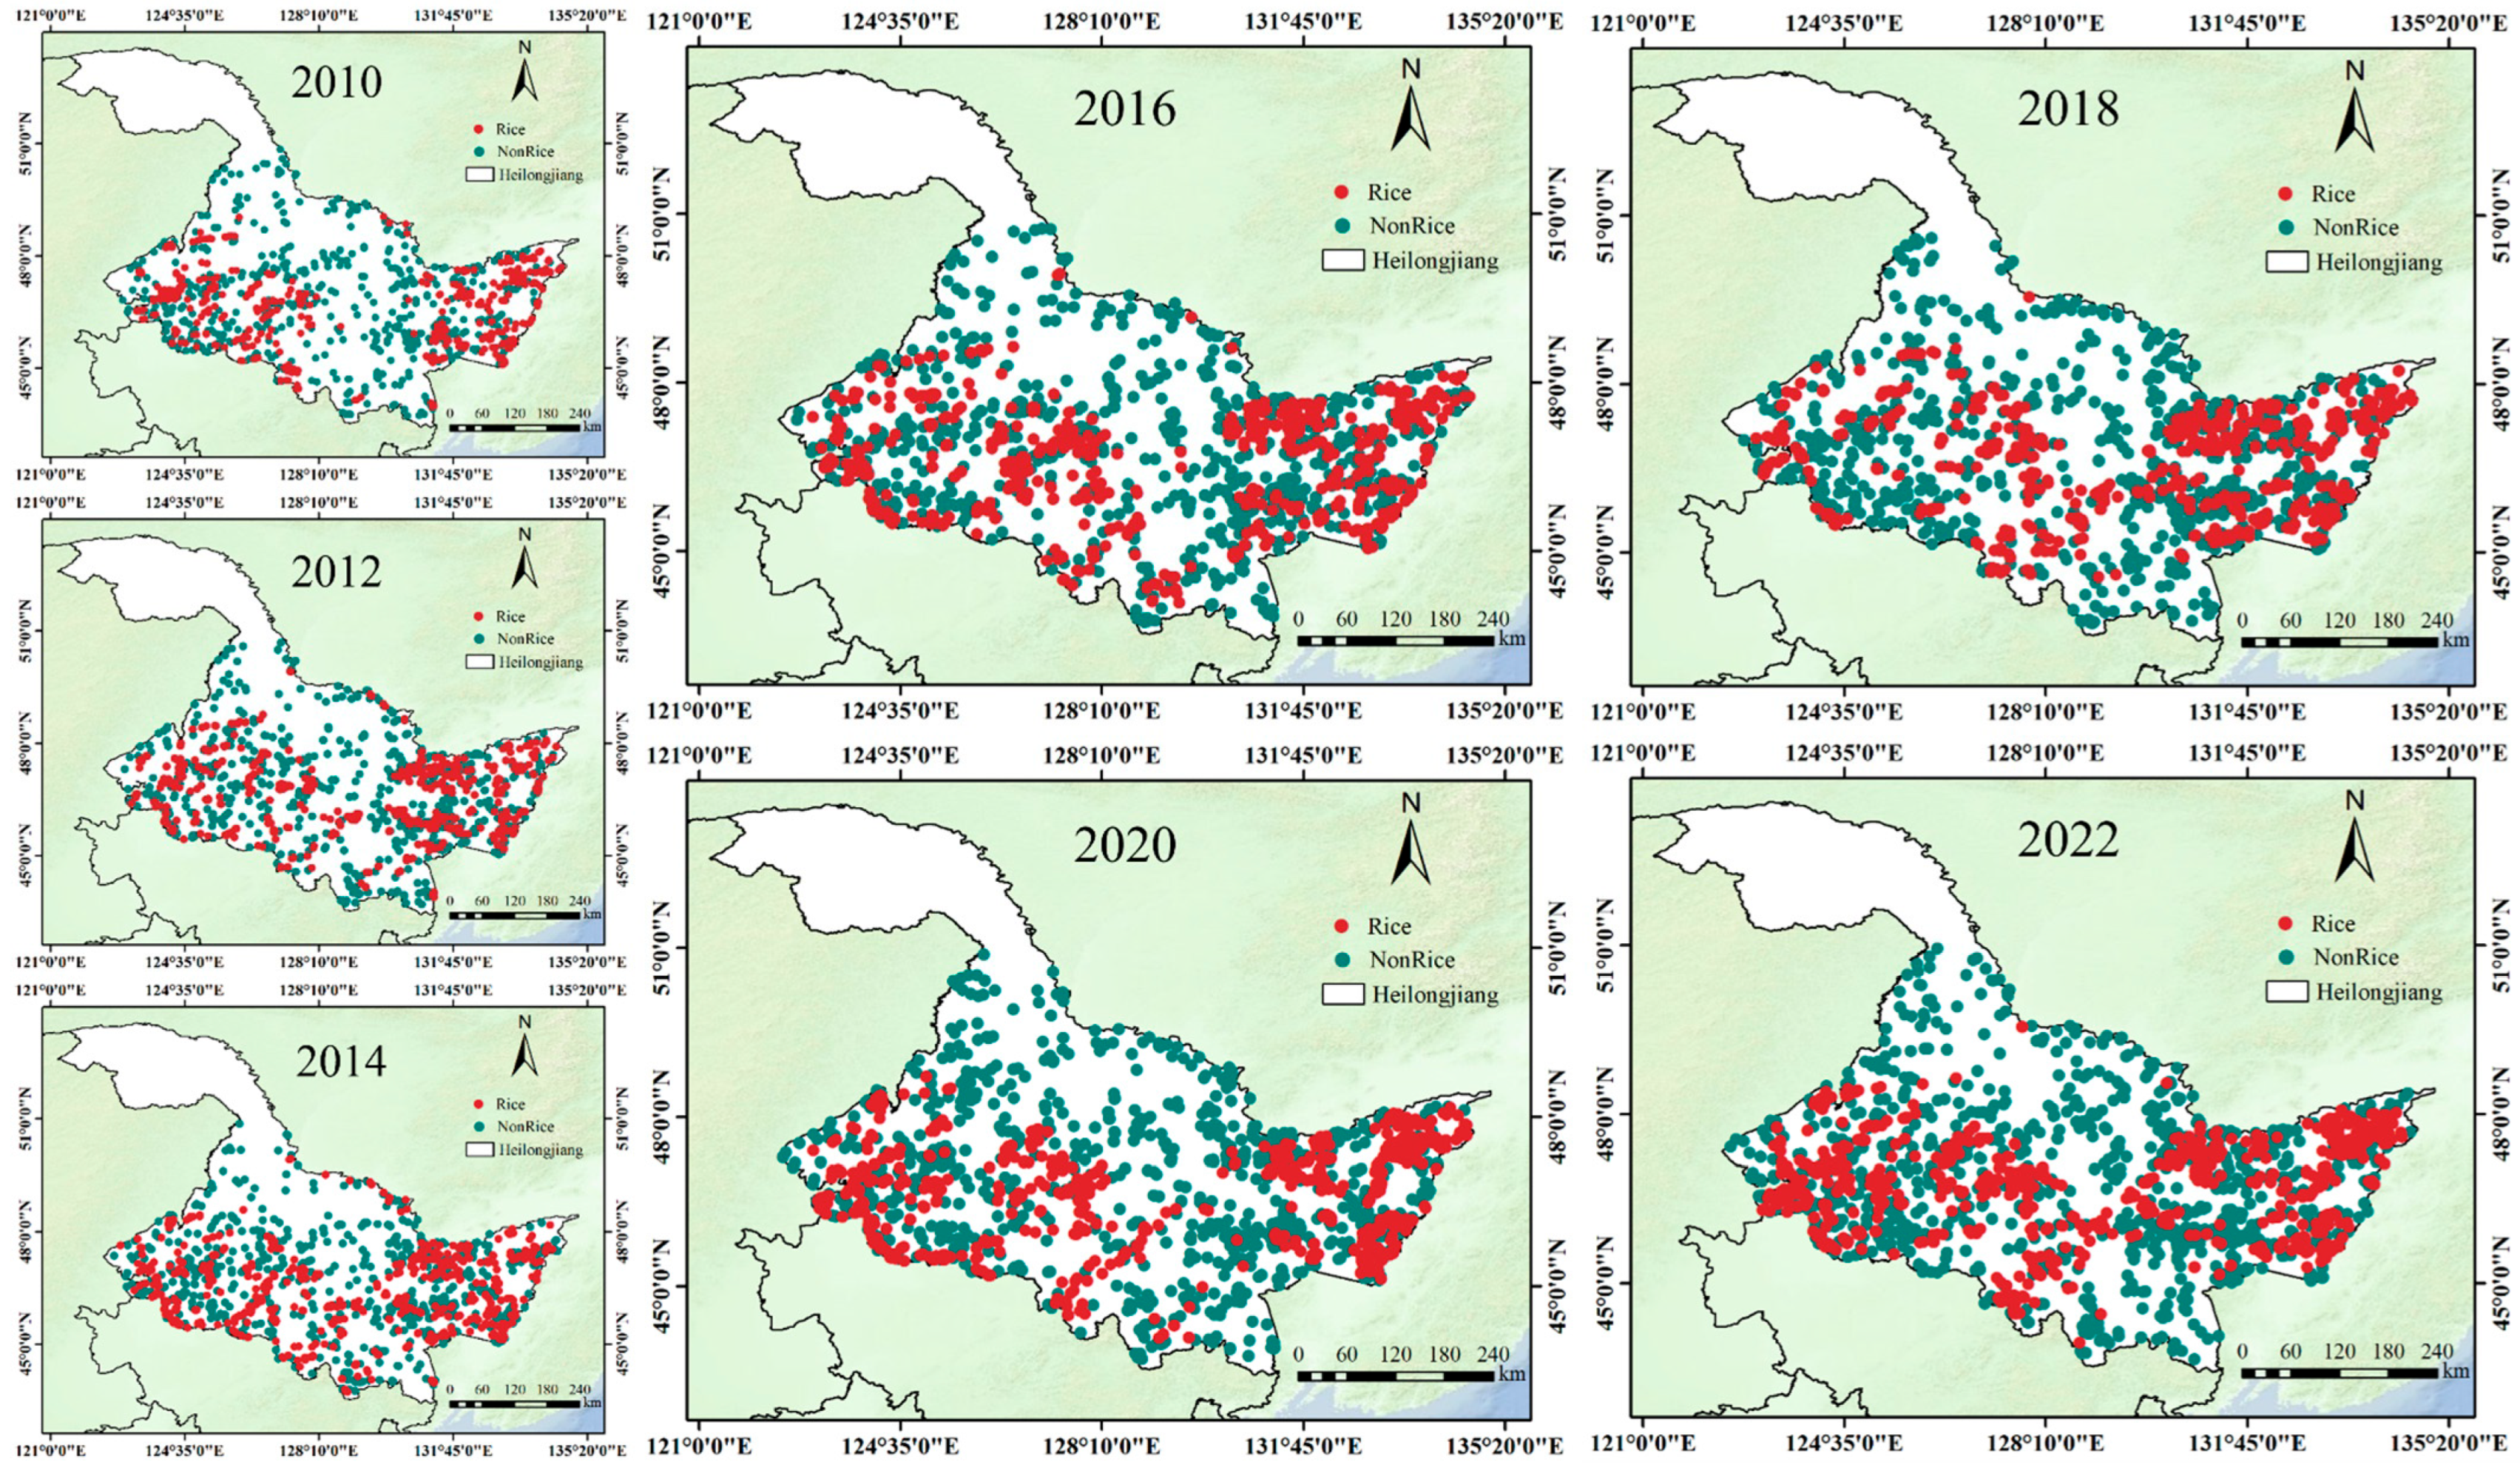
2.2.3. Automatically Generated Ground Sample Data
2.2.4. Agricultural Statistics
2.2.5. Existing Rice Mapping Products
3. Research Methodology
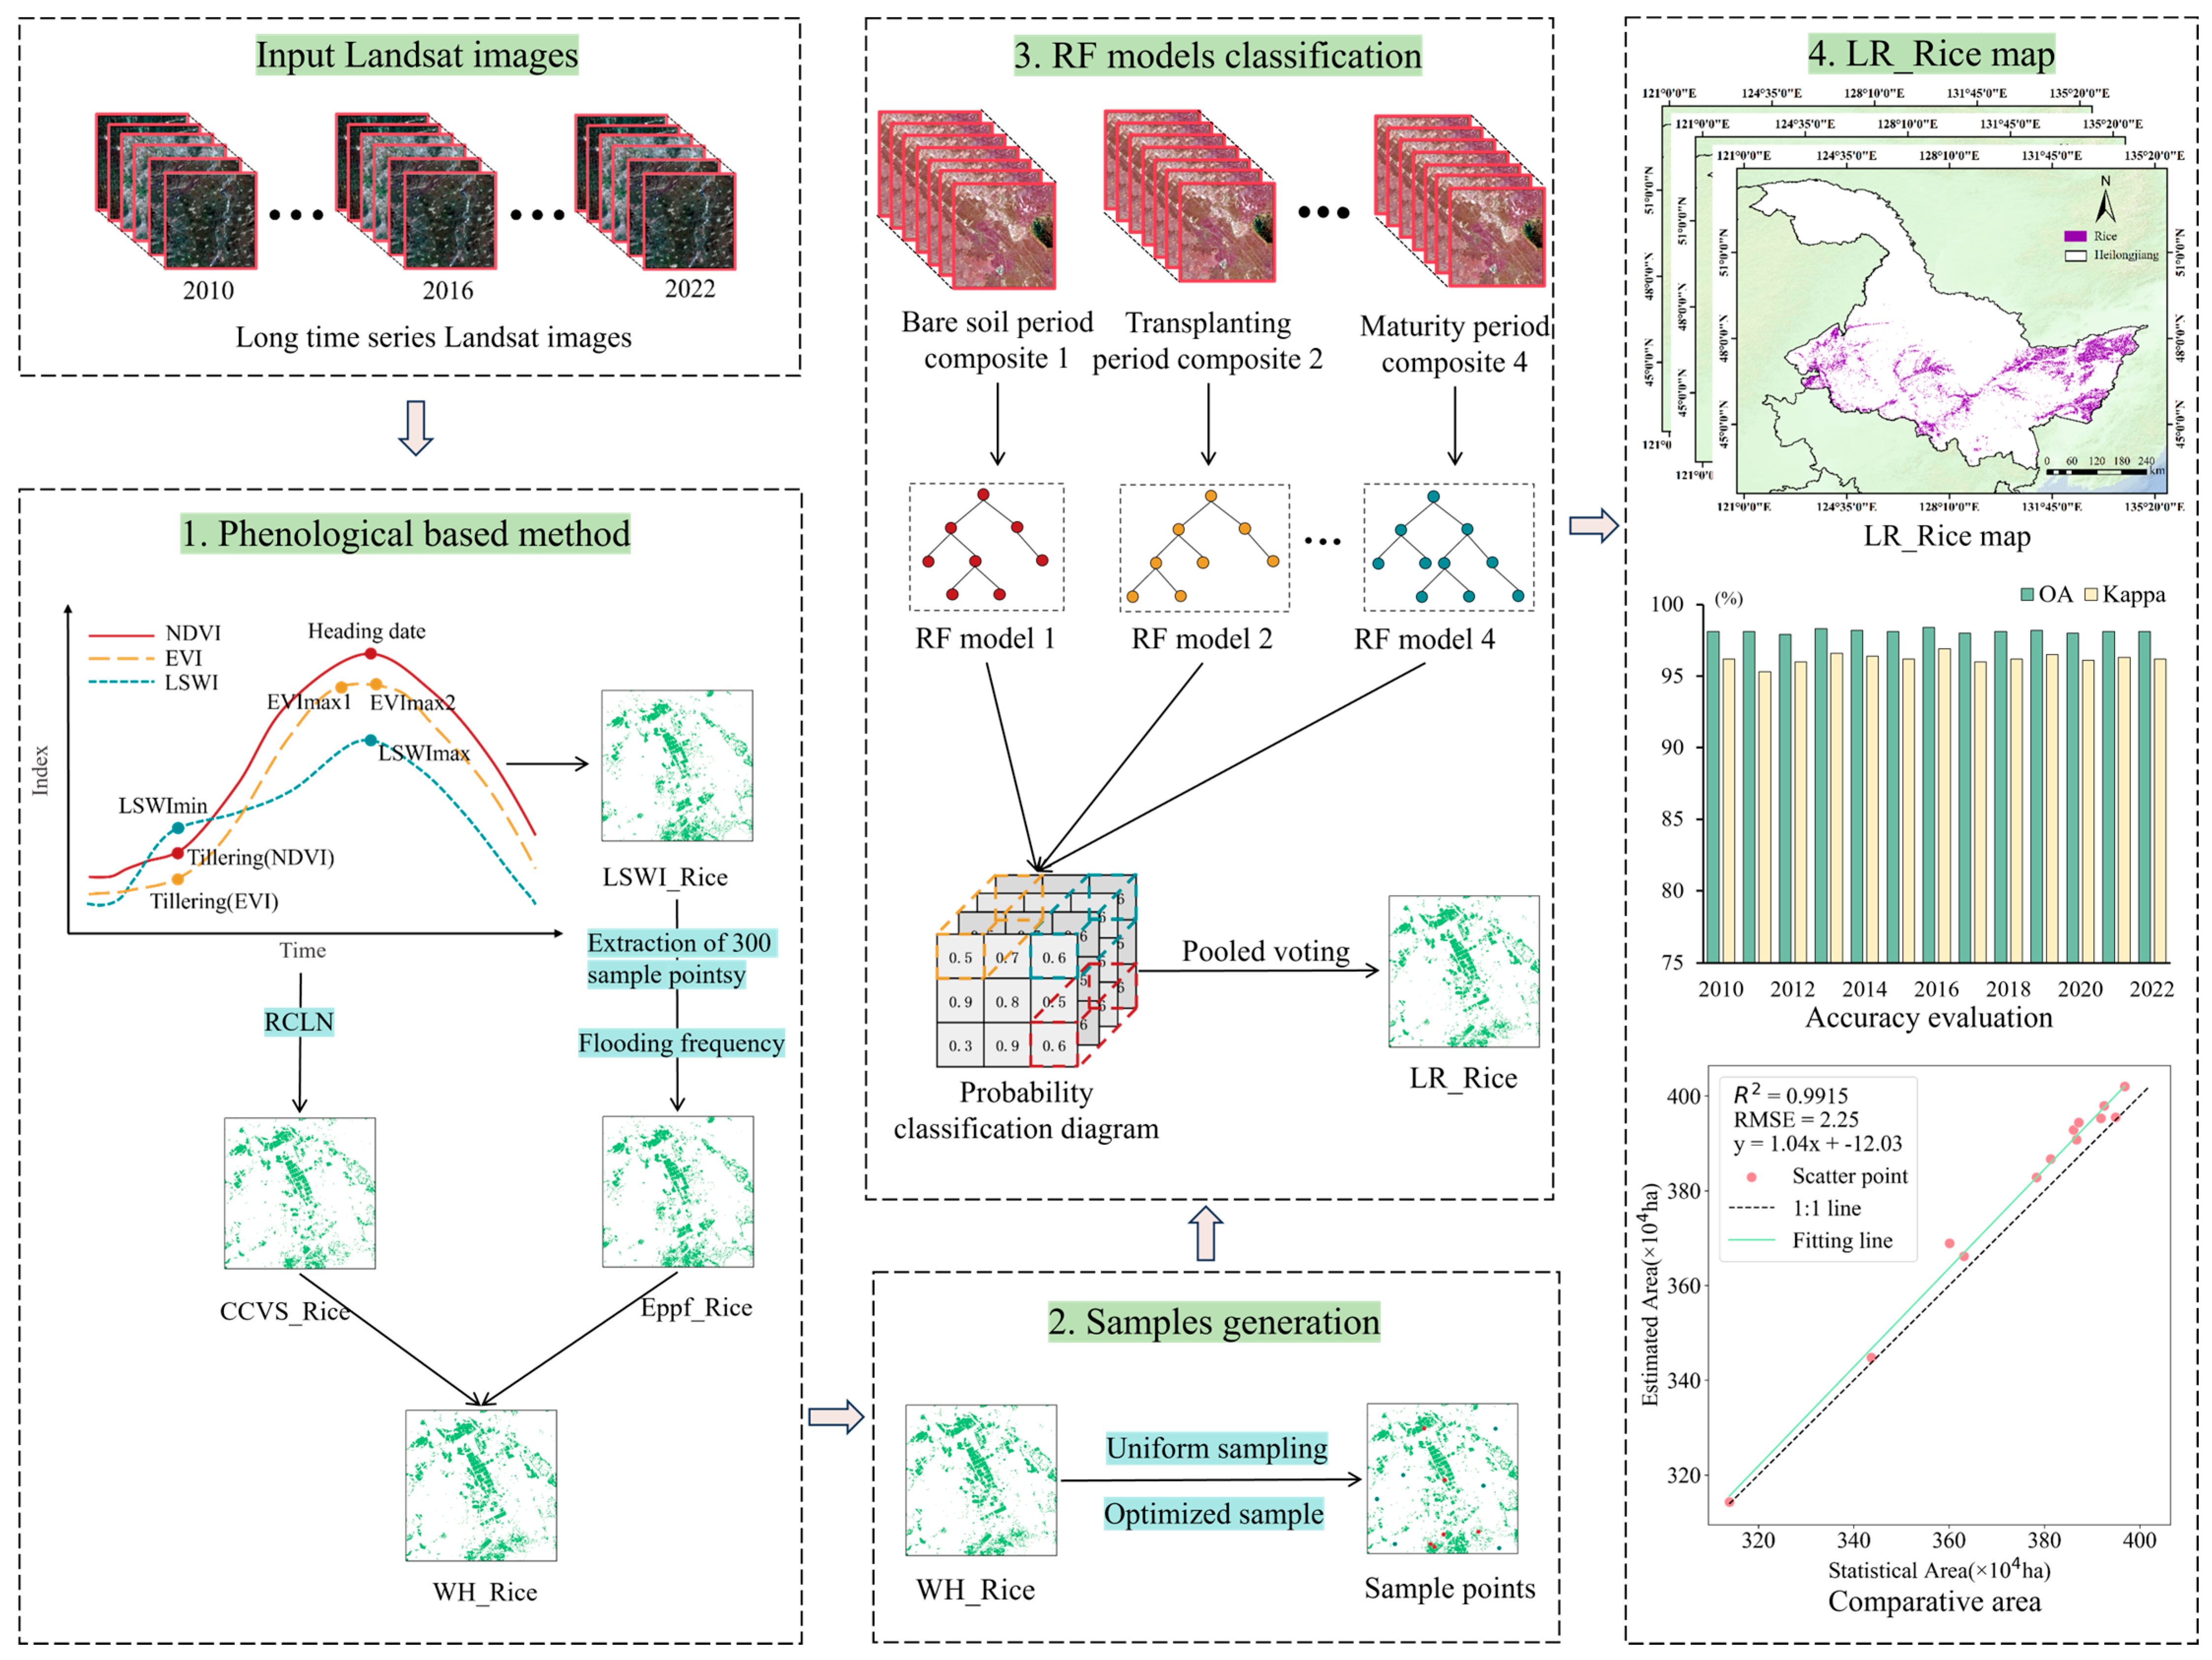
3.1. Introduction to Research Methods
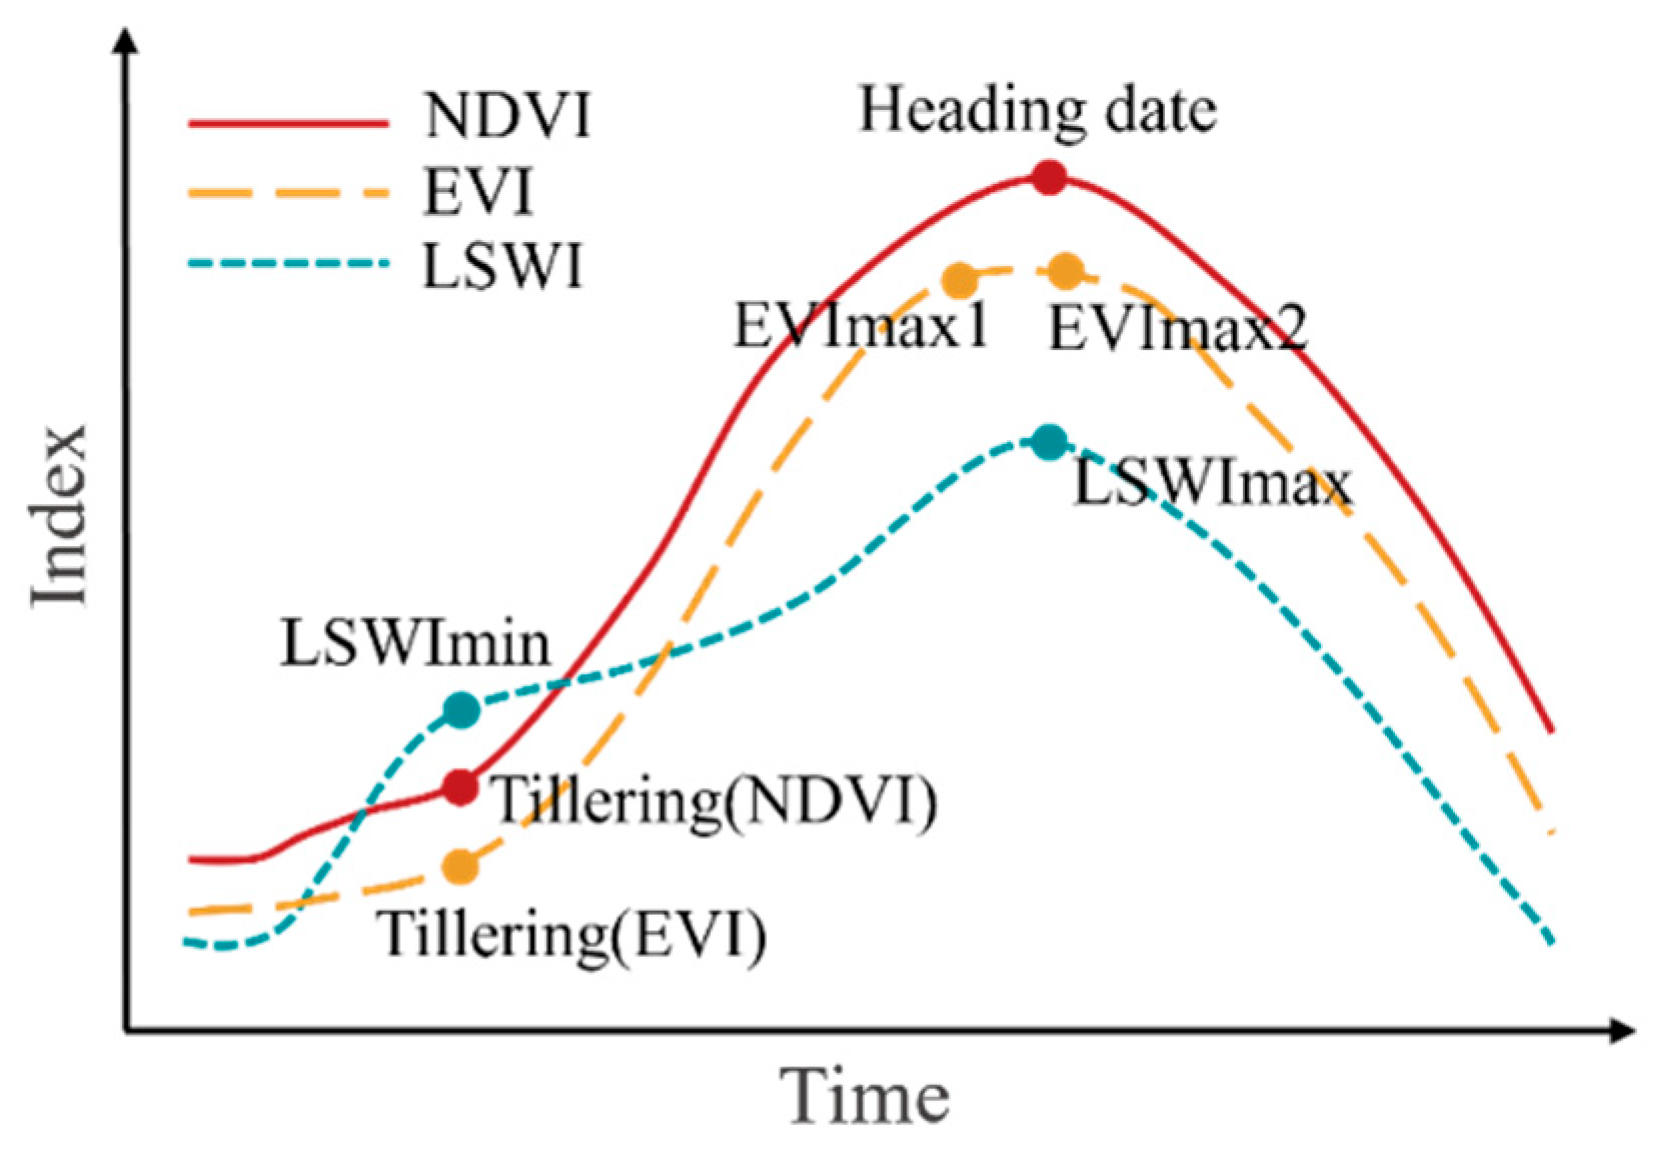
3.2. Mapping the Potential Distribution of Rice Based on Phenology
3.3. Sample Extraction and Optimization
3.4. Integrated Monthly RF Modeling
4. Experimental Results and Analysis
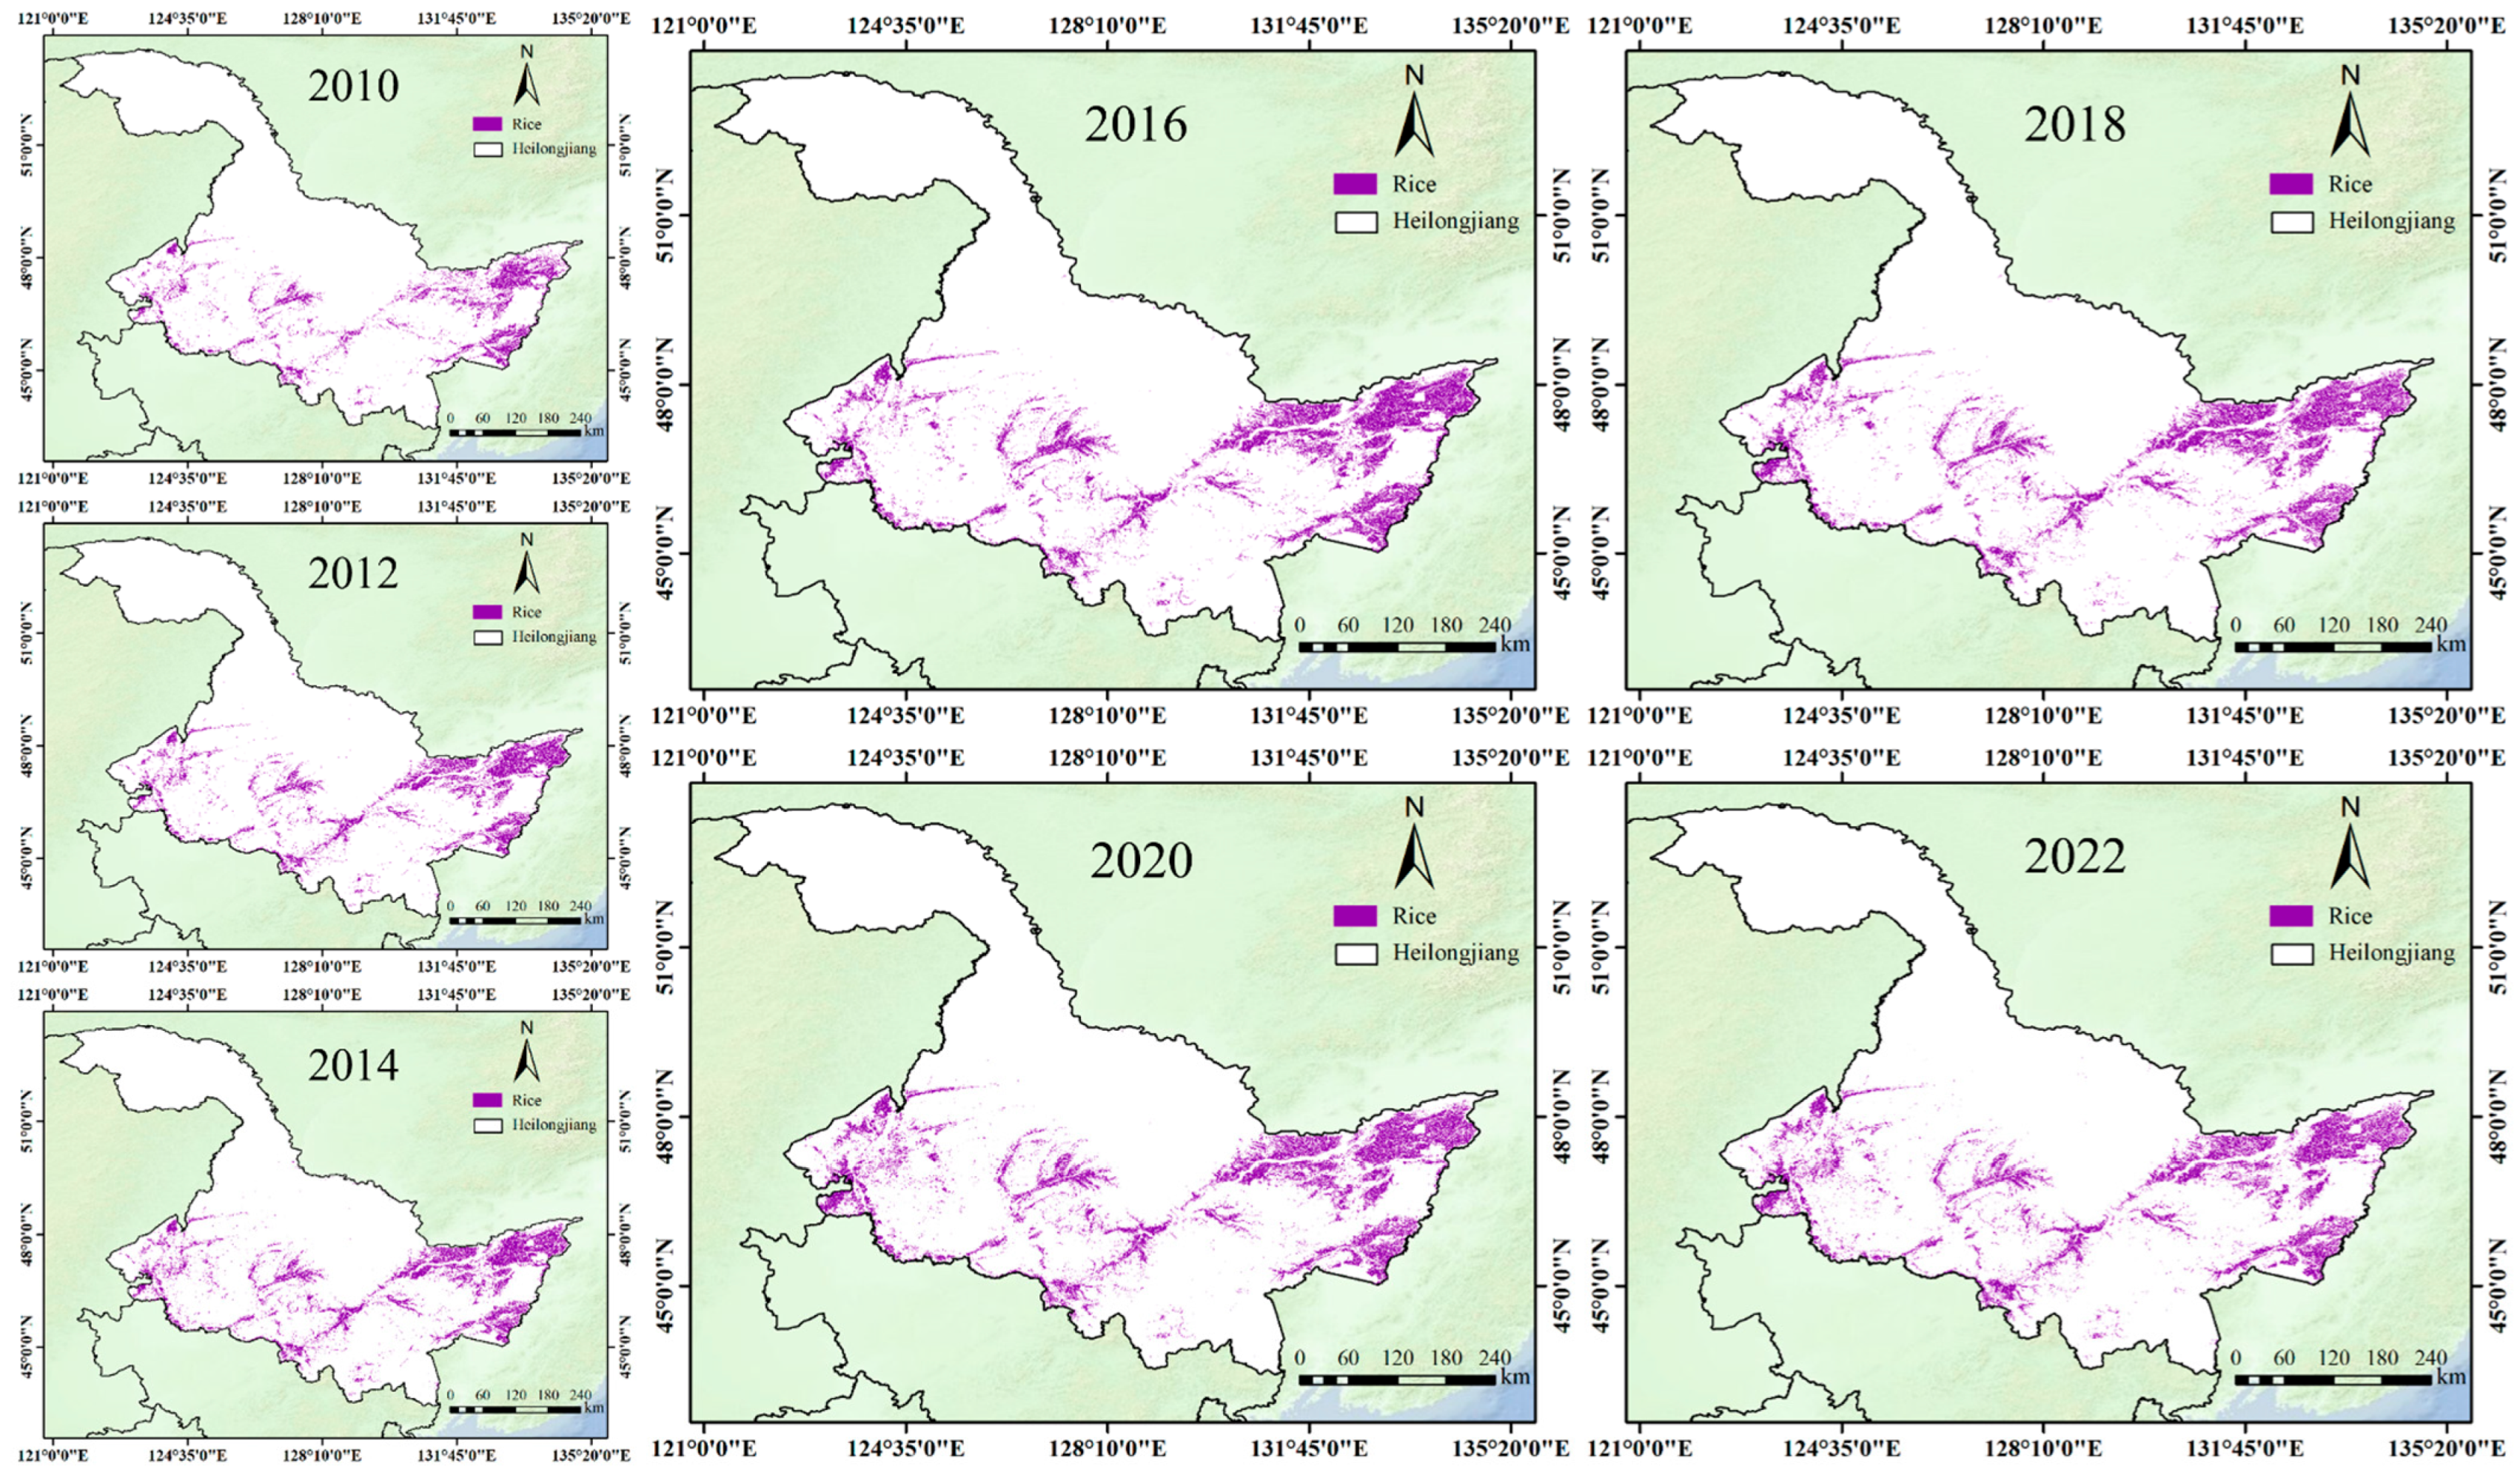
4.1. LR Algorithm for Rice Mapping
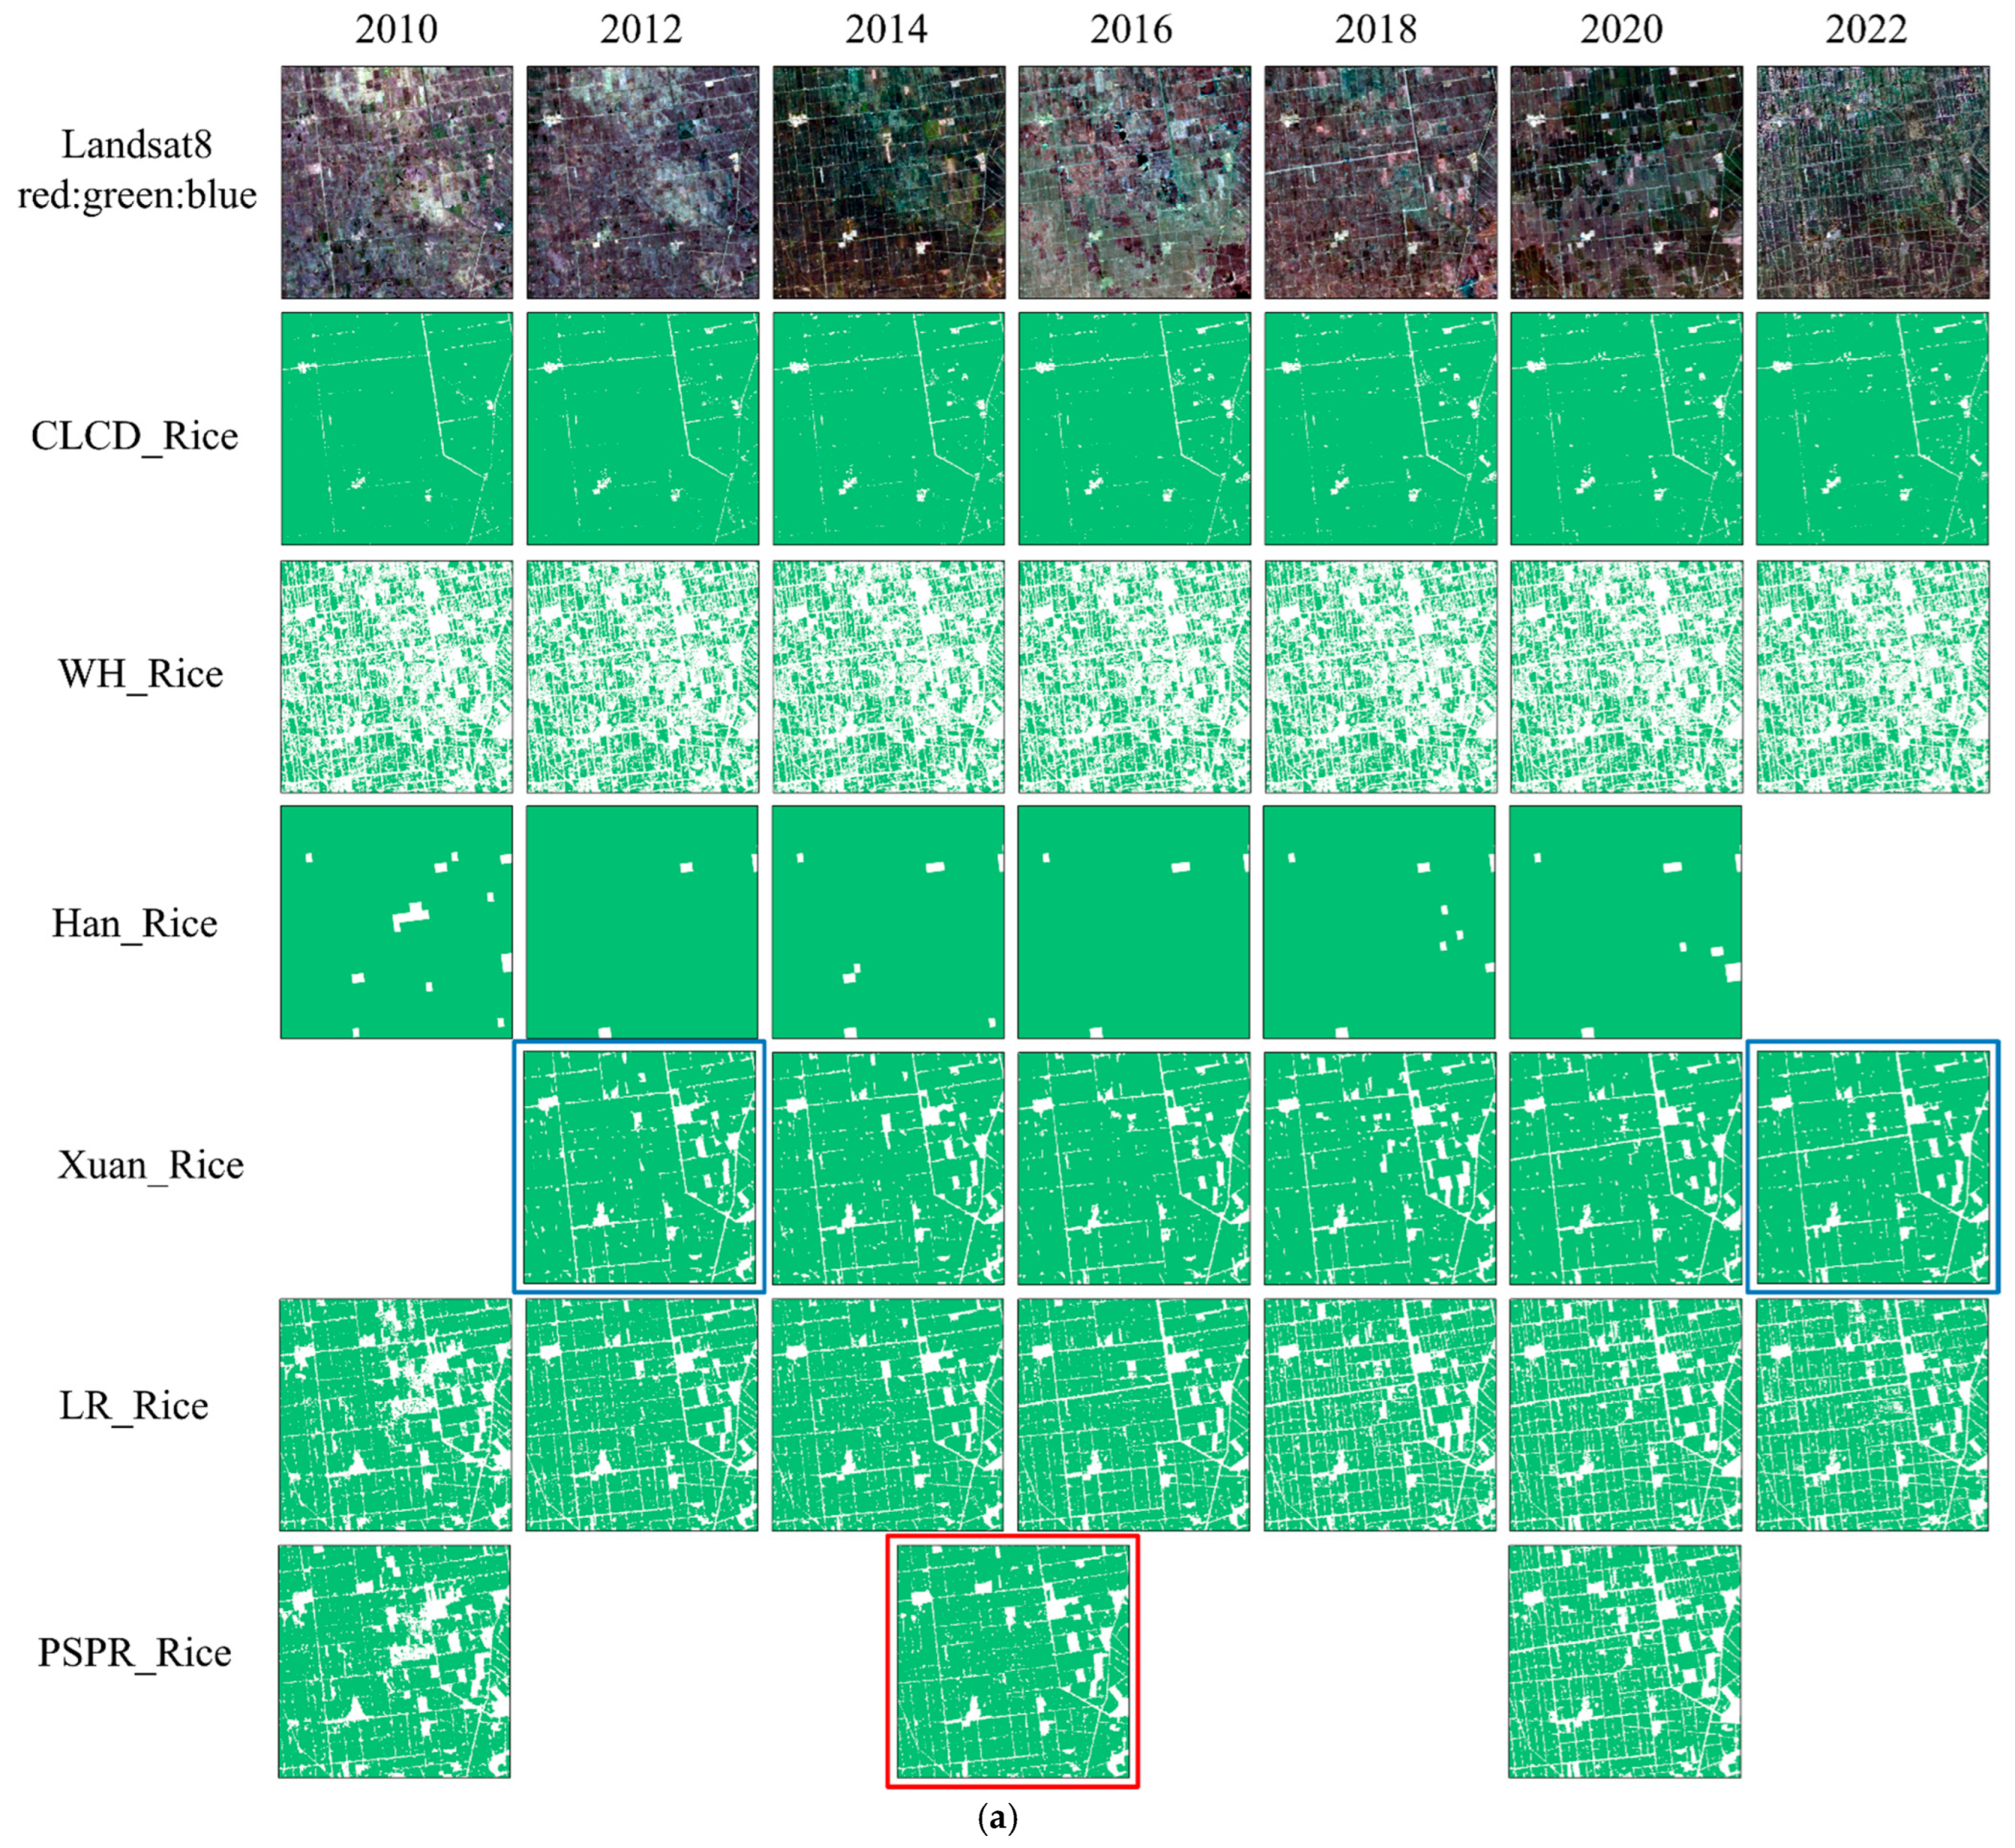
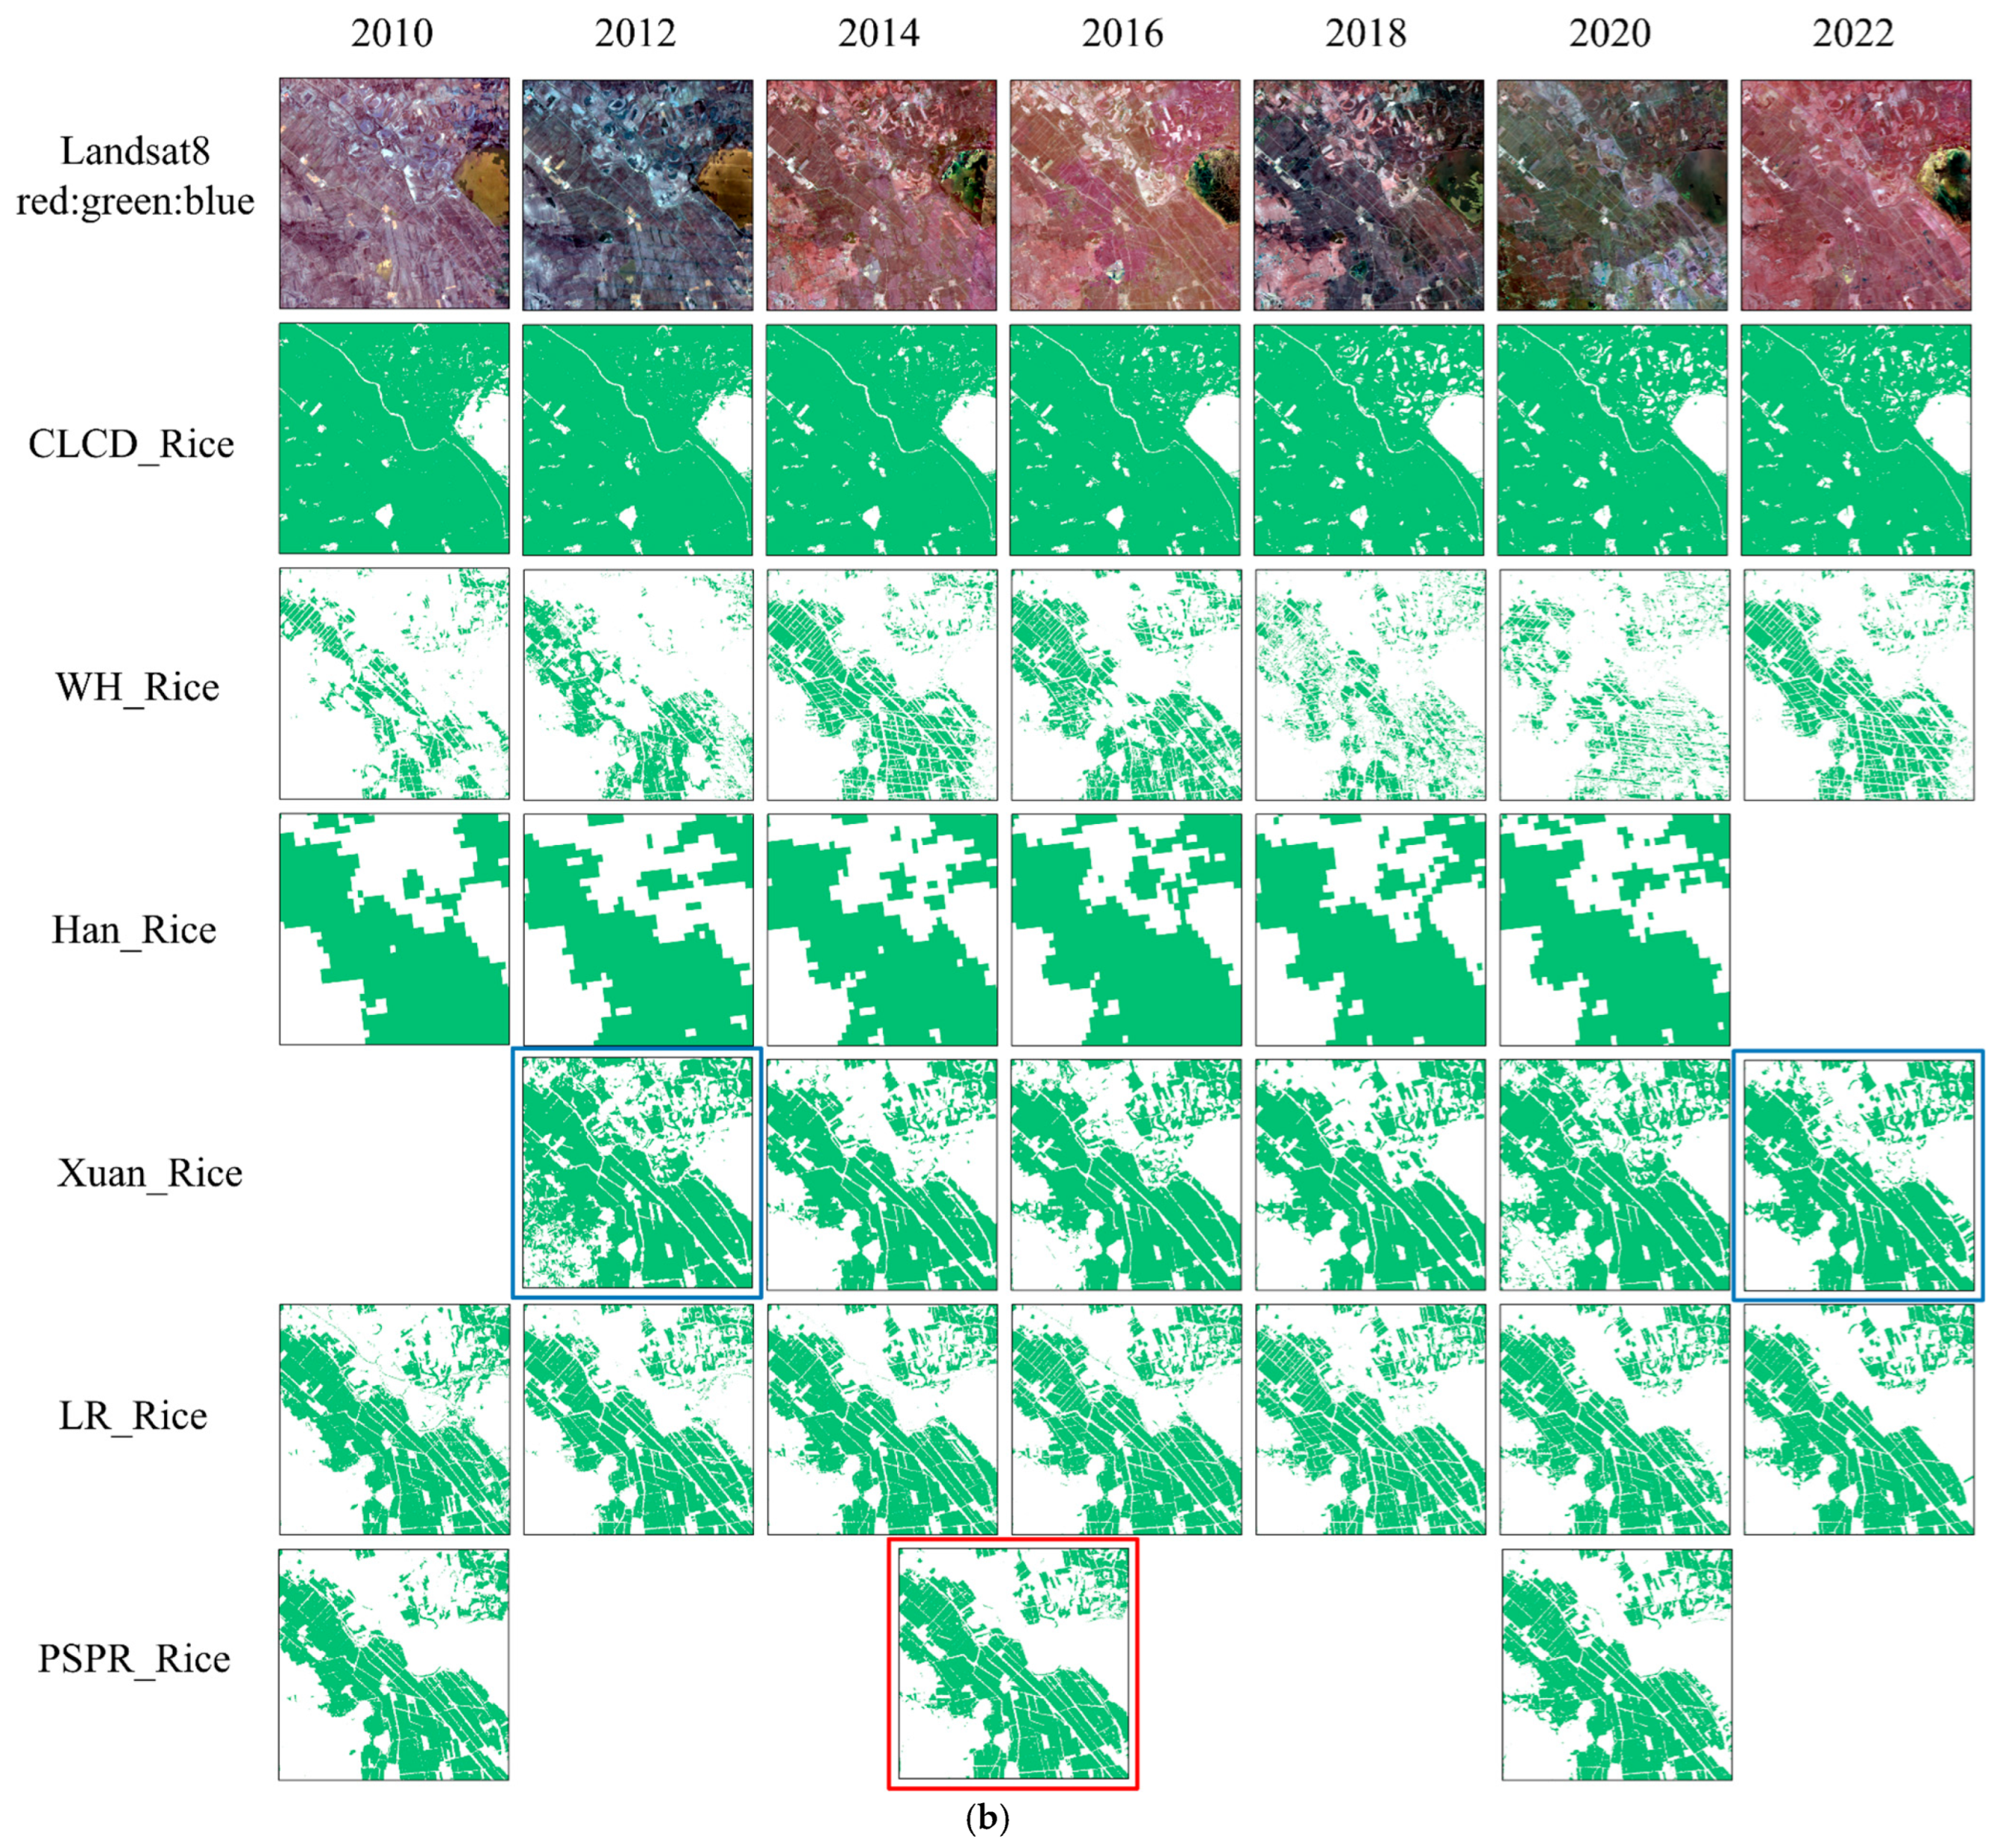
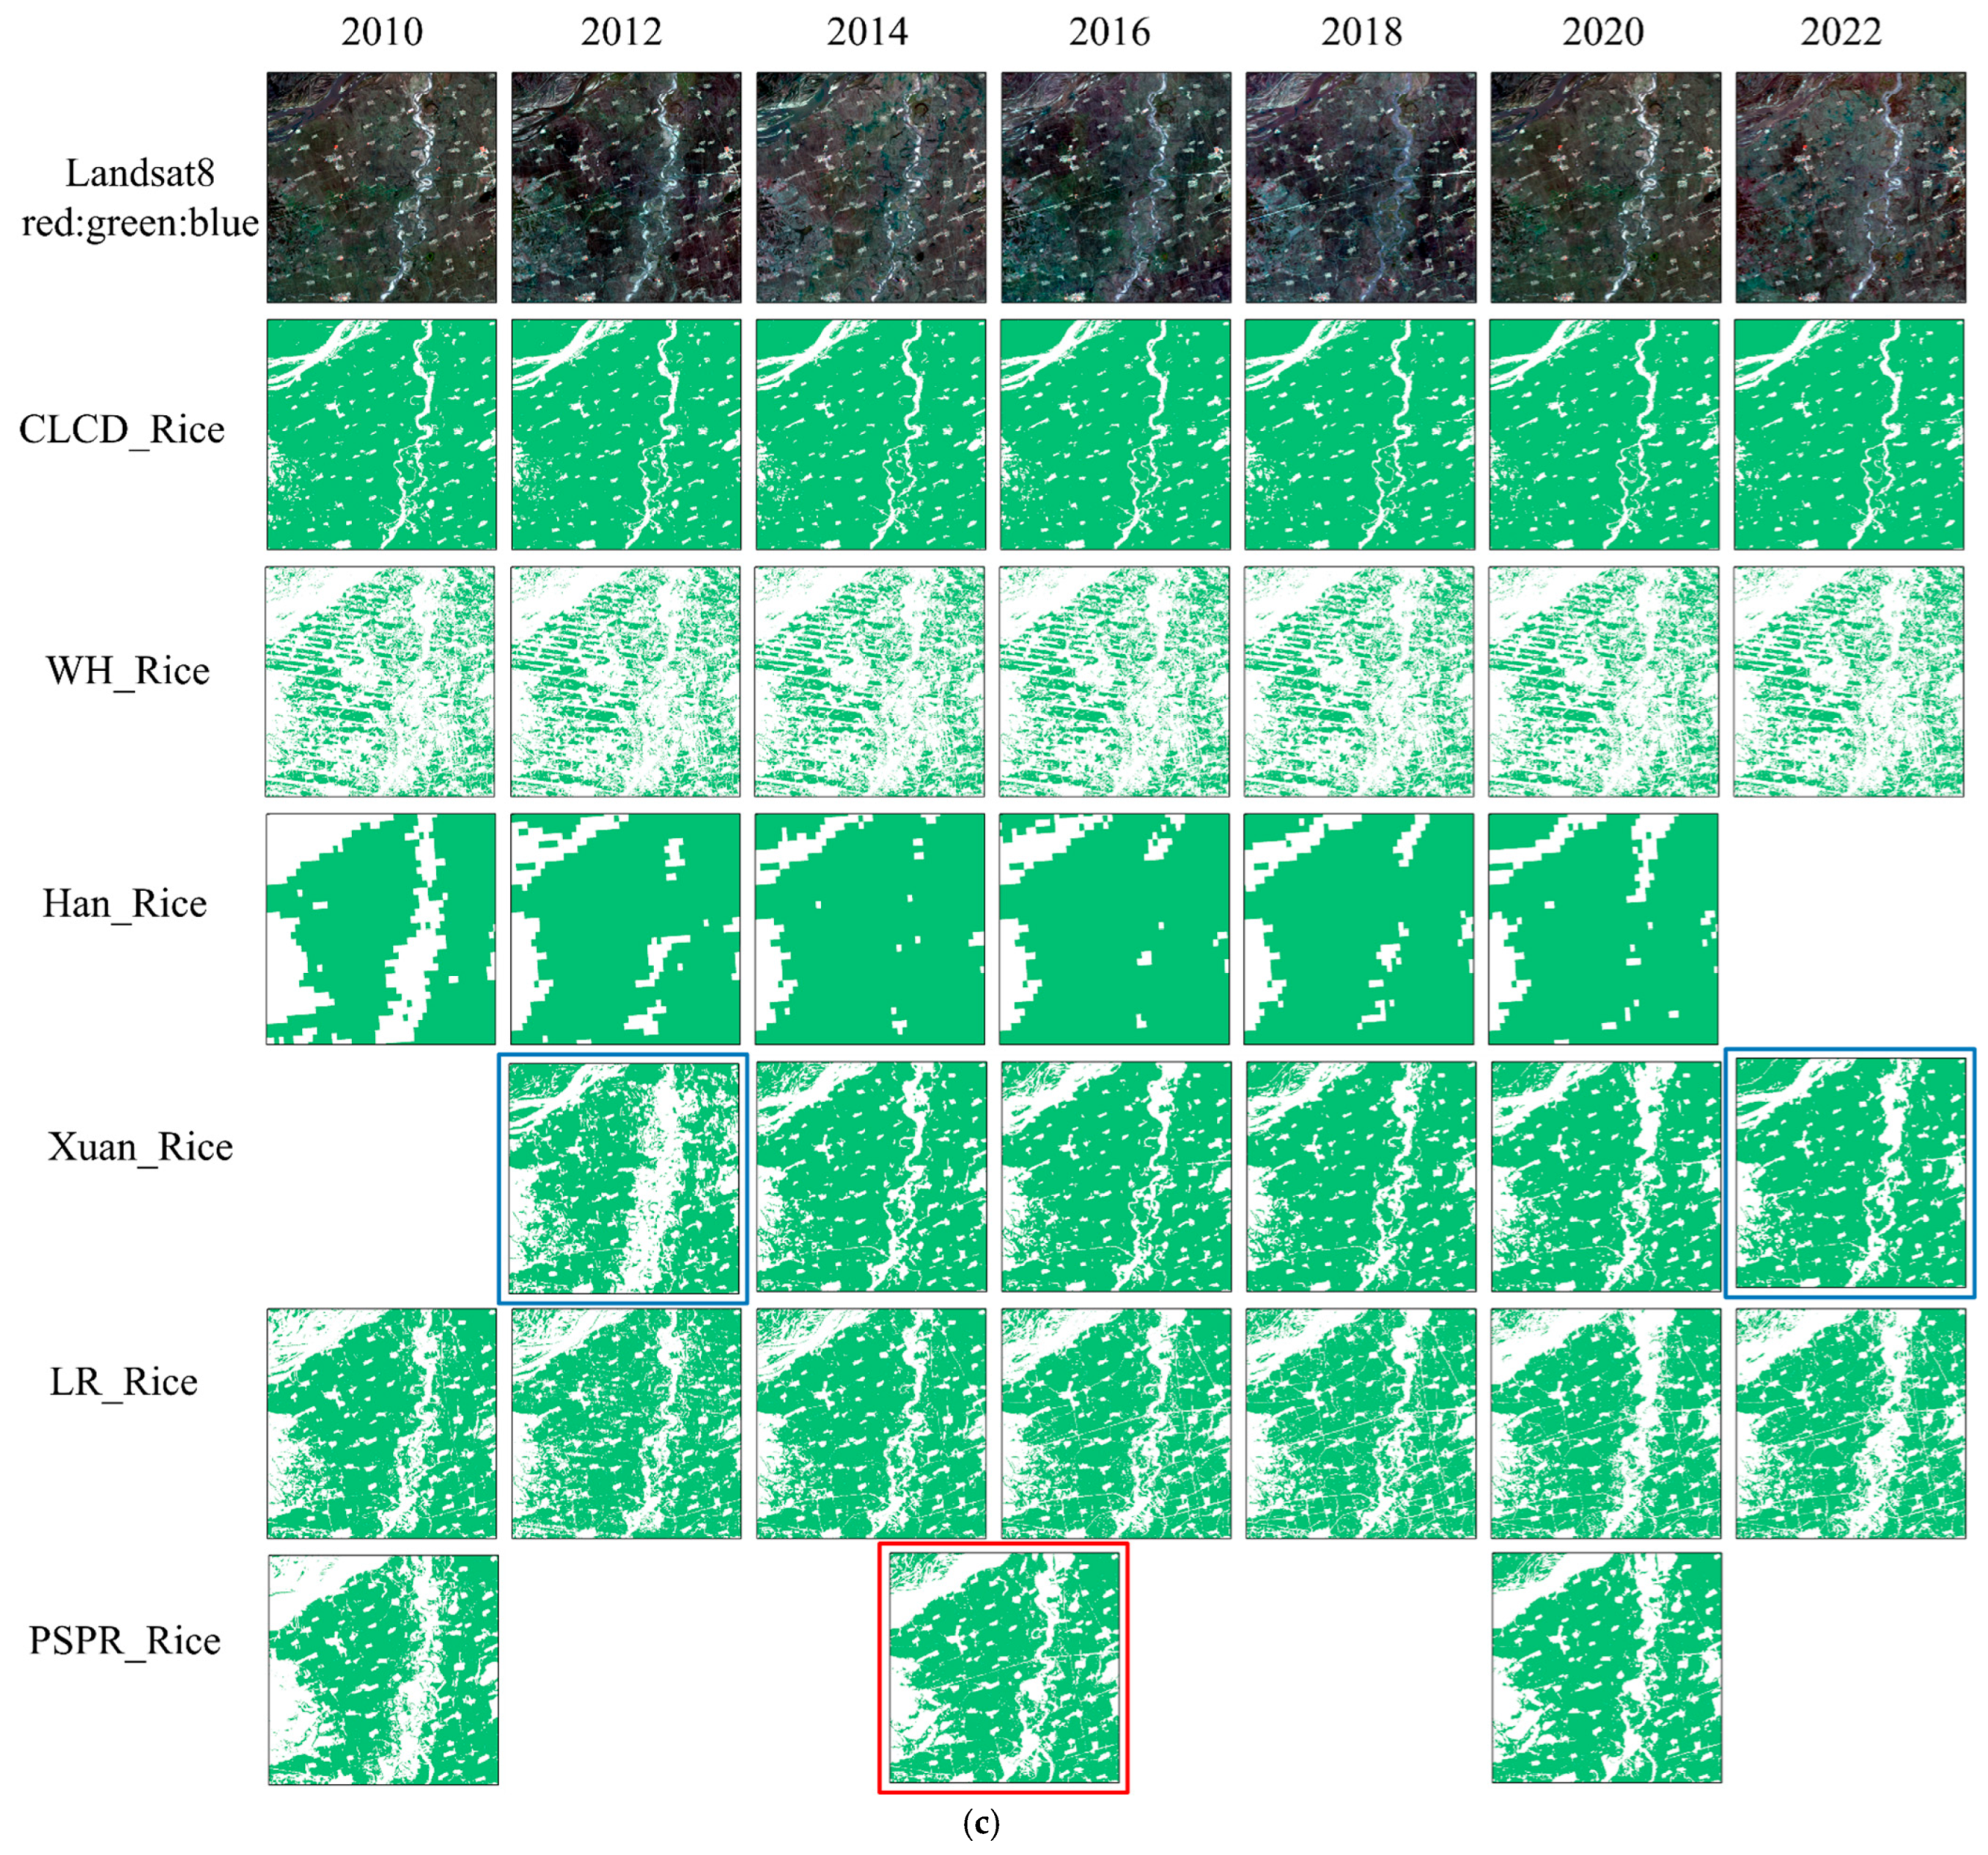
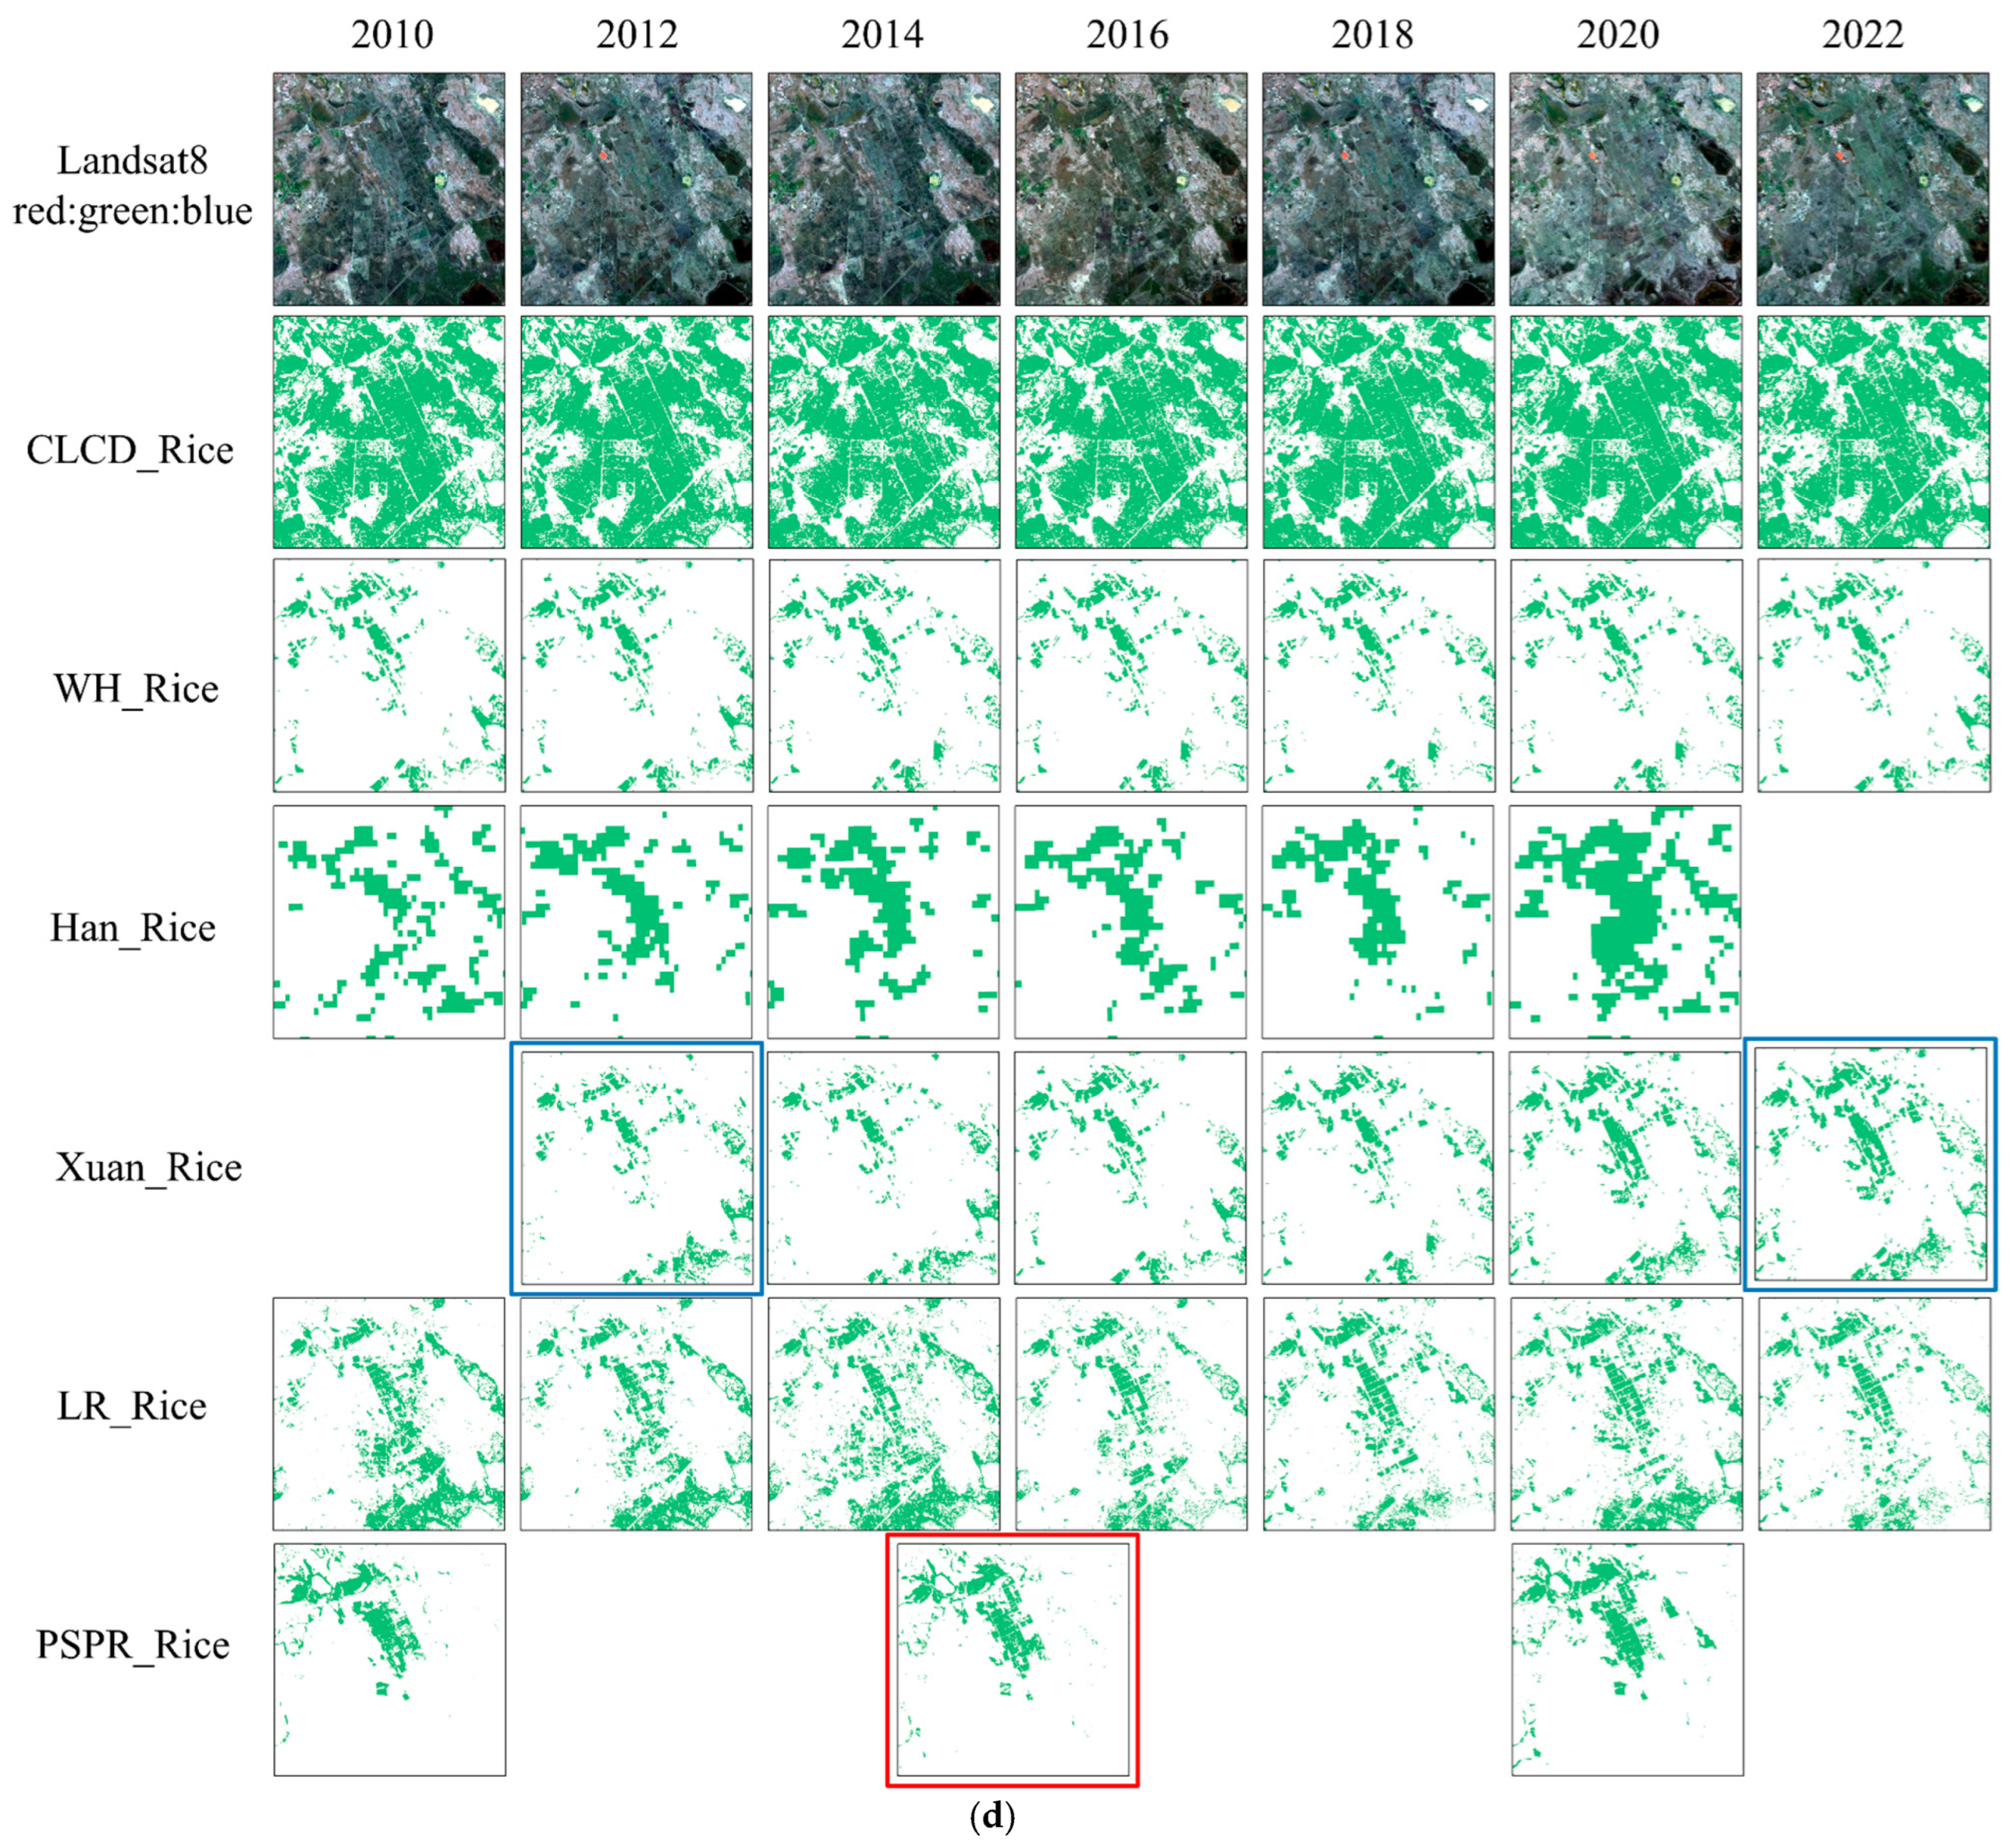
4.2. Comparison with Existing Products and Climatic Maps
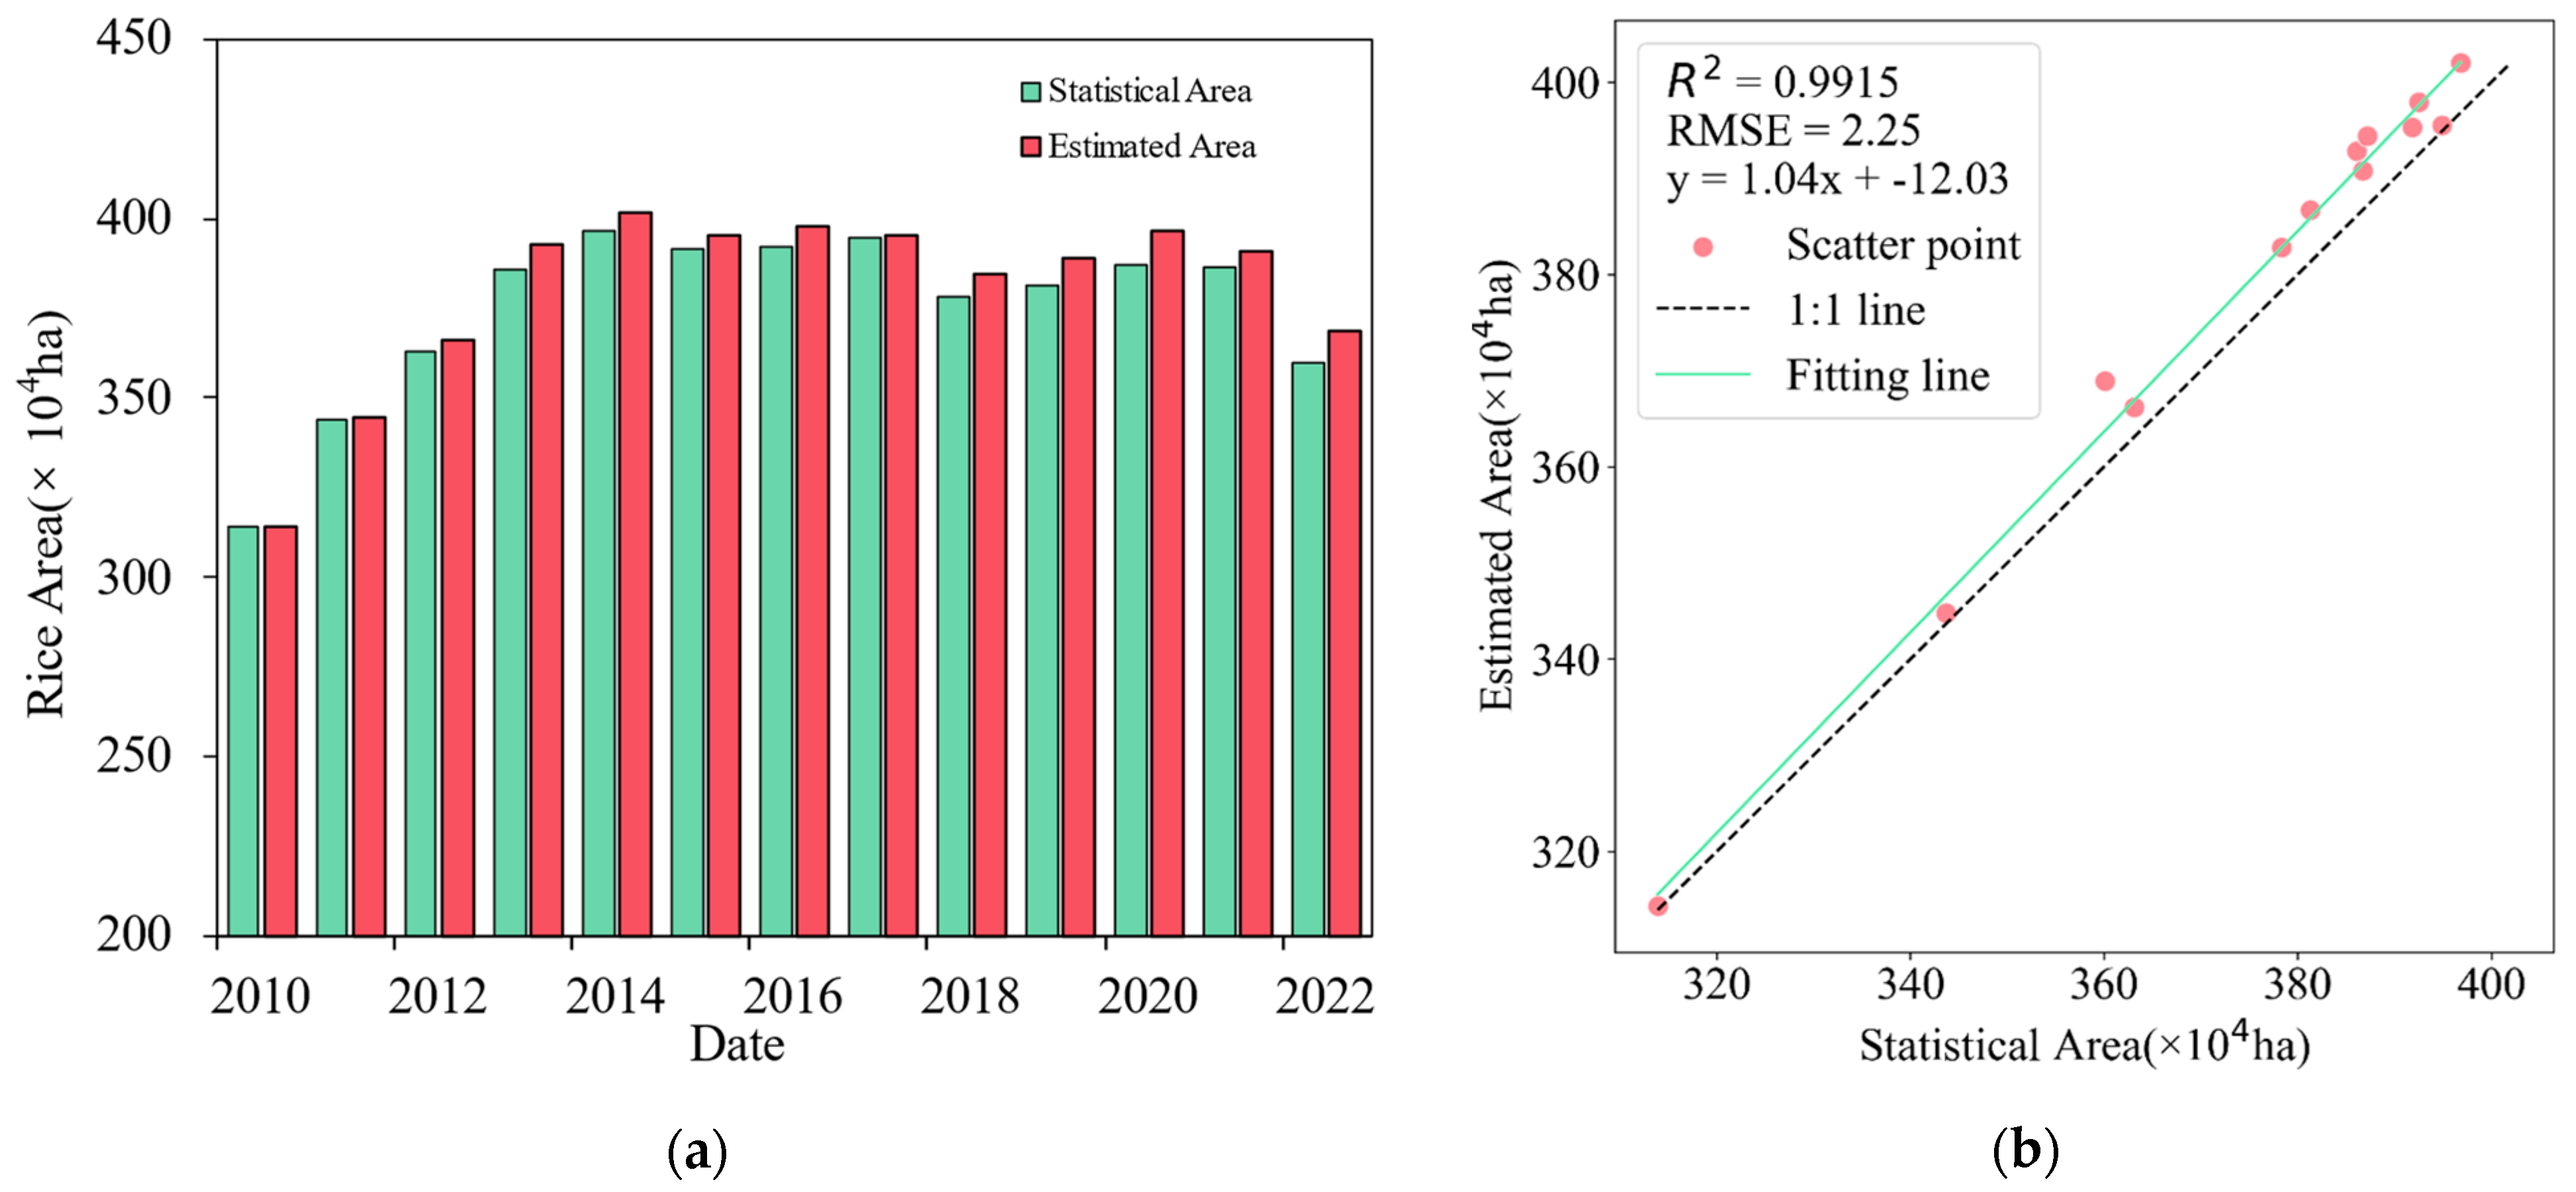
4.3. Comparison of LR Rice Mapping Area with Statistical Area
5. Discussion
5.1. Advantages of the LR Method
- (1)
- The LR algorithm realizes high-precision rice mapping using Landsat-7 and -8 images from a total of 13 years (2010–2022) of rice distribution mapping in Heilongjiang Province, overcoming the limitation of Sentinel-1/2’s time span, expanding the effective window of data, and effectively mitigating the problems arising from SLC-off image data and cloud occlusion in the Landsat-7 time-series images. This also enables use of Landsat-7 as the main data source for long-time-series rice mapping;
- (2)
- The LR method generates a preliminary rice distribution map based on the LSWI method. Selecting 300 sample points against the high-resolution image for the Eppf-CM method and introducing F and RCLN for the CCVS method, the potential rice distribution map WH_Rice is generated by combining the Eppf-CM and the CCVS methods. In comparison with the PSPR method that generates a rice distribution map based on phenology, WH_Rice has better consistency with the actual spatial distribution of the rice, indicating that the LR algorithm further improves the quality of the automatically generated sample data and provides favorable data security for the task of extracting rice distribution maps at large scale.
- (3)
- The study area addressed in this paper was large. When automatically generating sample data for the WH_Rice model, the study area is divided into prefectural cities and then into grids, and the sample points are extracted uniformly grid by grid; then, finally, the samples are summarized. This method not only ensures that the generated samples are more representative but also controls the spatial autocorrelation of the samples to a certain extent.
- (4)
- The LR algorithm synthesizes stage data for the four key phenological periods, and independently trains the machine learning model to generate multiple rice probability classification maps for each phenological period, adopting the pooled voting strategy to draw the final extracted rice maps, which ensures that the classification results for each phenological period do not interfere with each other in a “concurrent” way, effectively solving the null value problem. This “parallel” approach ensures that the classification results of each season do not interfere with each other and significantly improves the accuracy of rice information extraction.
5.2. Shortcomings and Improvements
- (1)
- The LR algorithm focuses on extracting single-season rice at high latitudes, while double- or even triple-season rice cropping systems are more common in subtropical and tropical regions. These multi-season rice cropping systems have unique climatic characteristics and can often include multiple flooding and transplanting periods. Therefore, in future studies we will consider optimizing and validating the LR method in multi-season rice growing regions;
- (2)
- Existing products offering rice mapping of northeast China use data for discrete years and most of them have low resolution. In this study, rice distribution maps with 30 m resolution were generated only for 2010–2022 in HLJ. It is important to extend the analysis timeframe into earlier eras to reveal changes in planting density over longer time scales;
- (3)
- This study validated the results using existing thematic maps of rice and official statistics, confirming their good spatial coverage and temporal consistency and effectively supporting the assessment of the methodology. Future studies can further enhance the credibility and applicability of the model by introducing more independent validation data;
- (4)
- In this study, an RF model was used to classify rice, and a number of classification performance indexes were calculated, but there were still shortcomings in the importance analysis of the variables. The lack of detailed analysis of the contribution of each input variable to the classification results, in particular the lack of an “information gain” result ranked by importance of the variables, limited an in-depth understanding of the model’s decision-making mechanism. Furthermore, the nfeatures value of the RF model was not finely optimized, which may have affected the stability and generalization ability of the model.
- (5)
- Classification errors in this study were mainly concentrated at the junctions of rice and other ground objects, and the classification accuracy of RF model may be unstable in other, more complex scenes. However, although we calculated and provide the confusion matrix, the specific factors leading to false positives (FP) and false negatives (FN) have not been explored in depth; these may relate to environmental conditions or other spatial features. Furthermore, the spatial distribution characteristics of misclassification were not analyzed in depth, which limits our understanding of the causes of classification errors and the development of optimization strategies.
6. Conclusions
Author Contributions
Funding
Data Availability Statement
Conflicts of Interest
References
- Tornos, L.; Huesca, M.; Antonio Dominguez, J.; Carmen Moyano, M.; Cicuendez, V.; Recuero, L.; Palacios-Orueta, A. Assessment of MODIS Spectral Indices for Determining Rice Paddy Agricultural Practices and Hydroperiod. ISPRS J. Photogramm. Remote Sens. 2015, 101, 110–124. [Google Scholar] [CrossRef]
- Zhang, G.; Xiao, X.; Dong, J.; Xin, F.; Zhang, Y.; Qin, Y.; Doughty, R.B.; Moore, B. Fingerprint of Rice Paddies in Spatial–Temporal Dynamics of Atmospheric Methane Concentration in Monsoon Asia. Nat. Commun. 2020, 11, 554. [Google Scholar] [CrossRef]
- Meng, L.; Li, Y.; Shen, R.; Zheng, Y.; Pan, B.; Yuan, W.; Li, J.; Zhuo, L. Large-Scale and High-Resolution Paddy Rice Intensity Mapping Using Downscaling and Phenology-Based Algorithms on Google Earth Engine. Int. J. Appl. Earth Obs. Geoinf. 2024, 128, 103725. [Google Scholar] [CrossRef]
- Dong, J.; Xiao, X. Evolution of Regional to Global Paddy Rice Mapping Methods: A Review. ISPRS J. Photogramm. Remote Sens. 2016, 119, 214–227. [Google Scholar] [CrossRef]
- Zhang, C.; Zhang, H.; Tian, S. Phenology-Assisted Supervised Paddy Rice Mapping with the Landsat Imagery on Google Earth Engine: Experiments in Heilongjiang Province of China from 1990 to 2020. Comput. Electron. Agric. 2023, 212, 108105. [Google Scholar] [CrossRef]
- Xiao, X.; Boles, S.; Liu, J.; Zhuang, D.; Frolking, S.; Li, C.; Salas, W.; Moore, B. Mapping Paddy Rice Agriculture in Southern China Using Multi-Temporal MODIS Images. Remote Sens. Environ. 2005, 95, 480–492. [Google Scholar] [CrossRef]
- Zhang, X.; Su, H.; Zhang, C.; Gu, X.; Tan, X.; Atkinson, P.M. Robust Unsupervised Small Area Change Detection from SAR Imagery Using Deep Learning. ISPRS J. Photogramm. Remote Sens. 2021, 173, 79–94. [Google Scholar] [CrossRef]
- Dong, J.; Xiao, X.; Menarguez, M.A.; Zhang, G.; Qin, Y.; Thau, D.; Biradar, C.; Moore, B. Mapping Paddy Rice Planting Area in Northeastern Asia with Landsat 8 Images, Phenology-Based Algorithm and Google Earth Engine. Remote Sens. Environ. 2016, 185, 142–154. [Google Scholar] [CrossRef]
- Jin, C.; Xiao, X.; Dong, J.; Qin, Y.; Wang, Z. Mapping Paddy Rice Distribution Using Multi-Temporal Landsat Imagery in the Sanjiang Plain, Northeast China. Front. Earth Sci. 2016, 10, 49–62. [Google Scholar] [CrossRef]
- Belgiu, M.; Bijker, W.; Csillik, O.; Stein, A. Phenology-Based Sample Generation for Supervised Crop Type Classification. Int. J. Appl. Earth Obs. Geoinf. 2021, 95, 102264. [Google Scholar] [CrossRef]
- Qiu, B.; Li, W.; Tang, Z.; Chen, C.; Qi, W. Mapping Paddy Rice Areas Based on Vegetation Phenology and Surface Moisture Conditions. Ecol. Indic. 2015, 56, 79–86. [Google Scholar] [CrossRef]
- Shen, R.; Pan, B.; Peng, Q.; Dong, J.; Chen, X.; Zhang, X.; Ye, T.; Huang, J.; Yuan, W. High-Resolution Distribution Maps of Single-Season Rice in China from 2017to 2022. Earth Syst. Sci. Data 2023, 15, 3203–3222. [Google Scholar] [CrossRef]
- Sun, L.; Lou, Y.; Shi, Q.; Zhang, L. Spatial Domain Transfer: Cross-Regional Paddy Rice Mapping with a Few Samples Based on Sentinel-1 and Sentinel-2 Data on GEE. Int. J. Appl. Earth Obs. Geoinf. 2024, 128, 103762. [Google Scholar] [CrossRef]
- Xiao, X.; He, L.; Salas, W.; Li, C.; Moore, B.; Zhao, R.; Frolking, S.; Boles, S. Quantitative Relationships between Field-Measured Leaf Area Index and Vegetation Index Derived from VEGETATION Images for Paddy Rice Fields. Int. J. Remote Sens. 2002, 23, 3595–3604. [Google Scholar] [CrossRef]
- Lin, Z.; Zhong, R.; Xiong, X.; Guo, C.; Xu, J.; Zhu, Y.; Xu, J.; Ying, Y.; Ting, K.C.; Huang, J.; et al. Large-Scale Rice Mapping Using Multi-Task Spatiotemporal Deep Learning and Sentinel-1 SAR Time Series. Remote Sens. 2022, 14, 699. [Google Scholar] [CrossRef]
- Xiao, X.M.; Boles, S.; Frolking, S.; Li, C.S.; Babu, J.Y.; Salas, W.; Moore, B. Mapping Paddy Rice Agriculture in South and Southeast Asia Using Multi-Temporal MODIS Images. Remote Sens. Environ. 2006, 100, 95–113. [Google Scholar] [CrossRef]
- Han, J.; Zhang, Z.; Luo, Y.; Cao, J.; Zhang, L.; Zhuang, H.; Cheng, F.; Zhang, J.; Tao, F. Annual Paddy Rice Planting Area and Cropping Intensity Datasets and Their Dynamics in the Asian Monsoon Region from 2000 to 2020. Agric. Syst. 2022, 200, 103437. [Google Scholar] [CrossRef]
- Zhou, Y.; Xiao, X.; Qin, Y.; Dong, J.; Zhang, G.; Kou, W.; Jin, C.; Wang, J.; Li, X. Mapping Paddy Rice Planting Area in Rice-Wetland Coexistent Areas through Analysis of Landsat 8 OLI and MODIS Images. Int. J. Appl. Earth Obs. Geoinf. 2016, 46, 1–12. [Google Scholar] [CrossRef]
- Han, J.; Zhang, Z.; Luo, Y.; Cao, J.; Zhang, L.; Cheng, F.; Zhuang, H.; Zhang, J.; Tao, F. NESEA-Rice10: High-Resolution Annual Paddy Rice Maps for Northeast and Southeast Asia from 2017 to 2019. Earth Syst. Sci. Data 2021, 13, 5969–5986. [Google Scholar] [CrossRef]
- Xiao, W.; Xu, S.; He, T. Mapping Paddy Rice with Sentinel-1/2 and Phenology-, Object-Based Algorithm-A Implementation in Hangjiahu Plain in China Using GEE Platform. Remote Sens. 2021, 13, 990. [Google Scholar] [CrossRef]
- Wei, J.; Cui, Y.; Luo, W.; Luo, Y. Mapping Paddy Rice Distribution and Cropping Intensity in China from 2014 to 2019 with Landsat Images, Effective Flood Signals, and Google Earth Engine. Remote Sens. 2022, 14, 759. [Google Scholar] [CrossRef]
- Zhang, K.; Lv, X.; Guo, B.; Chai, H. Unsupervised SAR Image Change Detection Based on Histogram Fitting Error Minimization and Convolutional Neural Network. Remote Sens. 2023, 15, 470. [Google Scholar] [CrossRef]
- Dong, J.; Xiao, X.; Kou, W.; Qin, Y.; Zhang, G.; Li, L.; Jin, C.; Zhou, Y.; Wang, J.; Biradar, C.; et al. Tracking the Dynamics of Paddy Rice Planting Area in 1986-2010 through Time Series Landsat Images and Phenology-Based Algorithms. Remote Sens. Environ. 2015, 160, 99–113. [Google Scholar] [CrossRef]
- Ni, R.; Tian, J.; Li, X.; Yin, D.; Li, J.; Gong, H.; Zhang, J.; Zhu, L.; Wu, D. An Enhanced Pixel-Based Phenological Feature for Accurate Paddy Rice Mapping with Sentinel-2 Imagery in Google Earth Engine. ISPRS J. Photogramm. Remote Sens. 2021, 178, 282–296. [Google Scholar] [CrossRef]
- Cai, Y.; Lin, H.; Zhang, M. Mapping Paddy Rice by the Object-Based Random Forest Method Using Time Series Sentinel-1/Sentinel-2 Data. Adv. Space Res. 2019, 64, 2233–2244. [Google Scholar] [CrossRef]
- Xiao, D.; Niu, H.; Guo, F.; Zhao, S.; Fan, L. Monitoring Irrigation Dynamics in Paddy Fields Using Spatiotemporal Fusion of Sentinel-2 and MODIS. Agric. Water Manag. 2022, 263, 107409. [Google Scholar] [CrossRef]
- Pan, B.; Zheng, Y.; Shen, R.; Ye, T.; Zhao, W.; Dong, J.; Ma, H.; Yuan, W. High Resolution Distribution Dataset of Double-Season Paddy Rice in China. Remote Sens. 2021, 13, 4609. [Google Scholar] [CrossRef]
- Xu, X.; Ji, X.; Jiang, J.; Yao, X.; Tian, Y.; Zhu, Y.; Cao, W.; Cao, Q.; Yang, H.; Shi, Z.; et al. Evaluation of One-Class Support Vector Classification for Mapping the Paddy Rice Planting Area in Jiangsu Province of China from Landsat 8 OLI Imagery. Remote Sens. 2018, 10, 546. [Google Scholar] [CrossRef]
- Chen, C.-F.; Chen, C.-R.; Nguyen-Thanh, S. Investigating Rice Cropping Practices and Growing Areas from MODIS Data Using Empirical Mode Decomposition and Support Vector Machines. GISci. Remote Sens. 2012, 49, 117–138. [Google Scholar] [CrossRef]
- Zhang, M.; Lin, H.; Wang, G.; Sun, H.; Fu, J. Mapping Paddy Rice Using a Convolutional Neural Network (CNN) with Landsat 8 Datasets in the Dongting Lake Area, China. Remote Sens. 2018, 10, 1840. [Google Scholar] [CrossRef]
- Clauss, K.; Yan, H.; Kuenzer, C. Mapping Paddy Rice in China in 2002, 2005, 2010 and 2014 with MODIS Time Series. Remote Sens. 2016, 8, 434. [Google Scholar] [CrossRef]
- Onojeghuo, A.O.; Blackburn, G.A.; Wang, Q.; Atkinson, P.M.; Kindred, D.; Miao, Y. Mapping Paddy Rice Fields by Applying Machine Learning Algorithms to Multi-Temporal Sentinel-1A and Landsat Data. Int. J. Remote Sens. 2018, 39, 1042–1067. [Google Scholar] [CrossRef]
- Zhang, C.; Zhang, H.; Zhang, L. Spatial Domain Bridge Transfer: An Automated Paddy Rice Mapping Method with No Training Data Required and Decreased Image Inputs for the Large Cloudy Area. Comput. Electron. Agric. 2021, 181, 105978. [Google Scholar] [CrossRef]
- Sun, Y.; Huang, J.; Ao, Z.; Lao, D.; Xin, Q. Deep Learning Approaches for the Mapping of Tree Species Diversity in a Tropical Wetland Using Airborne LiDAR and High-Spatial-Resolution Remote Sensing Images. Forests 2019, 10, 1047. [Google Scholar] [CrossRef]
- Teluguntla, P.; Thenkabail, P.S.; Oliphant, A.; Xiong, J.; Gumma, M.K.; Congalton, R.G.; Yadav, K.; Huete, A. A 30-m Landsat-Derived Cropland Extent Product of Australia and China Using Random Forest Machine Learning Algorithm on Google Earth Engine Cloud Computing Platform. ISPRS J. Photogramm. Remote Sens. 2018, 144, 325–340. [Google Scholar] [CrossRef]
- Chen, N.; Yu, L.; Zhang, X.; Shen, Y.; Zeng, L.; Hu, Q.; Niyogi, D. Mapping Paddy Rice Fields by Combining Multi-Temporal Vegetation Index and Synthetic Aperture Radar Remote Sensing Data Using Google Earth Engine Machine Learning Platform. Remote Sens. 2020, 12, 2992. [Google Scholar] [CrossRef]
- Kluger, D.M.; Wang, S.; Lobell, D.B. Two Shifts for Crop Mapping: Leveraging Aggregate Crop Statistics to Improve Satellite-Based Maps in New Regions. Remote Sens. Environ. 2021, 262, 112488. [Google Scholar] [CrossRef]
- Foga, S.; Scaramuzza, P.L.; Guo, S.; Zhu, Z.; Dilley, R.D.; Beckmann, T.; Schmidt, G.L.; Dwyer, J.L.; Hughes, M.J.; Laue, B. Cloud Detection Algorithm Comparison and Validation for Operational Landsat Data Products. Remote Sens. Environ. 2017, 194, 379–390. [Google Scholar] [CrossRef]
- You, N.; Dong, J.; Huang, J.; Du, G.; Zhang, G.; He, Y.; Yang, T.; Di, Y.; Xiao, X. The 10-m Crop Type Maps in Northeast China during 2017–2019. Sci. Data 2021, 8, 41. [Google Scholar] [CrossRef]
- Yang, J.; Huang, X. The 30 m Annual Land Cover Dataset and Its Dynamics in China from 1990 to 2019. Earth Syst. Sci. Data 2021, 13, 3907–3925. [Google Scholar] [CrossRef]
- Xuan, F.; Dong, Y.; Li, J.; Li, X.; Su, W.; Huang, X.; Huang, J.; Xie, Z.; Li, Z.; Liu, H.; et al. Mapping Crop Type in Northeast China during 2013–2021 Using Automatic Sampling and Tile-Based Image Classification. Int. J. Appl. Earth Obs. Geoinf. 2023, 117, 103178. [Google Scholar] [CrossRef]
- Liu, Y.; Xiao, D.; Yang, W. An Algorithm for Early Rice Area Mapping from Satellite Remote Sensing Data in Southwestern Guangdong in China Based on Feature Optimization and Random Forest. Ecol. Inform. 2022, 72, 101853. [Google Scholar] [CrossRef]


| Vegetation Index | Calculation |
|---|---|
| Normalized Difference Vegetation Index (NDVI) | |
| Land Surface Water Index (LSWI) | |
| Enhanced Vegetation Index (EVI) | |
| Enhanced Vegetation Index2 (EVI2) | |
| Bare Soil Index (BSI) | |
| Green Chlorophyll Vegetation Index (GCVI) | |
| Plant Senescence Reflectance Index (PSRI) | |
| Normalized Difference Water Index (NDWI) | |
| Modified Normalized Difference Water Index (MNDWI) |
| Phenological Stage | Input Features for RF |
|---|---|
| Bare soil period | BSI |
| Transplanting period | LSWI, GCVI, NDWI, MNDWI |
| Growth period | NDVI, EVI, EVI2 |
| Maturity period | PSRI |
| Year | Rice | No Rice | PA (%) | UA (%) | F1 (%) | Kappa (%) | OA (%) | |
|---|---|---|---|---|---|---|---|---|
| 2010 | Rice | 15,316 | 343 | 97.5 | 97.8 | 97.7 | 95.5 | 97.7 |
| No rice | 385 | 16,278 | 97.9 | 97.7 | ||||
| 2011 | Rice | 15,879 | 421 | 97.9 | 97.4 | 97.7 | 95.1 | 97.5 |
| No rice | 342 | 14,358 | 97.2 | 97.7 | ||||
| 2012 | Rice | 13,259 | 349 | 98.2 | 97.4 | 97.8 | 95.3 | 97.7 |
| No rice | 243 | 11,583 | 97.1 | 97.9 | ||||
| 2013 | Rice | 19,542 | 532 | 98.1 | 97.3 | 97.7 | 95.2 | 97.6 |
| No rice | 379 | 17,366 | 97 | 97.9 | ||||
| 2014 | Rice | 13,578 | 337 | 98.1 | 97.6 | 97.9 | 95.3 | 97.7 |
| No rice | 258 | 11,245 | 97.1 | 97.8 | ||||
| 2015 | Rice | 17,246 | 522 | 98.5 | 97.1 | 97.8 | 95.2 | 97.6 |
| No rice | 258 | 14,578 | 96.5 | 98.3 | ||||
| 2016 | Rice | 19,316 | 529 | 98.1 | 97.3 | 97.7 | 95.1 | 97.6 |
| No rice | 379 | 17,245 | 97 | 97.8 | ||||
| 2017 | Rice | 18,659 | 463 | 98.2 | 97.6 | 97.9 | 95.3 | 97.7 |
| No rice | 349 | 15,249 | 97.1 | 97.8 | ||||
| 2018 | Rice | 17,328 | 432 | 97.7 | 97.6 | 97.6 | 95.1 | 97.5 |
| No rice | 403 | 15,843 | 97.3 | 97.5 | ||||
| 2019 | Rice | 22,458 | 543 | 98.3 | 97.6 | 98 | 95.3 | 97.7 |
| No rice | 386 | 16,847 | 96.9 | 97.8 | ||||
| 2020 | Rice | 18,879 | 496 | 98.1 | 97.4 | 97.8 | 95.1 | 97.6 |
| No rice | 358 | 15,462 | 96.9 | 97.7 | ||||
| 2021 | Rice | 21,362 | 506 | 97.9 | 97.7 | 97.8 | 95.1 | 97.6 |
| No rice | 458 | 17,405 | 97.2 | 97.4 | ||||
| 2022 | Rice | 18,724 | 462 | 98.3 | 97.6 | 97.9 | 95.3 | 97.7 |
| No rice | 326 | 14,279 | 96.9 | 97.8 |
Disclaimer/Publisher’s Note: The statements, opinions and data contained in all publications are solely those of the individual author(s) and contributor(s) and not of MDPI and/or the editor(s). MDPI and/or the editor(s) disclaim responsibility for any injury to people or property resulting from any ideas, methods, instructions or products referred to in the content. |
© 2025 by the authors. Licensee MDPI, Basel, Switzerland. This article is an open access article distributed under the terms and conditions of the Creative Commons Attribution (CC BY) license (https://creativecommons.org/licenses/by/4.0/).
Share and Cite
Fan, Y.; Yuan, D.; Zhang, L.; Zhao, M.; Yang, R. A Rice-Mapping Method with Integrated Automatic Generation of Training Samples and Random Forest Classification Using Google Earth Engine. Agronomy 2025, 15, 873. https://doi.org/10.3390/agronomy15040873
Fan Y, Yuan D, Zhang L, Zhao M, Yang R. A Rice-Mapping Method with Integrated Automatic Generation of Training Samples and Random Forest Classification Using Google Earth Engine. Agronomy. 2025; 15(4):873. https://doi.org/10.3390/agronomy15040873
Chicago/Turabian StyleFan, Yuqing, Debao Yuan, Liuya Zhang, Maochen Zhao, and Renxu Yang. 2025. "A Rice-Mapping Method with Integrated Automatic Generation of Training Samples and Random Forest Classification Using Google Earth Engine" Agronomy 15, no. 4: 873. https://doi.org/10.3390/agronomy15040873
APA StyleFan, Y., Yuan, D., Zhang, L., Zhao, M., & Yang, R. (2025). A Rice-Mapping Method with Integrated Automatic Generation of Training Samples and Random Forest Classification Using Google Earth Engine. Agronomy, 15(4), 873. https://doi.org/10.3390/agronomy15040873