Article

Transcriptome Analysis of the Effects of Selenium Form and Concentration on Rice Growth and Metabolism at the Seedling Stage

1
College of Agronomy, Yanbian University, Yanji 133002, China
2
Characteristic Industry Development Center of Yantian, Yanji 133002, China
3
Husbandry Station of Longjing, Longjing 133400, China
*
Authors to whom correspondence should be addressed.
These authors contributed equally to this work.
Agronomy 2025, 15(4), 867; https://doi.org/10.3390/agronomy15040867
Submission received: 16 February 2025 / Revised: 22 March 2025 / Accepted: 26 March 2025 / Published: 30 March 2025
(This article belongs to the Section Plant-Crop Biology and Biochemistry)

Abstract

:
Selenium (Se) is an essential trace element for humans, and the production of Se-enriched rice (Oryza sativa) is a key approach for Se supplementation. Nevertheless, the effects of different Se forms and concentrations on the metabolism and aboveground absorption pathways of rice seedlings are not yet well-understood. Therefore, we conducted a hydroponic experiment and used transcriptome analysis to study the absorption and transformation processes of sodium selenite (Na2SeO3) and selenomethionine (SeMet) in rice at the seedling stage. The aboveground (stem + leaf) Se concentration at the seedling stage was higher under the SeMet treatments, and low Se applications (<25 μM) significantly promoted rice growth. Selenocysteine (SeCys) and SeMet were the primary forms of Se in rice, accounting for 57–86.35% and 7.6–31.5%, respectively, while selenate [Se (VI)] significantly increased when Se levels exceeded 25 μM. In the transcriptome, differentially expressed genes (DEGs) were significantly enriched in the following pathways: carbon metabolism, amino acid biosynthesis, and glutathione metabolism. In the Na2SeO3 treatments, genes encoding phosphoglycerate mutase (PGM), triosephosphate isomerase (TPI), phosphofructokinase (PFK), pyruvate kinase (PK), malate dehydrogenase (MDH), polyamine oxidase (PAO), aspartate aminotransferase (AST), and glutathione S-transferase (GST) were upregulated, and the expression levels of differentially expressed genes (DEGs) decreased with increasing Se levels. SeMet treatments upregulated genes encoding PFK, PK, glutamine synthetase (NADH-GOGAT), and L-ascorbate peroxidase (APX), and expression levels of DEGs increased with increasing Se levels. This study provides important insights into the molecular mechanisms of the uptake and metabolism of different Se forms in rice at the seedling stage.

1. Introduction

Functional agriculture refers to the enrichment of one or more target nutrients in agricultural products, for example, by using soil environments naturally rich in beneficial components or by biofortification [1,2]. Currently, approximately 2 billion people worldwide suffer from one or more micronutrient deficiencies. In particular, selenium (Se) deficiency has become a global health problem that needs to be addressed urgently [3,4]. Rice (Oryza sativa) is one of the most important food crops in China, and its Se content directly affects the Se nutritional status of the majority of the population [5,6,7]. The standard Se content of Se-enriched rice (GH/T1135-2017) in China is 0.10–0.50 mg/kg, while the current average Se content of rice in China is only 0.025 mg/kg [5,8]. With an average daily intake of 400 g of rice per person, the Se intake from rice is only 10 μg/day, which is far below the recommended Se intake of 60 μg/day. Therefore, research is needed to improve the Se biofortification capacity of rice and regulate the Se content in rice within a reasonable range [9,10].
The addition of Se at appropriate concentrations has various beneficial effects on plants, including an increased yield [11,12], enhanced antioxidant capacity [13], improved photosynthesis [1], and reduced heavy metal toxicity [14]. However, excessive Se can be toxic to plants [15]. Strategically regulating Se in plants can be beneficial for both plant growth and human health. Consuming Se-rich plant-based foods is considered the most effective way to increase human Se intake. The application of Se fertilizer to soil is the most practical and commonly used method for producing Se-enriched agricultural products [16,17].
To develop Se biofortification strategies, it is crucial that we understand the processes and mechanisms involved in plant Se uptake and metabolism [18]. The absorption and accumulation of Se in plants depend on the quantity and availability of Se in the soil, and also on the chemical form of Se and the crop species [2,19]. The application of Se fertilizer directly affects the concentration and bioavailability of Se in the soil [20]. Se exists in the soil in organic and inorganic forms, with inorganic selenite being the dominant form [18,21]. The absorption of selenite by plants was initially thought to occur via passive proliferation [22]. However, recent studies have revealed that the absorption of selenite is an energy-driven active process, as the addition of energy metabolism inhibitors can inhibit selenite uptake [23]. Other studies have shown that selenite is primarily absorbed by plants through phosphate transporters [16], and reducing the phosphate fertilizer addition can significantly enhance the uptake of selenite by plants. Zhang et al. (2014) first discovered that the overexpression of the phosphate transporter gene OsPT2 significantly increased the uptake of selenite by rice roots [24]. Therefore, selenite and phosphate share the same protein channel, and there is a competitive relationship between their absorption. The metabolic pathway of selenite in plants is not yet fully understood but is likely similar to that of selenate, with the key difference being that selenite, after entering the plant cell via phosphate transporters, undergoes a series of processes for absorption and transport. Organic forms of Se (selenocysteine [SeCys] and selenomethionine [SeMet]) are also important components of bioavailable Se in the soil. These forms are safer for plants, can be directly utilized by them, and are easily absorbed by roots and translocated upwards [2]. However, compared to inorganic Se forms, there is limited research on the absorption mechanisms of organic Se forms.
In recent years, transcriptome analyses have been widely applied to study the effects of Se on plants. For example, transcriptomics was used to systematically analyze the processes of Se absorption, transport, and metabolism in plants [25]. Moreover, high Se stress affects ion absorption and transport in soybean (Glycine max) plants, influencing the expression of genes associated with antioxidant enzymes, ion transporters, and hormones [26]. A transcriptome analysis of celery (Apium graveolens) showed that high Se treatment downregulated AUX1, TIR1, and ARF in the auxin pathway, as well as PP2C and ABF in the abscisic acid (ABA) pathway [27]. Moreover, a combined transcriptome and metabolome analysis of apple (Malus pumila) revealed that high Se treatment stimulates amino acid biosynthesis, accumulating large amounts of amino acids and organic acids to alleviate Se stress [28]. In mustard (Brassica spp.), Se is converted into SeMet, SeCys, methyl selenocysteine (MeSeCys), and selenoproteins through the action of proteins such as APS, APR, and SEP1, and is stored in the plant leaves [29]. A transcriptome analysis of a mushroom (Pleurotus citrinopileatus) showed that Se treatment affects 20 metabolic pathways, including carbon metabolism and amino acid biosynthesis, and stimulates the production of phenolic compounds [19].
Currently, research on Se-enriched rice has mainly focused on Se detoxification mechanisms. There is limited research on Se metabolism processes and mechanisms in rice. Furthermore, most studies analyze rice plants after the tillering stage and are conducted in soil culture experiments. Therefore, we employed transcriptome sequencing to study Se in rice seedlings. We grew seedlings using hydroponics, allowing more control over Se conditions. Specifically, the objectives were as follows: (1) to investigate the effects of different forms of Se, namely, Na2SeO3 and SeMet, at varying concentrations on rice seedling physiology, phenotype, Se concentration, and Se speciation; (2) to determine genes responding to Se treatment and explore the molecular mechanisms by which different forms of Se influence the metabolism of Se in rice seedlings; and (3) to determine the optimal Se dosage for application during the seedling stage to promote rice growth. Our results provide a theoretical basis for understanding the dynamic behavior of Se during the rice seedling stage and the molecular mechanisms underlying Se accumulation.

2. Materials and Methods

2.1. Experimental Design and Experimental Materials

This study used Jihong No. 6, a commonly cultivated rice variety in Jilin Province, which has a high genetic stability. Seeds were provided by the College of Agriculture at Yanbian University. Jihong No. 6 was developed using Jiyu Jing as the maternal parent and Jiuyin No. 1 as the paternal parent through pedigree breeding methods.
After the seeds are washed with tap water for 24 h, the seeds were immersed in 70% ethanol for 1 min in a sterile laminar flow hood. Non-disinfected seeds served as the control, and the seeds were disinfected using various methods: a: 10% H2O2 for 35 min; b: 2% NaClO for 35 min; c: 0.5% HgCl2 for 35 min; d: 0.1% HgCl2:2% NaClO (v:v, 1:1) for 35 min; e: 0.1% HgCl2:2% NaClO (v:v, 6:4) for 35 min; and f: 0.1% HgCl2:2% NaClO (v:v, 7:3) for 35 min. After each treatment, the seeds were rinsed 4–5 times with sterile water and then inoculated onto MS medium (30 g/L sucrose, 12.5 g/L agar, and pH 5.9), with 50 mL of Hoagland’s nutrient solution per liter of MS medium. Two hundred seeds were inoculated for each treatment, and the experiment was repeated three times. The plants were cultured under a 16 h light/8 h dark cycle at 25 °C for 21 days. A blank control was also set up. After measuring the germination rate and contamination rate, it was found that the best disinfectant treatment was 0.1% HgCl2:2% NaClO (v:v, 6:4). This method was selected for seed treatment in subsequent experiments.
Seven treatments were established based on the Se concentration in the medium: 0 (control), 5, 10, 15, 20, 25, and 30 μM. SeMet (196.11 g/mol) and Na2SeO3 (172.93 g/mol) were used as Se sources. The Na2SeO3 concentrations added to the medium were 0.9, 1.8, 2.7, 3.6, 4.5, and 5.4 mg/L and the SeMet concentrations added to the medium were 1, 2, 3, 4, 5, and 6 mg/L, resulting in a total of 13 treatment groups (six for each Se source and a common control). Seedling tissue was cultured, with 20 bottles per treatment and 20 seeds per bottle. The experiment was repeated three times, and the plants were cultured under a 16 h light/8 h dark cycle at 25 °C.
After collecting rice samples at the two-leaf one-heart, three-leaf one-heart, and four-leaf one-heart stages and measuring growth parameters, biomass, Se content, and Se speciation, we found that all indicators reached their highest values at the four-leaf one-heart stage. Among them, significant differences were observed among the control (A), 5 μM Na2SeO3 treatment (B), 25 μΜ Na2SeO3 treatment (C), 5 μM SeMet treatment (D), and 20 μM SeMet treatment (E). Therefore, samples from these five treatments at the four-leaf one-heart stage were analyzed further. After repeatedly rinsing the samples with deionized water, three replications were cryopreserved with liquid nitrogen for transcriptome sequencing.

2.2. Determination of Contamination and Germination Rates

During the experimental period, the number of germinated seeds and the incidence of contamination were recorded daily for 7 days. Seeds showing fungal mycelium or fungal growth around the seed were considered contaminated. The remaining uncontaminated seeds were transferred to new media for continued observation. Germination was considered to have occurred when the radicle exceeded 0.2 cm in length. The formulae for calculating the contamination rate and germination rate are as follows:
C o n t a m i n a t i o n   r a t e   ( % ) = N u m b e r   o f   c o n t a m i n a t e d   s e e d s T o t a l   n u m b e r   o f   i n o c u l a t e d   s e e d s × 100
G e r m i n a t i o n   R a t e   ( % ) = n N × 100
Note: n is the total number of germinated seeds, and N is the total number of inoculated seeds.

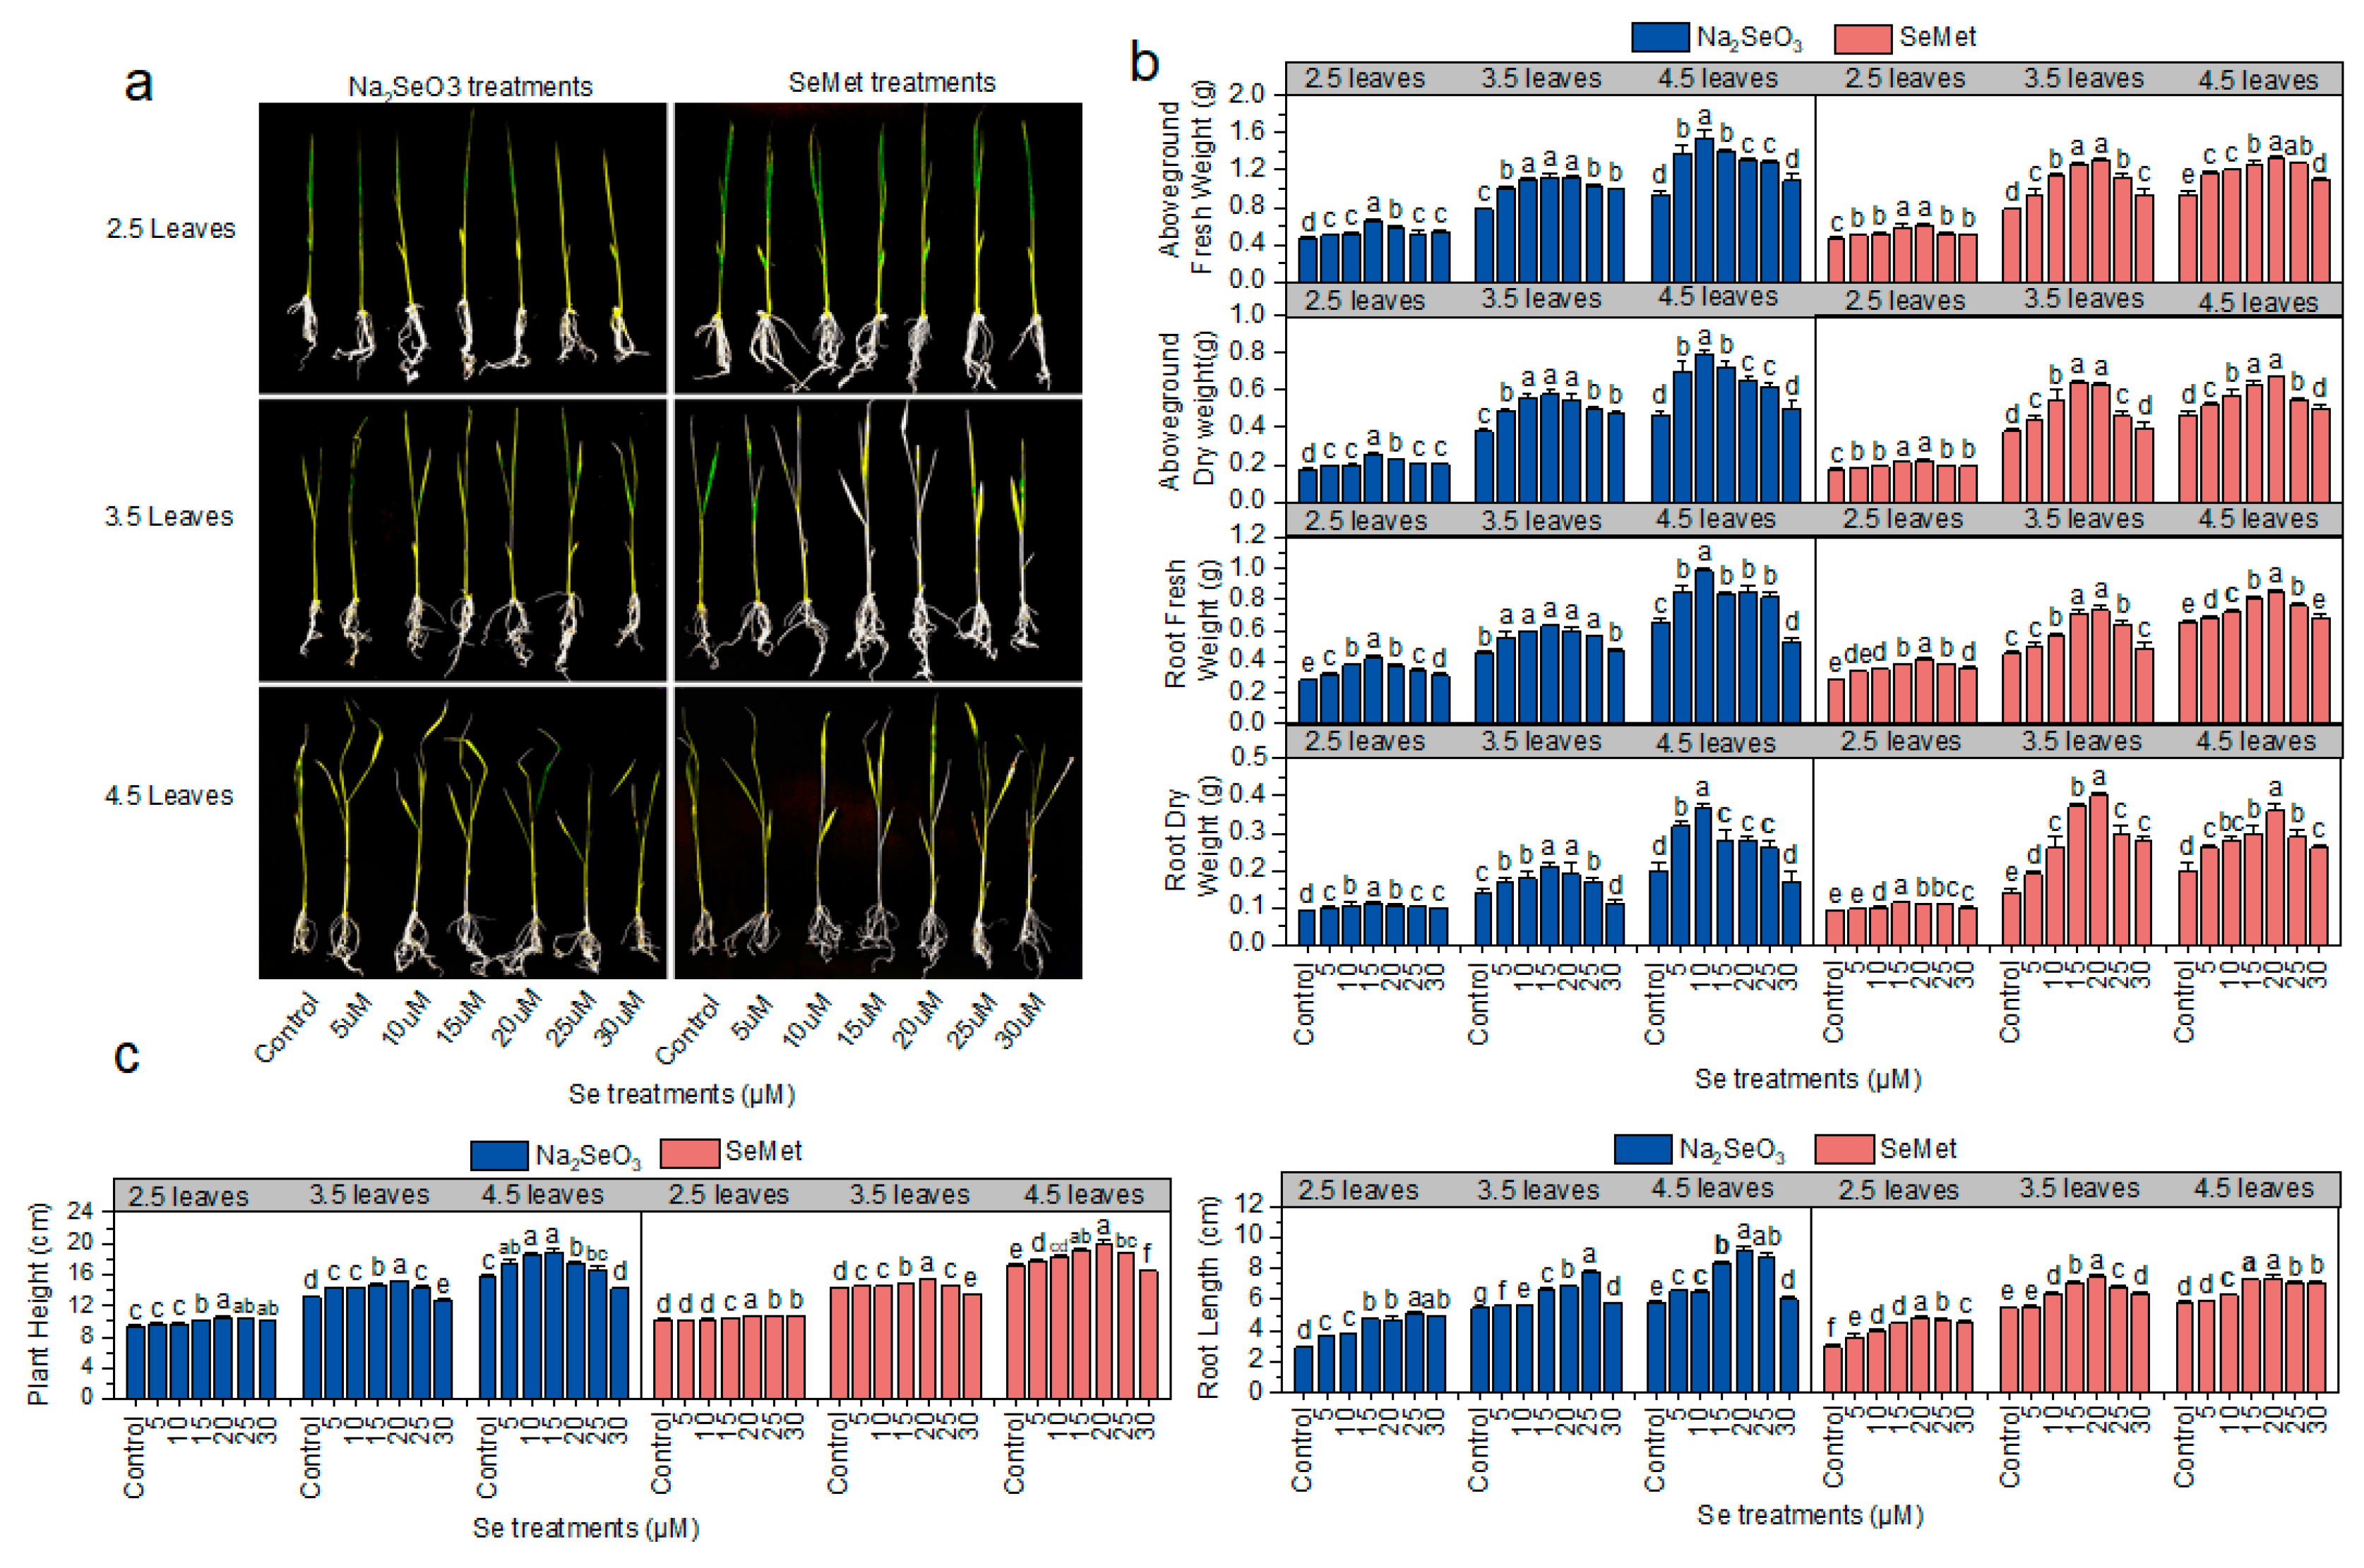
2.3. Plant Biomass and Growth Parameters

Six plants were randomly selected from each treatment group. The plants were washed with distilled water to remove contaminants, and excess water was blotted off using absorbent paper. The plants were then separated into roots and aboveground parts. Root length was measured using the root scanner WinRHIZO Tron MF (STD4800, Regent Instruments Inc., Québec City, QC, Canada) in conjunction with the root analysis software WinRHIZO (Version 2019a, Regent Instruments Inc., Québec City, QC, Canada), while shoot height was measured using a ruler. All plant parts were weighed for fresh weight and then transferred to a drying oven. The samples were initially dried at 105 °C for 30 min to inactivate enzymes, followed by drying at 75 °C for 48 h until a constant weight was achieved. The dry weight of each plant part was then recorded. After crushing the aboveground parts, they were passed through a 100 mm mesh sieve for subsequent Se content determination.

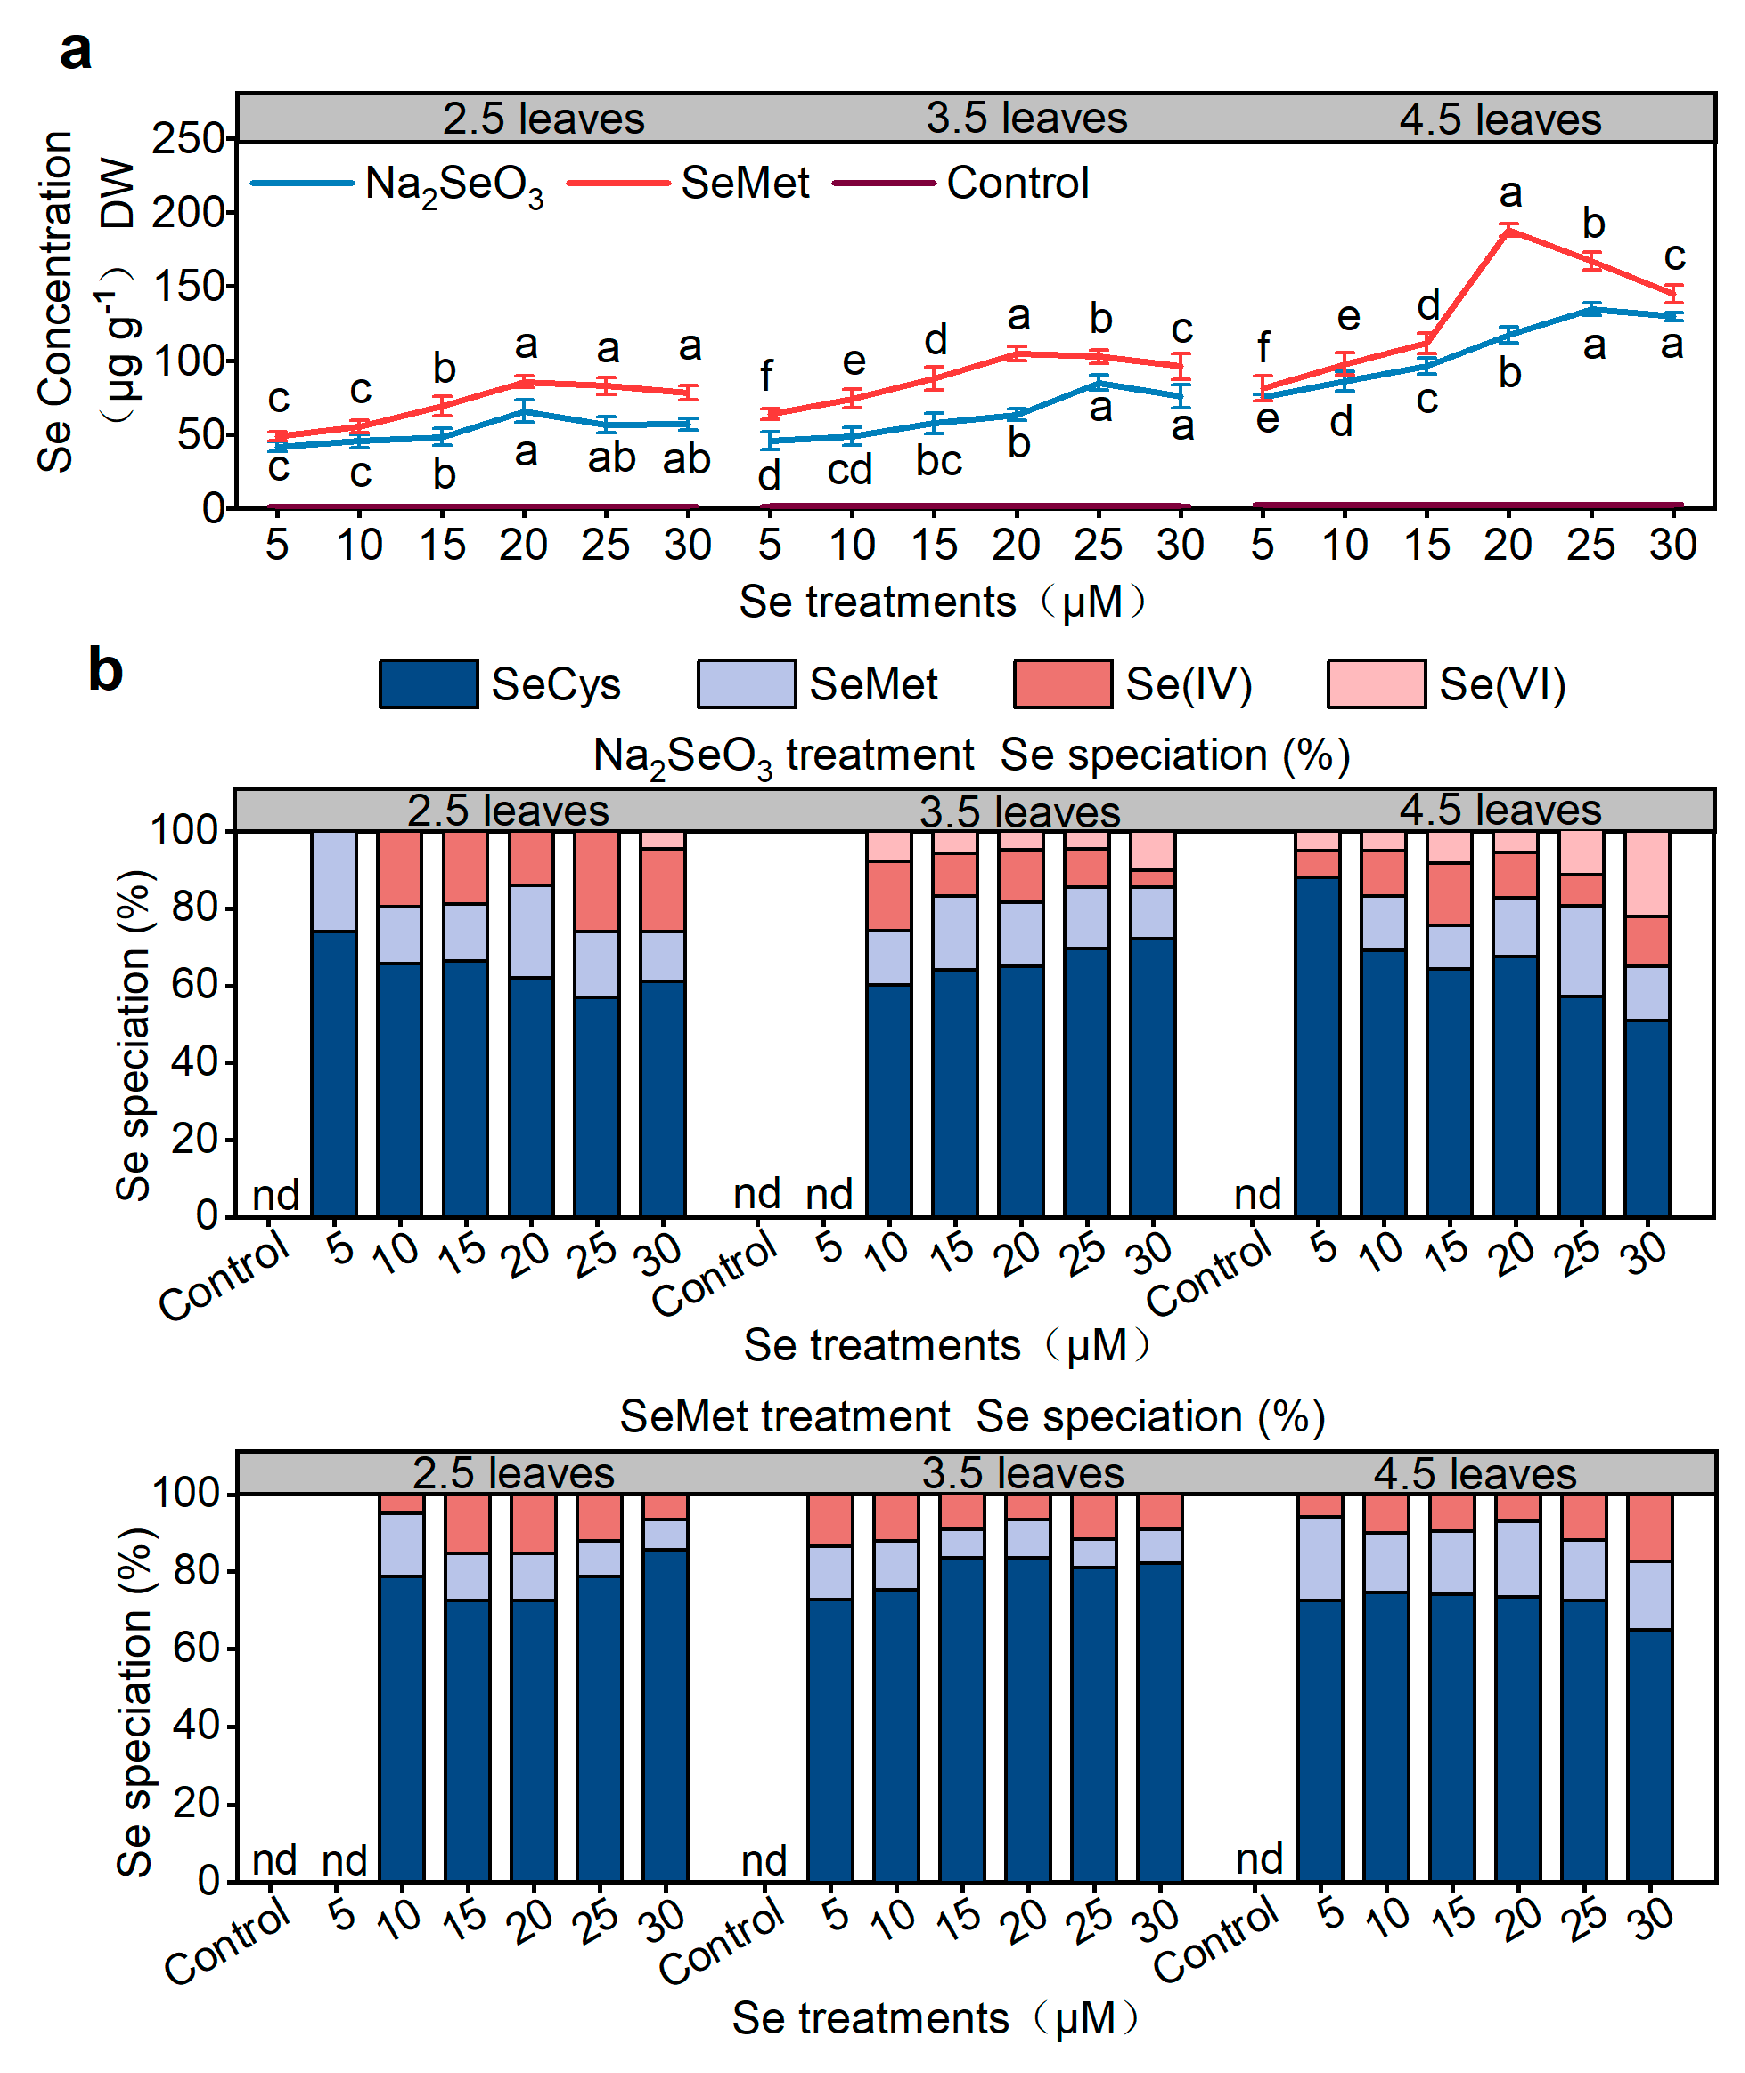
2.4. Determination of Se Concentration in Rice

One gram of solid plant sample was placed in a conical flask, to which 10 mL of a nitric acid (15.56 mol/L)–perchloric acid (12.44 mol/L) mixture (9:1, v/v) and some glass beads were added. The flask was covered with a glass sheet overnight. The following day, the mixture was heated on a 180 °C hot plate (EH20A Plus, Labtech, CA, USA), with additional nitric acid added as necessary, until the solution became clear and the residual volume was approximately 2 mL. After cooling, 5 mL of hydrochloric acid (6 mol/L) was added, and the mixture was further heated until the solution became clear and colorless, with white fumes appearing. After cooling, 2.5 mL of potassium ferrocyanide solution (100 g/L) was added, and the solution was diluted to approximately 10 mL with deionized water. The solution was then analyzed using an atomic fluorescence spectrophotometer (RGF-6800, Bohui Co., Beijing, China).

2.5. Determination of Se Species in Rice

The determination of Se species in plants was performed according to the method of Han [30]. Briefly, a 1 g fresh plant sample was ground in liquid nitrogen and transferred to a centrifuge tube, to which 10 mL of methanol–water (1:2, v/v) was added. After centrifuging at 5000 rpm for 15 min, the supernatant was collected. Methanol was removed from the sample using a rotary evaporator and the liquid volume was adjusted to 10 mL with deionized water. The solution was filtered through a 0.22 μm membrane and stored at 4 °C for the Se speciation assay.
The atomic fluorescence speciation analyzer (SA-10) and atomic fluorescence spectrometer (AFS-8220) of Beijing Titan Instruments Co., Ltd. (Beijing, China) and Shimadzu HPLC (Shimadzu Corporation, Kyoto, Japan) were used to determine Se speciation. The working conditions were as follows: oxidizing agent, 0.3% KI (m/v); carrier solution, 10% HCl (v/v); reducing agents, 2.0% KBH4 (m/v) + 0.5% KOH (m/v); and mobile phase for HPLC, 60 mmol L−1 (NH4)2HPO4 (pH 6.0, 1.0 mL min−1). The working AFS conditions were as follows: Se hollow cathode lamp current (general research institute for nonferrous metals, Beijing, China), 50 mA; negative high voltage of the photomultiplier tube, 270 V; flow rate of the carrier gas, 400 mL min−1; and flow rate of makeup gas, 600 mL min−1.
The Se standard material of SeMet (Sigma, St. Louis, MO, USA), SeCys (Sigma, USA), selenite radicals (GBW10032, 42.9 μg g−1 Se, National Institute of Metrology P.R., Beijing, China, NIM), and selenate radicals (GBW10033, 41.5 μg g−1 Se, P.R., Beijing, China, NIM) were used to prepare the Se species standard solutions.
Se standard solutions prepared from SeMet, selenite radicals, and selenate radicals were tested, and chromatographic analysis clearly revealed four Se species (Figure S1). The four Se species standard solutions were accurately added to Se-enriched rice samples, and the samples were extracted with methanol–water (1:2, v/v) to determine their recovery rates. The recovery rates for the four Se species ranged from 92.75% to 99.7%, indicating the feasibility of the method.

2.6. Transcriptome Sequencing and Analysis

RNA was extracted using the RNA prep Pure Plant Kit (Tiangen, Beijing, China) from three replicate samples of five experimental treatments: Control (A), 5 μM Na2SeO3 (B), 25 μM Na2SeO3 (C), 5 μM SeMet (D), and 20 μM SeMet (E). RNA concentration and purity were measured using a NanoDrop 2000 (Thermo Fisher Scientific, Wilmington, DE, USA). RNA integrity was assessed using the RNA Nano 6000 Kit on an Agilent Bioanalyzer 2100 system (Agilent Technologies, Santa Clara, CA, USA). The sequencing library was prepared using the Hieff NGS Ultima Dual-mode mRNA Library Prep Kit for Illumina (Yeasen Biotechnology (Shanghai) Co., Ltd., Shanghai, China), and libraries were sequenced on an Illumina NovaSeq platform to generate 150 bp paired-end reads. The raw data have been uploaded to NCBI under the accession number PRJNA1223382.
Sequencing work was carried out by Biomarker Technologies (Qingdao, China). The raw reads were further processed using the bioinformatics pipeline online platform BMKCloud, URL: www.biocloud.net (accessed on 12 December 2024). The raw sequencing data were filtered to generate clean data for high-quality analysis. HISAT2 v2.0.4 was used to align the clean data with the reference rice genome (MSU_v7.0) [31]. For gene expression analysis, HTSeq (version 0.9.1) was used to statistically compare the read count values for each gene with the raw gene expression levels. Differential gene expression analysis was conducted using DESeq2, with the following criteria for selecting DEGs: fold change >1 or <−1, p-value and FDR < 0.05. For functional annotation, BLASTx was used to search all assembled transcripts in the NCBI non-redundant protein (Nr), Clusters of Orthologous Groups of proteins (COG), Gene Ontology (GO), and Kyoto Encyclopedia of Genes and Genomes (KEGG) databases to retrieve their functional annotations. GO enrichment analysis of the DEGs was implemented using the clusterProfiler package based on the Wallenius non-central hyper-geometric distribution, using the KOBAS database and clusterProfiler software (Version 4.0) to test the statistical enrichment of differentially expressed genes in KEGG pathways. The screening criteria for GO and KEGG was p-value < 0.05.

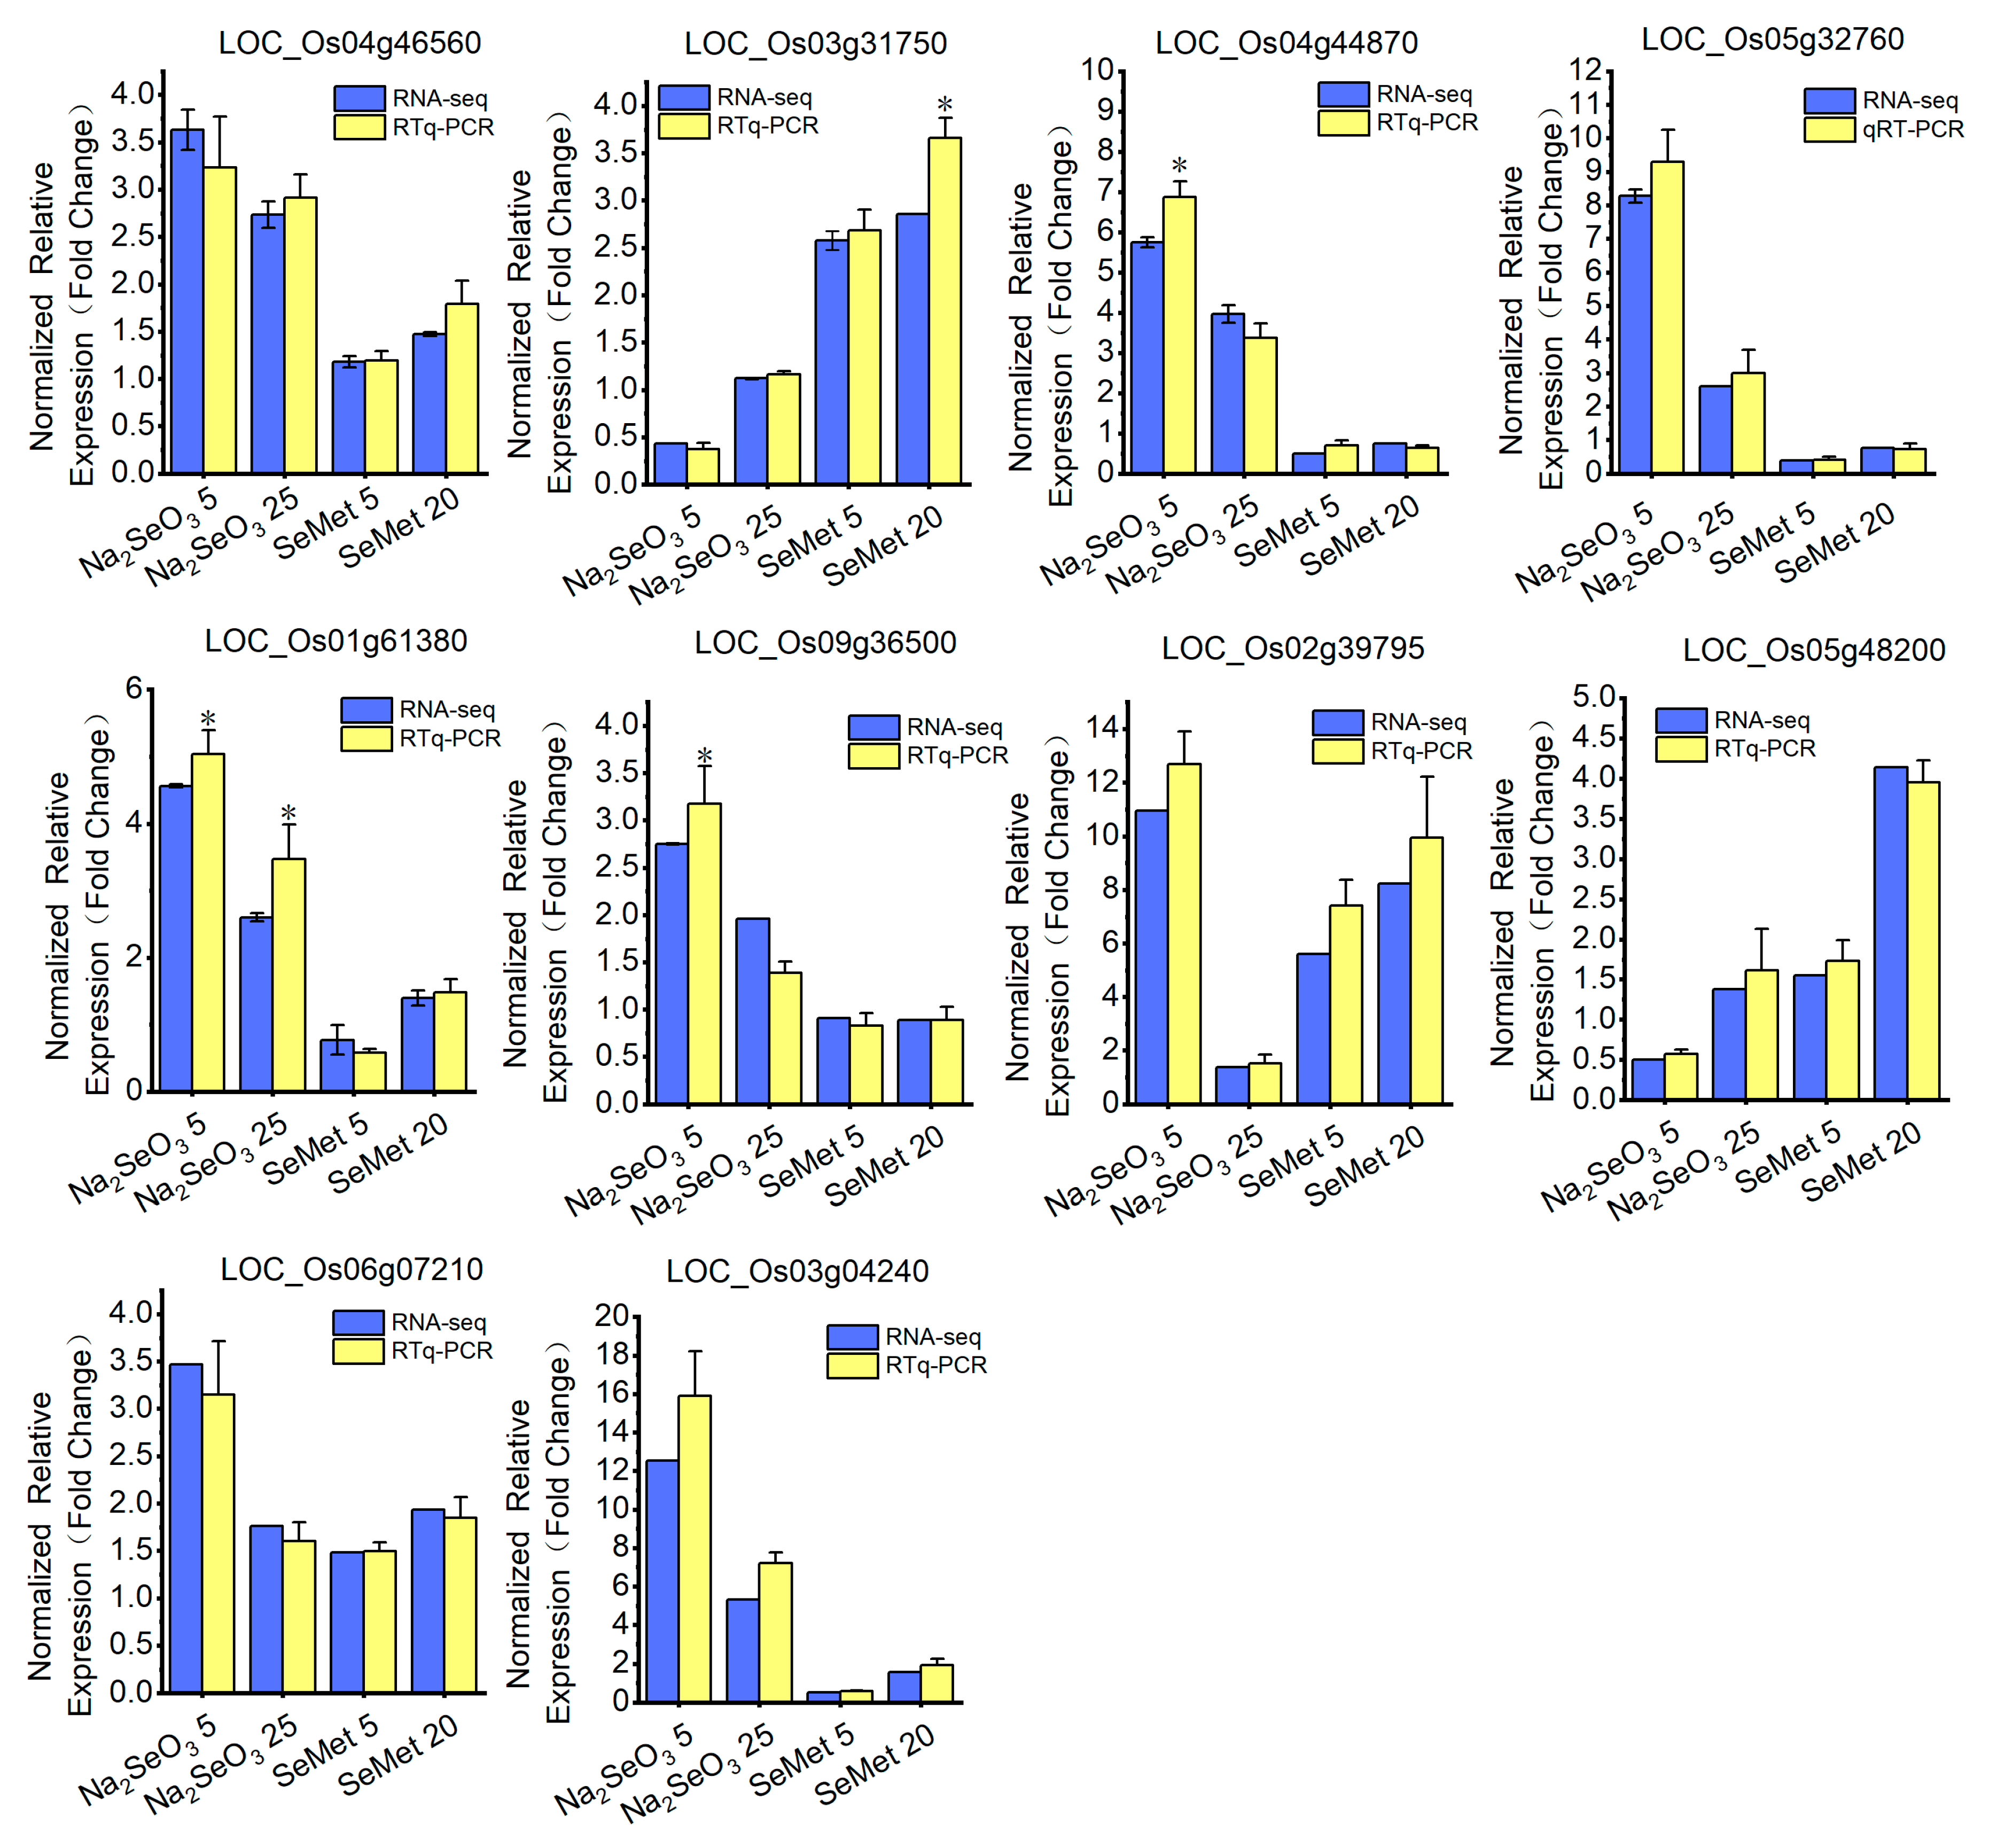
2.7. Validation of RNA-seq by RT-qPCR

RNA was isolated from the control (A), 5 μM Na2SeO3 (B), 25 μM Na2SeO3 (C), 5 μM SeMet (D), and 20 μM SeMet (E) treatments using the MolPure® Plant RNA Kit (Yeasen, Shanghai, China). DNaseI (Yeasen, Shanghai, China) was used to remove DNA contamination. Subsequently, cDNA was synthesized using the Hifair® II 1st Strand cDNA Synthesis Kit (Yeasen, Shanghai, China). qPCR was performed using the ABI 7500 fluorescence quantitative PCR system (Applied Biosystems, Carlsbad, CA, USA). The 20 µL qPCR mixture consisted of 8 µL deionized water, 10 µL Hieff UNICON® Universal Blue qPCR SYBR Green Premix (Yeasen, Shanghai, China), 0.5 µL forward primer, 0.5 µL reverse primer, and 1 µL cDNA. The relative expression of the genes was calculated using the 2–ΔΔCt method [32]. OsACTIN (Os04g0177600) was used as an internal reference [33]. The qPCR program included an initial step at 95 °C for 30 s, followed by 60 s at 58 °C, and, finally, 30 s at 72 °C. The primers for qPCR are listed in Table S1. The correlations between the expression values obtained from RT-qPCR and the FPKM values from RNA-seq for each gene were analyzed using the Pearson correlation coefficients (Table S2) [34].

2.8. Statistical Analysis

Analysis of variance was conducted using SPSS Statistics software (version 19.0, SPSS, Chicago, IL, USA). The differences between means were compared using the LSD test with a p-value of 0.05 (SPSS 19.0). Graphs were created using Origin 2021 software and Adobe Illustrator 2021.

3. Results

3.1. Screening of Seed Disinfection Methods for Hydroponic Experiments

We investigated the effects of different disinfection methods on the germination rate and contamination rate of rice seedlings (Table 1). Among the seven treatments, treatment e [0.1% HgCl2:2% NaClO (v:v, 6:4) for 35 min] performed the best, with a germination rate of 93.65% and a contamination rate of 5.5%. This disinfection method was chosen for subsequent experiments. As the proportion of HgCl2 increased, the contamination rate of the seeds decreased but the germination rate also decreased, indicating that a high concentration of HgCl2 may damage the seed structure and thus be detrimental to seed germination (Table 1).

3.2. Effects of Different Se Application Rates on Rice Growth

To investigate the effects of different types of Se at varying concentrations on rice growth and development at different stages, we recorded the plant height, root length, aboveground (stem + leaf) dry and fresh weight, and root dry and fresh weight of rice seedlings under Na2SeO3 and SeMet treatments at different stages. Se treatments significantly enhanced the growth and biomass of rice compared with the control (Figure 1b,c). The best performance was observed at Se concentrations of 15–25 µM. At 15 µM Na2SeO3, the plant height and aboveground fresh weight were 20.3% and 49.4% higher than the control group, respectively. At 20 µM SeMet, the plant height and root length were 15.9% and 27.2% higher than the control, and the aboveground dry and fresh weight and root dry and fresh weight increased by 41.9%, 17.02%, 30.7%, and 45%, respectively (Figure 1b,c). Root development was better under Na2SeO3 treatment than under SeMet treatment, but there was no significant difference between treatments in plant height. When Se was ≥25 µM, seedling growth decreased and the leaves began to yellow and wilt (Figure 1a). This suggests that high Se concentrations may affect photosynthesis in plants, inhibiting plant growth. It was found that Se application at concentrations ≤25 µM promoted rice growth.

3.3. Effects of Different Forms of Se on Se Concentration and Speciation in Rice

The seedling Se concentration first increased, then decreased with an increasing Se application rate. The aboveground Se concentration was highest at the four-leaf stage, and the total seedling Se concentration under the SeMet treatment was higher than that under the Na2SeO3 treatment (Figure 2a), indicating that seedlings more effectively absorbed SeMet than Na2SeO3. The highest Se concentrations occurred at the four-leaf stage under 25 µM Na2SeO3 (134.49 µg g−1) and 20 µM SeMet (188.06 µg g−1). The results indicate that the optimal Se dosage for biological fortification during the rice seedling stage is between 20 and 25 μM.
The Se species (Se (IV), Se (VI), SeMet, and SeCys) in seedlings were quantified. SeCys was the dominant Se form in seedlings, accounting for 57–86.35%, followed by SeMet, which accounted for 7.6–31.5%. The accumulation of Se (IV) ranged from 5.4% to 22.7%. Se (IV) accounted for 0–19.6% under Na2SeO3 treatments. Se (VI) was not detected under SeMet treatments (Figure 2b). Interestingly, as the Se concentration increased, the percentages of SeMet and SeCys gradually decreased, while the percentages of Se (IV) and Se (VI) gradually increased. At the 2.5-leaf stage, Se (VI) was detected only under high Se application rates (Se > 25 µM). At the 3.5- and 4.5-leaf stages, high Se application rates led to an increase in the percentages of Se (IV) and Se (VI) but a decrease in plant height and biomass (Figure 1b,c), suggesting again that high levels of Se are detrimental to the growth and development of rice.

3.4. Transcriptome Analysis

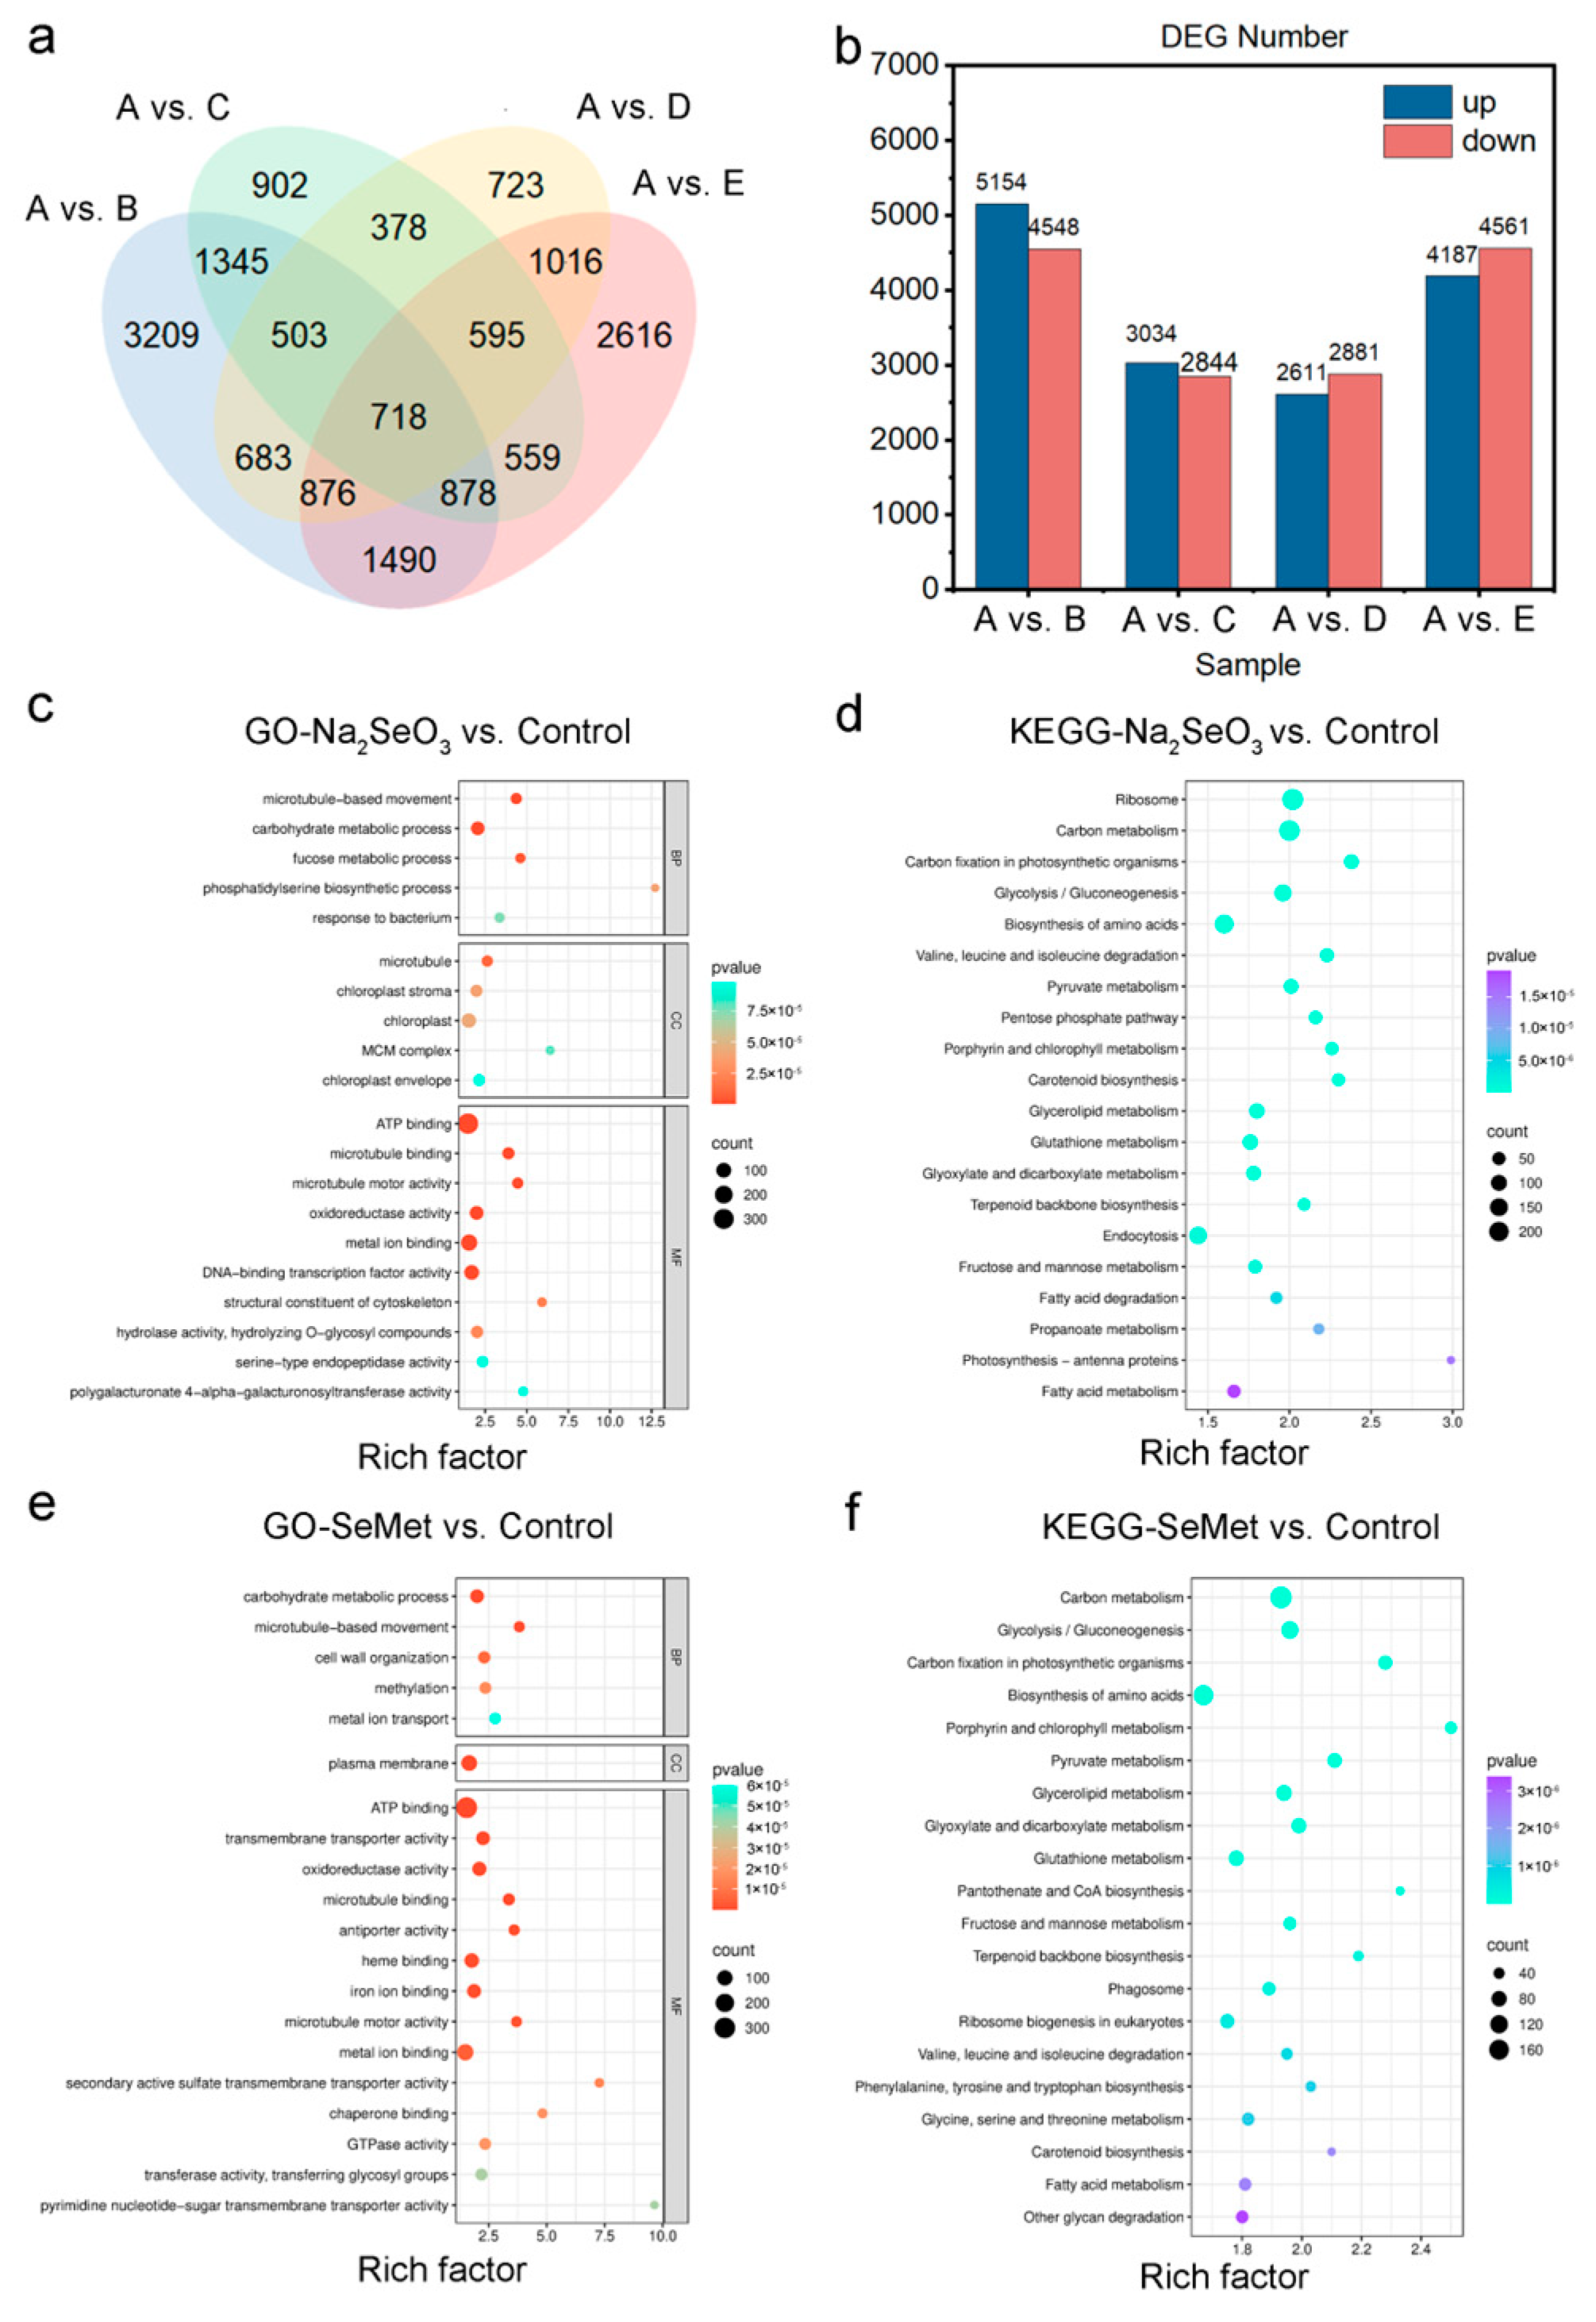
3.4.1. Transcriptome Sequencing and Differentially Expressed Gene (DEG) Identification

The Se treatments significantly affected seedling growth, Se content, and Se species, in particular, 20 µM SeMet and 25 µM Na2SeO3. Based on these results, we selected the following treatments for transcriptome sequencing to determine the changes in gene expression in aboveground tissue: control (A), low Se treatments [5 µM Na2SeO3 (B) and 5 µM SeMet (D)], and high Se treatments [25 µM Na2SeO3 (C) and 20 µM SeMet (E)]. After the quality control of sequencing, 90.25 Gb of clean data were obtained, with each cDNA library having a quality of over 90%. The Q20 base percentage for each sample was >98.44%, and the Q30 base percentage was >95.25%. The GC base content ranged between 51% and 53%, indicating a balanced base composition and good sample quality (Table S3). At least 96.08% of the clean reads aligned well with the reference genome, and the unique alignment rate with the reference genome was between 93% and 95%, confirming the applicability of the selected reference genome (Table S4). The principal component analysis (PCA) showed significant differences between the treatment groups (Figure S2). Figure S3 presents detailed annotation information for homologous protein clusters from the Cluster of Orthologous Groups (COG) database. Figure S4a presents FPKM data as a box plot, and the similar heights of the boxes indicates a uniform data distribution and consistent expression. A correlation heatmap is presented in Figure S4b, showing that the correlation coefficients of the three treatment groups were all >0.7.

3.4.2. GO Enrichment and KEGG Pathway Analysis

Pairwise comparisons were performed using fold change >1 or <−1 and p-value < 0.05 as selection criteria to identify DEGs in the four treatment groups. The Venn diagram revealed 3444 common DEGs in the Na2SeO3 treatments (A vs. B and A vs. C), 3205 common DEGs in the SeMet comparisons (A vs. D and A vs. E), and 718 DEGs commonly present in all four treatments (Figure 3a). A total of 9702 (5154 upregulated and 4548 downregulated), 5878 (3034 upregulated and 2844 downregulated), 5492 (2611 upregulated and 2881 downregulated), and 8748 (4187 upregulated and 4561 downregulated) DEGs were identified in the pairwise comparisons A vs. B, A vs. C, A vs. D, and A vs. E, respectively (Figure 3b).
The common DEGs were subjected to Gene Ontology (GO) and (KEGG) enrichment analyses using a screening threshold of p-value < 0.05. For the GO enrichment analysis, the top 20 pathways in molecular function, cell composition, and biological function were screened out according to the q-value. For the KEGG enrichment analysis, the top 20 pathways were screened out if the q-value was less than 0.05. The analysis was performed on the 3444 common DEGs between A vs. B and A vs. C, as well as the 3205 common DEGs between A vs. D and A vs. E. The results demonstrated that 2622 and 3041 DEGs from the Na2SeO3 comparisons were enriched in the GO and KEGG databases, respectively. Similarly, 2385 and 2874 common DEGs from the SeMet comparisons were enriched in the GO and KEGG databases, respectively. Na2SeO3 DEGs were highly enriched in GO pathways related to ATP binding, metal ion binding, DNA binding, transcription factor activity, and hydrolase activity. These DEGs are mainly related to cytoplasm and chloroplast regulation, microtubule movement, and carbohydrate metabolism (Figure 3c). KEGG analysis showed that Na2SeO3 DEGs were highly enriched in pathways related to the ribosome, carbon metabolism, glutathione metabolism, amino acid biosynthesis, and carbon fixation in photosynthetic organisms (Figure 3d). SeMet DEGs were highly enriched in GO pathways related to ATP binding, metal ion binding, oxidoreductase activity, and vascular movement activity. These DEGs are mainly related to plasma membrane regulation and carbohydrate metabolism (Figure 3e). A KEGG analysis revealed that SeMet DEGs were highly enriched in pathways related to the ribosome, glycerolipid metabolism, glutathione metabolism, and amino acid biosynthesis (Figure 3f).

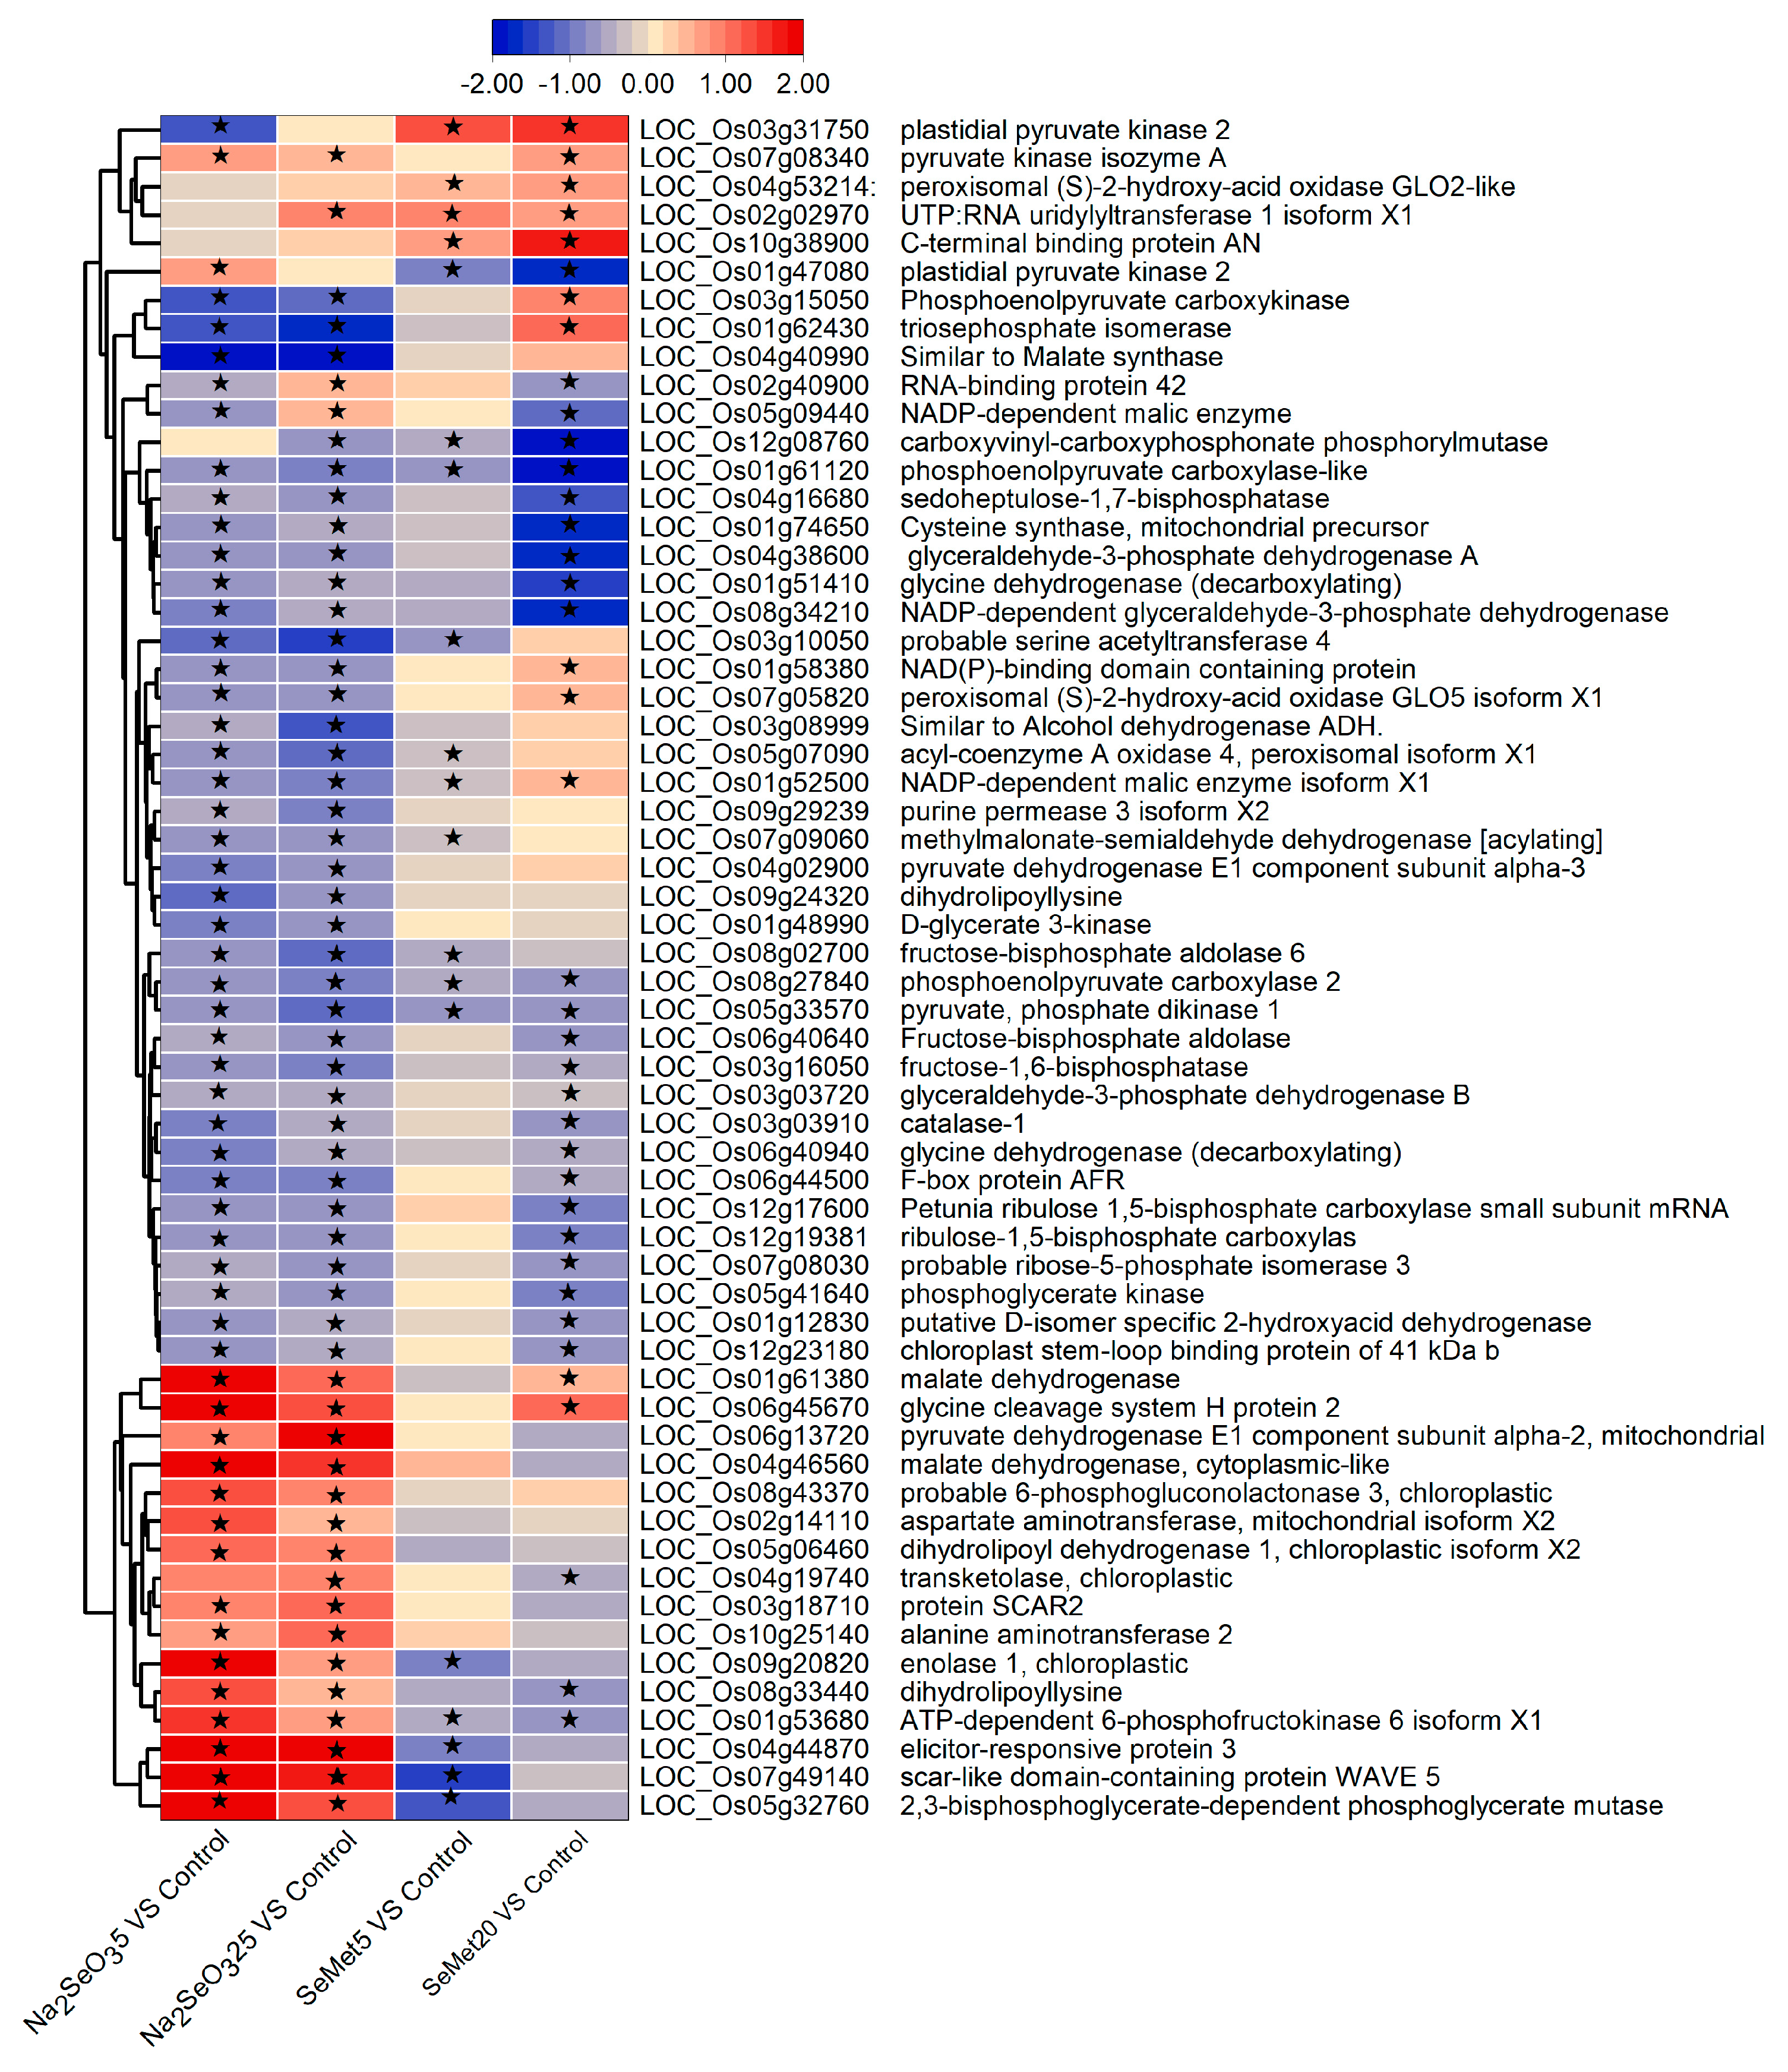
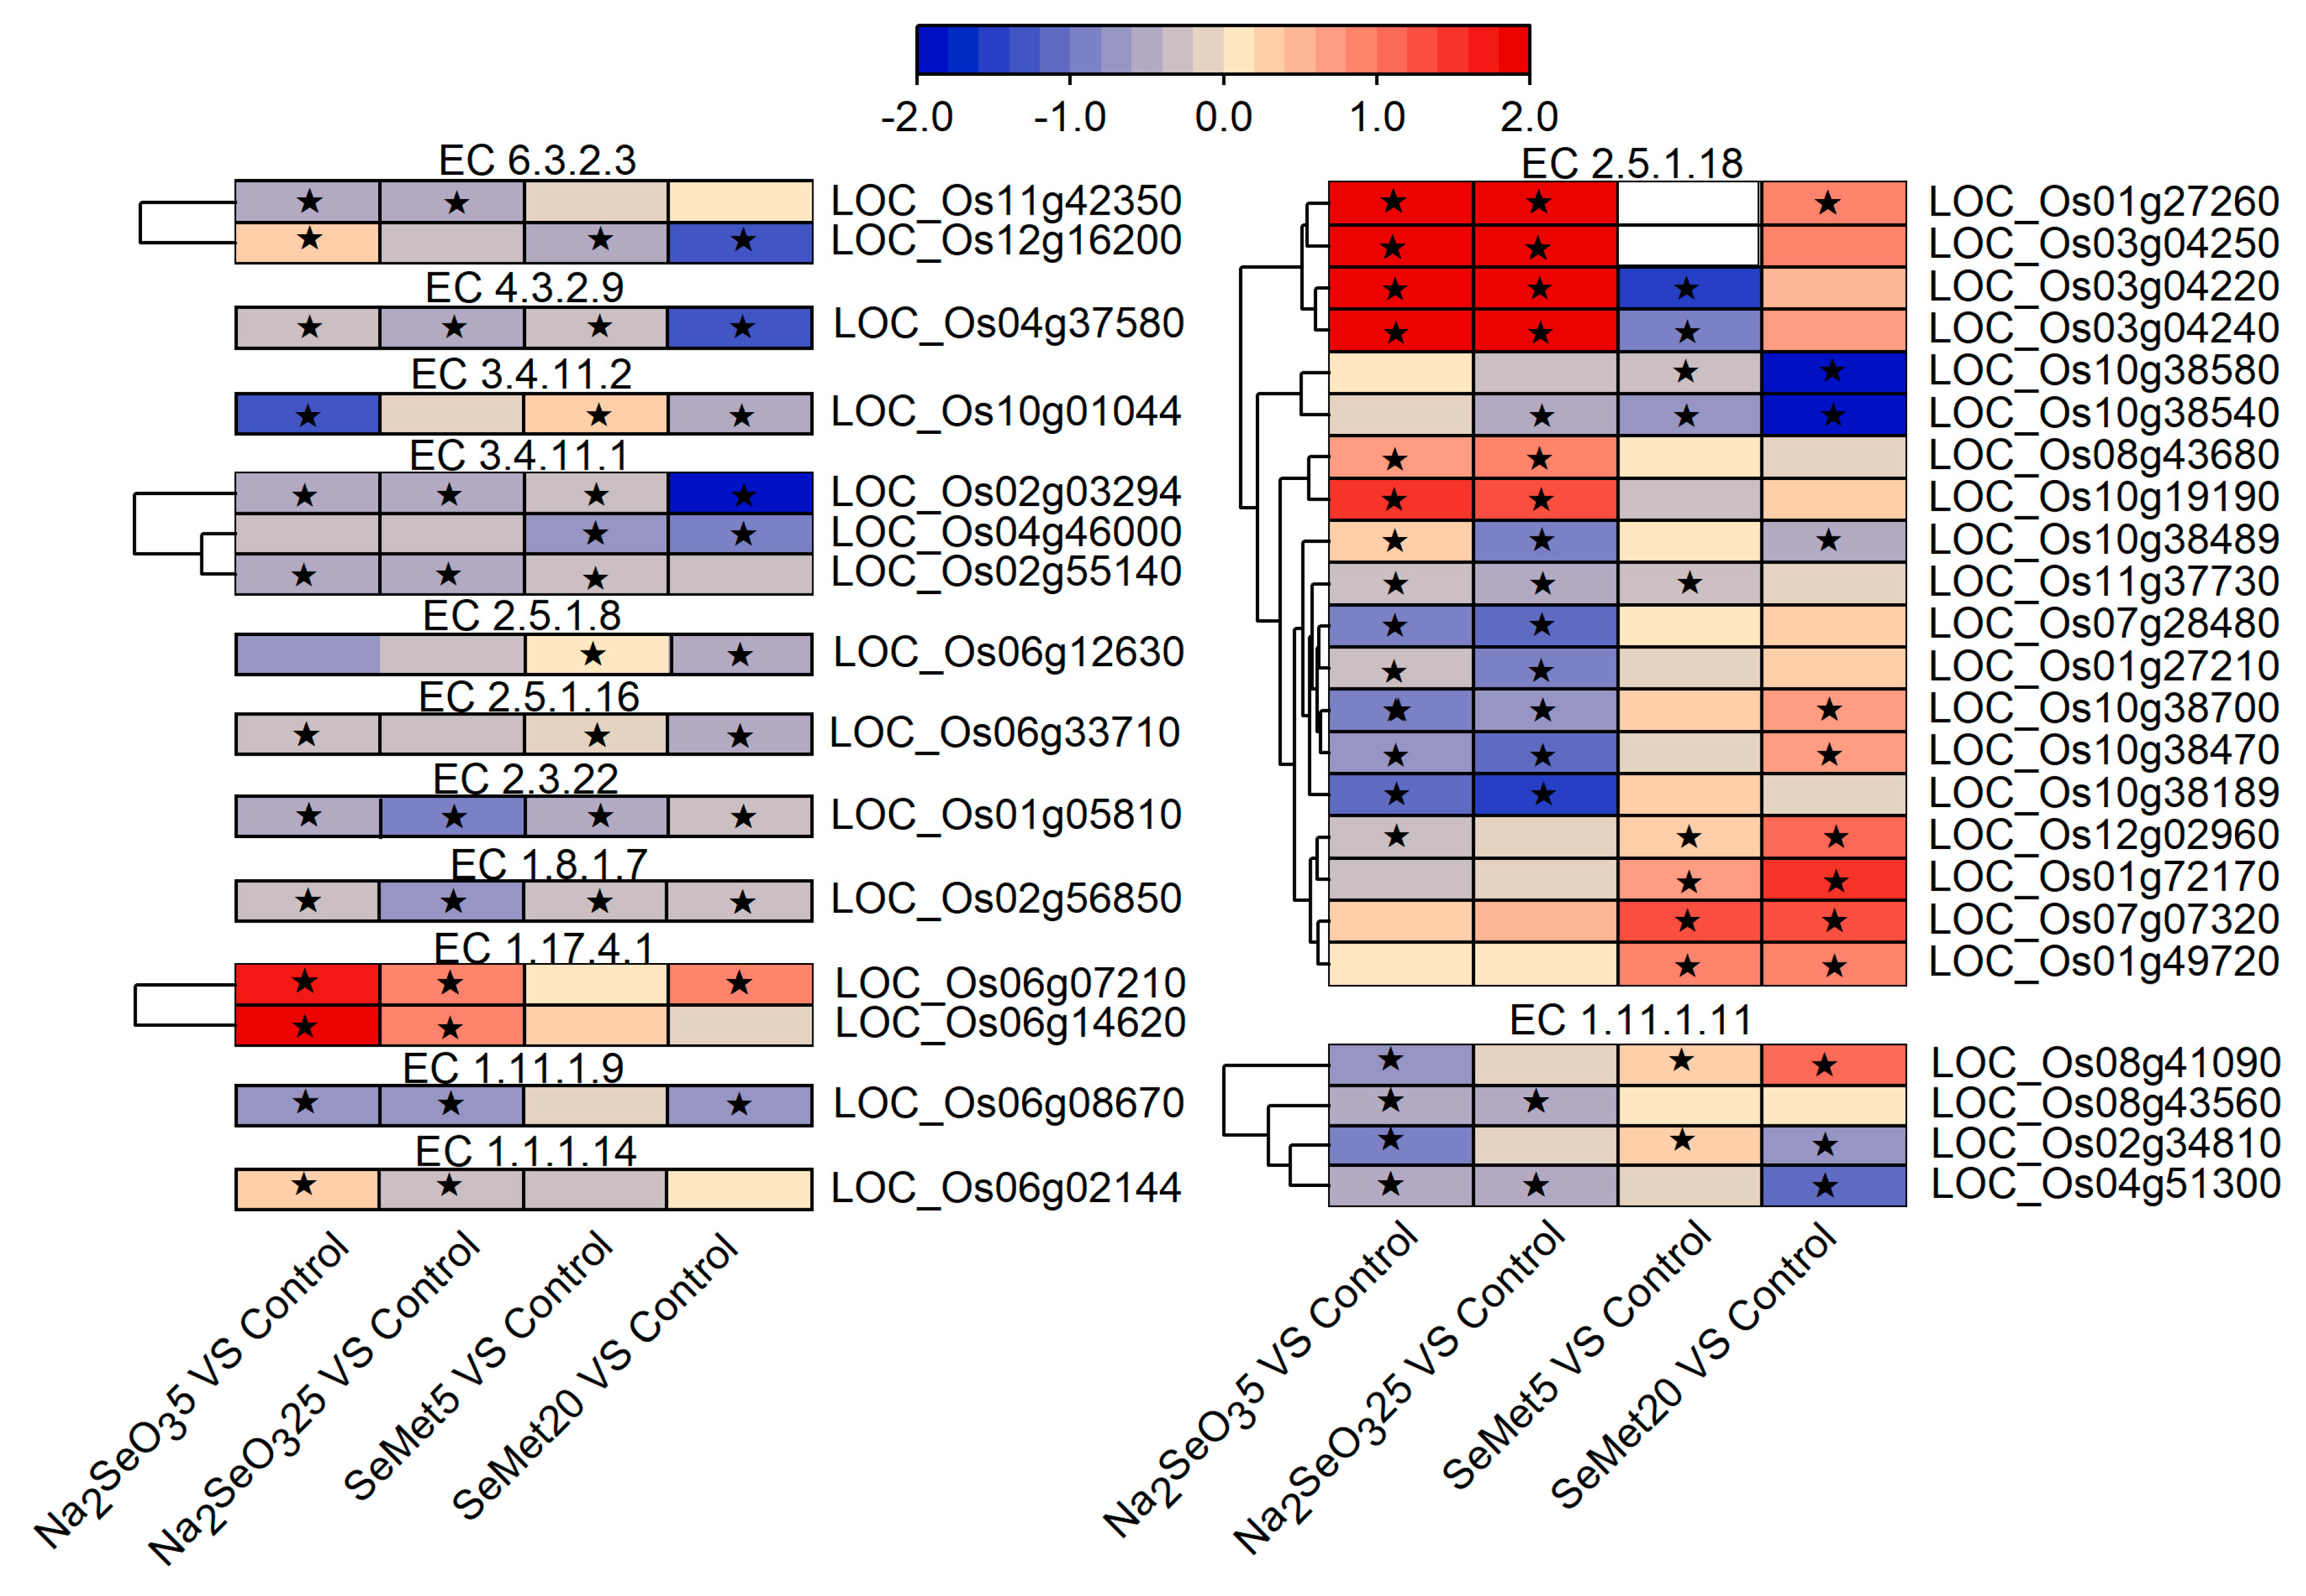
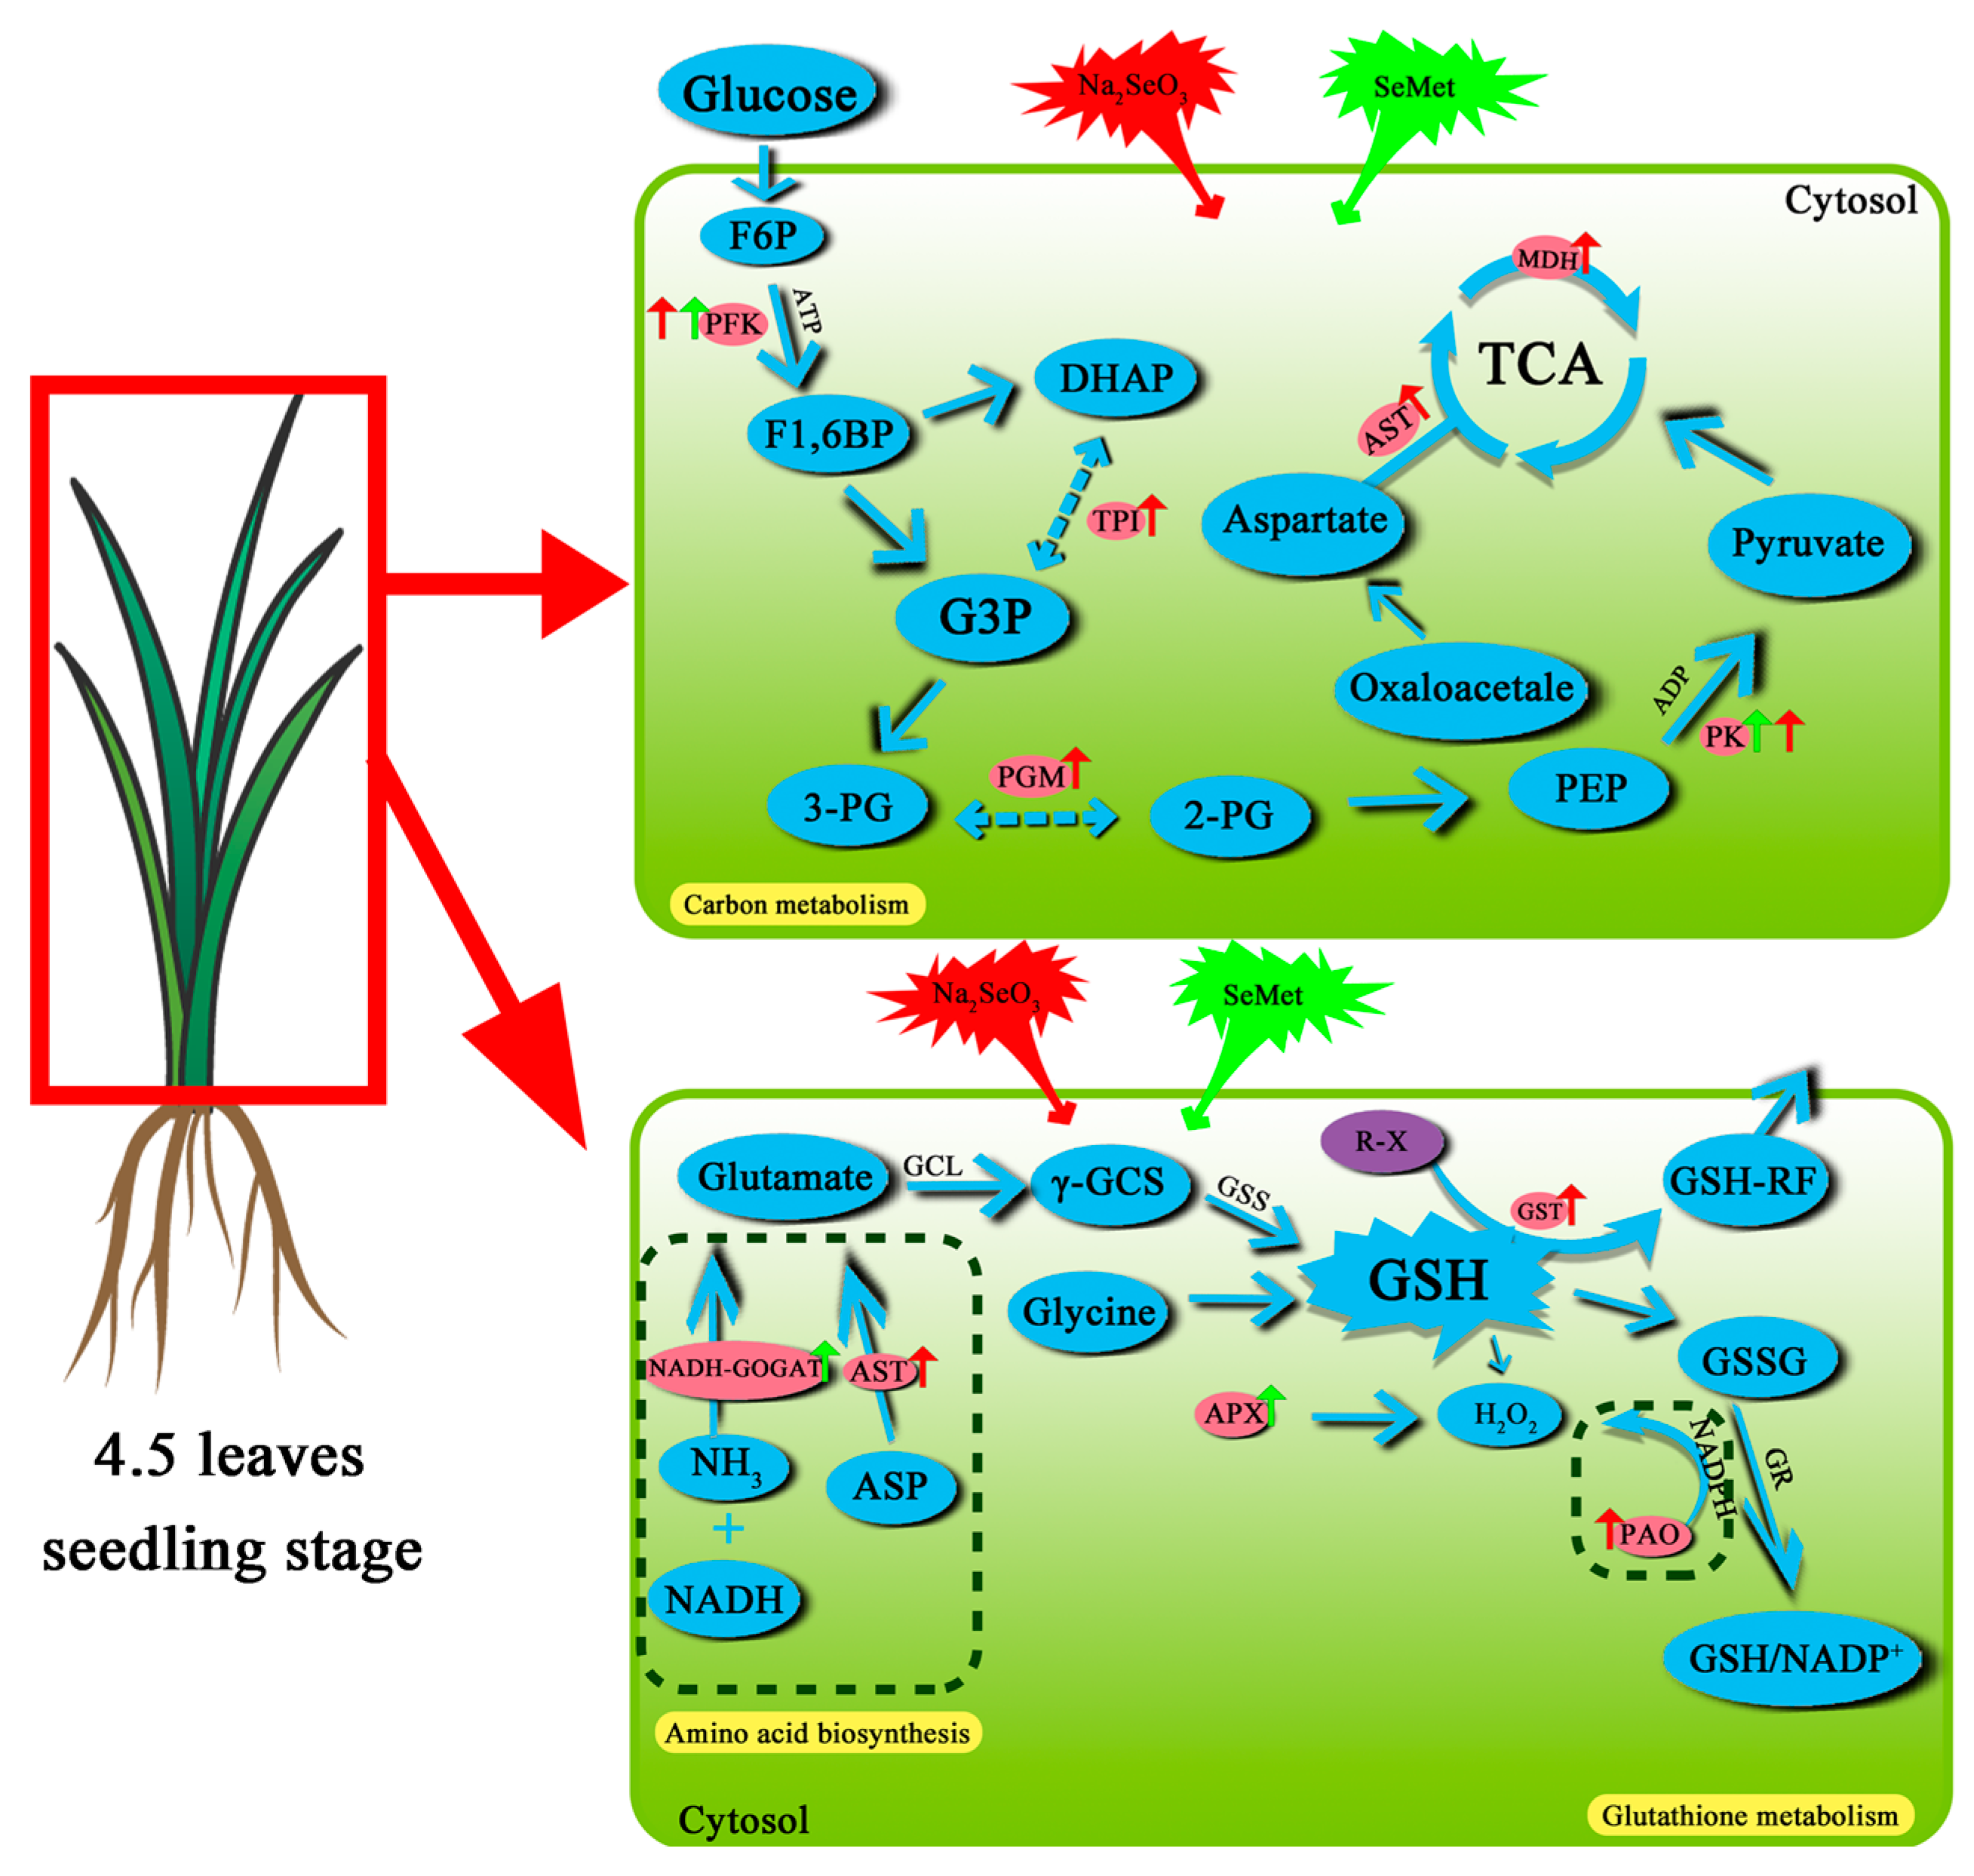
3.4.3. Key Metabolic Pathways and DEGs Involved in Se Assimilation and Metabolism

A KEGG enrichment analysis of 3041 DEGs in the Na2SeO3 and 2874 DEGs in the SeMet comparisons revealed that 74 metabolic pathways were significantly enriched in the Na2SeO3 comparisons and 68 pathways in the SeMet comparisons. Further examination identified 58 common metabolic pathways, including carbon metabolism, amino acid biosynthesis, and glutathione metabolism. The DEGs associated with these pathways are likely to play a pivotal role in regulating Se uptake, transport, and metabolism in rice under varying Na2SeO3 and SeMet concentrations.
  • DEGs related to carbon metabolism
A total of 60 DEGs related to carbon metabolism were identified under both Se comparisons (Figure 4). The carbon metabolism pathway was more enriched in the Na2SeO3 DEGs than in the SeMet DEGs. The pathways were filtered using p-adj < 0.05 and log2FC > 0.5. A total of 55 DEGs were identified in both Na2SeO3 comparisons. Among them, LOC_Os05g32760, LOC_Os04g46560, LOC_Os01g61380, and LOC_Os04g44870 expression increased by 3.05, 1.85, 2.19, and 2.52 times, respectively, in the Na2SeO3 treatment, and by 1.38, 1.45, 1.18, and 1.98 times, respectively, in the 25 μM Na2SeO3 treatment. Of the 55 DEGs, 39 were downregulated, with gene expression decreasing as the Se application rate increased. Few genes responded to SeMet treatment. A total of 10 DEGs were identified in both SeMet comparisons. LOC_Os03g31750 and LOC_Os10g38900 were upregulated by 1.36 and 0.71 times in the 5 μM SeMet treatment, and by 1.52 and 1.78 times in the 20 μM SeMet treatment. Six genes were downregulated, and gene expression increased with increasing Se application rate. Therefore, Na2SeO3 exerts a stronger regulatory effect on carbon-metabolism-related genes, with high concentrations generally inhibiting gene expression. In contrast, SeMet has a weaker influence and exhibits an opposite trend to Na2SeO3 treatment.
  • DEGs related to amino acid biosynthesis and metabolism
GO and KEGG enrichment analyses revealed that many pathways related to amino acid biosynthesis and metabolism were significantly enriched. Therefore, we analyzed the expression profiles of DEGs in the following pathways: amino acid biosynthesis; phenylalanine, tyrosine, and tryptophan biosynthesis; cysteine and methionine metabolism; and β-alanine metabolism (Figure 5). Compared to the control, 12 out of 34 DEGs related to amino acid synthesis were upregulated in the Na2SeO3 treatments. LOC_Os04g44870, LOC_Os05g32760, and LOC_Os02g30240 were upregulated by 2.52, 3.05, and 3.01 times, respectively, under 5 μM Na2SeO3, and by 1.98, 1.38, and 1.90 times, respectively, under 25 μM Na2SeO3. Compared to the control, three DEGs were upregulated in the SeMet treatments. LOC_Os05g48200 was upregulated by 0.63 times under 5 μM SeMet and by 2.05 times under 20 μM SeMet, while nine other DEGs were downregulated. For the biosynthesis of phenylalanine, tyrosine, and tryptophan, LOC_Os02g14110 increased by 1.34 times under 5 μM Na2SeO3 compared to the control, and no gene responded to SeMet treatment with a log2FC > 1. For the β-alanine metabolism pathway, LOC_Os09g36550 was upregulated by 1.46 times under 5 μM Na2SeO3 compared to the control, with no genes responding to SeMet treatment with a log2FC > 1. In the cysteine and methionine metabolism pathways, six DEGs were upregulated in Na2SeO3 treatments compared to the control. LOC_Os01g61380, LOC_Os10g28630, and LOC_Os07g08500 were upregulated by 2.19, 3.34, and 3.57 times, respectively, under 5 μM Na2SeO3, and by 1.18, 1.84, and 1.84 times, respectively, under 25 µM Na2SeO3. In contrast, only one DEG (LOC_Os02g39795) responded to SeMet treatments with a fold change greater than 2. Therefore, the expression of genes related to amino acid biosynthesis and metabolism may be strongly induced by Na2SeO3 and SeMet, with a stronger response to Na2SeO3 than to SeMet.
  • DEGs related to glutathione metabolism
A KEGG pathway analysis indicated that glutathione metabolism was one of the top 20 pathways enriched under both Na2SeO3 and SeMet treatments, with a transcriptome analysis revealing that a total of 38 DEGs were involved in the glutathione metabolism pathway (Figure 6). After Na2SeO3 treatment, 19 DEGs related to EC2.5.1.18 (glutathione S-transferase, GST) were identified. Seven of these DEGs were upregulated. LOC_Os06g02144 and LOC_Os06g14620 (EC1.1.1.44), as well as LOC_Os06g14620 and LOC_Os06g07210 (EC1.17.4.1), were upregulated. Few genes responded to SeMet treatment. Therefore, compared to SeMet treatment, Na2SeO3 treatment induced the glutathione metabolism pathway more strongly.

3.4.4. Validation of DEGs Through Reverse-Transcription–Quantitative PCR (RT-qPCR)

To verify the accuracy and reliability of the RNA-seq data, RT-qPCR was performed on 10 genes selected from those related to carbon metabolism, glutathione metabolism, and amino acid metabolism. By comparing the obtained RT-qPCR values with the original FPKM values, the results showed that the expression trends of RT-qPCR were consistent with those of RNA-seq. In order to validate the RNA-seq results for the 10 studied genes, the correlations between the expression values obtained by RT-qPCR and the FPKM values obtained from RNA-seq was analyzed using the Pearson correlation coefficients. The correlation coefficients and the p-values are presented in Table S2. The correlation coefficients for each gene were greater than 0.5, indicating that these genes exhibited similar expression patterns in both datasets (Figure 7).

4. Discussion

Omics technologies are being increasingly applied to study Se accumulation and transport; for example, transcriptomics has been utilized in Se-related research in Poaceae plants such as rice and wheat [35,36]. In this study, we investigated Se concentrations and forms at various growth stages in rice seedlings treated with different concentrations of Na2SeO3 and SeMet. Transcriptome analysis was used to identify DEGs and enriched pathways under Se treatments at the 4.5-leaf stage. The number of DEGs under Na2SeO3 treatment decreased with an increasing Se application rate, while the number of DEGs under SeMet treatment exhibited the opposite trend. Such results are not unprecedented. We hypothesize that the relatively high concentration of Se (25 μM) and long-term treatment may have affected the plant vitality, which may not be sufficient to induce a large number of DEGs, and this could explain the observed results. We confirmed the reliability of our data with quality control and expression validation. Our results provide valuable support for studying Se enrichment mechanisms in rice.

4.1. Effect of Different Types of Se on Rice Seedling Growth and Se Absorption

Low levels of Se (<25 µM) promoted rice growth, significantly increasing plant height and root length (Figure 2). This result is consistent with previous studies on rice [37], tobacco [30], and mustard [29]. Previous studies have shown that applying appropriate concentrations of Se can enhance photosynthesis in rice and wheat [38,39,40], promote amino acid and protein synthesis in rice [41,42], and mitigate the adverse effects of leaf senescence in rice [4]. However, when the Se concentration in the environment is too high, increased Se concentrations in plants can induce growth inhibition, chlorosis, senescence, biomass loss, and other plant toxicity symptoms, thereby having harmful effects on plants [43]. In our study, rice seedlings subjected to high Se stress exhibited significant growth inhibition. When the Na2SeO3 and SeMet treatments exceeded 25 μM and 20 μM, respectively, plant height, root length, and biomass significantly decreased (Figure 2). These results indicate that rice responds differently to various forms of Se, necessitating further investigation into the molecular mechanisms by which different Se types and concentrations promote seedling growth, particularly in relation to photosynthesis, amino acid biosynthesis, and anti-aging regulatory pathways. Additionally, the mechanisms underlying Se-induced phytotoxicity at high concentrations should be explored and strategies to mitigate Se toxicity should be developed, such as enhancing plant Se tolerance through genetic engineering or exogenous substances.
In this study, the absorption characteristics of organic Se (SeMet) in rice plants were significantly different from those of inorganic Se (Na2SeO3). Rice plants absorbed SeMet much more efficiently than Na2SeO3 (Figure 2a), but the change in biomass exhibited an opposite trend (Figure 1b). This result may be related to the form and metabolic processes of Se. In general, the smaller the aboveground biomass of rice, the stronger their ability to absorb and transport Se. Earlier studies have reported that many plants can directly absorb and utilize small Se-containing amino acids, and the bioavailability of these Se-containing amino acids is generally higher than that of selenate and selenite, such as SeMet and SeCys [44,45]. In nature, Se primarily enters the food chain by binding to plant proteins through SeMet and SeCys [46]. When sufficient exogenous SeMet is supplied, plants can directly utilize and metabolize it, incorporating it into proteins. Therefore, the efficiency of SeMet absorption and transport is higher. Due to the different chemical properties of Na2SeO3 compared to SeMet, plants may require some time to reduce Na2SeO3 to SeMet and SeCys before it can be utilized and transported. This step may be a major limiting factor that affects the Se content in both the roots and the aboveground parts of rice plants [46]. When Se application rates exceeded 25 µM, the total plant Se concentration and biomass began to decline. We speculate that this may be due to excess Se accumulating in the roots of rice seedlings, disrupting the ion balance and interfering with nutrient absorption and utilization. This could also be related to the excessive accumulation of dead cells induced by high Se levels.

4.2. The Effect of Different Forms of Exogenous Se on the Se Speciation Changes in Rice Seedlings

An analysis of rice seedlings treated with Na2SeO3 and SeMet revealed the presence of four main Se forms during the seedling stage: the organic Se forms SeMet and SeCys, and the inorganic Se forms Se (IV) and Se (VI). Among these, SeCys was the predominant Se form during the seedling stage. Similar trends have been observed in previous studies, confirming that Se primarily exists in rice in the form of organic Se [47,48].
Upon activation by various enzymes, Na2SeO3 is converted into organic Se after being absorbed by plants. It is initially converted to SeCys, which is further transformed into other forms, such as SeMet [40,49]. Our results are consistent with this, with inorganic Se increasing under Na2SeO3 application rates > 25 µM (Figure 2b). Han et al. also reported similar results [30], finding that inorganic Se was the predominant Se form in tobacco leaves grown in high-Se soil environments. However, various results have been observed in the edible parts of plants. For example, when treated with Na2SeO3, Se accumulation in cabbage, lettuce, and beet leaves followed the order Se(VI) > SeMet > Se(IV), while, in parsley leaves, it followed the order Se(VI) > Se(IV) [50]. After absorption by plants, selenite is converted into SeCys, Se(IV), and Se(VI) for Se protein synthesis, while SeMet can replace methionine in proteins, where it serves as a Se reservoir [51]. The results suggest that, with increasing Se treatment level, the percentage of inorganic Se [especially Se (VI)] in the soluble fraction increases, while the proportion of SeMet decreases and SeCys increases. We hypothesize that, after SeMet enters the plant roots, it is quickly converted into an unknown Se form, which may be a secondary derivative of SeMet. This unknown form is easily converted into other forms (such as SeCys and Se (IV)) in the roots and can be transported to the aboveground parts via the xylem, where it may also revert to SeMet (Figure 2b). It may also be closely related to the Se metabolic pathway and detoxification processes in plants. This hypothesis still requires extensive morphological and molecular-level studies for confirmation.

4.3. Key Se Metabolic Pathways in Rice Seedlings Under Se Treatment

In this study, a transcriptome analysis was conducted on rice seedlings at the 4.5-leaf stage treated with Na2SeO3 and SeMet to elucidate the absorption and transport mechanisms of different Se forms in rice. A KEGG enrichment analysis revealed that 58 pathways were significantly enriched between the two treatments. A further analysis of the top 20 enriched pathways showed that carbon metabolism, amino acid biosynthesis, and glutathione metabolism were strongly affected by Na2SeO3 and SeMet treatment.
Carbon and nitrogen metabolism are the most important material and energy metabolic processes in higher plants, fundamentally influencing rice growth, development, and yield formation. These two processes are closely interconnected, with a complex metabolic network linking them to regulate plant growth. The energy and carbon sources required for nitrogen metabolism are provided by carbon metabolism, while the enzymes and photosynthetic pigments needed for carbon metabolism are supplied by nitrogen metabolism [52]. Traditionally, the carbon metabolic pathways include glycolysis (EMP), the pentose phosphate pathway (PPP), and the tricarboxylic acid cycle (TCA) [53]. Phosphoglucomutase (PGM) and triose phosphate isomerase (TPI) are involved in carbohydrate transport, metabolism, catalytic activity, and growth. They are key enzymes in the glycolytic pathway and are indispensable in ATP generation [54]. Phosphofructokinase (PFK) and pyruvate kinase (PK) are two extremely important rate-limiting enzymes in glycolysis. PFK catalyzes the conversion of fructose-6-phosphate and ATP into fructose-1,6-bisphosphate and ADP, serving as a key regulatory point in the first step of glycolysis. PK is the key enzyme in the final step of glycolysis, accelerating the conversion of ADP to ATP, which is a crucial step in energy release and utilization in plants [55]. Malate dehydrogenase (MDH) is primarily involved in photosynthesis, the C4 cycle, and other metabolic pathways. It catalyzes the reversible conversion between malate and oxaloacetate, enhancing plant stress tolerance [56]. In the transcriptomic results, 16 genes related to these enzymes were significantly upregulated in the carbon metabolic pathways, providing energy and carbon skeletons for plant growth. However, under 25 µM Na2SeO3 treatment, the expression of these genes significantly decreased (Figure 4). In the 5 µM SeMet treatment, six carbon-metabolism-related genes, including PFK and PK, were upregulated, while, in the SeMet 20 µM, only two genes exhibited consistently upregulated expression (Figure 5), indicating that the Se species and treatment concentration significantly influence the expression of carbon-metabolism-related genes.
The application of different forms of Se significantly increases the amino acid content in rice [57]. In this study, DEGs from the Na2SeO3 and SeMet treatments were highly enriched in GO terms and KEGG metabolic pathways related to amino acids. Some genes associated with amino acid metabolism exhibited a differential expression in response to the Na2SeO3 and SeMet treatments. Polyamine oxidase (PAO) is generally located in the cell wall, where it strengthens the connection between cell walls by degrading polyamines and is essential for maintaining the structural integrity of the developing plant cell wall [56]. Aspartate aminotransferase (AST) is a central enzyme in amino acid metabolism. Various isoenzymes of AST have been identified in higher plants, and they are located in specific subcellular compartments, such as the cytosol, mitochondria, peroxisomes, and plastids [58]. Homocysteine methyltransferase (HMT) converts homocysteine into methionine, playing an important role in supplying methionine for plant growth and development [59]. Glutamine synthetase (NADH-GOGAT) is involved in nitrogen utilization and is active in developing organs, such as non-expanded, non-green leaves [60]. In this study, nine genes, including NADH-GOGAT, were upregulated by more than two-fold in response to the Na2SeO3 treatments, whereas the changes in expression in response to the SeMet treatments were generally less than two-fold. NADH-GOGAT was significantly expressed in the SeMet treatments (Figure 5). These results suggest that Na2SeO3 treatments more effectively promote amino acid biosynthesis and enhance the stress tolerance of rice seedlings compared to SeMet treatments.
Genes related to glutathione metabolism play an important role in Se assimilation and tolerance in plants [61]. Long-term Na2SeO3 treatment in rice seedlings leads to the differential regulation of glutathione metabolism. Notably, even with the short-term Na2SeO3 and SeMet treatments in this study, genes associated with glutathione metabolism were strongly induced, particularly the gene encoding the antioxidant enzyme L-ascorbate peroxidase (APX). APX is associated with glutathione metabolism and plays a role in protecting plants from oxidative stress [62]. APX was significantly upregulated in the glutathione metabolism pathway under SeMet treatment. Moreover, the importance of glutathione metabolism in the response of rice to Na2SeO3 and SeMet may differ. In response to selenite treatment, eight GST genes were upregulated, whereas only three GST genes were upregulated in response to SeMet treatment (Figure 6). In recent years, the positive role of GST in enhancing plant stress tolerance has been increasingly emphasized [63,64,65]. These findings suggest that Na2SeO3 exhibits higher phytotoxicity than SeMet in rice, and GST-mediated metabolism may be essential for the detoxification process following Na2SeO3 absorption. Future research should focus on further functional studies of redox and stress-related genes involved in Se absorption and metabolism in rice (Figure 8).

4.4. Metabolic Pathways and Differentially Expressed Genes for Se Bioaugmentation

The Se biofortification of rice seeds is a process that improves the rice plant’s ability to absorb, transport, and accumulate Se, thereby increasing its Se content. This process is crucial for the growth and development of plants. Seed biofortification includes traditional breeding as well as transgenic and genome editing technologies. By introducing, modifying, or deleting specific genes, these methods can effectively enhance crop yield, disease and pest resistance, nutritional content, and stress tolerance. Transgenic technology introduces foreign genes into crops to improve specific traits, such as pest resistance, disease resistance, or enhanced nutritional content. Genome editing technologies, such as CRISPR-Cas9, can precisely edit target genes to improve the genotype of crops. The combined application of both technologies can accelerate the agricultural breeding process, enhance crop adaptability to environmental changes, and provide significant support for food security and sustainable agricultural development [66].
SULTR (sulfate transporter) genes play an important role in plants, encoding sulfate transporter proteins. These proteins are primarily responsible for the absorption of sulfate (SO42−) by plant roots and its transport to various parts of the plant. Therefore, SULTR genes play a central role in plant sulfur metabolism and nutrient regulation. In Se biofortification research, SULTR genes also play a significant role. Since the chemical properties of Se are similar to those of sulfur, certain SULTR genes (especially SULTR1 and SULTR2) also play a role in the absorption and transport of Se in plants. By regulating the expression of these genes, the Se absorption capacity of crops such as rice can be enhanced, thereby achieving Se biofortification in rice [67]. In this study, neither Na2SeO3 treatment nor SeMet treatment revealed any related genes from the SULTR family. We speculate that this may be related to the growth environment of the plants. The Se absorption mechanism is lengthy and complex during plant growth. The process of sulfur metabolism mediating Se absorption and transport may involve microbial participation, and may also be closely related to the growth stages of the plants [68].
Amino acid metabolism and glutathione metabolism also play important roles in Se biofortification. In particular, Se is closely associated with the synthesis and conversion of certain sulfur-containing amino acids, such as cysteine and methionine, playing an important role in basic plant metabolism. Amino acid metabolism regulation affects the absorption, transport, and storage of Se in crops, not only increasing the Se content but also optimizing the nutritional components of the crops. This provides a sustainable technological pathway for Se biofortification. MDH is associated with the synthesis of SeCys and SeMet, further enhancing the Se content in plants [56]. Se enhances energy metabolism and the antioxidant capacity in plants by influencing the activity of MDH. It also regulates the hydrogen peroxide levels in plants by modulating the activity of PAO, helping plants cope with oxidative stress, which contributes to the stability and storage of Se [57,58]. Se regulates the activity of AST, influencing amino acid metabolism and Se accumulation in plants. It enhances the effective accumulation of Se through the amino acid synthesis pathway, which is closely related to amino acid metabolism. Glutathione metabolism promotes Se accumulation in plants through its binding and transport of Se. Genes related to the glutathione metabolic pathway not only contribute to Se accumulation but also enhance the absorption of other nutrients by plants, such as iron, zinc, and copper, by regulating mineral metabolism. Additionally, Se often improves plant stress resistance by regulating the antioxidant system. Studies have shown that Se can enhance the activity of related enzymes such as GST and APX, thereby promoting the maintenance of a high antioxidant capacity and stable growth in plants under Se-rich conditions [62,63]. In this study, genes related to MDH, PAO, AST, GST, and APX were significantly expressed under Na2SeO3 and SeMet treatments. Further research will focus on enhancing the activity of these enzymes through transgenic or gene editing technologies to promote Se biofortification and optimize the stress resistance of rice.

5. Conclusions

In this study, we explored the molecular mechanisms of Se absorption and transport in rice seedlings under treatment with different forms of Se. Se application rates below 25 μM increased plant biomass and Se levels, with SeMet treatment resulting in higher Se content than Na2SeO3 treatment at all stages. However, high Se application rates significantly impaired photosynthesis, ultimately inhibiting plant growth. Organic SeCys and SeMet were the main Se species in rice, and their relative concentration decreased with an increasing Se application rate. Additionally, a transcriptomic analysis showed that Se primarily affects the amino acid biosynthesis, carbon metabolism, and glutathione metabolism pathways, promoting rice growth. Na2SeO3 treatment upregulated genes related to PGM, TPI, PFK, PK, MDH, PAO, AST, and GST, and the expression levels of DEGs decreased with an increasing Se application rate. SeMet treatment upregulated genes related to PFK, PK, NADH-GOGAT, and APX, and the expression levels of DEGs increased with an increasing Se application rate. Genes related to MDH, PAO, AST, GST, and APX could be targeted using transgenic or gene editing technologies to promote Se enrichment and optimize the stress resistance of rice. Our findings provide new insights into the molecular pathways involved in the response of rice seedlings to different Se supply levels and provide a theoretical basis for the Se biofortification of rice.

Supplementary Materials

The following supporting information can be downloaded at: https://www.mdpi.com/article/10.3390/agronomy15040867/s1, Figure S1: Standard chromatograms of SeCys, Se(IV), SeMet, Se(VI); Figure S2: Principal component analysis(PCA) of transcriptome under different Se treatments; Figure S3: Annotations of each treatment group in the COG database. Figure S4: a: FPKM boxplot for each treatment sample, The x-axis in the figure represents different samples, while the y-axis shows the logarithmic values of the FPKM expression levels of the samples. This figure measures the expression levels of each sample from the perspective of overall expression variability; b: Heatmap of the expression correlation between pairs of samples, Each value in the heatmap represents the correlation between the two samples corresponding to the horizontal and vertical axes. The larger the value, the higher the correlation. Table S1: Primers used for RT-qPCR in the study; Table S2: Pearson correlation coefficients (upper value) and p-values (lower value) between RNA-Seq and RTq-PCR data for Na2SeO3 5 μM, Na2SeO3 25 μM, SeMet 5 μM, and SeMet 20 μM; Table S3: Summary table of sequencing data analysis; Table S4: Sequencing alignment statistics.

Author Contributions

H.Z.: conceptualization, data curation, formal analysis, investigation, methodology, writing—original draft, and funding acquisition. X.J. (Xinbo Jiang): investigation, data curation, methodology, formal analysis, writing—original draft, visualization, and supervision. H.Y.: formal analysis, investigation, methodology, and visualization. J.Y.: formal analysis, investigation, methodology, and visualization. S.L. and F.U.: investigation, validation, and writing—review and editing. X.Z.: conceptualization, methodology, project administration, and resources. D.C.: validation, funding acquisition, and writing—review and editing. X.J. (Xijiu Jin): conceptualization, supervision, funding acquisition, project administration, and writing—review and editing. All authors have read and agreed to the published version of the manuscript.

Funding

This research was supported by the Department of Natural Science Fund Project of Jilin Province (No. YDZJ202201ZYTS578), the Department of Project of Jilin Province Science and Technology (No. 20210401116YY), the Jilin Provincial Education Department Project (No. JJKH20240688HT), and the National Key Research and Development Program of China (No. 2024YFD15003022 and 2024YFD150100302).

Institutional Review Board Statement

Not applicable.

Informed Consent Statement

Not applicable.

Data Availability Statement

All data generated or analyzed during this study are included in this published article and its Supplementary Materials files.

Conflicts of Interest

The authors declare no conflicts of interest.

References

  1. Zhang, L.; Chu, C. Selenium Uptake, Transport, Metabolism, Reutilization, and Biofortification in Rice. Rice 2022, 15, 30. [Google Scholar] [CrossRef]
  2. Trippe, R.C.; Pilon-Smits, E.A.H. Selenium Transport and Metabolism in Plants: Phytoremediation and Biofortification Implications. J. Hazard. Mater. 2021, 404, 124178. [Google Scholar] [CrossRef] [PubMed]
  3. Kieliszek, M. Selenium−fascinating Microelement, Properties and Sources in Food. Molecules 2019, 24, 1298. [Google Scholar] [CrossRef] [PubMed]
  4. Duan, M.Y.; Cheng, S.R.; Lu, R.H.; Lai, R.F.; Zheng, A.X.; Ashraf, U.; Fan, P.S.; Du, B.; Luo, H.W.; Tang, X.R. Effect of Foliar Sodium Selenate on Leaf Senescence of Fragrant Rice in South China. Appl. Ecol. Environ. Res. 2019, 17, 3343–3351. [Google Scholar] [CrossRef]
  5. Gao, H.-H.; Chen, M.-X.; Hu, X.-Q.; Chai, S.-S.; Qin, M.-L.; Cao, Z.-Y. Separation of Selenium Species and Their Sensitive Determination in Rice Samples by Ion-Pairing Reversed-Phase Liquid Chromatography with Inductively Coupled Plasma Tandem Mass Spectrometry. J. Sep. Sci. 2018, 41, 432–439. [Google Scholar] [CrossRef] [PubMed]
  6. Rayman, M.P. The Importance of Selenium to Human Health. Lancet 2000, 356, 233–241. [Google Scholar] [CrossRef]
  7. Song, T.; Su, X.; He, J.; Liang, Y.; Zhou, T.; Liu, C. Selenium (Se) Uptake and Dynamic Changes of Se Content in Soil–Plant Systems. Environ. Sci. Pollut. Res. 2018, 25, 34343–34350. [Google Scholar] [CrossRef]
  8. D’Amato, R.; Fontanella, M.C.; Falcinelli, B.; Beone, G.M.; Bravi, E.; Marconi, O.; Benincasa, P.; Businelli, D. Selenium Biofortification in Rice (Oryza sativa L.) Sprouting: Effects on Se Yield and Nutritional Traits with Focus on Phenolic Acid Profile. J. Agric. Food Chem. 2018, 66, 4082–4090. [Google Scholar] [CrossRef]
  9. Hariharan, S.; Dharmaraj, S. Selenium and Selenoproteins: It’s Role in Regulation of Inflammation. Inflammopharmacology 2020, 28, 667–695. [Google Scholar] [CrossRef]
  10. Sun, Y.; Wang, Z.; Gong, P.; Yao, W.; Ba, Q.; Wang, H. Review on the Health-Promoting Effect of Adequate Selenium Status. Front. Nutr. 2023, 10, 1136458. [Google Scholar] [CrossRef]
  11. Tang, Y.; Liu, F.; Xing, H.; Mao, K.; Chen, G.; Guo, Q.; Chen, J. Correlation Analysis of Lignin Accumulation and Expression of Key Genes Involved in Lignin Biosynthesis of Ramie (Boehmeria nivea). Genes 2019, 10, 389. [Google Scholar] [CrossRef] [PubMed]
  12. Chen, Z.; Lu, Y.; Dun, X.; Wang, X.; Wang, H. Research Progress of Selenium-Enriched Foods. Nutrients 2023, 15, 4189. [Google Scholar] [CrossRef] [PubMed]
  13. White, P.J.; Broadley, M.R. Biofortification of Crops with Seven Mineral Elements Often Lacking in Human Diets—Iron, Zinc, Copper, Calcium, Magnesium, Selenium and Iodine. New Phytol. 2009, 182, 49–84. [Google Scholar] [CrossRef]
  14. Zou, Q.; Wu, B.; Bao, H.; Zheng, J.; Yu, F. Investigation of a Cascading Core-Offset in-Line Fiber Mach-Zehnder Interferometer for Refractive Index Measurement. In Advanced Sensor Systems and Applications X; SPIE: Bellingham, WA, USA, 2020; Volume 11554, pp. 155–162. [Google Scholar]
  15. Lanza, M.G.D.B.; Silva, V.M.; Montanha, G.S.; Lavres, J.; Pereira de Carvalho, H.W.; Reis, A.R.D. Assessment of Selenium Spatial Distribution Using μ-XFR in Cowpea (Vigna unguiculata (L.) Walp.) Plants: Integration of Physiological and Biochemical Responses. Ecotoxicol. Environ. Saf. 2021, 207, 111216. [Google Scholar] [CrossRef]
  16. Gong, R.; Ai, C.; Zhang, B.; Cheng, X. Effect of Selenite on Organic Selenium Speciation and Selenium Bio accessibility in Rice Grains of Two Se-Enriched Rice Cultivars. Food Chem. 2018, 264, 443–448. [Google Scholar] [CrossRef]
  17. Deng, X.-F.; Zhao, Z.-Q.; Han, Z.-Y.; Huang, L.-Q.; Lv, C.-H.; Zhang, Z.-H.; Zhang, H.-Q.; Liu, X.-W. Selenium Uptake and Fruit Quality of Pear (Pyrus communis L.) Treated with Foliar Se Application. J. Plant Nutr. Soil Sci. 2019, 182, 637–646. [Google Scholar] [CrossRef]
  18. Wang, Q.; Kong, L.; Huang, Q.; Li, H.; Wan, Y. Uptake and Translocation Mechanisms of Different Forms of Organic Selenium in Rice (Oryza sativa L.). Front. Plant Sci. 2022, 13, 970480. [Google Scholar] [CrossRef]
  19. Zhao, C.; Li, J.; Chen, N.; Bai, H.; Qu, L.; Yang, Y.; Ye, H.; Xiao, H.; Yan, H.; Zhang, T. Antioxidant Activity and Transcriptomic Analysis of Se-Enriched Golden Oyster Mushroom Pleurotus citrinopileatus (Agaricomycetes). Int. J. Med. Mushrooms 2020, 22, 755–762. [Google Scholar] [CrossRef] [PubMed]
  20. Yi, Q.; Sun, X.; Tang, S.; Xu, P.; Pang, Y.; Huang, X.; Huang, Q.; Huang, J.; Zhang, M. Comparation of Se Accumulation and Distribution of Two Rice (Oryza sativa L.) Cultivars with High- and Low- Se Efficiency as Affected by Exogenous Application of Selenite. J. Cereal Sci. 2022, 105, 103475. [Google Scholar] [CrossRef]
  21. Gupta, M.; Gupta, S. An Overview of Selenium Uptake, Metabolism, and Toxicity in Plants. Front. Plant Sci. 2017, 7, 2074. [Google Scholar] [CrossRef]
  22. Zhang, M.; Wilson, L.; Xing, G.; Jiang, L.; Tang, S. Optimizing Root Architecture and Increasing Transporter Gene Expression Are Strategies to Promote Selenium Uptake by High-Se Accumulating Rice Cultivar. Plant Soil 2020, 447, 319–332. [Google Scholar] [CrossRef]
  23. Zhang, M.; Pang, Y.; Yi, Q.; Huang, J.; Huang, X.; Huang, Q.; Xu, P.; Tang, S. Comparative Effectiveness of Se Translocation between Low-Se and High-Se Rice Cultivars under Se Fertilization. Ecotoxicol. Environ. Saf. 2020, 205, 111372. [Google Scholar] [CrossRef]
  24. Zhang, L.; Hu, B.; Li, W.; Che, R.; Deng, K.; Li, H.; Yu, F.; Ling, H.; Li, Y.; Chu, C. OsPT2, a Phosphate Transporter, Is Involved in the Active Uptake of Selenite in Rice. New Phytol. 2014, 201, 1183–1191. [Google Scholar] [CrossRef] [PubMed]
  25. Cao, D.; Liu, Y.; Ma, L.; Jin, X.; Guo, G.; Tan, R.; Liu, Z.; Zheng, L.; Ye, F.; Liu, W. Transcriptome Analysis of Differentially Expressed Genes Involved in Selenium Accumulation in Tea Plant (Camellia sinensis). PLoS ONE 2018, 13, e0197506. [Google Scholar] [CrossRef]
  26. Liu, Y.; Li, J.; Shi, J.; Pan, Y.; Yang, S.; Xue, Y. Combined Metabolome and Transcriptome Analysis Reveals the Key Pathways Involved in the Responses of Soybean Plants to High Se Stress. Ecotoxicol. Environ. Saf. 2024, 287, 117262. [Google Scholar] [CrossRef] [PubMed]
  27. Zhang, C.; Xu, B.; Zhao, C.-R.; Sun, J.; Lai, Q.; Yu, C. Comparative de Novo Transcriptomics and Untargeted Metabolomic Analyses Elucidate Complicated Mechanisms Regulating Celery (Apium graveolens L.) Responses to Selenium Stimuli. PLoS ONE 2019, 14, e0226752. [Google Scholar] [CrossRef]
  28. Liu, C.; Zhou, G.; Qin, H.; Guan, Y.; Wang, T.; Ni, W.; Xie, H.; Xing, Y.; Tian, G.; Lyu, M.; et al. Metabolomics Combined with Physiology and Transcriptomics Reveal Key Metabolic Pathway Responses in Apple Plants Exposure to Different Selenium Concentrations. J. Hazard. Mater. 2024, 464, 132953. [Google Scholar] [CrossRef]
  29. Li, L.; Wu, S.; Wang, S.; Shi, X.; Cheng, S.; Cheng, H. Molecular Mechanism of Exogenous Selenium Affecting the Nutritional Quality, Species and Content of Organic Selenium in Mustard. Agronomy 2023, 13, 1425. [Google Scholar] [CrossRef]
  30. Han, D.; Li, X.; Xiong, S.; Tu, S.; Chen, Z.; Li, J.; Xie, Z. Selenium Uptake, Speciation and Stressed Response of Nicotiana tabacum L. Environ. Exp. Bot. 2013, 95, 6–14. [Google Scholar] [CrossRef]
  31. Hu, J.; Huang, L.; Chen, G.; Liu, H.; Zhang, Y.; Zhang, R.; Zhang, S.; Liu, J.; Hu, Q.; Hu, F.; et al. The Elite Alleles of OsSPL4 Regulate Grain Size and Increase Grain Yield in Rice. Rice 2021, 14, 90. [Google Scholar] [CrossRef]
  32. Livak, K.J.; Schmittgen, T.D. Analysis of Relative Gene Expression Data Using Real-Time Quantitative PCR and the 2−ΔΔCT Method. Methods 2001, 25, 402–408. [Google Scholar] [CrossRef] [PubMed]
  33. Li, L.; Ahsan, M.Z.; Li, Z.; Panhwar, F.H.; Zhang, Y.; Luo, D.; Su, Y.; Jia, X.; Ye, X.; Shen, C.; et al. Transcriptome Analysis of High- and Low-Selenium Genotypes Identifies Genes Responsible for Selenium Absorption, Translocation, and Accumulation. Front. Plant Sci. 2024, 15, 1413549. [Google Scholar] [CrossRef] [PubMed]
  34. Sapkota, S.; Salem, M.; Jahed, K.R.; Artlip, T.S.; Sherif, S.M. From Endodormancy to Ecodormancy: The Transcriptional Landscape of Apple Floral Buds. Front. Plant Sci. 2023, 14, 1194244. [Google Scholar] [CrossRef]
  35. Di, X.; Jing, R.; Qin, X.; Liang, X.; Wang, L.; Xu, Y.; Sun, Y.; Huang, Q. The Role and Transcriptomic Mechanism of Cell Wall in the Mutual Antagonized Effects between Selenium Nanoparticles and Cadmium in Wheat. J. Hazard. Mater. 2024, 472, 134549. [Google Scholar] [CrossRef]
  36. Jiao, L.; Zhang, L.; Zhang, Y.; Wang, R.; Lu, B.; Liu, X. Transcriptome Analysis Provides New Insight into the Distribution and Transport of Selenium and Its Associated Metals in Selenium-Rich Rice. Environ. Pollut. 2022, 301, 118980. [Google Scholar] [CrossRef] [PubMed]
  37. Zhang, M.; Xing, G.; Tang, S.; Pang, Y.; Yi, Q.; Huang, Q.; Huang, X.; Huang, J.; Li, P.; Fu, H. Improving Soil Selenium Availability as a Strategy to Promote Selenium Uptake by High-Se Rice Cultivar. Environ. Exp. Bot. 2019, 163, 45–54. [Google Scholar] [CrossRef]
  38. Gao, M.; Zhou, J.; Liu, H.; Zhang, W.; Hu, Y.; Liang, J.; Zhou, J. Foliar Spraying with Silicon and Selenium Reduces Cadmium Uptake and Mitigates Cadmium Toxicity in Rice. Sci. Total Environ. 2018, 631–632, 1100–1108. [Google Scholar] [CrossRef]
  39. Gao, S.; Zhou, M.; Xu, J.; Xu, F.; Zhang, W. The Application of Organic Selenium (SeMet) Improve the Photosynthetic Characteristics, Yield and Quality of Hybrid Rice. Plant Physiol. Biochem. 2024, 208, 108457. [Google Scholar] [CrossRef]
  40. Kaur, M.; Sharma, S. Influence of Selenite and Selenate on Growth, Leaf Physiology and Antioxidant Defense System in Wheat (Triticum aestivum L.). J. Sci. Food Agric. 2018, 98, 5700–5710. [Google Scholar] [CrossRef]
  41. Hu, Z.; Cheng, Y.; Suzuki, N.; Guo, X.; Xiong, H.; Ogra, Y. Speciation of Selenium in Brown Rice Fertilized with Selenite and Effects of Selenium Fertilization on Rice Proteins. Int. J. Mol. Sci. 2018, 19, 3494. [Google Scholar] [CrossRef]
  42. Singh, R.; Upadhyay, A.K.; Singh, D.P. Regulation of Oxidative Stress and Mineral Nutrient Status by Selenium in Arsenic Treated Crop Plant Oryza sativa. Ecotoxicol. Environ. Saf. 2018, 148, 105–113. [Google Scholar] [CrossRef] [PubMed]
  43. Mostofa, M.G.; Rahman, M.M.; Siddiqui, M.N.; Fujita, M.; Tran, L.-S.P. Salicylic Acid Antagonizes Selenium Phytotoxicity in Rice: Selenium Homeostasis, Oxidative Stress Metabolism and Methylglyoxal Detoxification. J. Hazard. Mater. 2020, 394, 122572. [Google Scholar] [CrossRef]
  44. Kong, W.; Huo, R.; Lu, Y.; Fan, Z.; Yue, R.; Ren, A.; Li, L.; Ding, P.; Ren, Y.; Gao, Z.; et al. Nitrogen Application Can Optimize Form of Selenium in Soil in Selenium-Rich Areas to Affect Selenium Absorption and Accumulation in Black Wheat. Plants 2023, 12, 4160. [Google Scholar] [CrossRef]
  45. Williams, M.C.; Mayland, H.F. Selenium Absorption by Two-Grooved Milkvetch and Western Wheatgrass from Selenomethionine, Selenocystine, and Selenite. J. Range Manag. 1992, 45, 374–378. [Google Scholar] [CrossRef]
  46. Whanger, P.D. Selenium and Its Relationship to Cancer: An Update. Br. J. Nutr. 2004, 91, 11–28. [Google Scholar] [CrossRef]
  47. Zhang, L.; Li, Q.; Yang, X.; Xia, Z. Effects of Sodium Selenite and Germination on the Sprouting of Chickpeas (Cicer arietinum L.) and Its Content of Selenium, Formononetin and Biochanin a in the Sprouts. Biol. Trace Elem. Res. 2012, 146, 376–380. [Google Scholar] [CrossRef]
  48. Yeasmin, M.; Lamb, D.; Choppala, G.; Rahman, M.M. Impact of Sulfur on Biofortification and Speciation of Selenium in Wheat Grain Grown in Selenium-Deficient Soils. J. Soil Sci. Plant Nutr. 2022, 22, 3243–3253. [Google Scholar] [CrossRef]
  49. Sun, N.; Wang, H.; Zhang, W.; Zhang, Y.; Zhao, Y.; He, B.; Zhang, H.; Zhang, B. Research Progress on the Sources and Enrichment of Selenium and Selenium-Rich Dietary Resources. Food Sci. 2024, 45, 299. [Google Scholar] [CrossRef]
  50. Funes-Collado, V.; Morell-Garcia, A.; Rubio, R.; López-Sánchez, J.F. Selenium Uptake by Edible Plants from Enriched Peat. Sci. Hortic. 2013, 164, 428–433. [Google Scholar] [CrossRef]
  51. Németh, A.; Dernovics, M. Effective Selenium Detoxification in the Seed Proteins of a Hyperaccumulator Plant: The Analysis of Selenium-Containing Proteins of Monkeypot Nut (Lecythis minor) Seeds. J. Biol. Inorg. Chem. 2015, 20, 23–33. [Google Scholar] [CrossRef]
  52. Duan, Y.; Yang, H.; Yang, H.; Wu, Y.; Fan, S.; Wu, W.; Lyu, L.; Li, W. Integrative Physiological, Metabolomic and Transcriptomic Analysis Reveals Nitrogen Preference and Carbon and Nitrogen Metabolism in Blackberry Plants. J. Plant Physiol. 2023, 280, 153888. [Google Scholar] [CrossRef] [PubMed]
  53. Yuan, A.; Sui, F.; Li, S.; Liu, Y.; Lu, X.; Lu, Y.; Fan, Y. Transcriptome Analysis of the Effects of Different Carbon Dioxide Concentrations on Paramylon Accumulation in Euglena gracilis Z. Bioresour. Technol. 2024, 393, 130114. [Google Scholar] [CrossRef]
  54. Lone, S.N.; Maqbool, R.; Parray, F.Q.; Ul Hussain, M. Triose-Phosphate Isomerase Is a Novel Target of miR-22 and miR-28, with Implications in Tumorigenesis. J. Cell. Physiol. 2018, 233, 8919–8929. [Google Scholar] [CrossRef] [PubMed]
  55. Kamrad, S.; Grossbach, J.; Rodríguez-López, M.; Mülleder, M.; Townsend, S.; Cappelletti, V.; Stojanovski, G.; Correia-Melo, C.; Picotti, P.; Beyer, A.; et al. Pyruvate Kinase Variant of Fission Yeast Tunes Carbon Metabolism, Cell Regulation, Growth and Stress Resistance. Mol. Syst. Biol. 2020, 16, e9270. [Google Scholar] [CrossRef]
  56. Wu, J.-L.; Wu, Q.-P.; Huang, J.-M.; Chen, R.; Cai, M.; Tan, J.-B. Effects of L-Malate on Physical Stamina and Activities of Enzymes Related to the Malate-Aspartate Shuttle in Liver of Mice. Physiol. Res. 2007, 56, 213–220. [Google Scholar] [CrossRef] [PubMed]
  57. Yin, H.; Qi, Z.; Li, M.; Ahammed, G.J.; Chu, X.; Zhou, J. Selenium Forms and Methods of Application Differentially Modulate Plant Growth, Photosynthesis, Stress Tolerance, Selenium Content and Speciation in Oryza sativa L. Ecotoxicol. Environ. Saf. 2019, 169, 911–917. [Google Scholar] [CrossRef]
  58. de la Torre, F.; Santis, L.D.; Suárez, M.F.; Crespillo, R.; Cánovas, F.M. Identification and Functional Analysis of a Prokaryotic-Type Aspartate Aminotransferase: Implications for Plant Amino Acid Metabolism. Plant J. 2006, 46, 414–425. [Google Scholar] [CrossRef]
  59. Zhao, M.; Chen, P.; Wang, W.; Yuan, F.; Zhu, D.; Wang, Z.; Ying, X. Molecular Evolution and Expression Divergence of HMT Gene Family in Plants. Int. J. Mol. Sci. 2018, 19, 1248. [Google Scholar] [CrossRef]
  60. Kojima, S.; Konishi, N.; Beier, M.P.; Ishiyama, K.; Maru, I.; Hayakawa, T.; Yamaya, T. NADH-Dependent Glutamate Synthase Participated in Ammonium Assimilation in Arabidopsis Root. Plant Signal. Behav. 2014, 9, e29402. [Google Scholar] [CrossRef]
  61. Rao, S.; Yu, T.; Cong, X.; Lai, X.; Xiang, J.; Cao, J.; Liao, X.; Gou, Y.; Chao, W.; Xue, H.; et al. Transcriptome, Proteome, and Metabolome Reveal the Mechanism of Tolerance to Selenate Toxicity in Cardamine Violifolia. J. Hazard. Mater. 2021, 406, 124283. [Google Scholar] [CrossRef]
  62. Yoshimura, K.; Ishikawa, T. Physiological Function and Regulation of Ascorbate Peroxidase Isoforms. J. Exp. Bot. 2024, 75, 2700–2715. [Google Scholar] [CrossRef]
  63. Wang, M.; Wang, Y.; Zhang, Y.; Li, C.; Gong, S.; Yan, S.; Li, G.; Hu, G.; Ren, H.; Yang, J.; et al. Comparative Transcriptome Analysis of Salt-Sensitive and Salt-Tolerant Maize Reveals Potential Mechanisms to Enhance Salt Resistance. Genes Genom. 2019, 41, 781–801. [Google Scholar] [CrossRef] [PubMed]
  64. Xu, J.; Tian, Y.-S.; Xing, X.-J.; Peng, R.-H.; Zhu, B.; Gao, J.-J.; Yao, Q.-H. Over-Expression of AtGSTU19 Provides Tolerance to Salt, Drought and Methyl Viologen Stresses in Arabidopsis. Physiol. Plant. 2016, 156, 164–175. [Google Scholar] [CrossRef]
  65. Brentner, L.B.; Mukherji, S.T.; Merchie, K.M.; Yoon, J.M.; Schnoor, J.L.; Van Aken, B. Expression of Glutathione S-Transferases in Poplar Trees (Populus trichocarpa) Exposed to 2,4,6-Trinitrotoluene (TNT). Chemosphere 2008, 73, 657–662. [Google Scholar] [CrossRef] [PubMed]
  66. Zhou, X.; Yang, J.; Kronzucker, H.J.; Shi, W. Selenium Biofortification and Interaction with Other Elements in Plants: A Review. Front. Plant Sci. 2020, 11, 586421. [Google Scholar] [CrossRef] [PubMed]
  67. White, P.J. Selenium Metabolism in Plants. Biochim. Biophys. Acta Gen. Subj. 2018, 1862, 2333–2342. [Google Scholar] [CrossRef]
  68. Zhu, Y.-Y.; Wu, W.-L.; Zhao, G.-S.; Guo, Y.-B. Progress of selenium biological transformation in animals, plants, and microorganisms. J. Agric. Resour. Environ. 2018, 35, 189–198. [Google Scholar] [CrossRef]
Figure 1. (a) Growth and development of rice seedlings treated with different types and concentration of Se. (b) Seedling aboveground (stem + leaf) and root biomass at different stages under different Se types and concentrations. (c) Plant height and root length at different stages under different Se types and concentrations. Notes: ‘2.5 leaves’ refers to the two-leaf one-heart stage, ‘3.5 leaves’ refers to the three-leaf one-heart stage, and ‘4.5 leaves’ refers to the four-leaf one-heart stage. Data are presented as the mean ± standard deviation (n = 3). Different letters indicate significant differences between treatments at p-value < 0.05.
Agronomy 15 00867 g001
Figure 2. (a) Seedling aboveground (stem + leaf) Se concentration at different stages under various Se treatments. (b) Proportion of Se species in the shoots of rice seedlings at different stages under different Se treatments. ‘nd’ is not detected. Data are presented as mean ± standard deviation (n = 3). Different letters indicate significant differences at p-value < 0.05.
Agronomy 15 00867 g002
Figure 3. (a) Venn diagram of differentially expressed genes (DEGs) for each comparison group: A is the control, B is 5 μΜ Na2SeO3, C is 25 μΜ Na2SeO3, D is 5 μM SeMet, and E is 20 μM SeMet. (b) The upregulated and downregulated DEGs for each selenium treatment group. (c) GO enrichment analysis of common DEGs under Na2SeO3 treatment. (d) KEGG enrichment analysis of common DEGs under Na2SeO3 treatment. (e) GO enrichment analysis of common DEGs under SeMet treatment. (f) KEGG enrichment analysis of common DEGs under SeMet treatment.
Agronomy 15 00867 g003
Figure 4. Heatmap of DEGs related to carbon metabolism in response to Na2SeO3 and SeMet treatments. Asterisks indicate DEGs with (p-adj < 0.05 and log2FC > 0.5).
Agronomy 15 00867 g004
Figure 5. Heatmap of DEGs related to amino acid synthesis and metabolism in response to Na2SeO3 and SeMet treatments; white boxes indicate DEGs that were not detected; asterisks indicate DEGs with p-adj < 0.05 and log2FC > 0.5.
Agronomy 15 00867 g005
Figure 6. Genes involved in the glutathione metabolism pathway. White boxes indicate DEGs that were not detected; asterisks indicate DEGs with p-adj < 0.05 and log2FC > 0.5.
Agronomy 15 00867 g006
Figure 7. Verification of gene expression through RT-qPCR. Error bars represent the standard error of the means of three biological and three technical replicates. * represent significant at p-value < 0.05.
Agronomy 15 00867 g007
Figure 8. Model showing selenium absorption and aboveground metabolic processes in rice seedlings grown under different selenium treatments. The red and green arrows indicate that gene expression levels are upregulated under Na2SeO3 and SeMet treatments, respectively. The pink circles represent key enzymes in different metabolic pathways.
Agronomy 15 00867 g008
Table 1. Effect of different seed disinfection methods on the germination and contamination rate of rice seedlings.
Disinfection MethodGermination Rate (%)Contamination Rate (%)
Control82.25 ± 1.9 d32.75 ± 3.74 a
a88.70 ± 1.2 bc31.20 ± 1.41 a
b85.80 ± 0.17 c19.20 ± 2.28 ab
c80.60 ± 1.13 d10.95 ± 3.9 b
d90.60 ± 1.13 ab7.70 ± 2.7 c
e93.65 ± 1.62 a5.50 ± 1.2 d
f85.55 ± 2.89 c3.60 ± 1.8 e
Note: a: 10% H2O2 for 35 min; b: 2% NaClO for 35 min; c: 0.5% HgCl2 for 35 min; d: 0.1% HgCl2:2% NaClO (v:v, 1:1) for 35 min; e: 0.1% HgCl2:2% NaClO (v:v, 6:4) for 35 min; and f: 0.1% HgCl2:2% NaClO (v:v, 7:3) for 35 min. Data are presented as the mean ± standard deviation (n = 3). Different letters indicate significant differences between treatments at p-value < 0.05.
Disclaimer/Publisher’s Note: The statements, opinions and data contained in all publications are solely those of the individual author(s) and contributor(s) and not of MDPI and/or the editor(s). MDPI and/or the editor(s) disclaim responsibility for any injury to people or property resulting from any ideas, methods, instructions or products referred to in the content.

