Article

Macro–Microscale Research on the Single Shear Characteristics of the Root–Loess Interface in Robinia pseudoacacia

1
Key Laboratory for Geo-Hazard in Loess Area MNR, Xi’an Center of China Geological Survey, Xi’an 710119, China
2
School of Geological Engineering and Geomatics, Chang’an University, Xi’an 710064, China
3
Department of Geology, Northwest University, Xi’an 710069, China
*
Authors to whom correspondence should be addressed.
Agronomy 2025, 15(4), 847; https://doi.org/10.3390/agronomy15040847
Submission received: 14 February 2025 / Revised: 23 March 2025 / Accepted: 25 March 2025 / Published: 28 March 2025
(This article belongs to the Section Agroecology Innovation: Achieving System Resilience)

Abstract

:
Rainfall-induced weakening of the root–loess interface’s shear strength is a key factor in slope instability, yet research on its shear characteristics remains limited. This study classifies Robinia pseudoacacia roots into three types (0–2 mm, 2–5 mm, and 5–10 mm) based on field surveys and 3D laser scanning. Large-scale, direct shear tests and three-dimensional failure surface reconstruction were conducted using a self-developed apparatus to examine the effects of water content (5%, 12%, and 19%), root type, and root content ratio (2.11%, 1.17%, and 0.23%) on shear strength and failure morphology. Results indicate that increasing water content reduces shear resistance, while root type and content ratio enhance cohesion. Shear resistance follows an order: Type II > Type III > Type I, influenced by root curvature, and increases with root content. A novel correlation is identified between shear strength and the fractal dimension of the failure surface. This study proposes a self-locking and interlocking mechanism based on micromechanical force chains between roots and soil particles, offering new insights into root–loess interface mechanics and a theoretical basis for evaluating vegetative root reinforcement under rainfall conditions.

1. Introduction

Slope stability issues have consistently been a focal point of research in engineering geology, particularly in the ecologically fragile and geomorphologically fragmented Loess Plateau region, where these problems are particularly pronounced [1,2,3,4]. In this region, shallow loess landslides induced by heavy rainfall have become a common geological disaster [5,6]. Robinia pseudacacia trees, which are widely planted on the Loess Plateau, strengthen the soil structure with their root systems and are critical in slope reinforcement projects owing to their low cost, environmental sustainability, and ecofriendly characteristics [7,8,9]. However, affected by extreme rainfall, the slopes of the Loess Plateau still face frequent instability issues, posing a severe threat to residents’ safety and the regional economy’s development [10,11]. Therefore, in-depth research into the mechanical interaction between Robinia pseudacacia roots and loess is of considerable scientific value for enhancing slope protection efficacy and informing geological disaster prevention and control strategies.
Evidence of slope failure stabilization by root is prominently observable in the Loess Plateau. Our preliminary investigations conducted in a typical vegetated area of shallow loess landslides in Yichuan County, Yan’an City, Shaanxi Province (36°7′54″–36°7′56″, 110°15′14″–110°15′16″), revealed distinct perimeters and characteristics of mass occurrence with a slide thickness of approximately 1 m (Figure 1A). This type of landslide exhibits clear boundaries and characteristics of mass occurrence (Figure 1B–D). The sliding surface develops at the contact point between the roots and the loess layer, with friction traces remaining on the contact surface. Roots exhibit shear damage (breakage) or a pulling-out failure mode (Figure 1E,F). Consequently, by examining the shear characteristics of the root–loess interface, we can elucidate the mechanisms of slope stabilization by roots and variations in mechanical strength.
Currently, considering the root–loess as a composite, research has achieved fruitful results in studying the shear strength, stress–strain curves, and shear fracture characteristics of the composite, considering root diameter, quantity, distribution, and burial depth [12,13,14,15,16]. Regarding shear strength, an increase in root quantity or diameter enhances soil cohesion, whereas the internal friction angle remains almost constant [17,18,19]. The root distribution also significantly affects shear strength; studies have found that inclined roots have a more significant impact on loess shear strength than horizontal roots [20]. The root failure mode depends on burial depth; deeper roots tend to be pulled out entirely, whereas roots closer to the surface are more prone to fracture under the influence of sliding forces [21]. Regarding the stress–strain characteristics, plant roots form a wide shear band at the heterogeneous root–loess interface. The growth pattern of roots influences the shape of the stress–strain curve, with horizontal root–loess exhibiting softening characteristics, whereas vertical growth exhibits hardening characteristics [22]. Regarding the characteristics of shear failure surfaces in samples, macroscopic phenomenological methods or microscopic methods, such as electron microscopy, are primarily employed to reveal macro–micro features of shear surfaces under the influence of different factors [23,24]. For shallow landslides in vegetated areas, it is essential to focus on the shear characteristics and interface failure modes of the root–loess interface and conduct shear tests on the root–loess interface under the influence of root spatial density, root configuration, and topological structure. The above is crucial to reflect the ability of resisting shear failure between soil particles and roots and quantitatively assess the impact of root morphology on soil shear strength. However, limited reporting exists on the shear characteristics and interaction mechanisms of the root–loess interface.
Research on the shear strength of root–loess has primarily employed laboratory triaxial tests; small-scale, direct shear tests; and in situ, direct shear tests. The sample dimensions predominantly analyzed are 39.1 × 80 mm (D × H) and 61.8 × 20 mm (D × H), to investigate the shear strength of root-containing loess [25,26,27]. However, the limited sample sizes in laboratory tests hinder the objective reflection of the actual variations in root diameter distribution on shear failure characteristics [28]. Furthermore, in situ direct shear tests encounter challenges in controlling boundary conditions and are influenced by multiple variables, complicating the assessment of the effects of different factors on the testing objectives [29]. Given that current testing instruments do not adequately fulfill the requirements for evaluating the strength of the root–loess interface, there is an urgent need to develop a single shear apparatus capable of testing large-sized root–loess interface specimens to ensure a uniform stress–strain distribution during the shear process.
In summary, this study aimed to conduct experimental research on the single shear characteristics of the Robinia pseudacacia root–loess interface, including (1) developing a novel, self-made, ring-shear apparatus to perform large-sized shear tests on the root–loess interface; (2) exploring the influence of water content, root type, and root content on the single shear characteristics and interface failure modes of the root–loess interface; and (3) integrating microscopic mechanics of root–soil interactions to elucidate the physical mechanisms underlying shear behavior at the Robinia pseudacacia root–loess interface. This study aimed to provide new insights into the failure of slope stabilization caused by vegetation roots during rainfall.

2. Materials and Methods

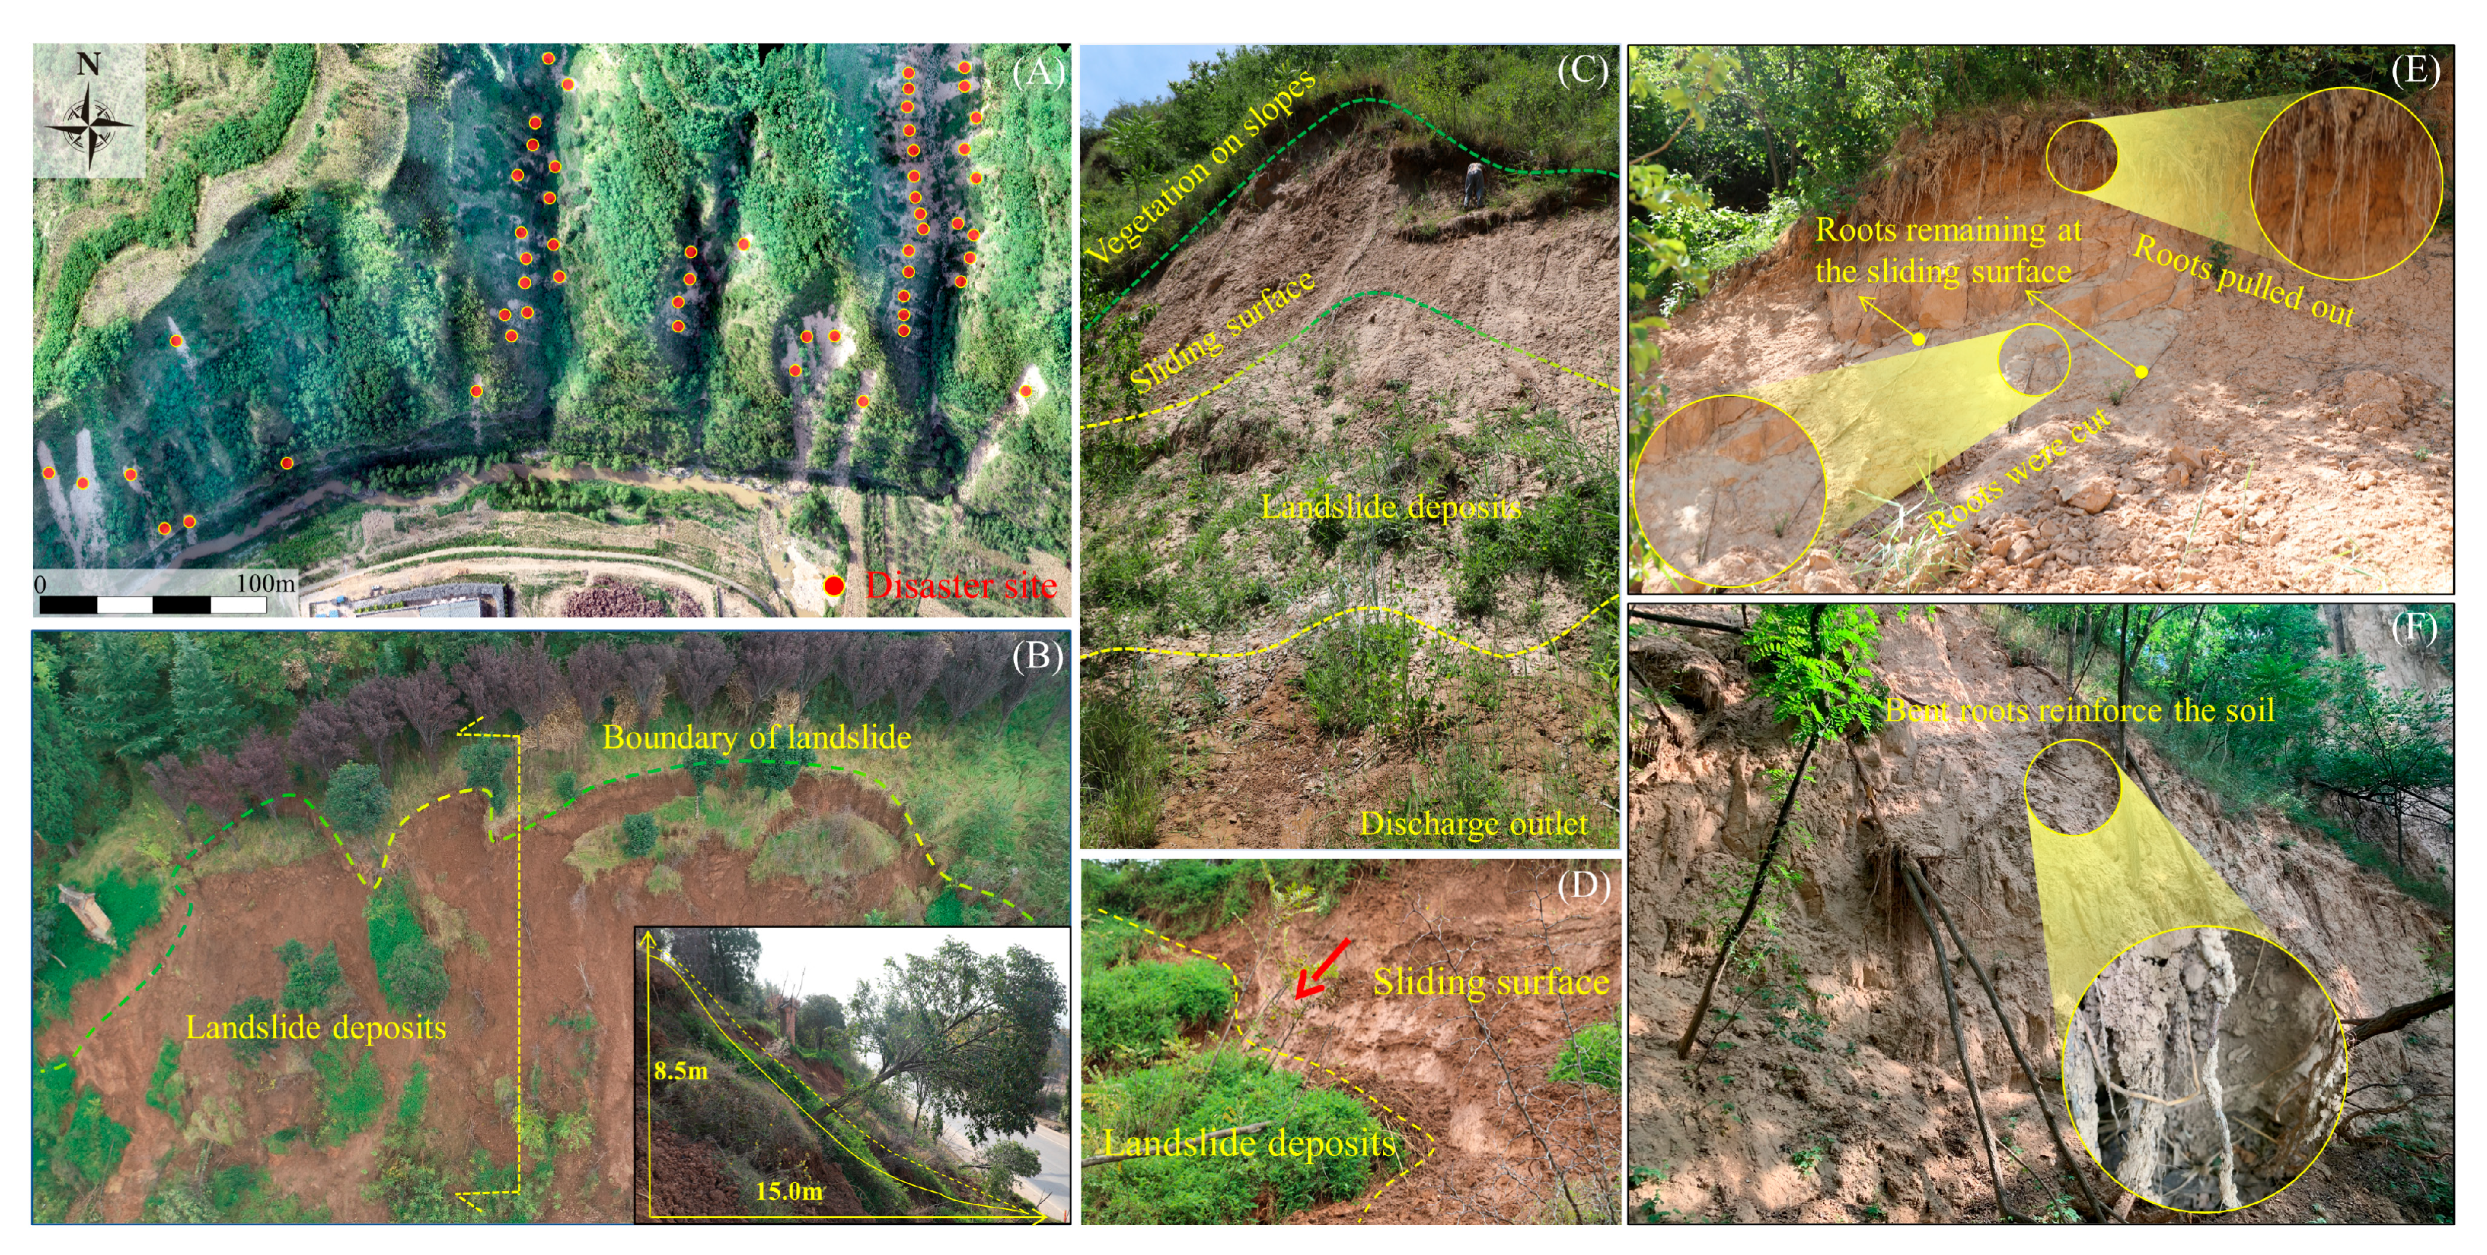
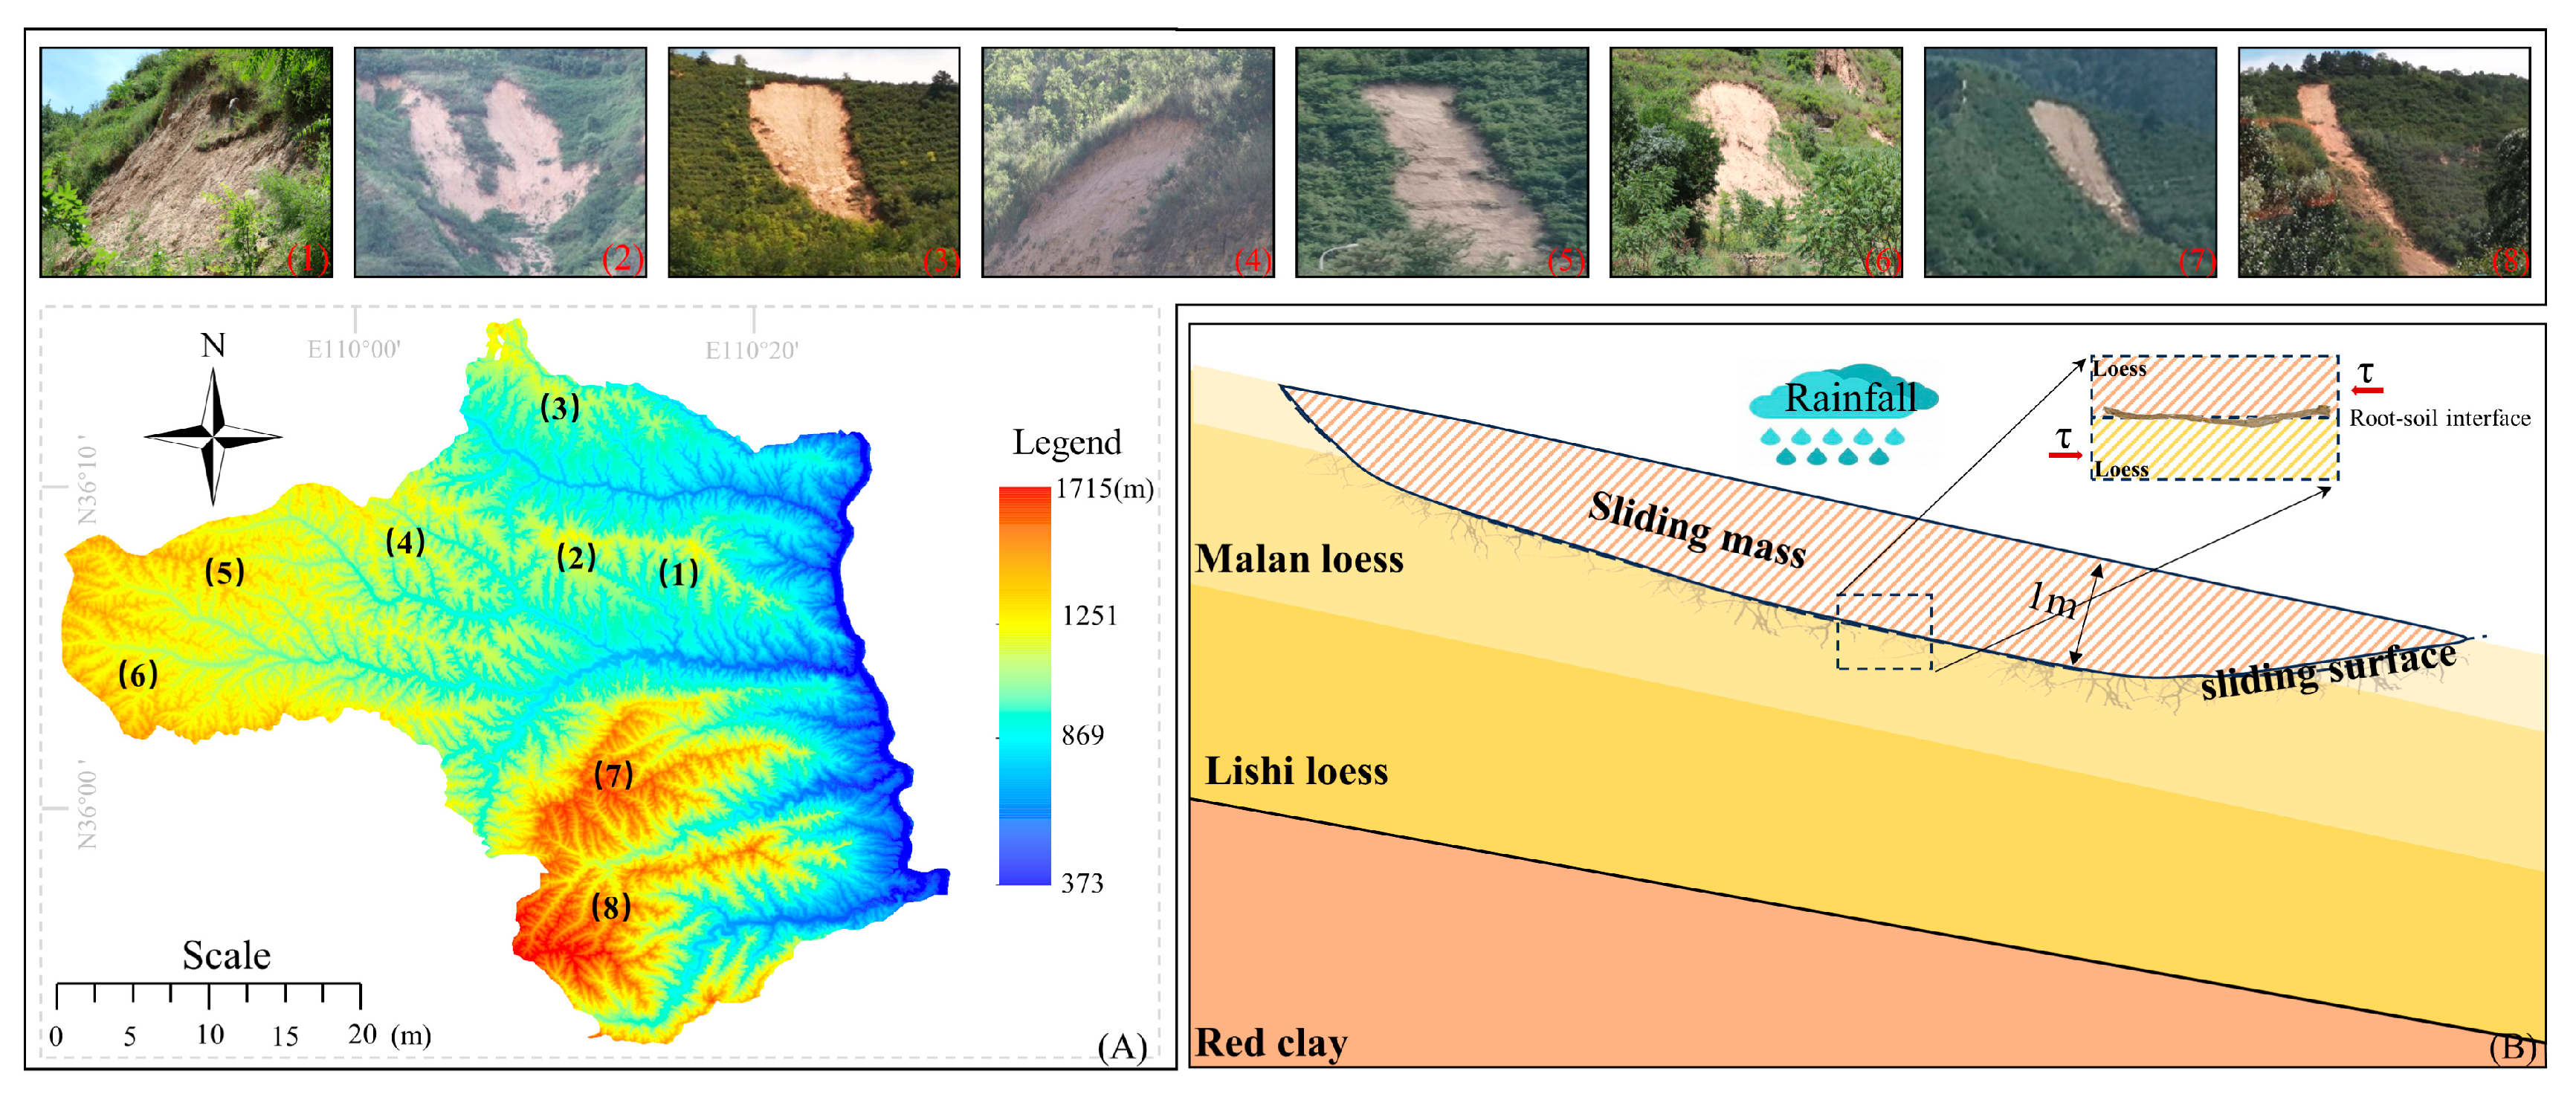
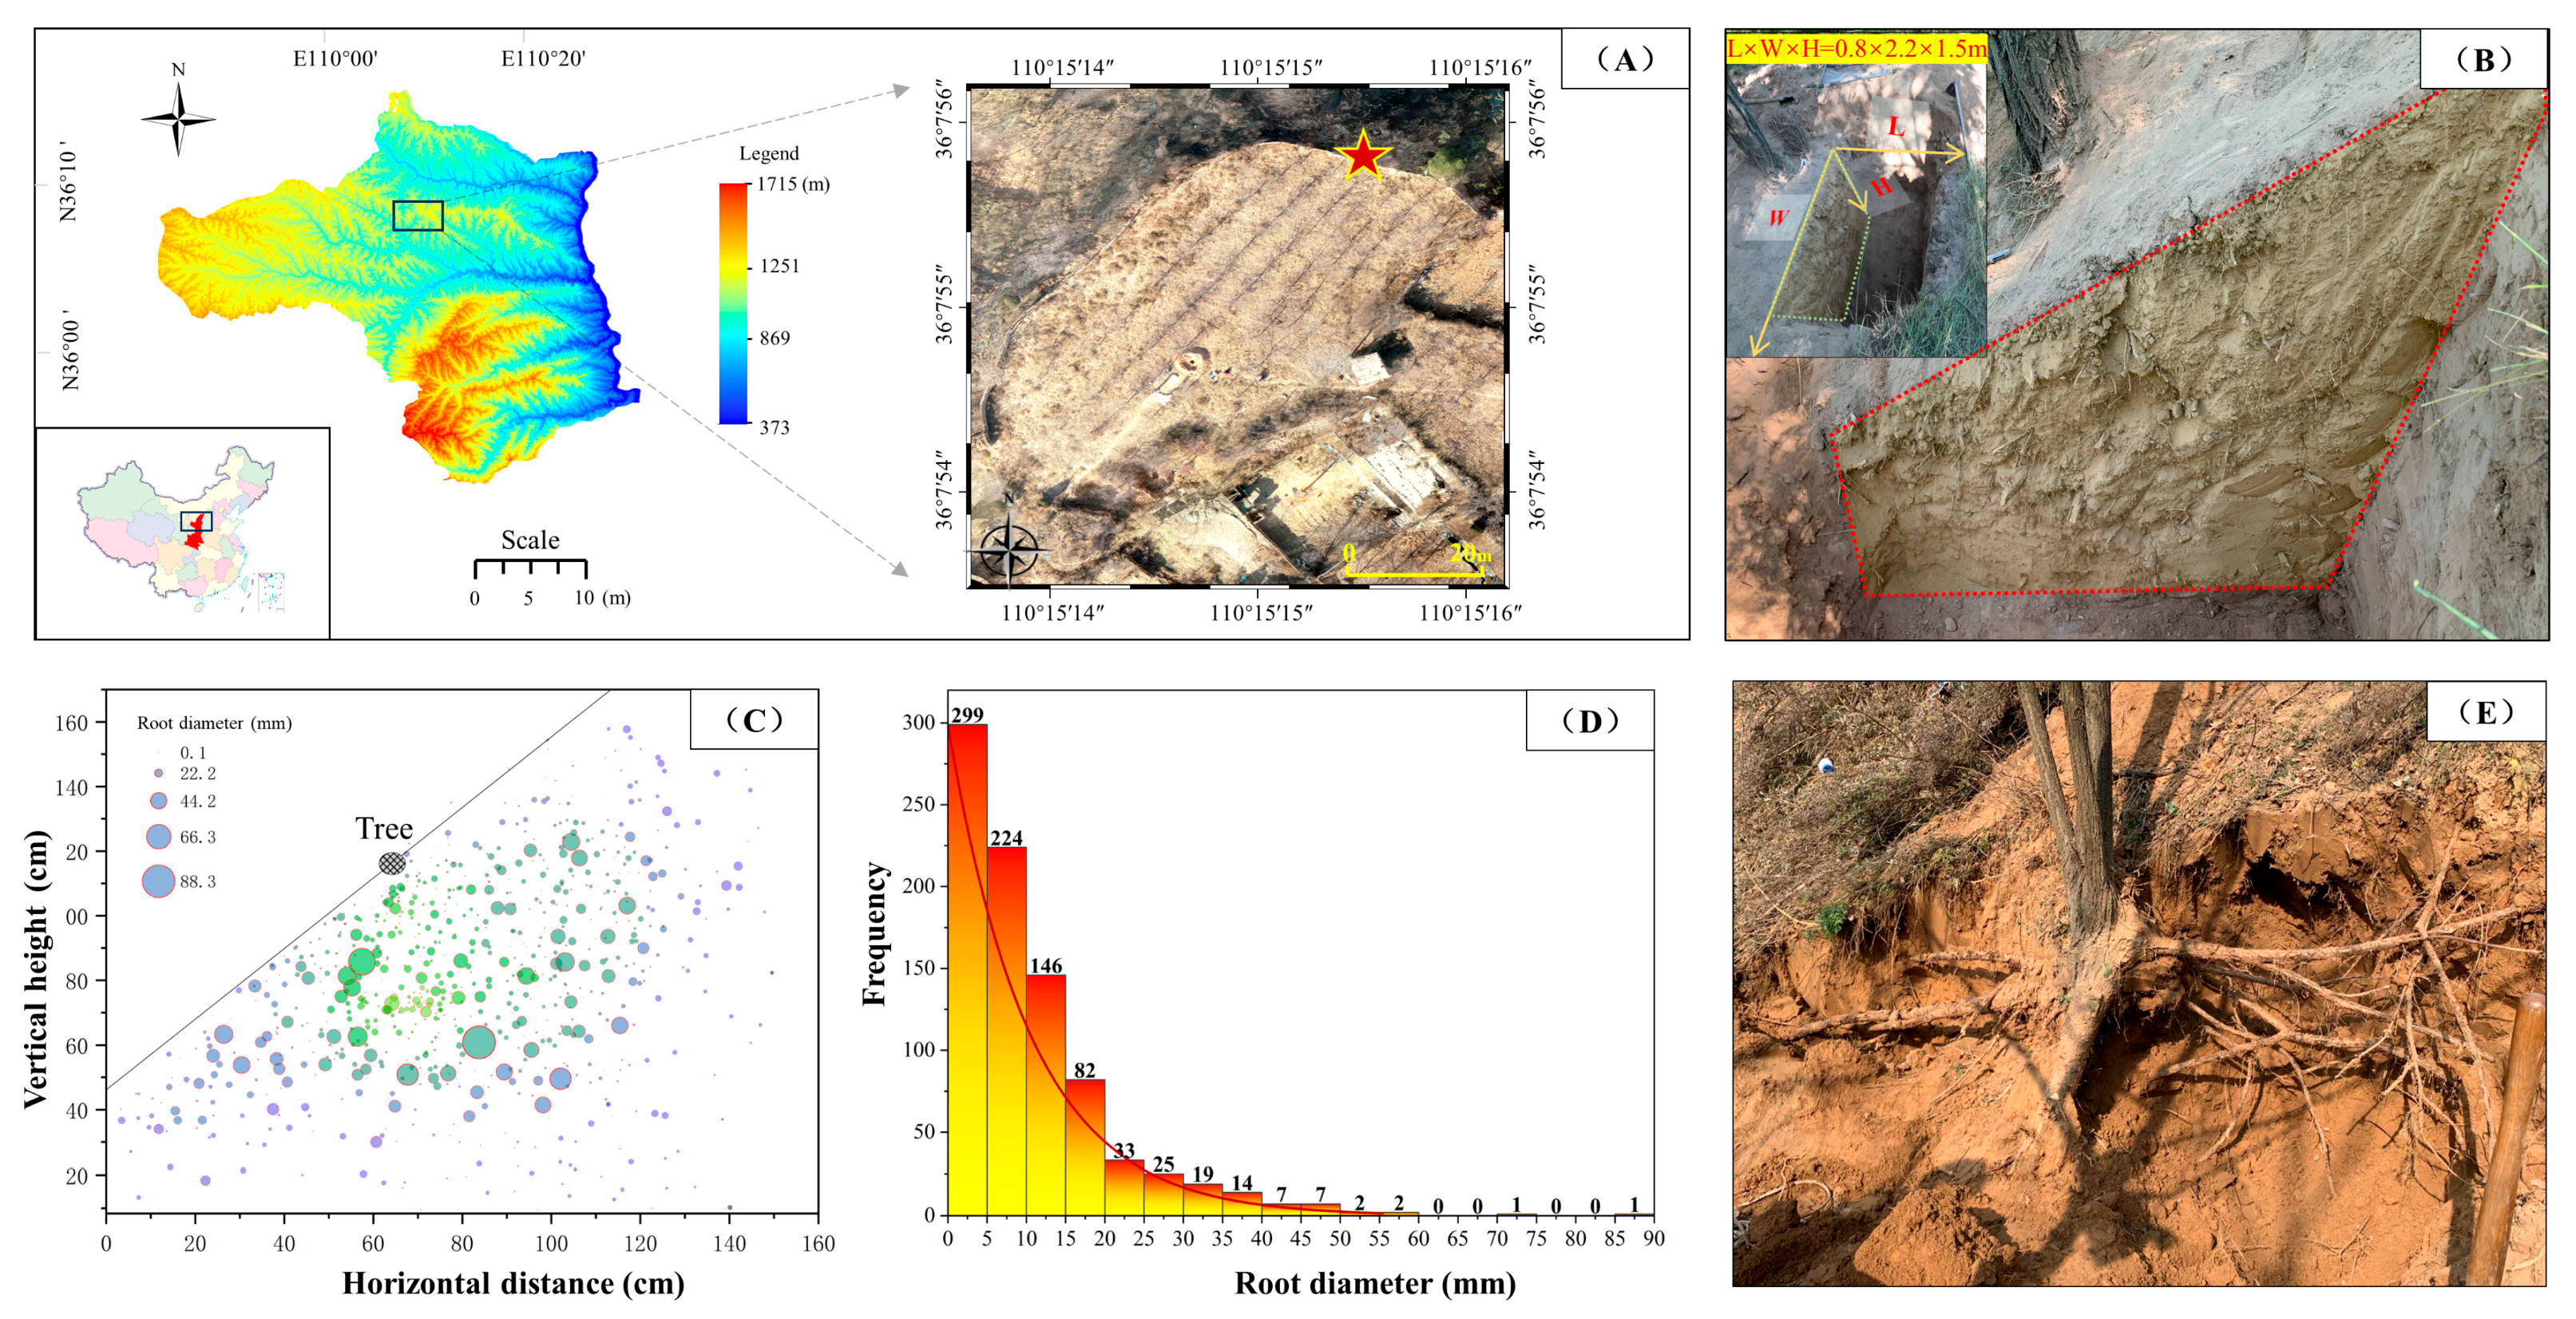
2.1. Geologic Conditions of Typical Landslide Area to Be Engineered

Yichuan County, Yan’an City, Shaanxi Province, China, is a typical area with distributed artificial Chinese scholar tree forests (Figure 2A). In recent years, slope instability has become one of the significant factors contributing to the degradation of the ecological environment in this region. The study area features significant topographical variations, simple geological structures, and the absence of large folds and faults. It is primarily distributed at the tops of geomorphic units, such as loess ridges and mounds. The stratigraphy, from young to old, comprises cultivated soil (Q4ml), Malan loess (Q3eol), Lishi loess (Q2eol + el), red clay (N), and mudstone (J). Due to rainfall, the Malan loess layer is particularly susceptible to landslides. Typical characteristics of developed shallow loess landslides include small-scale landslides with a small volume of soil, a slide thickness of approximately 1 m (Figure 2B), and the development of the sliding surface at the root–soil interface with many damaged plant roots. Additionally, the region is inland, with a higher terrain and a semiarid, continental monsoon climate characterized by dry and variable weather with uneven temperature distribution between cold and hot seasons. Precipitation is extremely uneven throughout the year, with July, August, and September accounting for 60–80% of the annual rainfall. In July 2013, cumulative rainfall reached 382.74 mm [30].

2.2. Sample Collection and Classification

The experimental samples of Robinia pseudacacia roots and loess were collected from Qiulin Town, Yichuan County, Yan’an City, Shaanxi Province, China (Figure 3A). The trenching method was utilized for an in situ investigation of the distribution of Robinia pseudacacia roots (Figure 3B). On-site observations revealed that Robinia pseudacacia roots predominantly exhibit a horizontal distribution in the soil. The quantity of roots shows a pattern of initial increase, followed by a decrease with increasing depth. Statistical results indicate that this plant species is primarily characterized by fine roots with 0.1–10 mm diameters (Figure 3C,D). The root density in the trench section, defined as the ratio of root mass to dry soil mass per cubic decimeter, ranges from 0.23% to 2.11%. The intact and undamaged root samples were collected using the whole plant excavation method (Figure 3E). All root samples measured 50 cm in length and were carefully packaged in layers with cling film and bubble wrap to prevent moisture loss and damage to the root tissues during transportation.
To quantitatively classify roots and subsequently conduct a study on the single shear characteristics of the root–loess interface, three-dimensional (3D) reconstruction scanning experiments were conducted on roots of different lengths (2 cm, 10 cm, 15 cm, and 20 cm) and different diameters (1 mm, 2 mm, 3 mm, 4 mm, 5 mm, 6 mm, 7 mm, 8 mm, 9 mm, and 10 mm) using a 3D laser scanner (Figure 4B–D). The instrument used was the Tianyuan FREESCAN-UE11 handheld blue laser 3D scanner (SHINING 3D Technology Co., Ltd., Hangzhou, China) (Figure 4A). The 3DReshaper software (Version 17.1.25190.0) was employed to process the root data, measuring the central axis length (L) and the straight-line length (X) to quantitatively characterize the root curvature, β = (L − X)/L. Roots exhibiting the maximum curvature variation across different lengths were selected as target roots for experimentation. The test results indicated that the curvatures of roots measuring 2 cm, 10 cm, 15 cm, and 20 cm were 0–1.38%, 0–6.48%, 0–16.85%, and 0–7.71%, respectively. Except for the 15 cm roots, the curvature of roots generally increased with the length. Since the 15 cm roots exhibited the greatest variation in curvature, they were selected as the target roots for experimentation. An analysis of the curvature correlation of target roots in different diameter ranges categorized the target roots into Types I, II, and III (Figure 4E–J). This study represents the first successful classification of target roots, notably introducing root configurations as a significant feature.
The loess samples were collected near the Robinia pseudacacia roots at a burial depth of 10–50 cm, with a dry density of approximately 1.3 g/cm3. Table 1 presents the basic physical indicators of the soil. The loess samples retrieved from the field underwent several processing steps to closely simulate the field test environment. Initially, the disturbed soil samples were firstly air-dried and then processed through a 0.5 mm sieve. After that, the physical parameters such as specific gravity, plastic limit, and liquid limit were measured using the sieved soil samples in accordance with the Chinese National Standards [31], but clay size was defined to be less than 2 um followed ASTM, D422 [32]. Subsequently, the dried soil was mixed with water to achieve the desired moisture content. The wet soil samples were then left undisturbed in a preservation device for 72 h to ensure uniform moisture distribution. Finally, the soil samples with the target moisture content were layered into the container, each layer measuring 5 cm in thickness.

2.3. Test Methods

The impact of root morphology on the shear characteristics of the root–loess interface was investigated by categorizing the target root diameters D into three intervals of 0–2 mm, 2–6 mm, and 6–10 mm and labeled as Types I, II, and III, respectively, and the corresponding curvatures varied within the ranges of 0–7.92%, 0–12.32%, and 0–16.85%, with the mean values of 1.05%, 2.35%, and 1.26%, respectively (Figure 4J). The root densities were set at gradients of 0.23%, 1.17%, and 2.11% to study the effect of root density based on field survey results. Considering that the root depth in the study area is approximately 1 m, and the fluctuation range of the soil moisture content is between 5% and 19%, the controlled soil moisture content (w) for the experiments was 5%, 12%, and 19%, with consolidation pressures (σv) of 20, 40, 60, and 80 kPa. Given the on-site root distribution characteristics, the roots were arranged horizontally at the root–loess interface, with the natural dry soil density as the standard control. Considering the rapid instability of loess slopes in vegetation growth areas, a consolidated undrained method was employed for single shear experiments on the root–loess interface. The experiment was conducted using the controlled variable method, where different combinations of variables were tested one by one. A total of 120 experimental groups were used in the experimental design, and 12 groups of loess samples were the blank control groups.
A 3D laser scanning test was conducted on the shear surface of the w = 12% sample to investigate the influence of experimental variables on the shear surface failure characteristics following single shear experiments. This test aimed to identify the impact of various experimental variables on the shear failure morphology of the root–loess interface. Furthermore, fractal dimensions at the shear interface were analyzed to reveal the evolution pattern of strength.
To examine the microscopic mechanical characteristics of the Robinia pseudacacia root–loess interface, a 3D particle flow code (PFC3D) numerical analysis was performed on Robinia pseudacacia root–loess samples with a moisture content of 12% and varying root densities (0% and 2.11%). This analysis, combined with macroscopic experimental patterns, elucidated the physical mechanism underlying the shear behavior at the Robinia pseudacacia root–loess interface.

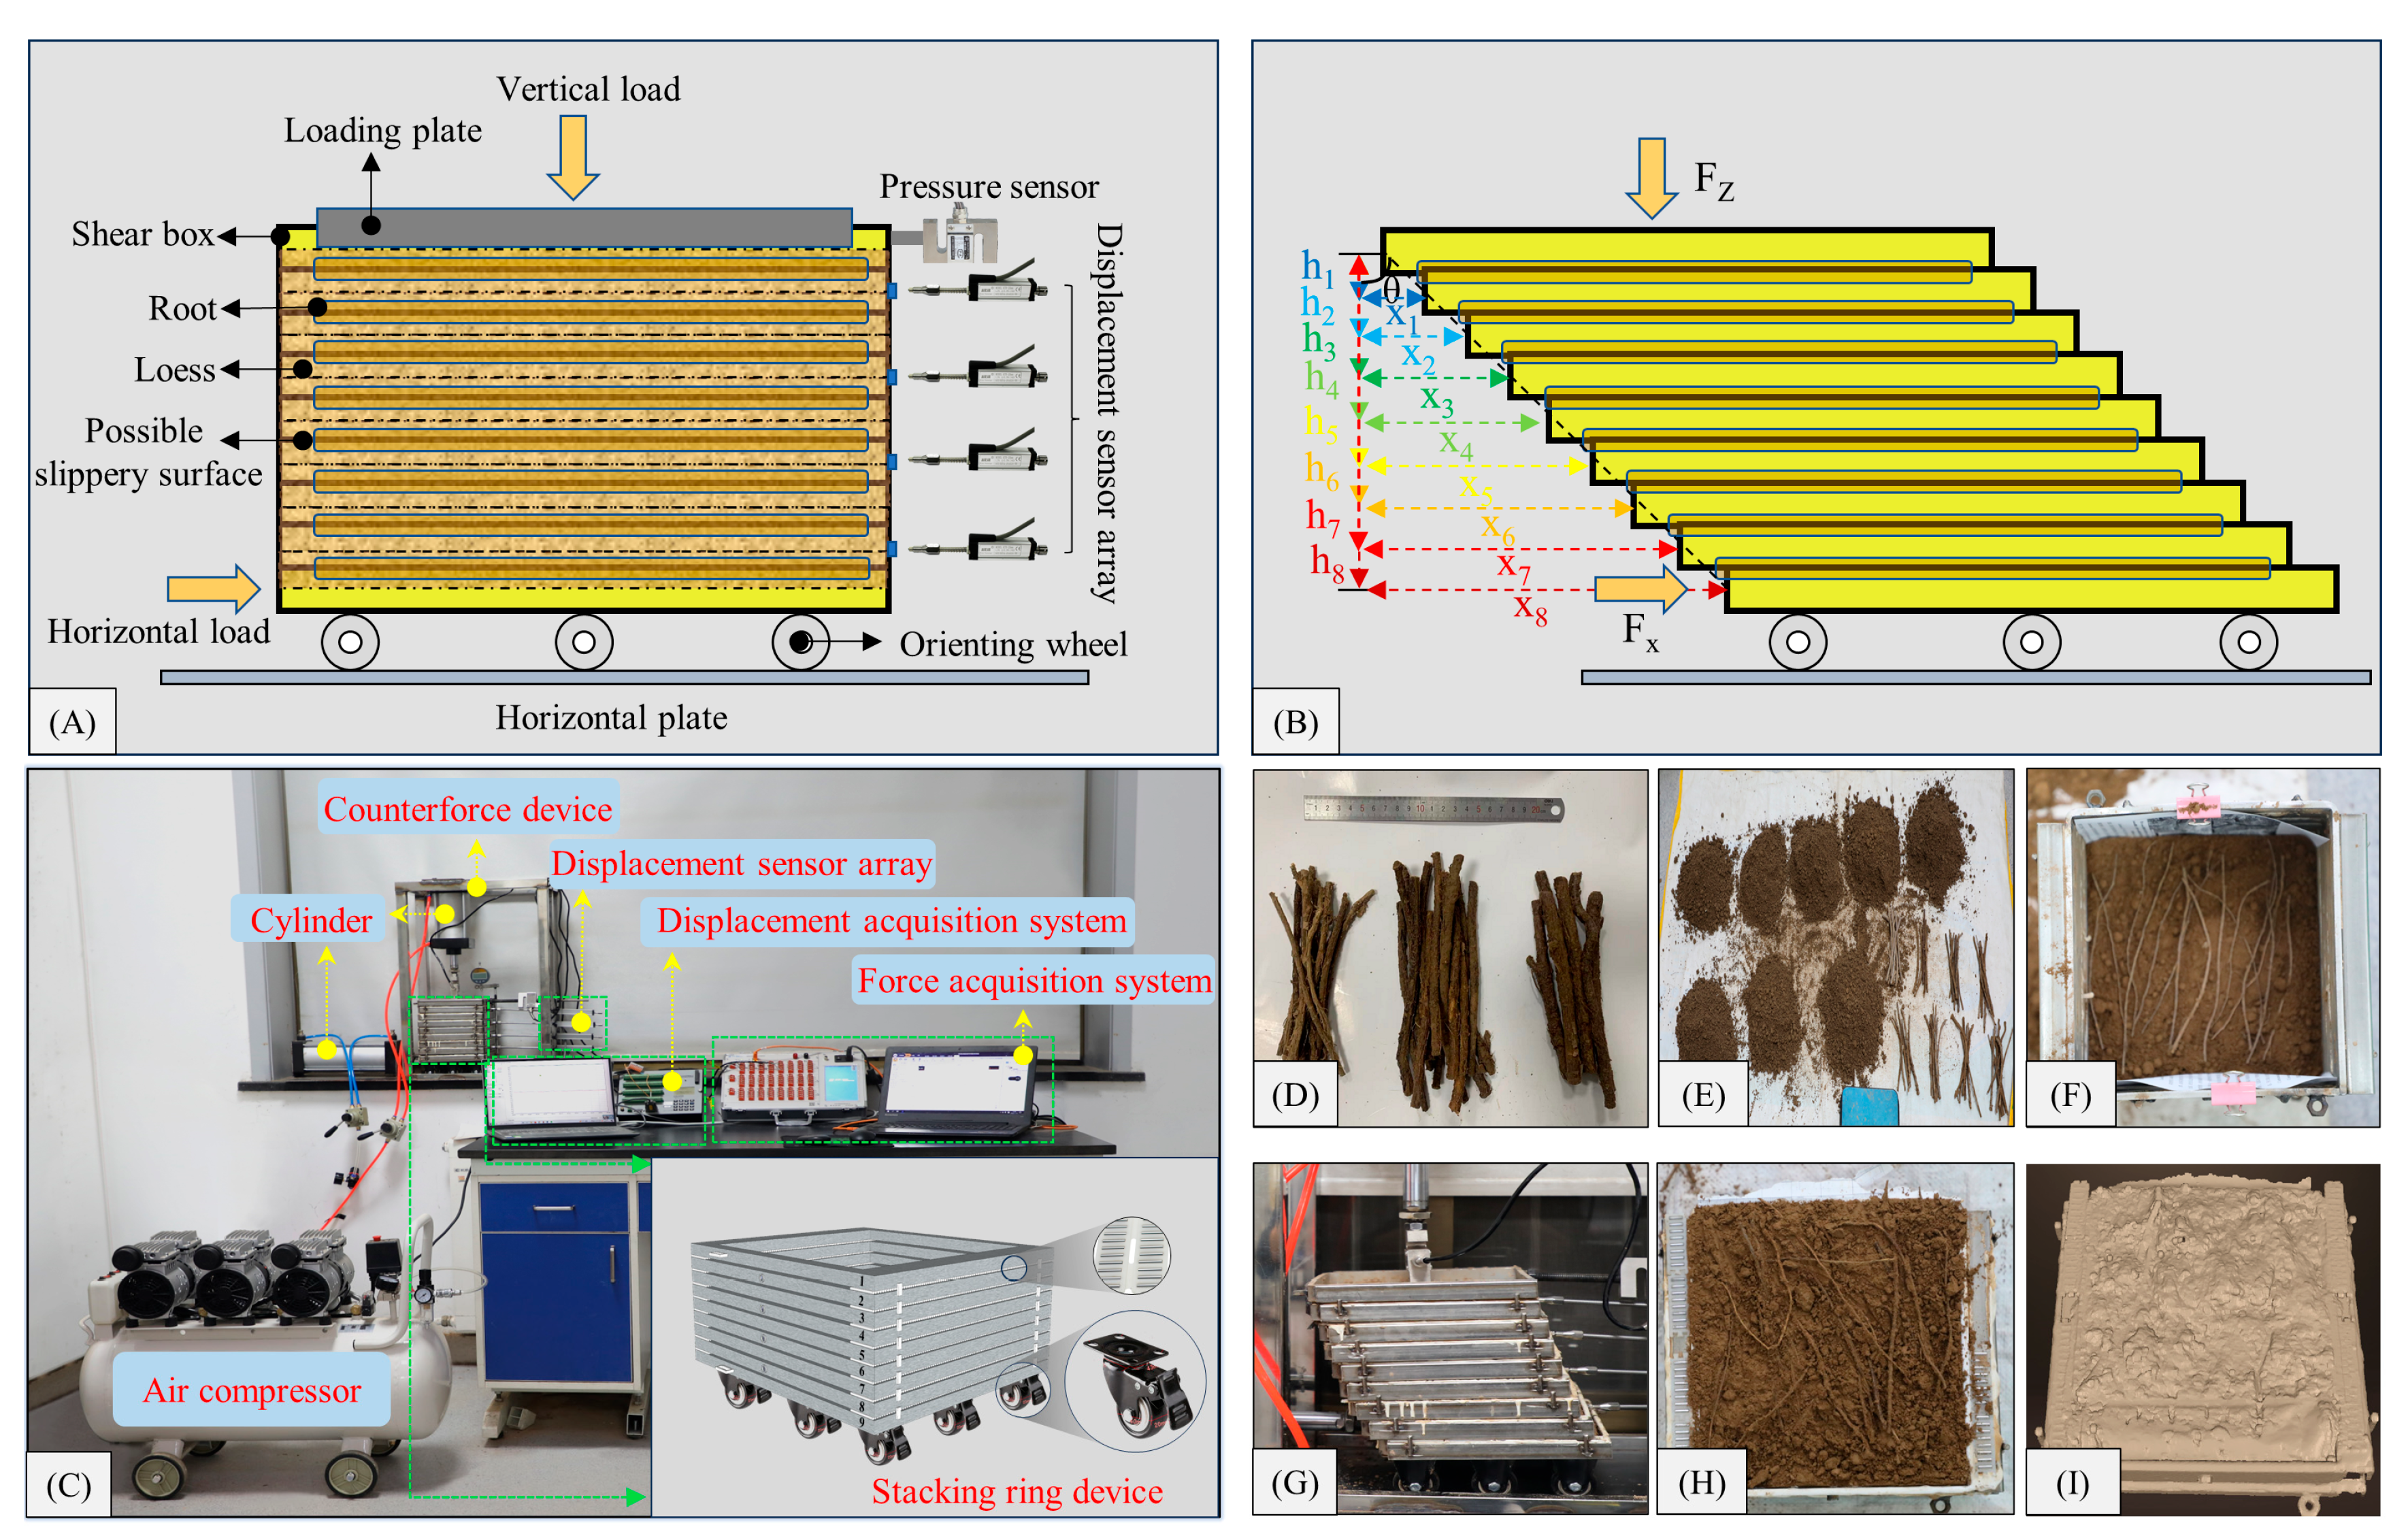
2.4. Test Apparatus and Methods

2.4.1. Single Shear Test at the Root–Loess Interface

(1) Introduction to stacked-ring single shear instruments
A self-developed, stacked-ring, single shear apparatus was fabricated to implement the research plan. It primarily comprises a stacked-ring shear box, a reaction structure, a loading device, a deformation measurement device, and a data acquisition system (Figure 5A,C).
The stacked-ring shear box consists of nine stainless steel frames, each measuring 20 × 20 × 2 cm. At the bottom of the shear box, nine directional wheels are installed, and six roller needle bars (4.5 × 1.5 × 0.25 cm) are positioned at the interface of the frames to minimize interface friction. Additionally, side stop devices measuring 1 cm in length and 0.4 cm in diameter are installed on both sides of the frames at positions 2, 4, 6, and 8 to ensure the shear occurs in a constant direction. Circular grooves with a 0.5 cm diameter are installed at the central positions to prevent lateral sliding of displacement sensors during use. Two diagonal stainless steel positioning rods (26 × 0.6 cm) are installed on the first and ninth frames. The reaction structure primarily consists of a steel pipe framework with dimensions of 60 × 50 × 30 cm for the upright frame, 80 × 30 × 0.75 cm for the base plate, and 19.0 × 19.0 × 0.75 cm for the pressure plate; the loading device mainly comprises an air compressor and a cylinder, with the gas pressure from the air compressor driving the cylinder piston to push the pressure rod, thereby achieving horizontal and vertical loading forces within the stacked frames. Two YBY-3KN force sensors (sensitivity 1.33 μV/KN) are utilized for force measurement. Vertical deformation is measured using an electronic dial indicator fixed on the pressure plate, whereas horizontal deformation is measured using four self-resetting, miniature KTR displacement sensors. The system is complemented by a Campbell CR3000 data acquisition system and a DH3818Y static stress–strain testing analysis system.
(2) Single shear test procedure at the root–loess interface
The procedure is as follows:
1. Using a 3D laser scanner and a steel ruler, categorize the roots of different diameter ranges into Type I, II, and III roots (Figure 5D).
2. Divide the target soil with the desired water content and the roots with specific root ratios into eight portions. Use a layer-by-layer compaction method to create root–loess samples inside the shear box. The roots are positioned horizontally within the sample (Figure 5E,F).
3. Connect all air pipes and lines and turn on the power for all equipment.
4. Adjust the positions of the force and displacement sensors to ensure full contact with the shear box. Zero out the force and displacement collection systems and set the sampling frequency to one sample per second.
5. Initially consolidate the specimen according to the controlled vertical stress. Once the dial gauge values stabilize, proceed with the shear test.
6. Adjust the shear rate to 0.8 mm/min during the shear test by regulating the cylinder’s inlet valve. Continuously observe the damage phenomenon and shear stress changes in real-time during the shearing process (Figure 5G). The test concludes when the maximum shear stress or strain reaches 5%, as per the termination criterion, and the shear stress at the end of the test is defined as the failure stress. Finally, after displacements occur in adjacent frames, place magnetic retroreflective markers around the typical root–loess shear failure surface (Figure 5H) and conduct a comprehensive 3D laser scan to reconstruct the 3D morphology of the shear failure surface (Figure 5I).
7. Data results processing. Use the displacement sensor array to measure the shear displacements x1, x2, x3, …x8; vertical compression distances h1, h2, h3, …h8; vertical compression amount z; horizontal cross-sectional area A of the specimen; and measure the results of the horizontal thrust force Fx and vertical load Fz (Figure 5B). Calculate vertical stress (σz), horizontal shear stress (τzx), and shear strain (γ) as follows:
σ z = F Z A
τ z x = F x A
γ = ( a r c t a n x 1 h 1 z + a r c t a n x 2 h 2 z + a r c t a n x 3 h 3 z + a r c t a n x 8 h 8 z ) 8
Considering that the vertical compression z during shear is very small, Equation (3) can be simplified as
γ ( x 1 h 1 + x 2 h 2 + x 3 h 3 + x 8 h 8 ) 8

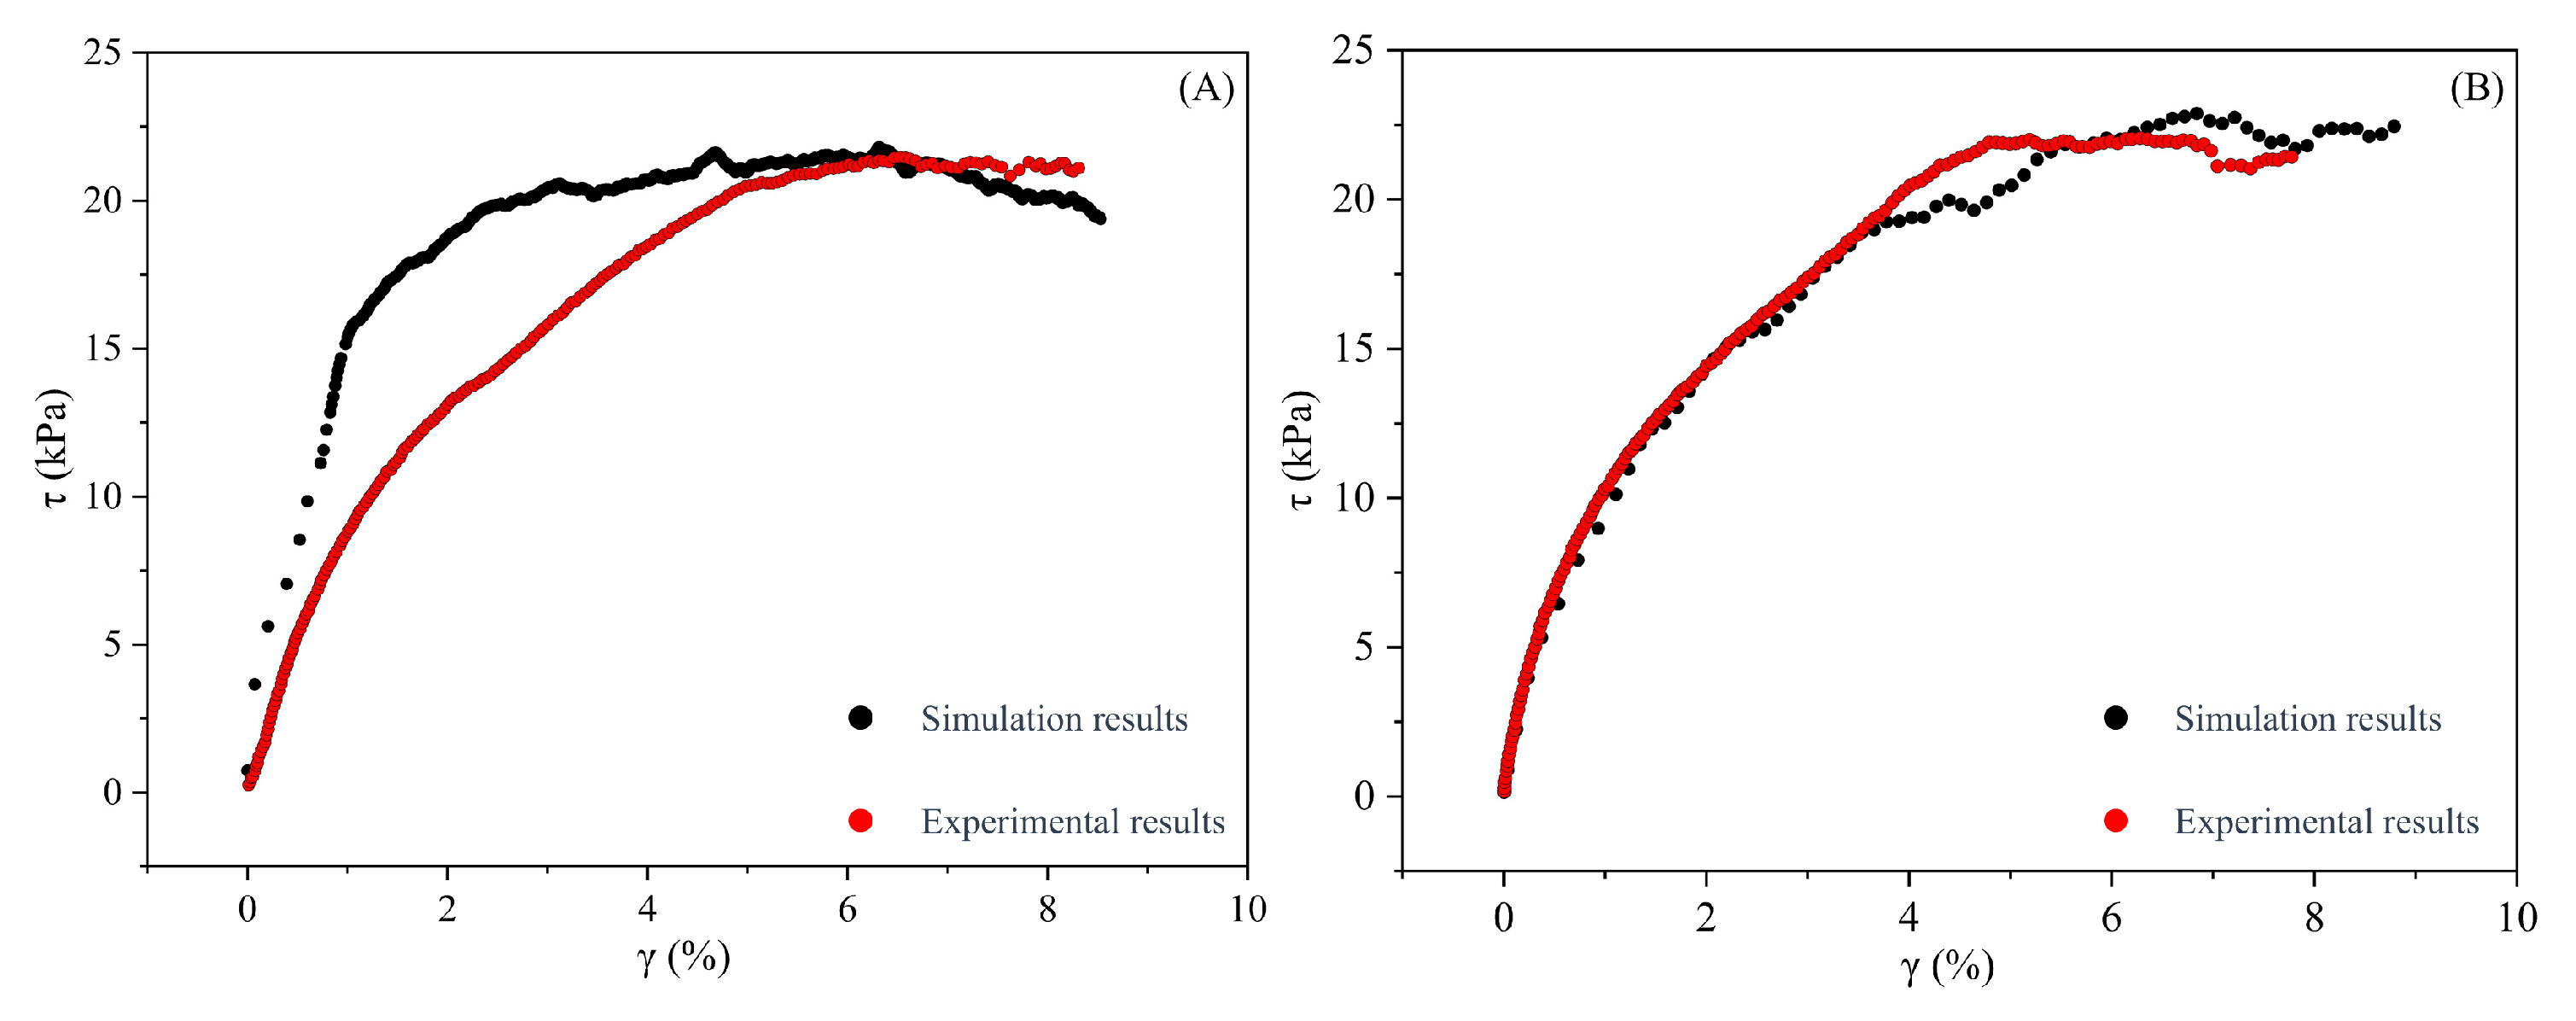
2.4.2. Particle Flow Discrete Element Test

Detailed shear test simulations of root–loess combinations with a water content of 12%, Type II roots, and varying root ratios (0% and 2.11%) were conducted using the PFC in three dimensions (PFC3D) software (version 5.0). The linear contact bond (CB) model was employed to simulate loess at the interface (Figure 6A), while the linear parallel bond (PB) model was utilized for the roots. The contact models between the roots and loess, as well as between loess and stacked frames, were established as linear contact models. Loads were applied to particles through walls to achieve a microscopic simulation of root–loess single shear (Figure 6B). In this context, the red particles represent Robinia pseudacacia tree roots, and the blue cylindrical bonds between particles indicate the linear PB contact model. Cyan particles represent loess particles, with the green cylindrical bonds indicating the linear CB contact model. The green cylindrical bond between roots and loess particles represents a linear contact model (Figure 6C). Additionally, the green cylindrical bond on cyan loess particles indicates the linear contact model contact between loess and the loading plate (Figure 6D). During the shearing process, it is essential to ensure that the radial servo through the wall maintains a confinement pressure deviation within 1% during loading.
The determination of model parameters is based on fitting the stress–strain curves derived from experimental data. Figure 7 shows the numerical simulation results of loess and root–soil samples. The density of the soil particles is 2.7 × 10³ kg/m3, and the diameters of the loess particles are 10–16 mm, enlarged by a factor of 50, generated using a uniform probability distribution, totaling 15,187 particles. The diameters of the root particles range from 5.5 mm. The reference gap between the root and loess particles is 0.0 m. Table 2 provides details of the other parameters. A comparison indicates a strong correlation between the experimental results and the fitting results, with a basic consistency in the trends of the curves. When the strain is between 0% and 4%, the sample remains in the elastic stage, and stress increases rapidly with strain. Upon reaching 5% strain, the stress increases more slowly with further strain, indicating a transition to the plastic stage. Subsequently, as strain continues to increase, the stress levels off, maintaining a constant value within the plastic stage (Figure 7A,B).

3. Results and Discussion

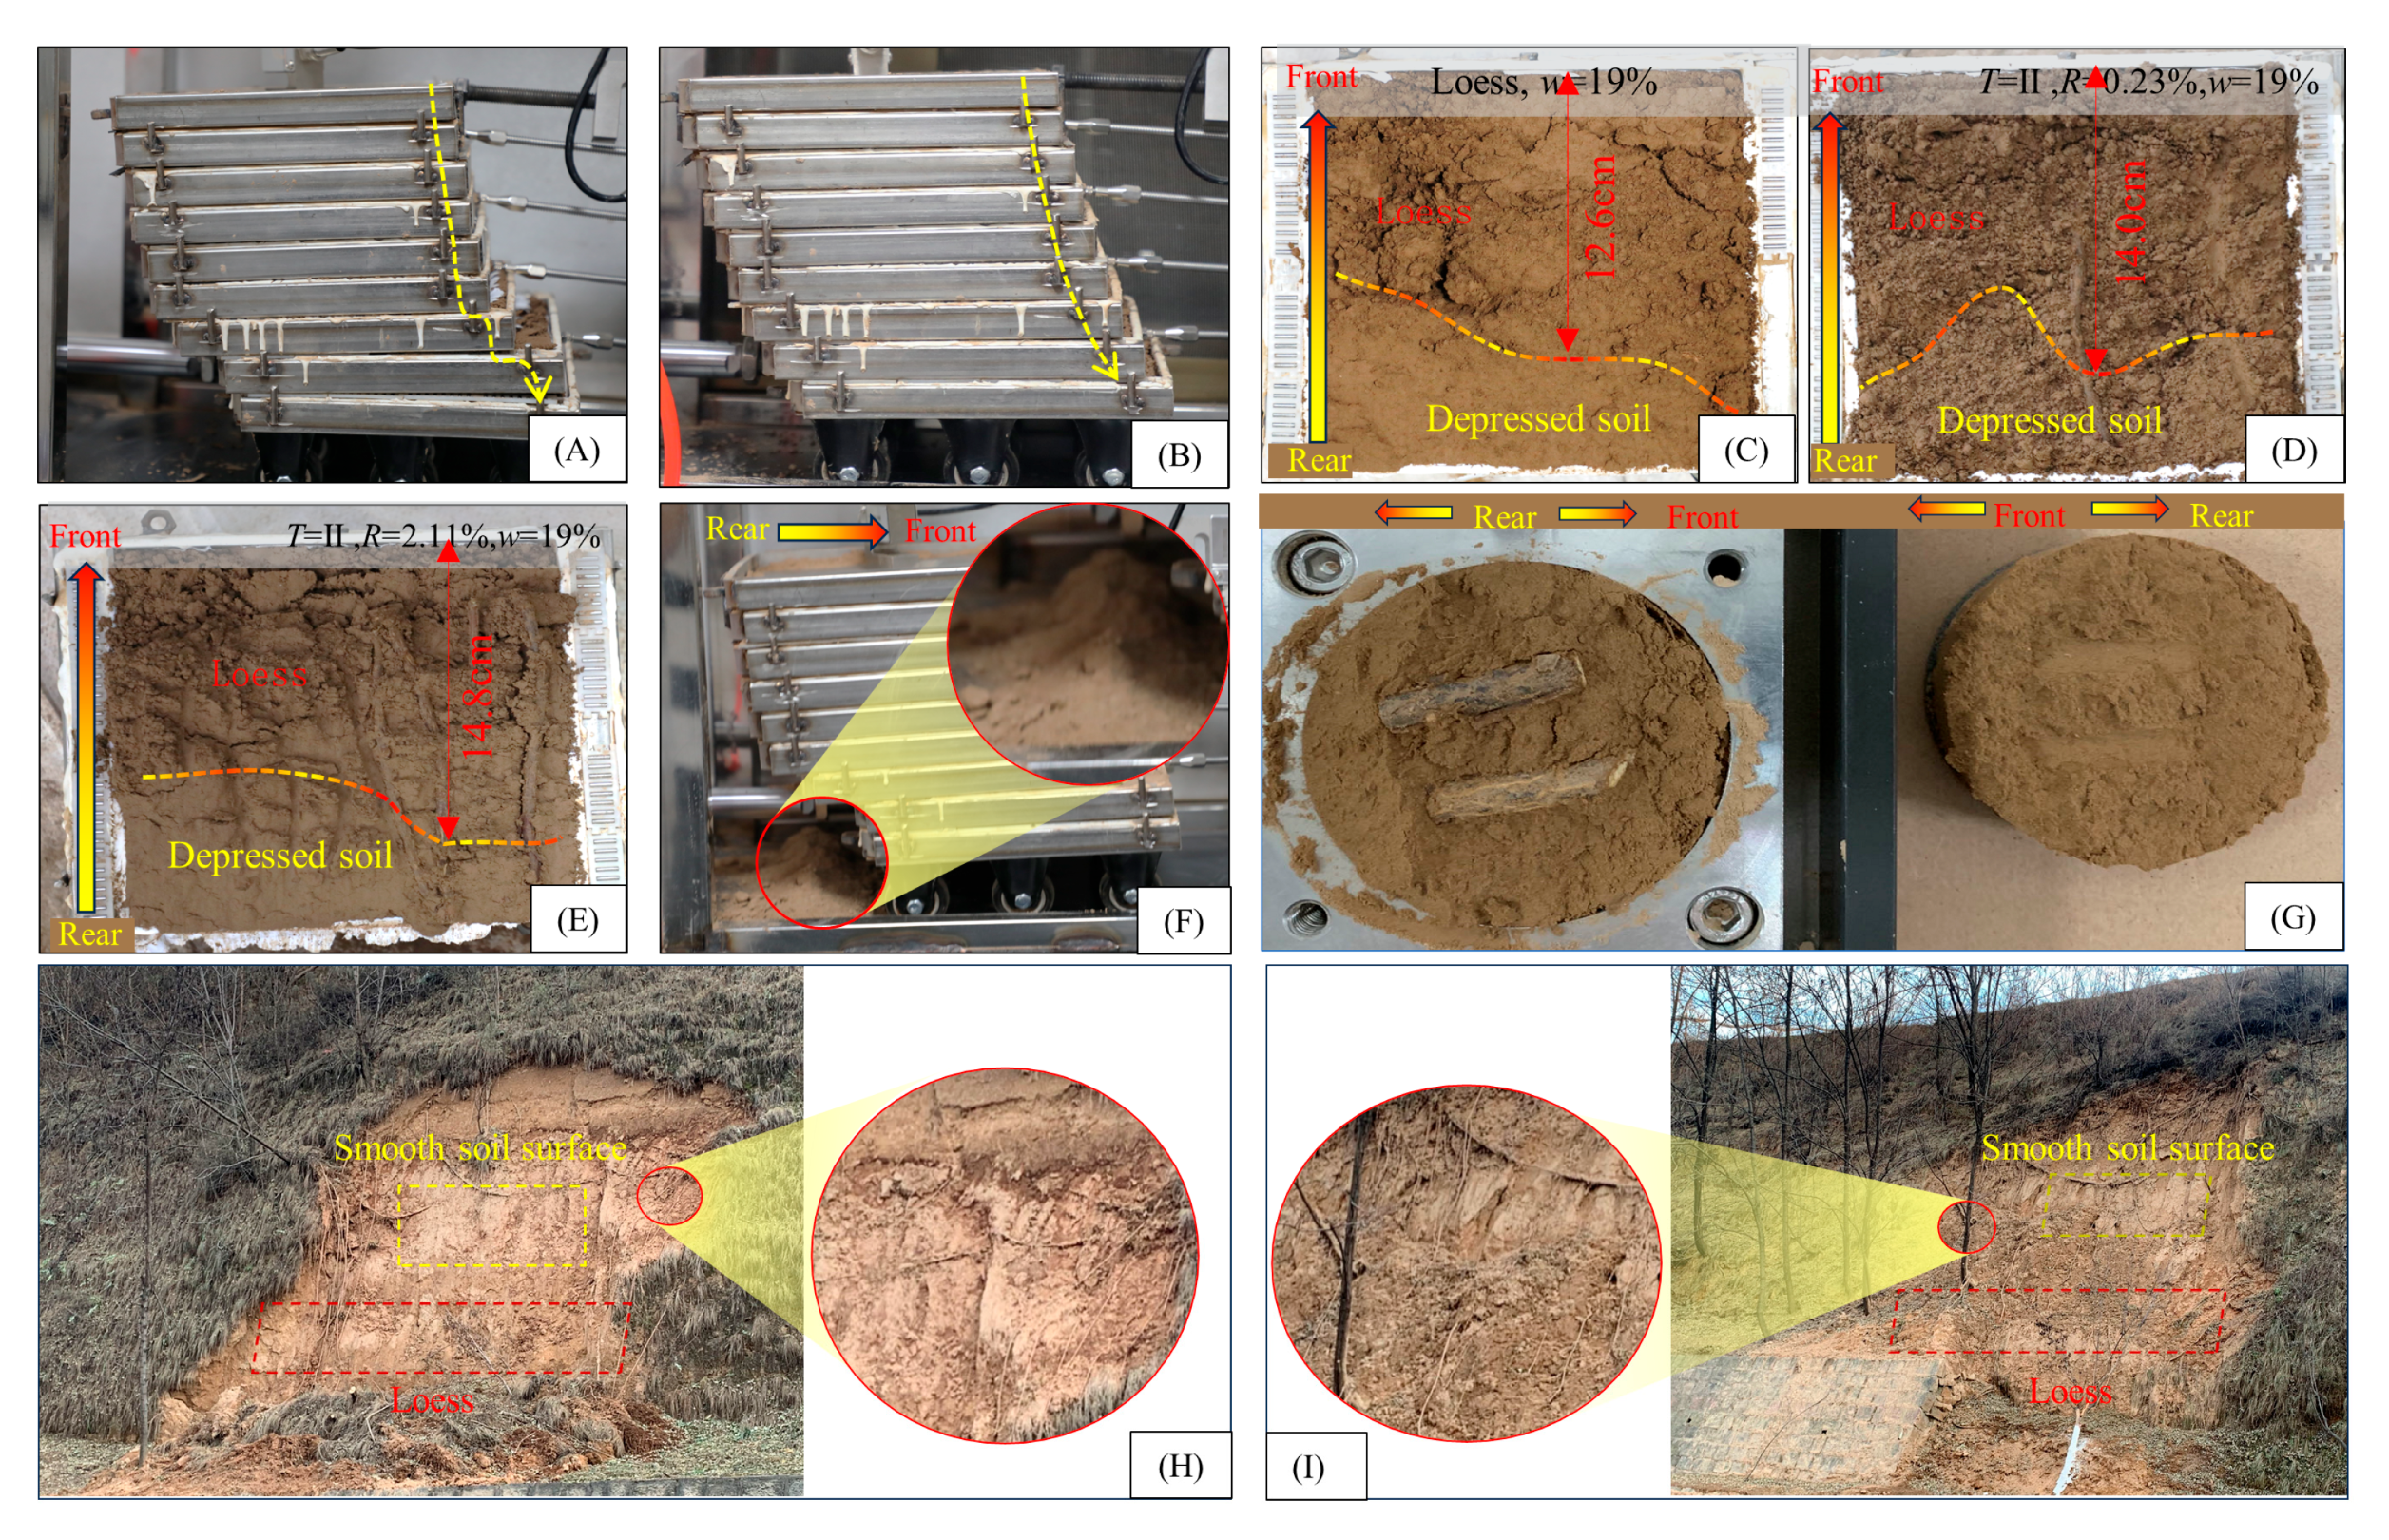
3.1. Characteristics of the Root–Loess Shear Failure Surface

3.1.1. Macroscopic Morphological Characteristics of the Root–Loess Shear Failure Surface

Figure 8 illustrates the macroscopic morphological characteristics of the root–loess shear failure surface under various experimental conditions, including load, water content, root type, and root content. The findings are as follows:
(1) Slippage mode of the frames: In most samples during shear, the frames undergo uniform tilting, with only a few samples showing cliff-like slippage at the seventh or eighth ring. This result indicates the presence of multiple fragile shear failure surfaces in the root–loess interface, and the interface strength is not constant (Figure 8A,B). Additionally, soil accumulates in the opposite direction of the horizontal thrust when the loess has a lower water content, indicating that the sheared root–loess interface has a loose structure (Figure 8F).
(2) Shear failure surface morphology: The smoothness of the shear failure surface of the root–loess sample varies, with the front part being rough and loose and the rear part smooth with depressions. Under the same water content conditions, the area of the rough and loose region in the front part of the shear failure surface increases with the increase in root content (Figure 8C–E). Moreover, a comparison with the shear surface of direct shear tests under equivalent variable conditions reveals that direct shear tests can only observe horizontally smooth shear failure surfaces and exposed roots (Figure 8G; However, the shear failure surface obtained through the double-ring shear apparatus exhibits consistent features with the sliding surface of unstable slopes in the field (Figure 8H,I). In other words, the double-ring shear test reproduces the destructive morphology of field landslide surfaces, which cannot be achieved in the laboratory using traditional shear instruments.

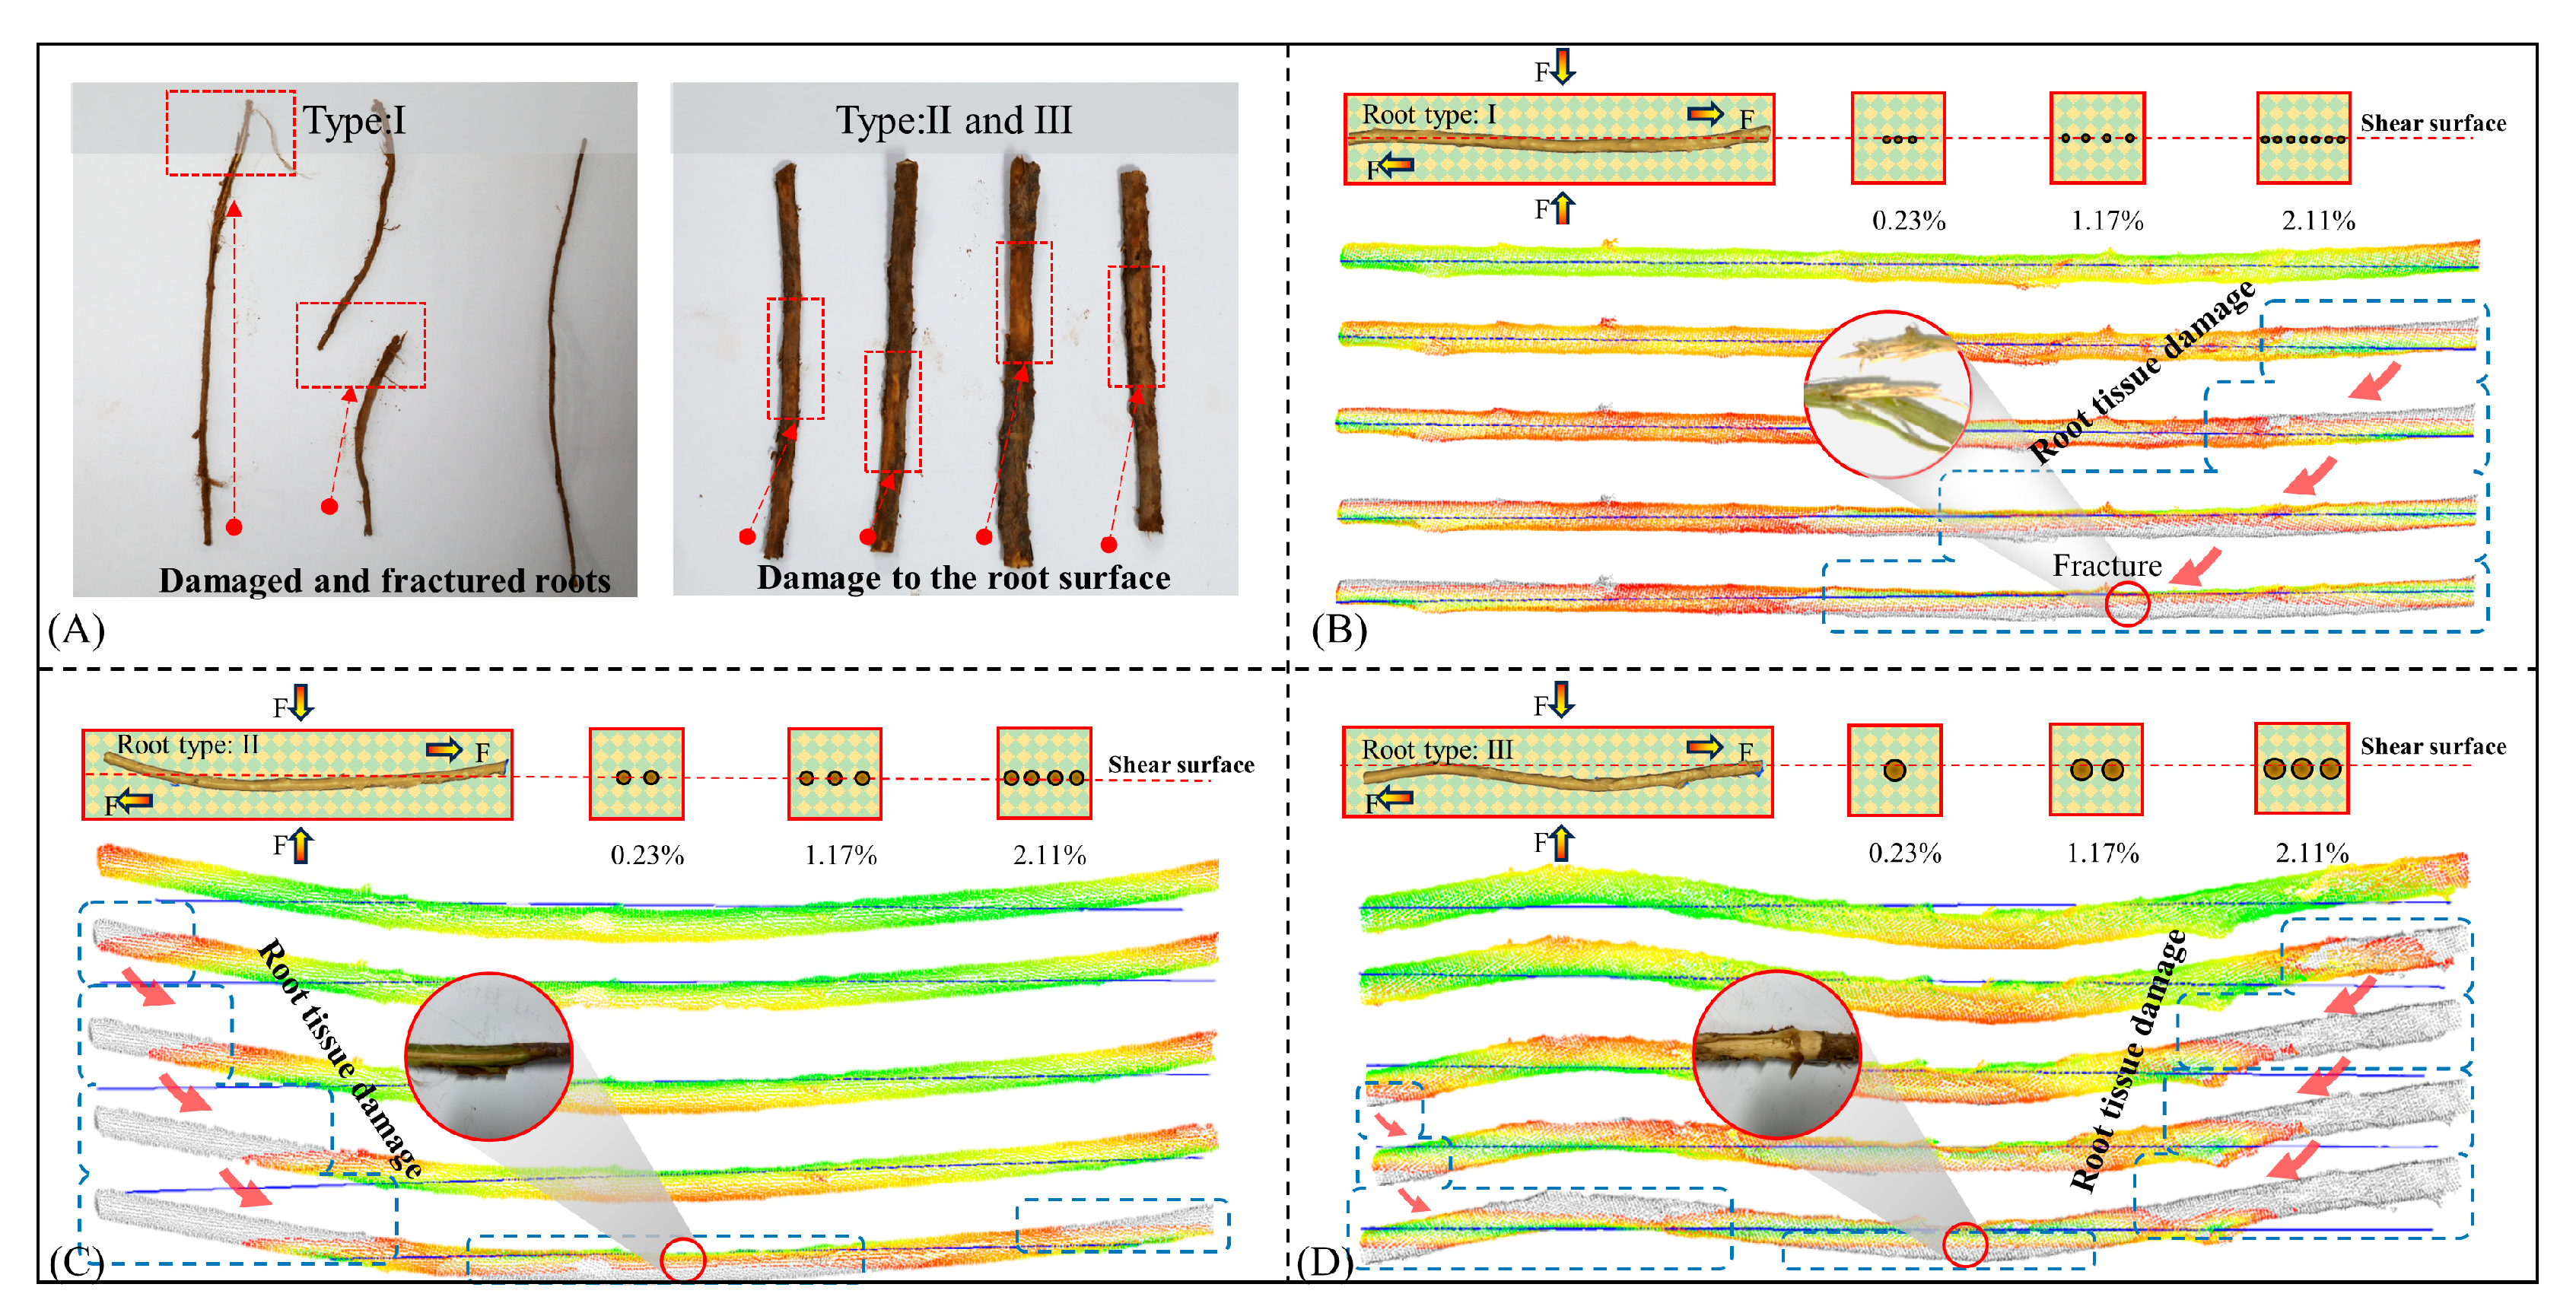
3.1.2. Macroscopic Characterization of Root Damage in Root–Loess Shear Damage Surfaces

Figure 9 illustrates various types of root damage observed on the shear failure surface of the root–soil interface. Type I roots predominantly exhibit shear failure, whereas the degrees of damage in Types II and III roots vary. Damage is primarily observed in superficial peridermal tissues and cortical fiber bundles, with emphasis on uneven surface regions (Figure 9A). To replicate the failure characteristics of different root types during shearing, root damage was simulated using 3DReshaper software (Version 17.1.25190.0) based on root point cloud data. In the simulation, each root has a central axis, and damage occurs first in the superficial tissues as the distance from this axis increases, with corresponding point clouds extinguishing earlier. For Type I roots, the area of point cloud distribution expands with increasing shear strain until localized point cloud extinction. The corresponding experimental observation shows a continuous increase in the damaged area of root epidermal tissues, culminating in the fracture of woody tissue (Figure 9B). For Type III roots, point cloud data first extinguish from both sides of the root, eventually spreading toward the middle. The corresponding experimental observation is damage to root epidermal tissues at the ends of the root, with the damaged area increasing with the shear strain growth concentrated near the periderm and cortical fiber bundles (Figure 9D). The damage characteristics of Type II roots are similar to those of Type III roots, with the damaged biological tissues concentrated in the periderm and cortical tissues and with instances of fracture in the woody tissue (Figure 9C). In summary, root damage during shearing can be categorized into fracture and pulling out, consistent with the findings of Pollen and Schwarz [33,34].

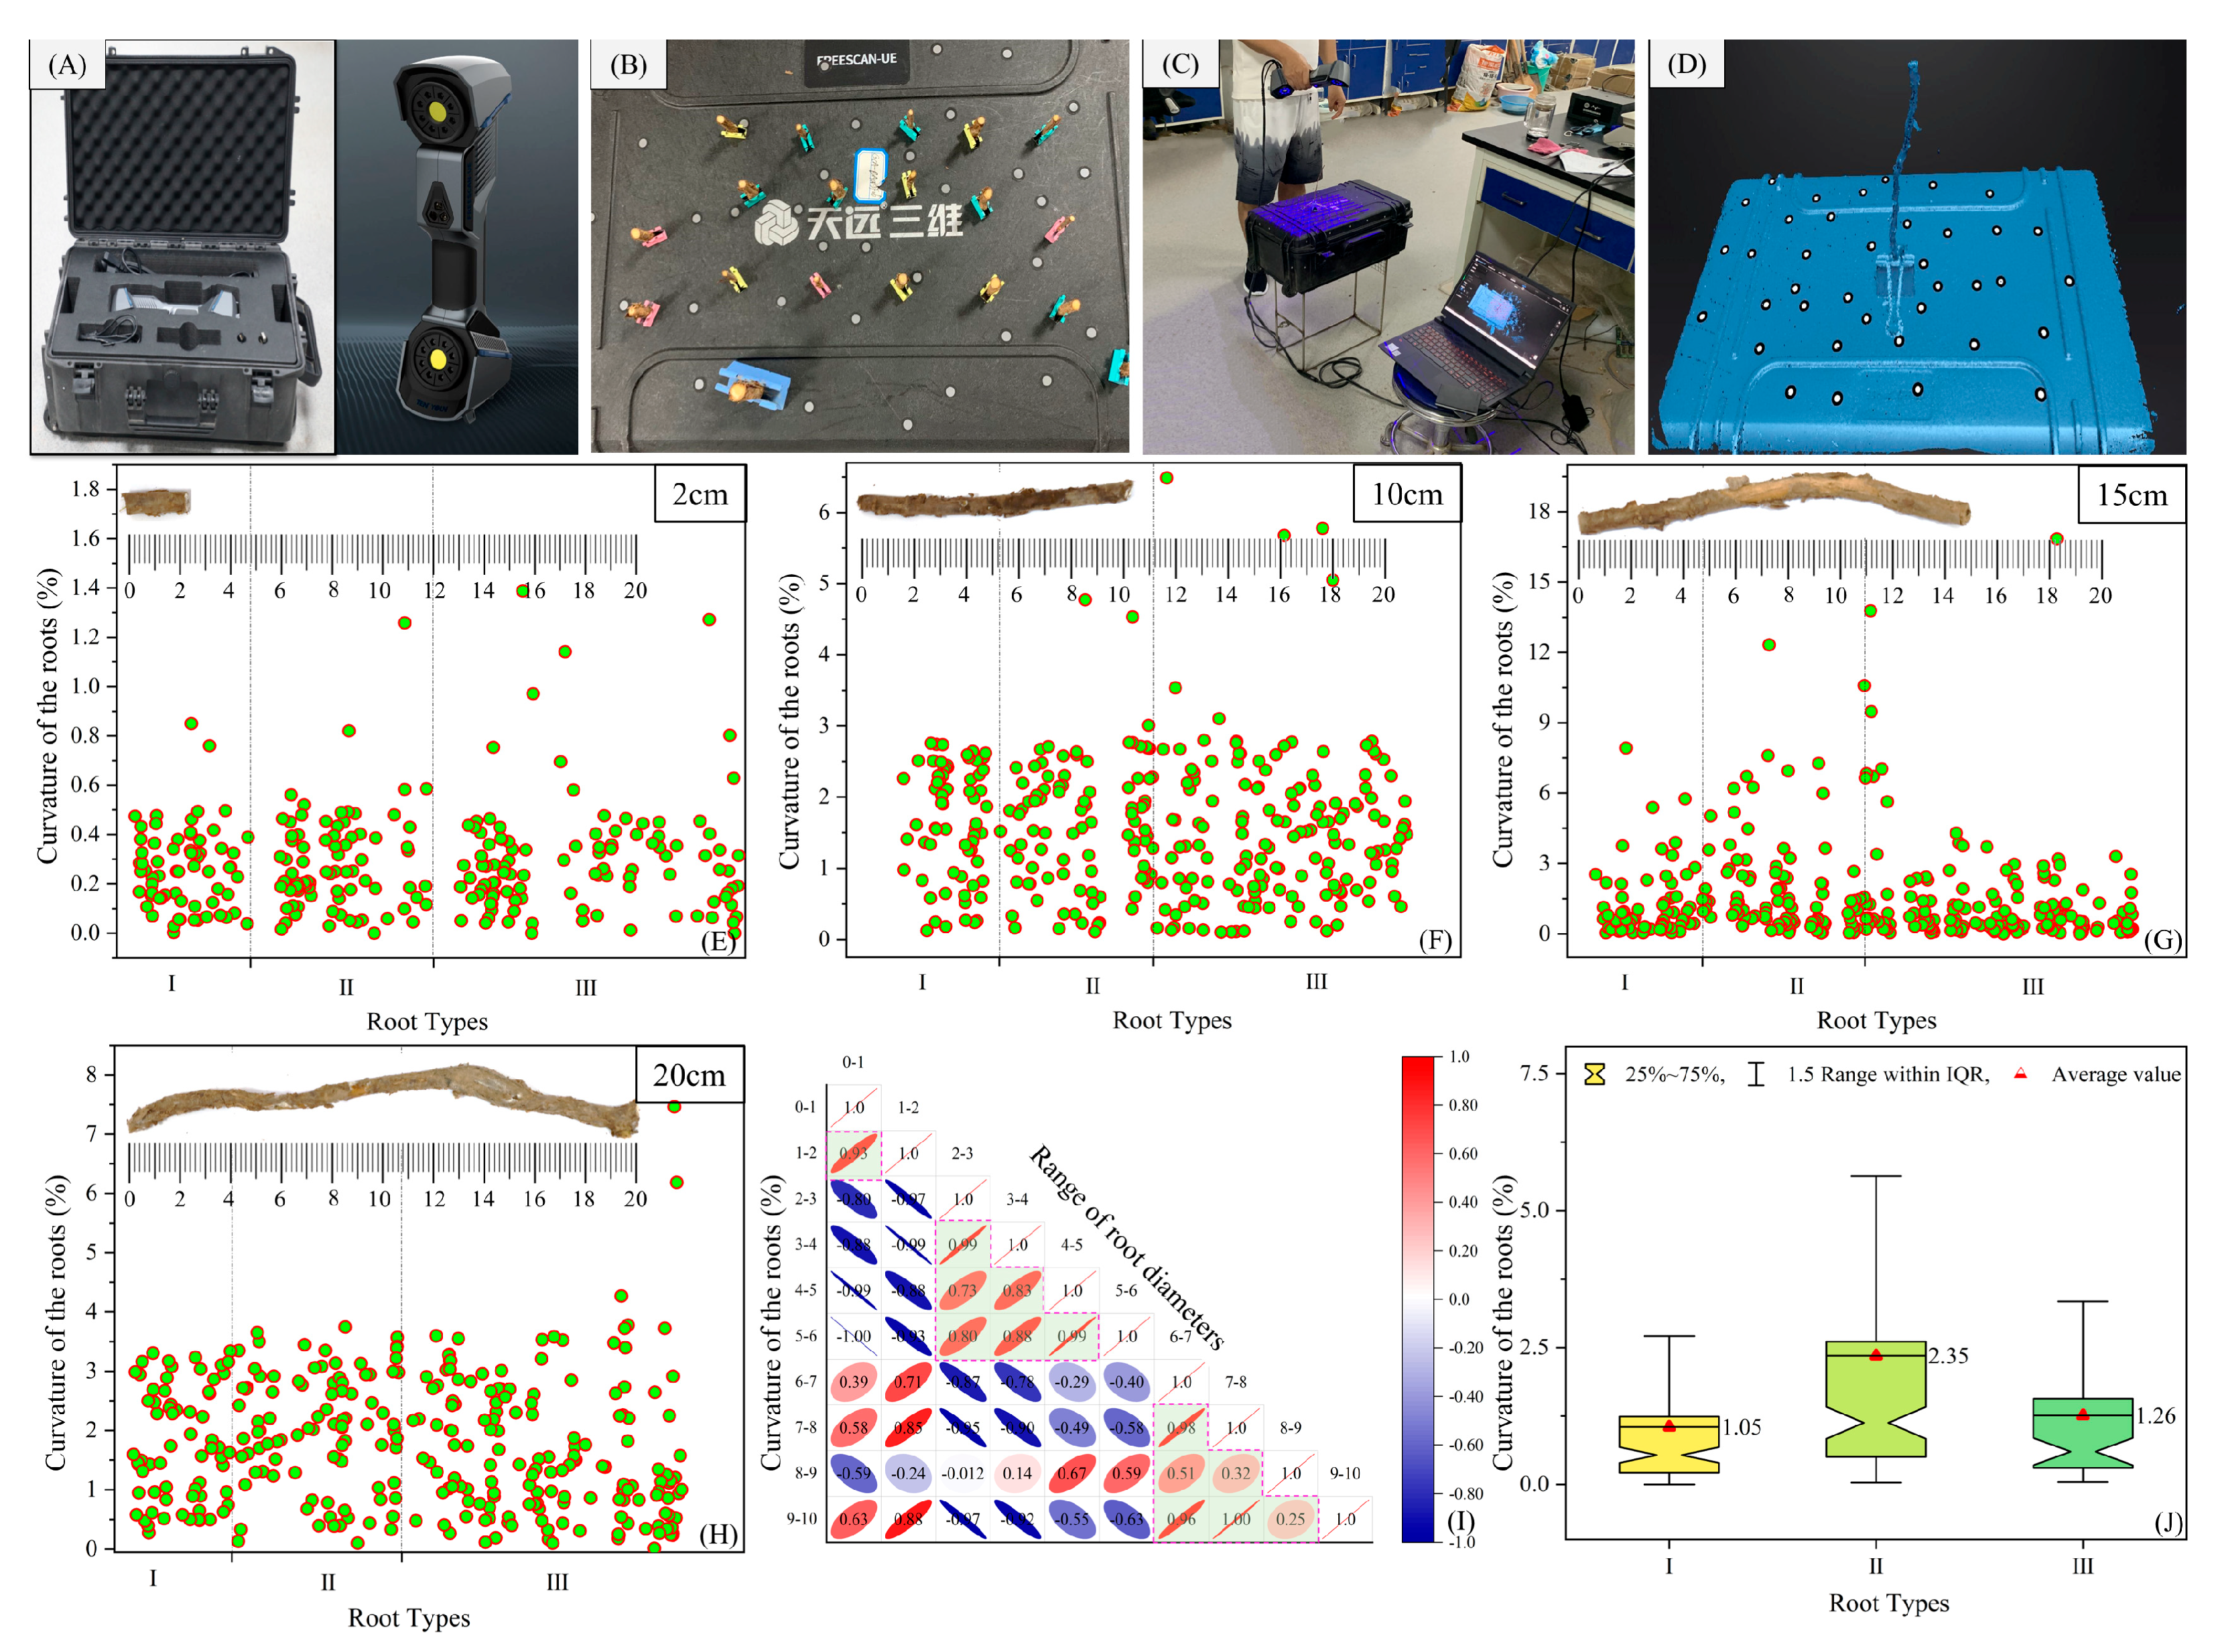
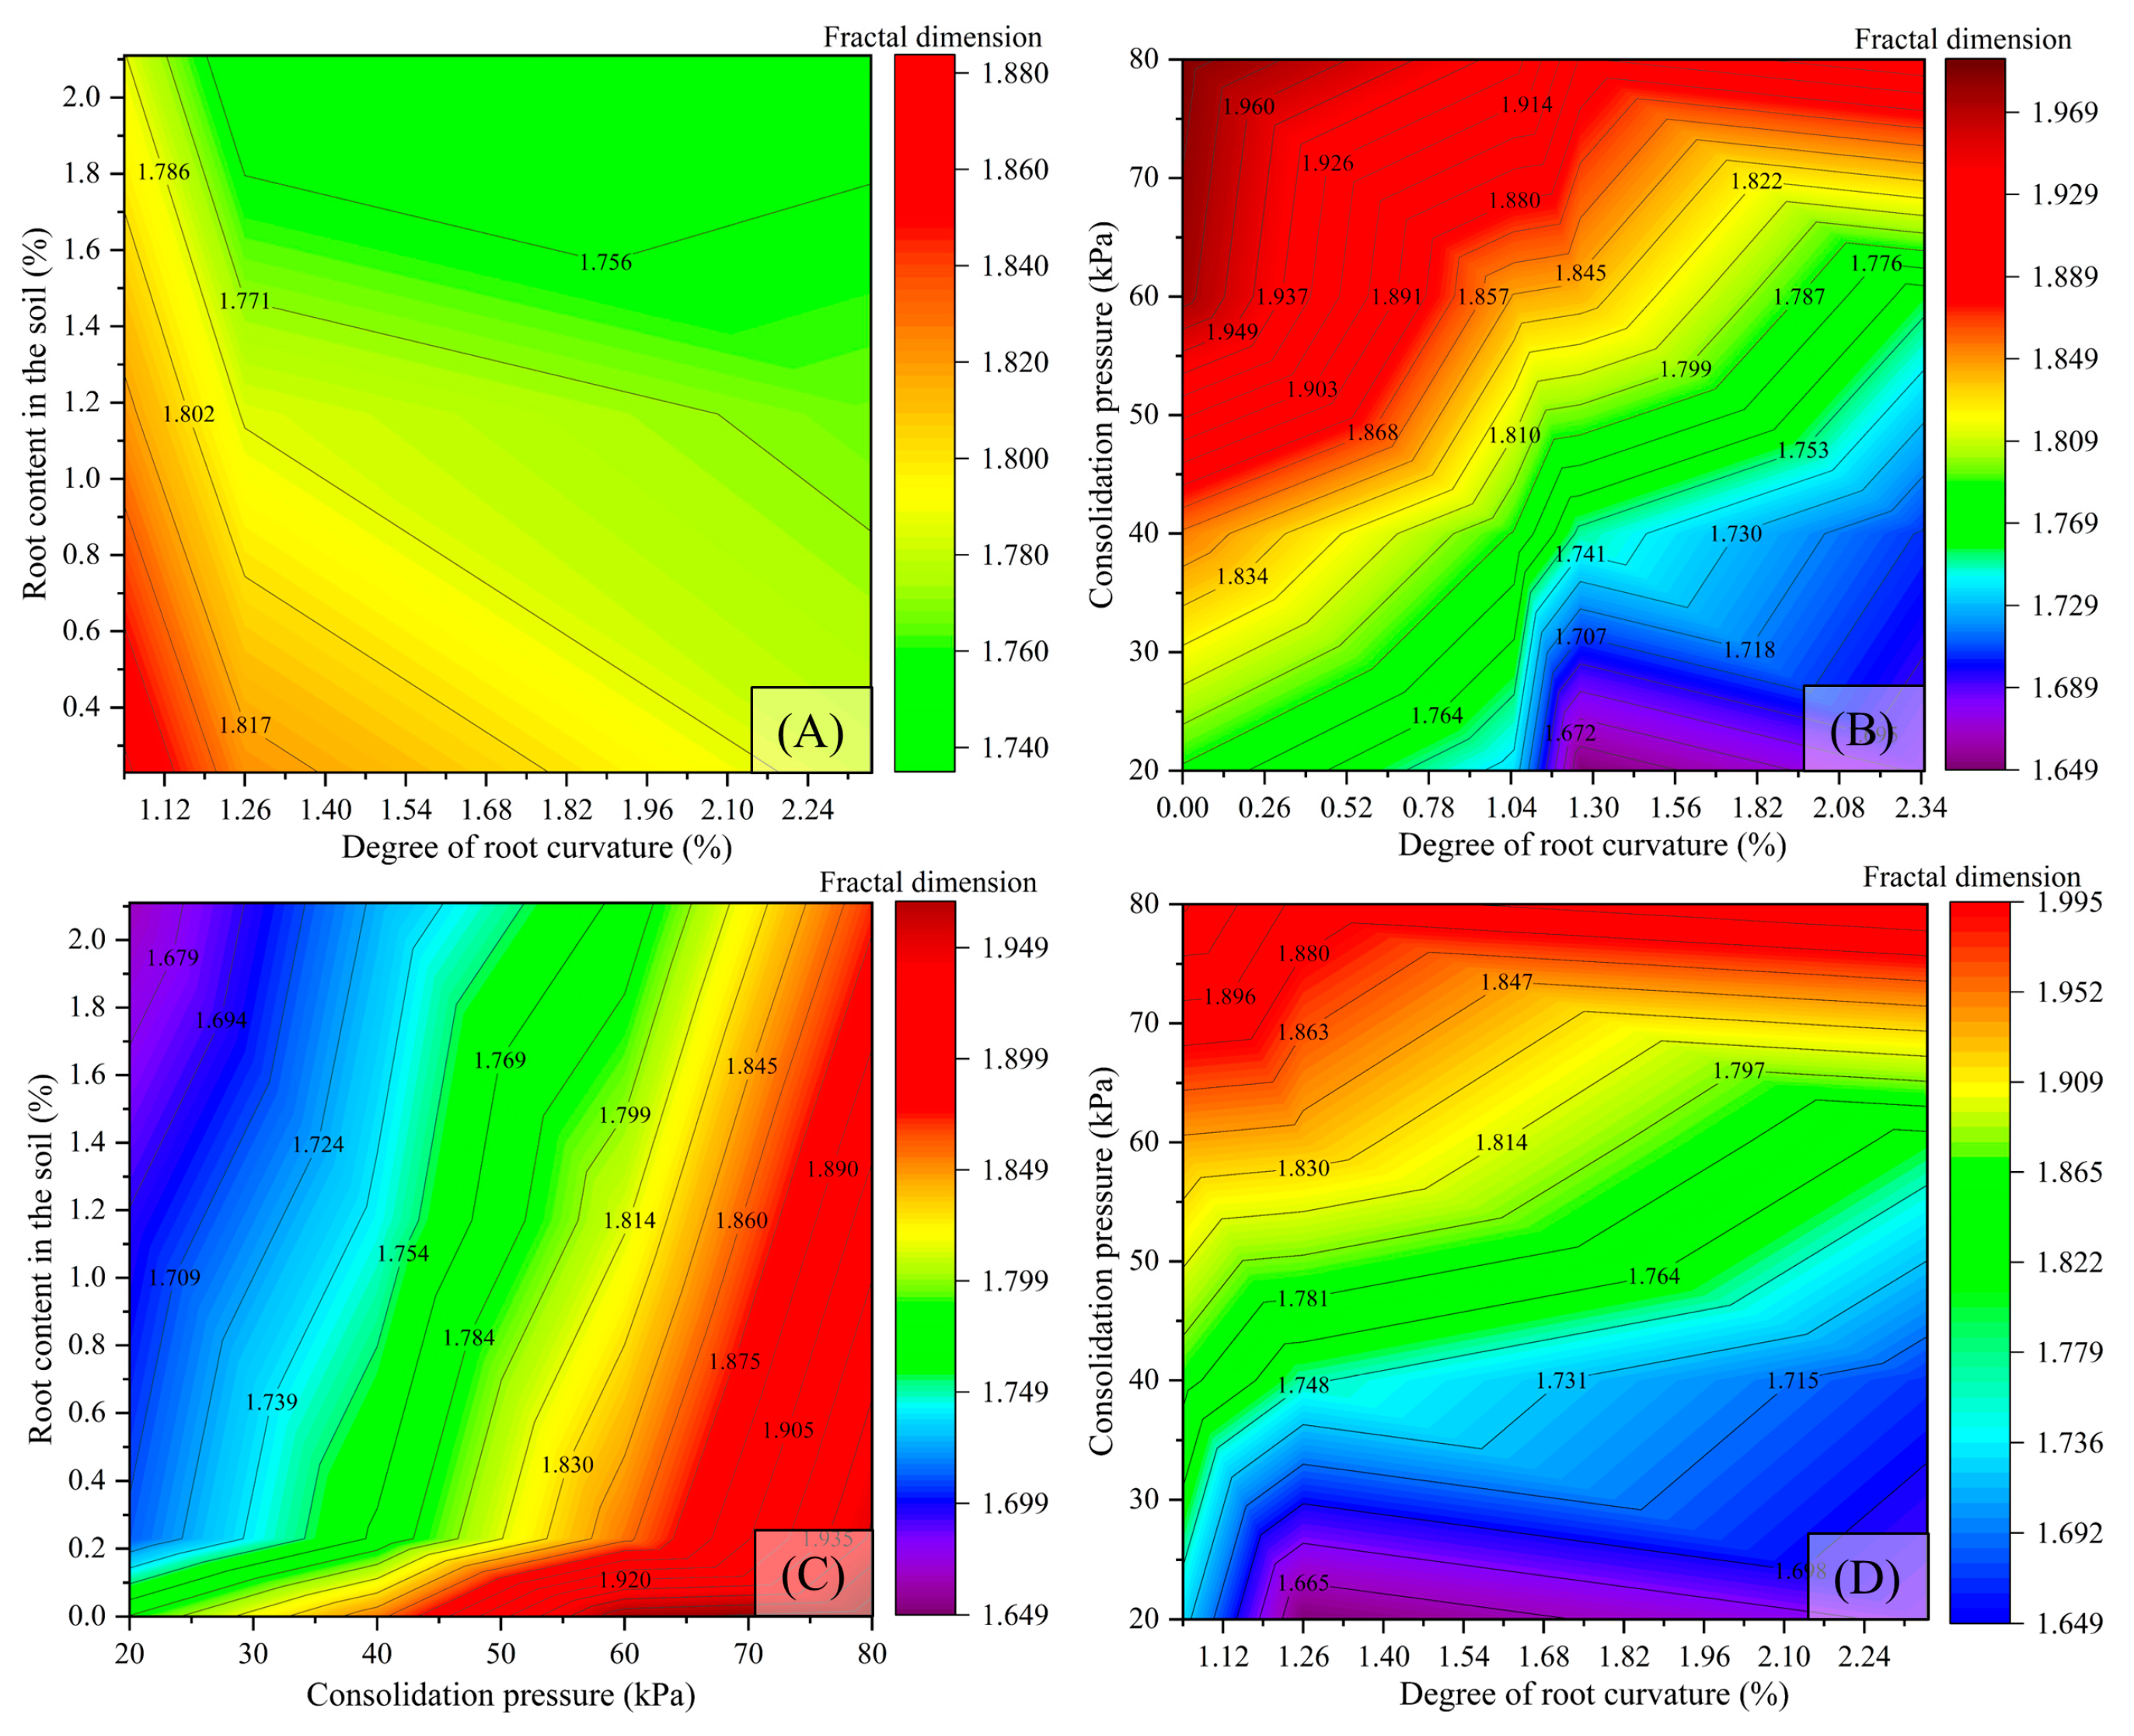
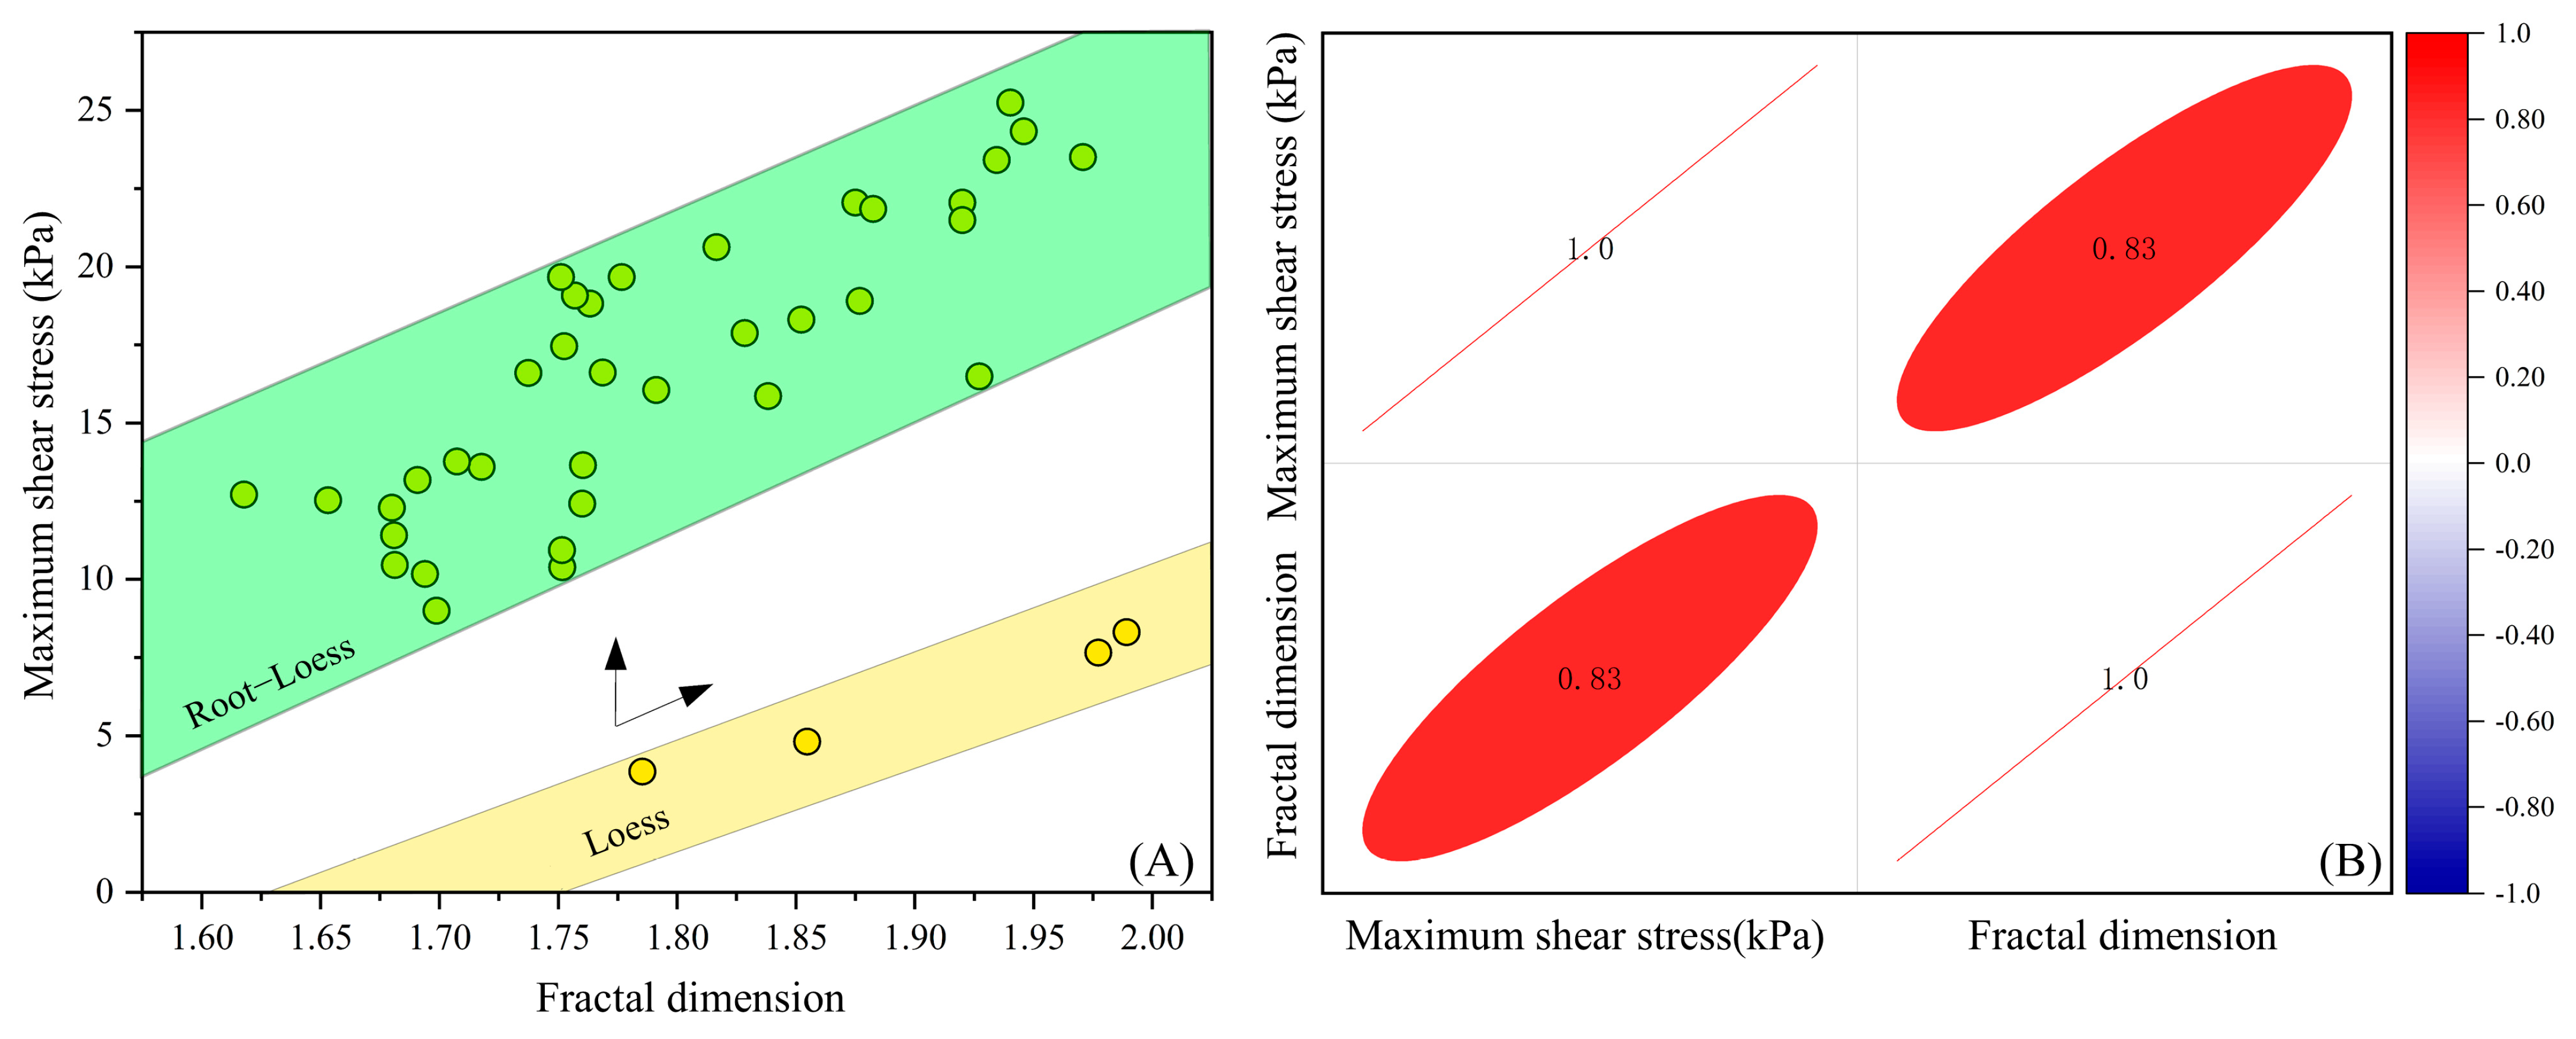
3.1.3. Roughness Characteristics of Root–Loess Shear Damage Surfaces

Figure 10 shows the roughness characteristics of the root–loess shear failure surface:
(1) When the root mass ratio and curvature change, if the curvature value of the roots is less than 1.26%, the fractal dimension of the shear failure surface decreases with an increase in the root mass ratio, transitioning from smooth to relatively rough. When the curvature value of the roots is greater than 1.26%, samples with a higher root mass ratio exhibit a smaller fractal dimension of the shear failure surface, and the interface is rougher (Figure 10A).
(2) When the root mass ratio and consolidation pressure change, if the consolidation pressure is the same, the fractal dimension of the loess failure surface is greater than that of the root–loess interface, indicating that the loess shear failure surface is smoother. As the consolidation pressure varies across the range of 20–40 kPa, 40–60 kPa, and 60–80 kPa, the fractal dimension of the root–loess shear failure surface increases with rising consolidation pressure, suggesting that higher consolidation pressure leads to a more regular and smooth shear failure surface (Figure 10B). Additionally, when both curvature and consolidation pressure are altered, a larger consolidation pressure in loess results in a more regular and smooth shear failure surface. Under identical consolidation pressure, an increase in the curvature of the roots leads to a decrease in the fractal dimension of the root–loess interface, indicating a more irregular and rough shear failure surface (Figure 10B–D).
To clarify the relationship between the fractal dimension of the shear failure surface and shear strength, using samples with a moisture content of 12% (loess and root–loess samples) as typical representatives, the statistical analysis focused on the relationship between the fractal dimension of the shear failure surface and the maximum shear stress (Figure 11). The results indicate that the maximum shear stress at the root–loess interface ranges from 9.00 to 25.25 kPa, with a fractal dimension between 1.62 and 1.97. In contrast, for the loess sample, the maximum shear stress ranges from 3.85 to 8.31 kPa, with a fractal dimension between 1.78 and 1.98. The maximum shear stress of the samples is directly proportional to the fractal dimension, and the maximum shear stress at the root–loess interface is higher than that of the loess sample. Similar research results have been corroborated in the field of rock mechanics [35]. These results reflect the enhancement of shear strength at the root–loess interface due to the influence of roots, which primarily alters the fractal dimension of the interface shear surface by the roots, enhancing interface strength. This result provides a new perspective for quantitatively characterizing the strength criteria of root–soil interaction. Future research should incorporate the variation of the interface fractal dimension into strength criteria to achieve a quantitative characterization of the strength of the root–loess interface.

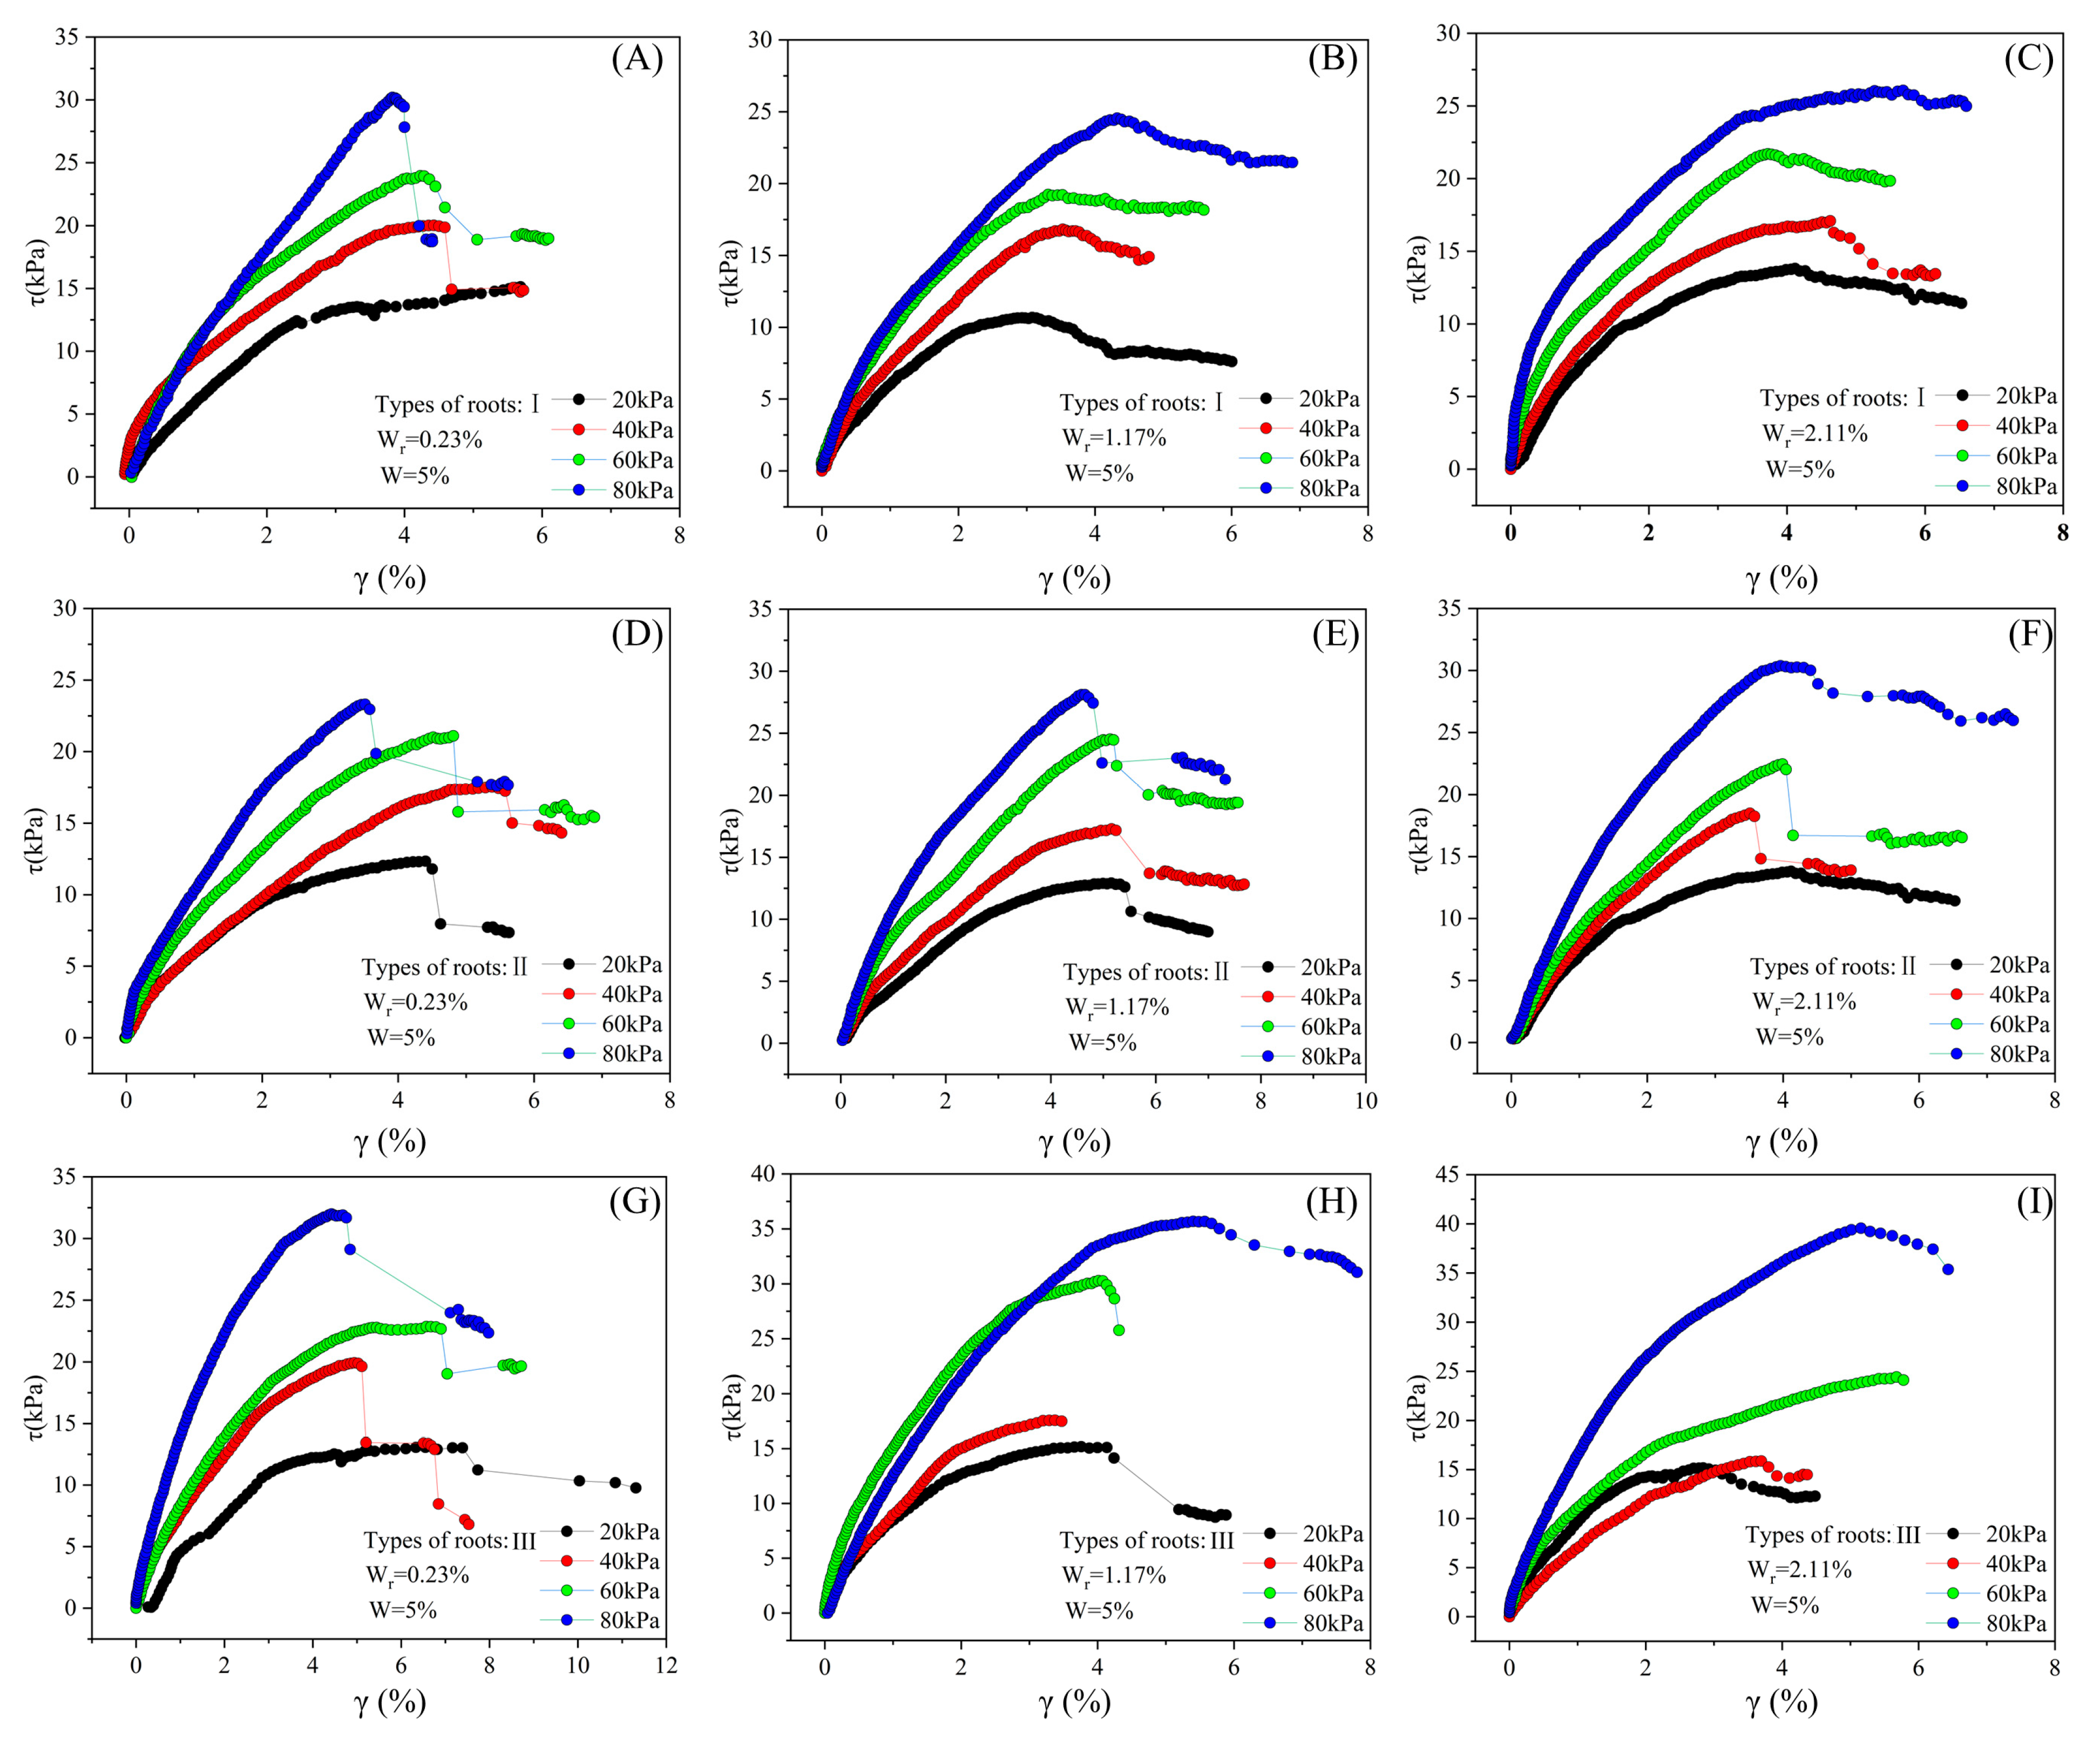
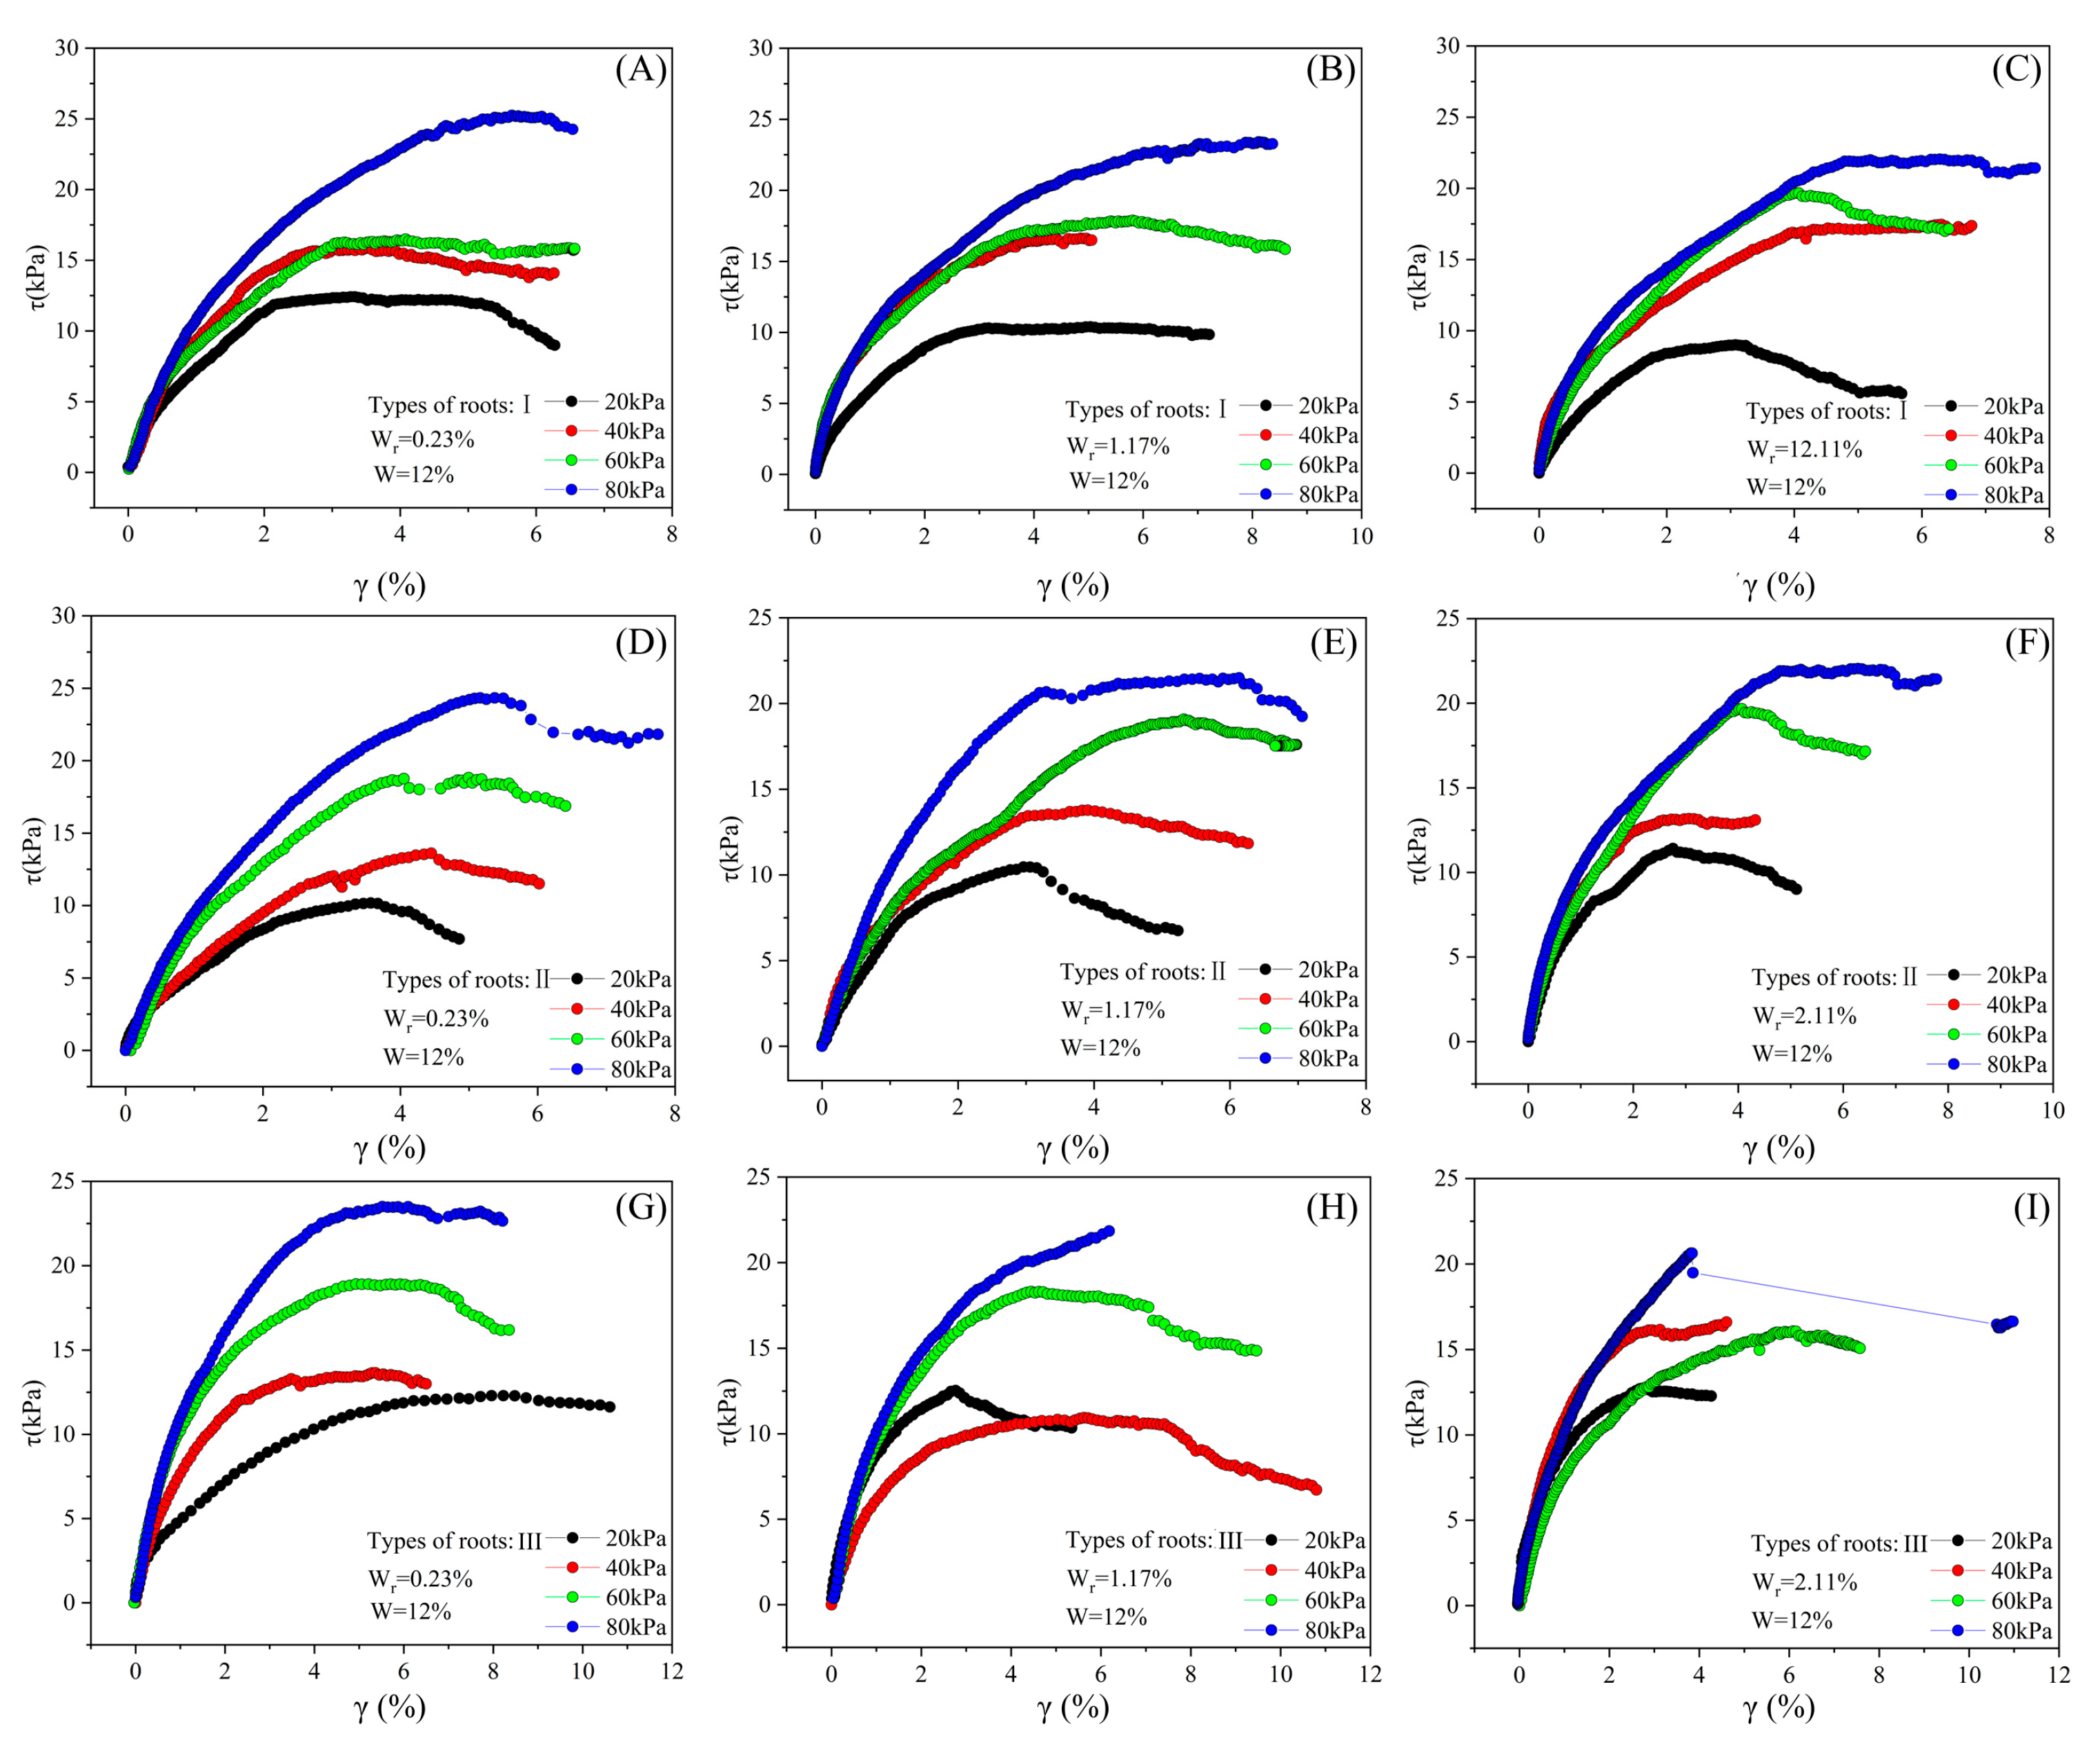
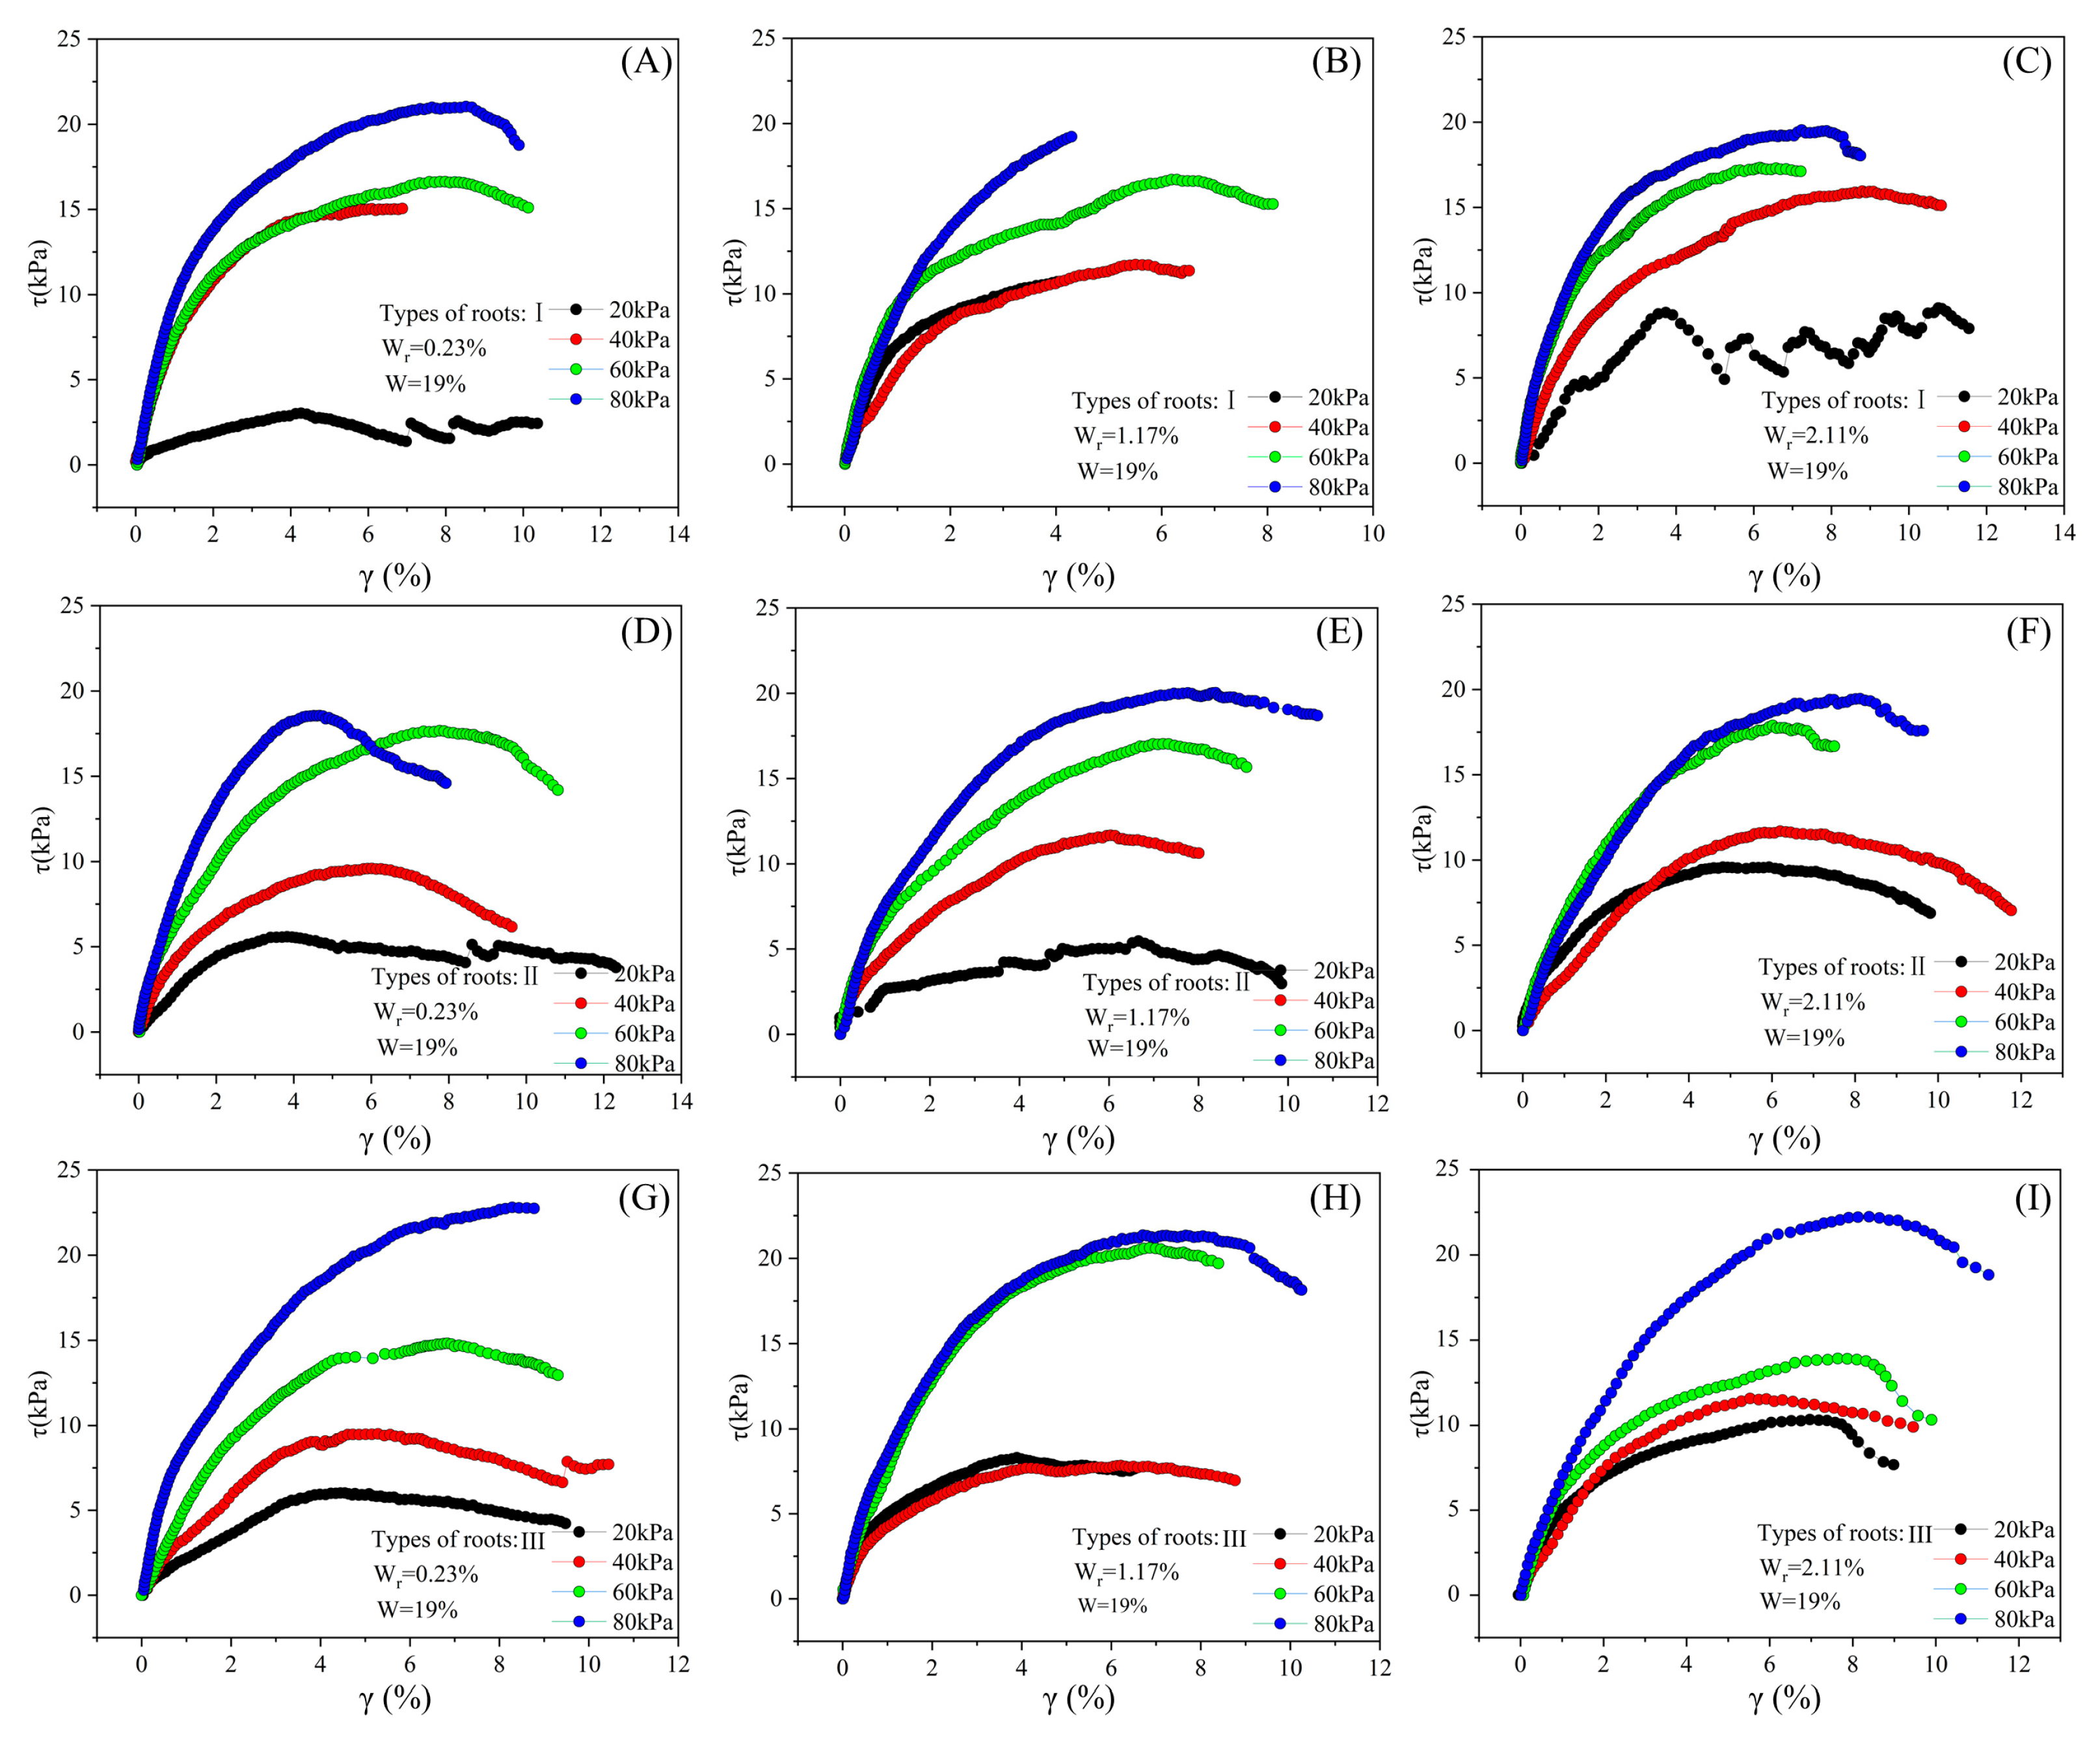
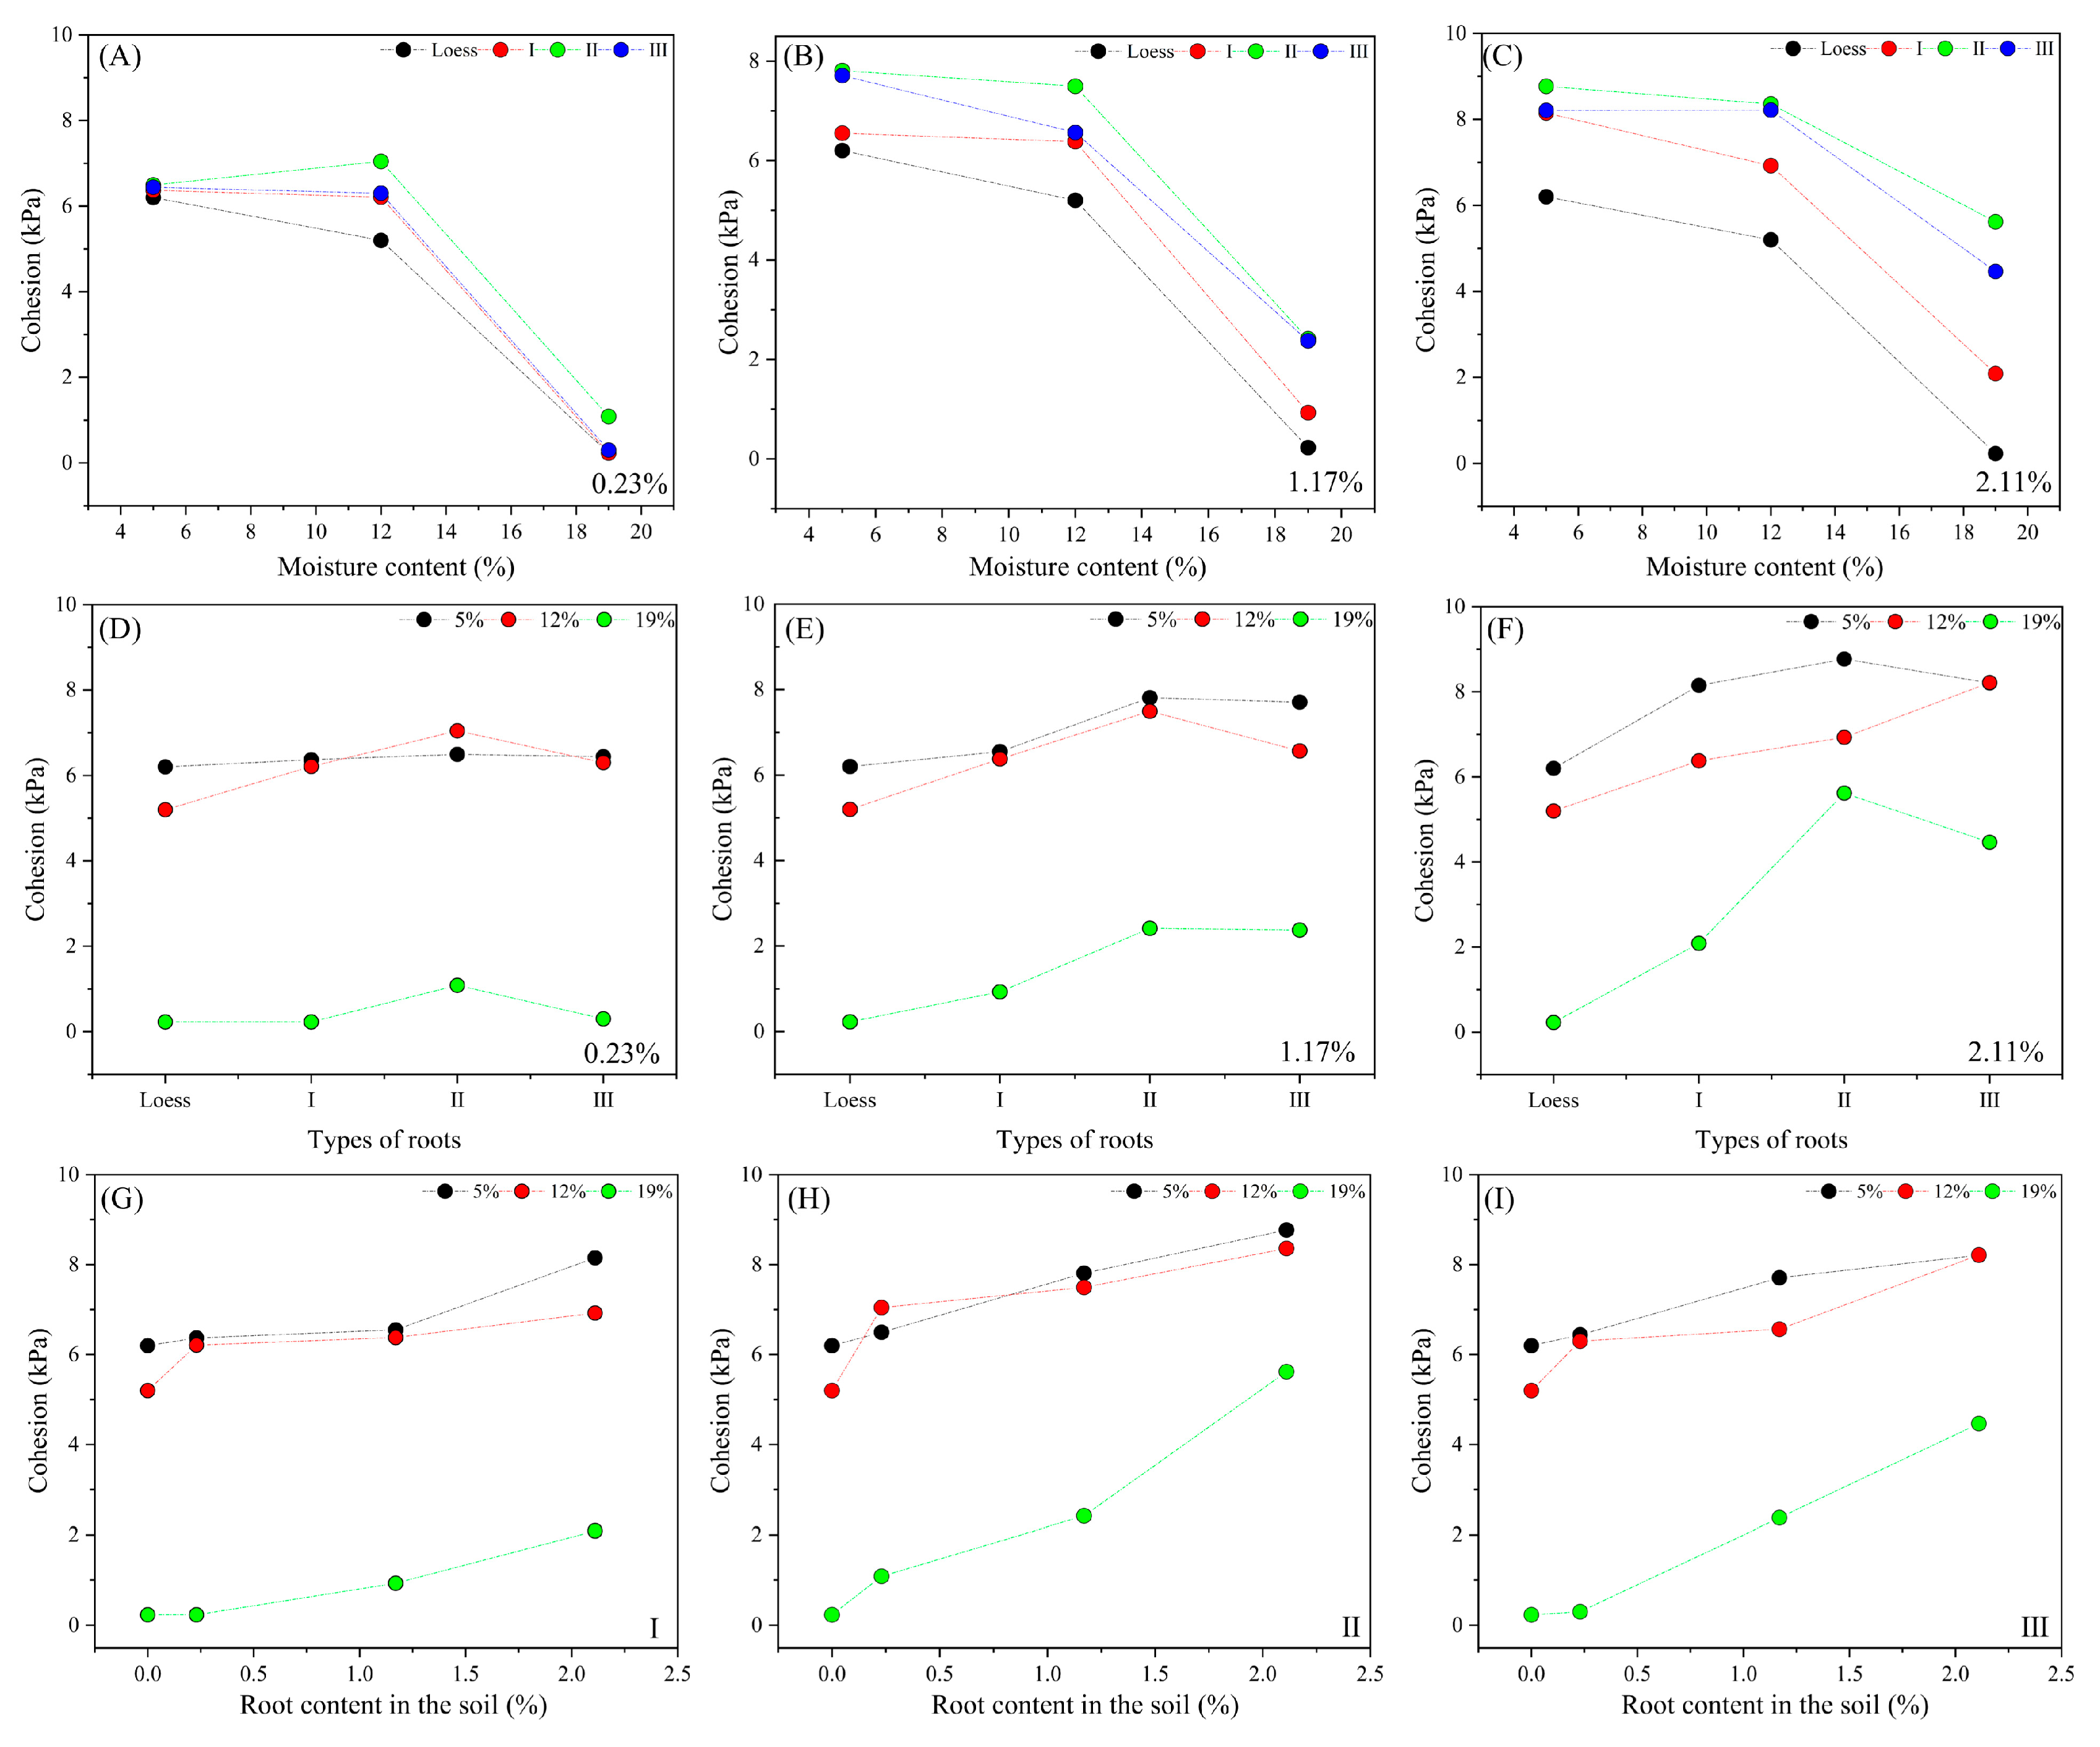
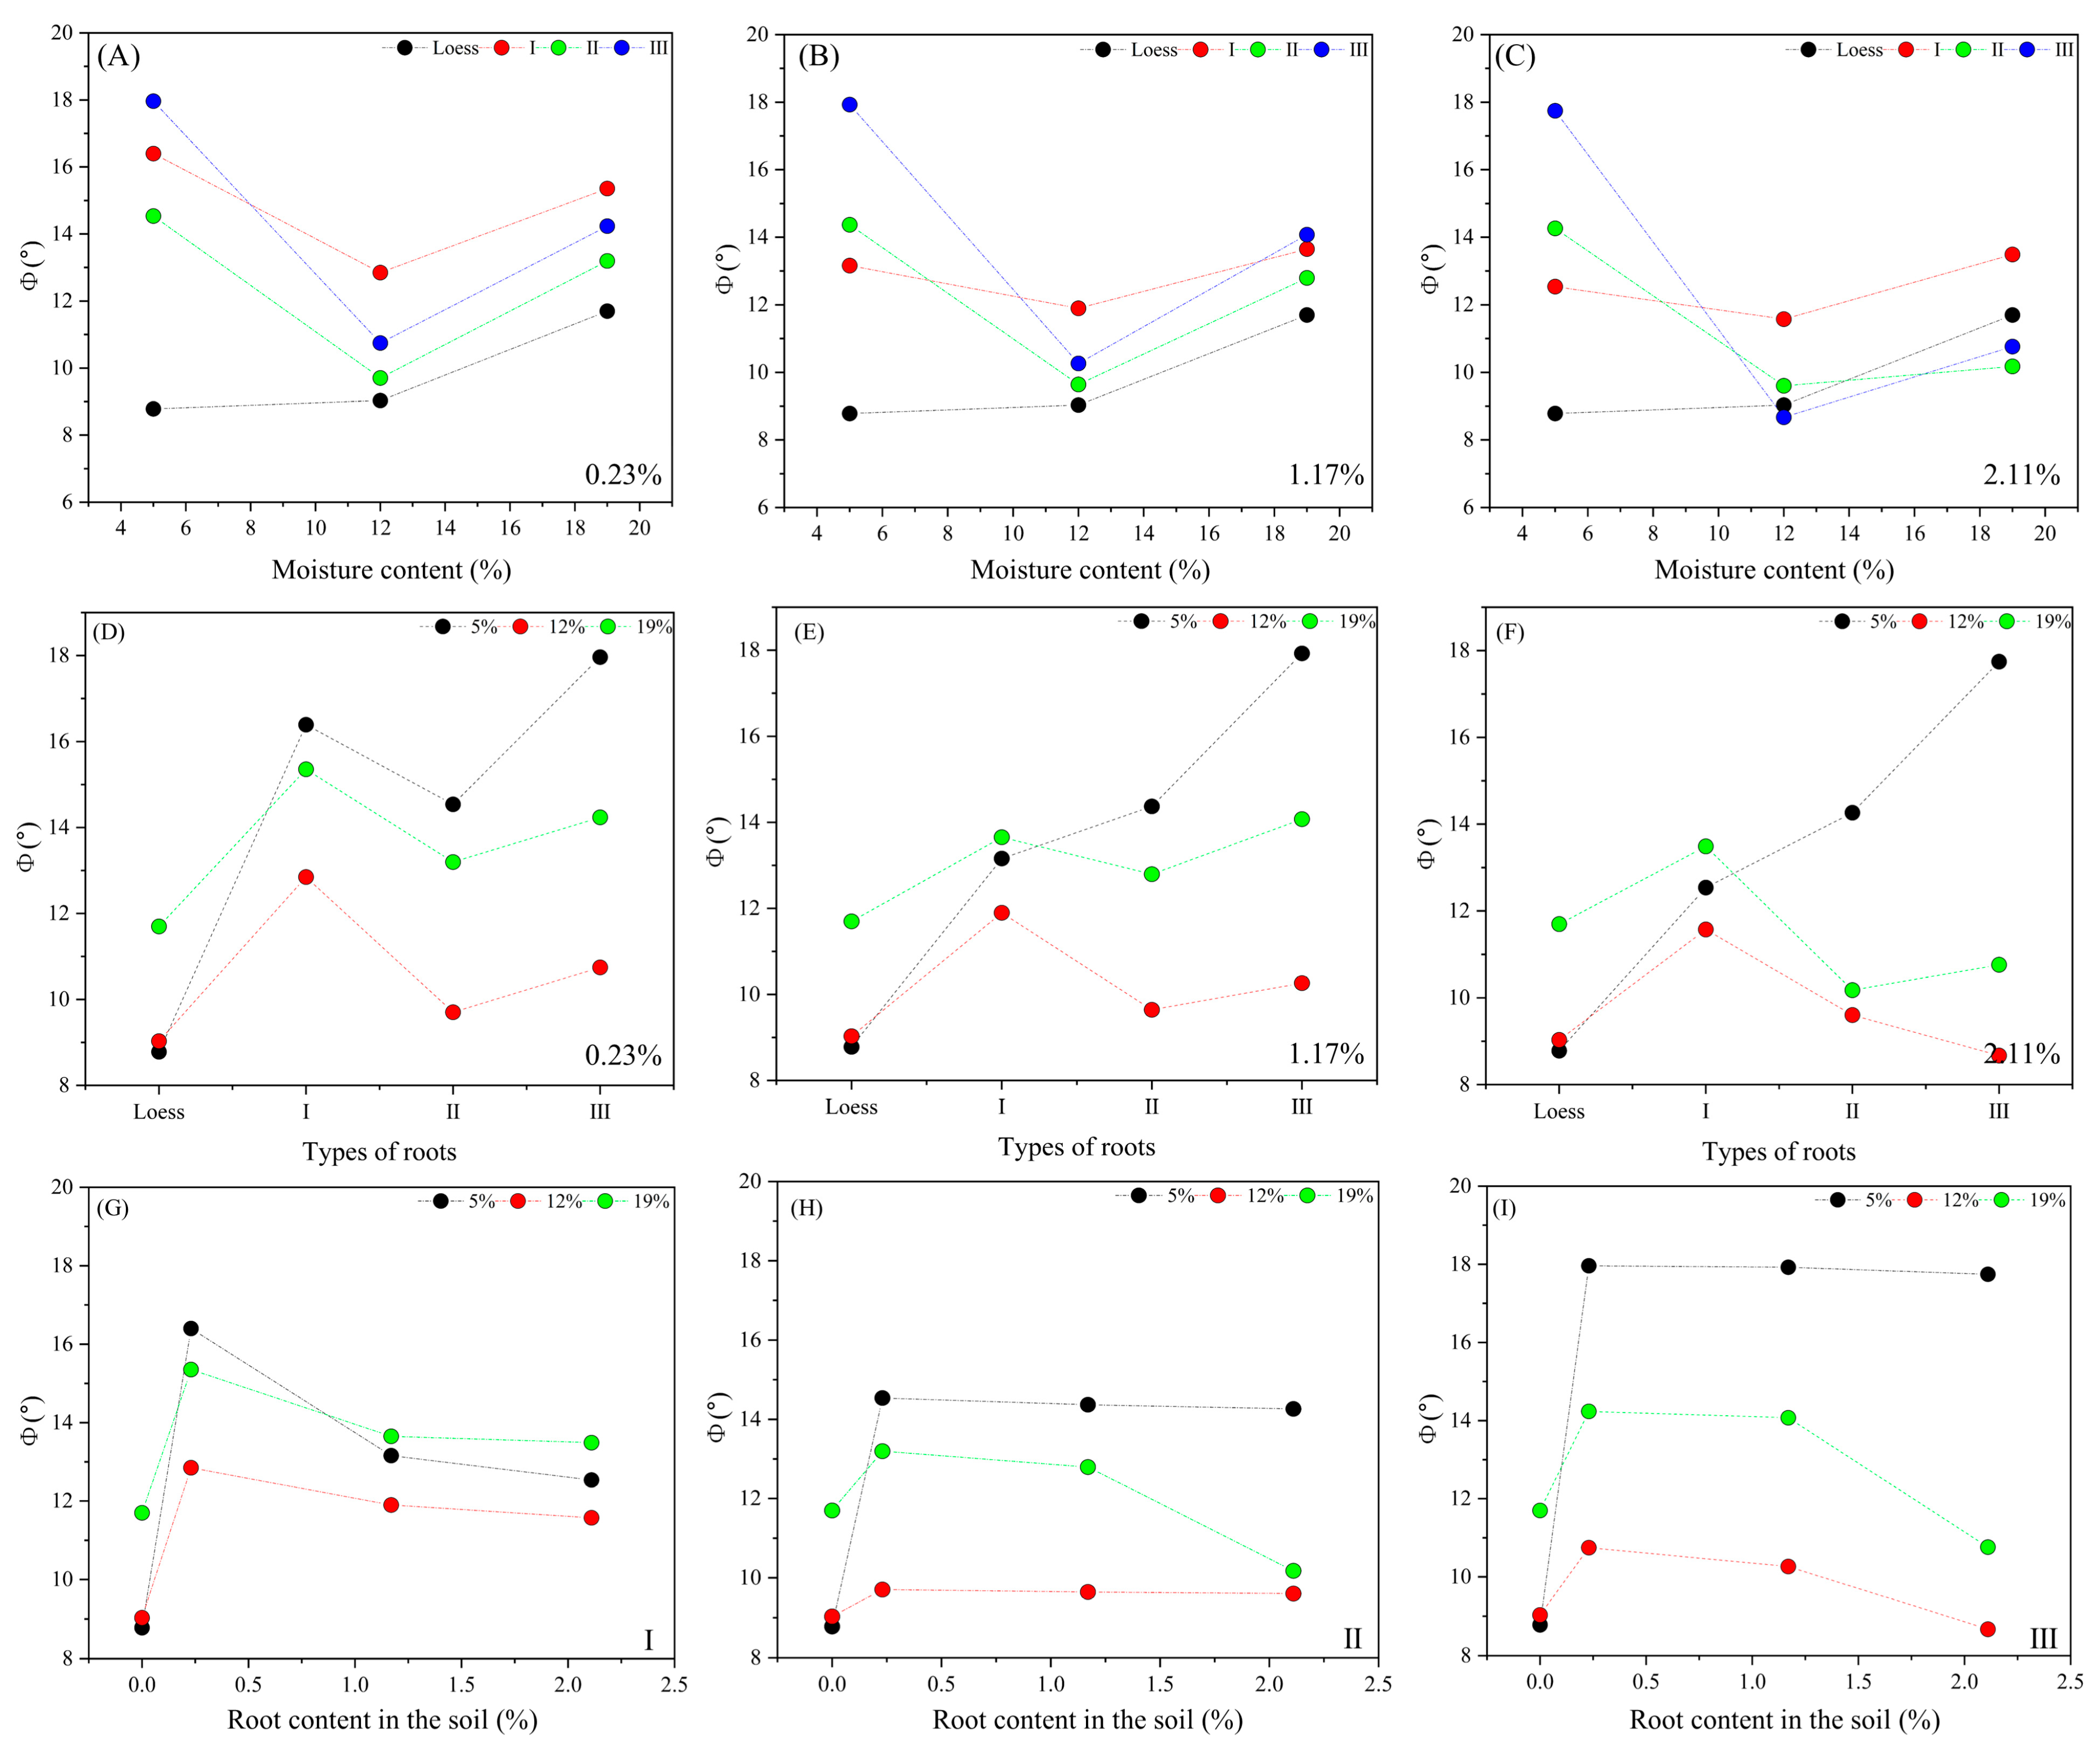
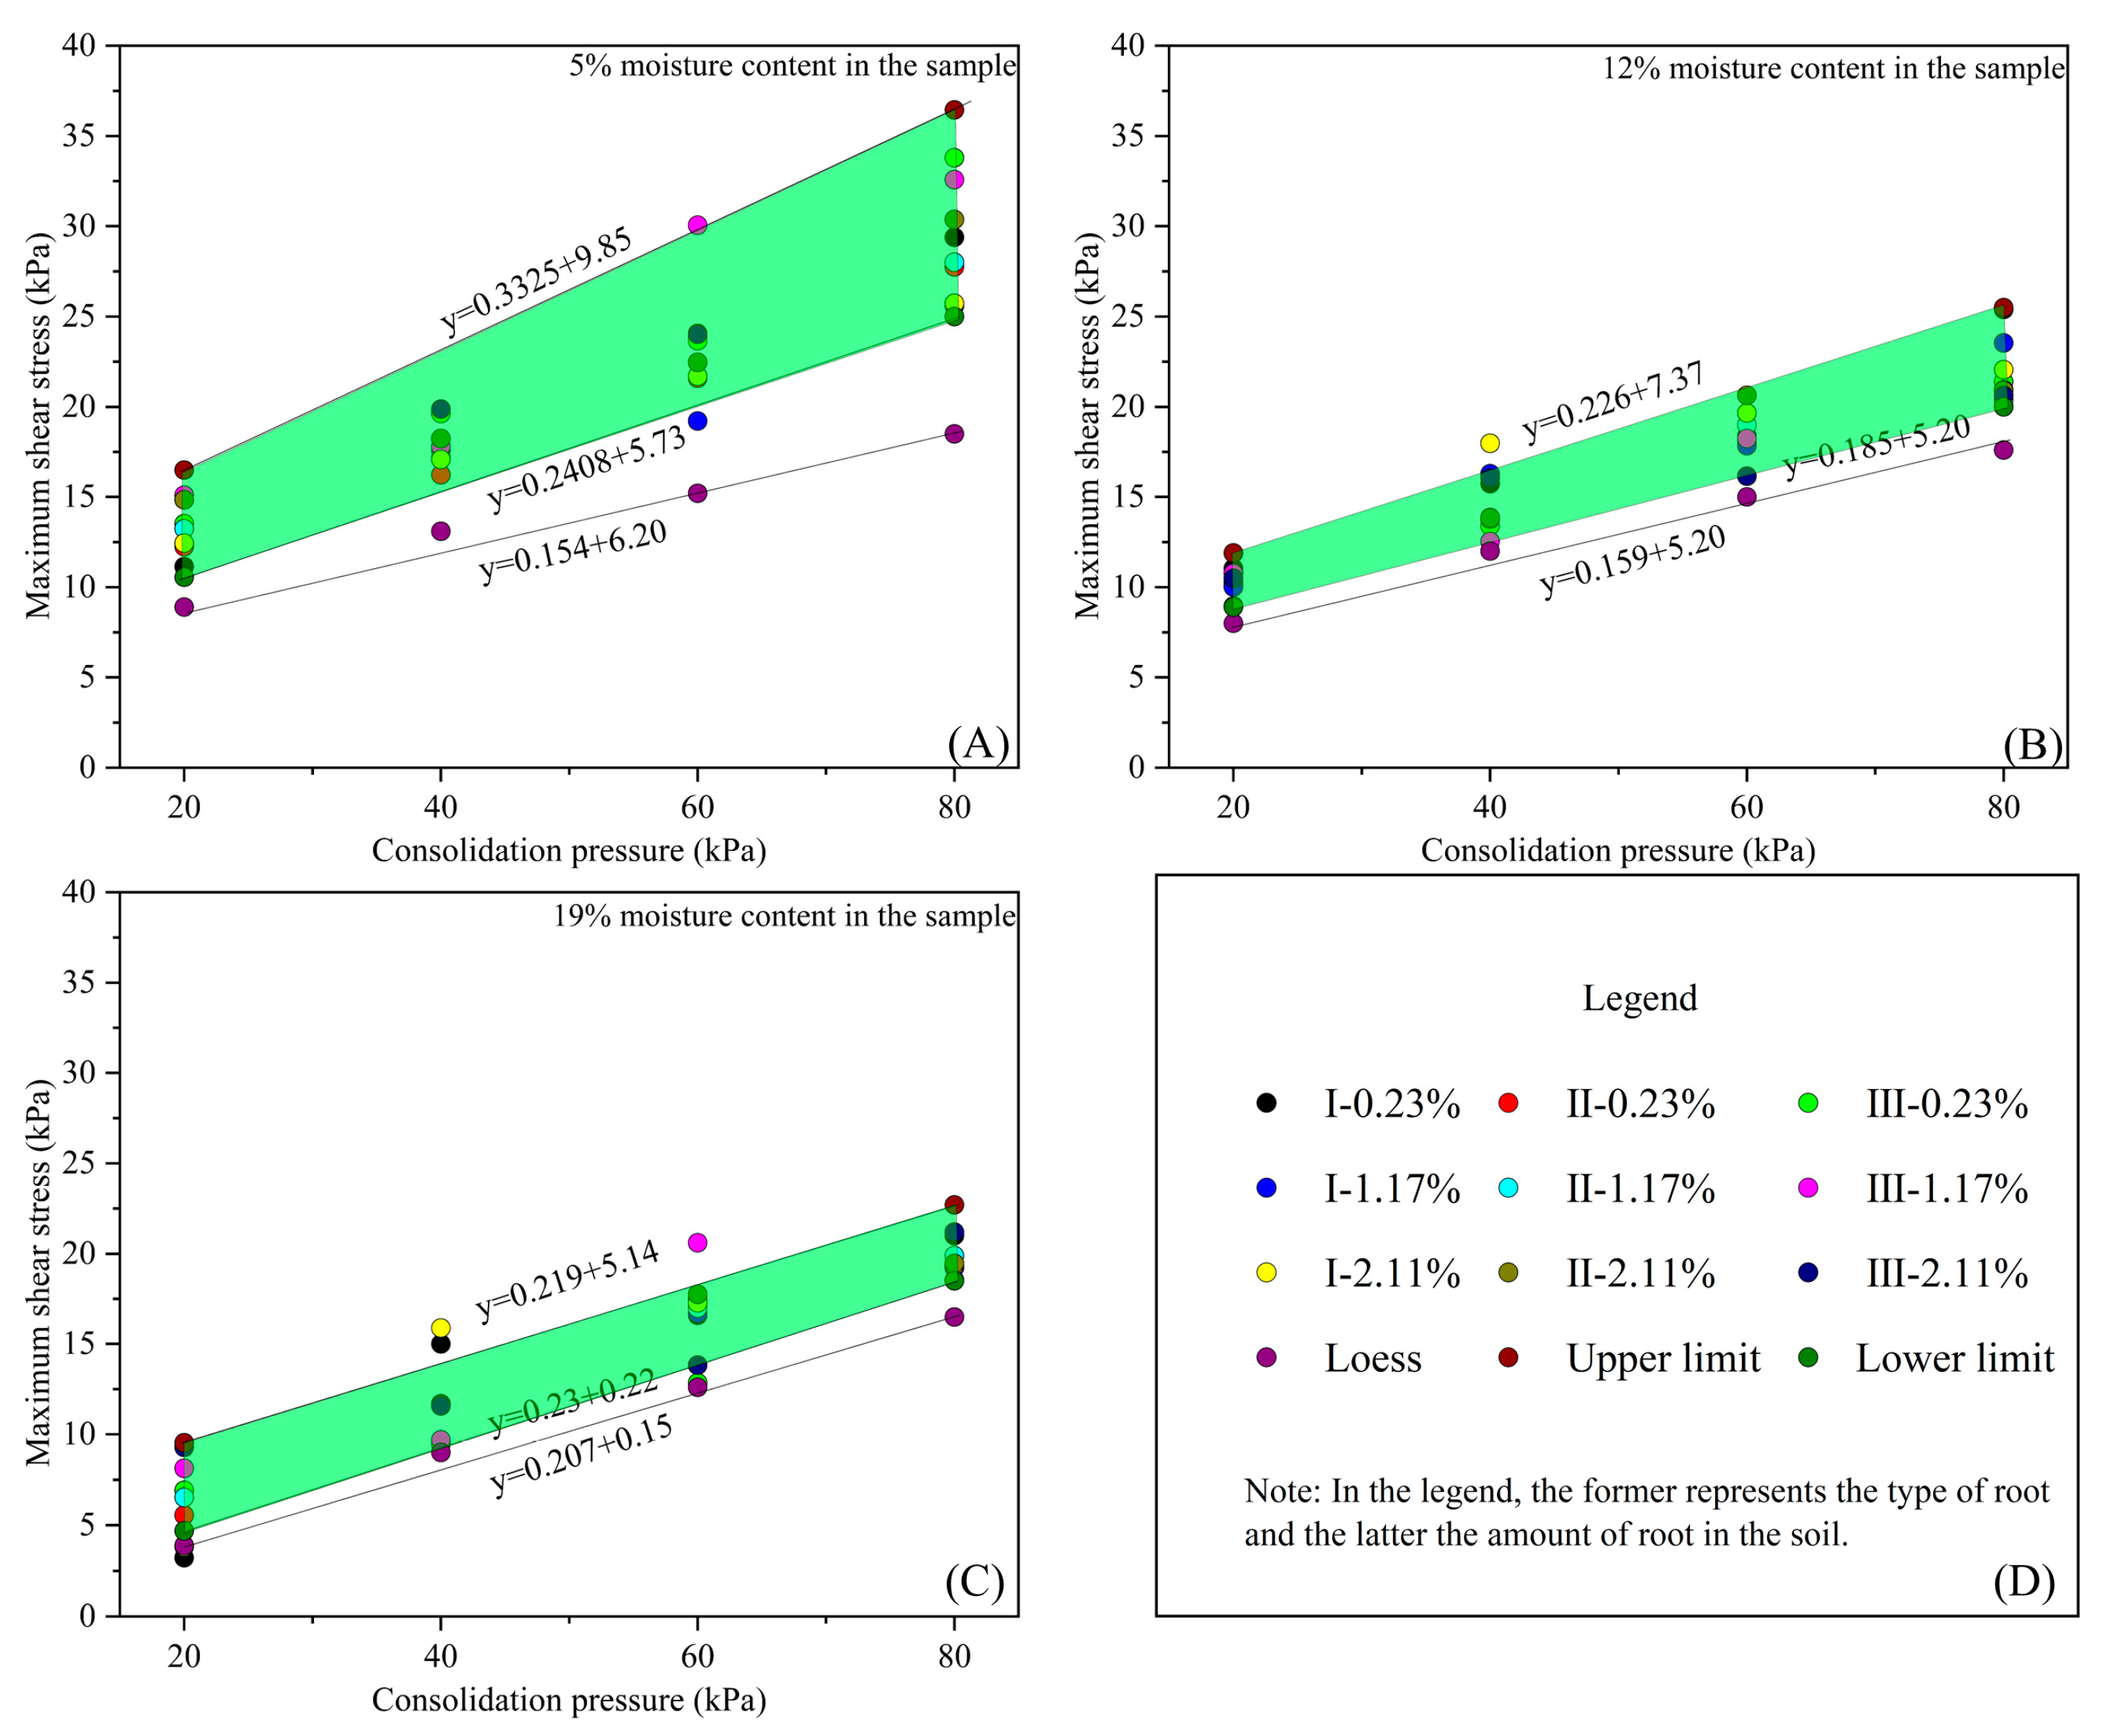
3.2. Macroscopic Mechanical Properties of the Root–Loess Interface

A nonlinear relationship exists at the root–loess interface between shear stress and shear strain (Figure 12, Figure 13 and Figure 14). Shear stress rapidly increases when shear strain is small (approximately 4% and below), and then gradually increases or stabilizes with the increase in shear strain. In most conditions, the stress–strain curve exhibits maximum shear stress, and after reaching the maximum shear stress, the curve flattens. Under constant conditions of moisture content, root type, and root ratio, the maximum shear stress value increases with the increase in consolidation pressure.
For specimens with a moisture content of 5%, under the influence of different consolidation pressures, root ratios, and root types, the range of maximum shear stress is between 10.6 and 39.5 kPa, and the shear strain is between 3.1% and 5.2%. Among these nine conditions, only samples with a root ratio of 0.2% experience strain hardening during testing, whereas samples with other root ratios undergo strain softening. Furthermore, the influence of root type and consolidation pressure on the stress–strain curve is insignificant (Figure 12).
Samples with moisture contents of 12% and 19% exhibit similar stress–strain characteristics to those with a 5% moisture content. For samples with 12% moisture content, the maximum shear stress, influenced by various consolidation pressures, root ratios, and root types, ranges from 8.9 to 25.2 kPa, with corresponding shear strains between 3.1% and 5.8%. In contrast, for samples with 19% moisture content, the maximum shear stress varies from 3.0 to 22.7 kPa, with shear strains between 4.2% and 8.7%. Across the aforementioned 18 conditions, the samples demonstrate strain softening during testing; however, the effects of consolidation pressure, root ratio, and root type on the stress–strain curve are negligible (Figure 13 and Figure 14).

Variation Characteristics of Shear Strength Indicators at the Root–Loess Interface

The influence of roots on shear strength influences cohesion and frictional strength [36]. This study employs the Mohr–Coulomb criterion to calculate the shear strength parameter cohesion (c) and internal friction angle (φ) at the root–loess interface. Figure 15 shows the shear strength parameters under different conditions. The test results indicate that the cohesion of the loess samples varies between 0.2 and 6.2 kPa, whereas that of the root–soil samples ranges from 0.2 to 8.8 kPa. Compared to loess, roots can enhance interface cohesion by approximately 41.5%. Additionally, cohesion decreases with an increase in moisture content. The variation patterns of cohesion with different variables are as follows.
When both the root type and ratio remain constant at the root–loess interface, cohesion decreases as moisture content increases (Figure 15C). Conversely, when moisture content and root ratio are held constant, cohesion exhibits a trend of initially increasing and then decreasing with changes in root type (Figure 15 D). Additionally, when moisture content and root type are fixed, cohesion increases with a higher root ratio (Figure 15G–I). In summary, a comparison of the cohesion test results from the two aforementioned samples indicates that the cohesion of root–loess samples surpasses that of loess alone. The findings reveal that soil cohesion increases with an increase in root ratio while decreasing with higher moisture content, aligning with previous studies [37]. Furthermore, the results of this study confirm that the bending degree of different root diameters follows the sequence: Type II, Type III, and Type I. Current research has established that Type I roots (diameter 0–2 mm) can enhance soil cohesion; however, there remains limited exploration regarding the effects of other root types on test outcomes [30]. This finding supports the notion that other root types may influence shear strength [38] and underscores the necessity for future research on the shear strength of the root–loess interface to account for the impact of root morphology.
Figure 16 shows the impact of the experimental variables on the internal friction angle. Test results indicate that the internal friction angles of the loess samples are 8.7–11.7°, whereas the internal friction angles of the root–loess samples are 8.6–17.9°. In comparison to loess, roots can significantly enhance the internal friction angle at the interface by approximately 53.5%. The variation patterns of the internal friction angle with different variables are as follows. When the root type and ratio are constant at the root–loess interface, the internal friction angle decreases with an increase in moisture content, followed by an increase (Figure 16A–C). When the moisture content and root ratio are constant, the internal friction angle changes with the root type, initially increasing, then decreasing, and then increasing again (Figure 16D–F). When the moisture content and root type are constant, the internal friction angle increases with an increase in root ratio, followed by a decrease (Figure 16G–I). Comparing the test results of the two samples shows that the internal friction angle of the root–soil sample is greater than that of loess. However, previous research results indicate that the internal friction angle of the tested sample is not influenced by the roots [39,40]. The causes of this difference are attributed to experimental methods, plant species, root morphology, and inherent variability. Among these, the testing method is likely the primary factor. Traditional testing methods involve small-sized root–soil composites, which cannot objectively reflect the influence of roots on the mechanical properties of samples. The testing method used in this study can obtain multiple shear failure surfaces from a set of samples simultaneously, revealing the impact of roots on the internal friction angle in the root–soil heterogeneous interface.
This paper quantifies the influence of roots on the shear strength of the root–loess interface at varying moisture contents. It also facilitates the application of test results by proposing recommended values for the shear strength of the root–loess interface under different moisture conditions, while excluding certain outliers during statistical analysis and establishing upper and lower limits for strength (Figure 17). The figure indicates that at a moisture content of 5%, the internal friction angle of the root–loess interface’s shear strength ranges from 13.5° to 18.4°, with cohesion values between 5.7 and 9.8 kPa. At a moisture content of 12%, the internal friction angle ranges from 9.0° to 12.7°, and cohesion values range from 5.2 to 7.3 kPa. Finally, at a moisture content of 19%, the internal friction angle ranges from 12.3° to 12.9°, while the cohesion values span from 0.2 to 5.1 kPa.

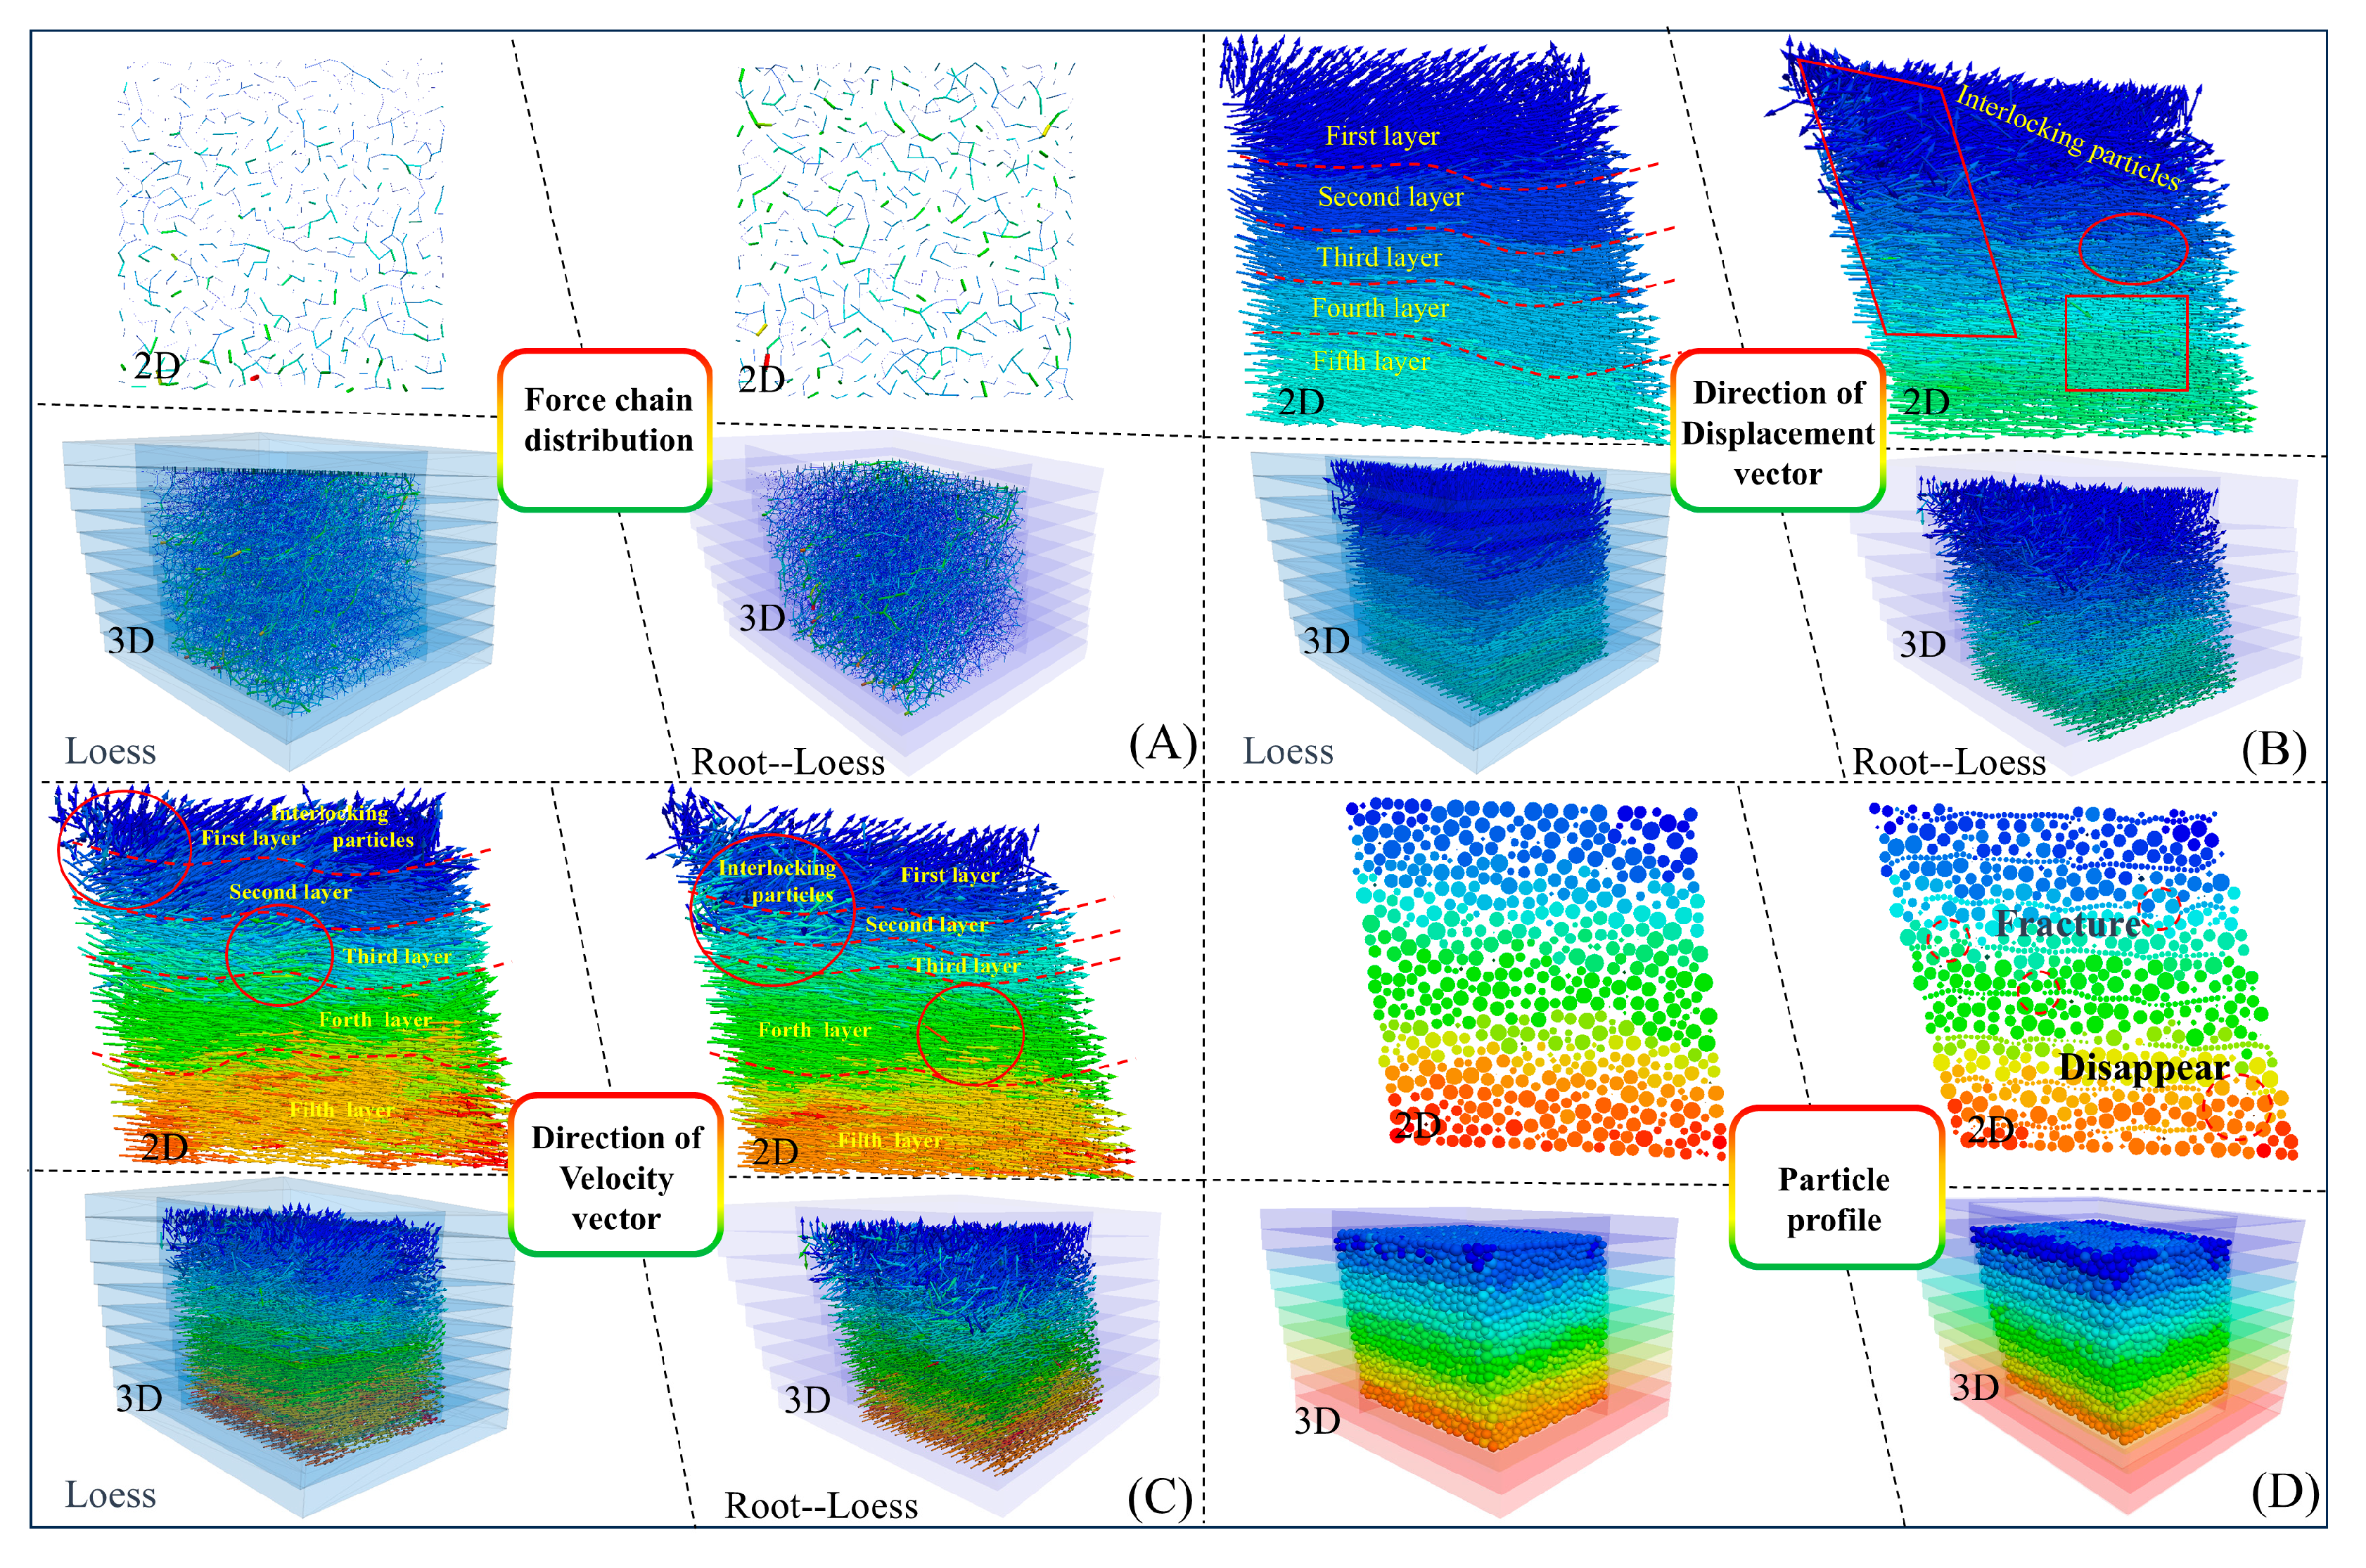
3.3. Micromechanical Properties of the Root–Loess Interface

After undergoing shearing and compression, the internal particles of the loess and root–loess samples slide against each other due to the generation of tangential contact forces. The force chains generated by the mutual contact of particles can transmit external loads, and the distribution of the internal force chains in the samples is shown in Figure 18. The internal force chains in the samples are uneven in strength, weaving through each other and distributed among particles. This distribution of force chains between particles is consistent with previous studies [41,42]. Furthermore, when comparing the shear result profile of the loess sample, it is observed that the root–soil sample contains fewer fine force chains, while the number of coarse force chains is greater and more evenly distributed. This observation indicates a higher presence of larger particles that can internally support the soil structure. The cross-distribution of coarse and fine force chain networks enhances the stability of soil particles, making the sample less prone to shear failure (Figure 18A). In conclusion, at the microscopic scale, roots enhance soil strength and the overall stability of the sample by influencing the thickness and distribution of force chains resisting external forces within the soil particles.
Recording and analyzing the movement status and displacement field distribution of root–soil particles inside the sample are crucial for exploring the micromechanical properties of the sample and the root–soil reinforcement mechanism. Figure 18B,C show the displacement and velocity field distributions of the particles inside the loess and root–soil samples at the moment of shear failure. Based on the differences in particle movement status and displacement, the above two types of samples can be divided from the top to the bottom into the first, second, third, fourth, and fifth layers, with particles in each layer moving from left to right along the shear direction. In the first layer of both samples, the particles have the smallest movement speed and move upward, resulting in a macroscopic manifestation of shear dilation. Compared with the loess sample, in the root–soil sample, the particles in two adjacent layers have a significant cross-distribution, obvious differences in velocity magnitude and direction, and large differences in the displacement field. This result indicates that the particles inside the sample move nonuniformly during shearing, and where roots are present, the soil particles move through rotation, translation, and other modes [43] (Hunt et al., 2010). The particles in the loess sample, with an interwoven distribution, exhibit more significant differences in the velocity field than the root–loess sample. This result indicates that roots impede local particle movement, enhancing the overall stability of the particles inside the sample (at the fifth layer). The oriented arrangement of particles is significant in forming shear bands. The presence of roots changes the movement pattern of soil particles at the root–soil interface, making shear surfaces (bands) less distinct in such samples. Furthermore, the root and soil particles interact during shearing, and the roots play a role by breaking and bluntly extinguishing in a damaged form (Figure 18D).

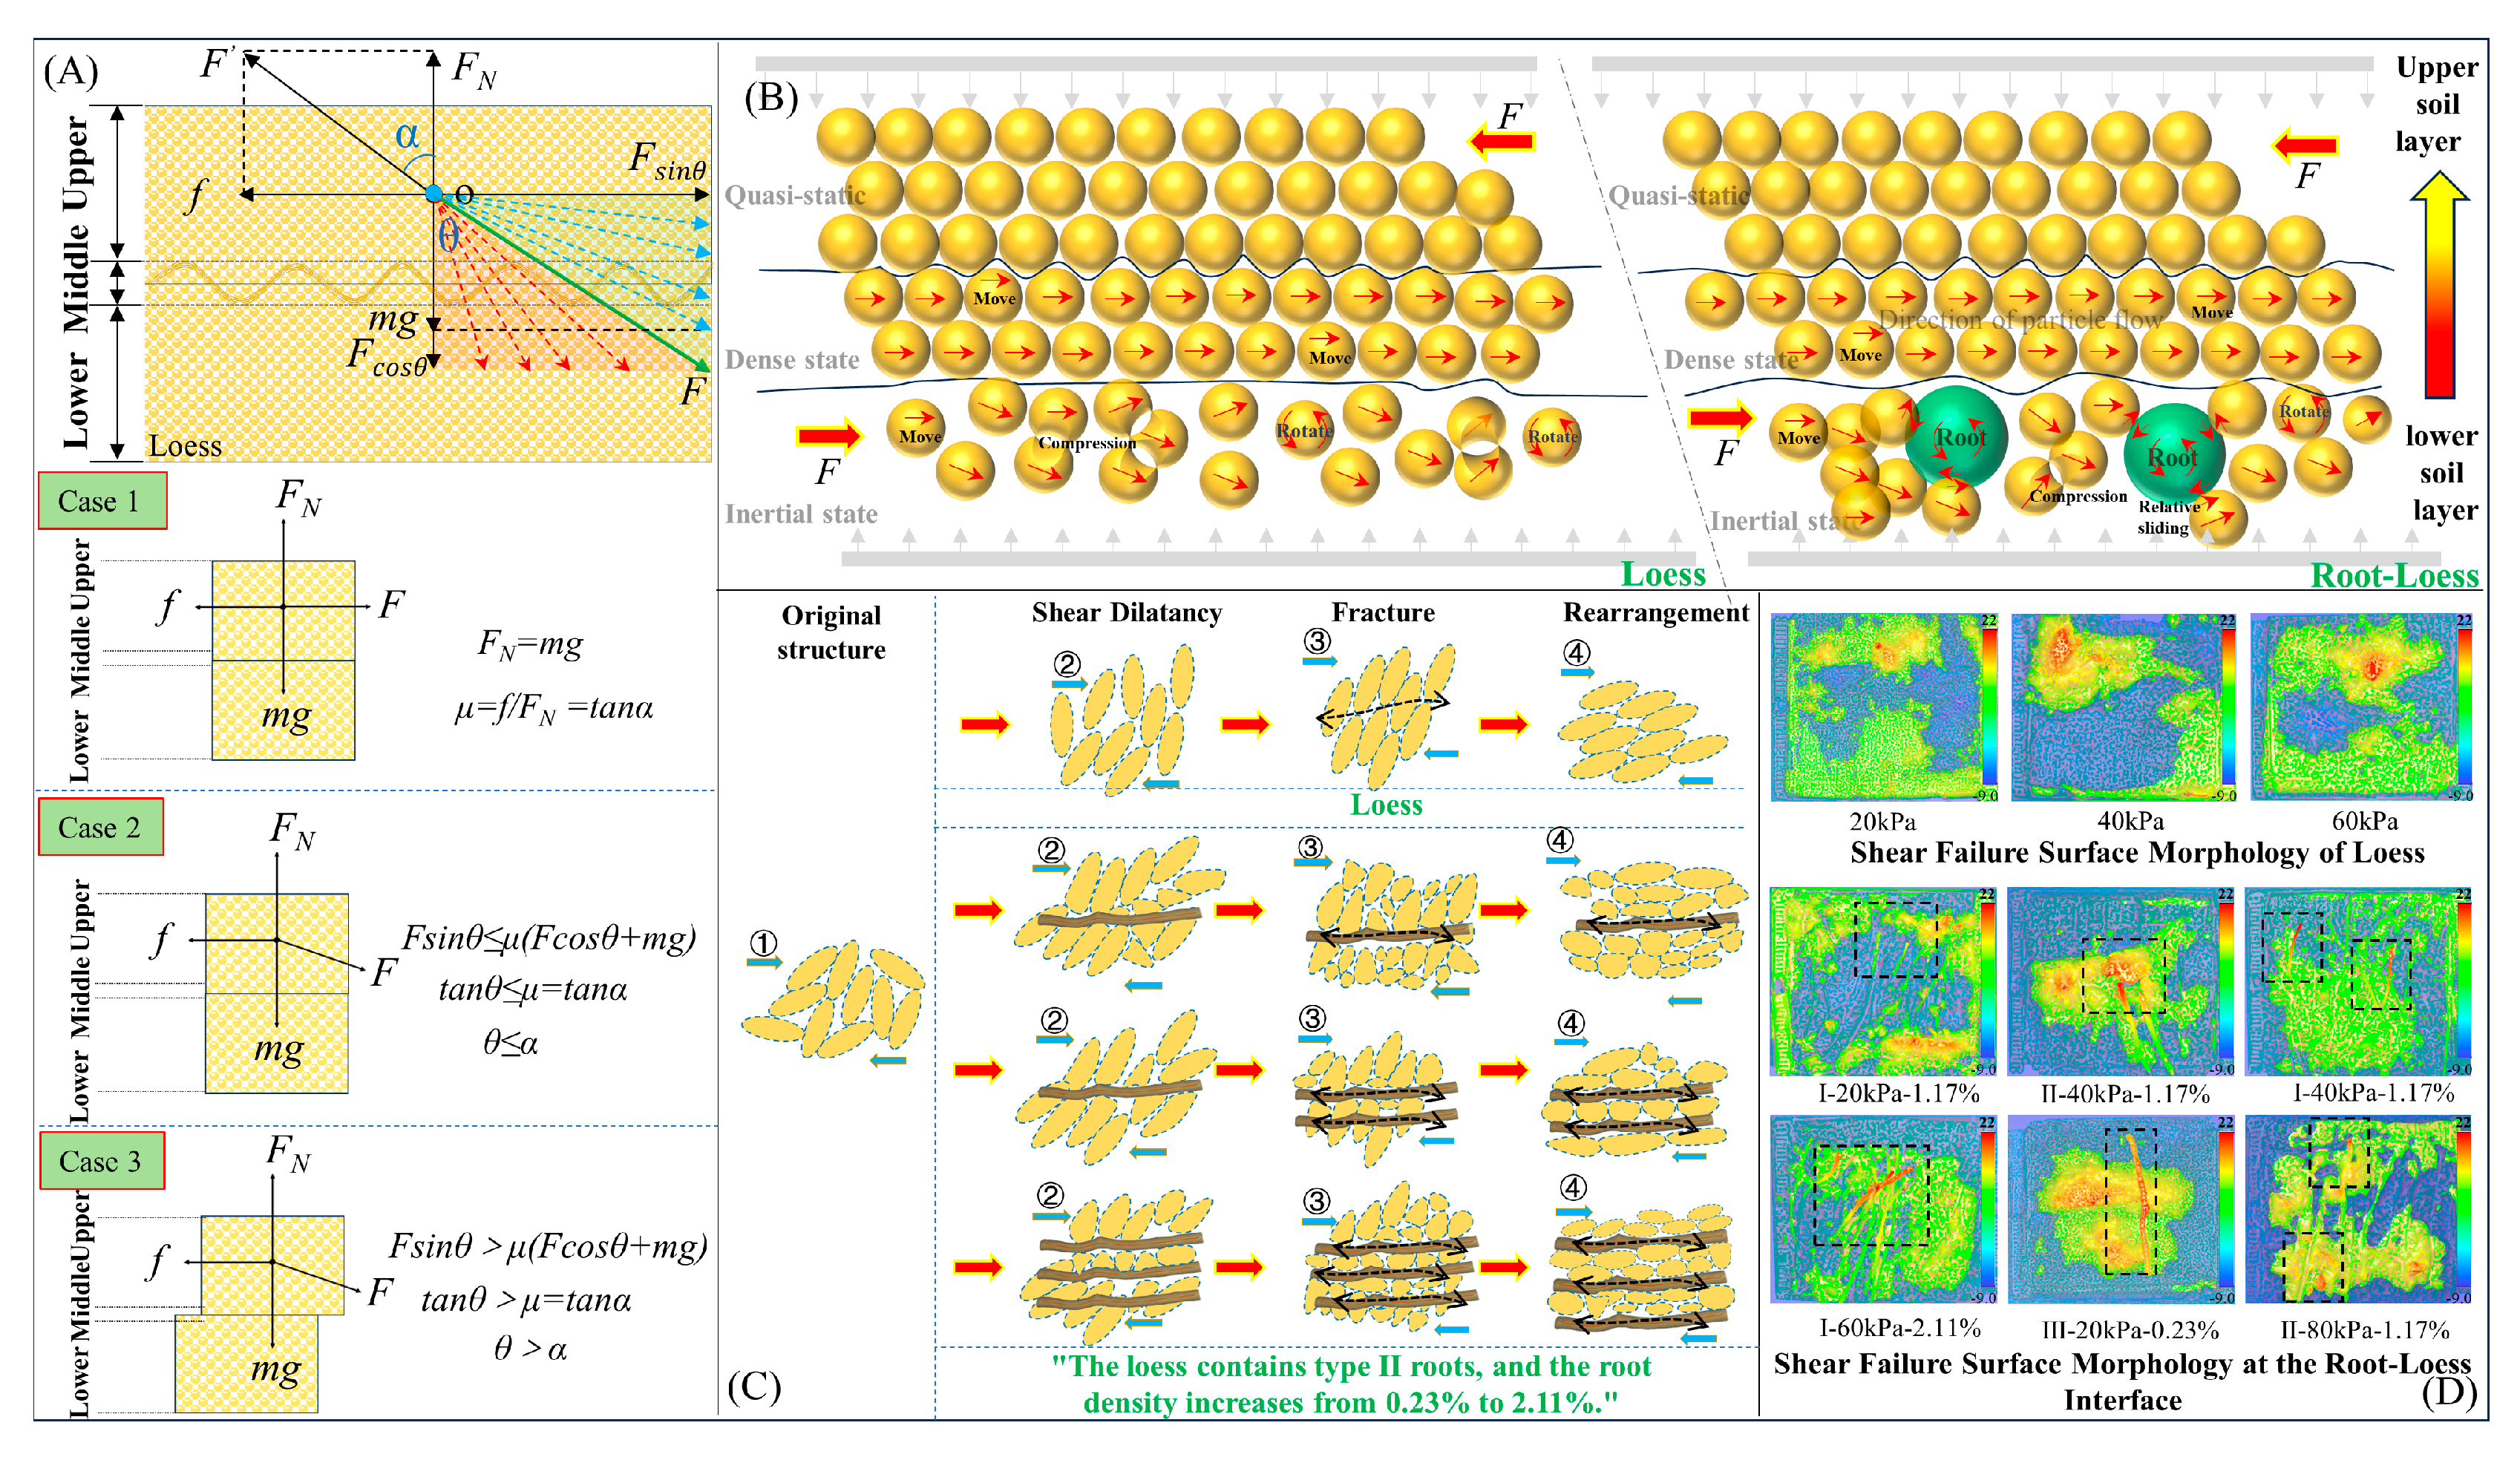
3.4. Physical Mechanism of Shear Behavior at the Root–Loess Interface

The experimental results regarding the macroscopic and microscopic shear mechanical properties of root–soil specimens confirm that the presence of roots significantly enhances both the cohesion and frictional strength of the soil. To elucidate the mechanisms by which roots influence the shear strength at the root–soil interface, we integrate principles of friction, engineering mechanics, and experimental findings from macroscopic and microscopic analyses of root–soil specimens. A physical model for the shear behavior of the root–soil interface is discussed. Figure 19 shows the analytical model comprising a layer of loess embedded with roots. The upper layer of loess is subjected to the effects of gravity (mg), external force (F), supporting force (FN), and frictional force (f, corresponding to the friction coefficient μ). Additionally, the resultant force of the supporting and frictional forces is denoted as F’, with an angle α relative to the resultant force and the angle θ between the external force F and gravity. Changes in the external force F lead to three distinct motion states at the root–soil interface: static, limit equilibrium, and sliding.
When the root–soil specimen is static (case 1), if f is >sinθ, the root–soil interface does not experience sliding. Neglecting the influence of gravity, when α is ≥θ, i.e., when the external force F is in the red region of Figure 19A, the root–soil interface exhibits a self-locking phenomenon under the action of a biting static frictional force. When the root–soil interface is in a limit equilibrium state (case 2), regardless of how the supporting force FN changes, as long as the internal friction angle α remains constant, the root–soil interface will remain in a static state, as the friction coefficient solely determines its stability. When the root–soil interface is in a sliding state (case 3) as α is , i.e., when the external force F is in the green region of Figure 19A, a biting sliding phenomenon occurs between the roots and the soil. In summary, irregular biting and self-locking effects are present in the sliding friction of the root–soil interface.
To reveal the physical mechanism by which roots and loess media enhance interface strength through biting action, this paper constructs a schematic diagram illustrating the processes, phenomena, and results of root–soil particle interaction based on macro–micromechanical experimental results (Figure 19B,D). The soil particles in the upper, middle, and lower parts of the specimen are summarized according to their layer distribution characteristics as quasistatic, dense, and inertial states [44]. During shearing, quasistatic particles remain stationary in their initial positions, dense particles move nonuniformly along a constant direction, and inertial particles engage in biting through movement, rotation, and compression within the soil (Figure 19B). The combination of the three states of root–soil particles forms the deformation of the specimen at the macroscale. The physical change in the state of inertial particles is the primary cause of induced specimen deformation. The root–soil particles in this state generate biting friction through surface friction, particle interlocking, and chaining, improving the frictional and cohesive strength of the soil through particle fracture or rearrangement, which is characterized at the macroscale by changes in specimen volume, strength, and structure [45]. Furthermore, the roots increase the contact area between different particles, weaken the relative movement of the roots with respect to the soil, and increase the internal friction angle of the root–loess interface (Figure 19C). Additionally, the roots near the shearing surface function as a link, first converting some of the compressed soil’s shear stress into tensile stress in the roots, and then converting it into static frictional and cohesive forces between the root–loess interface, enhancing the shear strength of the root–loess interface. Macroscopic features of root–soil particles under biting include a relatively smooth shearing failure surface of loess and sheared or damaged roots. Compared to the shearing failure surface of loess specimens, the thickness, roughness, and effective area of the shearing failure surface in the root–soil interface are larger (Figure 19D). Utilizing a numerical calculation method to evaluate the effectiveness of the root to stabilize the slope reveals that the root system enhances the shear strength of the soil within the slope. This enhancement occurs through an increase in both the cohesion and the angle of internal friction of the soil matrix [46]. Additionally, the presence of the root system alters the stress distribution within the slope, leading to a more homogeneous bearing capacity and a reduction in localized stress concentrations, thereby improving the slope’s safety factor. However, the reinforcement effect is influenced by the density, spatial distribution, and mechanical properties of the root system.

4. Conclusions

Rainfall-induced damage to the shear strength of the root–loess interface, leading to failure, is the primary cause of instability in vegetated slope areas. Given the importance of the shear strength of the root–loess interface in controlling slope stability, the scarcity of research on the shear strength characteristics of the root–loess interface, and the inadequacy of existing instruments to meet the testing requirements for the interface strength, this study conducted single shear tests using a self-developed, stacked-ring, shear apparatus. The study investigated the variation patterns of shear strength at the root–loess interface under different root types, root contents, and moisture conditions. Morphological characteristics of the root–soil shear failure surface were studied using a 3D laser scanner. The microscopic mechanical characteristics of the root–loess interface were studied using PFC3D. The paper reveals the physical mechanisms of shear behavior at the heterogeneous interface of Robinia pseudacacia tree roots and loess from macroscopic and microscopic perspectives. The primary conclusions are as follows:
(1) The damage to the root–soil heterogeneous interface includes two modes: fracture and pullout. Based on the differences in the bending radius of roots with different diameters, they can be classified into 0–2 mm (Type I), 2–5 mm (Type II), and 5–10 mm (Type III). Increasing the water content significantly reduces the shear strength of the root–loess interface. Within the studied humidity range, the influence of root type and volume fraction on the shear strength of the root–loess interface is evident, primarily attributed to the increase in cohesive strength. The enhancement of the shear strength of the root–loess interface by root type is in the order of Type II, Type III, and Type I, and the primary reason for this difference is the bending radius of the root type. The increase in root volume fraction in the root–loess interface is in the order of 2.11%, 1.17%, and 0.23%.
(2) Compared to loess, roots can enhance the cohesive and frictional strengths in the root–loess interface, with maximum increases of 41.45% and 53.51%, respectively. The shear strength of the root–loess interface positively correlates with its fractal dimension of the shear failure surface. The maximum shear stress in the root–loess interface is higher than in the loess, primarily due to the influence of root actions altering the fractal dimension of the shear surface to enhance the interface strength.
(3) In the root–loess interface, roots enhance the stability and strength of the entire sample by resisting the movement of some soil particles, increasing the thickness and distribution of the force chains resisting external forces within the soil particles. The differential distribution of the displacement and velocity fields inside the sample is crucial for forming potential shear failure surfaces.
(4) A self-locking and biting physical mechanism exists between the root–soil particles in the root–loess interface. The type of physical mechanism (self-locking or biting) at the root–particle interface depends on the difference in external forces acting on the root–soil interface. In the self-locking state, roots convert some of the compressed soil’s shear stress into root tensile stress, transforming into static frictional and cohesive forces at the root–loess interface. In the bite state, roots increase the contact area with soil particles, enhancing the bite between the two and increasing the internal friction angle of the root–loess interface.
(5) Optimizing root density and distribution can help improve soil stability. A well-distributed root network can effectively increase the shear strength of the soil and thus improve slope stability.

Author Contributions

Conceptualization, Q.G.; methodology, B.H. and Q.H.; software, T.X., Q.G. and G.L.; validation, T.X., B.H. and G.L.; formal analysis, D.Z. and G.L.; investigation, Q.G. and G.L.; resources, Q.G.; data curation, D.Z.; writing—original draft preparation, Q.G.; writing—review and editing, Q.G. and X.K.; visualization, X.G.; supervision, B.H.; project administration, B.H.; funding acquisition, B.H. All authors have read and agreed to the published version of the manuscript.

Funding

This research was supported by funds from the National Key R&D Program of China (2023YFC3008401) and the Natural Science Basic Research Program of Shaanxi (2023-JC-QN-0288 and 2024JC-YBQN-0299) and the Director Fund of Xi’an Center of CGS (XACGS-2022-04 and XACGS-2023-09).

Data Availability Statement

The data presented in this study are available upon request from the corresponding author.

Conflicts of Interest

The authors declare that they have no conflicts of interests.

References

  1. Jin, Z.; Peng, J.; Zhuang, J.; Feng, L.; Huo, A.; Mu, X.; Wang, W. Gully erosion and expansion mechanisms in loess tablelands and the scientific basis of gully consolidation and tableland protection. Sci. China Earth Sci. 2023, 66, 821–839. [Google Scholar] [CrossRef]
  2. Li, J.; Wang, X.; Jia, H.; Liu, Y.; Zhao, Y.; Shi, C.; Zhang, F. Effect of herbaceous plant root density on slope stability in a shallow landslide-prone area. Nat. Hazards 2022, 112, 2337–2360. [Google Scholar] [CrossRef]
  3. Xiao, T.; Li, P.; Fei, W.; Wang, J. Effects of vegetation roots on the structure and hydraulic properties of soils: A perspective review. Sci. Total Environ. 2024, 906, 167524. [Google Scholar] [CrossRef] [PubMed]
  4. Zhang, F.; Shu, H.; Yan, B.; Wu, X.; Lan, H.; Peng, J. Characteristic analysis and potential hazard assessment of reclaimed mountainous areas in Lanzhou, China. Catena 2023, 221, 106771. [Google Scholar] [CrossRef]
  5. Feng, L.; Zhang, M.; Jin, Z.; Zhang, S.; Sun, P.; Gu, T.; Liu, X.; Lin, H.; An, Z.; Peng, J.; et al. The genesis, development, and evolution of original vertical joints in loess. Earth Sci. Rev. 2021, 214, 103526. [Google Scholar] [CrossRef]
  6. Xu, L.; Dai, F.; Tu, X.; Tham, L.G.; Zhou, Y.; Iqbal, J. Landslides in a loess platform, North–West China. Landslides 2014, 11, 993–1005. [Google Scholar] [CrossRef]
  7. Bellugi, D.G.; Milledge, D.G.; Cuffey, K.M.; Dietrich, W.E.; Larsen, L.G. Controls on the size distributions of shallow landslides. Proc. Natl. Acad. Sci. USA 2021, 118, e2021855118. [Google Scholar] [CrossRef]
  8. Khan, Y.A.; Lateh, H. Failure Mechanism of a Shallow Landslide at Tun–Sardon Road Cut Section of Penang Island, Malaysia. Geotech. Geol. Eng. 2011, 29, 1063–1072. [Google Scholar] [CrossRef]
  9. Li, L.; Lan, H.; Strom, A.; Macciotta, R. Landslide length, width, and aspect ratio: Path–dependent measurement and a revisit of nomenclature. Landslides 2022, 19, 3009–3029. [Google Scholar] [CrossRef]
  10. Chen, H.X.; Zhang, L.M.; Gao, L.; Zhu, H.; Zhang, S. Presenting regional shallow landslide movement on three-dimensional digital terrain. Eng. Geol. 2015, 195, 122–134. [Google Scholar] [CrossRef]
  11. Sun, P.; Wang, H.; Wang, G.; Li, R.; Zhang, Z.; Huo, X. Field model experiments and numerical analysis of rainfall-induced shallow loess landslides. Eng. Geol. 2021, 295, 106411. [Google Scholar] [CrossRef]
  12. Fan, C.-C. A displacement–based model for estimating the shear resistance of root–permeated soils. Plant Soil 2012, 355, 103–119. [Google Scholar] [CrossRef]
  13. Forster, M.; Ugarte, C.; Lamandé, M.; Faucon, M.-P. Root traits of crop species contributing to soil shear strength. Geoderma 2022, 409, 115642. [Google Scholar] [CrossRef]
  14. Ji, X.; Cong, X.; Dai, X.; Zhang, A.; Chen, L. Studying the mechanical properties of the soil–root interface using the pullout test method. J. Mt. Sci. 2018, 15, 882–893. [Google Scholar] [CrossRef]
  15. Schwarz, M.; Preti, F.; Giadrossich, F.; Lehmann, P.; Or, D. Quantifying the role of vegetation in slope stability: A case study in Tuscany (Italy). Ecol. Eng. 2010, 36, 285–291. [Google Scholar] [CrossRef]
  16. Jiang, R.; Xie, J.; Zhao, Y.; He, H.; He, G. Spatiotemporal variability of extreme precipitation in shaanxi province under climate change. Theor. Appl. Climatol. 2017, 130, 831–845. [Google Scholar] [CrossRef]
  17. Genet, M.; Stokes, A.; Salin, F.; Mickovski, S.B.; Fourcaud, T.; Dumail, J.-F.; van Beek, R. The Influence of Cellulose Content on Tensile Strength in Tree Roots. Plant Soil 2005, 278, 1–9. [Google Scholar] [CrossRef]
  18. Ghestem, M.; Veylon, G.; Bernard, A.; Vanel, Q.; Stokes, A. Influence of plant roots morphology and architectural traits on soil shear resistance. Plant Soil 2014, 377, 43–61. [Google Scholar] [CrossRef]
  19. Liu, J.; Zhou, Z.; Liu, J.; Su, X. Effects of root density on soil detachment capacity by overland flow during one growing season. J. Soils Sediments 2022, 22, 1500–1510. [Google Scholar] [CrossRef]
  20. Tanaka, N.; Samarakoon, M.B.; Yagisawa, J. Effects of root architecture, physical tree characteristics, and soil shear strength on maximum resistive bending moment for overturning Salix babylonica and Juglans ailanthifolia. Landsc. Ecol. Eng. 2012, 8, 69–79. [Google Scholar] [CrossRef]
  21. Mickovski, S.B.; Hallett, P.D.; Bransby, M.F.; Davies, M.C.R.; Sonnenberg, R.; Bengough, A.G. Mechanical reinforcement of soil by willow roots: Impacts of root properties and root failure mechanism. Soil Sci. Soc. Am. J. 2009, 73, 1276–1285. [Google Scholar] [CrossRef]
  22. Docker, B.B.; Hubble, T.C.T. Quantifying root-reinforcement of river bank soils by four Australian tree species. Geomorphology 2008, 100, 401–418. [Google Scholar] [CrossRef]
  23. Nan, J.; Peng, J.; Zhu, F.; Ma, P.; Liu, R.; Leng, Y.; Meng, Z. Shear behavior and microstructural variation in loess from the Yan’an area, China. Eng. Geol. 2021, 280, 105964. [Google Scholar] [CrossRef]
  24. Yang, Q.C.; Hao, Z.; Cheng, W.; Lei, S.Y.; Zhang, Y.; Teng, D.; Zhang, Q.; Wang, X.M. Study on the cohesive shear characteristics and intrinsic modelling of the root-tailing soil interface of Amorpha fruticosa. Sci. Rep. 2022, 12, 11800. [Google Scholar] [CrossRef]
  25. Comino, E.; Marengo, P.; Rolli, V. Root reinforcement effect of different grass species: A comparison between experimental and models results. Soil Tillage Res. 2010, 110, 60–68. [Google Scholar] [CrossRef]
  26. Fan, C.-C.; Su, C.-F. Role of roots in the shear strength of root-reinforced soils with high moisture content. Ecol. Eng. 2008, 33, 157–166. [Google Scholar] [CrossRef]
  27. Thomas, R.E.; Pollen-Bankhead, N. Modeling root-reinforcement with a fiber-bundle model and Monte Carlo simulation. Ecol. Eng. 2010, 36, 47–61. [Google Scholar] [CrossRef]
  28. Wu, T.H. Root reinforcement of soil: Review of analytical models, test results, and applications to design. Can. Geotech. J. 2013, 50, 259–274. [Google Scholar] [CrossRef]
  29. Waghmare, K.D.; Tripathi, K.K. Review on Field Direct Shear Test Methodologies. In Recent Trends in Construction Technology and Management; Lecture Notes in Civil Engineering; Ranadive, M.S., Das, B.B., Mehta, Y.A., Gupta, R., Eds.; Springer Nature: Singapore, 2023; pp. 665–672. [Google Scholar] [CrossRef]
  30. Jiang, Y.; Alam, M.; Li-Jun, S.; Umar, M.; Sadiq, S.; Jia, L.J.; Rahman, M. Effect of root orientation on the strength characteristics of loess in drained and undrained triaxial tests. Eng. Geol. 2022, 296, 106459. [Google Scholar] [CrossRef]
  31. GB/T50123; Standard for Soil Test Method. Ministry of Construction: Beijing, China, 1999. (In Chinese)
  32. ASTM D422-63(2007)e1; Standard Test Method for Particle-Size Analysis of Soils. US Department of Defense: Washington, DC, USA, 2007.
  33. Pollen, N. Temporal and spatial variability in root reinforcement of streambanks: Accounting for soil shear strength and moisture. Catena 2007, 69, 197–205. [Google Scholar] [CrossRef]
  34. Schwarz, M.; Cohen, D.; Or, D. Root-soil mechanical interactions during pullout and failure of root bundles. J. Geophys. Res. Earth Surf. 2010, 115, F04035. [Google Scholar] [CrossRef]
  35. Ari, A.; Akbulut, S. Effect of fractal dimension on sand-geosynthetic interface shear strength. Powder Technol. 2022, 401, 117349. [Google Scholar] [CrossRef]
  36. Chang, R.; Fu, B.; Liu, G.; Yao, X.; Wang, S. Effects of soil physicochemical properties and stand age on fine root biomass and vertical distribution of plantation forests in the Loess Plateau of China. Ecol. Res. 2012, 27, 827–836. [Google Scholar] [CrossRef]
  37. Lian, B.; Peng, J.; Zhan, H.; Wang, X. Mechanical response of root-reinforced loess with various water contents. Soil Tillage Res. 2019, 193, 85–94. [Google Scholar] [CrossRef]
  38. Meng, S.; Zhao, G.; Yang, Y. Impact of Plant Root Morphology on Rooted-Soil Shear Resistance Using Triaxial Testing. Adv. Civ. Eng. 2020, 2020, e8825828. [Google Scholar] [CrossRef]
  39. Abernethy, B.; Rutherfurd, I.D. The distribution and strength of riparian tree roots in relation to riverbank reinforcement. Hydrol. Process 2001, 15, 63–79. [Google Scholar] [CrossRef]
  40. Stokes, A.; Sotir, R.; Chen, W.; Ghestem, M. Soil bio- and eco-engineering in China: Past experience and future priorities. Ecol. Eng. 2010, 36, 247–257. [Google Scholar] [CrossRef]
  41. Booth, A.M.; Hurley, R.; Lamb, M.P.; Andrade, J.E. Force chains as the link between particle and bulk friction angles in granular material. Geophys. Res. Lett. 2014, 41, 8862–8869. [Google Scholar] [CrossRef]
  42. Huang, Y.; Daniels, K.E. Friction and pressure–dependence of force chain communities in granular materials. Granul. Matter 2016, 18, 85. [Google Scholar] [CrossRef]
  43. Hunt, G.W.; Tordesillas, A.; Green, S.C.; Shi, J. Force-chain buckling in granular media: A structural mechanics perspective. Philos. Trans. R. Soc. A Math. Phys. Eng. Sci. 2010, 368, 249–262. [Google Scholar] [CrossRef]
  44. Amundson, J.M.; Burton, J.C. Quasi-Static Granular Flow of Ice Mélange. J. Geophys. Res. Earth Surf. 2018, 123, 2243–2257. [Google Scholar] [CrossRef]
  45. Canakci, H.; Hamed, M.; Celik, F.; Sidik, W.; Eviz, F. Friction characteristics of organic soil with construction materials. Soils Found. 2016, 56, 965–972. [Google Scholar] [CrossRef]
  46. Zhang, L.; Sun, J.; Shi, C. Numerical simulation on the influence of plant root morphology on shear strength in the sandy soil, Northwest China. J. Arid. Land 2024, 16, 1444–1462. (In Chinese) [Google Scholar]
Figure 1. Typical characteristics of shallow loess landslides in the Robinia pseudacacia growth area of the loess plateau. (A) Aerial photograph of a typical shallow loess landslide; (B) cross-section of a shallow loess landslide; (C) appearance of the outlet at the front edge of the shallow loess landslide; (D) sliding surface of the shallow loess landslide; (E) exposure and damage of roots near the sliding surface of the shallow loess landslide; (F) roots adhering to loess through their curved morphology.
Agronomy 15 00847 g001
Figure 2. Distribution and profiles of typical shallow loess landslides in Yichuan County. (A) Distribution of typical shallow loess landslides in Yichuan County, Yan’an City, Shaanxi Province, China; (B) Profile of a Typical Shallow Loess Landslide. In (A), the numbers in the DEM map correspond to typical, shallow loess landslide photos.
Agronomy 15 00847 g002
Figure 3. Field investigation and sampling of root distribution characteristics. (A) Geographic location of the sampling points and aerial view of the site; (B) distribution of roots on the trench profile; (C) counting and distribution of coarse and fine roots in the trench sections based on the grid method; (D) Frequency distribution of roots of different diameters; (E) collection of root samples based on the whole plant excavation method.
Agronomy 15 00847 g003
Figure 4. Primary steps and results of root classification. (A) 3D laser scanner; (B) fixing roots on a workbench with marked points; (C) reconstruction of the 3D morphology of the roots; (D) preprocessing of point cloud data; (EH) scatter plots of curvature distribution for roots of lengths of 2 cm, 10 cm, 15 cm, and 20 cm; (I) correlation analysis of curvatures for target roots in different diameter ranges; (J) statistical results of curvatures for different root types with a length of 15 cm.
Agronomy 15 00847 g004
Figure 5. Working principle and primary steps of the ring-shear apparatus. (A) Working principle of the ring-shear apparatus; (B) schematic diagram of the stress–strain calculation; (C) photograph of the ring-shear apparatus; (D) classified Type I, Type II, and Type III roots; (E) root and soil samples divided into eight equal parts to be placed in the shear box; (F) distribution of the roots in the shear box; (G) relative displacement of the frames during the shear process; (H) root–soil shear failure surface; (I) reconstruction of the 3D morphology of the root–soil shear failure surface.
Agronomy 15 00847 g005
Figure 6. Establishment of different single shear models. (A) Establishment of single shear model of loess specimen; (B) Establishment of single shear model of root-loess specimen; (C) Model of mutual contact between soil particles and roots; (D) Model of contact between particles and loading plate.
Agronomy 15 00847 g006
Figure 7. Comparison of laboratory test stress–strain results with numerical simulation results. (A) Comparison of laboratory test and numerical simulation results for loess samples; (B) comparison of laboratory test and numerical simulation results for root–soil samples.
Agronomy 15 00847 g007
Figure 8. Macroscopic features of shear surface failure at the root–loess interface. (A) Cliff-like slip of the seventh or eighth coil; (B) samples within the coil slip in a tilted manner; (CE) shear failure surface morphology of samples with different root contents (0%, 0.23%, AND 2.11%) (t = ii and w = 19%); (F) soil accumulation near the shear box; (G) shear failure surface morphology of the laboratory direct shear test; (H,I) loess slopes with different root content instability on the same slope.
Agronomy 15 00847 g008
Figure 9. Failure process and characteristics of roots at the root–loess interface. (A) Damage characteristics of different root types in single shear tests; (BD) evolution process of root damage in the shear of the root–loess interface with Type I, II, and III roots.
Agronomy 15 00847 g009
Figure 10. Influence of experimental variables on fractal dimension of shear failure surface. (A) Influence of curvature and root content on the fractal dimension of the shear failure surface; (B) influence of curvature (range 0–2.35%) and confining pressure on the fractal dimension of the shear failure surface; (C) influence of the confining pressure and root content on the fractal dimension of the shear failure surface; (D) influence of the curvature (range 1.05–2.35%) and confining pressure on the fractal dimension of the shear failure surface.
Agronomy 15 00847 g010
Figure 11. Relationship between the fractal dimension of the shear failure surface and maximum shear stress in different samples. (A) Relationship between the fractal dimension of the shear failure surface and maximum shear stress in different samples; (B) Pearson correlation analysis between the fractal dimension of the root–loess shear failure surface and maximum shear stress.
Agronomy 15 00847 g011
Figure 12. Influence of root content, root type, and confining pressure on the stress–strain relationship of samples with 5% moisture content. (AC) Influence of root content variations on the stress–strain of samples with Type I roots; (DF) influence of root content variations on the stress–strain of samples with Type II roots; (GI) influence of root content variations on the stress–strain of samples with Type III roots.
Agronomy 15 00847 g012
Figure 13. Influence of root content, root type, and confining pressure on the stress–strain relationship of samples with 12% moisture content. (AC) Influence of root content variations on the stress–strain of samples with Type I roots; (DF) influence of root content variations on the stress–strain of samples with Type II roots; (GI) influence of root content variations on the stress–strain of samples with Type III roots.
Agronomy 15 00847 g013
Figure 14. Influence of root content, root type, and confining pressure on stress–strain relationship of samples with 19% moisture content. (AC) Influence of root content variations on the stress–strain of samples with Type I roots; (DF) influence of root content variations on the stress–strain of samples with Type II roots; (GI) influence of root content variations on the stress–strain of samples with Type III roots.
Agronomy 15 00847 g014
Figure 15. Influence of experimental variables on the cohesion in shear strength indicators at the root–loess interface. (AC) Influence of the moisture content variation on cohesion; (DF) influence of the root shape variation on cohesion; (GI) influence of the root content variation on cohesion.
Agronomy 15 00847 g015
Figure 16. Influence of experimental variables on the internal friction angle of shear strength indicators at the root–loess interface. (AC) Influence of the moisture content variation on the internal friction angle; (DF) influence of the root shape variation on the internal friction angle; (GI) influence of the root content variation on the internal friction angle.
Agronomy 15 00847 g016
Figure 17. Influence range of roots on shear strength indicators at the root–loess interface with different moisture contents (The green shading represents the extent of root influence on the strength of the root-soil interface). (A) Influence of roots on shear strength indicators at the root–loess interface with 5% moisture content; (B) influence of roots on shear strength indicators at the root–loess interface with 12% moisture content; (C) influence of roots on shear strength indicators at the root–loess interface with 19% moisture content; (D) legend and explanation.
Agronomy 15 00847 g017
Figure 18. Comparison of simulation results in different dimensions for two types of samples. (A) Force chain distribution between particles; (B) distribution of particle displacement field; (C) distribution of particle velocity field; (D) particle profile inside the specimen.
Agronomy 15 00847 g018
Figure 19. Physical mechanism of shear behavior at the root–loess interface: self-locking and biting. (A) Formation conditions of biting and self-locking at the root–loess interface; (B) interaction mechanism between roots and soil particles at the root–loess interface; (C) shear dilatancy, fracture, and rearrangement of soil particles under force; (D) morphology of root–loess shear failure surface under different conditions.
Agronomy 15 00847 g019
Table 1. Physical properties of soil specimens.
Samplew (%)ρ (g/cm3)ρd (g/cm3)wL
(%)
wp
(%)
Ip (%)Classification
Malan loess12.501.691.3028.1416.8212.32Silty clay
Note: w—water content, ρ—natural density, ρd—natural dry density, wL—liquid limit, wp—plastic limit, Ip—plasticity index.
Table 2. Loess and roots’ fine view parameters.
Indicator NameRadius Range (mm)Particle Density (kg/m3)Porosity
n
Linear Stiffness Ratio
K*
Loess5–82.7 × 1030.552.50
roots5.51.5 × 1030.701.50
Indicator NameEffective modulus
E * /MPa
Coefficient
of friction
μ
radius multiplier
λ ¯
Normal bond strength
σ c ¯ /MPa
Loess33.50.5771.00.25
roots0.40.5770.25100
Indicator NameFriction angle
ϑ ¯
Bonded
stiffness ratio
K * ¯
Linear normal stiffness
MPa
Tangential bond strength
c ¯ /MPa
Loess33.52.50/0.1
roots/1.500.5100
Disclaimer/Publisher’s Note: The statements, opinions and data contained in all publications are solely those of the individual author(s) and contributor(s) and not of MDPI and/or the editor(s). MDPI and/or the editor(s) disclaim responsibility for any injury to people or property resulting from any ideas, methods, instructions or products referred to in the content.

