Article

Effects of Premature Harvesting on Grain Weight and Quality: A Field Study

Rice Research Institute, Anhui Academy of Agricultural Sciences, Hefei 230031, China
*
Author to whom correspondence should be addressed.
These authors contributed equally to this work.
Agronomy 2025, 15(4), 846; https://doi.org/10.3390/agronomy15040846
Submission received: 4 March 2025 / Revised: 24 March 2025 / Accepted: 27 March 2025 / Published: 28 March 2025
(This article belongs to the Section Innovative Cropping Systems)

Abstract

:
Premature harvesting is a prevalent concern in rice cultivation, significantly impacting both grain yield and quality. However, there is limited information regarding the specific effects of premature harvesting on rice quality, particularly in terms of taste value. Consequently, this research aimed to assess the distribution of rice maturity and its implications for rice quality. A comprehensive study was conducted, comprising a one-year survey study and two years of field experiments, to examine the effects of premature harvesting on head rice rate, taste value, amylose content, and protein content. In the survey study, the results indicated that, on average, more than one-quarter of the samples exhibited a green rice rate exceeding 10% at harvest, with the majority having rates surpassing 15%. Premature harvesting was found to significantly reduce grain weight, head rice rate, and taste value, especially when the green rice rate exceeded 15%. Similarly, research experimentation demonstrated that premature harvesting significantly decreased the head rice rate and taste value, accompanied by a reduction in amylose content and an increase in protein content. The head rice rate (r = −0.148 **, p < 0.01), taste value (r = −0.217 **, p < 0.01), amylose content (r = −0.854 **, p < 0.01), and protein content (r = 0.475 **, p < 0.01) exhibited significant correlations with the green rice rate. These findings indicated that optimizing the harvest date is crucial to achieving a low green rice rate (<15%), thereby ensuring high head rice rate, taste value, and amylose content, along with low protein content.

1. Introduction

Rice (Oryza sativa L.) is a primary food crop that plays a vital role in food security and serves as a significant source of income for farmers, particularly in Asia [1,2]. China stands as the leading global producer of rice, with over 65% of its population relying on rice as a staple food, and 50% of its agricultural sector engaged in rice cultivation [3]. As the population grows and living standards improve, there is heightened focus on both the yield and quality of rice production [4]. The head rice rate and taste value have become increasingly significant to consumers, serving as critical determinants of rice’s market value [1,5,6]. These factors are influenced by a range of management practices.
The determination of optimal harvesting time is a critical component of crop management that substantially enhances both the yield and quality of the final produce [7,8]. Jeong et al. [9] also reported that improper timing of harvest can severely diminish the grain quality of rice. Furthermore, grain filling of rice plays a pivotal role in determining kernel weight and harvesting maturity, thereby indirectly affecting the grain yield and quality [10,11]. Grain filling is influenced by a multitude of factors, including nitrogen fertilization, drought, shading, and temperature conditions [12,13,14,15]. The suboptimal presence of these factors complicates the determination of the optimal harvest time. The findings indicate that premature harvesting represents a significant constraint on the yield and quality of rice in practical production [16]. Inappropriate harvest timing can exacerbate these adverse effects. However, there is limited information available concerning the impact of premature harvesting on rice quality.
China contributes to over one-third of the world’s rice production, with more than 60% of rice being from the Yangtze River Valley region [17]. It is essential to acknowledge that rice production in this area plays a vital role in ensuring global food security and is crucial for stabilizing the international rice market [18,19]. Within this region, farming communities exhibit diverse approaches to harvesting, leading to variations in harvesting timings based on their individual experiences. Discrepancies in harvesting schedules elevate the risk of selecting unsuitable rice harvesting dates, which in turn adversely affect rice yield and quality due to uneven maturation. It is imperative to optimize harvesting dates in this region to enhance both grain yield and quality.
Notably, there is a paucity of research examining the influences of premature harvesting on grain quality, particularly in terms of taste value. In response to this gap, the present study aimed to conduct a comprehensive survey (including 466 samples from 11 cities in the middle reaches of the Yangtze River) and two years of field experiments to achieve the following objectives: (1) to examine the maturation pattern in this region; and (2) to evaluate the impacts of premature harvesting on grain quality, including head rice rate, taste value, amylose content, and protein content.

2. Materials and Methods

2.1. Survey Study

In 2020, a survey study was undertaken to examine the maturity stages of rice in the middle reaches of the Yangtze River, China. A total of 466 rice samples were collected from farmers’ fields across this region, covering 11 cities with geographical coordinates ranging from 29.4° N to 33.0° N latitude and 114.9° E to 119.3° E longitude (Table 1). The number of samples obtained from each area was proportionate to the extent of rice cultivation and the prevalence of the main promoted rice cultivars in that area. Each sample was collected from five distinct points within a single field. The study assessed the green rice rates (the ratio of green grains to total grains) for each sample, with three repetitions to determine maturity levels. The 1000-grain weights of both immature (green rice) and mature grains were measured simultaneously.

2.2. Field Experimentation and Growth Conditions

Field experiments were conducted in Dingyuan County, Chuzhou City (32.5° N, 117.7° E), in 2020 and 2021 to assess the effect of premature harvesting on rice quality. Rice grain samples were collected from the central spot to examine rice quality approximately 30 ± 3 days after the grain filling stage (first sampling, S1) and at the harvest (second sampling, S2). Soil properties of the upper 20 cm layer were pH 5.90, organic matter 17.8 g kg−1, total N 1.2 g kg−1, available P 6.1 mg kg−1, and exchangeable K 56.6 mg kg−1. Experiments followed a randomized complete block design with three replications. Indica hybrid rice varieties (Jingliangyouhuazhan, JLYHZ; Jingliangyou 534, JLY534; Quanyou 9028, QY9028; Nuoliangyou 6, NLY6) were used in 2020, and four indica hybrid rice varieties (Jingliangyouhuazhan, JLYHZ; Jingliangyou 534, JLY534; Wangliangyou 9188, WLY9188; Liangyou 5078, LY5078) were used in 2021.
In the present study, field management was conducted according to local practices and was the same in the two consecutive years. Normal fertilization level was 195 kg h/m2 total N, 90 kg h/m2 P2O5, and 195 kg h/m2 K2O. Fertilizer-N was applied in four splits: 40% as basal, 20% at tillering, 20% at panicle initiation, and 20% at two weeks after panicle initiation. Fertilizer-P was fully applied as basal, and fertilizer-K was involved in two splits of 50% as basal and 50% at panicle initiation. The fertilizers were compound fertilizer, urea, calcium superphosphate, and potassium chloride. After transplantation, the fields were submerged. A 3–5 cm flood depth was maintained until the week before maturity, with drainage only during the maximum tillering period to reduce unproductive tillers.

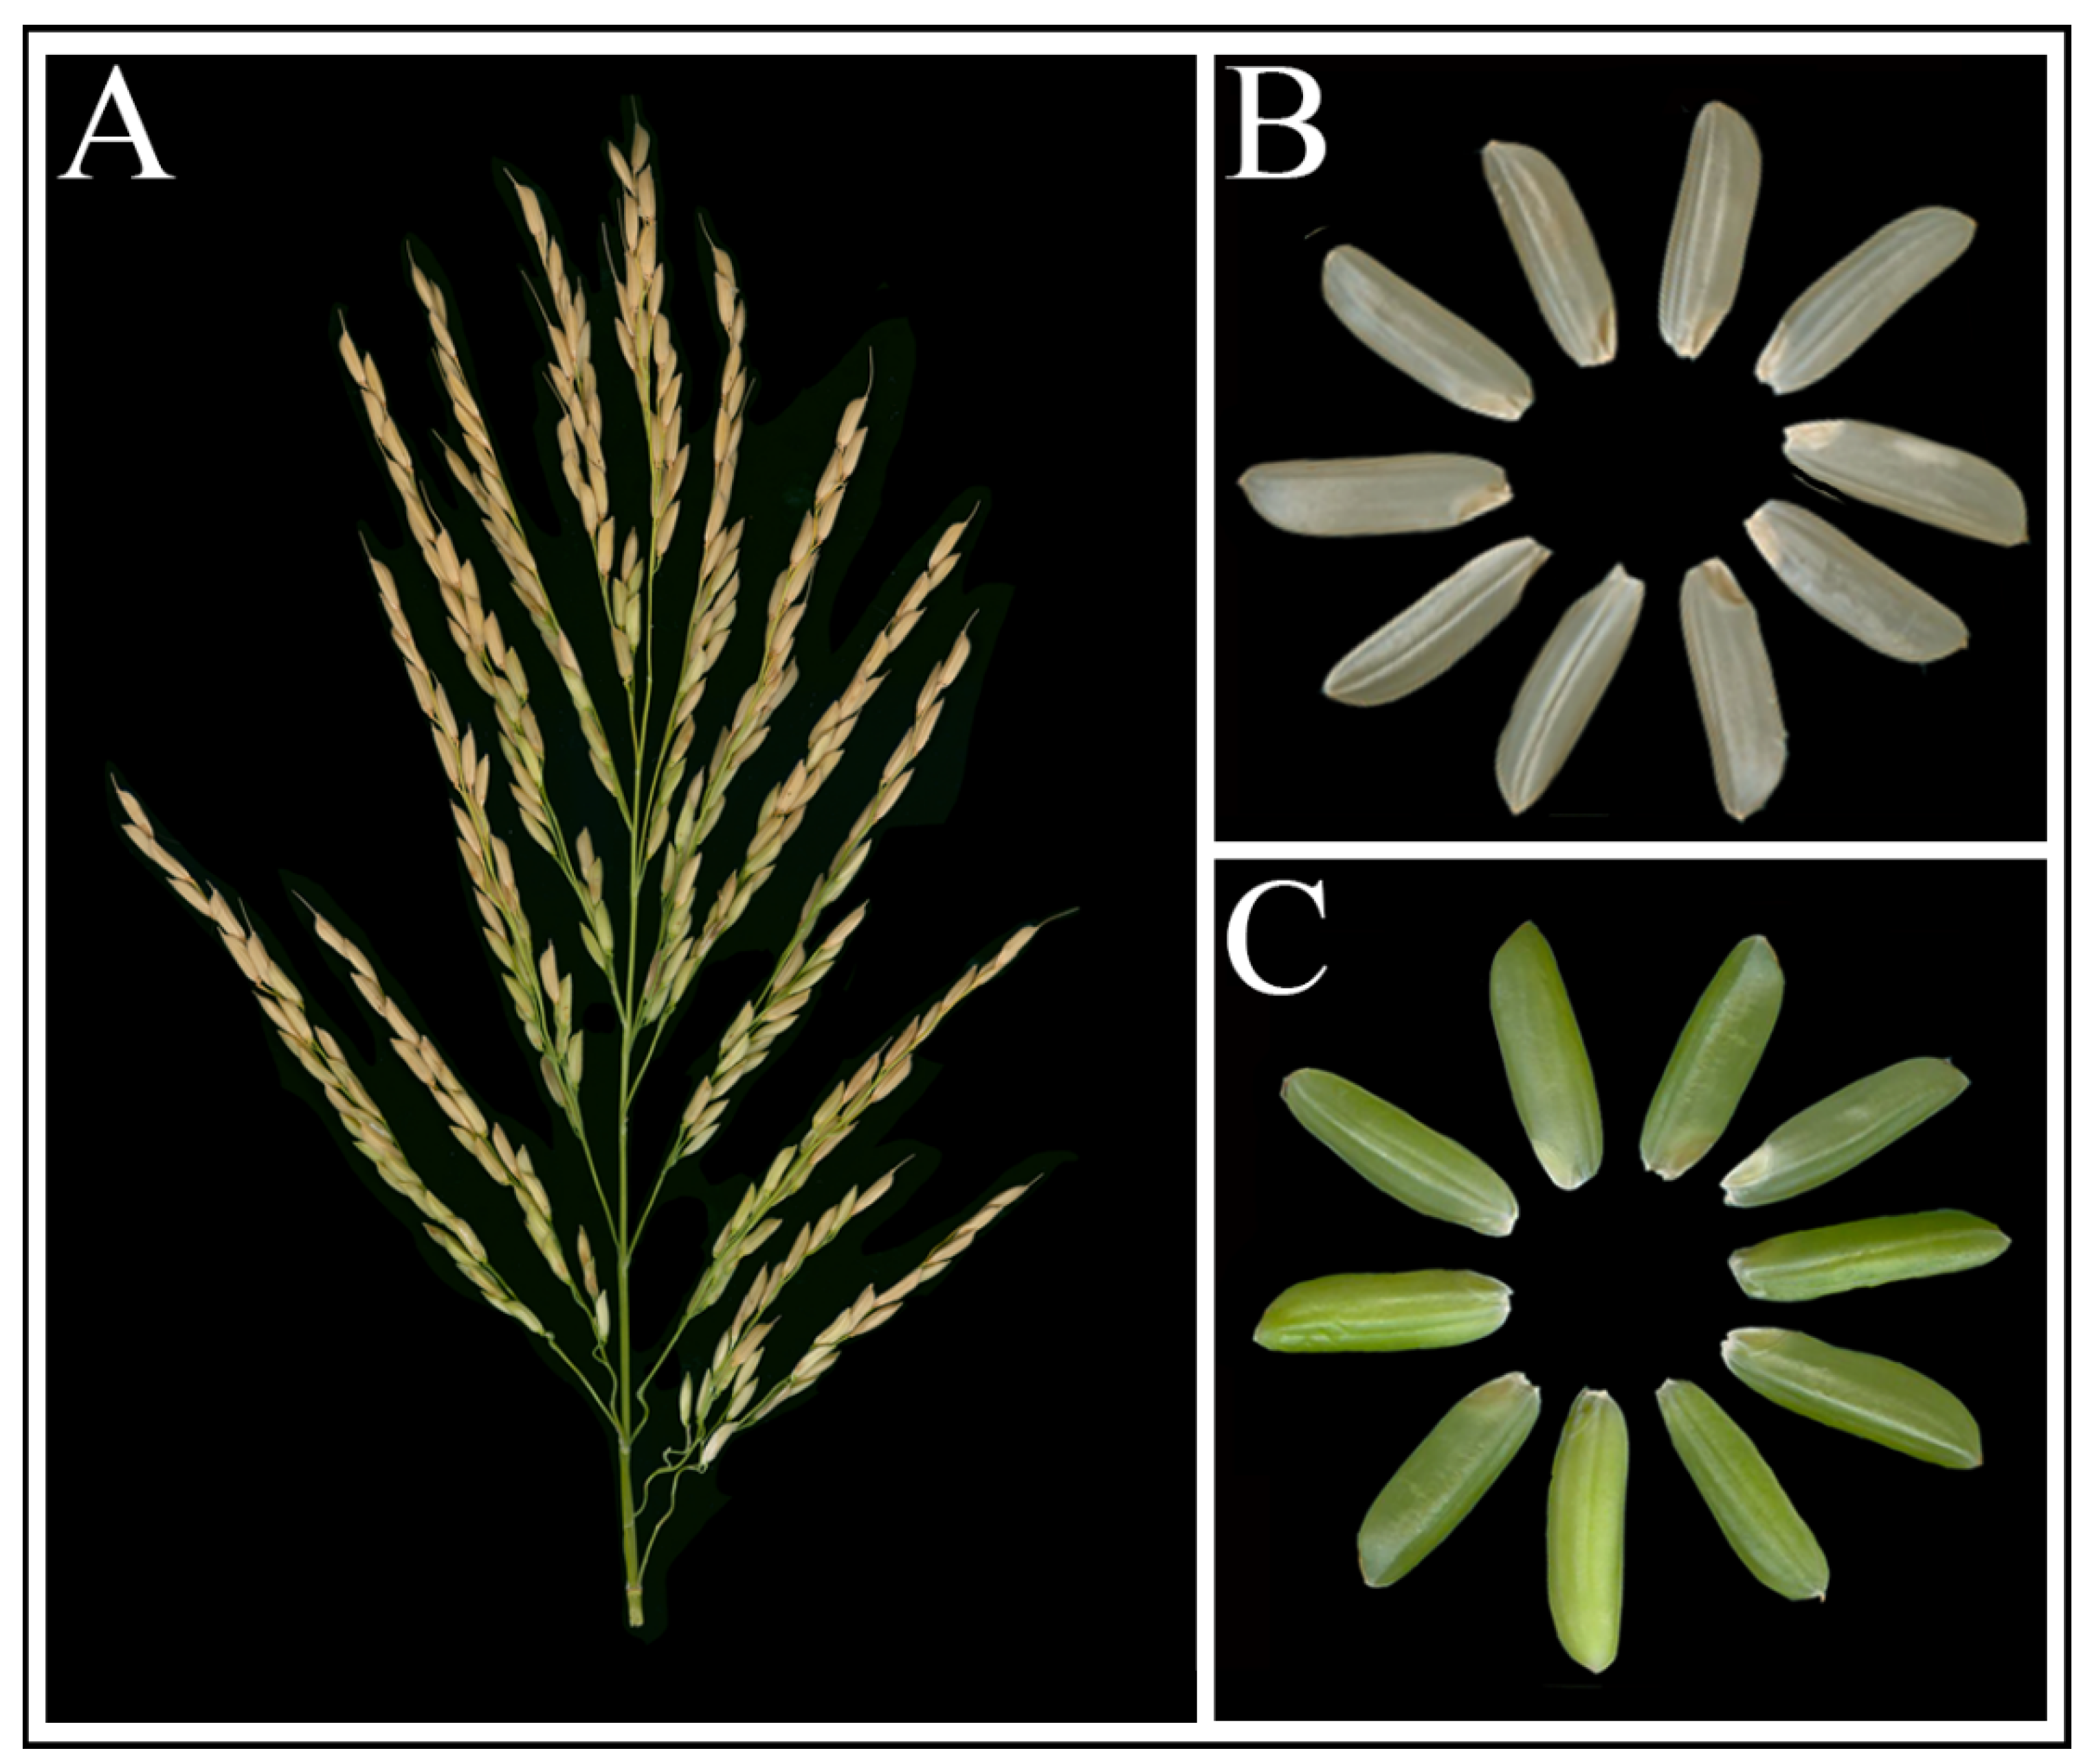
2.3. Determination of Green Rice Rate

About 500 g of rice grains from the center of the plot were collected at 30 ± 3 d after the grain-filling stage and harvest date. Three subsamples (30 g grains) were randomly taken to determine the green rice rate (grain rice rate (%) = green grains/total grains × 100%). The green rice rate (%) of different varieties in different sampling dates in 2020 and 2021 is shown in Table 2.

2.4. Determination of Rice Quality

The grains were air-dried and maintained at room temperature for three months to assess the rice quality of rice, as outlined by Zhang et al. [20]. Rice was hulled and milled by using a rice hulling machine (BLH-3250, Bethlehem, Tongling, China) and a rice polishing machine (Pearlest, Kett, Tokyo, Japan), and the head rice rate was measured. The appearance quality of milled rice was measured and analyzed with a scanner (Epson Expression 1680 Professional, Epson, Beijing, China) and image analysis software. The amylose and protein content were examined using the iodine blue colorimetric and Kjeldahl methods. The taste value of rice was measured by the RCTA-11A Taste Analyzer (Satake, Nagasaki, Japan) according to the method of Zhang et al. [20].

2.5. Statistical Analysis

Analysis of variance (ANOVA) was used to analyze the difference in rice quality, including heading rice rate, chalky grain rate, amylose content, protein content, and gel consistency. Data analysis and graphs were performed using SPSS 21 and SigmaPlot 14.0, respectively.

3. Results

3.1. Premature Harvesting of Rice in Practices

As illustrated in Figure 1, the rice grains frequently exhibited incomplete maturity at the time of harvest. The grains could be categorized into white (Figure 1B) and green (Figure 1C), with the latter representing immature grains. Survey data revealed that over 25% of the samples contained more than 10% immature green rice at the time of harvest, and approximately 50% of the samples exhibited a green rice rate exceeding 15% (Figure 2). These findings suggest a substantial inconsistency in rice maturity at the time of harvest within production practices.

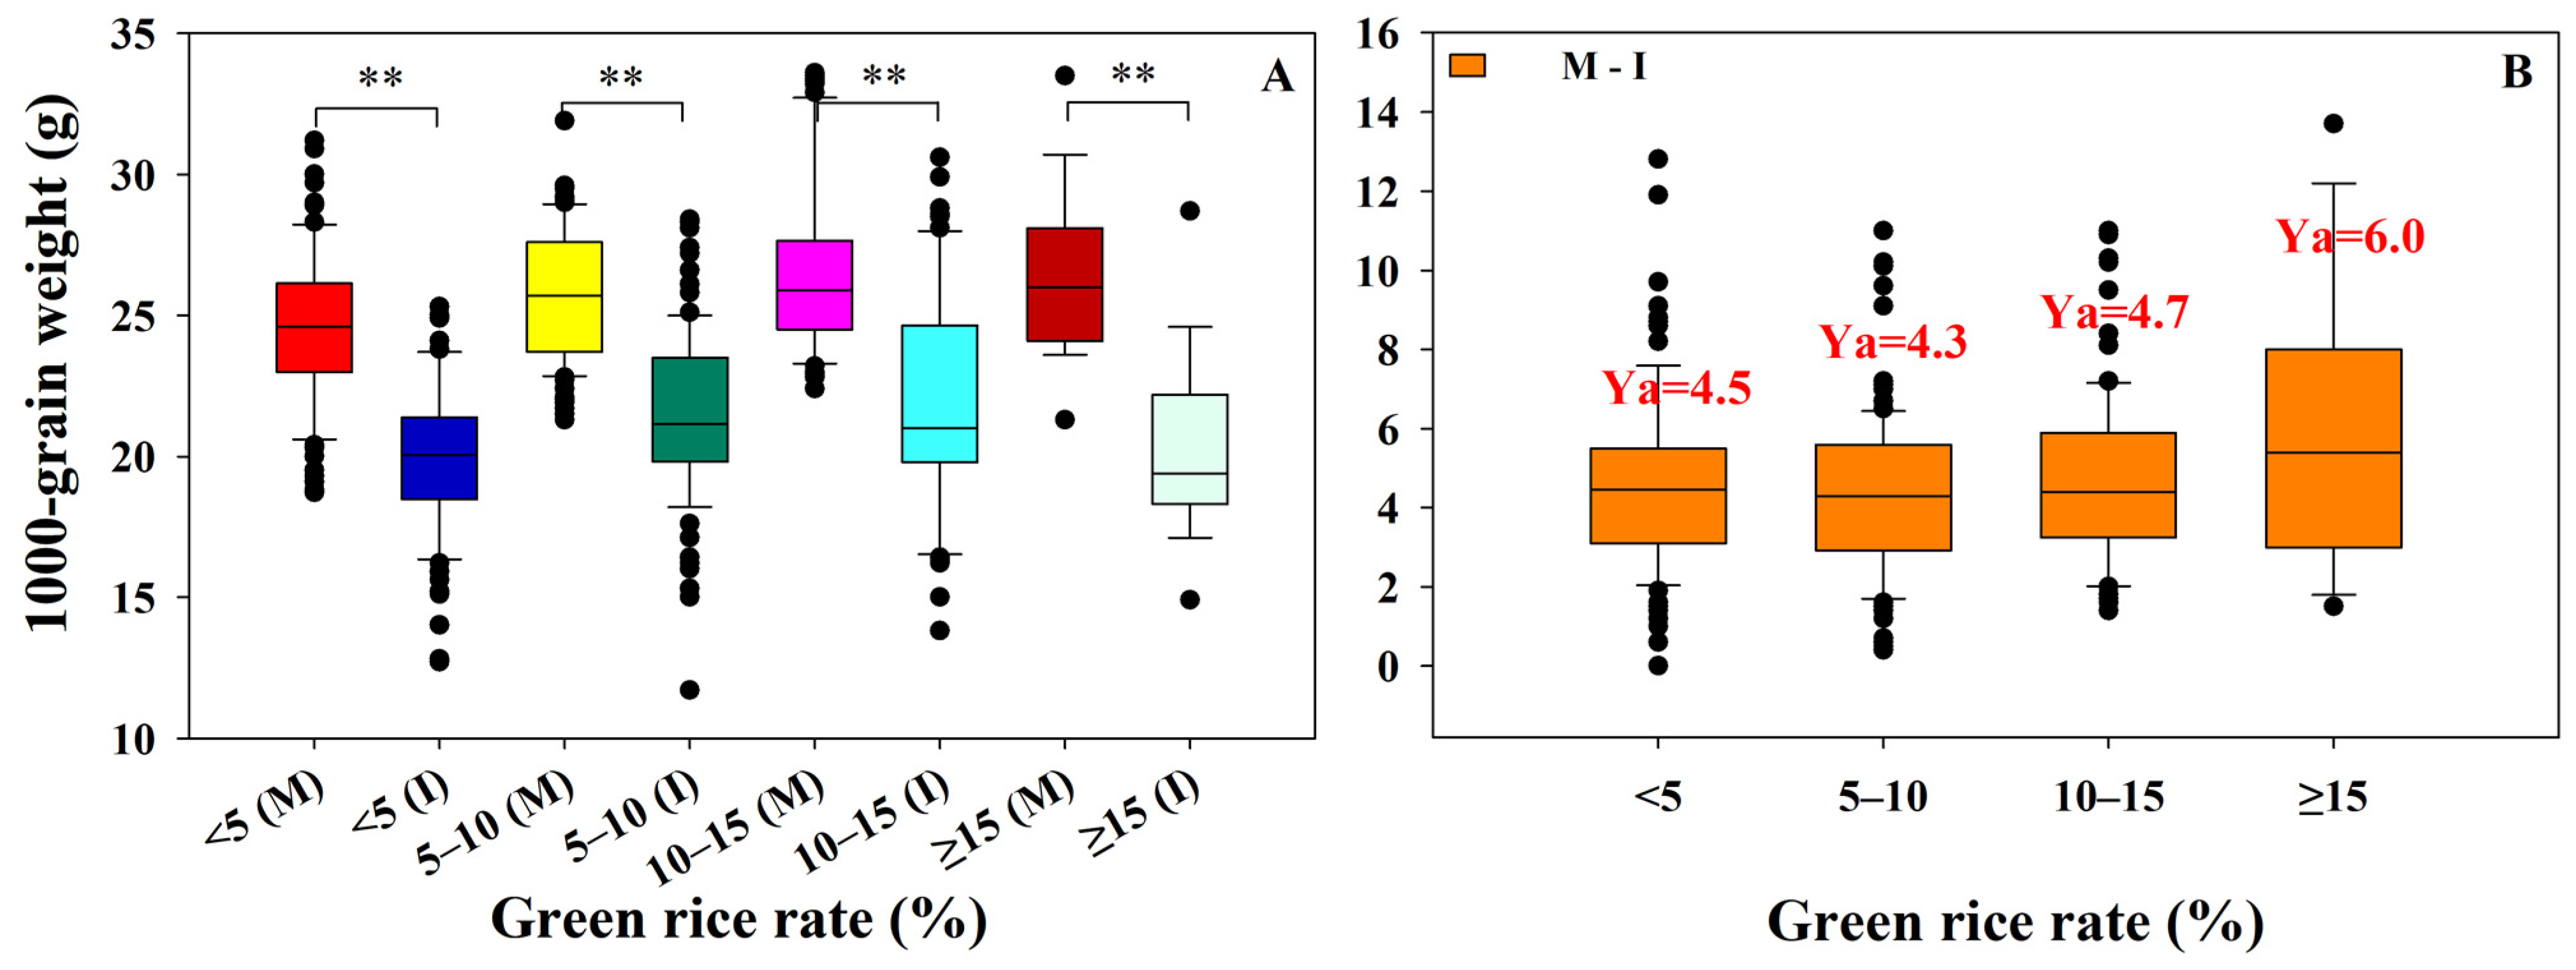
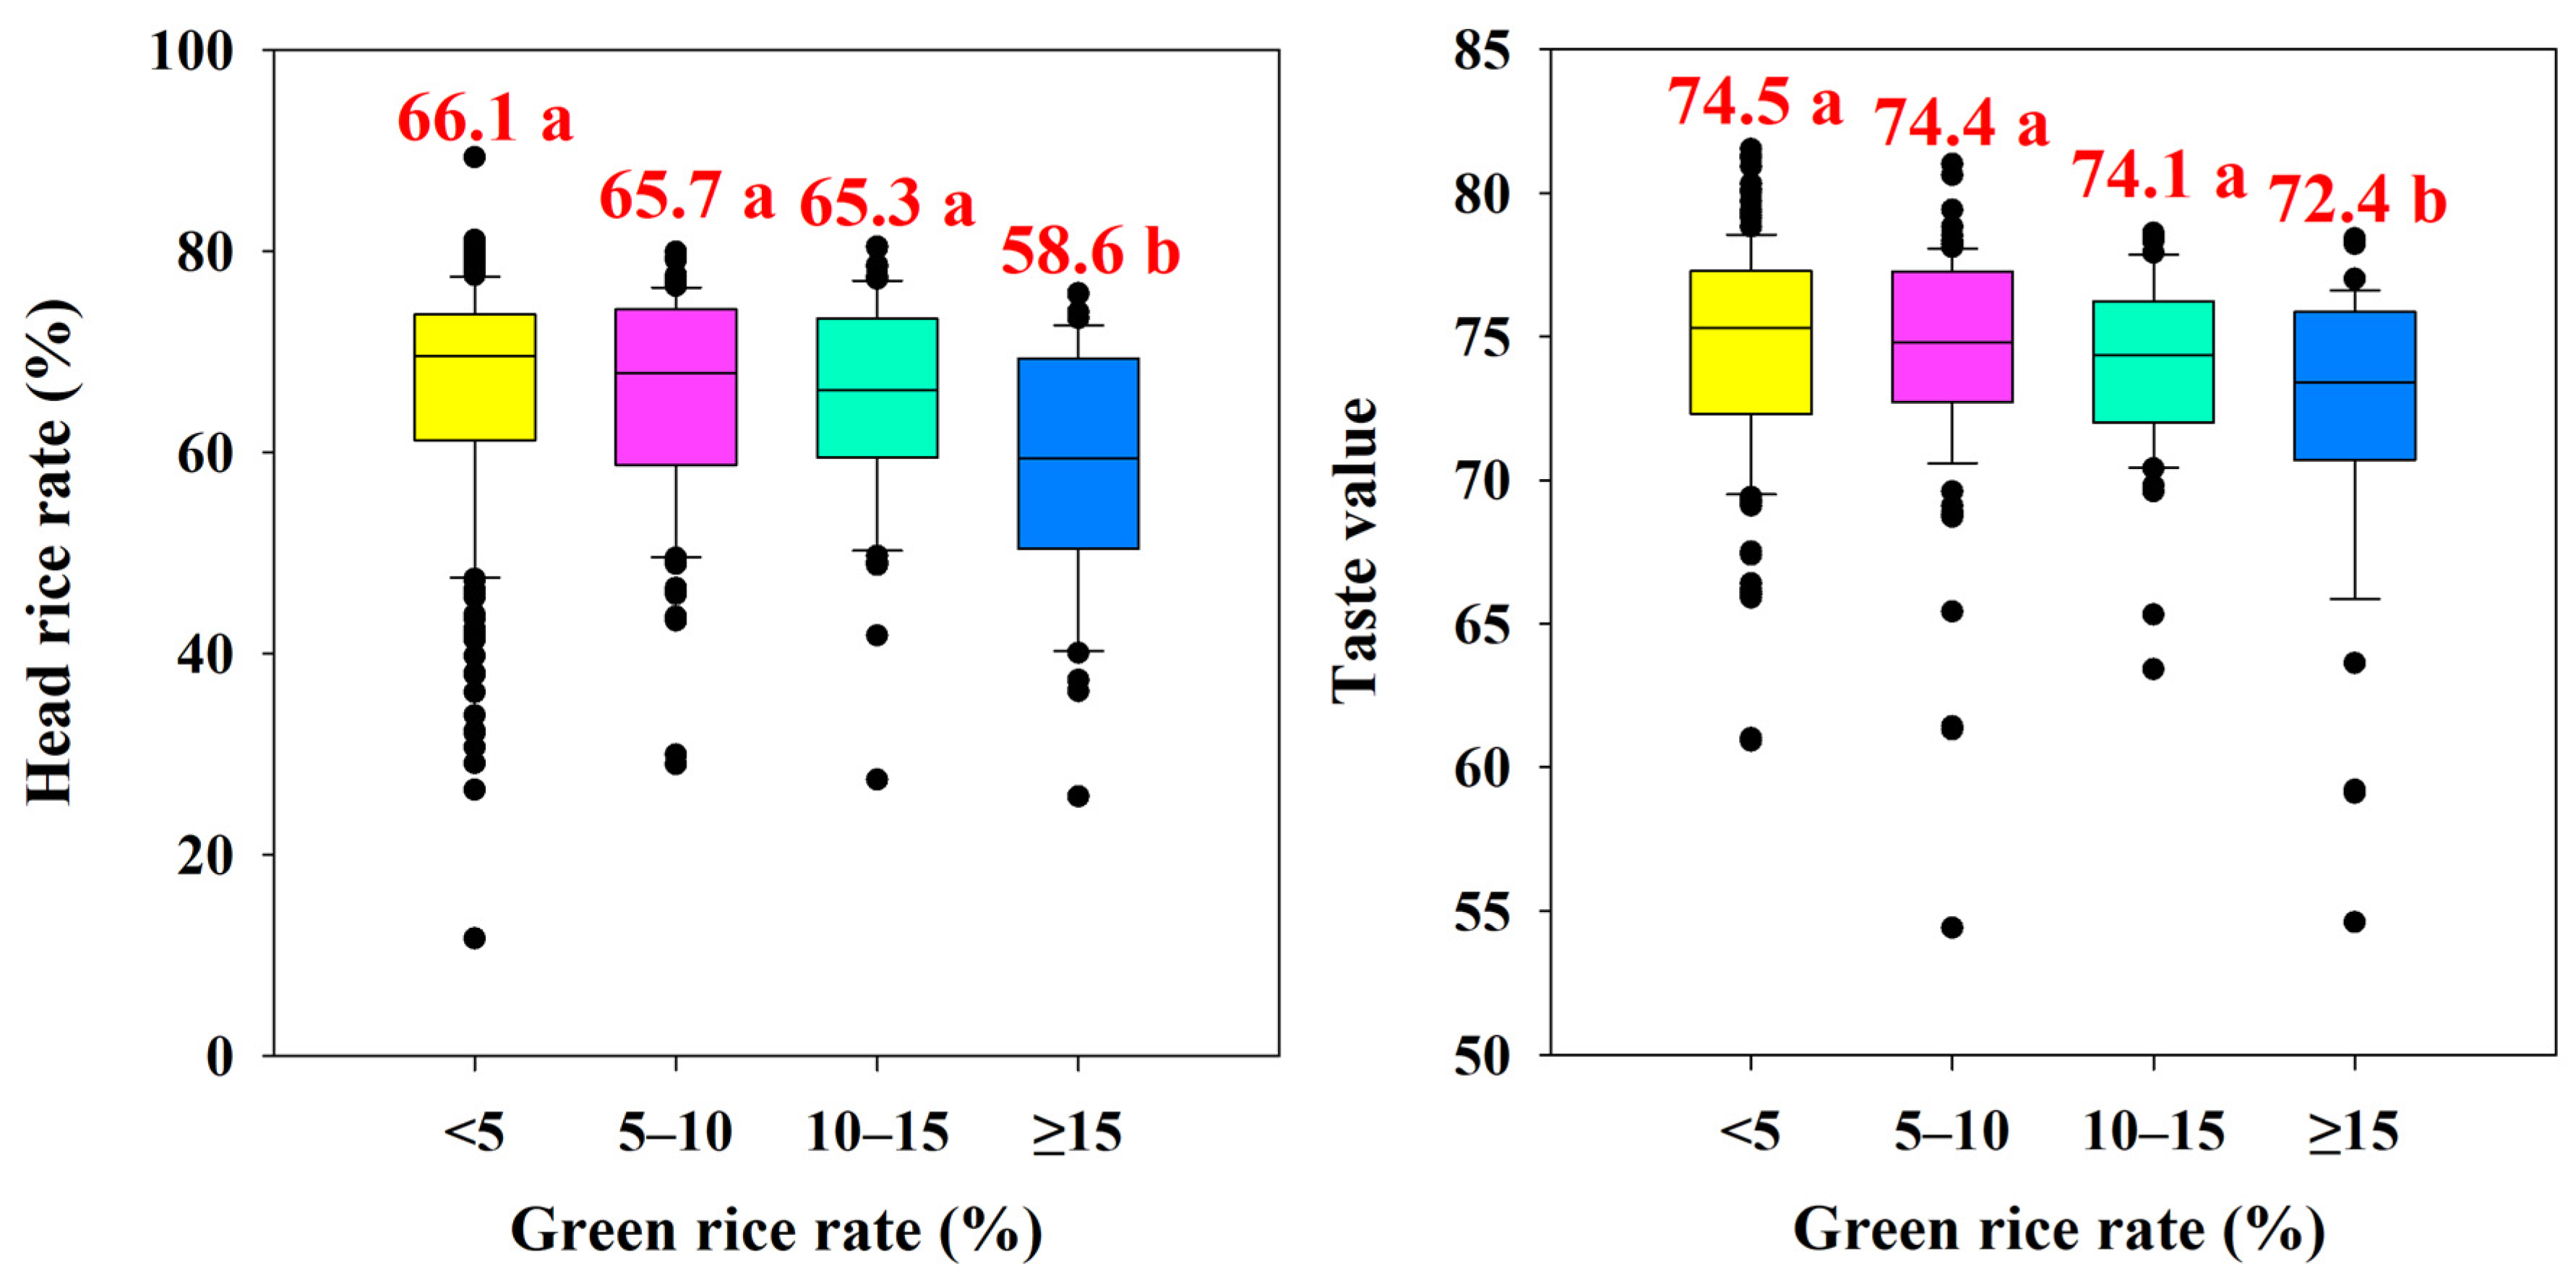
3.2. Difference in Grain Weight and Quality at Different Maturities in Survey Study

In the conducted survey study, significant variations in grain weight were observed across different maturity levels (Figure 3). Specifically, the grain weight of mature rice was substantially greater than that of immature rice across all maturity levels (Figure 3A). The mean difference in 1000-grain weight between mature and immature rice was recorded as 4.3, 4.5, 4.7, and 6.0 g at various maturity levels (Figure 3B). Notably, the disparity was more pronounced when the green rice rate exceeded 15% compared to other maturity stages. Furthermore, the finding indicated a decline in both the head rice rate and the taste value with an increase in the green rice rate (Figure 4). Rice samples exhibited significantly reduced head rice rate and taste value when the green rice rate exceeded 15%. These results suggested that premature harvesting had a substantial impact on grain weight, head rice rate, and taste value, particularly when the green rice rate surpasses 15%.

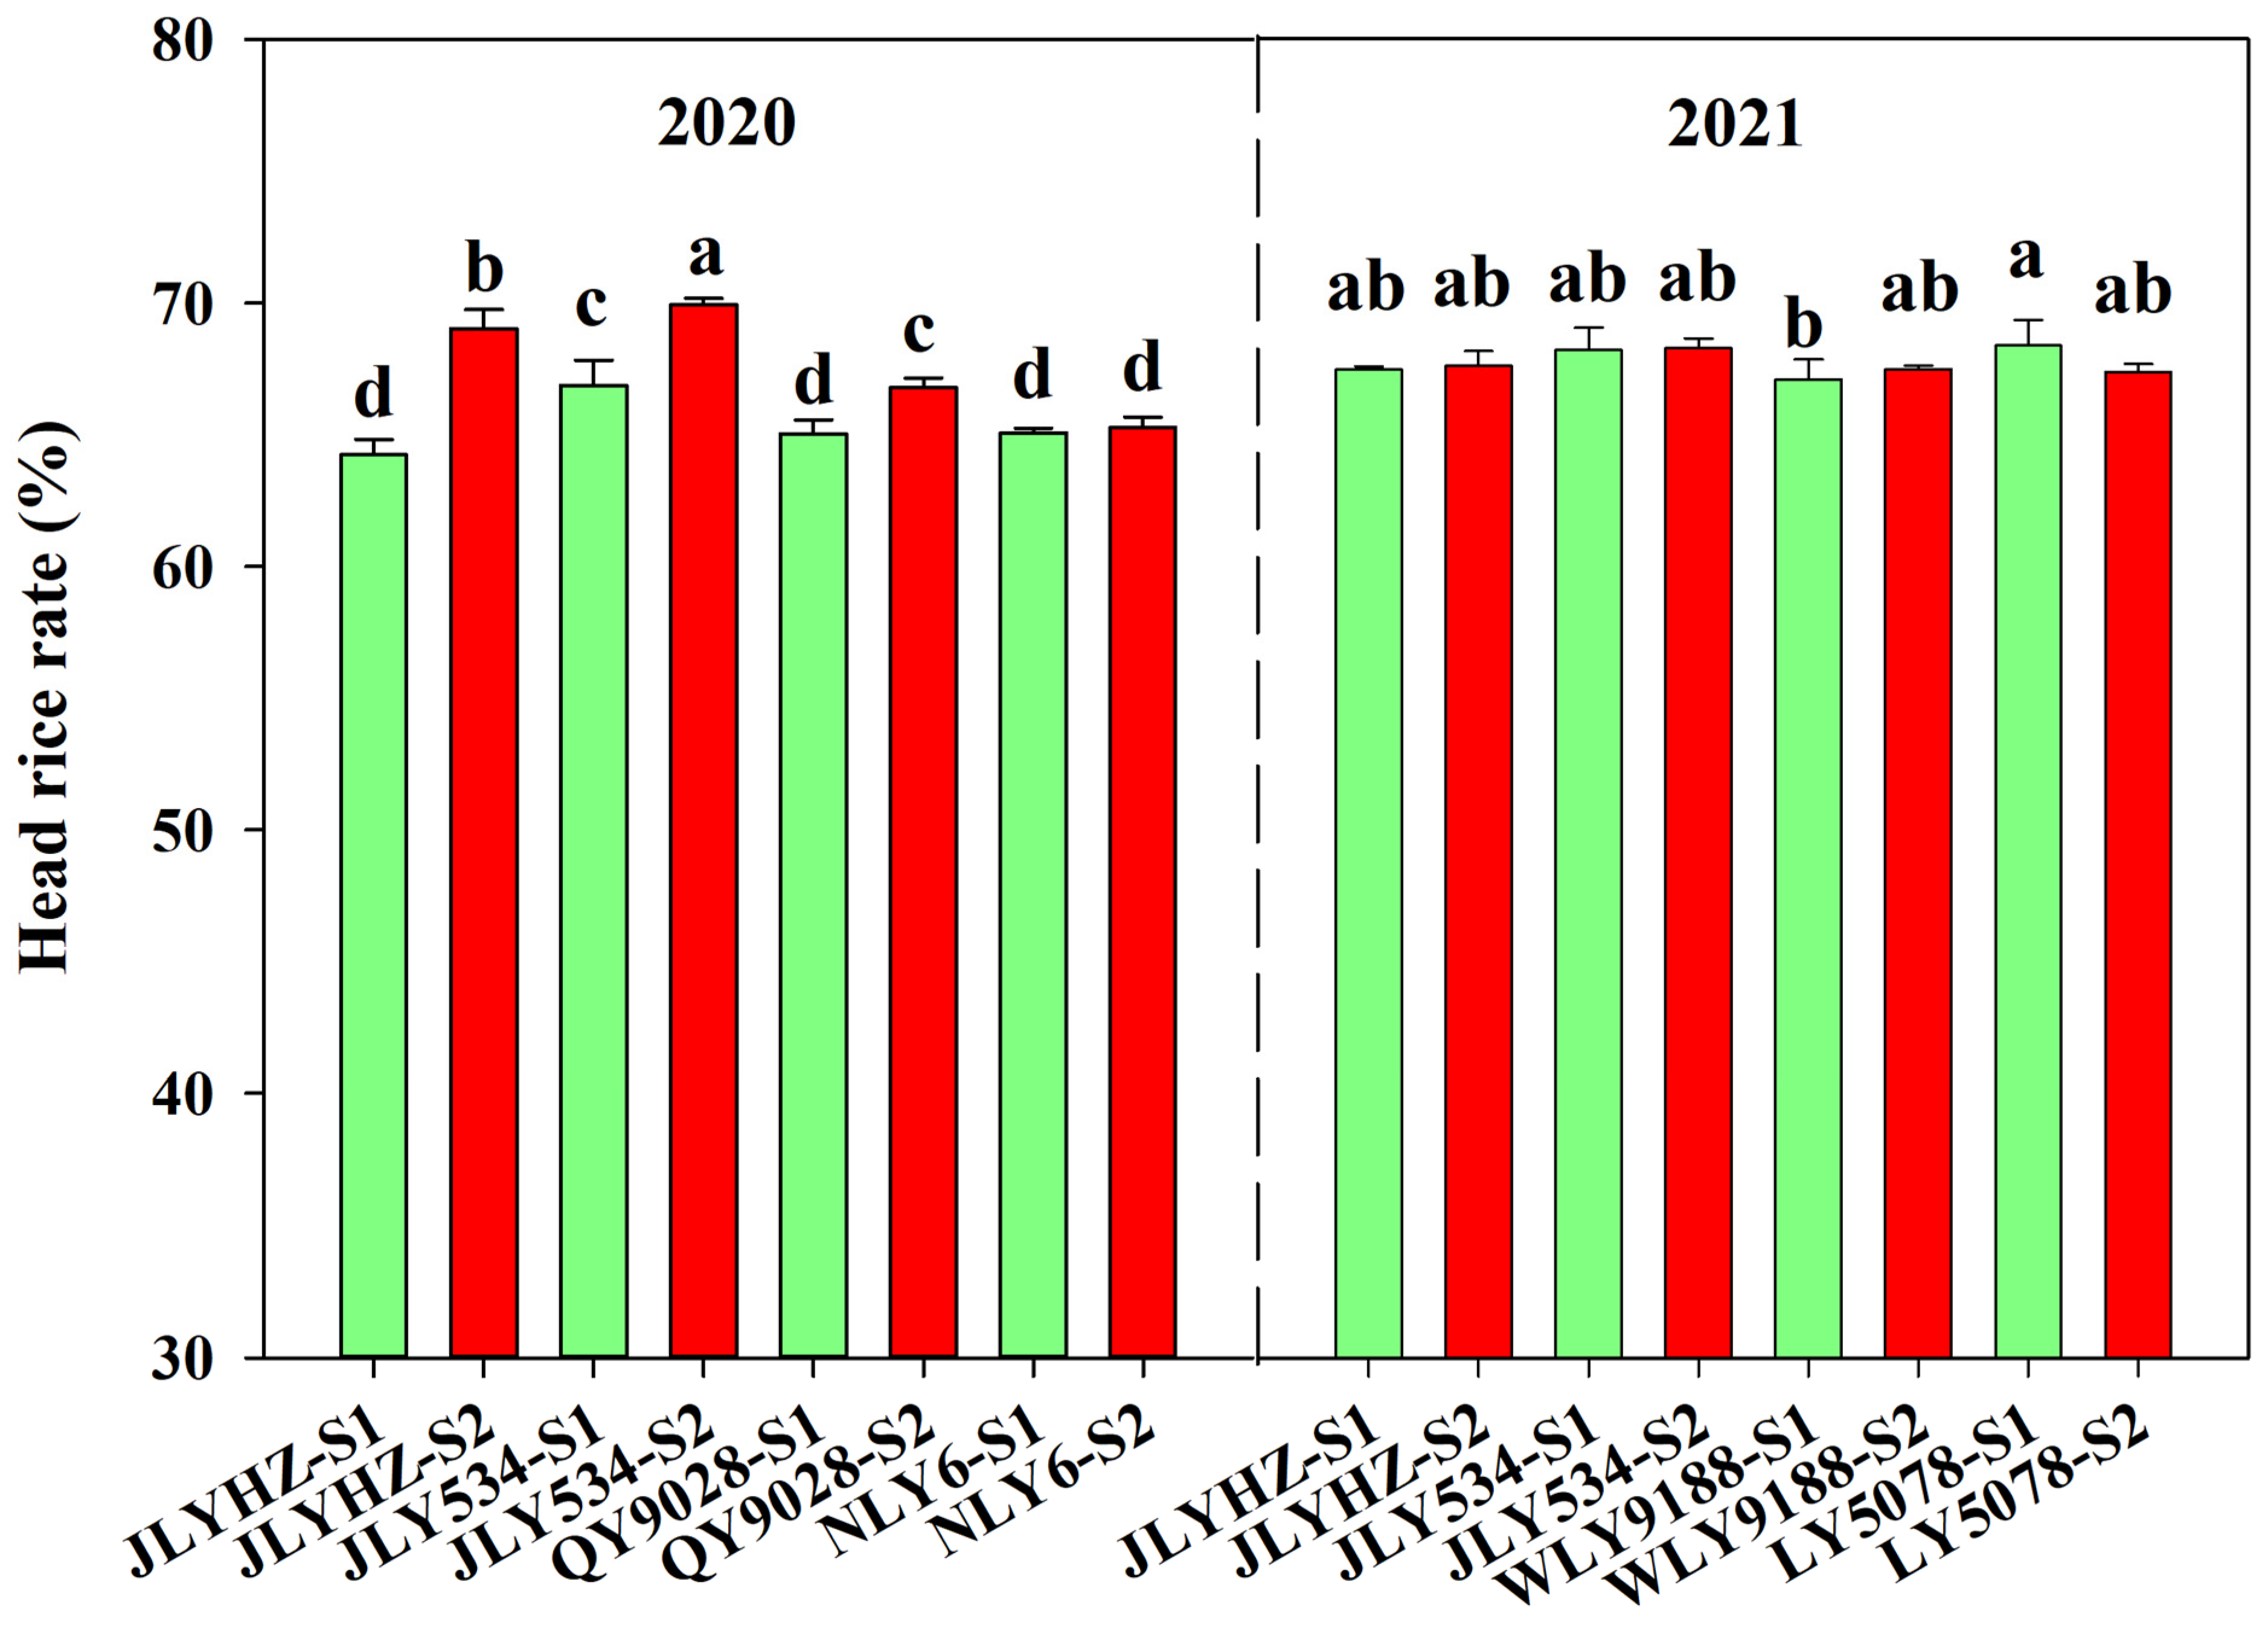
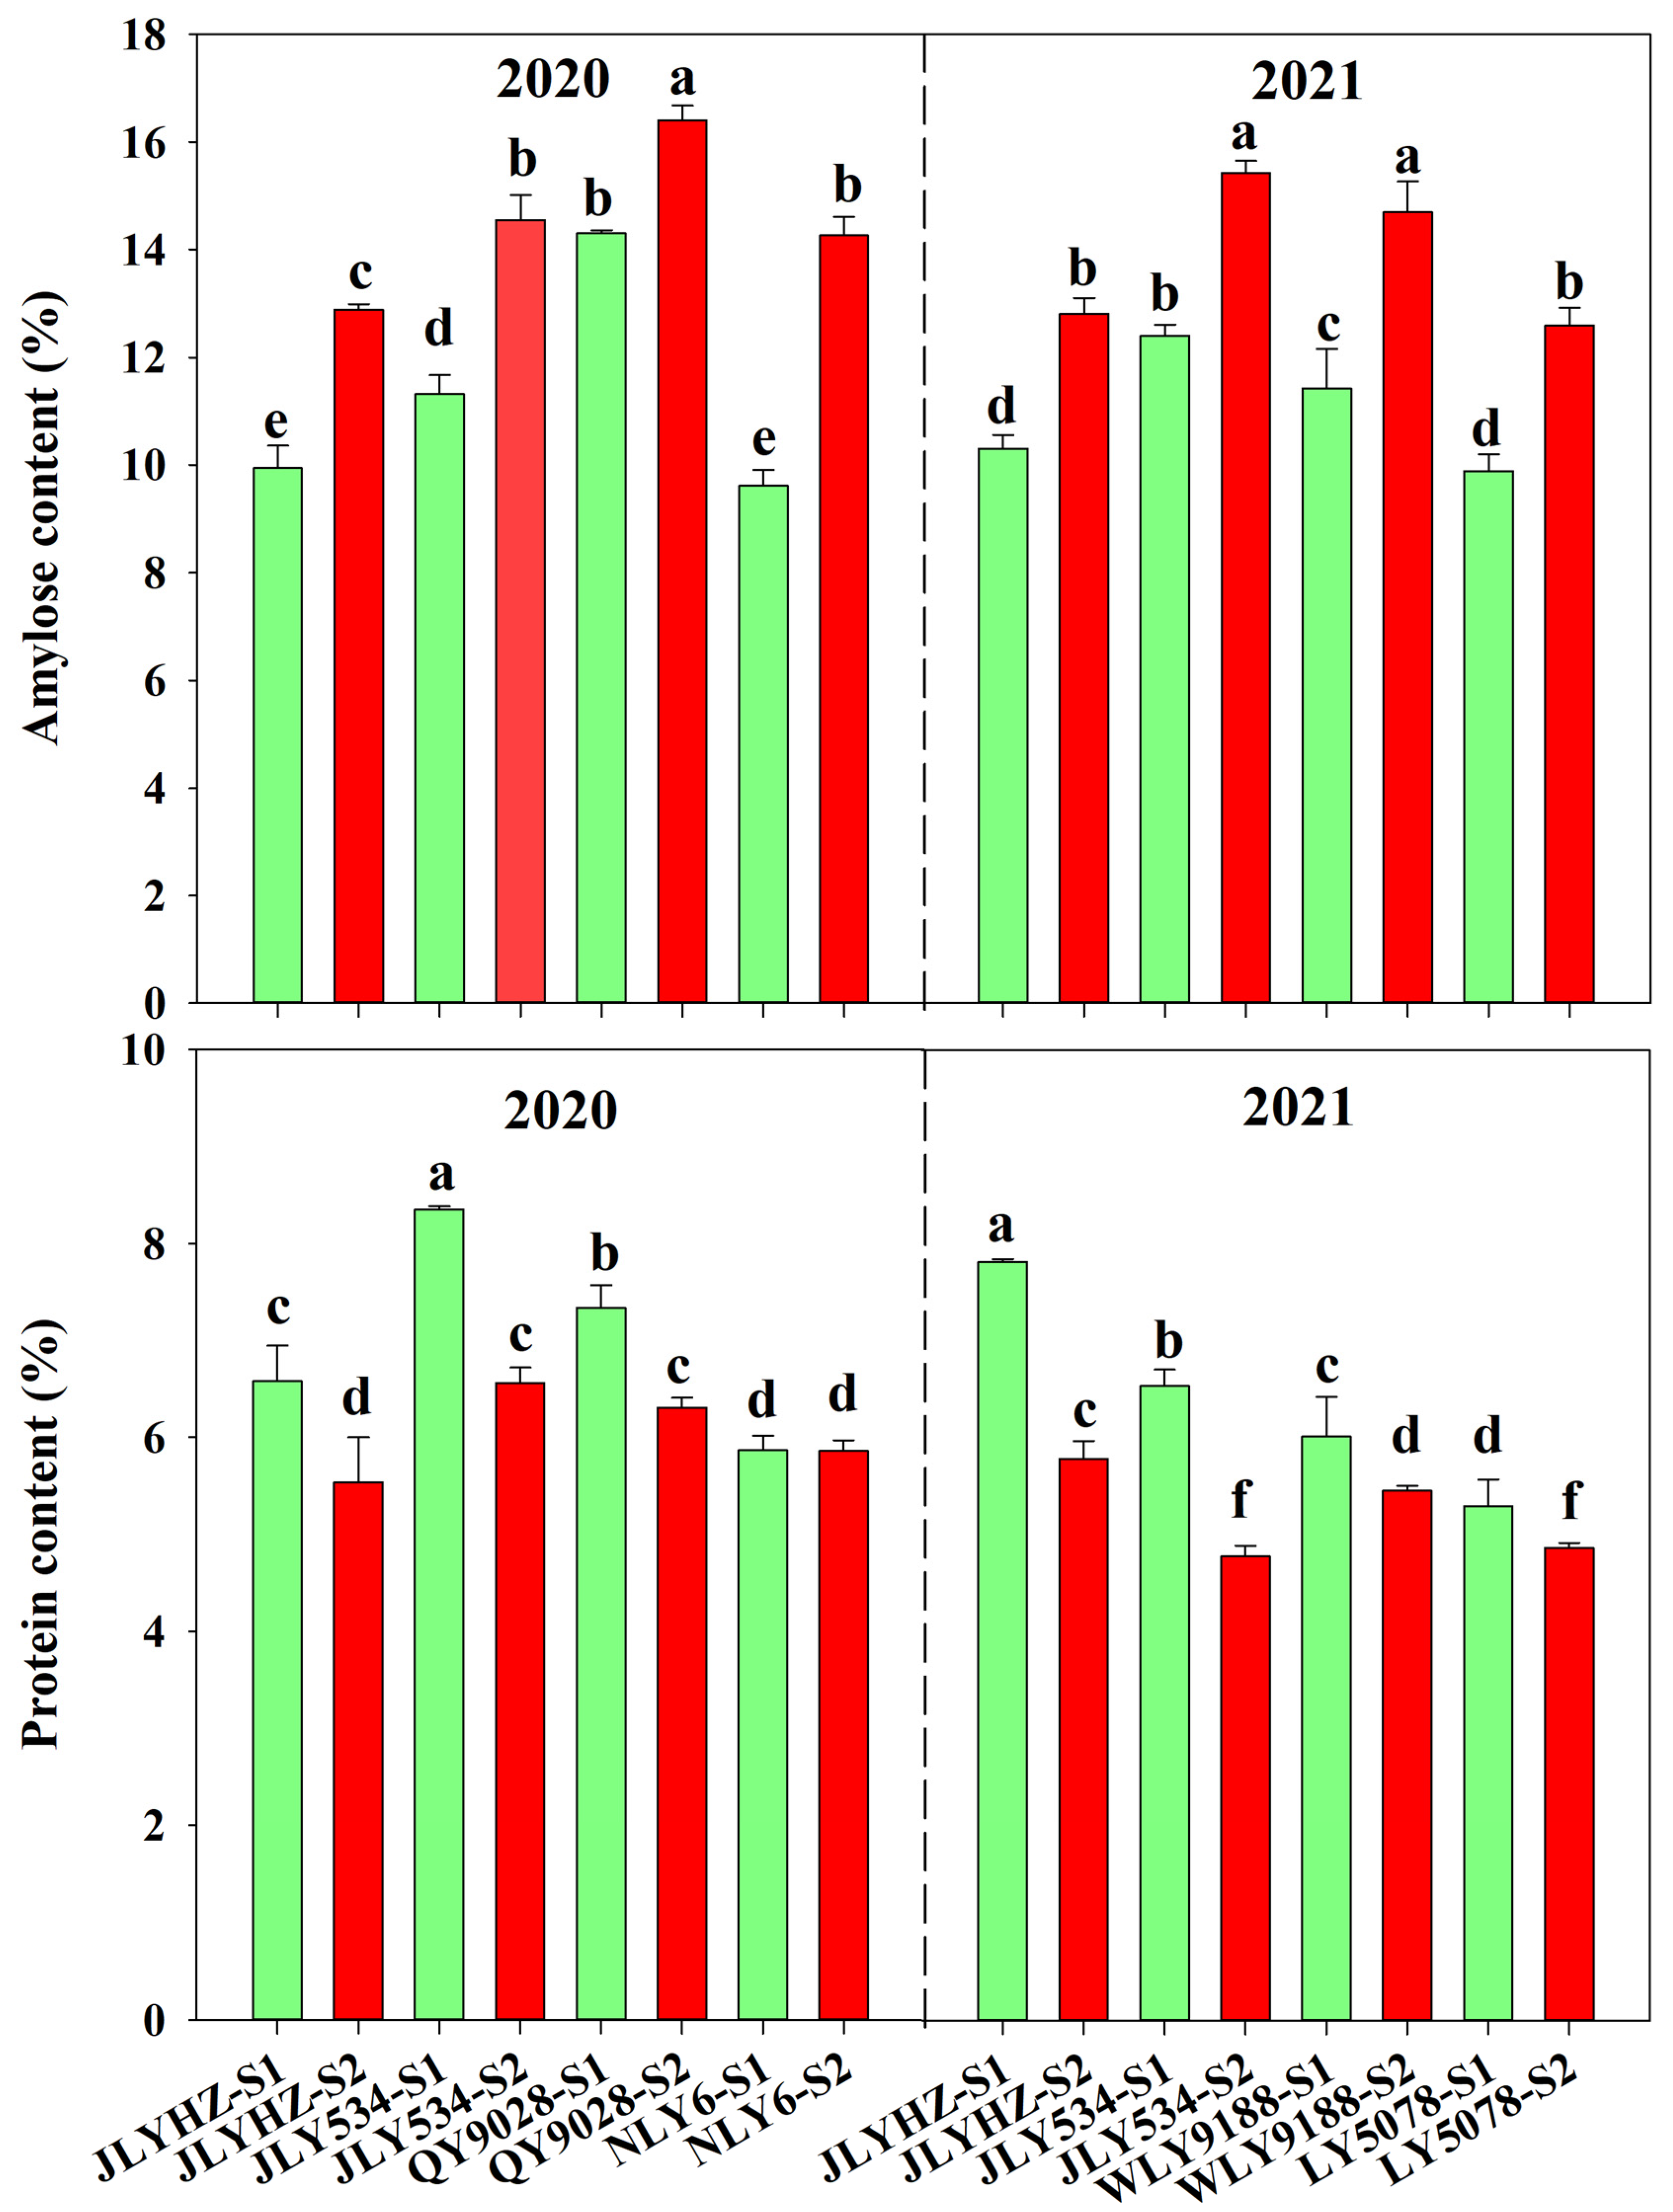
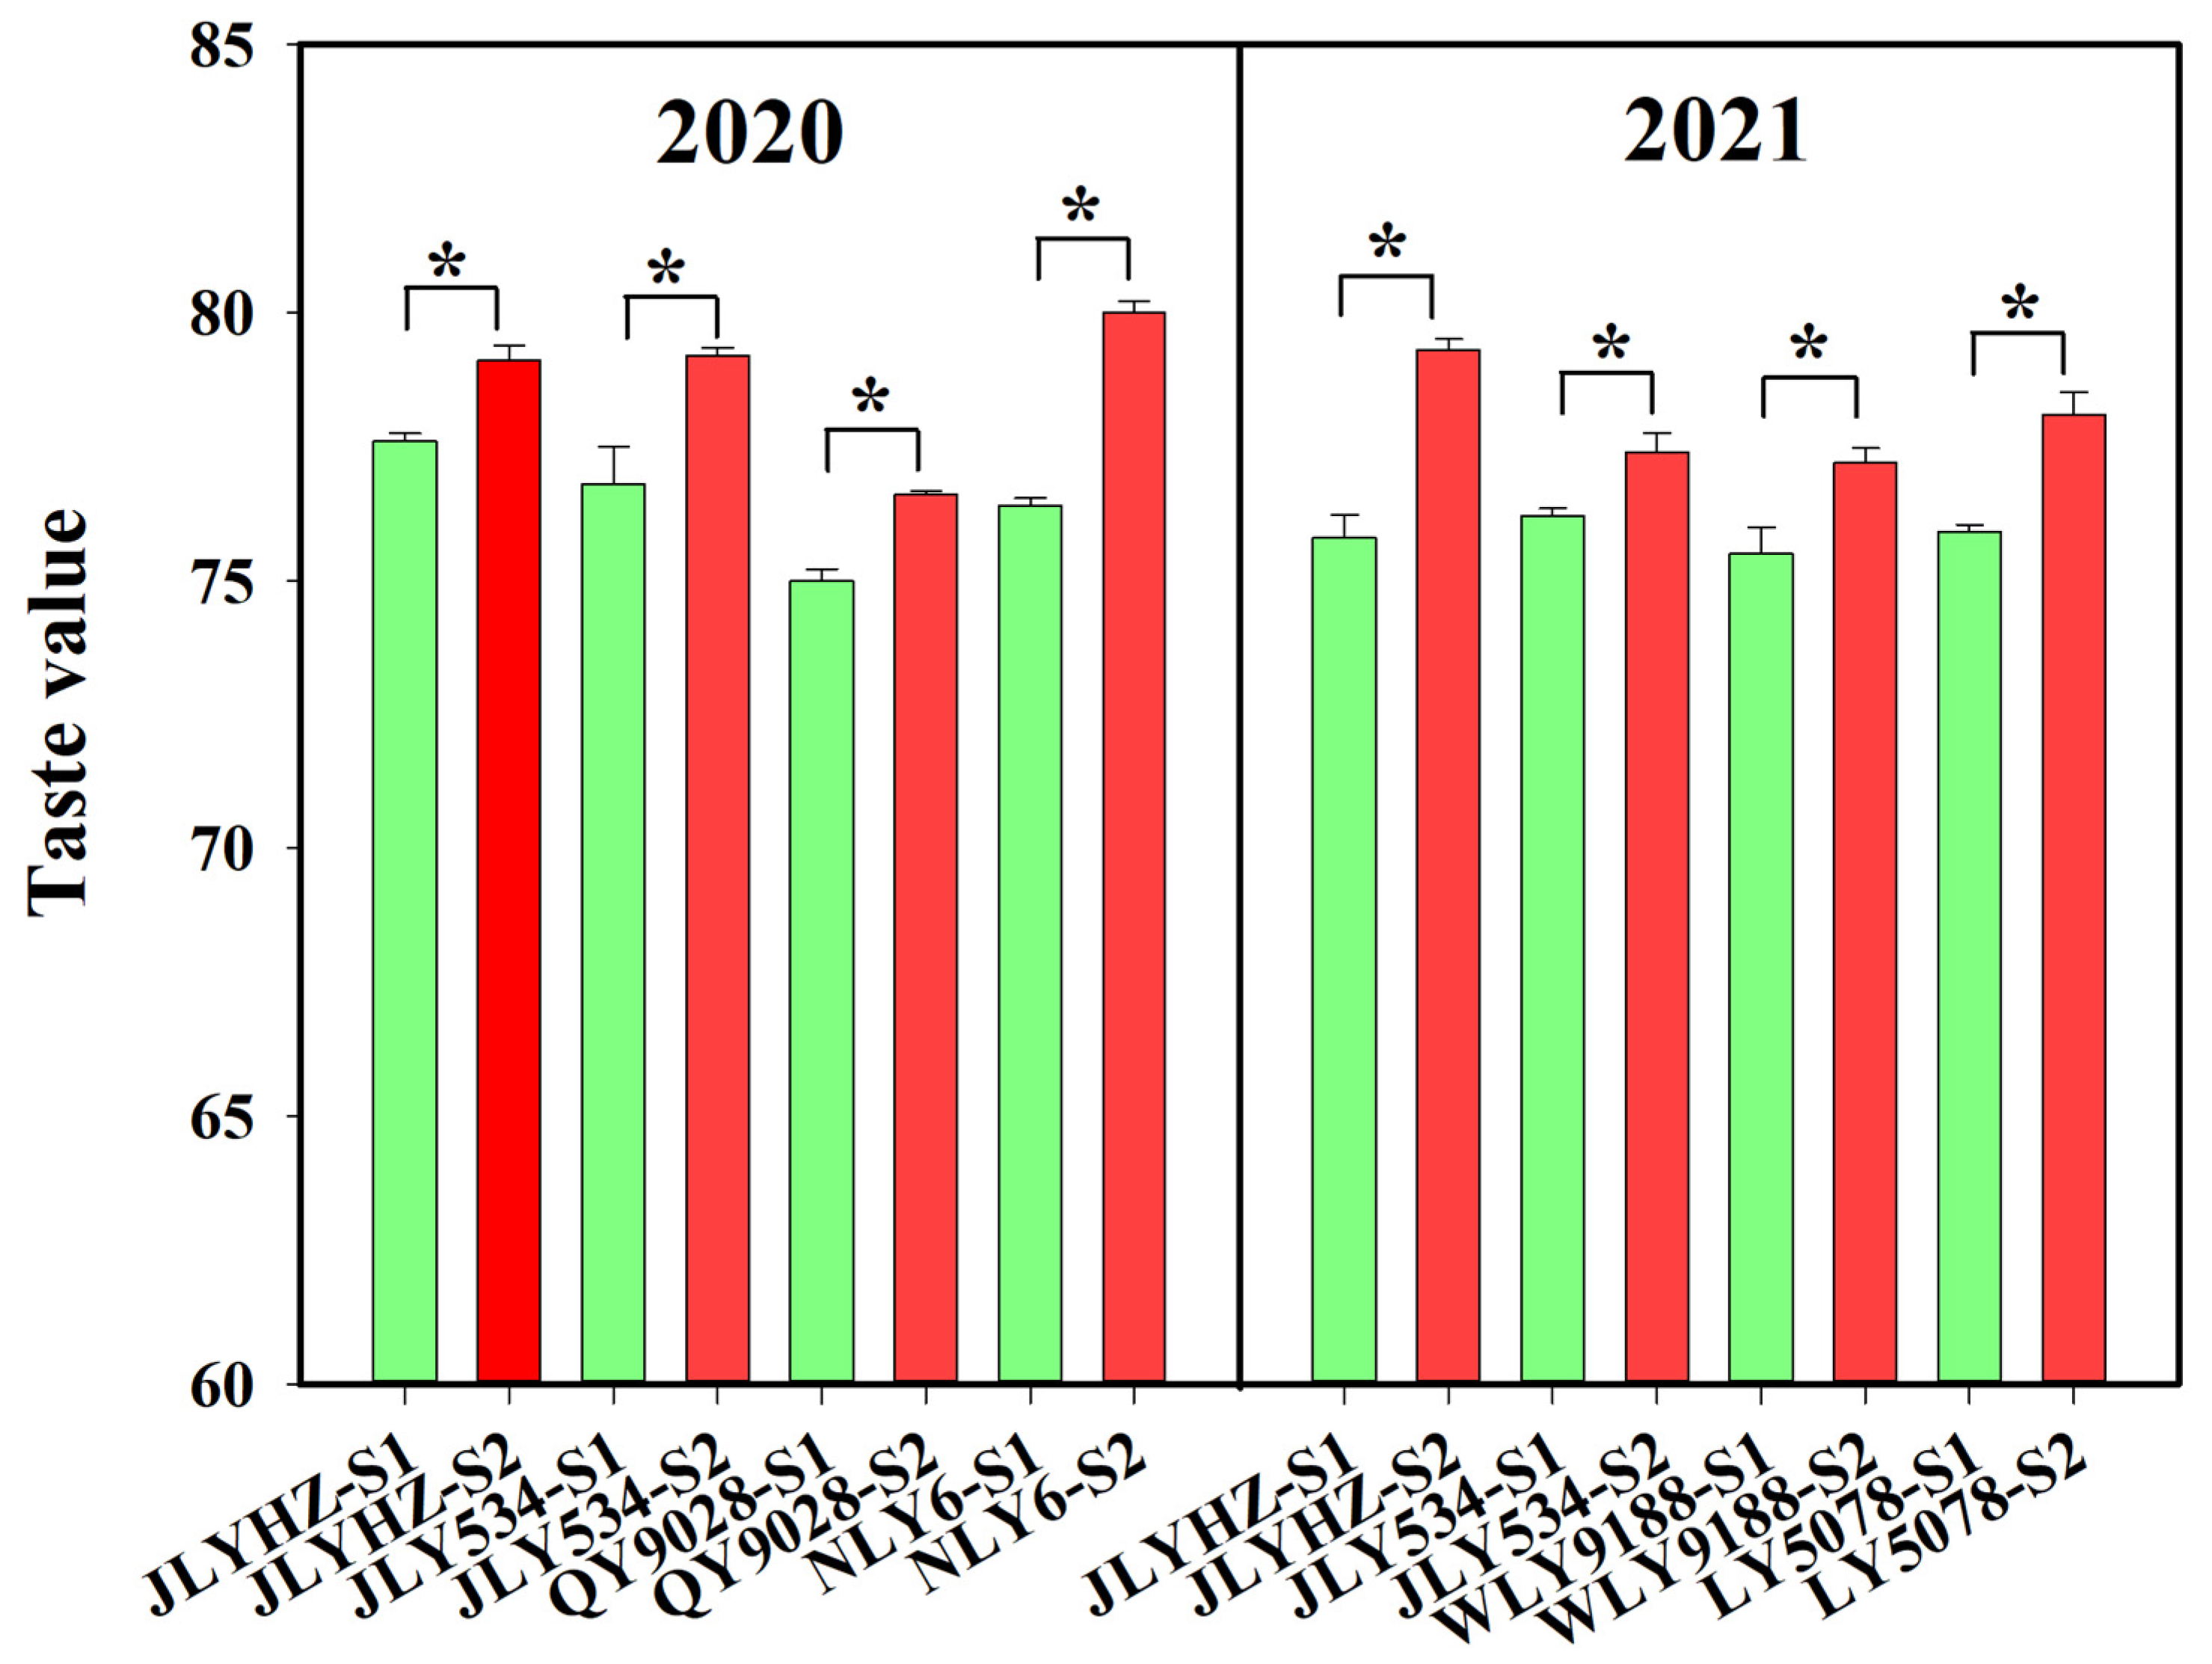
3.3. Response of Rice Quality to Different Maturities

There were significant differences in head rice rate between S1 and S2 (Figure 5). In addition, significant variations were observed in amylose and protein content (Figure 6). The trend in head rice rate, amylose content, and protein across different varieties was generally consistent, with higher head rice rate and amylose content observed in S2. In comparison, the protein content in S1 was higher than in S2. However, the significance of these differences varied across different varieties and years. Furthermore, the taste value of S1 was significantly lower compared to S2 (Figure 7). These results suggested that premature harvesting may lead to a reduction in amylose content and an increase in protein content, consequently resulting in a decreased head rice rate and taste value.

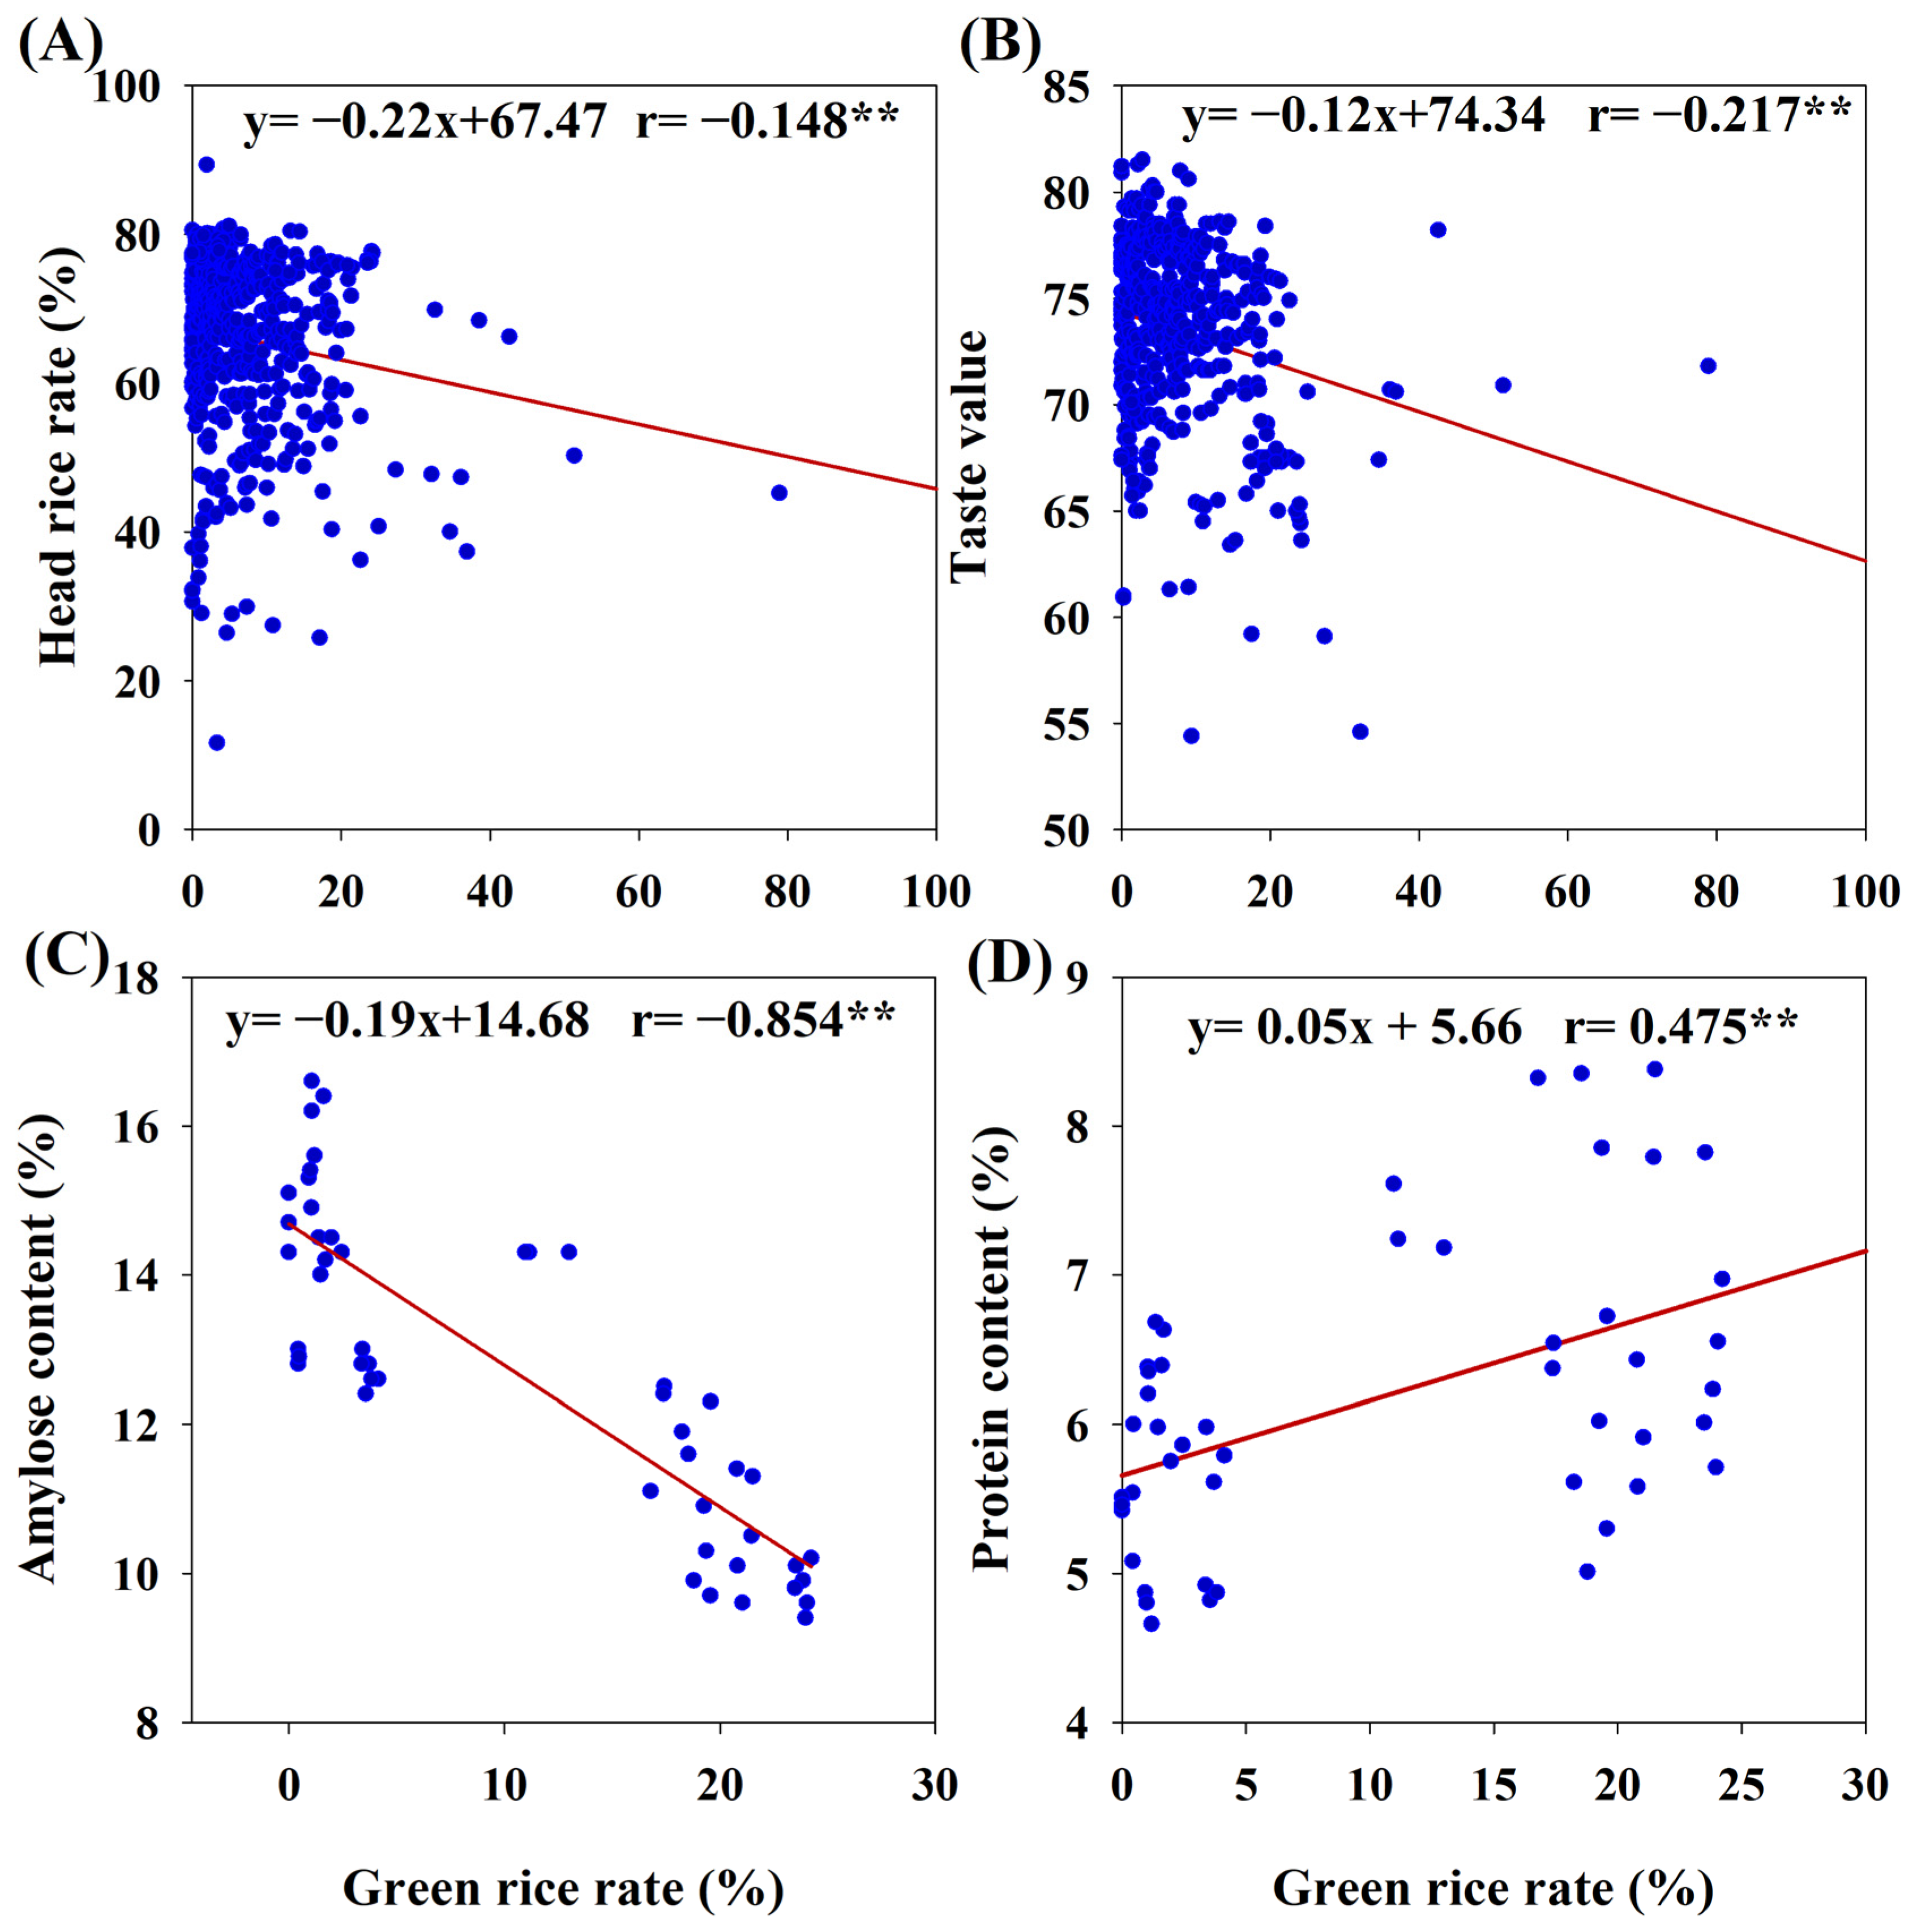
3.4. Relationship Between Green Rice Rate and Rice Quality

The relationships between green rice rate and various aspects of rice quality, such as head rice rate, amylose content, and protein content, are illustrated in Figure 8. The finding indicated a significant negative correlation between the green rice rate and the head rice rate (r = −0.148 **, p < 0.01), taste value (r = −0.217 **, p < 0.01), and amylose content (r = −0.854 **, p < 0.01). Conversely, a significant positive correlation was observed between the green rice rate and the protein content (r = 0.475 **, p < 0.01). These results suggested that premature harvesting adversely affected rice quality, particularly in terms of head rice rate, amylose content, and protein content.

4. Discussion

The head rice rate is a crucial factor in determining the market value of rice [2,5]. Consequently, this study measured the head rice rate to evaluate the effect of premature harvesting on rice quality. It is well established that rice quality is influenced by genetics and is closely associated with external variables such as environmental conditions and crop management practices [2,21]. While the significance of differences in head rice rates varied across different varieties and years, the overall trends remained consistent: optimal maturity was correlated with higher head rice rates compared to premature harvesting. This observation indicated that premature harvesting may result in diminished head rice rates. A plausible explanation for this result could be attributed to the variations in kernel density, as kernels with lower density are more prone to damage during processing than those with higher density [22]. In the present study, premature harvesting was correlated with a reduction in grain weight, signifying a decrease in grain plumpness. Consequently, attaining optimal maturity is crucial for achieving high head rice rates in practical production. Additionally, the findings indicated that premature harvesting significantly affected taste value, an important factor for consumers [20,23]. This result is primarily attributed to a decrease in amylose content and an increase in protein content. Similarly, previous research has stated that amylose and protein are two fundamental components of grains, with their content being closely linked to the eating and cooking quality (ECQ) of grain [24,25]. High protein content has been shown to significantly diminish the taste value [6]. These observations aligned with the findings that mature rice typically exhibited lower protein content compared to immature rice [16], whereas elevated amylose content when the harvest date is postponed [8]. Moreover, several studies have suggested that low amylose content and high protein content can adversely affect ECQ, as evidenced by the increased gelatinization temperature, swelling power, water solubility, and pasting properties [20,23]. Therefore, we propose that premature harvesting significantly degraded ECQ, namely, declined taste value, by increasing protein content and decreasing amylose. Furthermore, correlation analysis demonstrated that head rice rate and amylose content showed a significant negative correlation with green rice rate, whereas protein content exhibited a strong positive correlation with the green rice rate. These findings suggested that premature harvesting exerted a substantial impact on rice quality, particularly the head rice rate, amylose content, and protein content, ultimately resulting in inferior rice quality. The survey data revealed that approximately 25% of the samples exhibited a green rice rate exceeding 10%, with even higher levels (typically over 15%) observed in the Yangtze River Valley. Consequently, it is evident that premature harvesting is a significant factor influencing rice quality in this region, warranting increased attention in practical production.
Optimizing the harvest date is crucial to maximize the likelihood of achieving optimal maturity [8]. Therefore, it is imperative to develop rational standards for maturity assessment and establish reliable methods for determining the optimal harvest date in future practices. The maturation of rice is intricately associated with the grain filling process, which is defined by an early initiation of filling, a steady filling rate, an extended duration of filling, and a high level of filling completion. Nevertheless, the grain filling in rice adheres to the flowering sequence of spikelets, resulting in variable grain growth rates, especially with large panicle sizes [25,26]. The inconsistency presents challenges in determining the optimal harvest date, owing to the delicate equilibrium between maturity and immaturity, which has been shown in previous studies to adversely affect rice yield and quality [8]. Additionally, environmental conditions such as shading and drought further exacerbate this inconsistency [12,13]. This highlighted that rice maturation is a complex biological process influenced by the interplay of genetic traits and environmental conditions. Nitrogen is a vital nutrient that plays a significant role in influencing both the yield and quality of rice. Numerous studies have demonstrated that a carefully managed increase in nitrogen fertilizer can markedly improve crop yield. However, excessive nitrogen application frequently results in the proliferation of non-productive tillers, thereby depleting soil fertility and reducing nutrient use efficiency [27]. It can also inhibit the grain filling of inferior spikelets, consequently delaying the maturation of rice grains [14]. Moreover, planting density significantly impacted rice maturation by affecting both population dynamics and individual plant growth. Recent extreme weather events were expected to substantially influence rice maturation significantly. Elevated temperatures during the grain-filling period have been observed to accelerate the filling rate and shorten the duration of this phase, leading to premature maturation and suboptimal grain filling. In contrast, lower temperatures can decelerate or even halt the filling process, thereby similarly impeding effective grain filling in rice. At present, numerous farmers persist in utilizing traditional cultivation techniques and standardized harvesting practices, frequently overlooking the impact of diverse cultivation methods, management strategies, and climate change on rice maturation. Consequently, it is imperative to investigate more appropriate cultivation practices and optimize the selection of harvesting dates to minimize the incidence of green rice rates and enhance rice yield and quality in future agricultural practices.

5. Conclusions

Premature harvesting has emerged as a prevalent issue in rice production within the Yangtze River Valley. Survey data revealed that over 25% of the samples exhibited a green rice rate exceeding 10% at the time of harvest, with approximately half of these samples having a green rice rate surpassing 15%. Consequently, it is crucial to understand the implications of premature harvesting on rice quality. The findings demonstrated that premature harvesting, characterized by a high green rice rate, significantly diminished grain weight, head rice rate, taste value, and amylose content, while concurrently increasing protein content, particularly when the green rice rate exceeded 15%. Moreover, a significant correlation was observed between the green rice rate and several quality traits: head rice rate (r = −0.148 **, p < 0.01), taste value (r = −0.217 **, p < 0.01), amylose content (r = −0.854 **, p < 0.01), and protein content (r = 0.475 **, p < 0.01). These findings indicated that inadequate maturity due to premature harvesting resulted in a reduced head rice rate and diminished taste value. Therefore, it is essential to implement more appropriate cultivation practices and optimize the harvesting date to minimize the green rice rate and enhance grain weight and quality in future practice.

Author Contributions

X.Z. and L.Y.: formal analysis, data curation, and writing—original draft. Z.L.: writing—review and editing the manuscript. D.T.: methodology, writing—review and editing, supervision, and funding acquisition. All authors have read and agreed to the published version of the manuscript.

Funding

This work was supported by the Anhui Natural Science Foundation (No. 2408085QC105), the National Natural Science Foundation of China (No. 32272211), and Joint Research on Improved Varieties of Crops in Anhui Province (Rice).

Data Availability Statement

The original contributions presented in this study are included in the article. Further inquiries can be directed to the corresponding author.

Conflicts of Interest

The authors declare that they have no conflicts of interest to report regarding the present study.

Abbreviations

The following abbreviations are used in this manuscript:
JLYHZJingliangyouhuazhan
JLY534Jingliangyou 534
QY9028Quanyou 9028
NLY6Nuoliangyou 6
WLY9188Wangliangyou 9188
LY5078Liangyou 5078
ECQEating and cooking quality
S11st sampling time, at 30 ± 3 d after grain filling stage
S22nd sampling time, namely harvest

References

  1. Kato, K.; Suzuki, Y.; Hosaka, Y.; Takahashi, R.; Kodama, I.; Sato, K.; Kawamoto, T.; Kumamaru, T.; Fujita, N. Effect of high temperature on starch biosynthetic enzymes and starch structure in japonica rice cultivar ‘Akitakomachi’ (Oryza sativa L.) endosperm and palatability of cooked rice. J. Cereal Sci. 2019, 87, 209–214. [Google Scholar] [CrossRef]
  2. Tu, D.; Jiang, Y.; Zhang, L.; Cai, M.; Li, C.; Cao, C. Effect of various combinations of temperature during different phenological periods on indica rice yield and quality in the Yangtze River Basin in China. J. Integr. Agric. 2022, 21, 2900–2909. [Google Scholar] [CrossRef]
  3. Huang, M.; Zou, Y. Integrating mechanization with agronomy and breeding to ensure food security in China. Field Crops Res. 2018, 224, 22–27. [Google Scholar] [CrossRef]
  4. Zhang, C.; Zhou, L.; Lu, Y.; Yang, Y.; Feng, L.; Hao, W.; Li, Q.; Fan, X.; Zhao, D.; Liu, Q. Changes in the physicochemical properties and starch structures of rice grains upon pre-harvest sprouting. Carbohydr. Polym. 2020, 234, 115893. [Google Scholar] [CrossRef] [PubMed]
  5. Lyman, N.B.; Jagadish, K.S.V.; Nalley, L.L.; Dixon, B.L.; Siebenmorgen, T. Neglecting Rice Milling Yield and Quality Underestimates Economic Losses from High-Temperature Stress. PLoS ONE 2013, 8, e72157. [Google Scholar] [CrossRef] [PubMed]
  6. Chen, H.; Chen, D.; He, L.; Wang, T.; Lu, H.; Yang, F.; Deng, F.; Chen, Y.; Tao, Y.; Li, M.; et al. Correlation of taste values with chemical compositions and Rapid Visco Analyser profiles of 36 indica rice (Oryza sativa L.) varieties. Food Chem. 2021, 349, 129176. [Google Scholar] [CrossRef]
  7. Fernandes, D.D.S.; dos Santos, T.P.R.; Fernandes, A.M.; Leonel, M. Harvest time optimization leads to the production of native cassava starches with different properties. Int. J. Biol. Macromol. 2019, 132, 710–721. [Google Scholar] [CrossRef]
  8. Cheng, C.; Lei, K.; Wang, S.; Zhu, B.; Lu, Z.; Gao, B.; Wang, B.; Shi, Q.; Zeng, Y. Effects of Water Irrigation Cut off and Harvest Date on the Grain Yield and Quality of High-quality Japonica Rice during the Late-rice Cropping Season in Southern China. Crop Res. 2020, 34, 1–7. [Google Scholar]
  9. Jeong, O.Y.; Baek, M.K.; Bombay, M.; Ancheta, M.B.; Lee, J.-H. Evaluation of the optimal harvest time of rice (Oryza sativa L.) with different grain shapes grown in the Philippines. J. Crop Sci. Biotechnol. 2020, 23, 405–412. [Google Scholar] [CrossRef]
  10. McClung, A.M. Chapter 2: The Rice Plant: Growth, Development, And Genetic Improvement. In Rice: Chemistry and Technology; American Association of Cereal Chemists, Inc.: St. Paul, MN, USA, 2004; pp. 25–48. [Google Scholar]
  11. Siebenmorgen, T.J.; Grigg, B.C.; Lanning, S.B. Impacts of Preharvest factors during kernel development on rice quality and functionality. Annu. Rev. Food Sci. Technol. 2013, 4, 101–115. [Google Scholar] [CrossRef]
  12. Chen, Z.; Li, P.; Du, Y.; Jiang, Y.; Cai, M.; Cao, C. Dry cultivation and cultivar affect starch synthesis and traits to define rice grain quality in various panicle parts. Carbohydr. Polym. 2021, 269, 118336. [Google Scholar] [PubMed]
  13. Deng, F.; Wang, L.; Pu, S.L.; Mei, X.F.; Li, S.X.; Li, Q.P.; Ren, W.J. Shading stress increases chalkiness by postponing caryopsis development and disturbing starch characteristics of rice grains. Agric. For. Meteorol. 2018, 263, 49–58. [Google Scholar] [CrossRef]
  14. Chen, Y.; Teng, Z.; Yuan, Y.; Yi, Z.; Zheng, Q.; Yu, H.; Lv, J.; Wang, Y.; Duan, M.; Zhang, J.; et al. Excessive nitrogen in field-grown rice suppresses grain filling of inferior spikelets by reducing the accumulation of cytokinin and auxin. Field Crops Res. 2022, 28, 108542. [Google Scholar]
  15. Tu, D.; Jiang, Y.; Salah, A.; Cai, M.; Peng, W.; Zhang, L.; Li, C.; Cao, C. Response of Source-Sink Characteristics and Rice Quality to High Natural Field Temperature During Reproductive Stage in Irrigated Rice System. Front. Plant Sci. 2022, 13, 911181. [Google Scholar]
  16. Díaz, E.O.; Kawamura, S.; Koseki, S. Effect of thickness and maturity on protein content of Japonica brown rice collected during postharvest processing. Biosyst. Eng. 2019, 183, 160–169. [Google Scholar] [CrossRef]
  17. NBSC. National Bureau of Statistics of China. 2023. Available online: http://www.stats.gov.cn (accessed on 10 September 2024).
  18. Chen, C.; van Groenigen, K.J.; Yang, H.; Hungate, B.A.; Yang, B.; Tian, Y.; Chen, J.; Dong, W.; Huang, S.; Deng, A.; et al. Global warming and shifts in cropping systems together reduce China’s rice production. Glob. Food Secur. 2020, 24, 100359. [Google Scholar] [CrossRef]
  19. Deng, N.; Ling, X.; Sun, Y.; Zhang, C.; Fahad, S.; Peng, S.; Cui, K.; Nie, L.; Huang, J. Influence of temperature and solar radiation on grain yield and quality in irrigated rice system. Eur. J. Agron. 2015, 64, 37–46. [Google Scholar] [CrossRef]
  20. Zhang, C.; Zhou, L.; Zhu, Z.; Lu, H.; Zhou, X.; Qian, Y.; Li, Q.; Lu, Y.; Gu, M.; Liu, Q. Characterization of Grain Quality and Starch Fine Structure of Two Japonica Rice (Oryza sativa) Cultivars with Good Sensory Properties at Different Temperatures during the Filling Stage. J. Agric. Food Chem. 2016, 64, 4048–4057. [Google Scholar] [CrossRef]
  21. Lin, G.; Yang, Y.; Chen, X.; Yu, X.; Wu, Y.; Xiong, F. Effects of high temperature during two growth stages on caryopsis development and physicochemical properties of starch in rice. Int. J. Biol. Macromol. 2020, 145, 301–310. [Google Scholar]
  22. Jongkaewwattana, S.; Geng, S. Non-Uniformity of Grain Characteristics and Milling Quality of California Rice (Oryza sativa L.) of Different Maturities. J. Agron. Crop Sci. 2002, 188, 161–167. [Google Scholar]
  23. Yao, D.; Wu, J.; Luo, Q.; Li, J.; Zhuang, W.; Xiao, G.; Deng, Q.; Lei, D.; Bai, B. Influence of high natural field temperature during grain filling stage on the morphological structure and physicochemical properties of rice (Oryza sativa L.) starch. Food Chem. 2020, 310, 125817. [Google Scholar] [PubMed]
  24. Cai, J.; Man, J.; Huang, J.; Liu, Q.; Wei, W.; Wei, C. Relationship between structure and functional properties of normal rice starches with different amylose contents. Carbohydr. Polym. 2015, 125, 35–44. [Google Scholar] [PubMed]
  25. Zhu, D.; Fang, C.; Qian, Z.; Guo, B.; Huo, Z. Differences in starch structure, physicochemical properties and texture characteristics in superior and inferior grains of rice varieties with different amylose contents. Food Hydrocoll. 2021, 110, 106170. [Google Scholar]
  26. Yang, J.; Zhang, J. Grain-filling problem in ‘super’ rice. J. Exp. Bot. 2010, 61, 1–5. [Google Scholar]
  27. Qiao, J.; Liu, Z.; Deng, S.; Ning, H.; Yang, X.; Lin, Z.; Li, G.; Wang, Q.; Wang, S.; Ding, Y. Occurrence of perfect and imperfect grains of six japonica rice cultivars as affected by nitrogen fertilization. Plant Soil 2011, 349, 191–202. [Google Scholar]
Figure 1. Maturity of rice grains at harvesting time: (A) for the whole panicle, (B) for mature grain, and (C) for immature grain (green grain).
Agronomy 15 00846 g001
Figure 2. The distribution of rice maturities in the survey study. Green percentages <5%, 5–10%, 10–15%, and ≥15% mean the green rate of rice was lower than 5%, from 5% to 10%, from 10 to 15%, and higher than 15%, respectively. The bold percentage indicates the proportion of the green rice rate range sample to the total sample number.
Agronomy 15 00846 g002
Figure 3. The 1000-grain weight of mature and immature rice (A), the difference in 1000-grain weight between mature (M) and immature (I) rice (M-I) (B). <5, 5–10, 10–15, and ≥15 mean the green rice rate was lower than 5%, from 5% to 10%, 10 to 15%, and beyond 15%, respectively. ** represents the 1000-grain weight significant difference between mature and immature at the level of p < 0.01. Ya are the average differences in 1000-grain weight between mature and immature rice in each green rice rate threshold.
Agronomy 15 00846 g003
Figure 4. The difference in head rice rate and taste value of rice from survey study. <5, 5–10, 10–15, and ≥15 mean the green rice rate was lower than 5%, from 5% to 10%, 10 to 15%, and beyond 15%. Different letters represent the significant difference at the level of p < 0.05.
Agronomy 15 00846 g004
Figure 5. The difference in heading rice rate at different sampling dates. S1 and S2 mean first sampling, namely at 30 ± 3 d after the grain filling stage, and second sampling, namely harvest. Jingliangyouhuazhan, JLYHZ; Jingliangyou 534, JLY534; Quanyou 9028, QY9028; Nuoliangyou 6, NLY6; Wangliangyou 9188, WLY9188; Liangyou 5078, LY5078. Different letters represent the significant difference among treatments in each year at the level of p < 0.05.
Agronomy 15 00846 g005
Figure 6. The difference in amylose and protein content at different sampling dates. S1 and S2 mean first sampling, namely at 30 ± 3 d after the grain filling stage, and second sampling, namely harvest. Jingliangyouhuazhan, JLYHZ; Jingliangyou 534, JLY534; Quanyou 9028, QY9028; Nuoliangyou 6, NLY6; Wangliangyou 9188, WLY9188; Liangyou 5078, LY5078. Different letters represent the significant difference among treatments in each year at the level of p < 0.05.
Agronomy 15 00846 g006
Figure 7. The difference in taste value at different sampling dates. S1 and S2 mean first sampling, namely at 30 ± 3 d after the grain filling stage, and second sampling, namely harvest. Jingliangyouhuazhan, JLYHZ; Jingliangyou 534, JLY534; Quanyou 9028, QY9028; Nuoliangyou 6, NLY6; Wangliangyou 9188, WLY9188; Liangyou 5078, LY5078. * represents the significant difference between S1 and S2 in each year at the level of p < 0.05.
Agronomy 15 00846 g007
Figure 8. The relationship between green rice rate and rice quality, including head rice rate (A), taste value (B), amylose content (C), and protein content (D). “**” represents a significant correlation at the level p < 0.01 (2-tailed).
Agronomy 15 00846 g008
Table 1. The distribution of paddy field plots.
North Latitude (°)East Longitude (°)Total Number of Sampled Paddy Plot
Anqing30.3117.060
Chizhou30.7117.542
Chuzhou31.5119.156
Fuyang32.3114.920
Hefei31.5117.254
Huainan33.0117.050
Huangshan29.4119.328
Lu’an31.8116.546
Maanshan31.2118.536
Wuhu31.0118.018
Xuanchen30.6118.556
Table 2. The green rice rate (%) of different varieties in sampling duration of 2020 and 2021.
YearGreen Rice Rate (%)
1st Sampling (S1)2nd Sampling (S2)S2−S1
JLYHZ202024.0 ± 0.190.4 ± 0.0123.6
JLY53418.9 ± 2.391.4 ± 0.3217.5
QY902811.7 ± 1.121.2 ± 0.3110.5
NLY622.8 ± 1.572.0 ± 0.4920.8
JLYHZ202121.4 ± 2.083.8 ± 0.3617.6
JLY53418.1 ± 1.261.0 ± 0.1417.1
WLY918819.4 ± 1.29019.4
LY507819.7 ± 1.033.6 ± 0.2316.1
Jingliangyouhuazhan, JLYHZ; Jingliangyou 534, JLY534; Quanyou 9028, QY9028; Nuoliangyou 6, NLY6; Wangliangyou 9188, WLY9188; Liangyou 5078, LY5078.
Disclaimer/Publisher’s Note: The statements, opinions and data contained in all publications are solely those of the individual author(s) and contributor(s) and not of MDPI and/or the editor(s). MDPI and/or the editor(s) disclaim responsibility for any injury to people or property resulting from any ideas, methods, instructions or products referred to in the content.

